28
President Takashi Tanaka KDDI Corporation Financial Results for the 1 st Quarter of the Fiscal Year Ending March 2016 (from April to June 2015) August 7, 2015

President Takashi Tanaka KDDI Corporation
Financial Results for the 1st Quarter of the Fiscal Year Ending March 2016 (from April to June 2015) August 7, 2015
Consolidated Highlights of 1Q Performance
Note) Based on IFRS
1
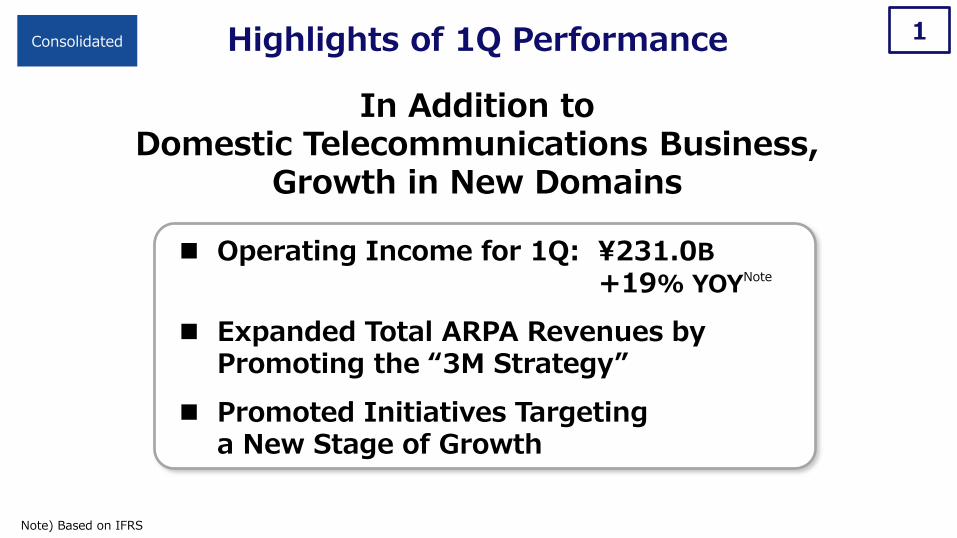
Operating Income for 1Q: ¥231.0B +19% YOYNote
Expanded Total ARPA Revenues by Promoting the “3M Strategy”
Promoted Initiatives Targeting a New Stage of Growth
In Addition to Domestic Telecommunications Business,
Growth in New Domains
FY15.3 FY16.3FY15.3 FY16.3
2
*Based on IFRS
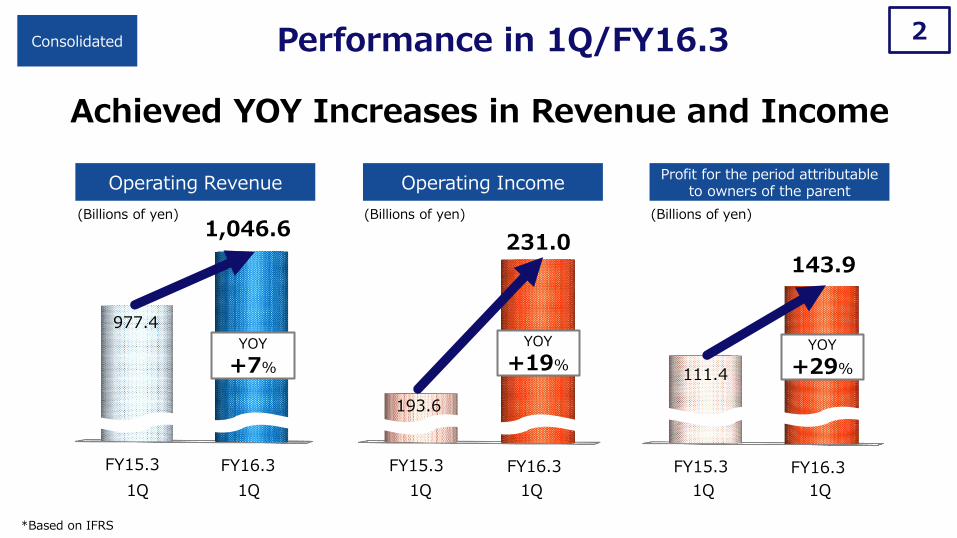
Achieved YOY Increases in Revenue and Income
Performance in 1Q/FY16.3 Consolidated
Operating Income Operating Revenue Profit for the period attributable
to owners of the parent
(Billions of yen) (Billions of yen) (Billions of yen)
231.0
193.6
YOY
+19%
FY15.3 FY16.3
977.4
YOY
+7%
1Q 1Q 1Q 1Q
1,046.6
143.9
1Q 1Q
YOY
+29% 111.4
(Billions of yen)
FY15.3 FY16.3
16.4
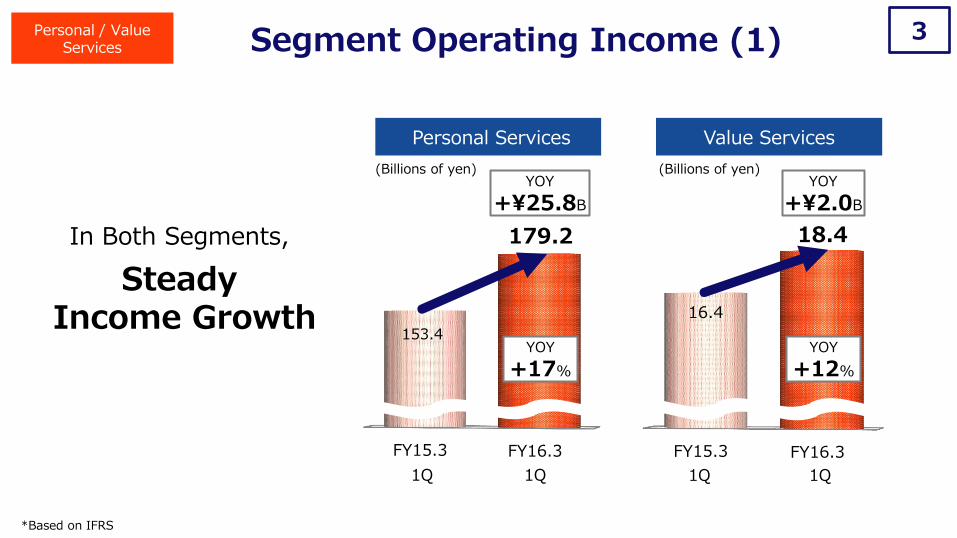
Segment Operating Income (1) 3
Personal Services
Steady Income Growth
In Both Segments,
Value Services
Personal / Value Services
(Billions of yen)
*Based on IFRS
FY15.3 FY16.3
153.4
179.2
YOY
+17%
1Q 1Q
18.4
1Q 1Q
YOY
+12%
YOY
+¥25.8B
YOY
+¥2.0B
FY15.3 FY16.3
3.6
4
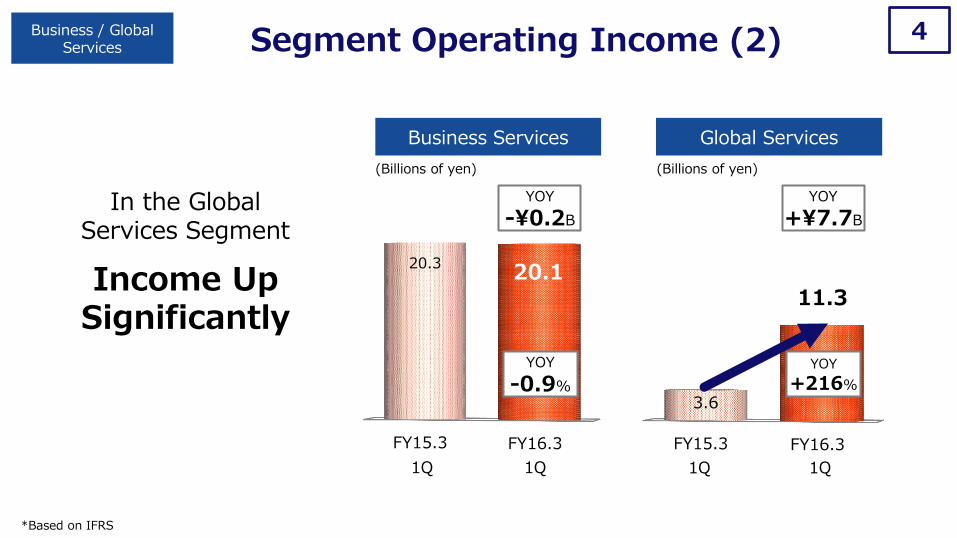
Income Up Significantly
In the Global Services Segment
Business / Global Services
Business Services Global Services
(Billions of yen) (Billions of yen)
Segment Operating Income (2)
*Based on IFRS
FY15.3 FY16.3
20.3 20.1
YOY
-0.9%
1Q 1Q
11.3
1Q 1Q
YOY
+216%
YOY
-¥0.2B
YOY
+¥7.7B
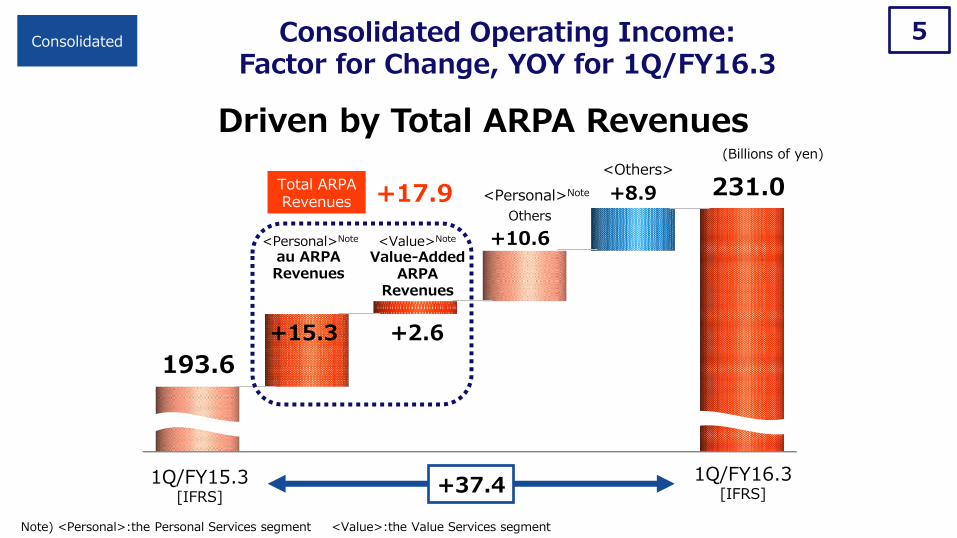
5 Consolidated Consolidated Operating Income: Factor for Change, YOY for 1Q/FY16.3
(Billions of yen)
193.6
231.0
+15.3 +2.6
+8.9
<Others>
+10.6
<Personal>Note
Others
<Personal>Note <Value>Note
+37.4 1Q/FY15.3 [IFRS]
1Q/FY16.3 [IFRS]
+17.9 Total ARPA Revenues
au ARPA Revenues
Value-Added ARPA
Revenues
Note) <Personal>:the Personal Services segment <Value>:the Value Services segment
Driven by Total ARPA Revenues
Operational Data
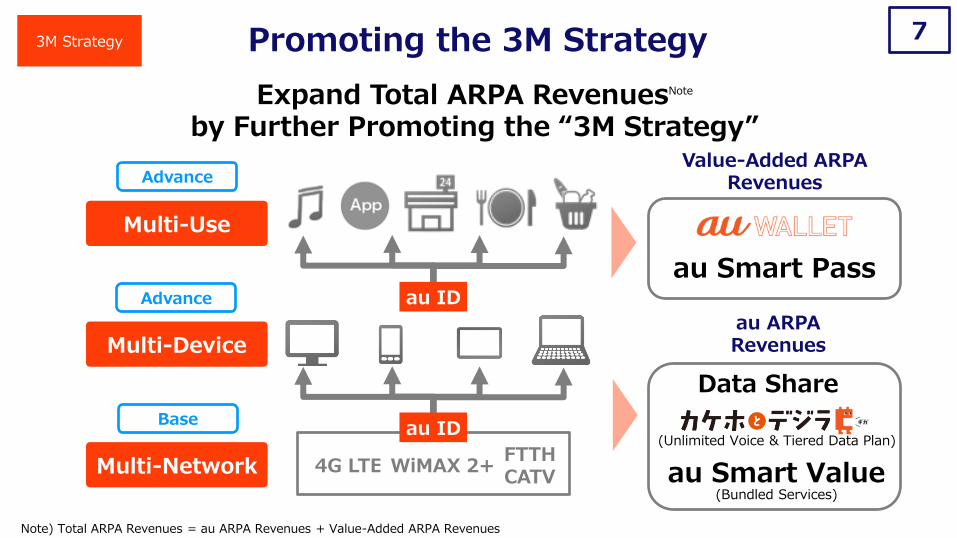
Multi-Network
Multi-Use
Multi-Device
4G LTE WiMAX 2+ FTTH CATV
au ID
Data Share
au ID
Value-Added ARPA Revenues
au ARPA Revenues
7
Expand Total ARPA RevenuesNote
by Further Promoting the “3M Strategy”
Promoting the 3M Strategy 3M Strategy
au Smart Pass
(Unlimited Voice & Tiered Data Plan)
au Smart Value (Bundled Services)
Advance
Advance
Base
Note) Total ARPA Revenues = au ARPA Revenues + Value-Added ARPA Revenues
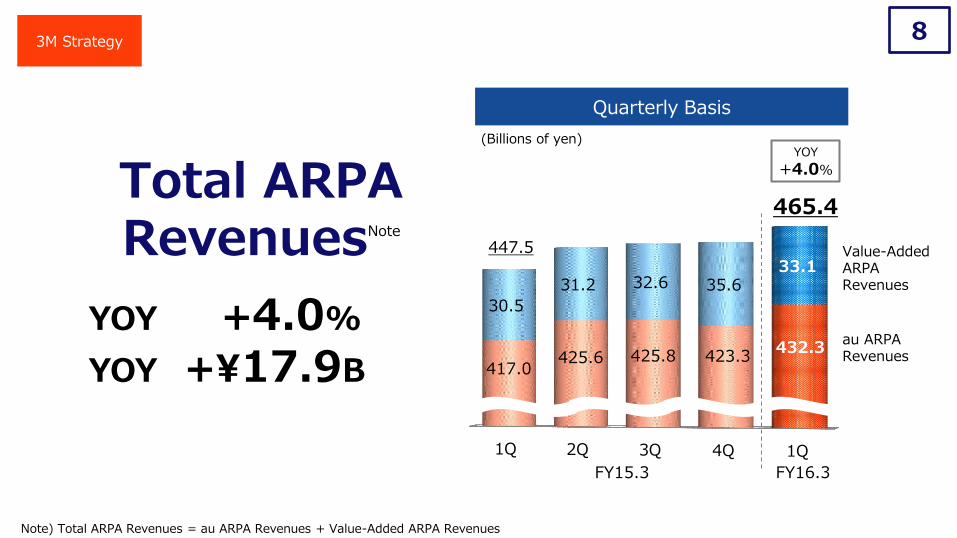
1Q 2Q 3Q 4Q 1Q
417.0 425.6 425.8 423.3
432.3
30.5
31.2 32.6 35.6 33.1
8
FY15.3 FY16.3
Total ARPA RevenuesNote
YOY +4.0%
YOY +¥17.9B
YOY
+4.0%
465.4
447.5
Quarterly Basis
3M Strategy
(Billions of yen)
au ARPA Revenues
Value-Added ARPA Revenues
Note) Total ARPA Revenues = au ARPA Revenues + Value-Added ARPA Revenues
1Q 2Q 3Q 4Q 1Q
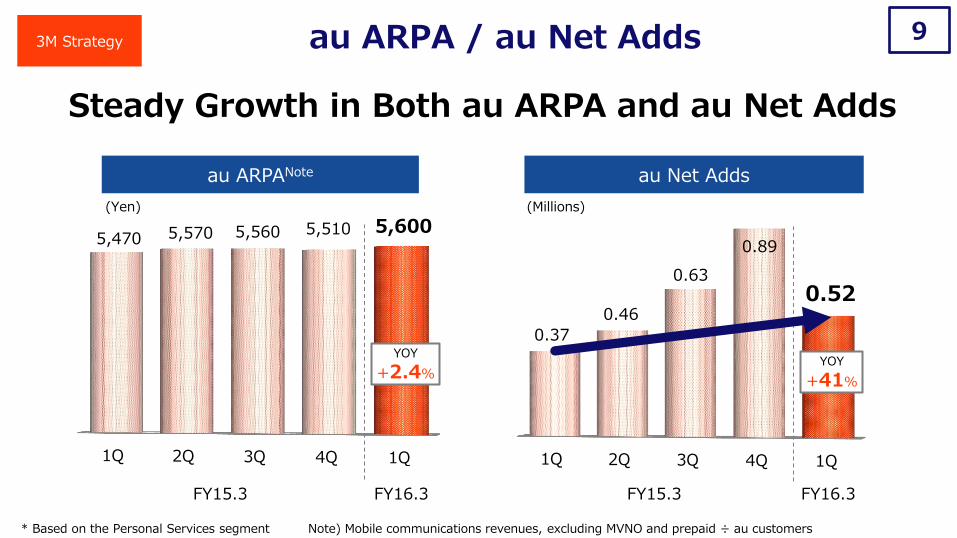
5,470 5,570 5,560 5,510 5,600
1Q 2Q 3Q 4Q 1Q
0.37
0.46
0.63
0.89
0.52
9
(Yen)
FY15.3 FY16.3
au ARPA / au Net Adds
Steady Growth in Both au ARPA and au Net Adds
FY15.3 FY16.3
au Net Adds
3M Strategy
au ARPANote
* Based on the Personal Services segment Note) Mobile communications revenues, excluding MVNO and prepaid ÷ au customers
(Millions)
YOY
+2.4% YOY
+41%
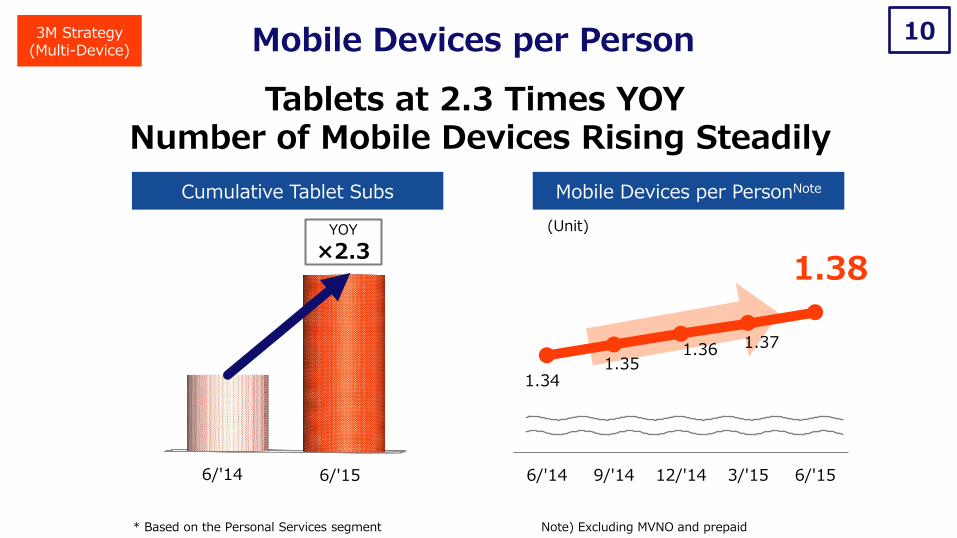
Mobile Devices per Person 10
Tablets at 2.3 Times YOY Number of Mobile Devices Rising Steadily
Mobile Devices per PersonNote
6/'14 6/'15
YOY
×2.3
Cumulative Tablet Subs
(Unit)
Note) Excluding MVNO and prepaid * Based on the Personal Services segment
3M Strategy (Multi-Device)
1.34 1.35
1.36 1.37
6/'14 9/'14 12/'14 3/'15 6/'15
1.38
6/'12 6/'13 6/'14 6/'15
11
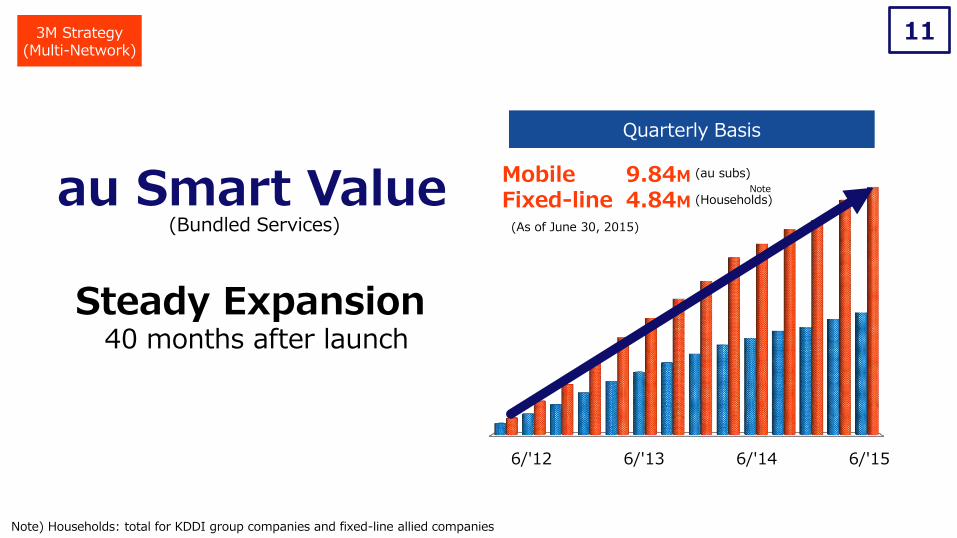
Mobile Fixed-line
Quarterly Basis
Steady Expansion 40 months after launch
(As of June 30, 2015)
3M Strategy (Multi-Network)
au Smart Value (Bundled Services)
Note) Households: total for KDDI group companies and fixed-line allied companies
9.84M
4.84M
(au subs)
(Households) Note
6/'12 6/'13 6/'14 6/'156/'12 6/'13 6/'14 6/'15
12
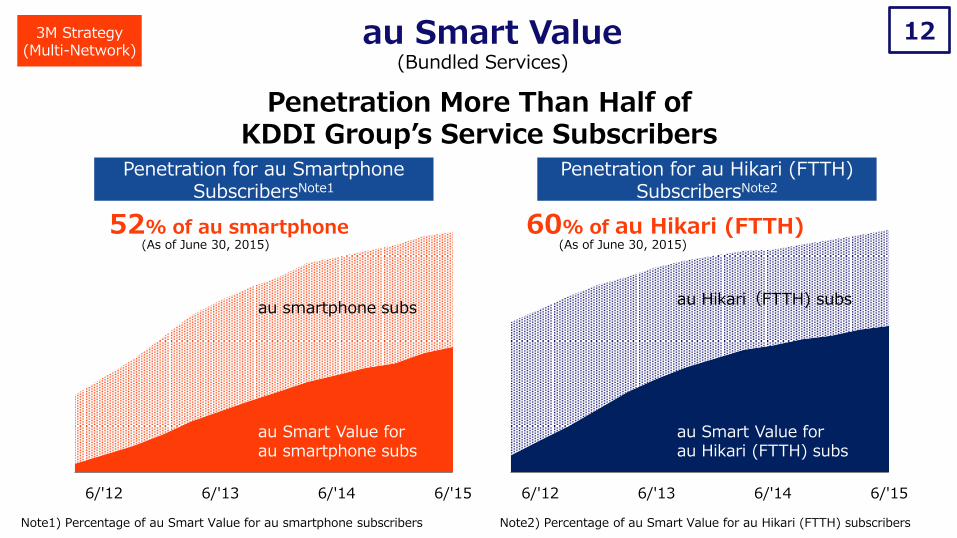
60% of au Hikari (FTTH) 52% of au smartphone
au Hikari(FTTH) subs
au Smart Value for au Hikari (FTTH) subs
au smartphone subs
au Smart Value for au smartphone subs
Penetration More Than Half of KDDI Group’s Service Subscribers
au Smart Value (Bundled Services)
3M Strategy (Multi-Network)
Penetration for au Hikari (FTTH) SubscribersNote2
Penetration for au Smartphone SubscribersNote1
Note1) Percentage of au Smart Value for au smartphone subscribers Note2) Percentage of au Smart Value for au Hikari (FTTH) subscribers
(As of June 30, 2015) (As of June 30, 2015)
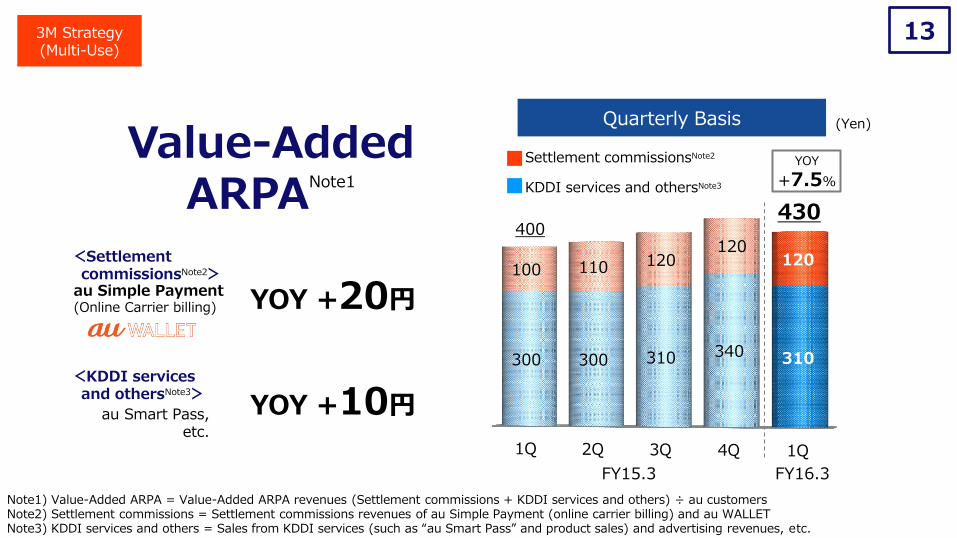
1Q 2Q 3Q 4Q 1Q
300 300 310 340 310
100 110 120 120
120
13
FY15.3 FY16.3
430 400
YOY
+7.5%
Quarterly Basis
YOY +20円
YOY +10円
3M Strategy (Multi-Use)
(Yen)
<KDDI services and othersNote3>
<Settlement commissionsNote2>
au Simple Payment (Online Carrier billing)
au Smart Pass, etc.
Value-Added ARPA
Note1
Note1) Value-Added ARPA = Value-Added ARPA revenues (Settlement commissions + KDDI services and others) ÷ au customers Note2) Settlement commissions = Settlement commissions revenues of au Simple Payment (online carrier billing) and au WALLET Note3) KDDI services and others = Sales from KDDI services (such as “au Smart Pass” and product sales) and advertising revenues, etc.
Settlement commissionsNote2
KDDI services and othersNote3
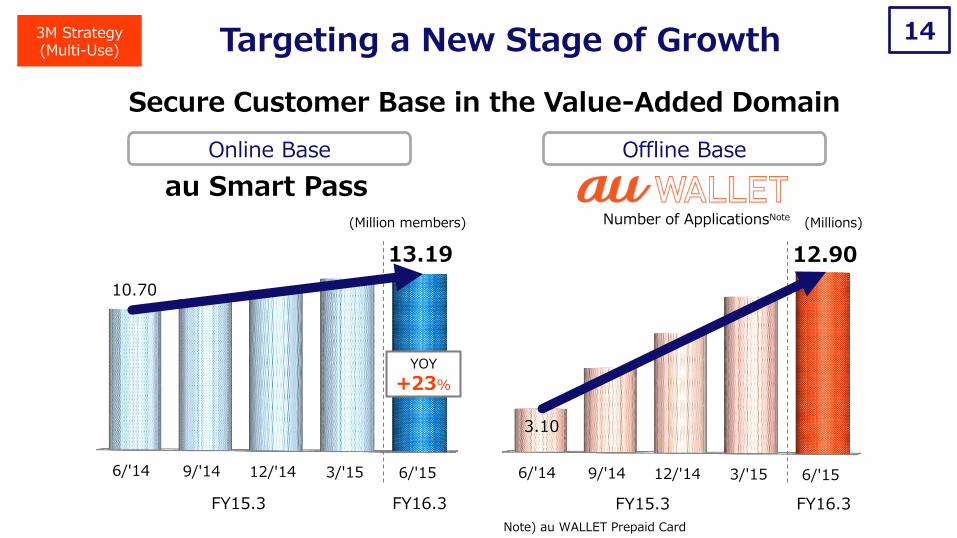
14
FY15.3 FY16.3 FY15.3 FY16.3
Number of ApplicationsNote
Targeting a New Stage of Growth
Secure Customer Base in the Value-Added Domain
Online Base Offline Base
au Smart Pass
3M Strategy (Multi-Use)
(Million members) (Millions)
Note) au WALLET Prepaid Card
6/'14 9/'14 12/'14 3/'15 6/'15
10.70
13.19
6/'14 9/'14 12/'14 3/'15 6/'15
3.10
12.90
YOY
+23%
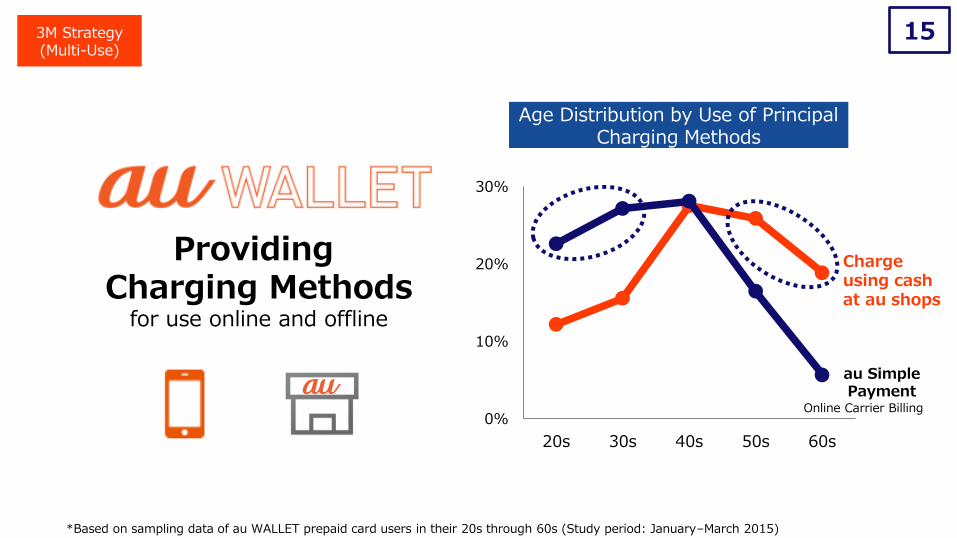
15 3M Strategy (Multi-Use)
Providing Charging Methods
for use online and offline
Charge using cash at au shops
au Simple Payment
Online Carrier Billing 0%
10%
20%
30%
20s 30s 40s 50s 60s
Age Distribution by Use of Principal Charging Methods
*Based on sampling data of au WALLET prepaid card users in their 20s through 60s (Study period: January–March 2015)
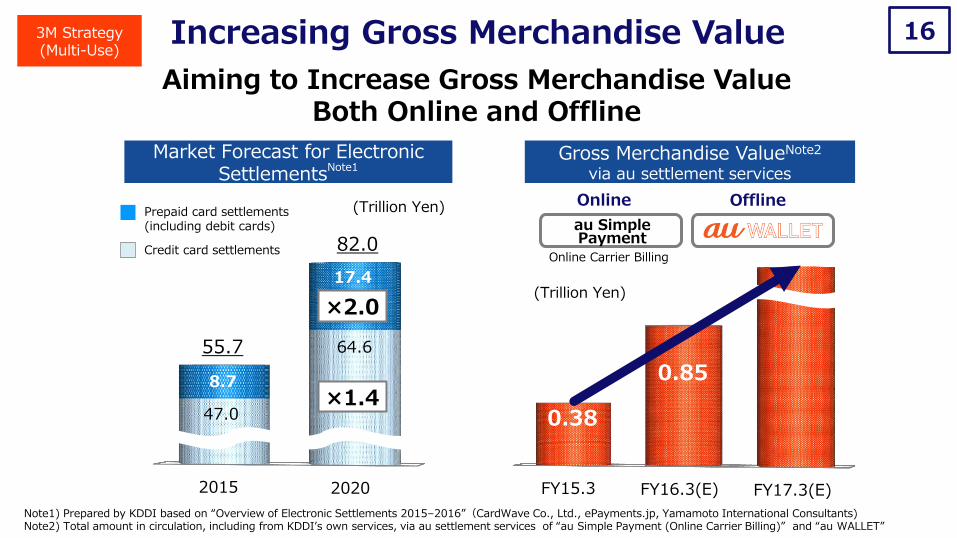
16
Gross Merchandise ValueNote2
via au settlement services
2015 2020
47.0
64.6
8.7
17.4
×1.4
×2.0
82.0
55.7
3M Strategy (Multi-Use)
au Simple Payment
Online Carrier Billing
FY15.3 FY16.3(E) FY17.3(E)
0.38
0.85
(Trillion Yen)
(Trillion Yen) Prepaid card settlements (including debit cards)
Credit card settlements
Market Forecast for Electronic Settlements
Note1
Online Offline
Note1) Prepared by KDDI based on “Overview of Electronic Settlements 2015–2016”(CardWave Co., Ltd., ePayments.jp, Yamamoto International Consultants) Note2) Total amount in circulation, including from KDDI’s own services, via au settlement services of “au Simple Payment (Online Carrier Billing)” and “au WALLET”
Increasing Gross Merchandise Value
Aiming to Increase Gross Merchandise Value Both Online and Offline
17
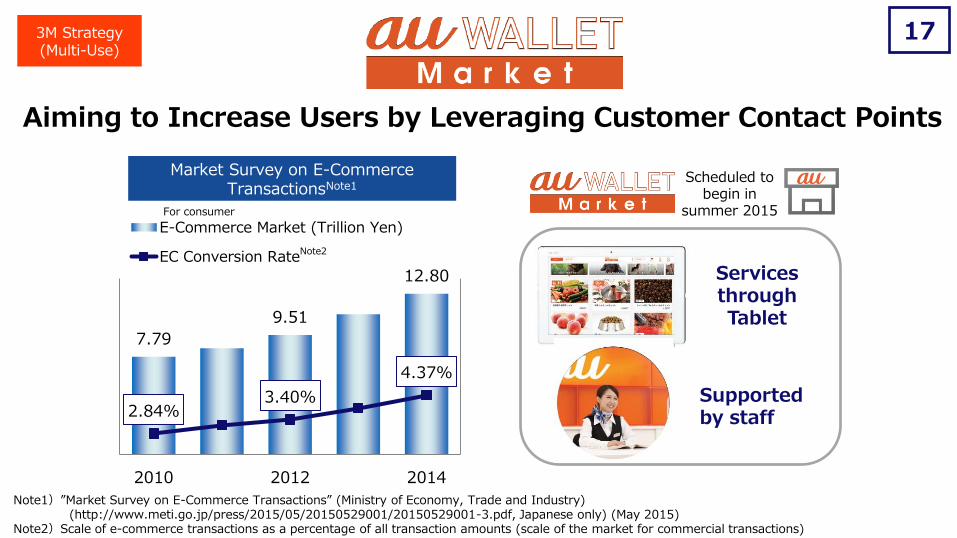
7.79
9.51
12.80
2.84% 3.40%
4.37%
2.00%
4.00%
6.00%
8.00%
0.00
5.00
10.00
2010 2012 2014
E-Commerce Market (Trillion Yen)
EC Conversion RateNote2
Services through Tablet
3M Strategy (Multi-Use)
Supported by staff
Scheduled to begin in
summer 2015
Note1)”Market Survey on E-Commerce Transactions” (Ministry of Economy, Trade and Industry) (http://www.meti.go.jp/press/2015/05/20150529001/20150529001-3.pdf, Japanese only) (May 2015) Note2)Scale of e-commerce transactions as a percentage of all transaction amounts (scale of the market for commercial transactions)
Aiming to Increase Users by Leveraging Customer Contact Points
Market Survey on E-Commerce TransactionsNote1
For consumer
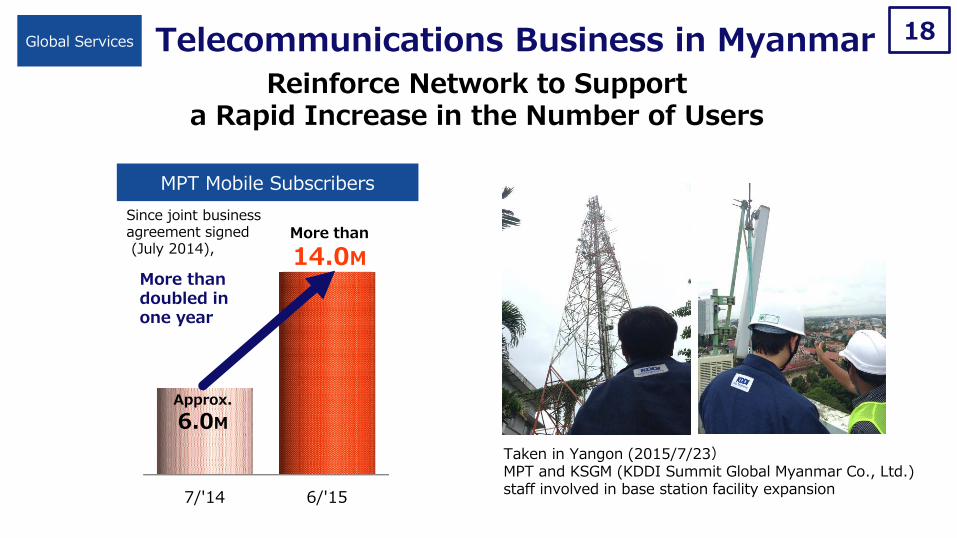
18 Global Services Telecommunications Business in Myanmar
MPT Mobile Subscribers
Reinforce Network to Support a Rapid Increase in the Number of Users
7/'14 6/'15
More than
14.0M
Since joint business agreement signed (July 2014),
Approx.
6.0M
More than doubled in one year
Taken in Yangon (2015/7/23) MPT and KSGM (KDDI Summit Global Myanmar Co., Ltd.) staff involved in base station facility expansion
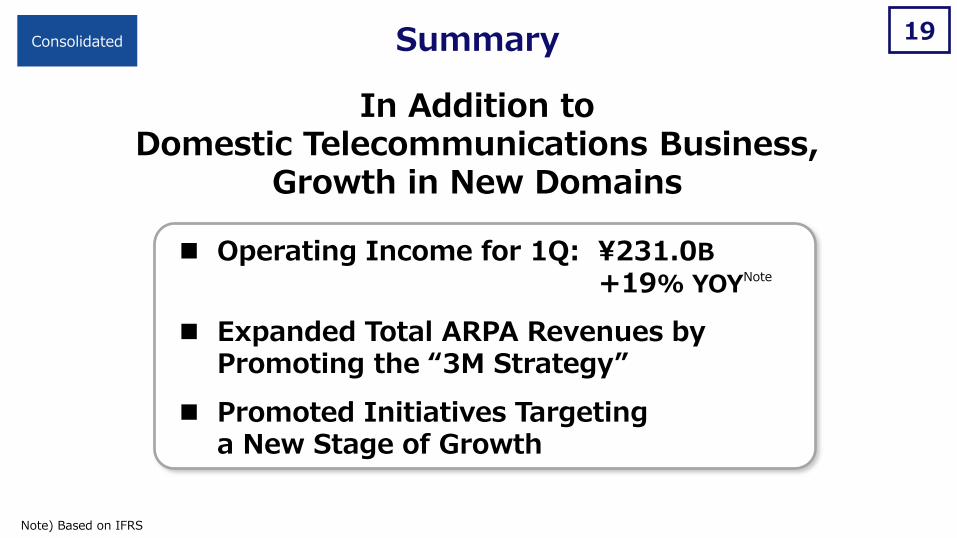
Summary 19 Consolidated
Note) Based on IFRS
In Addition to Domestic Telecommunications Business,
Growth in New Domains
Operating Income for 1Q: ¥231.0B +19% YOYNote
Expanded Total ARPA Revenues by Promoting the “3M Strategy”
Promoted Initiatives Targeting a New Stage of Growth

Appendix
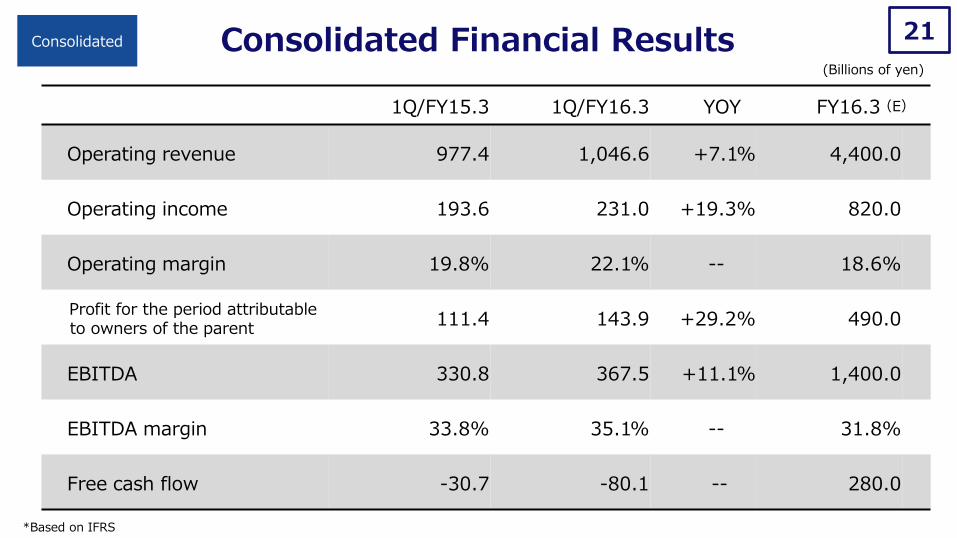
Consolidated Financial Results 21
1Q/FY15.3 1Q/FY16.3 YOY FY16.3
Operating revenue 977.4 1,046.6 +7.1% 4,400.0
Operating income 193.6 231.0 +19.3% 820.0
Operating margin 19.8% 22.1% -- 18.6%
Profit for the period attributable to owners of the parent
111.4 143.9 +29.2% 490.0
EBITDA 330.8 367.5 +11.1% 1,400.0
EBITDA margin 33.8% 35.1% -- 31.8%
Free cash flow -30.7 -80.1 -- 280.0
(E)
Consolidated
(Billions of yen)
*Based on IFRS
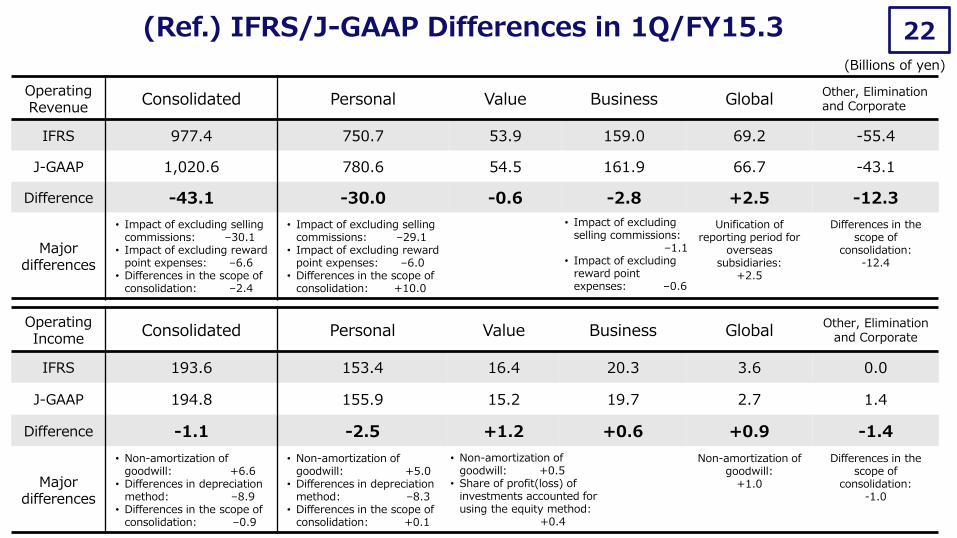
22
Operating Income
Consolidated Personal Value Business Global Other, Elimination
and Corporate
IFRS 193.6 153.4 16.4 20.3 3.6 0.0
J-GAAP 194.8 155.9 15.2 19.7 2.7 1.4
Difference -1.1 -2.5 +1.2 +0.6 +0.9 -1.4
Major differences
• Non-amortization of goodwill: +6.6
• Differences in depreciation method: –8.9
• Differences in the scope of consolidation: –0.9
• Non-amortization of goodwill: +5.0
• Differences in depreciation method: –8.3
• Differences in the scope of consolidation: +0.1
Non-amortization of goodwill:
+1.0
Differences in the scope of
consolidation: -1.0
Operating Revenue
Consolidated Personal Value Business Global Other, Elimination and Corporate
IFRS 977.4 750.7 53.9 159.0 69.2 -55.4
J-GAAP 1,020.6 780.6 54.5 161.9 66.7 -43.1
Difference -43.1 -30.0 -0.6 -2.8 +2.5 -12.3
Major differences
• Impact of excluding selling commissions: –30.1
• Impact of excluding reward point expenses: –6.6
• Differences in the scope of consolidation: –2.4
• Impact of excluding selling commissions: –29.1
• Impact of excluding reward point expenses: –6.0
• Differences in the scope of consolidation: +10.0
Unification of reporting period for
overseas subsidiaries:
+2.5
Differences in the scope of
consolidation: -12.4
(Ref.) IFRS/J-GAAP Differences in 1Q/FY15.3
(Billions of yen)
• Non-amortization of goodwill: +0.5
• Share of profit(loss) of investments accounted for using the equity method: +0.4
• Impact of excluding selling commissions:
–1.1 • Impact of excluding
reward point expenses: –0.6
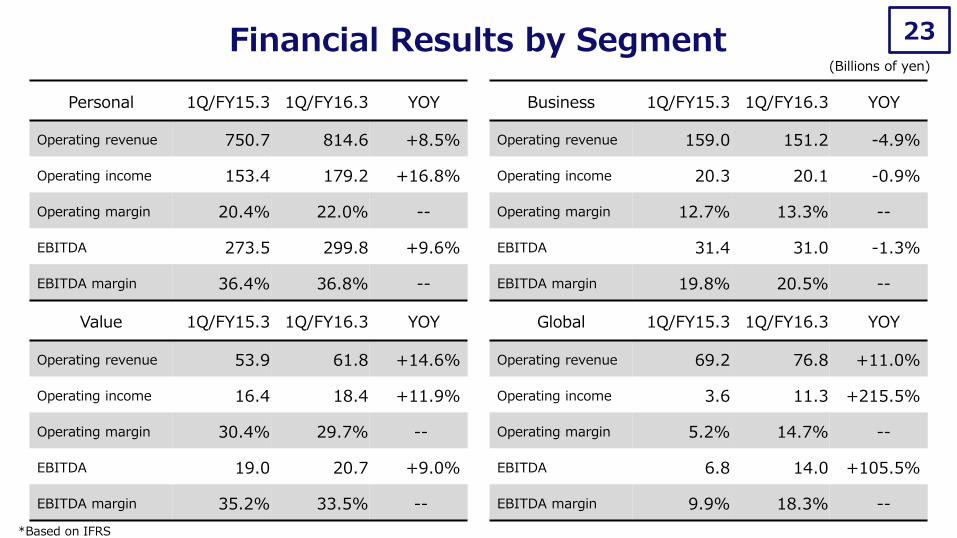
Financial Results by Segment 23
Personal 1Q/FY15.3 1Q/FY16.3 YOY
Operating revenue 750.7 814.6 +8.5%
Operating income 153.4 179.2 +16.8%
Operating margin 20.4% 22.0% --
EBITDA 273.5 299.8 +9.6%
EBITDA margin 36.4% 36.8% --
Value 1Q/FY15.3 1Q/FY16.3 YOY
Operating revenue 53.9 61.8 +14.6%
Operating income 16.4 18.4 +11.9%
Operating margin 30.4% 29.7% --
EBITDA 19.0 20.7 +9.0%
EBITDA margin 35.2% 33.5% --
Business 1Q/FY15.3 1Q/FY16.3 YOY
Operating revenue 159.0 151.2 -4.9%
Operating income 20.3 20.1 -0.9%
Operating margin 12.7% 13.3% --
EBITDA 31.4 31.0 -1.3%
EBITDA margin 19.8% 20.5% --
Global 1Q/FY15.3 1Q/FY16.3 YOY
Operating revenue 69.2 76.8 +11.0%
Operating income 3.6 11.3 +215.5%
Operating margin 5.2% 14.7% --
EBITDA 6.8 14.0 +105.5%
EBITDA margin 9.9% 18.3% --
(Billions of yen)
*Based on IFRS
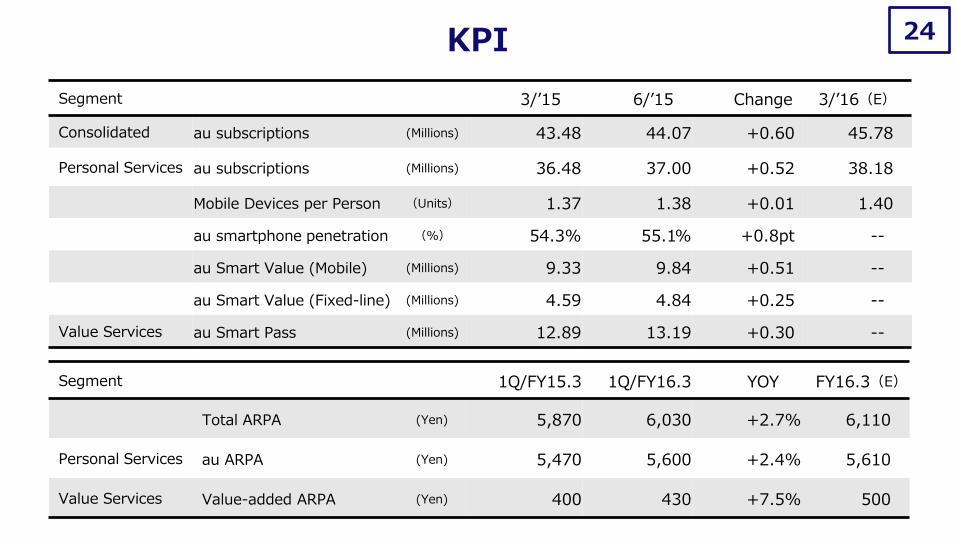
KPI 24
Segment 3/’15 6/’15 Change 3/’16(E)
Consolidated au subscriptions (Millions) 43.48 44.07 +0.60 45.78
Personal Services au subscriptions (Millions) 36.48 37.00 +0.52 38.18
Mobile Devices per Person (Units) 1.37 1.38 +0.01 1.40
au smartphone penetration (%) 54.3% 55.1% +0.8pt --
au Smart Value (Mobile) (Millions) 9.33 9.84 +0.51 --
au Smart Value (Fixed-line) (Millions) 4.59 4.84 +0.25 --
Value Services au Smart Pass (Millions) 12.89 13.19 +0.30 --
Segment 1Q/FY15.3 1Q/FY16.3 YOY FY16.3(E)
Total ARPA (Yen) 5,870 6,030 +2.7% 6,110
Personal Services au ARPA (Yen) 5,470 5,600 +2.4% 5,610
Value Services Value-added ARPA (Yen) 400 430 +7.5% 500
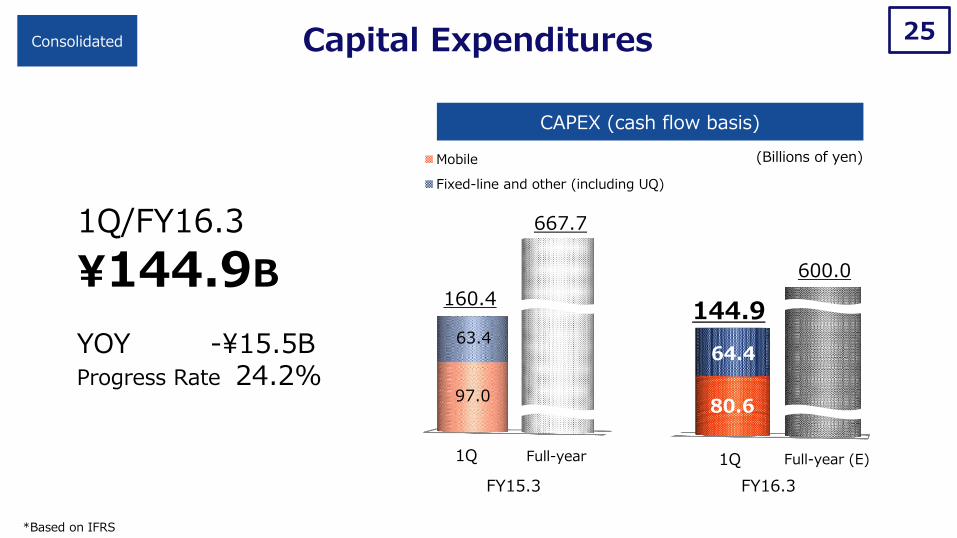
CAPEX (cash flow basis)
25
1Q 1Q
Mobile
Fixed-line and other (including UQ)
1Q/FY16.3
¥144.9B
FY15.3 FY16.3
Capital Expenditures Consolidated
YOY -¥15.5B Progress Rate 24.2%
63.4
97.0
Full-year (E)
(Billions of yen)
160.4
600.0
144.9
667.7
64.4
80.6
*Based on IFRS
Full-year

The figures included in the this brief, including the business performance target and the target for the number of subscribers are all projected data based on the information currently available to the KDDI Group, and are subject to variable factors such as economic conditions, a competitive environment and the future prospects for newly introduced services. Accordingly, please be advised that the actual results of business performance or of the number of subscribers may differ substantially from the projections described here.
Disclaimer


