+ All Categories
Home > Documents > Financial Results for the 3 Quarter of the FY ending March 31, 2015 · 2015-04-17 · I. Financial...

Financial Results for the 3 Quarter of the FY ending March 31, 2015 · 2015-04-17 · I. Financial...

Date post: 11-Jul-2020
Category:
Upload: others
View: 1 times
Download: 0 times
Share this document with a friend
14
© Copyright 2015 Oki Electric Industry Co., Ltd. 1 Financial Results for the 3 rd Quarter of the FY ending March 31, 2015 February 3, 2015 Oki Electric Industry Co., Ltd. Indication method of amounts in hundred millions (yen) are as follow: Amounts in each item are rounded to the nearest hundred million yen. Variances are calculated in the hundred millions. The projections and plans in this material are subject to change depending upon the changes of business environments and other conditions.
Transcript

© Copyright 2015 Oki Electric Industry Co., Ltd. 1

Financial Results for the 3rd Quarter of the FY ending March 31, 2015

February 3, 2015

Oki Electric Industry Co., Ltd.

•Indication method of amounts in hundred millions (yen) are as follow:Amounts in each item are rounded to the nearest hundred million yen. Variances are calculated in the hundred millions.

• The projections and plans in this material are subject to change depending upon the changes of business environments and other conditions.

© Copyright 2015 Oki Electric Industry Co., Ltd. 2

Table of Contents

I. Financial results for the Q3, FY ending Mar. 20151. Overall condition of the Group

2. Segment information

3. Changing factors of operating income

4. Profit and loss

5. Balance sheets

6. Cash flows

II. Full Year Projections for the FY ending Mar. 2015

1. Full Year Projections and Dividend

© Copyright 2015 Oki Electric Industry Co., Ltd. 3

Overall Condition of the Group

FY end Mar. 2015 FY end Mar. 2014Net sales Operating

incomeNet sales Operating

income

Info-telecom 219.8 10.2 188.5 10.1Printers 94.5 5.8 89.2 1.3EMS 29.3 0.9 26.8 0.9Others 13.4 2.5 13.3 2.1Eliminates & Corp. - (4.1) - (4.1)Total 356.9 15.3 317.8 10.4

Net sales and operating income increased year on year.Each segment sustained its healthy performance.

[Y o Y comparison]Net sales increased by 39.1 B yen.Operating income increased by 4.9 B yen.

(Billion yen)

© Copyright 2015 Oki Electric Industry Co., Ltd. 4

10.2

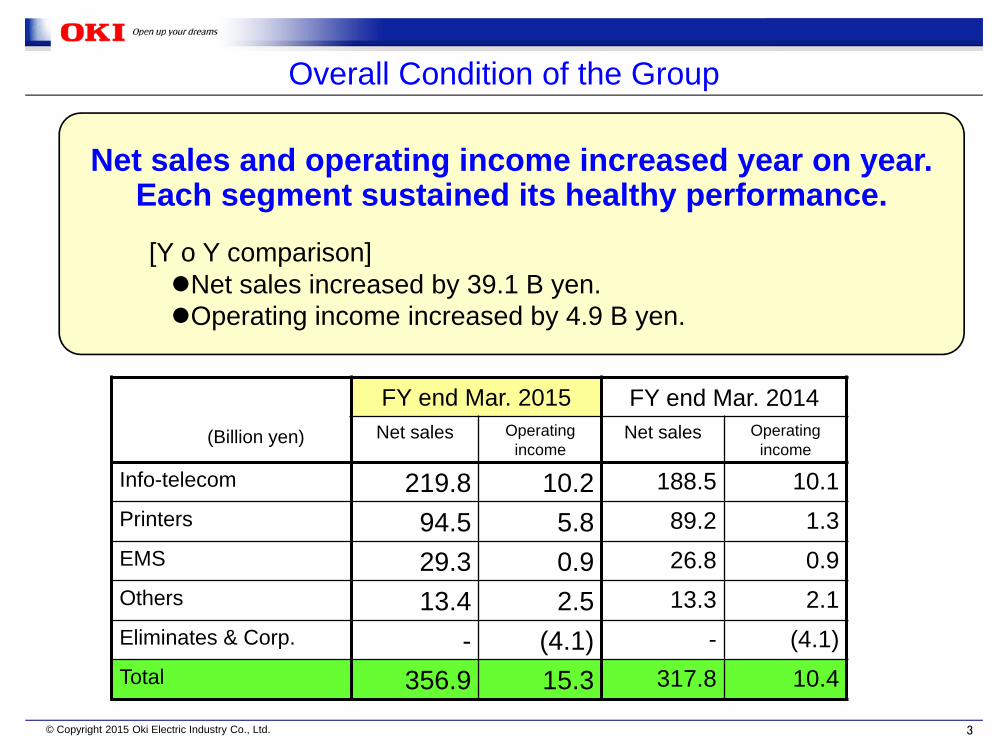
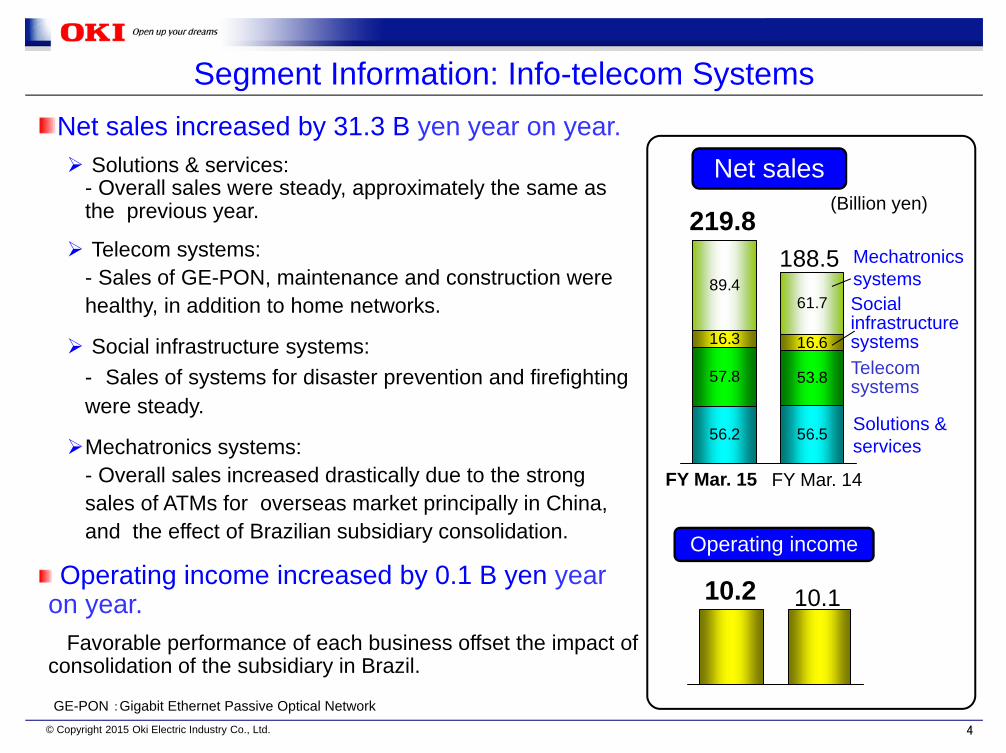
Net sales increased by 31.3 B yen year on year. Solutions & services:

- Overall sales were steady, approximately the same as the previous year.

Telecom systems:- Sales of GE-PON, maintenance and construction were healthy, in addition to home networks.

Social infrastructure systems: - Sales of systems for disaster prevention and firefighting were steady.

Mechatronics systems: - Overall sales increased drastically due to the strong sales of ATMs for overseas market principally in China, and the effect of Brazilian subsidiary consolidation.

Operating income increased by 0.1 B yen year on year.

Favorable performance of each business offset the impact of consolidation of the subsidiary in Brazil.

Segment Information: Info-telecom Systems

56.2 56.5

57.8 53.8

16.3 16.6

89.461.7

188.5

10.1

219.8

Net sales(Billion yen)

Mechatronicssystems

Telecom systems

Solutions & services

Social infrastructure systems

FY Mar. 15 FY Mar. 14

Operating income

GE-PON :Gigabit Ethernet Passive Optical Network

© Copyright 2015 Oki Electric Industry Co., Ltd. 5

Segment Information: Printers

Net sales increased by 5.3 B yen year on year.

Color and mono LED printers:- Color LED printers: Sales of strategic models were healthy.- Mono LED printers: Sales of high-end models were steady.

Dot impact printers:Sales were approximately the same as the previous fiscal year.

Operating income increased by 4.5 B yen year on year.Operating income increased due to the impact of revamping business structure, in addition to product mix improvement.

57.9 53.4

23.622.5

10.510.7

2.52.6

89.2

1.3

94.5

5.8

Net sales(Billion yen)

Others

Mono LED

Color LED

Dot Impact

Operating income

FY Mar. 15 FY Mar. 14

© Copyright 2015 Oki Electric Industry Co., Ltd. 6

2.1

0.9 0.9

2.5

29.3 26.8

13.413.3

Segment Information: EMS, Others

3.0

42.7

3.4

Net sales:

EMS:Sales increased as acquiring new customers was

stable.

Others:Sales in components related business were

continuously steady.

Operating income:

Operating income rose due to the increase in sales volume.

40.1

Net sales(Billion yen)

FY Mar. 15 FY Mar. 14

Others

EMS

Operating income

OthersEMS

© Copyright 2015 Oki Electric Industry Co., Ltd. 7

Changing Factors of Operating Income

Operating income increased due to rise in sales volume and product mix improvement.

10.4

(3.0)

+6.0

(1.5)+2.0

+1.5

15.3

FY14first nine months

FY13first nine months

(Billion yen)Changes in fixed costs, etc.

Impact of currency exchangeReduction in

production and procurement costs

Price decline

Changes in volume and product mix

© Copyright 2015 Oki Electric Industry Co., Ltd. 8

Other income and expenses:Exchange gain decreased (from 12.8 B yen to 9.5 B yen).

Extraordinary income/loss improved since revamping Printers business structure completed.

Net income rose by 4.0 B yen.

Profit and Loss for the Nine Months

9 months FY Mar.

20159 monthsFY Mar.

2014

Net Sales 356.9 317.8

Cost of Sales 263.6 233.9

SG&A 78.0 73.4Operating income 15.3 10.4

Other income & expenses 8.0 11.3

Ordinary income 23.3 21.7Extraordinary income(loss) 0.1 (3.5)

Income before income taxes 23.4 18.2

Net income 18.5 14.5

[Y on Y comparison]

[Ref.]Closing exchange rate Average exchange rate

End of Dec. 2014

End of Mar. 2014

9 monthsFY end.

Mar. 2015

9 monthsFY end.

Mar. 2014

USD 120.5 102.9 106.9 99.4

EUR 146.5 141.6 140.3 132.2

(Billion yen)

© Copyright 2015 Oki Electric Industry Co., Ltd. 9

Balance Sheet [Assets]

133.4

50.9

55.8 57.8

107.8 75.0

90.2 123.9

50.4 35.9

96.5 86.7

56.5 56.2

118.5 85.3

98.9

60.5

56.757.1

Dec.31, 2014 Mar.31, 2014 Dec.31, 2013 Mar.31, 2013

Cash and cashequivalents Notes and accountsreceivables Inventories

Property, plant andequipmentsOthers

+9.6

(34.5)

+33.2

+0.3

+9.8

430.9 412.5361.3 349.3

Total assets increased by 18.4 B yen to 430.9 B yen.

Cash and cash equivalents increased by 9.6 B yen to 60.5 B yen.

Trend of change in each asset was the same as in the past.

(Billion yen)Variance with

March 31, 2014

© Copyright 2015 Oki Electric Industry Co., Ltd. 10

Balance Sheet [Liabilities and shareholders’ equity]

119.0

73.3

106.3 109.3

121.7 120.5

67.5 63.4

88.797.6

131.5140.0

117.6

75.7

56.165.8

Dec.31, 2014 Mar.31, 2014 Dec.31, 2013 Mar.31, 2013

Accounts payable

Interest bearing debt

Others

Shareholders' equity

+2.4

(1.4)

+8.5

+8.9

Shareholders’ equity increased by 8.9 B yen to 97.6 B yen.Shareholders’ equity ratio: 22.6%Interest bearing debt decreased by 1.4 B yen to 117.6 B yen. D/E ratio: 1.2 times

412.5430.9349.3361.3

(Billion yen)

Variance with March 31, 2014

© Copyright 2015 Oki Electric Industry Co., Ltd. 11

Cash Flows

Cash flows from operating activities rose by 11.5 B yen year on year due to increase in net income, etc.Free Cash flows saw a net inflow of 18.8 B yen due to the outflow increase in cash flows from investing activities.

(Billion yen)

Free cash flows and net cash flows are the total of each item which are rounded to the nearest hundred million yen.

FY March end. 2015

FY March end. 2014

Ⅰ Cash flows from operating activities 33.0 21.5Net income before income taxes 23.4 18.2Depreciation & amortization 10.5 10.5Change in working capital 6.9 7.3Others (7.8) (14.5)

Ⅱ Cash flows from investing activities (14.2) (7.2)Purchase of property, plants & equipment (8.3) (6.2)Others (5.9) (1.0)

Free Cash Flows(Ⅰ+Ⅱ) 18.8 14.3Ⅲ Cash flows from financing activities (10.3) (1.3)Net cash flows (Ⅰ+Ⅱ+Ⅲ) 8.5 13.0

(Billion yen)

© Copyright 2015 Oki Electric Industry Co., Ltd. 12

I. Financial results for the Q3, FY ending Mar. 20151. Overall condition of the Group

2. Segment information

3. Changing factors of operating income

4. Profit and loss

5. Balance sheets

6. Cash flows

II. Full Year Projections for the FY ending Mar. 2015

1. Full Year Projections and Dividend

© Copyright 2015 Oki Electric Industry Co., Ltd. 13

Full Year Projections and Dividend

Full year projections for the FY end. Mar. 2015FY end.

Mar.2014Feb. 3, 2015 Previous projections Variance

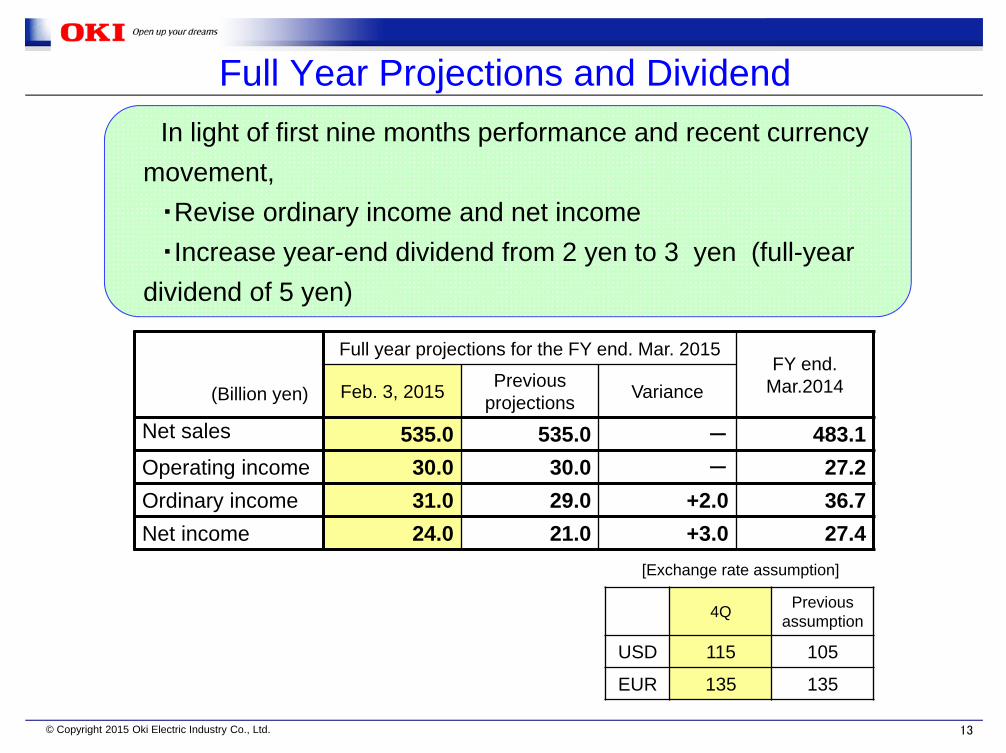
Net sales 535.0 535.0 - 483.1Operating income 30.0 30.0 - 27.2Ordinary income 31.0 29.0 +2.0 36.7Net income 24.0 21.0 +3.0 27.4

In light of first nine months performance and recent currency movement, ・Revise ordinary income and net income・Increase year-end dividend from 2 yen to 3 yen (full-year

dividend of 5 yen)

(Billion yen)

4Q Previous assumption

USD 115 105

EUR 135 135

[Exchange rate assumption]

© Copyright 2015 Oki Electric Industry Co., Ltd. 14


Recommended