20
FINANCIAL RESULTS FOR THE SIX MONTHS ENDED SEPTEMBER 2019 Mitsubishi Corporation 2-3-1 Marunouchi, Chiyoda-ku, Tokyo, JAPAN 100-8086 https://www.mitsubishicorp.com/

FINANCIAL RESULTS FOR
THE SIX MONTHS ENDED SEPTEMBER 2019
Mitsubishi Corporation 2-3-1 Marunouchi, Chiyoda-ku, Tokyo, JAPAN 100-8086
https://www.mitsubishicorp.com/

November 6, 2019
Mitsubishi Corporation FINANCIAL HIGHLIGHTS FOR THE SIX MONTHS ENDED SEPTEMBER 30, 2019
(Based on IFRS) (Consolidated) 1. Consolidated operating results for the six months ended September 30, 2019 (1) Revenues and income
Note: Figures less than one million yen are rounded. %: change from the same period of the previous year
Revenues Profit before tax Profit for the period
Profit for the period
attributable to
owners of the Parent
Comprehensive income
For the six months ended Millions of Yen % Millions of Yen % Millions of Yen % Millions of Yen % Millions of Yen %
September 30, 2019 7,723,892 (2.8) 356,440 (20.9) 269,939 (20.4) 242,359 (21.6) 26,257 (94.6)
September 30, 2018 7,943,248 117.2 450,554 20.1 339,075 19.8 309,309 21.8 489,412 13.5
Profit for the period
attributable to
owners of the Parent
per share (basic)
Profit for the period
attributable to
owners of the Parent
per share (diluted)
For the six months ended Yen Yen
September 30, 2019 154.97 154.64
September 30, 2018 195.01 194.55 Note: Profit for the period attributable to owners of the Parent per share (basic) and Profit for the period attributable to owners of the Parent per share (diluted) are calculated based on Profit for the
period attributable to owners of the Parent.
(2) Financial position
Total assets Total equity Equity attributable to
owners of the Parent
Ratio of equity attributable to
owners of the Parent to total
assets
As of Millions of Yen Millions of Yen Millions of Yen %
September 30, 2019 17,532,294 6,358,790 5,422,301 30.9
March 31, 2019 16,532,800 6,636,920 5,696,246 34.5
2. Dividends Cash dividend per share (Yen)
(Record date) 1Q end 2Q end 3Q end 4Q end Annual
Fiscal Year
ended March 31, 2019 - 62.00 - 63.00 125.00
Fiscal Year
ending March 31, 2020 - 64.00
Fiscal Year
ending March 31, 2020 (Forecast) - 68.00 132.00
Note: Change from the latest released dividend forecasts: Yes
3. Consolidated forecasts for the fiscal year ending March 31, 2020 (April 1, 2019 to March 31, 2020)
Note: %: change from the previous year.
Profit attributable to
owners of the Parent
Profit attributable to owners of
the Parent per share
For the year ending Millions of Yen % Yen
March 31, 2020 520,000 (12.0) 339.33 Note: Change from the latest released earnings forecasts: Yes
4. Notes (1) Changes in significant subsidiaries during the period (changes in specified subsidiaries causing changes in scope of consolidation): Yes
New companies: 1(Chiyoda Corporation) -Excluded companies:
Chiyoda Corporation became a consolidated subsidiary during the period.
(2) Changes in accounting policies and accounting estimates
-1- Changes in accounting policies required by IFRS : Yes
-2- Changes in accounting policies other than -1- : None
-3- Changes in accounting estimates : None
Please refer to page 11, "3. Changes in Accounting Policies and Accounting Estimates."
(3) Number of shares issued (Common stock)
-1- Number of shares issued at quarterly-end (including treasury stock) (September 30, 2019) 1,590,076,851 (March 31, 2019) 1,590,076,851
-2- Number of treasury stock at quarterly-end (September 30, 2019) 63,327,701 (March 31, 2019) 3,099,600
-3- Average number of shares during each of the six months ended September 30, 2019 (September 30, 2019) 1,563,917,783 (September 30, 2018) 1,586,143,959
Disclosure Regarding Quarterly Review Procedures
This earnings release is not subject to independent Auditor's review procedures.
Forward-looking Statements
Earnings forecasts and other forward-looking statements in this release are based on data currently available to management and certain assumptions that management believes are reasonable. The
achievement of said forecasts cannot be promised. Actual results may therefore differ materially from these statements for various reasons. For cautionary notes concerning assumptions for earnings
forecasts and use of earnings forecasts, please refer to "1. (4) Forecasts for the Year Ending March 2020" on page 4.

1
Contents
1. Qualitative Information …………………………………………………………………………2 (1) Results of Operations ……………………………………………………………………………2 (2) Financial Position ………………………………………………………………………………3 (3) Cash Flows ………………………………………………………………………………………3 (4) Forecasts for the Year Ending March 2020 …………………………………………………… 4
2. Condensed Consolidated Financial Statements …………………………………………………5 (1) Condensed Consolidated Statement of Financial Position ………………………………………5 (2) Condensed Consolidated Statement of Income …………………………………………………7 (3) Condensed Consolidated Statement of Comprehensive Income ………………………………8 (4) Condensed Consolidated Statement of Changes in Equity ……………………………………9 (5) Condensed Consolidated Statement of Cash Flows ……………………………………………10
3. Changes in Accounting Policies and Accounting Estimates ………………………………… 11
4. Notes Concerning Going Concern Assumption ……………………………………………… 12
* Mitsubishi Corporation will hold an earnings conference call for the six months ended September 2019, inviting institutional investors and analysts to join. The conference material can be accessed live in Japanese from our website (Investor Relations section) at the following URL: https://www.mitsubishicorp.com/jp/ja/ir/index.html Time and date of the earnings conference call: From 14:30 to 16:00 on Friday, November 8, 2019 (Japan Time)

2
1. Qualitative Information (Profit for the period, as used hereinafter, refers to profit for the period attributable to owners of the Parent.) (1) Results of Operations Revenues was ¥7,723.9 billion, a decrease of ¥219.3 billion, or 3% year over year. This was mainly due to decreased transaction volumes in the Petro-chemical business. Gross profit was ¥903.1 billion, a decrease of ¥91.4 billion, or 9% year over year, mainly due to increased production cost and decreased market price in the Australian metallurgical coal business as well as the loss related to crude oil trading derivatives. Selling, general and administrative expenses remained nearly the same year over year at ¥711.0 billion. Gains on investments increased ¥18.2 billion, or 209% year over year, to ¥26.9 billion, mainly due to rebound from impairment loss of investment in Chiyoda Corporation in the previous year and fair value evaluation profit due to Chiyoda Corporation becoming a consolidated subsidiary. Impairment losses on property, plant and equipment and others remained nearly the same year over year at ¥7.1 billion. Other income (expense)-net remained nearly the same year over year at an expense amount of ¥14.2 billion. Finance income decreased by ¥15.8 billion, or 16% year over year, to ¥85.1 billion, mainly due to decreased dividend income from resource-related investments. Share of profit of investments accounted for using the equity method increased ¥13.9 billion, or 15% year over year, to ¥106.9 billion, mainly due to rebound from one-off losses related to Chiyoda Corporation in the previous year. As a result, profit before tax decreased ¥94.2 billion, or 21% year over year, to ¥356.4 billion. Accordingly, profit for the period fell ¥66.9 billion, or 22% year over year to ¥242.4 billion.

3
(2) Financial Position Total assets at September 30, 2019 was ¥17,532.3 billion, an increase of ¥999.5 billion from March 31, 2019. The increase was mainly due to an increase in right-of-use assets as a result of the adoption of IFRS 16 "Leases". Total liabilities was ¥11,173.5 billion, an increase of ¥1,277.6 billion from March 31, 2019. This increase was mainly attributable to an increase in lease liabilities as a result of the adoption of IFRS 16 "Leases". Net interest-bearing liabilities (excluding lease liabilities), which is gross interest-bearing liabilities minus cash and cash equivalents, time deposits and lease liabilities, increased ¥55.7 billion from March 31, 2019, to ¥3,779.3 billion. Equity attributable to owners of the Parent was ¥5,422.3 billion, a decrease of ¥273.9 billion from March 31, 2019. This decrease was mainly attributable to the purchase of treasury stock, the payment of dividends and a decrease in exchange differences on translating foreign operations due to the depreciation of the Australian dollar and US dollar, despite the accumulation of profit for the period. (3) Cash Flows
Cash and cash equivalents at September 30, 2019 was ¥1,201.8 billion, an increase of ¥41.2 billion from March 31, 2019. (Operating activities) Net cash provided by operating activities was ¥360.1 billion, mainly due to cash flows from operating transactions and dividend income, despite the payment of income taxes and an increase in working capital requirements. (Investing activities) Net cash provided by investing activities was ¥25.1 billion. The main inflows were the inclusion of cash held by Chiyoda Corporation as a result of consolidating that company as a new subsidiary, the sale of investments in affiliated companies and the sale of listed stocks, which exceeded such uses of cash as payments for the purchase of property, plant and equipment and investments in affiliated companies. As a result, free cash flows, the sum of operating and investing cash flows, was positive ¥385.2 billion. (Financing activities) Net cash used in financing activities was ¥329.8 billion. The main uses of cash were the acquisition of treasury stock and repayments of lease liabilities, which exceeded cash provided by short term financing activities. Repayments of lease liabilities recognized with the adoption of IFRS16 "Leases" are included in Financing activities.

4
(4) Forecasts for the Year Ending March 2020 Due to lower operating income mainly in the Australian metallurgical coal business, the Automotive-related business and LNG-related business, and the loss related to crude oil trading derivatives, the forecast for the year ending March 2020 has been revised as follows. Consolidated Forecast for the Year Ending March 2020 (April 1, 2019 to March 31, 2020) (Billions of Yen)
Previous full-year forecast
(May 9, 2019) (A) Revised full-year forecast
(B) Change (B-A)
Change (%)
Profit attributable to owners of the Parent 600.0 520.0 (80.0) (13%)
Note: Earnings forecast and other forward-looking statements in this release are based on data currently available to management and certain assumptions that management believes are reasonable. Therefore, they do not constitute a guarantee that they will be achieved. Actual results may differ materially from these statements for various reasons.

5
2. Condensed Consolidated Financial Statements
(1) Condensed Consolidated Statement of Financial Position March 31, 2019 and September 30, 2019
ASSETS
Millions of Yen
March 31, 2019
September 30, 2019
Current assets
Cash and cash equivalents 1,160,582 1,201,842
Time deposits 207,949 197,338
Short-term investments 7,798 16,487
Trade and other receivables 3,722,719 3,397,667
Other financial assets 93,139 127,724
Inventories 1,213,742 1,296,546
Biological assets 70,687 68,427
Advance payments to suppliers 43,797 48,730
Assets classified as held for sale 105,586 39,224
Other current assets 412,925 425,518
Total current assets 7,038,924 6,819,503
Non-current assets
Investments accounted for using the equity method 3,191,145 3,209,459
Other investments 2,108,983 2,011,153
Trade and other receivables 599,619 604,376
Other financial assets 100,326 101,615
Property, plant and equipment 2,168,962 1,910,752
Investment property 69,293 82,748
Intangible assets and goodwill 1,035,898 1,147,797
Right-of-use assets - 1,441,141
Deferred tax assets 31,431 30,724
Other non-current assets 188,219 173,026
Total non-current assets 9,493,876 10,712,791
Total 16,532,800 17,532,294

6
LIABILITIES AND EQUITY
Millions of Yen
March 31, 2019
September 30, 2019
Current liabilities
Bonds and borrowings 1,522,878 1,556,824
Trade and other payables 2,862,954 2,751,907
Lease liabilities 54,276 214,032
Other financial liabilities 83,589 93,592
Advances from customers 43,481 174,719
Income tax payables 63,497 37,610
Provisions 33,023 85,840
Liabilities directly associated with assets classified as held for sale 29,062 4,631
Other current liabilities 460,922 433,055
Total current liabilities 5,153,682 5,352,210
Non-current liabilities
Bonds and borrowings 3,569,221 3,621,693
Trade and other payables 60,304 59,047
Lease liabilities 231,001 1,285,627
Other financial liabilities 15,198 26,177
Retirement benefit obligation 86,401 86,623
Provisions 178,928 160,661
Deferred tax liabilities 585,952 566,957
Other non-current liabilities 15,193 14,509
Total non-current liabilities 4,742,198 5,821,294
Total liabilities 9,895,880 11,173,504
Equity
Common stock 204,447 204,447
Additional paid-in capital 228,340 227,358
Treasury stock (8,279) (178,328)
Other components of equity
Other investments designated as FVTOCI 541,970 501,348
Cash flow hedges (6,291) (42,632)
Exchange differences on translating foreign operations 379,128 204,023
Total other components of equity 914,807 662,739
Retained earnings 4,356,931 4,506,085
Equity attributable to owners of the Parent 5,696,246 5,422,301
Non-controlling interests 940,674 936,489
Total equity 6,636,920 6,358,790
Total 16,532,800 17,532,294

7
(2) Condensed Consolidated Statement of Income
for the six months ended September 30, 2018 and 2019
Millions of Yen
Six months ended
September 30, 2018
Six months ended
September 30, 2019
Revenues 7,943,248 7,723,892
Cost of revenues (6,948,702) (6,820,814)
Gross profit 994,546 903,078
Selling, general and administrative expenses (691,815) (710,983)
Gains on investments 8,726 26,942
Gains on disposal and sale of property, plant and equipment and others 2,161 2,287
Impairment losses on property, plant and equipment and others (8,577) (7,074)
Other income (expense)-net (15,851) (14,170)
Finance income 100,880 85,094
Finance costs (32,515) (35,585)
Share of profit of investments accounted for using the equity method 92,999 106,851
Profit before tax 450,554 356,440
Income taxes (111,479) (86,501)
Profit for the period 339,075 269,939
Profit for the period attributable to:
Owners of the Parent 309,309 242,359
Non-controlling interests 29,766 27,580
339,075 269,939
Profit for the period attributable to Owners of the Parent per share (in Yen)
Basic 195.01 154.97
Diluted 194.55 154.64

8
(3) Condensed Consolidated Statement of Comprehensive Income
for the six months ended September 30, 2018 and 2019
Millions of Yen
Six months ended
September 30, 2018
Six months ended
September 30, 2019
Profit for the period 339,075 269,939
Other comprehensive income (loss), net of tax
Items that will not be reclassified to profit or loss for the period:
Gains (losses) on other investments designated as FVTOCI 98,723 (25,533)
Remeasurement of defined benefit pension plans (120) 514
Share of other comprehensive income of investments accounted for using the equity method
2,386 1,780
Total 100,989 (23,239)
Items that may be reclassified to profit or loss for the period:
Cash flow hedges (2,761) (9,106)
Exchange differences on translating foreign operations 68,637 (154,926)
Share of other comprehensive (loss) of investments accounted for using the equity method
(16,528) (56,411)
Total 49,348 (220,443)
Total other comprehensive income (loss) 150,337 (243,682)
Total comprehensive income 489,412 26,257
Comprehensive income attributable to:
Owners of the Parent 449,494 6,794
Non-controlling interests 39,918 19,463
489,412 26,257

9
(4) Condensed Consolidated Statement of Changes in Equity
for the six months ended September 30, 2018 and 2019
Millions of Yen
Six months ended
September 30, 2018
Six months ended
September 30, 2019
Common stock:
Balance at the beginning of the period 204,447 204,447
Balance at the end of the period 204,447 204,447
Additional paid-in capital:
Balance at the beginning of the period 229,423 228,340
Compensation costs related to share-based payment 768 1,426
Sales of treasury stock upon exercise of share-based payment (787) (1,049)
Equity transactions with non-controlling interests and others (334) (1,359)
Balance at the end of the period 229,070 227,358
Treasury stock:
Balance at the beginning of the period (10,970) (8,279)
Sales of treasury stock upon exercise of share-based payment 1,288 1,706
Purchases and sales-net (6) (171,755)
Balance at the end of the period (9,688) (178,328)
Other components of equity:
Balance at the beginning of the period 925,611 914,807
Cumulative effects of change in accounting policy 53 -
Adjusted balance at the beginning of the period 925,664 914,807
Other comprehensive income (loss) attributable to owners of the Parent 140,185 (235,565)
Transfer to retained earnings 67,397 (16,503)
Balance at the end of the period 1,133,246 662,739
Retained earnings:
Balance at the beginning of the period 3,983,916 4,356,931
Cumulative effects of change in accounting policy (3,677) (9,079)
Adjusted balance at the beginning of the period 3,980,239 4,347,852
Profit for the period attributable to owners of the Parent 309,309 242,359
Cash dividends paid to owners of the Parent (99,916) (99,982)
Sales of treasury stock upon exercise of share-based payment (500) (647)
Transfer from other components of equity (67,397) 16,503
Balance at the end of the period 4,121,735 4,506,085
Equity attributable to owners of the Parent 5,678,810 5,422,301
Non-controlling interests:
Balance at the beginning of the period 932,784 940,674
Cumulative effects of change in accounting policy (521) (2,677)
Adjusted balance at the beginning of the period 932,263 937,997
Cash dividends paid to non-controlling interests (38,853) (32,094)
Equity transactions with non-controlling interests and others (3,411) 11,123
Profit for the period attributable to non-controlling interests 29,766 27,580
Other comprehensive income (loss) attributable to non-controlling interests 10,152 (8,117)
Balance at the end of the period 929,917 936,489
Total equity 6,608,727 6,358,790
Comprehensive income attributable to:
Owners of the Parent 449,494 6,794
Non-controlling interests 39,918 19,463
Total comprehensive income 489,412 26,257

10
(5) Condensed Consolidated Statement of Cash Flows for the six months ended September 30, 2018 and 2019
Millions of Yen
Six months ended September 30, 2018
Six months ended September 30, 2019
Operating activities:
Profit for the period 339,075 269,939
Adjustments to reconcile profit for the period to net cash provided by (used in) operating activities:
Depreciation and amortization 122,664 218,672
(Gains) on investments (8,726) (26,942)
Losses on property, plant and equipment and others 6,416 4,787
Finance (income) -net of finance costs (68,365) (49,509)
Share of (profit) of investments accounted for using the equity method (92,999) (106,851)
Income taxes 111,479 86,501
Changes in trade receivables (247,928) 339,843
Changes in inventories (3,731) (115,975)
Changes in trade payables 130,904 (244,601)
Other-net (76,313) (96,743)
Dividends received 207,152 182,067
Interest received 56,625 60,703
Interest paid (39,843) (47,579)
Income taxes paid (149,928) (114,177)
Net cash provided by (used in) operating activities 286,482 360,135
Investing activities:
Payments for property, plant and equipment and others (137,862) (161,442)
Proceeds from disposal of property, plant and equipment and others 65,393 22,149
Purchases of investments accounted for using the equity method (219,968) (79,697)
Proceeds from disposal of investments accounted for using the equity method 70,123 61,935
Acquisitions of businesses-net of cash acquired (18,431) 130,838
Proceeds from disposal of businesses-net of cash divested 86,141 50,813
Purchases of other investments (39,813) (18,247)
Proceeds from disposal of other investments 44,539 74,600
Increase in loans receivable (28,986) (104,757)
Collection of loans receivable 22,354 39,110
Net (increase) decrease in time deposits 1,535 9,817
Net cash provided by (used in) investing activities (154,975) 25,119
Financing activities:
Net increase (decrease) in short-term debts 108,708 172,521
Proceeds from long-term debts 331,532 174,423
Repayments of long-term debts (363,598) (235,720)
Repayments of lease liabilities (26,417) (130,561)
Dividends paid to owners of the Parent (99,916) (99,982)
Dividends paid to non-controlling interests (38,853) (32,094)
Payments for acquisition of subsidiary's interests from the non-controlling interests (3,746) (13,540)
Proceeds from disposal of subsidiary's interests to the non-controlling interests 6,813 6,649
Net (increase) decrease in treasury stock (6) (171,472)
Net cash provided by (used in) financing activities (85,483) (329,776)
Effect of exchange rate changes on cash and cash equivalents 12,137 (14,218)
Net increase (decrease) in cash and cash equivalents 58,161 41,260
Cash and cash equivalents at the beginning of the period 1,005,461 1,160,582
Cash and cash equivalents at the end of the period 1,063,622 1,201,842
11
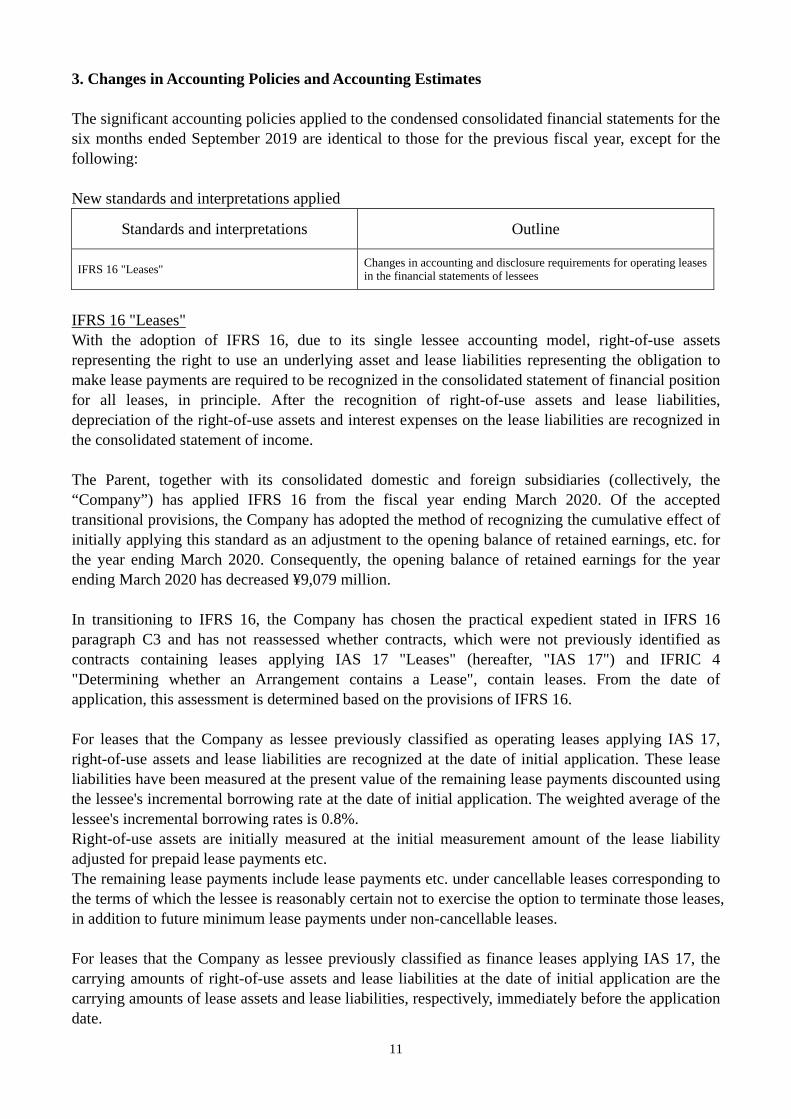
3. Changes in Accounting Policies and Accounting Estimates The significant accounting policies applied to the condensed consolidated financial statements for the six months ended September 2019 are identical to those for the previous fiscal year, except for the following: New standards and interpretations applied
Standards and interpretations Outline
IFRS 16 "Leases" Changes in accounting and disclosure requirements for operating leases in the financial statements of lessees
IFRS 16 "Leases" With the adoption of IFRS 16, due to its single lessee accounting model, right-of-use assets representing the right to use an underlying asset and lease liabilities representing the obligation to make lease payments are required to be recognized in the consolidated statement of financial position for all leases, in principle. After the recognition of right-of-use assets and lease liabilities, depreciation of the right-of-use assets and interest expenses on the lease liabilities are recognized in the consolidated statement of income. The Parent, together with its consolidated domestic and foreign subsidiaries (collectively, the “Company”) has applied IFRS 16 from the fiscal year ending March 2020. Of the accepted transitional provisions, the Company has adopted the method of recognizing the cumulative effect of initially applying this standard as an adjustment to the opening balance of retained earnings, etc. for the year ending March 2020. Consequently, the opening balance of retained earnings for the year ending March 2020 has decreased ¥9,079 million. In transitioning to IFRS 16, the Company has chosen the practical expedient stated in IFRS 16 paragraph C3 and has not reassessed whether contracts, which were not previously identified as contracts containing leases applying IAS 17 "Leases" (hereafter, "IAS 17") and IFRIC 4 "Determining whether an Arrangement contains a Lease", contain leases. From the date of application, this assessment is determined based on the provisions of IFRS 16. For leases that the Company as lessee previously classified as operating leases applying IAS 17, right-of-use assets and lease liabilities are recognized at the date of initial application. These lease liabilities have been measured at the present value of the remaining lease payments discounted using the lessee's incremental borrowing rate at the date of initial application. The weighted average of the lessee's incremental borrowing rates is 0.8%. Right-of-use assets are initially measured at the initial measurement amount of the lease liability adjusted for prepaid lease payments etc. The remaining lease payments include lease payments etc. under cancellable leases corresponding to the terms of which the lessee is reasonably certain not to exercise the option to terminate those leases, in addition to future minimum lease payments under non-cancellable leases. For leases that the Company as lessee previously classified as finance leases applying IAS 17, the carrying amounts of right-of-use assets and lease liabilities at the date of initial application are the carrying amounts of lease assets and lease liabilities, respectively, immediately before the application date.

12
The following is a reconciliation of the disclosed non-cancellable operating lease contracts applying IAS 17 as of March 31, 2019 and lease liabilities recognized in the consolidated statement of financial position at the date of initial application.
(Millions of yen)
Non-cancellable operating lease contracts as of March 31, 2019 351,557
Finance lease liabilities as of March 31, 2019 285,277
Cancellable operating lease contracts, etc. (*) 867,414
Lease liabilities as of April 1, 2019 1,504,248
(*) Includes the effect of discounting Non-cancellable operating lease contracts as of March 31, 2019 by the incremental borrowing rate at the date of initial application. Right-of-use assets recognized at the date of initial application in the consolidated statement of financial position was ¥1,434,275 million. The following practical expedients are used in the application of IFRS 16. (a) Leases for which the lease term ends within 12 months as of the date of initial application are accounted for in the same way as short-term leases. (b) Initial direct costs are excluded from the measurement of right-of-use assets at the date of initial application. (c) A lessee elects, by class of underlying asset, not to separate non-lease components from lease components, and instead account for each lease component and any associated non-lease components as a single lease component. (d) As an alternative to perform an impairment test, the Company relies on its assessment of whether leases are onerous applying IAS 37 "Provisions, Contingent Liabilities and Contingent Assets" immediately before the date of initial application. (e) The Company uses hindsight to calculate the lease term for lease contracts including options to extend or terminate the lease. Except standards and interpretations outlined above, the adoption of new standards and interpretations had no significant impact on the condensed consolidated financial statements for the six months ended September 2019. 4. Notes Concerning Going Concern Assumption None

November 6, 2019Mitsubishi Corporation
Copyright © 2019 Mitsubishi CorporationCopyright © 2019 Mitsubishi Corporation
Results for the Six Months Ended September 2019
November 6, 2019
Mitsubishi Corporation
(Forward-Looking Statements)- This release contains forward-looking statements about Mitsubishi Corporation’s future plans, strategies, beliefs and performance that are not historical facts. Such statements are based on the
company’s assumptions and beliefs in light of competitive, financial and economic data currently available and are subject to a number of risks, uncertainties and assumptions that, without limitation, relate to world economic conditions, exchange rates and commodity prices.
- Accordingly, Mitsubishi Corporation wishes to caution readers that actual results may differ materially from those projected in this release and that Mitsubishi Corporation bears no responsibility for any negative impact caused by the use of this release.
(Notes Regarding These Presentation Materials)- Consolidated net income in this presentation shows the amount of net income attributable to owners of the Parent, excluding non-controlling interests.
November 6, 2019Mitsubishi Corporation
Copyright © 2019 Mitsubishi Corporation
309.3242.440.6 (15.7)
(91.8)
Six monthsended Sep. 2018
Six monthsended Sep. 2019
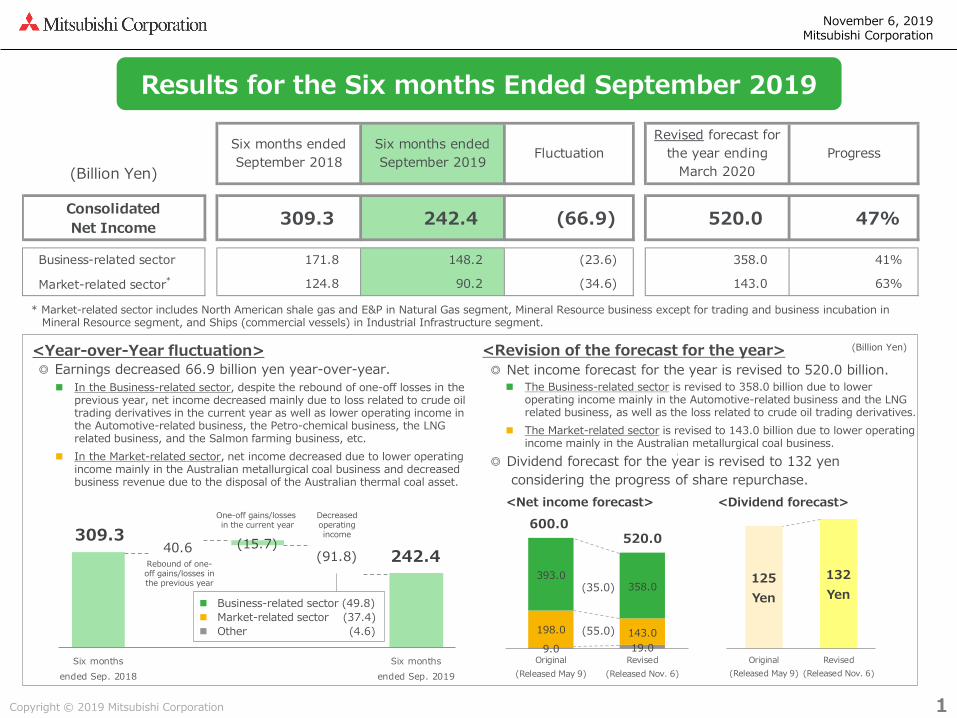
* Market-related sector includes North American shale gas and E&P in Natural Gas segment, Mineral Resource business except for trading and business incubation in Mineral Resource segment, and Ships (commercial vessels) in Industrial Infrastructure segment.
◎ Net income forecast for the year is revised to 520.0 billion. In the Business-related sector, despite the rebound of one-off losses in the
previous year, net income decreased mainly due to loss related to crude oil trading derivatives in the current year as well as lower operating income in the Automotive-related business, the Petro-chemical business, the LNG related business, and the Salmon farming business, etc.
In the Market-related sector, net income decreased due to lower operating income mainly in the Australian metallurgical coal business and decreased business revenue due to the disposal of the Australian thermal coal asset.
1
Business-related sector (49.8) Market-related sector (37.4) Other (4.6)
Results for the Six months Ended September 2019
(Billion Yen)
ConsolidatedNet Income 309.3 242.4 (66.9) 520.0 47%
Six months endedSeptember 2018
124.8Market-related sector*
Business-related sector 171.8
Revised forecast forthe year ending
March 2020FluctuationSix months ended
September 2019 Progress
90.2
148.2
63%143.0(34.6)
41%358.0(23.6)
<Year-over-Year fluctuation>◎ Earnings decreased 66.9 billion yen year-over-year.
<Revision of the forecast for the year>
Rebound of one-off gains/losses in the previous year
One-off gains/losses in the current year
Decreasedoperatingincome
(Billion Yen)
The Business-related sector is revised to 358.0 billion due to lower operating income mainly in the Automotive-related business and the LNG related business, as well as the loss related to crude oil trading derivatives.
The Market-related sector is revised to 143.0 billion due to lower operating income mainly in the Australian metallurgical coal business.
9.0 19.0198.0 143.0
393.0 358.0
600.0 520.0
Original(Released May 9)
Revised(Released Nov. 6)
◎ Dividend forecast for the year is revised to 132 yen considering the progress of share repurchase.
125 Yen
132 Yen
Original(Released May 9)
Revised(Released Nov. 6)
<Net income forecast> <Dividend forecast>
(35.0)
(55.0)

November 6, 2019Mitsubishi Corporation
Copyright © 2019 Mitsubishi Corporation
39.0
42.9
FY182Q
FY192Q
17.8
17.3
FY182Q
FY192Q
22.9
(22.1)
FY182Q
131.2
89.6
FY182Q
FY192Q
(32.6)
25.9
FY191Q
FY182Q
FY192Q
FY192Q
FY192Q
FY192Q
FY192Q
17.2
15.7
FY182Q
FY192Q
43.3
28.4
FY182Q
FY192Q
22.3
14.2
FY182Q
FY192Q
18.1
15.2
FY182Q
FY192Q
17.5
11.3
FY182Q
FY192Q
FY192Q
FY192Q
FY192Q
FY192Q
FY192Q
Year-over-Year Segment Net Income
■ Industrial Materials [YoY (3%)]ー
■ Natural Gas [YoY +10%]Rebound of one-off losses related to resource-related asset replacements in the previous year, etc.
■ Petroleum & ChemicalsLoss related to crude oil trading derivativesat the Singapore petroleum subsidiary as well as decrease in earnings in the Petro-chemical business, etc.
■ Mineral Resources [YoY (32%)] Decrease in business revenue due to increased production cost and decreased market price in the Australian metallurgical coal business, the disposal of the Australian thermal coal asset, as well as decreased dividend income in the Copper business, etc.
■ Industrial InfrastructureRebound of one-off losses related to Chiyoda Corporation in the previous year, etc.
Six months ended September 2018 (FY18 2Q): 309.3
Six months ended September 2019 (FY19 2Q): 242.4
■ Automotive & Mobility [YoY (34%)] Decreased earnings from equity method investees, etc.
■ Food Industry [YoY (36%)]Decreased earnings in the Salmon farming business, etc.
■ Consumer Industry [YoY (16%)] Decreased earnings in the Logistics business, etc.
■ Power Solution [YoY (35%)] Rebound of one-off gains related to the Overseas power business in the previous year, etc.
■ Urban Development [YoY (9%)] Rebound of sales gain of a fund management company stock in the previous year, etc.
Consolidated Net Income:
[+3.9]
[(6.2)]
[(45.0)]
[(41.6)]
[(14.9)]
[(8.1)]
[(2.9)]
[(1.5)]
[(0.5)]
[+58.5]
[YoY (66.9)]
2
(Billion Yen)
Copyright © 2019 Mitsubishi Corporation

November 6, 2019Mitsubishi Corporation
Copyright © 2019 Mitsubishi Corporation
286.5
479.5
(155.0)
360.1 356.3
25.1
+324.5
<Adjusted Free Cash Flows>+381.4
Cash Flows
3
*1
In order to present the source of funds for future investments and shareholder returns appropriately, “Adjusted Free Cash Flows” is introduced, which is free cash flows excluding changes in working capitals whilst including repayments of lease liabilities which are necessary in the ordinary course of business activities.
Six months ended September 2019
Six months ended September 2018
Investingcash flows
Operatingcash flows
Underlyingoperatingcash flows
(after repayments of lease liabilities)*2
New/SustainingInvestments
Sales andCollection
Net
356.3 (233.3) 258.4 25.1 381.4
・Chiyoda Corporation preferred stock (Industrial Infrastructure)・Australian metallurgical coal business (Mineral Resources)・Convenience store business (Consumer Industry)
・Australian thermal coal interest (Mineral Resources)・Overseas power business (Power Solution)・Listed stocks (Food Industry/Consumer Industry/Other)
Adjusted FreeCash Flows
Six months endedSep. 2019
Underlyingoperatingcash flows
(after repaymentsof lease liabilities)
Investing CF
New/Sustaining Investments Sales and Collection
(Billion Yen)[Breakdown of cash flows]
[Main items included in Investing CF for the six months ended September 2019]
*1 Due to adoption of IFRS16, repayments of lease liabilities for the six months ended September 2019 (130.6 Billion) are not included.
*2 Underlying operating cash flows (after repayments of lease liabilities) :Operating cash flows excluding changes in working capitals (=Net income (including non-controlling interests) – DD&A – profits and losses related to investing
activities – equity in earnings of affiliated companies not recovered through dividends– allowance for bad debt etc. – deferred tax)
whilst including repayments of lease liabilities
*3 In “New/Sustaining Investments”, a positive cash flow of 134.2 billion related to consolidation ofcash held by Chiyoda Corporation is included.
*3

November 6, 2019Mitsubishi Corporation
Copyright © 2019 Mitsubishi Corporation
86.0
73.0
Original(Rlsd. 5/9)
Revised
33.0
33.0
Original(Rlsd. 5/9)
Revised
30.0
(7.0)
Original(Rlsd. 5/9)
205.0
146.0
Original(Rlsd. 5/9)
Revised
23.0
37.0
Original(Rlsd. 5/9)
Revised
Revised
Revised
Revised
Revised
Revised
28.0
34.0
Original(Rlsd. 5/9)
Revised
88.0
69.0
Original(Rlsd. 5/9)
Revised
54.0
53.0
Original(Rlsd. 5/9)
Revised
19.0
25.0
Original(Rlsd. 5/9)
Revised
25.0
38.0
Original(Rlsd. 5/9)
Revised
Revised
Revised
Revised
Revised
Revised
Segment Forecasts for the Year Ending March 2020
■ Industrial Materialsー
■ Natural Gas [Revised (15%)]Decreased earnings in the LNG related business, etc.
■ Petroleum & ChemicalsLoss related to crude oil trading derivativesat the Singapore petroleum subsidiary as well as decrease in earnings in the Petro-chemical business, etc.
■ Mineral Resources [Revised (29%)] Decreased market price in the Australian metallurgical coal business, as well as decreased dividend income in the Copper business, etc.
■ Industrial Infrastructure [Revised +61%]
One-off gain related to consolidation of Chiyoda Corporation, etc.
Original forecast (Released May 9): 600.0
Revised forecast (Released November 6): 520.0
■ Automotive & Mobility [Revised (22%)] Decreased earnings from equity method investees, etc.
■ Food Industry [Revised (2%)]Despite disposal gain due to asset replacements is prospected, decreased earnings in the Salmon farming business, etc.
■ Consumer Industry [Revised +32%] Disposal gain due to asset replacements, etc.
■ Power Solution [Revised +52%] Disposal gain due to sales of overseas power assets, etc.
■ Urban Development [Revised +21%] Disposal gain due to asset replacements and increase of fund evaluation profit, etc.
Consolidated Net Income:
[(13.0)]
[+13.0]
[(37.0)]
[(59.0)]
[(19.0)]
[(1.0)]
[+6.0]
[+6.0]
[ー]
[+14.0]
[Revised (80.0)]
4
(Billion Yen)
Copyright © 2019 Mitsubishi Corporation

November 6, 2019Mitsubishi Corporation
Copyright © 2019 Mitsubishi Corporation
[Foreign Exchange, Commodity Prices and Interest Rates]
(Reference) Market Conditions
5
Forecast for theyear endingMarch 2020
(Released May 9)
Forecast for theyear ending
March 2020*(Revised Nov. 6)
VarianceSix months
ended September
2019
Consolidated Net Income Sensitivitiesfor the year ending March 2020
ForeignExchange(YEN/US$)
110.00 106.80 (3.20) 108.60 Depreciation/appreciation of 1 yen per US$1 has a 3.0 billion yen positive/negative impact on a full-year earnings.
Crude Oil Price (Dubai)
(US$/BBL)65 65 ±0 65
A US$1 rise/decline per barrel increases/reduces full-yearearnings by 2.5 billion Yen.To better account for the differences in fiscal year-ends ofconsolidated companies and the timing when crude oil price isactually reflected in LNG sales price, the average price for thepreceding 6 month period (e.g. For the year ending March:average price from Oct. to Sep.) is utilized.In addition to changes in crude oil price, other factors couldalso affect crude oil-related earnings, such as dividend policy,foreign currency movements, and production/sales volume.Therefore, the impact on earnings cannot be determined bythe crude oil price alone.
Copper Price(US$/MT) 6,504 5,842 (662) 5,952
A US$100 rise/decline per MT increases/reduces full-year earnings by 1.4 billion yen (A US¢10 rise/decline per lb increases/reduces full-year earnings by 3.2 billion yen). In addition to changes in copper price, other variables affect earnings from copper mines, such as the grade of mined ore, the status of production operations, and reinvestment plans (capital expenditure). Therefore, the impact on earnings cannot be determined by the copper price alone.
YEN InterestTIBOR 3M (%) 0.10 0.09 (0.01) 0.07
The effect of rising interest rates is mostly offset by an increase in operating and investment profits. However, a rapid rise in interest rates could have a temporary negative effect.
US$ InterestLIBOR 3M (%) 2.60 2.48 (0.12) 2.35
[US¢/lb ][ 295 ] [ 265 ] [ (30) ] [ 270 ]
(2nd Half:[ 260 ])
(2nd Half:105.00)
* The annual average are shown for the forecast for the year.


