23
IR Financial Results for Third Quarter of FY2021 (From April 1, 2020 to December 31, 2020) January 27, 2021 Hino Motors, Ltd.

IR
Financial Results for
Third Quarter of FY2021(From April 1, 2020 to December 31, 2020)
January 27, 2021
Hino Motors, Ltd.

2/22IR
1) Sales Turnover
2) Consolidated Income Statements
3) FY2021 Sales Forecast
4) FY2021 Consolidated Financial Forecast
3/22IR
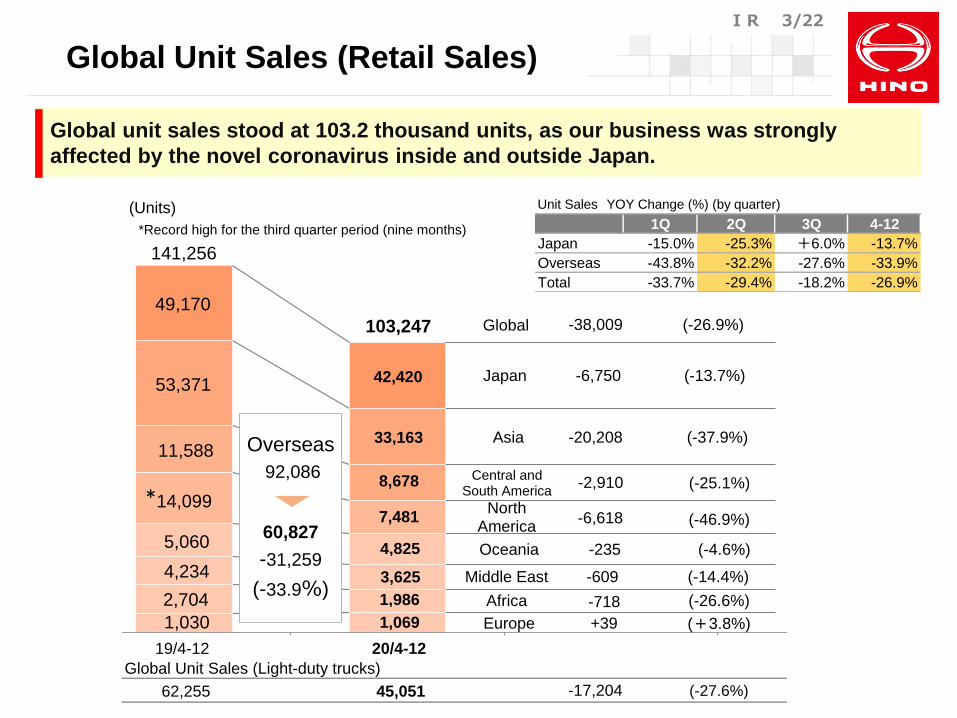
Global unit sales stood at 103.2 thousand units, as our business was strongly
affected by the novel coronavirus inside and outside Japan.
Global Unit Sales (Light-duty trucks)
1,030
42,420
49,170
1,069
53,371
14,099
11,588
5,060
4,234
2,704
33,163
7,481
8,678
4,825
3,625
1,986
141,256
103,247
Japan -6,750
Asia
North America
Central and South America
Oceania
Middle East
Africa
Europe
-20,208
-6,618
-2,910
-235
-609
-718
+39
-38,009Global
(-13.7%)
(-37.9%)
(-46.9%)
(-25.1%)
(-4.6%)
(-14.4%)
(-26.6%)
(+3.8%)
(-26.9%)
Overseas
92,086
60,827
-31,259
(-33.9%)
19/4-12 20/4-12
*
*Record high for the third quarter period (nine months)
*
62,255 45,051 -17,204 (-27.6%)
(Units)
Global Unit Sales (Retail Sales)
Unit Sales YOY Change (%) (by quarter)
1Q 2Q 3Q 4-12
Japan -15.0% -25.3% +6.0% -13.7%
Overseas -43.8% -32.2% -27.6% -33.9%
Total -33.7% -29.4% -18.2% -26.9%

4/22IR
-2,715
-6,750
-3,190
-845
49,170
26,726
2,030
20,414
24,011
42,420
17,224
1,185
Heavy-and
medium-duty
Light-duty
Bus
〔39.5%〕
〔31.6%〕
〔26.4%〕
〔38.6%〕
〔28.2%〕
〔31.7%〕
(-10.2%)
(-13.7%)
(-15.6%)
(-41.6%)
〔32.5%〕
〔33.4%〕Total
19/4-12 20/4-12
The number in 〔 〕 represents the share
The number in ( ) represents year-on-year increase/decrease rate
〔share +0.9P〕
〔share -0.9P〕
〔share +1.8P〕
〔share +0.1P〕
(Units)Hino's sales (Retail)
[Share]
151,402
67,715
6,423
77,264
62,269
126,991
3,739
Heavy-and
medium-duty
Light-duty
Bus
-5,446
-16,281
-2,684
-24,411
(-8.0%)
(-21.1%)
(-41.8%)
(-16.1%)Total
19/4-12 20/4-12
60,983
(Units)Total demand
Truck and Bus Market in Japan
Total demand YOY Change (%) (by quarter)
1Q 2Q 3Q 4-12
-22.2% -26.5% +7.5% -16.1%
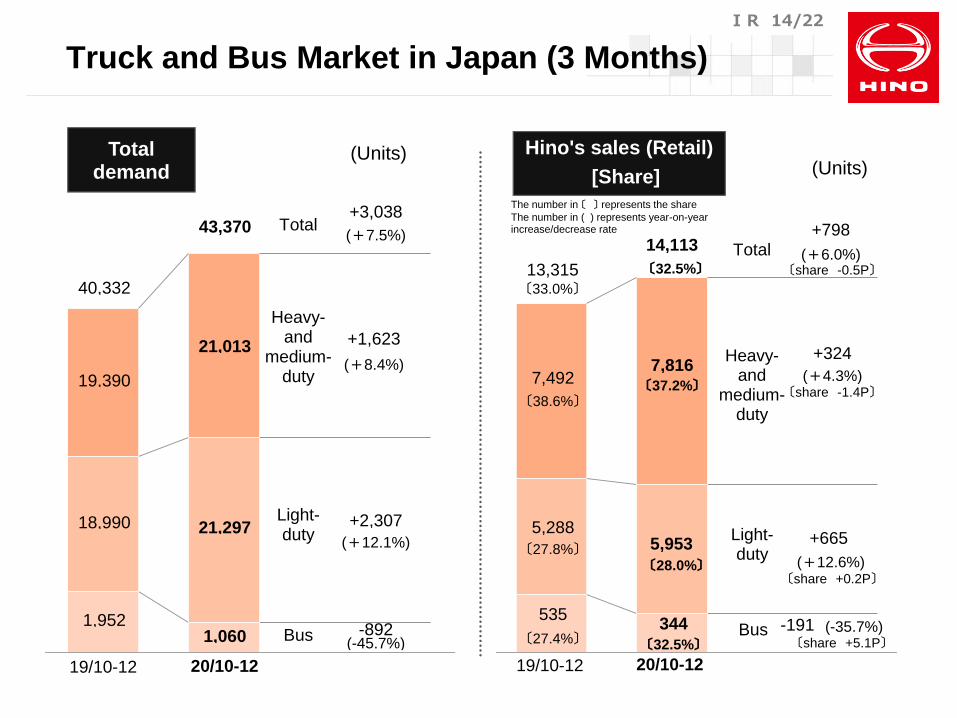
Total demand: Declined from the previous year due to the novel coronavirus.
Especially, the sales of light-duty trucks and buses were affected.
Hino’s sales: While demand declined, sales were healthy.
Hino's sales YOY Change (%) (by quarter)
1Q 2Q 3Q 4-12
-15.0% -25.3% +6.0% -13.7%

5/22IR
12,221
3,581-8,640
(-70.7%)
23,039
8,156-14,883
(-64.6%)
10,818
-6,243
(-57.7%)
Total
Heavy- and medium-
duty
Light-duty4,575
19/4-12 20/4-12
8,286
4,666-3,620
(-43.7%)
3,2791,585 -1,694
(-51.7%)
11,565
6,251-5,314
(-45.9%)
Heavy- and medium-
duty(Class 6.7)
Light-duty(Class 4.5)
Total
19/4-12 20/4-12
9,5038,231
7,7616,463
1,742 1,768
-1,298
(-16.7%)
+26(+1.5%)
-1,272
(-13.4%)
Heavy-and
medium-duty
Light-duty
Total
19/4-12 20/4-12
(Units)(Units)(Units) The U.S. ThailandIndonesia
Sales Volumes in Indonesia, the U.S. and Thailand (Retail Sales)
Indonesia YOY Change (%) (by quarter)
1Q 2Q 3Q 4-12Heavy- and medium-duty -78.6% -73.2% -62.9% -70.7%
Light-duty -67.0% -63.5% -48.0% -57.7%
Total -73.2% -69.0% -55.4% -64.6%
The U.S. YOY Change (%) (by quarter)
1Q 2Q 3Q 4-12Heavy- and medium-duty -41.3% -35.2% -52.7% -43.7%
Light-duty -45.0% -59.2% -50.3% -51.7%
Total -42.4% -42.2% -52.0% -45.9%
Thailand YOY Change (%) (by quarter)
1Q 2Q 3Q 4-12Heavy- and medium-duty -30.8% -17.9% -3.4% -16.7%
Light-duty -32.9% +12.2% +31.9% +1.5%
Total -31.2% -12.2% +2.1% -13.4%
Indonesia: The market environment remained harsh. Sales volume is improving, but recovery is
gentle.
The U.S.: Sales volume dropped considerably, due to the problems with supply as well as the novel
coronavirus.
Thailand: The market for light-duty trucks grew first, thanks to the expansion of e-commerce. Sales
volume in 3Q recovered, exceeding that in the previous year.
6/22IR
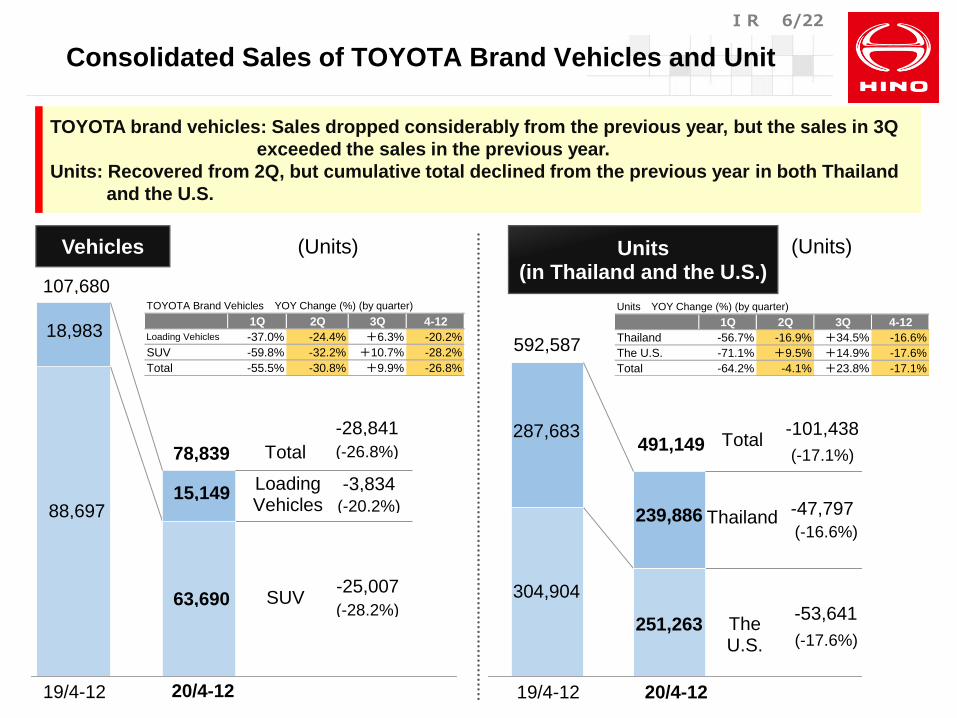
304,904
251,263-53,641
(-17.6%)
Total
Thailand
The U.S.
239,886
287,683
592,587
491,149
-47,797
(-16.6%)
-101,438
(-17.1%)
19/4-12 20/4-12
(Units)Units(in Thailand and the U.S.)
18,983
88,697
107,680
78,839
15,149
63,690
Total
Loading Vehicles
SUV
-28,841
-3,834
-25,007
(-26.8%)
(-20.2%)
(-28.2%)
19/4-12 20/4-12
(Units)Vehicles
Consolidated Sales of TOYOTA Brand Vehicles and Unit
TOYOTA brand vehicles: Sales dropped considerably from the previous year, but the sales in 3Q
exceeded the sales in the previous year.
Units: Recovered from 2Q, but cumulative total declined from the previous year in both Thailand
and the U.S.
TOYOTA Brand Vehicles YOY Change (%) (by quarter)
1Q 2Q 3Q 4-12
Loading Vehicles -37.0% -24.4% +6.3% -20.2%
SUV -59.8% -32.2% +10.7% -28.2%
Total -55.5% -30.8% +9.9% -26.8%
Units YOY Change (%) (by quarter)
1Q 2Q 3Q 4-12
Thailand -56.7% -16.9% +34.5% -16.6%
The U.S. -71.1% +9.5% +14.9% -17.6%
Total -64.2% -4.1% +23.8% -17.1%

7/22IR
1) Sales Turnover
2) Consolidated Income Statements
3) FY2021 Sales Forecast
4) FY2021 Consolidated Financial Forecast

8/22IR
Consolidated Income Statements
(Billions of yen)
Item Change
Net sales 1,074.5 1,374.3 -299.8
<-3.6p>
Operating income -1.0 48.2 -49.2
<-3.5p>
Ordinary income -1.7 45.0 -46.7
Profit attributable <-2.4p>
to owners of parent -2.2 29.9 -32.1Note: Figures in parentheses (<>) indicate income margin.
-
FY2021 3Q
('20/4-12)
<-0.2%>
<-0.1%>
Change (%)FY2020 3Q
('19/4-12)
-21.8%
<2.2%>
<3.5%>
<3.3%>
<-0.2%>
-
-
■ Exchange rate
20/4-12 19/4-12
US$ 106 109
THB 3.37 3.51
IDR (100) 0.70 0.77
A$ 73 76
■ Consolidated unit sales (Units)
20/4-12 19/4-12 Change
Japan 43,209 49,227 -6,018
Overseas 50,205 85,884 -35,679
TOYOTA brand 78,839 107,680 -28,841
■ Exchange rate
20/4-12 19/4-12 Plan
US$ 106 109 110
THB 3.37 3.51 3.35
IDR (100) 0.70 0.77 0.75
A$ 73 76 78

9/22IR
0
Non-operating
Income taxes
Profit for non-
controlling
interests, etc
Foreign exchange -2.3
Materials -1.1
Net income -32.1 (29.9 → -2.2)
Operating income -49.2 (48.2 → -1.0)
Analysis of Consolidated Income Statements
(Billions of yen)
Decrease in tax expenses +11.7
Profit for non-controlling interests +1.9
etc.
Profit decreased considerably due to the decline in sales, but operating income in 3Q was 10.7
billion yen in the black, thanks to the curtailment of fixed costs and the reduction of cost of sales.
Cumulative profit recovered to negative 1 billion yen.
10/22IR
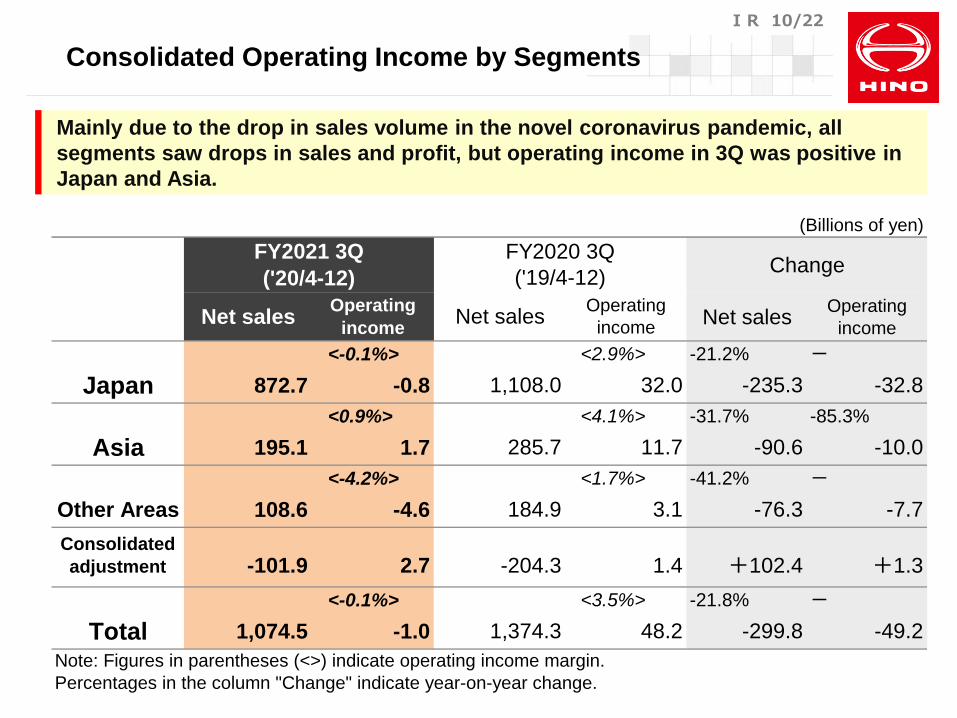
Consolidated Operating Income by Segments
Mainly due to the drop in sales volume in the novel coronavirus pandemic, all
segments saw drops in sales and profit, but operating income in 3Q was positive in
Japan and Asia.
(Billions of yen)
Change 20/4-12
Net salesOperating
income
<-0.1%> <2.9%> -21.2% -
Japan 872.7 -0.8 1,108.0 32.0 -235.3 -32.8
<0.9%> <4.1%> -31.7% -85.3%
Asia 195.1 1.7 285.7 11.7 -90.6 -10.0
<-4.2%> <1.7%> -41.2% -
Other Areas 108.6 -4.6 184.9 3.1 -76.3 -7.7
Consolidated
adjustment -101.9 2.7 -204.3 1.4 +102.4 +1.3
<-0.1%> <3.5%> -21.8% -
Total 1,074.5 -1.0 1,374.3 48.2 -299.8 -49.2
Operating
incomeNet sales
FY2021 3Q
('20/4-12)
FY2020 3Q
('19/4-12)
Note: Figures in parentheses (<>) indicate operating income margin.
Percentages in the column "Change" indicate year-on-year change.
Net salesOperating
income

11/22IR
Trends in the Quarterly Consolidated Sales and Operating Income
Exchange rate FY2020 FY2021 FY2020 FY2021 FY2020 FY2021 FY2020 FY2021
US$ 111 109 107 106 109 105 110
13.619.2
15.4
6.7
-10.6-1.1
10.7
446.2
499.9
428.2 441.3
300.4
365.9408.2
1Q 2Q 3Q 4Q
(Billions of yen)
Operating Income
Sales
FY2020
FY2021
(3.0%)(3.8%)
(3.6%)(1.5%)
(-3.5%)
(-0.3%)(2.6%)
Previous FY
Current FY
Figures in parentheses indicate operating income margin.
12/22IR
完
【For Reference】FY2021 Third-Quarter Results
(3 Months)

13/22IR
完
Global Unit Sales (Retail Sales) (3 Months)
Global Unit Sales (Light-duty trucks)
394
14,113
13,315
431
20,591
5,090
4,009
1,673
1,452
901
14,420
2,415
3,656
1,631
1,342
803
47,425
38,811
Japan +798
Asia
North America
Central and South America
Oceania
Middle EastAfrica
Europe
-6,171
-2,675
-353
-42
-110-98+37
-8,614Global
(+6.0%)
(-30.0%)
(-52.6%)
(-8.8%)
(-2.5%)
(-7.6%)
(-10.9%)(+9.4%)
(-18.2%)
Overseas
34,110
24,698
-9,412
(-27.6%)
19/10-12 20/10-12
20,671 17,487 -3,184 (-15.4%)
*第3四半期(3ヶ月)として過去最高
(Units)
14/22IR
完
Truck and Bus Market in Japan (3 Months)
40,332
19,390
1,952
18,990
21,013
43,370
21,297
1,060
Heavy-and
medium-duty
Light-duty
Bus
+1,623
+2,307
-892
+3,038
(+8.4%)
(+12.1%)
(-45.7%)
(+7.5%)Total
19/10-12 20/10-12
Total demand
(Units)
+324
+798
+665
-191
13,315
7,492
535
5,288
7,816
14,113
5,953
344
Heavy-and
medium-duty
Light-duty
Bus
〔38.6%〕
〔27.4%〕
〔27.8%〕
〔37.2%〕
〔28.0%〕
〔32.5%〕
(+4.3%)
(+6.0%)
(+12.6%)
(-35.7%)
〔33.0%〕
〔32.5%〕
Total
19/10-12 20/10-12
The number in 〔 〕 represents the share
The number in ( ) represents year-on-year increase/decrease rate
〔share -0.5P〕
〔share -1.4P〕
〔share +0.2P〕
〔share +5.1P〕
Hino's sales (Retail)
[Share] (Units)

15/22IR
4,566
1,692-2,874
(-62.9%)
9,210
4,105-5,105
(-55.4%)
4,644
-2,231
(-48.0%)
Total
Heavy- and medium-
duty
Light-duty2,413
19/10-12 20/10-12
3,167
1,499-1,668
(-52.7%)
1,163
578-585
(-50.3%)
4,330
2,077-2,253
(-52.0%)
Heavy- and medium-
duty(Class 6.7)
Total
19/10-12 20/10-12
3,3113,380
2,797 2,702
514678
-95(-3.4%)
+164(+31.9%)
+69
(+2.1%)
Heavy-and
medium-duty
Light-duty
Total
19/10-12 20/10-12
Light-duty(Class 4.5)
The U.S. ThailandIndonesia (Units)(Units)(Units)
Sales Volumes in Indonesia, the U.S. and Thailand (Retail Sales)
(3 Months)

16/22IR
96,002110,262
+14,260
(+14.9%)
Total
Thailand
The U.S.
107,453
79,866
175,868
217,715
+27,587
(+34.5%)
+41,847
(+23.8%)
19/10-12 20/10-12
(Units)Units
(in Thailand and the U.S.)
5,466
27,756
33,222
36,524
5,809
30,715
Total
Loading Vehicles
SUV
+3,302
+343
+2,959
(+9.9%)
(+6.3%)
(+10.7%)
19/10-12 20/10-12
(Units)Vehicles
完
Consolidated Sales of TOYOTA Brand Vehicles and Unit
(3 Months)
17/22IR
完
<注>下期実行計画つけた
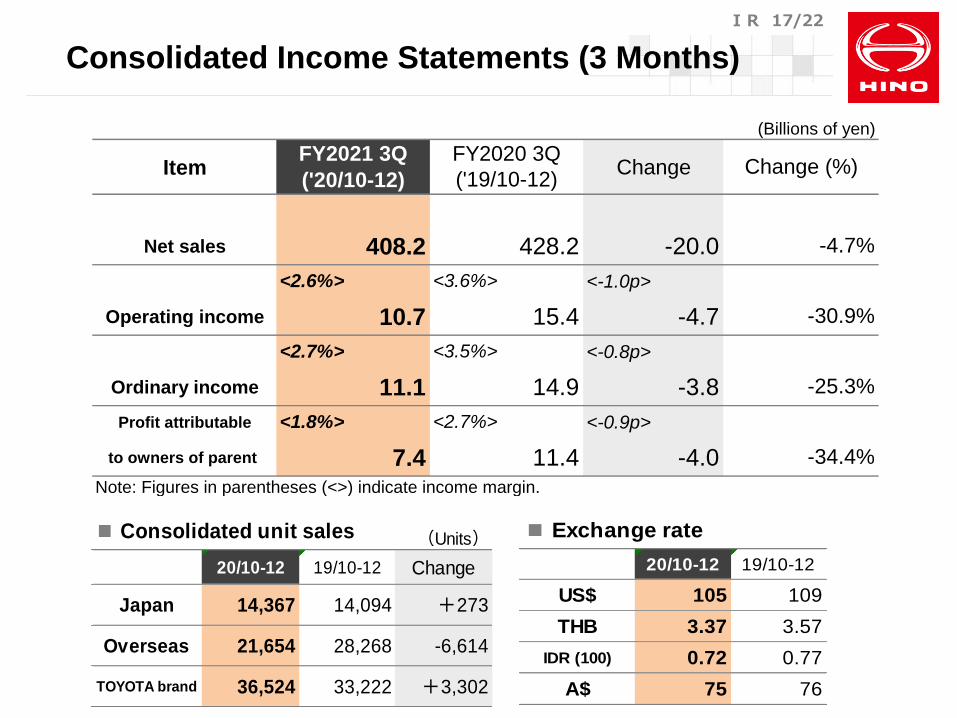
Consolidated Income Statements (3 Months)
(Billions of yen)
Item Change
Net sales 408.2 428.2 -20.0
<-1.0p>
Operating income 10.7 15.4 -4.7
<-0.8p>
Ordinary income 11.1 14.9 -3.8
Profit attributable <-0.9p>
to owners of parent 7.4 11.4 -4.0
FY2021 3Q
('20/10-12)
FY2020 3Q
('19/10-12)Change (%)
-25.3%
<1.8%> <2.7%>
-34.4%
-4.7%
<2.6%> <3.6%>
-30.9%
<2.7%> <3.5%>
Note: Figures in parentheses (<>) indicate income margin.
■ Exchange rate
20/10-12 19/10-12
US$ 105 109
THB 3.37 3.57
IDR (100) 0.72 0.77
A$ 75 76
■ Consolidated unit sales (Units)
20/10-12 19/10-12 Change
Japan 14,367 14,094 +273
Overseas 21,654 28,268 -6,614
TOYOTA brand 36,524 33,222 +3,302

18/22IR
Non-operating
Income taxes
Profit for non-
controlling
interests, etc
Net income -4.0 (11.4 → 7.4)
Operating income -4.7 (15.4 → 10.7)
Increase in gain on sale of
investment securities +0.7
etc.
Analysis of Consolidated Income Statements (3 Months)
Foreign exchange -1.0
Materials -0.3
(Billions of yen)

19/22IR
1) Sales Turnover
2) Consolidated Income Statements
3) FY2021 Sales Forecast
4) FY2021 Consolidated Financial Forecast

20/22IR
Global Unit Sales (Retail Sales)
(Thousand units)
FY2021
('20/4-'21/3)
Forecasts
announced on
January 27
FY2021
('20/4-'21/3)
Forecasts
announced on
October 29
Change Change (%)FY2020
('19/4-'20/3)
Results
Change Change (%)
Japan 59.0 59.0 - - 66.8 -7.8 -11.7%
Overseas 83.5 83.5 - - 113.5 -30.0 -26.4%
Total 142.5 142.5 - - 180.3 -37.8 -21.0%
TOYOTA
brand
(*)
109.7 109.7 - - 139.3 -29.6 -21.3%
*Including Dyna for Indonesia.
The assumed number of unit sales is unchanged from that announced on October 29.

21/22IR
1) Sales Turnover
2) Consolidated Income Statements
3) FY2021 Sales Forecast
4) FY2021 Consolidated Financial Forecast

22/22IR
Consolidated Income Statements
(Billions of yen)
Item
FY2021
('20/4-'21/3)
Forecasts
announced on
January 27
FY2021
('20/4-'21/3)
Forecasts
announced on
October 29
Change Change (%)FY2020
('19/4-'20/3)
Results
Change Change (%)
Net sales 1,430.0 1,430.0 - - 1,815.6 -385.6 -21.2%
<0.2%> <0.2%> - <3.0%> <-2.8p>
Operating income 3.0 3.0 - - 54.9 -51.9 -94.5%
<-0.1%> <-0.1%> - <2.7%> <-2.8p>
Ordinary income -2.0 -2.0 - - 49.6 -51.6 -
Profit attributable <-0.8%> <-0.2%> <-0.6p> <1.7%> <-2.5p>
to owners of parent -12.0 -3.0 -9.0 - 31.5 -43.5 -
Note: Figures in parentheses (<>) indicate income margin.
■Exchange rate
Announced on
January 27
Announced on
October 29
FY2020
('19/4-'20/3)
Results
US$ 106 106 109
THB 3.41 3.41 3.52
IDR (100) 0.75 0.75 0.77
A$ 72 72 75
The cost related to the discontinuation of manufacturing at North American factories
amounting to about 14 billion yen was reflected in extraordinary loss, so net income
has been revised downwardly to negative 12 billion yen.