36
Financial Results Meeting: FY Ended March 2012 (April 1, 2011 - March 31, 2012) Financial Results Meeting: FY Ended March 2012 (April 1, 2011 - March 31, 2012) May 10, 2012 May 10, 2012

Financial Results Meeting:FY Ended March 2012
(April 1, 2011 - March 31, 2012)
Financial Results Meeting:FY Ended March 2012
(April 1, 2011 - March 31, 2012)
May 10, 2012May 10, 2012

1
28 KWE Group’s Worldwide Five Regional Management System29 Non-consolidated Balance Sheets30 Freight Volume by Region (Air Freight)31 Freight Volume by Region (Sea Freight)32 Air Freight Export Volume by Destination33 Items Handled – (1) (Non-consolidated: Air Freight)34 Items Handled – (2) (Non-consolidated: Sea Freight)
Summary of Business Results for FY ended March 31, 2012, and Forecast for FY Ending March 2013
Review of the 2nd Year of the Medium-Term Management Plan ‘Ready for the Next!’ and Business Expansion Strategies
02 Financial Summary 03 Highlights for FY ended March 31, 201204 Year over Year Comparisons of Consolidated Net Sales,
Cost of Sales, and SGA Expenses05 Freight Cost Ratio for Air Freight Exports Revenue06 Consolidated Balance Sheets (1)07 Consolidated Balance Sheets (2)08 Consolidated Cash Flow Statements09 Consolidated Net Sales by Service Type 10 Consolidated Net Sales and Operating Income by Region11 Operating Margins by Region12 Highlights by Region13 Consolidated Operating Results by Quarter14 Consolidated Earnings Forecast for FY Ending March 2013 15 Consolidated Net Sales Forecast by Service Type & Region
for FY Ending March 2013
17 Outline of “Ready for the Next!” (1)18 Outline of “Ready for the Next!” (2) 19 Review of the 2nd year of “Ready for the Next!” (1)20 Review of the 2nd year of “Ready for the Next!” (2)21 Major Policies for FY Ending March 2013 ①22 Major Policies for FY Ending March 2013 ②23 Promote a Growth Strategy in Emerging Markets (1) 24 Promote a Growth Strategy in Emerging Markets (2) 25 Promote a Growth Strategy in Emerging Markets (3) 26 Dividends
ContentsContents
Supplemental Materials

2
Financial SummaryFinancial Summary
FY ended March 2011 ¥87.81
2nd half of the FY ended March 2012 ¥82.04
FY ended March 2012 ¥79.84
Shipments (thousands) Weight (1,000 tons) Volume (1,000 TEU) Amount (¥million)
(Yen-Dollar Conversion Rate)
Indicator FY ended March 2011 FY ended March 2012
EPS ¥218.92 ¥265.16
BPS ¥1,925.90 ¥2,113.67
ROE 11.7% 13.1%
FY ended March 31
Item 2011 2012Yrover Yr(%) Yrover Yr(%)
Weight (Air freight export) 497 31.8 473 △ 4.8Shipments (Air freight import) 1,325 11.1 1,300 △ 1.9Volume (Ocean export) 278 12.2 290 4.5Shipments (Ocean import) 217 16.6 220 1.2
Net salesConsolidated 267,688 26.4 264,403 △ 1.2
Non-consolidated 92,719 21.9 90,677 △ 2.2
Gross profitConsolidated 40,842 13.1 43,484 6.5
Non-consolidated 16,641 3.9 18,080 8.6Operating income
Consolidated 11,898 59.7 13,824 16.2Non-consolidated 2,002 35.3 3,232 61.4
Ordinary income
Consolidated 12,831 59.7 14,847 15.7Non-consolidated 4,659 11.5 5,497 18.0
Income before income taxes and minority interests
Consolidated 12,676 66.9 14,954 18.0Non-consolidated 4,332 19.2 5,859 35.2
Net incomeConsolidated 7,880 72.4 9,545 21.1
Non-consolidated 2,554 △ 18.2 4,019 57.4
FY ended March 2012 Forecast(※Forecast at 2011/11/8 2Q)
――――
272,000―――
13,300―
14,000―――
9,200―

3
HighlightsFY Ended March 31, 2012
HighlightsFY Ended March 31, 2012
1
2
In spite of the domestic downturn in freight volume, KWE Japan exceeded targets due to an improved operating cost ratio
・Operating margin in KWE Japan rose to 3.6% from 2.2% a year earlier. ・While air freight volumes fell due to a decline in global demand for electronic
products (e.g., flat screen TVs, PCs), the operating cost ratio fell due to spot rate acquisitions as we continued to rein in fixed and variable costs.
Overseas profits fared well with large contributions from East Asia in particular
・Average operating margin in the combined overseas regions rose to 5.9% from 5.5% a year earlier.
・While freight volumes trended downward, particularly in Asia, the operating cost ratio fell, primarily in East Asia. In Europe, results for German subsidiary were depressed.
・ Domestic subsidiaries were similar to the previous year.

4
(Millions of yen, %)
FY ended March 31
2011 Ratio to net sales 2012 Ratio to net sales
Net sales 267,688 100.0% 264,403 100.0%
Cost of sales 226,846 84.8% 220,918 83.6%
SGA expenses 28,943 10.8% 29,659 11.2%
Operating income 11,898 4.4% 13,824 5.2%
(Millions of yen)267,688 264,403
226,846 220,918
28,943 29,659
050,000
100,000150,000200,000250,000300,000
FY ended March 2011 FY ended March 2012
Net sales
Cost of sales
SGA expenses
Year over Year Comparisons of Consolidated Net Sales, Cost of Sales, and SGA Expenses
Year over Year Comparisons of Consolidated Net Sales, Cost of Sales, and SGA Expenses

5
Freight Cost Ratio for Air Freight Exports RevenueFreight Cost Ratio for Air Freight Exports Revenue
FY ended March 31, 2011
Six months ended September 30, 2011
FY ended March 31, 2012
KWE Japan 70.1% 69.2% 66.9%
The Americas 62.1% 64.7% 66.7%
Europe, Middle East & Africa 68.4% 68.2% 68.3%
East Asia & Oceania 72.8% 64.4% 62.1%
Southeast Asia 77.3% 76.7% 75.0%
Group as a whole 70.5% 68.0% 66.5%
The fuel surcharges remained high, but figures improved as freight demand leveled off, primarily in Japan, East Asia & Oceania.
6
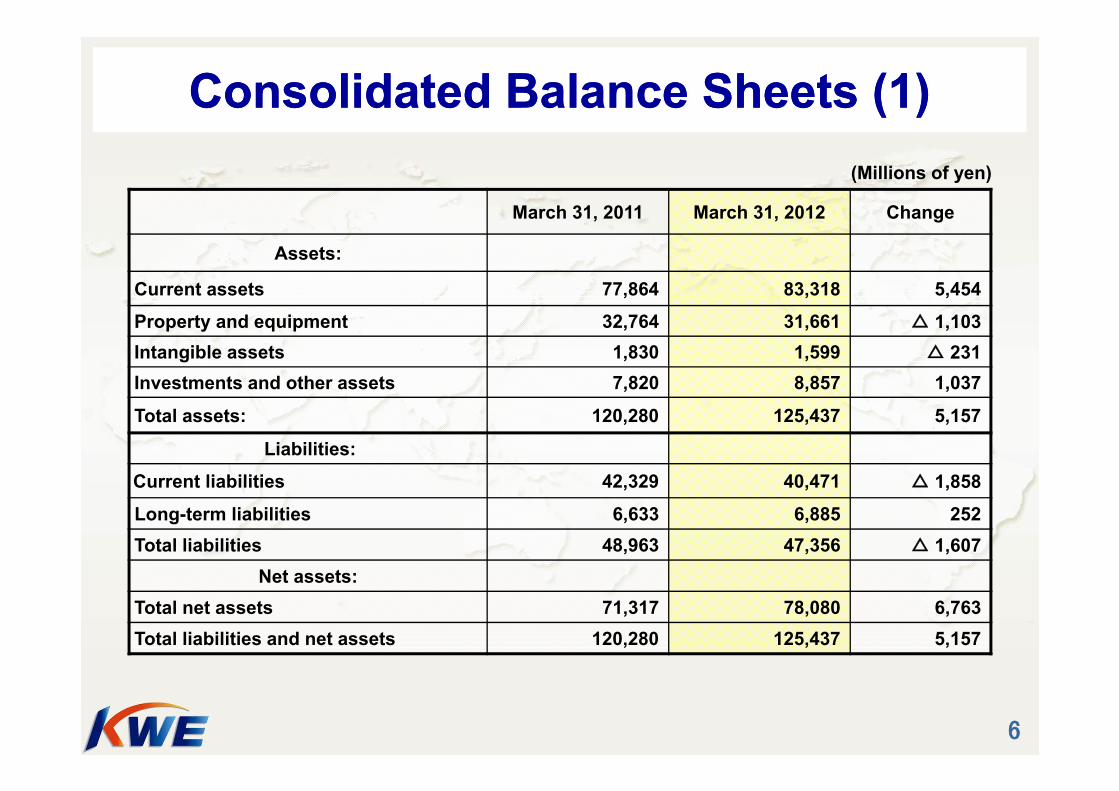
Consolidated Balance Sheets (1)Consolidated Balance Sheets (1)(Millions of yen)
March 31, 2011 March 31, 2012 Change
Assets:
Current assets 77,864 83,318 5,454
Property and equipment 32,764 31,661 △ 1,103Intangible assets 1,830 1,599 △ 231Investments and other assets 7,820 8,857 1,037
Total assets: 120,280 125,437 5,157
Liabilities:
Current liabilities 42,329 40,471 △ 1,858
Long-term liabilities 6,633 6,885 252Total liabilities 48,963 47,356 △ 1,607
Net assets:Total net assets 71,317 78,080 6,763Total liabilities and net assets 120,280 125,437 5,157
7
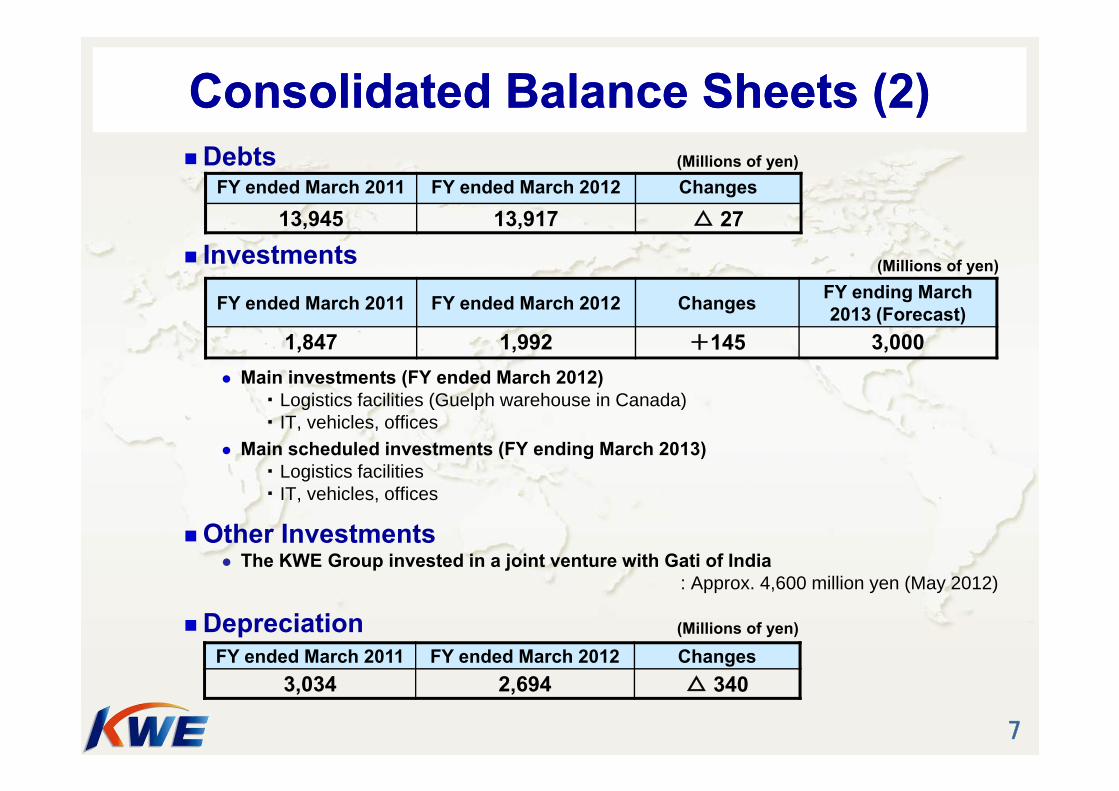
Consolidated Balance Sheets (2)Consolidated Balance Sheets (2)Debts
Investments
Main investments (FY ended March 2012)・ Logistics facilities (Guelph warehouse in Canada)・ IT, vehicles, offices
Main scheduled investments (FY ending March 2013)・ Logistics facilities ・ IT, vehicles, offices
Other Investments The KWE Group invested in a joint venture with Gati of India
: Approx. 4,600 million yen (May 2012)
Depreciation
FY ended March 2011 FY ended March 2012 Changes
13,945 13,917 △ 27
FY ended March 2011 FY ended March 2012 Changes FY ending March 2013 (Forecast)
1,847 1,992 +145 3,000
FY ended March 2011 FY ended March 2012 Changes3,034 2,694 △ 340
(Millions of yen)
(Millions of yen)
(Millions of yen)

8
(Millions of yen)
FY endedMarch 31, 2011 March 31, 2012 Change
Cash flows from operating activities 9,843 11,118 1,275
Cash flows from investing activities 779 △ 3,820 △ 4,599
Cash flows from financing activities △ 2,703 △ 1,396 1,307
Effect of exchange rate changes on cash and cash equivalents
△ 1,998 △ 770 1,228
Net increase in cash and cash equivalents 5,920 5,130 △ 790
Cash and cash equivalents at beginning of year
25,045 30,966 5,921
Cash and cash equivalents at end of year 30,966 36,096 5,130
Consolidated Cash Flow StatementsConsolidated Cash Flow Statements

9
49.5%
19.5%
19.2%
11.8%
49.1%
21.6%
19.4%
9.9%
Consolidated Net Sales by Service TypeConsolidated Net Sales by Service Type
2012
FY ended March 31
Service Type 2011 2012Net sales Yr over Yr Net sales Yr over Yr
Forwarding 132,467 41.4 % 129,808 △ 2.0 %Logistics 52,234 16.6 % 57,156 9.4 %Ocean 51,285 19.3 % 51,241 △ 0.1 %Other 31,700 4.5 % 26,196 △ 17.4 %
Total 267,688 26.4 % 264,403 △ 1.2 %
Forwarding
Logistics
Ocean
Other
2011
Frei
ght
tran
spor
tatio
n
(Millions of yen, %)
FY ended March 31Composition by Service Type

10
9.9%
27.2%
0.7%9.4%
12.0%
40.8%
8.8%
28.3%
0.7%9.1%
12.0%
41.1%
Consolidated Net Sales and Operating Income by Region
Consolidated Net Sales and Operating Income by Region
FY ended March 31
Region 2011 2012Net sales Operating income Net sales Operating income
Japan 112,725 2,918 110,628 4,159The Americas 32,855 2,327 32,587 2,127Europe, Middle East & Africa 24,085 679 26,841 541East Asia & Oceania 77,606 4,212 73,715 5,359Southeast Asia 25,078 1,522 25,482 1,408Other 1,976 296 1,787 314Adjustment △ 6,640 △ 56 △ 6,641 △ 85
Total 267,688 11,898 264,403 13,824
2011 2012
※”Other” above mainly contain incidental logistic businesses for KWE groups, which are not included in reporting segments.
The AmericasJapan
Europe, Middle East & AfricaEast Asia & OceaniaSoutheast AsiaOther
(Millions of yen, %)
FY ended March 31Composition by Region

11
Japan The Americas Europe, Middle East & Africa
East Asia & Oceania
Southeast AsiaConsolidated
5.2%
3.8%
2.8%
6.1%
7.1%
5.4%
2.6%
4.4%
2.0%
6.5%
7.3%
5.5%
0.0%
1.0%
2.0%
3.0%
4.0%
5.0%
6.0%
7.0%
8.0%
Operating Margins by RegionOperating Margins by RegionThe Americas
Japan
Europe, Middle East& Africa East Asia & OceaniaSoutheast Asia
2011 / 2012
FY ended March 312011 and 2012
2011 / 2012 2011 / 2012 2011 / 2012 2011 / 2012 2011 / 2012
12
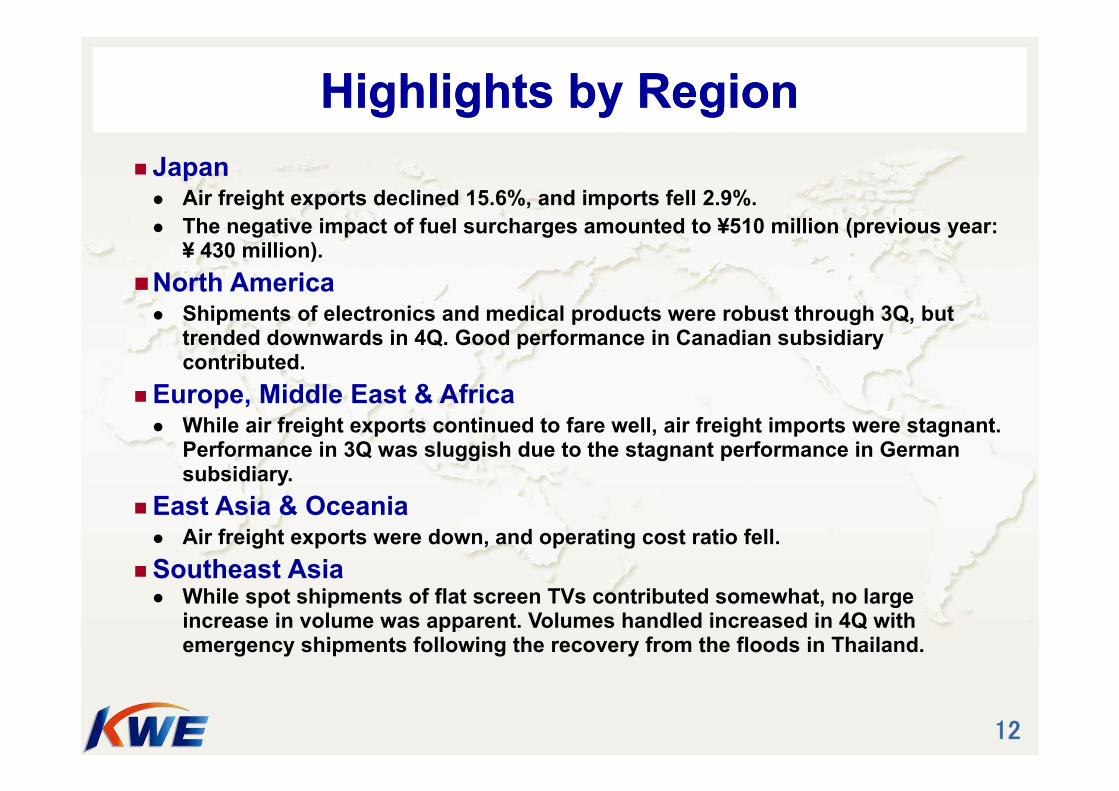
Highlights by RegionHighlights by Region Japan Air freight exports declined 15.6%, and imports fell 2.9%. The negative impact of fuel surcharges amounted to ¥510 million (previous year:
¥ 430 million). North America Shipments of electronics and medical products were robust through 3Q, but
trended downwards in 4Q. Good performance in Canadian subsidiary contributed.
Europe, Middle East & Africa While air freight exports continued to fare well, air freight imports were stagnant.
Performance in 3Q was sluggish due to the stagnant performance in German subsidiary.
East Asia & Oceania Air freight exports were down, and operating cost ratio fell.
Southeast Asia While spot shipments of flat screen TVs contributed somewhat, no large
increase in volume was apparent. Volumes handled increased in 4Q with emergency shipments following the recovery from the floods in Thailand.

13
Consolidated Operating Results by QuarterConsolidated Operating Results by Quarter
Numbers inside ( ) are cumulative figures from the first quarter.
(Millions of yen)(Millions of yen)
Net sales 1Q 2Q 3Q 4QFY ended March 2010 45,468 49,273 (94,741) 55,993 (150,734) 61,102 (211,836)FY ended March 2011 63,587 69,324 (132,912) 67,772 (200,684) 67,004 (267,688)FY ended March 2012 67,923 68,111 (136,034) 64,622 (200,656) 63,747 (264,403)
Operating income 1Q 2Q 3Q 4QFY ended March 2010 727 2,046 (2,773) 2,565 (5,338) 2,113 (7,451)FY ended March 2011 2,266 2,675 (4,942) 3,427 (8,369) 3,530 (11,898)FY ended March 2012 3,382 3,278 (6,660) 3,631 (10,291) 3,533 (13,824)
Ordinary income 1Q 2Q 3Q 4QFY ended March 2010 816 2,111 (2,927) 2,749 (5,676) 2,356 (8,032)FY ended March 2011 2,461 2,938 (5,399) 3,580 (8,979) 3,852 (12,831)FY ended March 2012 3,668 3,418 (7,086) 3,971 (11,057) 3,790 (14,847)
Consolidated Net Sales by Quarter Consolidated Operating Income by Quarter
(Millions of yen)
020,00040,00060,00080,000
1Q 2Q 3Q 4QFY March 2010 FY March 2011 FY March 2012
01,000
2,0003,000
4,000
1Q 2Q 3Q 4QFY March 2010 FY March 2011 FY March 2012

14
ItemFY ended March 2012
(Results)FY ending March 2013
(Forecasts)
Yr over Yr (%) Yr over Yr (%)
Net sales 264,403 △ 1.2 300,000 13.5
Gross profit 43,484 6.5 49,738 14.4
Operating income 13,824 16.2 15,000 8.5
Ordinary income 14,847 15.7 15,000 1.0Income before income taxes and minority interests
14,954 18.0 15,000 0.3
Net income 9,545 21.1 9,500 △ 0.5
Consolidated Earnings Forecast for FY Ending March 2013 – The Final Year of the Medium-Term Management Plan
Consolidated Earnings Forecast for FY Ending March 2013 – The Final Year of the Medium-Term Management Plan
(Millions of yen)

15
Consolidated Net Sales Forecast by Service Type & Region for FY Ending March 2013
Consolidated Net Sales Forecast by Service Type & Region for FY Ending March 2013
FY ending March 2013 (Forecast)
Net Sales by Service Type
Service TypeFY ending March 2013
(Forecast) Net sales Composition
Forwarding 147,100 49.0%
Logistics 65,500 21.8%
Ocean 58,700 19.6%
Other 28,700 9.6%
Total 300,000 100.0%
Forwarding
Logistics
Ocean
Other
Region FY ending March 2013 (Forecast)Net sales Operating income
Japan 125,000 4,240The Americas 40,100 2,450Europe, Middle East & Africa 29,100 900East Asia & Oceania 79,700 5,600Southeast Asia 27,900 1,620Other 2,200 260Adjustment △4,000 △70
Total 300,000 15,000
FY ending March 2013 (Forecast)
Net Sales by Region
(Millions of yen, %) (Millions of yen)
Frei
ght
tran
spor
tatio
n
The Americas
Japan
Europe, Middle East& Africa East Asia & OceaniaSoutheast AsiaOther
9.6%
26.2%
9.2% 0.7%
13.2%
41.1%

16
Review of the 2nd Year of the Medium-Term Management Plan
‘Ready for the Next!’and
Business Expansion Strategies
Review of the 2nd Year of the Medium-Term Management Plan
‘Ready for the Next!’and
Business Expansion Strategies
17
Outline of “Ready for the Next!” (1)Outline of “Ready for the Next!” (1)
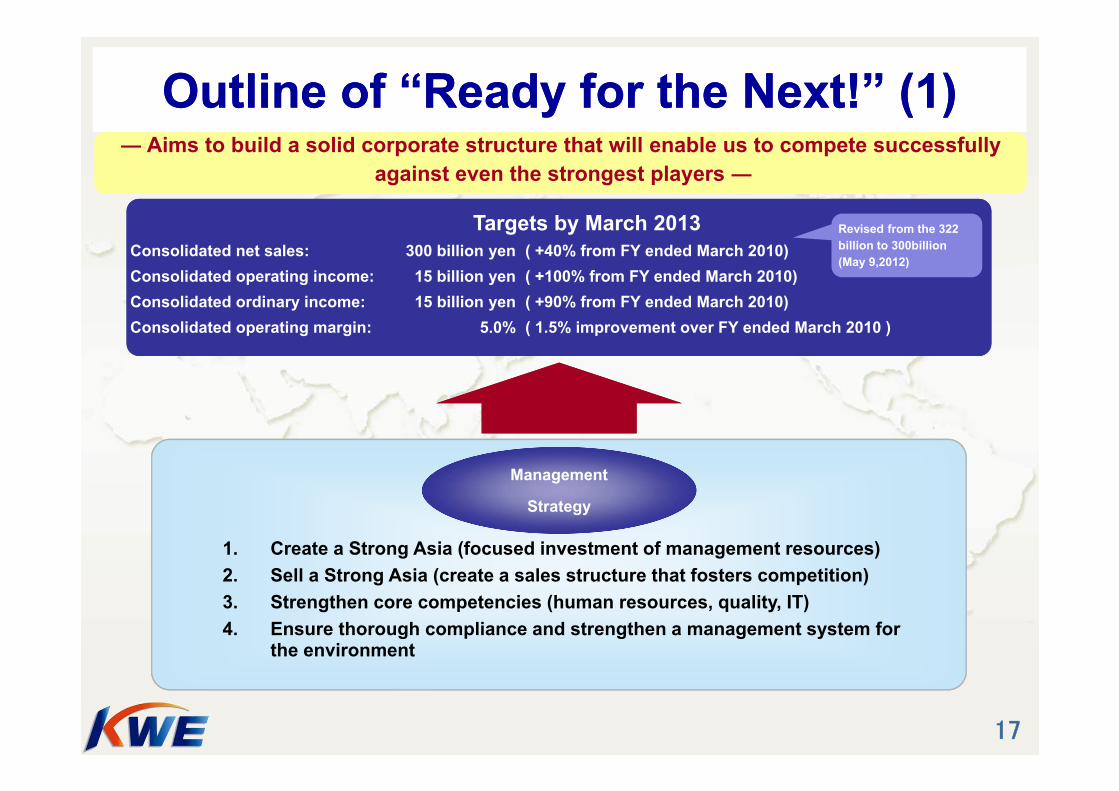
Targets by March 2013Consolidated net sales: 300 billion yen ( +40% from FY ended March 2010) Consolidated operating income: 15 billion yen ( +100% from FY ended March 2010)Consolidated ordinary income: 15 billion yen ( +90% from FY ended March 2010)Consolidated operating margin: 5.0% ( 1.5% improvement over FY ended March 2010 )
Targets by March 2013Consolidated net sales: 300 billion yen ( +40% from FY ended March 2010) Consolidated operating income: 15 billion yen ( +100% from FY ended March 2010)Consolidated ordinary income: 15 billion yen ( +90% from FY ended March 2010)Consolidated operating margin: 5.0% ( 1.5% improvement over FY ended March 2010 )
1. Create a Strong Asia (focused investment of management resources)2. Sell a Strong Asia (create a sales structure that fosters competition)3. Strengthen core competencies (human resources, quality, IT) 4. Ensure thorough compliance and strengthen a management system for
the environment
Management
Strategy
― Aims to build a solid corporate structure that will enable us to compete successfullyagainst even the strongest players ―
― Aims to build a solid corporate structure that will enable us to compete successfullyagainst even the strongest players ―
Revised from the 322 billion to 300billion(May 9,2012)

18
10,000 million
11,800 million 12,000 million
13,800 million15,000 million
9,500 million9,500 million
7,000 million7,800 million
5,800 million
Outline of “Ready for the Next!” (2) Basic Numerical Targets (Consolidated, Three Years)
Outline of “Ready for the Next!” (2) Basic Numerical Targets (Consolidated, Three Years)
Operating income
Net income
Net sales¥267,600
million
Net sales¥270,000
million
Net sales¥264,400
million
●The first and second year results substantially exceeded targets. We will seek to achieve final year targets.
Net sales¥235,000
million
Net sales¥300,000
million
Mar 2011 (Original plan)
Mar 2011 (Results)
Mar 2012(Original plan)
Mar 2012(Results)
Mar 2013(Forecast)
Aim is for record high of FY Mar 2008 Aim is for record high of FY Mar 2008 Net sales ¥ 292,300 millionOperating income ¥13,800 million
(The 1st year) (The 2nd year) (The 3rd year)

19
Review of the 2nd year of “Ready for the Next!” (1)Review of the 2nd year of “Ready for the Next!” (1)
President and CEO
Air Freight Dept. Sea Freight Dept. Quality Management Dept.
Strengthen matrix management to link the business approaches of four headquarters andthe regional scope of five regions
⇒Create a structure that plans and executes the best strategy to the whole group across the departments and the regions
Formulates, promotes, and is responsible for general coordination of Group management strategies (Established in April 2010)
Responsible for identifying and dealing with major customers involved in global operations, and aims to further enhance the marketing functions, as well as diversify our customer base
Formulates and promotes Group-wide sales and business strategies for our logistics operations
Commenced ‘Business Leader Global Seminar’ in July 2011 (11 trainees from 9 countries). Aim: To train top management candidates selected from throughout the Group.
Formulates and executes strategies to expand our air freight and sea freight forwarding businesses globally. Also aims to create a framework for maintaining and improving the quality of our services on a global scale
Corporate Strategy Headquarters
Corporate Forwarding Headquarters
Corporate Logistics Headquarters
Corporate Sales & Marketing Headquarters
Initiated Group Management Organization (Four Headquarters System) in April 2011
Global Business Leadership Training
20
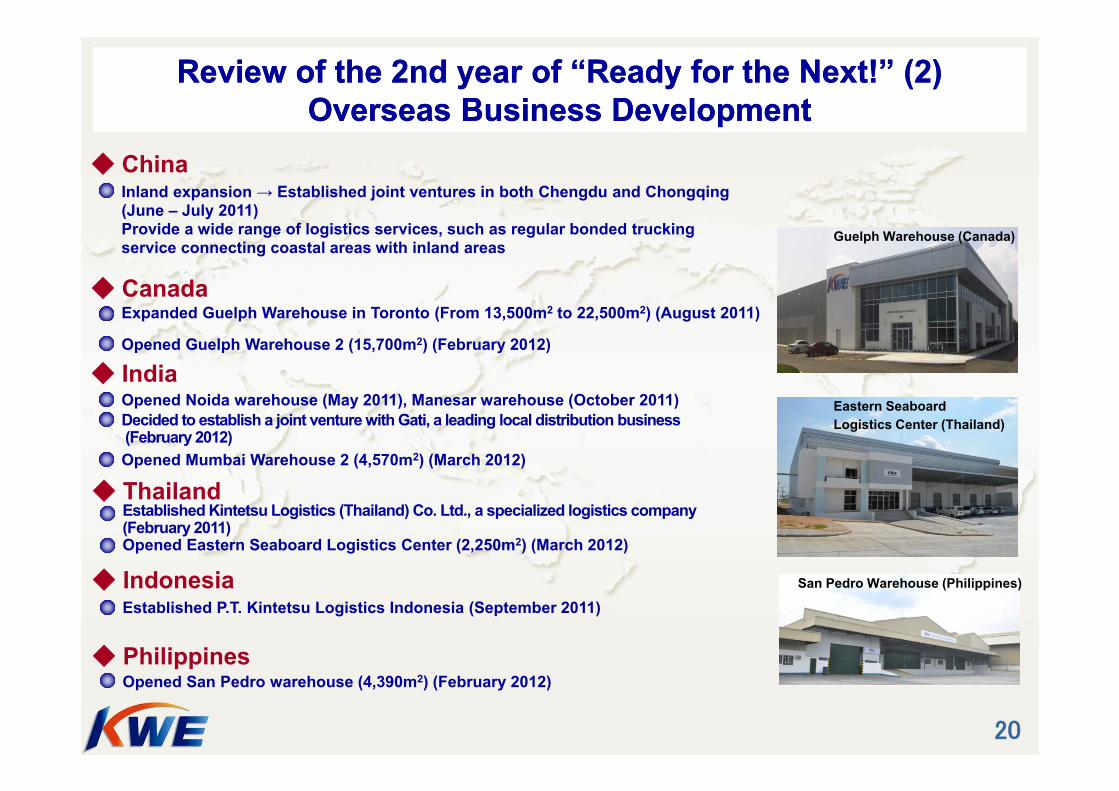
Review of the 2nd year of “Ready for the Next!” (2)Overseas Business Development
Review of the 2nd year of “Ready for the Next!” (2)Overseas Business Development
Guelph Warehouse (Canada)
San Pedro Warehouse (Philippines)
Eastern Seaboard Logistics Center (Thailand)
◆ China
◆ Canada
◆ India
◆ Thailand
◆ Indonesia
◆ Philippines
Inland expansion → Established joint ventures in both Chengdu and Chongqing (June – July 2011) Provide a wide range of logistics services, such as regular bonded trucking service connecting coastal areas with inland areas
Expanded Guelph Warehouse in Toronto (From 13,500m2 to 22,500m2) (August 2011)
Opened Guelph Warehouse 2 (15,700m2) (February 2012)
Opened Noida warehouse (May 2011), Manesar warehouse (October 2011)Decided to establish a joint venture with Gati, a leading local distribution business(February 2012)Opened Mumbai Warehouse 2 (4,570m2) (March 2012)
Established Kintetsu Logistics (Thailand) Co. Ltd., a specialized logistics company (February 2011) Opened Eastern Seaboard Logistics Center (2,250m2) (March 2012)
Established P.T. Kintetsu Logistics Indonesia (September 2011)
Opened San Pedro warehouse (4,390m2) (February 2012)

21
277,250248,012
278,263290,906
340,000
0
100,000
200,000
300,000
400,000
500,000
2009/3
(Result)
2010/3
(Result)
2011/3
(Result)
2012/3
(Result)
432,954
377,395
497,508473,722
600,000
0
100,000
200,000
300,000
400,000
500,000
600,000
700,000
2009/3
(Result)
2010/3
(Result)
2011/3
(Result)
2012/3
(Result)
◆ Intensify arrangements with major airlines worldwide◆ Expand offshore business (forwarding services between
countries other than Japan)◆ Expand the business with global companies
◆Expand freight volume to/from Asia◆Expand the business with global companies◆Bolster global procurement and control transporting cargo
space◆ Leverage external resources effectively (M&As, business
alliances, etc.)
Major Policies for FY Ending March 2013 ①– The Final Year of the Medium-Term Management Plan
Major Policies for FY Ending March 2013 ①– The Final Year of the Medium-Term Management Plan
―Group-wide Volume Targets―Volume (TEU) Sea Freight (Export)Weight (tons) Air Freight (Export)
Air freight forwarding Sea freight forwarding
Target
Target
Expand Air Freight and Sea Freight

22
Major Policies for FY Ending March 2013 ②– The Final Year of the Medium-Term Management Plan
Major Policies for FY Ending March 2013 ②– The Final Year of the Medium-Term Management Plan
― To expand the freight volume by the entire Group irrespective of the impact of the economic situation ―
― Six primary categories ―Hi-tech (electronics), automobiles, healthcare, retail, aircraft, energy
⇒The global leader in each category promotes information and expertise sharing within the Group for the sake of expansion.
Target South Korean, Taiwanese companies in addition to European, Japanese companies◆ Our global team will maintain and expand sales.
1) Expand items handled
2)Maintain and expand sales from corporate accounts
Received the 2011 Preferred Supplier Excellence Award from Texas Instruments (April 2012)

23
1) Strengthen Southeast Asia together with East Asia to create a “Strong Asia”
2) Strengthen the business structure in the high-growth Latin American region
Promote a Growth Strategy in Emerging Markets― Towards Further Growth (1)
Promote a Growth Strategy in Emerging Markets― Towards Further Growth (1)
Expansion into Southeast Asia and Latin America
Commence market research in: Myanmar, Cambodia, Laos
Key Countries India, Indonesia, Vietnam, Thailand
Key CountriesMexico, Brazil

24
Promote a Growth Strategy in Emerging Markets― Towards further growth (2)
Promote a Growth Strategy in Emerging Markets― Towards further growth (2)
Gati Limited: Headquartered in Hyderabad with 3,500 employees and approximately 500 locations in India. Operates about 4,000 trucks (including 845 fitted with GPS) in India., Uses IT for rapid and automatic distribution of delivery completioninformation. Provides an India-wide service and high added-value distribution services, such as date-specified delivery.
Business expansion in India
⇒Aim to raise our presence in Indian logistics and expand our Indian business globally by combining Gati’s high-quality domestic distribution service with KWE Group’s global network.
◆ Establish Gati-Kintetsu Express Pvt. Ltd, a joint venture with major Indian distributor, Gati
Gati distribution center
Due to launch in May 2012 with 70% equity held by Gati and 30% by KWE Group
The new company will inherit Gati’s Indian transport and logistics businesses

25
Dalian
Shanghai
Guangzhou
Beijing
Chengdu
Chongqing
Secure a position of absolute advantage in bonded logistics business in ChinaSecure a position of absolute advantage in bonded logistics business in China
◆Administrative headquarters: Kintetsu World Express (China) Co. Ltd (KWE China) Strengthen governance within China by merging the primary Chinese companies
◆Expansion of warehouse in Shanghai Pudong International Airport Comprehensive Bonded Area
Continue to expand network inland and enhance bonded logistics business in China
KWE’s network in China (As of March 31, 2012)
■16 subsidiaries■47 cities■117 locations
■58 warehouses(Total area:433,645㎡)■ 906 trucks
・Expanded from the initial 7,000m2 to 14,000m2 in March 2012・Expansion to 42,000m2 possible
KWE China
Business expansion in China
Promote a Growth Strategy in Emerging Markets― Towards further growth (3)
Promote a Growth Strategy in Emerging Markets― Towards further growth (3)

26
DividendsDividendsFuture goal is 20% of
consolidated net incomeCurrently goal is 30% of
non-consolidated net income
Stable dividend for shareholders
¥27/year¥24/year
¥30/year
¥35/year (Plan)
¥30/year (Forecast)
FY March 2009 FY March 2010 FY March 2011 FY March 2012(Plan)
FY March 2013(Forecast)
Supplemental MaterialsSupplemental Materials
27

28
KWE Group
Other business(2 companies)
KWE Group’s Worldwide Five Regional Management System
KWE Group’s Worldwide Five Regional Management System31 overseas countries, 203 cities, 333 locations (as of March 31, 2012)
Acquired ISO 9001 certification
(20 subsidiaries including Japan)
Logistics facilities 155 locations overseas
(872,535 m²) 32 locations in Japan
(207,646 m²)
Acquired ISO14001 certification(13 locations
worldwide including the Narita Terminal)
Acquired TAPA certification(19 locations
worldwide including the Narita Terminal)
Europe, Middle East & Africa
(16 companies)〔Includes 1 equity method affiliate〕
Japan(9 companies)
Includes KWE Japan and 3 equity method affiliates
The Americas(3 companies)
Southeast Asia (11 companies)
East Asia & Oceania (25 companies)
〔Includes 2 equity method affiliates〕

29
Non-consolidated Balance SheetsNon-consolidated Balance Sheets(Millions of yen)
March 31, 2011 March 31, 2012 Change
Assets:
Current assets 29,371 31,281 1,910
Property and equipment 22,631 22,010 △ 620Intangible fixed assets 689 643 △ 46Investments and other assets 13,702 14,466 763Total assets: 66,394 68,401 2,007
Liabilities:
Current liabilities 20,609 19,462 △ 1,147
Long-term liabilities 4,284 4,473 188Total liabilities 24,894 23,935 △ 958
Net Assets:Total net assets 41,500 44,466 2,965Total liabilities and net assets 66,394 68,401 2,007
30
129,539 121,552
522,794
192,023 179,844
352,492 342,316
134,375141,424
510,353
0
300,000
600,000
900,000
1,200,000
1,500,000
39,51344,235
164,342155,628
65,28268,062
152,564 128,708
77,08975,807
0
100,000
200,000
300,000
400,000
500,000
600,000
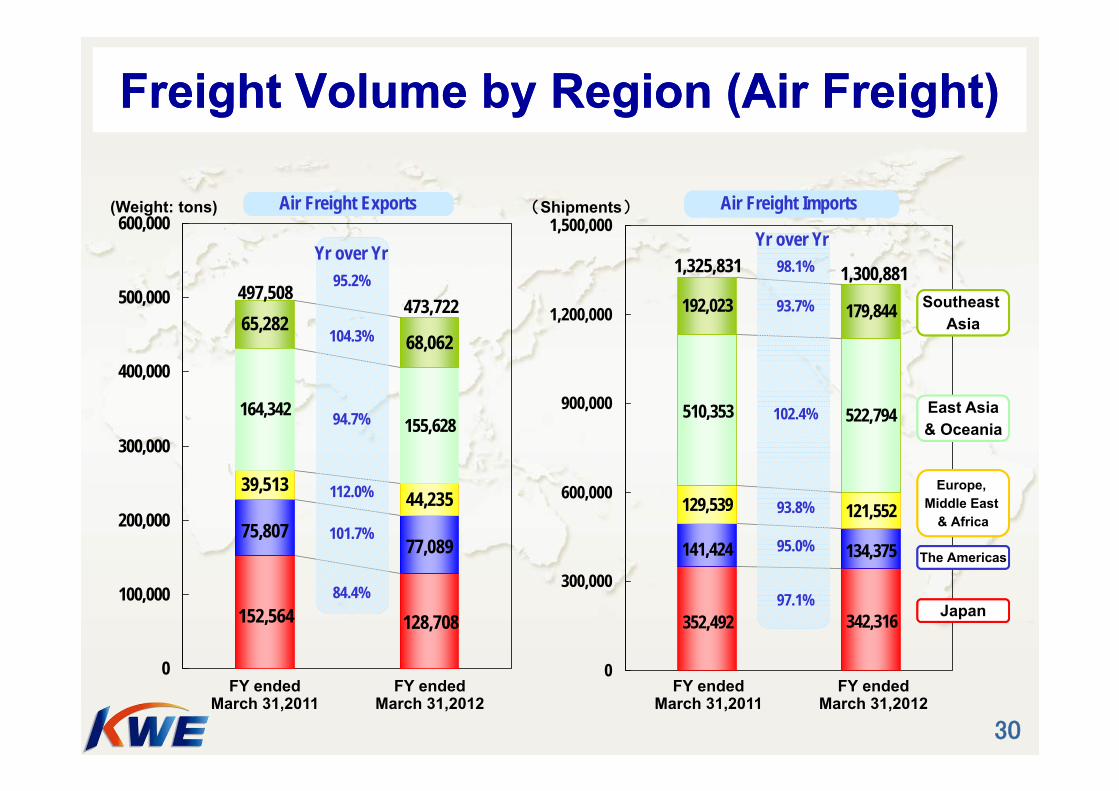
Freight Volume by Region (Air Freight)Freight Volume by Region (Air Freight)
(Shipments)(Weight: tons) 航空輸入Air Freight Exports
95.2%
101.7%
112.0%
94.7%
84.4%
1,325,831 98.1%
102.4%
93.8%
95.0%
97.1%
104.3%
93.7%
East Asia& Oceania
Europe, Middle East
& Africa
The Americas
Japan
Southeast Asia
1,300,881473,722
497,508
Yr over Yr
Air Freight Imports
Yr over Yr
FY endedMarch 31,2011
FY endedMarch 31,2012
FY endedMarch 31,2011
FY endedMarch 31,2012

31
16,501 18,267
62,098
34,541 33,437
86,270 87,655
19,21719,274
61,390
0
50,000
100,000
150,000
200,000
250,000
10,640 11,241
130,167 141,403
36,30936,840
71,428 67,867
33,55529,719
0
50,000
100,000
150,000
200,000
250,000
300,000
350,000
Freight Volume by Region (Sea Freight)Freight Volume by Region (Sea Freight)
(Shipments)(Volume: TEU) 航空輸入Sea Freight Exports
104.5%
112.9%105.6%
108.6%
95.0%
217,976 101.2%
101.2%
110.7%
99.7%
101.6%
101.5%96.8%
East Asia& Oceania
Europe, Middle East
& Africa
The Americas
Japan
Southeast Asia
220,674290,906
278,263
Yr over Yr
Sea Freight Imports
FY endedMarch 31,2011
FY endedMarch 31,2012
FY endedMarch 31,2011
FY endedMarch 31,2012
Yr over Yr
32
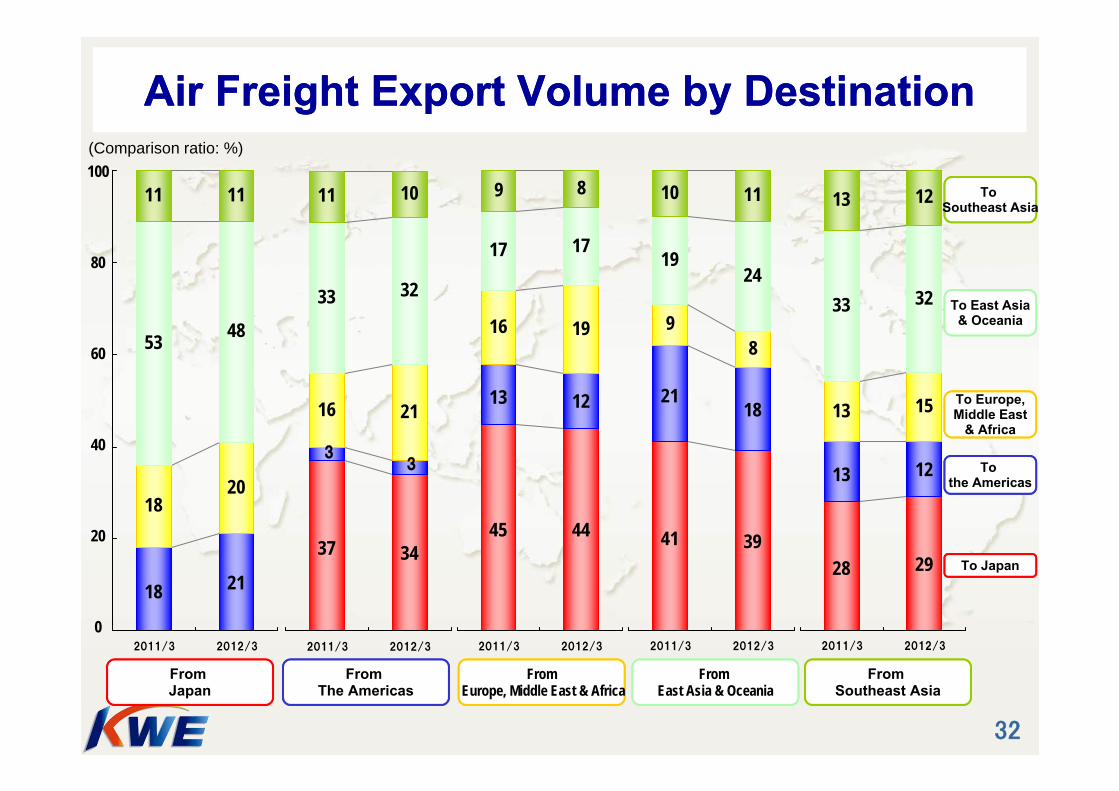
Air Freight Export Volume by DestinationAir Freight Export Volume by Destination100(Comparison ratio: %)
To East Asia& Oceania
To Europe,Middle East
& Africa
To the Americas
To Japan
Southeast AsiaTo
Southeast Asia
80
60
40
20
0
From East Asia & OceaniaEurope, Middle East & Africa
FromEurope, Middle East & Africa
From The Americas
From Japan
From Southeast Asia
16 21
33 32
11 10
37 34
2011/3 2012/3
1820
53 48
11 11
2118
2011/3 2012/3
16 19
17 17
9 8
45 44
1213
2011/3 2012/3
98
1924
10 11
41 39
1821
2011/3 2012/3
13 15
33 32
13 12
28 29
1213
2011/3 2012/3
33

33
Items Handled – (1) (Non-consolidated: Air Freight)Items Handled – (1) (Non-consolidated: Air Freight)- Based on net sales of top 100-ranked companies -
Air freight composition- Based on net sales of top 100-ranked companies -
Air freight composition
KWE Japan’s Air Freight Export Composition, FY Ended March 31, 2012
KWE Japan’s Air Freight Import Composition, FY Ended March 31, 2012
Electronics-related items
48.1%
Aircraftcomponents
1.4%Machineryand
constructiondevices
5.9%
Other1.0%
Opticaldevices1.1%
Medical andchemicalproducts13.0%
Automobile-related
products29.5%
Electronics-related items
63.2%
Medical andChemicalproducts
21.8%
Machinery-related
products2.6%
Other 4.7%
Automobile-related
products3.2%
Fashion andtextile
products4.5%

34
Items Handled – (2) (Non-consolidated: Sea Freight)Items Handled – (2) (Non-consolidated: Sea Freight)- Based on net sales of top 100-ranked companies -
Sea freight composition- Based on net sales of top 100-ranked companies -
Sea freight composition
KWE Japan’s Sea Freight Export Composition, FY Ended March 31, 2012
KWE Japan’s Sea Freight Import Composition, FY Ended March 31, 2012
Electronics-related items
25.9%
Automobile-related
products20.8%
Medical andChemicalproducts
18.4%
Other 10.4%
Facilities andMachinery-
relatedproducts
24.5%
Electronics-related items
43.0%
Fashion andTextile
products8.2%
Machinery-related
products6.9%
Medical andChemicalproducts
6.9%
Other18.1%
Generalmerchandise
8.3%
Automobile-related
products8.6%
Kintetsu World Express, Inc.Website: http://www.kwe.co.jp/en/index.html
* The information contained herein does not constitute an offer to solicit investment which can only be made by formal prospectus. The forward-looking statements contained herein are not intended to assure or guarantee future performance. Actual results may vary from that projected herein.


![Luzhou 9MFY13 Presentation.ppt [Repaired]luzhou.listedcompany.com/newsroom/20131112_173859_L46_4288… · FY: Year ended December 31 1Q: Three months ended March 31 2Q:Three months](https://static.documents.pub/doc/80x56/5f50d0ed9f531e5913404436/luzhou-9mfy13-repairedluzhoulistedcompanycomnewsroom20131112173859l464288.jpg)


![ANNUAL FINANCIAL STATEMENTS For years ended March ......2019/04/26 · Total comprehensive income (millions of yen) FY 2019: 511,586 [ + 23.1% ] FY 2018: 415,602 [ + 28.5% ] (2) Consolidated](https://static.documents.pub/doc/80x56/60acba23d205b46f7039a0ac/annual-financial-statements-for-years-ended-march-20190426-total-comprehensive.jpg)


