49
Financial results Year ended 30 June 2020 Escondida

Financial resultsYear ended30 June 2020
Escondida

Disclaimer
Forward-looking statementsThis presentation contains forward-looking statements, including statements regarding: trends in commodity prices and currency exchange rates; demand for commodities; production forecasts; plans, strategies and objectives of management; closure or divestment of certain assets,
operations or facilities (including associated costs); anticipated production or construction commencement dates; capital costs and scheduling; operating costs and shortages of materials and skilled employees; anticipated productive lives of projects, mines and facilities; provisions and
contingent liabilities; and tax and regulatory developments.
Forward-looking statements may be identified by the use of terminology, including, but not limited to, ‘intend’, ‘aim’, ‘project’, ‘anticipate’, ‘estimate’, ‘plan’, ‘believe’, ‘expect’, ‘may’, ‘should’, ‘will’, ‘would’, ‘continue’, ‘annualised’ or similar words. These statements discuss future
expectations concerning the results of assets or financial conditions, or provide other forward-looking information.
These forward-looking statements are based on the information available as at the date of this release and are not guarantees or predictions of future performance, and involve known and unknown risks, uncertainties and other factors, many of which are beyond our control, and which
may cause actual results to differ materially from those expressed in the statements contained in this release. BHP cautions against reliance on any forward-looking statements or guidance, particularly in light of the current economic climate and the significant volatility, uncertainty and
disruption arising in connection with COVID-19.
For example, our future revenues from our assets, projects or mines described in this release will be based, in part, upon the market price of the minerals, metals or petroleum produced, which may vary significantly from current levels. These variations, if materially adverse, may affect
the timing or the feasibility of the development of a particular project, the expansion of certain facilities or mines, or the continuation of existing assets.
Other factors that may affect the actual construction or production commencement dates, costs or production output and anticipated lives of assets, mines or facilities include our ability to profitably produce and transport the minerals, petroleum and/or metals extracted to applicable
markets; the impact of foreign currency exchange rates on the market prices of the minerals, petroleum or metals we produce; activities of government authorities in the countries where we sell our products and in the countries where we are exploring or developing projects, facilities or
mines, including increases in taxes; changes in environmental and other regulations; the duration and severity of the COVID-19 pandemic and its impact on our business; political uncertainty; labour unrest; and other factors identified in the risk factors discussed in BHP’s filings with the
U.S. Securities and Exchange Commission (the ‘SEC’) (including in Annual Reports on Form 20-F) which are available on the SEC’s website at www.sec.gov.
Except as required by applicable regulations or by law, BHP does not undertake to publicly update or review any forward-looking statements, whether as a result of new information or future events.
Presentation of dataUnless specified otherwise: variance analysis relates to the relative performance of BHP and/or its operations during the 2020 financial year compared with the 2019 financial year; operations includes operated assets and non-operated assets; total operations refers to the combination
of continuing and discontinued operations; continuing operations refers to data presented excluding the impacts of South32 from the 2014 financial year onwards, and Onshore US from the 2017 financial year onwards; copper equivalent production based on 2020 financial year average
realised prices; references to Underlying EBITDA margin exclude third party trading activities; data from subsidiaries are shown on a 100 per cent basis and data from equity accounted investments and other operations is presented, with the exception of net operating assets, reflecting
BHP’s share; medium term refers to our five year plan. Queensland Coal comprises the BHP Mitsubishi Alliance (BMA) asset, jointly operated with Mitsubishi, and the BHP Mitsui Coal (BMC) asset, operated by BHP. Numbers presented may not add up precisely to the totals provided
due to rounding. All footnote content (except in the Annexures) is contained on slide 48.
Alternative performance measuresWe use various alternative performance measures to reflect our underlying performance. For further information please refer to alternative performance measures set out on pages 51 - 62 of the BHP Results for the year ended 30 June 2020.
No offer of securitiesNothing in this presentation should be construed as either an offer or a solicitation of an offer to buy or sell BHP securities in any jurisdiction, or be treated or relied upon as a recommendation or advice by BHP.
Reliance on third party informationThe views expressed in this presentation contain information that has been derived from publicly available sources that have not been independently verified. No representation or warranty is made as to the accuracy, completeness or reliability of the information. This presentation
should not be relied upon as a recommendation or forecast by BHP.
BHP and its subsidiariesIn this presentation, the terms ‘BHP’, the ‘Company’, the ‘Group’, ‘our business’, ‘organization’, ‘Group’, ‘we’, ‘us’ and ‘our’ refer to BHP Group Limited, BHP Group Plc and, except where the context otherwise requires, their respective subsidiaries set out in note 13 ‘Related undertaking
of the Group’ in section 5.2 of BHP’s Annual Report on Form 20-F. Those terms do not included non-operated assets. Notwithstanding that this presentation may include production, financial and other information from non-operated assets, non-operated assets are not included in the
Group and, as a result, statements regarding our operations, assets and values apply only to our operated assets unless otherwise stated. Our non-operated assets include Antamina, Cerrejón, Samarco, Atlantis, Mad Dog, Bass Strait and North West Shelf.
18 August 2020
Financial results
2

Financial resultsYear ended 30 June 2020
Mike Henry Chief Executive Officer
Nickel West

Resilient results in extraordinary times
18 August 2020
Financial results
4
Performance underpinned by reliable operational delivery and continuous improvement
Dynamic and effective response to COVID-19
Managing portfolio for sustainable value creation
Safer, lower cost and more reliable
Strong free cash flow ensuring net debt at the low end of our
target range
Delivering strong and consistent shareholder returns:
55 US cps final dividend, 72% payout
Western Australia Iron Ore

Response to COVID-19
18 August 2020
Financial results
5
Great people, strong relationships and clear priorities supported continued operational performance
Operational
resilience
Underpinned by financial strength, structure, culture,
safety focus and social value
Swift response enabled through partnership with governments, suppliers and customers
Stakeholders
More connected, flexible, focused and fast
Looking
forwardStrengthened relationships underpinning value creation
for all shareholders
Diversified portfolio with balanced commodity exposure
Working closely with communities and Traditional Owners; US$50m in COVID-19 community support
Queensland Coal
Note: COVID-19 community support (US$50 million) excludes US$25 million to support contracting partners whose activities at sites have been interrupted due to workforce demobilisation.

FY20 financial highlights Resilient margins, strong earnings, net debt at the bottom of our target range
US$12 bnnet debt
Net debt
55 US cps
dividend determined,
payout ratio of 72%
Shareholder returns
US$22.1 bnUnderlying EBITDA down 5%
Earnings
18 August 2020
Financial results
6
53%Underlying EBITDA margin
Margin
US$8.1 bnfree cash flow
Free cash flow
17%ROCE
ROCE
Note: Net debt excludes vessel lease contracts that are priced with reference to a freight index.

FY20 operational highlights
18 August 2020
Financial results
7
Safer, lower cost, more reliable
ImprovedNo major operational disruptions
WAIO car dumper MTBF up 28%
Reliability
Recordsat WAIO, Caval Ridge, Broadmeadow
and Poitrel
Production
On trackwith minimal delays despite COVID-19
Major projects
AdvancingOak Dam phase 3 drilling complete;
Honeymoon Well acquisition
Minerals exploration
SaferZero fatalities
23% decrease in HPI1
11% decrease to 4.2 TRIF
Safety
Notes: HPI – High Potential Injury frequency; TRIF – Total Recordable Injury Frequency, WAIO – Western Australia Iron Ore; MTBF = Mean Time Between Failure.
Unit costs
Lowerby 9% across major assets2

Inclusion & diversity
↑ ~4,000
to 27%
FY16 FY17 FY18 FY19 FY20
Female workforce participation
FY20 social value highlights Social value integrated into all we do
18 August 2020
Financial results
8
US$150 minvested largely in regional communities
Social investment
12%of total external expenditure
paid directly to local suppliers
Local spend GHG emissions
FY17 FY18 FY19 FY20
Scope 1 & 2 GHG emissions
FY20
15.8 Mt
CO2-e
US$9.1 bnglobal tax, royalty and other
government payments
Economic contributionWater
FY20
↓19%
from
FY17
FY17 FY18 FY19 FY20
Fresh water withdrawals (GL)
Note: Work is progressing on the implementation of the climate change initiatives announced in July 2019. We are setting a 2030 science-based target for Scope 1 and 2 emissions, to set the trajectory towards our 2050 goal of net-zero operational emissions, as well as setting
Scope 3 emissions goals. We are implementing the US$400 million Climate Investment Program, are updating our climate portfolio analysis, and clarifying and strengthening the link between performance against emissions targets and BHP’s executive pay plans. We will announce
these in our Climate Change Report to be published on 10 September 2020.
18%
(Mt of CO2-e)
Queensland Coal
Financial resultsYear ended 30 June 2020
Peter Beaven Chief Financial Officer

Financial performanceEBITDA margin 53% and continued earnings per share growth
Summary income statement(US$ billion)
FY20 % change
Underlying EBITDA 22.1 5%
Underlying EBITDA margin 53%
Underlying EBIT 15.9 7%
Adjusted effective tax rate3 33.2%
Adjusted effective tax rate incl. royalties3 42.2%
Underlying attributable profit (total ops.) 9.1 1%
Net exceptional items (1.1)
Attributable profit 8.0
Underlying basic earnings per share (total ops.) 179.2 US cps 2%
Dividend per share 120 US cps 10%
Strong earnings delivery(US cents per share) (Index, FY16=100)
0
100
200
0
50
100
150
200
FY16 FY17 FY18 FY19 FY20
Underlying basic EPS (H1)
Underlying basic EPS (H2)
Revenue
Note: Presented on a total operations basis.
18 August 2020
Financial results
10

Strong underlying performance across the portfolio, despite COVID-19 headwinds
23.2 23.422.1
(0.3)
0.1
(0.6)(1.1)
1.0 0.6
(0.4)
0.1
(0.5)
0
5
10
15
20
25
FY19 Price Foreignexchange
Inflation IFRS 16leases
Sub-total Volumes Controllablecash costs
Fuel &energy
Non-cash(inc. deferred
stripping)
Other(inc. P&Lfrom EAI)
FY20
Group EBITDA waterfall
External US$0.2 billion Controllable US$(1.3) billion
Underlying EBITDA variance(US$ billion)
4
18 August 2020
Financial results
11
5
Note: EAI – equity accounted investment.
(0.4)
0.0
0.4
0.8
1.2
Escondidaproductivity
WAIOproductivity
Coppergrade
decline
Naturalfield
decline
Weather Other
0.4
FY20 volume and cash cost variance(US$bn)
(0.3)0.6
(0.4)
(0.4)
(0.2)

Segment performanceStrong underlying performance, offset planned maintenance, natural field decline and grade decline
Iron Ore7 Copper Metallurgical Coal Petroleum9
300 Mtpa run rate,
a quarterly record
Record throughput
at Escondida
Record volumes Broadmeadow,
Caval Ridge and Poitrel
Resilient portfolio with
valuable growth options
% of Group EBITDA6 64% 19% 9% 10%
EBITDA: US$14.6 bn US$4.3 bn US$1.9 bn US$2.2 bn
EBITDA margin: 70% 45% 36% 55%
ROCE: 56% 7% 12% 6%
Unit cost:WAIO(US$/t)
Performance
drivers:
Cost 10
Cost at FX guidance 10
Guidance 10
• FY20 record concentrator throughput,
strong cost management, higher
deferred stripping, lower by-product
credits and lower grade
• FY21 unit cost reflects reduced
workforce and lower grade offset by
lower stripping costs
Queensland Coal(US$/t)
69.44 67.59
30
50
70
90
FY19 FY20 FY21e MT
58–6669–75
• FY20 significant wet weather impacts,
higher stripping costs, and wash plant
and port shut down maintenance
• FY21 unit cost reflects higher strip
ratios, increased contractor stripping
costs and tailings and risk spend,
partly offset by higher volumes and
improved productivity
• FY20 lower price-linked costs, cost
efficiencies and lower maintenance
activities
• FY21 unit cost reflects impact of lower
volumes and forecast lower price-
linked costs
18 August 2020 12
• FY20 strong inflow performance
despite two tropical cyclones
• Uplift in car dumper reliability
enabled by improved
maintenance strategies
• FY21 unit cost reflects higher FX
and longer Yandi haul times
14.1612.63
<13
0
5
10
15
FY19 FY20 FY21e MT
FY20 C1 costs US$11.82/t
(ex. 3rd party royalties)8
13–14
Financial results
Escondida(US$/lb)
1.14
<1.10
0.00
0.40
0.80
1.20
FY19 FY20 FY21e MT
1.00–1.25
1.01
Petroleum(US$/boe)
10.54
<13
9.74
0
5
10
15
FY19 FY20 FY21e MT
11-12

Cash generation
Net operating cash flow(US$ billion) (Index, FY10=100)
0
100
200
0
5
10
15
20
25
30
35
FY10 FY11 FY12 FY13 FY14 FY15 FY16 FY17 FY18 FY19 FY20
Operating cash flow (H1) Operating cash flow (H2)
Onshore US proceeds Revenue (RHS)
200
200
(100)
0
100
200
(10)
(5)
0
5
10
15
20
25
FY10 FY11 FY12 FY13 FY14 FY15 FY16 FY17 FY18 FY19 FY20
Free cash flow (H1) Free cash flow (H2)
Onshore US proceeds Revenue (RHS)
Free cash flow(US$ billion) (Index, FY10=100)
Note: Presented on a total operations basis.
Attractive free cash flow while continuing to invest through the cycle
18 August 2020
Financial results
13

Capital allocationInvesting in value growth; disciplined adherence to our Capital Allocation Framework
Includes net cash outflow of US$1.1 bn
Note: Excess cash includes total net cash outflow of US$1.1 billion (FY19: US$1.3 billion) which comprises dividends paid to non-controlling interests of US$1.0 billion12 (FY19: US$1.2 billion); net investment and funding of equity accounted
investments of US$0.6 billion (FY19: US$0.6 billion) and an adjustment for exploration expenses of US$(0.5) billion (FY19: US$(0.5) billion) which is classified as organic development in accordance with the Capital Allocation Framework.
Operatingproductivity
Capitalproductivity
Net operating cash flow
Excess cash
US$15.7 bn
Maintenance capital US$1.9 bn
Minimum 50% payout ratio dividend12 US$5.0 bn
US$7.7 bn
FY20
Buy-backsAcquisitions/
(Divestments)Balance sheet
Organic
development
Additional
dividends11
US$0.1 bn US$1.9 bn US$0.0 bn US$5.7 bn US$0.0 bn
• US$3.2 bn improvement
• US$0.4 bn latent capacity
• US$1.4 bn major projects
• US$0.7 bn exploration
Strong balance sheet
H2 FY19 and
H1 FY20
18 August 2020
Financial results
14
0
10
20
30
FY16 FY17 FY18 FY19 FY200
3
6
9
FY16 FY17 FY18 FY19 FY20
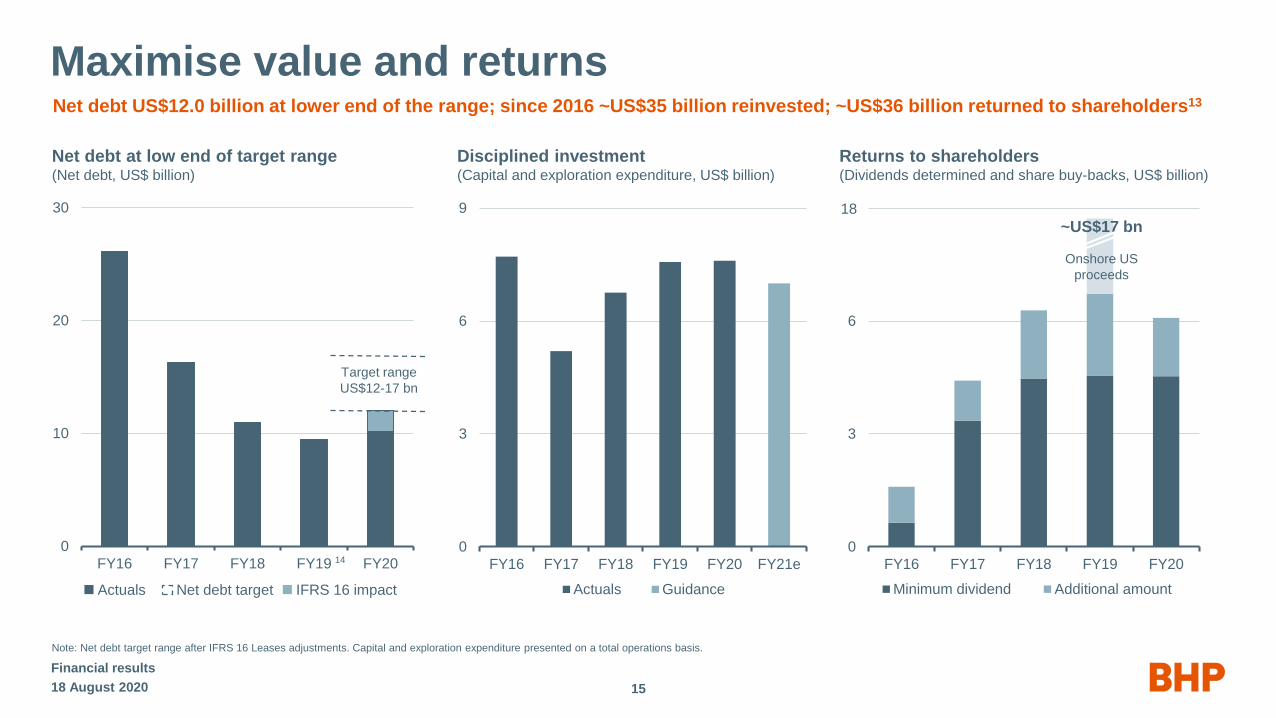
Minimum dividend Additional amount
Onshore US
proceeds
Maximise value and returns
0
3
6
9
FY16 FY17 FY18 FY19 FY20 FY21e
Actuals Guidance
Disciplined investment(Capital and exploration expenditure, US$ billion)
Net debt US$12.0 billion at lower end of the range; since 2016 ~US$35 billion reinvested; ~US$36 billion returned to shareholders13
Note: Net debt target range after IFRS 16 Leases adjustments. Capital and exploration expenditure presented on a total operations basis.
Returns to shareholders(Dividends determined and share buy-backs, US$ billion)
18
~US$17 bn
Net debt at low end of target range(Net debt, US$ billion)
Net debt targetActuals
Target range
US$12-17 bn
18 August 2020
Financial results
15
IFRS 16 impact
14

(5)
0
5
10
15
20
25
30
0 10 20 30 40 50 60
Return on Capital EmployedFY20 ROCE 17%; strong underlying performance despite challenging operating and market conditions
Antamina16
Average capital employed(US$ billion)
WAIO16
Queensland
Coal
NSWEC15
Pampa
Norte
Cerrejón15,16
Petroleum
ex-ExplorationOlympic Dam
Note: ROCE represents profit after tax excluding exceptional items and net finance costs (after tax) divided by average capital employed. Average capital employed is net assets less net debt for the last two reporting periods.
0
5
10
15
20
FY16 FY17 FY18 FY19 FY20
Actual FY17 average realised prices
Returns(ROCE excluding Onshore US, %)
Escondida
Potash
Excludes investment in
major projects in execution
18 August 2020
Financial results
16
50
ROCE by asset (%)
Supportive
iron ore price
COVID-19
disruptions to
operations
COVID-19
demand
impacts
Excess global supply
and COVID-19 demand
impacts
External
factors17
Exploration15

Financial resultsYear ended 30 June 2020
Mike Henry Chief Executive Officer
Mt Whaleback

External environment
18 August 2020
Financial results
18
Demand
volatility
Society
in flux
Opportunity
and risk
Price
uncertainty
Policy
uncertainty
Uneven
recovery
Climate
action
Sustainable
productivity
Growth in
population,
wealth
Electrification
of transport
Biosphere
stewardship
Decarbonisation
of power
Short term Medium term Long term
Near-term uncertainty continues, attractive medium-term fundamentals, with long-term strategic themes intact and accelerating
Note: Further information on BHP’s economic and commodity outlook can be found at www.bhp.com/prospects.

Growing value in a dynamic world
18 August 2020
Financial results
19
Safe
LeanHigh
performing
Future
fit
Value
and
returns
Building on our strong foundations to prosper in uncertain times and create value in the longer term
Consistent strategy to own and operate the best assets in the
best commodities
Strategy to be underpinned by reliable, safe delivery of leading
operational performance
Rich set of options to grow value and deliver high returns over
the next 5 – 10 years
Active portfolio management to support value growth across
multiple time horizons
Focus on increasing exposure to future facing commodities

Approach to portfolio
Value
Time
Electrification of transport
• Policy support (e.g. pro-EV & anti-ICE)
• Cost competitiveness of EVs
• Infrastructure charging speed and
availability
Licence to operate
• Decline in trust between governments,
citizens and corporations
• Fluid policy environment at the global,
national, regional and sectoral levels
Biosphere
• Globally coordinated regulatory intervention
to resolve land and water competition
• Food security threatened18
• Steep disincentive pricing19
Decarbonisation of stationary power
• Early retirement of non-renewable resources
• Standalone renewable cost competitiveness
• Grid flexibility solutions become economic
Circular economy
• Policy changes (i.e. imported waste bans)
• Emergence of cost competitive substitutes
for single-use plastics
• Breakthrough in household recycling
• Consumers reject unsustainable options
Note: Represents possible impact on our portfolio if no action is taken to mitigate against risks or seize opportunities. Themes are not mutually exclusive or exhaustive, outcomes from one
theme could impact our view on severity, timeframes, or strategic considerations for other themes.
Strategic scenarios inform management of portfolio for value and returns over time
2018 August 2020
Financial results
Response to Climate Change
• Effects of global responses to climate change
• Rapid roll out of renewable energy and electrification
• Decarbonisation of industry, including via carbon offsets
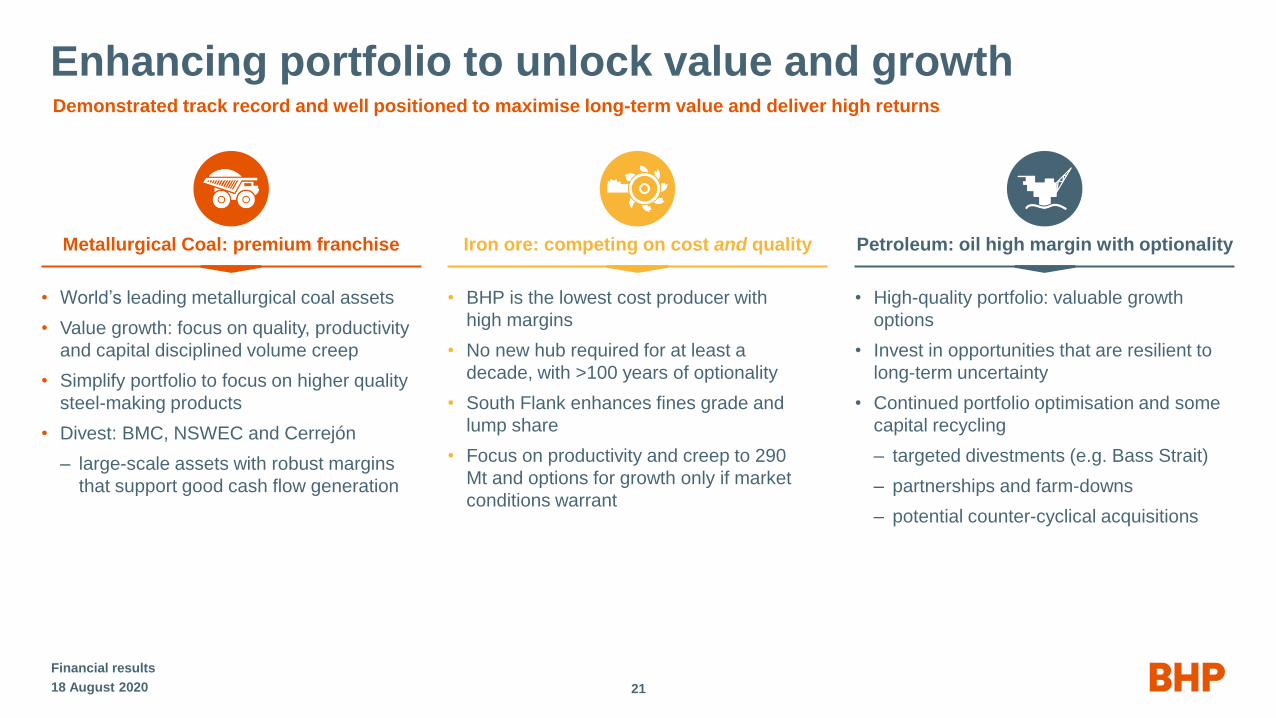
Enhancing portfolio to unlock value and growthDemonstrated track record and well positioned to maximise long-term value and deliver high returns
2118 August 2020
Financial results
• BHP is the lowest cost producer with
high margins
• No new hub required for at least a
decade, with >100 years of optionality
• South Flank enhances fines grade and
lump share
• Focus on productivity and creep to 290
Mt and options for growth only if market
conditions warrant
Iron ore: competing on cost and qualityMetallurgical Coal: premium franchise
• World’s leading metallurgical coal assets
• Value growth: focus on quality, productivity
and capital disciplined volume creep
• Simplify portfolio to focus on higher quality
steel-making products
• Divest: BMC, NSWEC and Cerrejón
– large-scale assets with robust margins
that support good cash flow generation
• High-quality portfolio: valuable growth
options
• Invest in opportunities that are resilient to
long-term uncertainty
• Continued portfolio optimisation and some
capital recycling
– targeted divestments (e.g. Bass Strait)
– partnerships and farm-downs
– potential counter-cyclical acquisitions
Petroleum: oil high margin with optionality
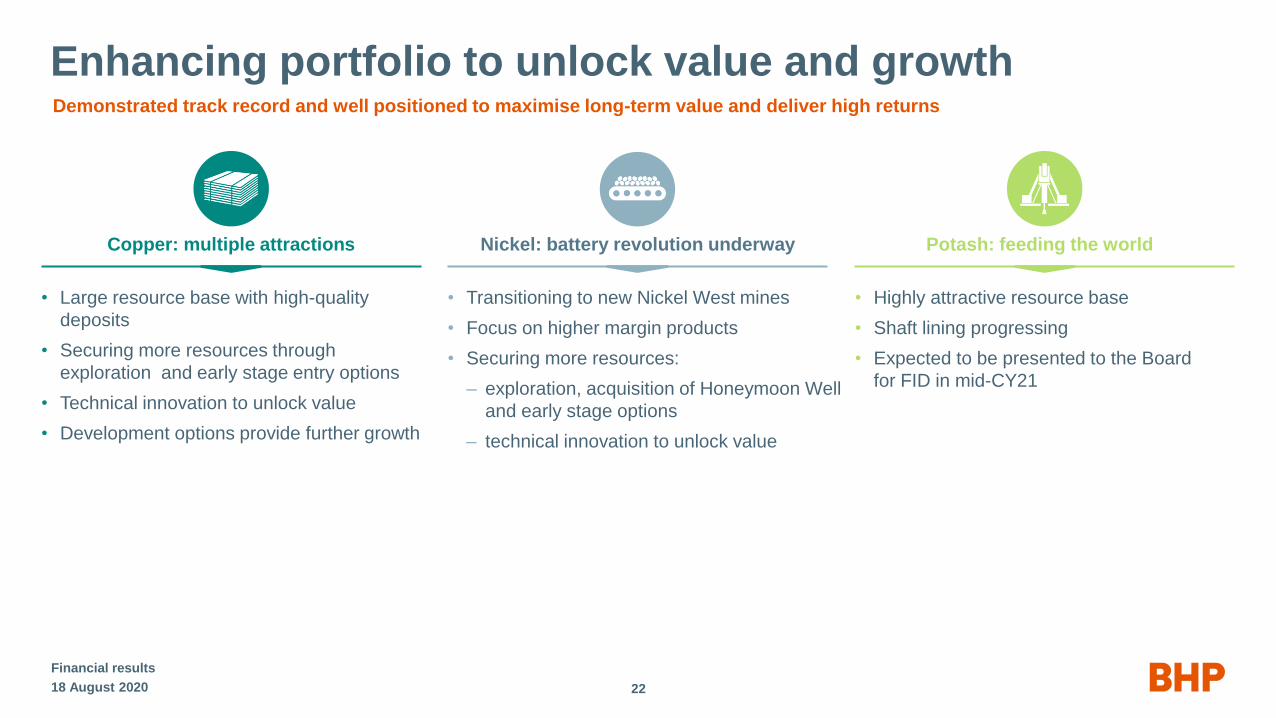
Enhancing portfolio to unlock value and growth
• Transitioning to new Nickel West mines
• Focus on higher margin products
• Securing more resources:
– exploration, acquisition of Honeymoon Well
and early stage options
– technical innovation to unlock value
• Highly attractive resource base
• Shaft lining progressing
• Expected to be presented to the Board
for FID in mid-CY21
• Large resource base with high-quality
deposits
• Securing more resources through
exploration and early stage entry options
• Technical innovation to unlock value
• Development options provide further growth
Demonstrated track record and well positioned to maximise long-term value and deliver high returns
2218 August 2020
Financial results
Nickel: battery revolution underwayCopper: multiple attractions Potash: feeding the world

Strengthening safety, performance and portfolio
18 August 2020
Financial results
23
Five levers to enable BHP to become the best operator and reliably deliver leading financial returns and social value
Bedrock of
Culture
• Right workforce; inclusive and diverse
• Strengthening leadership; increasing time in field
• Pace and urgency
Depth in
Capability
Disciplined and dynamic
Capital allocation
Technologyenabled operational
excellence and growth
Asset centricperformance focus
• Enhancing technical excellence
• Operations Services & BHP Operating System deployments
• Streamlined accountabilities
• Market responsive approach to protect and grow value
• COVID-19 impact on projects mitigated
• Counter-cyclical investing
• Restructured, refocused and streamlined
• Further autonomous haulage deployments
• Digital and data strategy defined
• Operations Committee
• Consolidated technical teams to support assets
• Lessons learnt through COVID-19

Team aligned to strategy
18 August 2020 24
Experienced team to lead culture, performance and growth
Chief Executive
Officer
Mike Henry
Chief Commercial
Officer
Vandita Pant
Chief Development
Officer
Johan van Jaarsveld
Chief External
Affairs Officer
Caroline Cox
Chief People
Officer
Athalie Williams
President
Minerals Americas
Ragnar Udd
President
Minerals Australia
Edgar Basto
President
Petroleum
Geraldine Slattery
Chief Technical
Officer
Laura Tyler
Chief Financial
Officer
David Lamont
Operations Committee
Financial Results

Low-cost producerefficiency, technology, culture
Volume growthperformance, project delivery
Positive long-termoutlook with nearer-term COVID-19
uncertainty for our commodities
Investment proposition
Financial results
25
Maximise cash flow
Net debttargeting lower end
of US$12-17 bn range
~US$7 bn capexin FY21 and ~US$8.5 bn in FY22
Organic opportunitiesrich option set across commodities
and time periods assessed on risk
and return metrics
Capital discipline
20% FY20 ROCEat spot prices
Portfoliocreating and securing options
Shareholder returns US$6.1 bn dividends
determined in FY20
Value and returns
Note: FY20 ROCE is based on spot prices as at 3 August 2020.
We have the people, assets, options, and discipline to sustainably grow long-term shareholder value and returns
18 August 2020


Appendix

Social Value scorecard
18 August 2020
Financial results
28
Category Key indicators1 FY19 H1 FY20 H2 FY20 FY20 Target
Safety & Health
Fatalities 1 0 0 0 Zero work-related fatalities
High Potential Injury (HPI) frequency
(per million hours worked)0.31 0.32 0.14 0.24
Year-on-year improvement of our HPI
frequency
Total Recordable Injury Frequency (TRIF)
(per million hours worked)4.7 4.6 3.7 4.2 Year-on-year improvement in TRIF
Environment
Operational greenhouse gas (GHG) emissions
(Mt CO2-e)15.32 7.9 7.9 15.8
Maintain FY22 operational GHG emissions
at or below FY17 levels3
Fresh water withdrawals (GL) 155.6 75.0 52.0 127.0Reduce FY22 fresh water withdrawal
by 15 per cent from FY17 levels4
Community
Social investment (US$m) 93.5 29.8 119.8 149.6No less than one per cent of pre-tax profit
(three-year rolling average)
Local procurement spend (US$m) 1,903 949 972 1,922Support the growth of local businesses in the
regions where we operate
Inclusion & Diversity
Female workforce participation (%) 24.5 24.8 26.5 26.5 Aspirational goal for gender balance by CY25
Australia Indigenous workforce participation (%) 5.6 5.8 6.5 6.5Aim to achieve 5.75 per cent by the end of
FY205
Chile Indigenous workforce participation (%) 5.9 6.3 6.6 6.6 Increase representation from prior year5
We transparently track our performance on our social value commitments and we are making good progress
1. FY19 presented on a total operations basis, except for operational GHG emissions, fresh water withdrawals and local procurement spend.
2. Operational GHG emissions have been revised subsequent to the FY19 annual report following an HSE data audit, resulting in an improvement to emissions reporting methodology for our operations in Chile; previously reported as 14.2 Mt CO2-e.
3. In FY17, our operational GHG emissions were 14.6 Mt CO2-e (excluding Onshore US). Greenhouse gas emissions are subject to final sustainability assurance review.
4. In FY17, our fresh water withdrawals were 156.1 GL (on an adjusted basis, excluding Onshore US).
5. Work is underway to establish medium term targets for Indigenous workforce participation in Australia and Chile.

Asset performance and plans
18 August 2020
Financial results
29
Note: FID – Final Investment Decision; Shenzi SSMPP – Shenzi Sub-Sea Multi-Phase Pumping; GoM – Gulf of Mexico.
Low cost operations, commercial agility, growth options
Petroleum Medium term Petroleum projects
Flexible options within current portfolio to suit market conditions
• Resilient even in a low price environment
– testing confirms no asset impairments even at US$55/bbl
• Value based deferrals in FY21: several brownfield projects, Scarborough FID
delayed to FY22, optimisation work ongoing and lower exploration spend
• Trion feasibility study phase on track as planned
Attractive opportunities with execution flexibility
• Competitive pipeline of brownfield and greenfield options
• Continue to progress exploration and appraisal discoveries
– Trinidad and Tobago discovery appraisal and development studies
– secured and expanded positions in central and western GoM
– progressed and de-risked Wildling opportunity in GoM
• Enhancing portfolio through counter-cyclical investments, strategic partnership
farm-downs and targeted divestments
85
95
105
115
0
1
2
3
FY20 FY21e FY22e MT
Capex Production(US$ billion) (MMboe)
Development
Production trend
Exploration Maintenance Deferred capital
Prior production trend
Medium term production Medium term prior production
Range
20282027202620252024202320222021CY2020
FID range First production range AppraiseExplorePrior FID range
Eastern Canada
Shenzi SSMPP
Scarborough
T&T North
Western GoM
Trion
Sanctioned
Unsanctioned
Mad Dog – Water Injection
Wildling Phase 1
Exploration
Barracouta West
Atlantis Ph3 Mad Dog Ph2
Ruby
Central GOM
MT average ~104 MMboe
~100 MMboe in FY25

0
80
160
FY14 FY15 FY16 FY17 FY18 FY19 FY20 FY21e MT
0
200
400
Production Average copper grade Expit mine movement
New concentrator throughput record of 371 ktpd
• Strong cost management
• Lower volumes in FY21 and likely in FY22 as reduced workforce will restrict
material movement
– average annual 1.2 Mt medium term guidance maintained
Sustainability advantage
• Ceased water drawdown from aquifers, 10 years ahead of target; water
consumption efficiency at concentrators increased by almost five per cent
• New more cost efficient renewables power contracts to start in FY22
0
80
160
FY14 FY15 FY16 FY17 FY18 FY19 FY20 FY21e FY22e MT
0
800
1,600
Production Concentrator head grade Expit mine movement
Escondida throughput record; Spence Growth Option progressing on budget
Asset performance and plans
Consistent performance
• Spence: strong leaching result, partially offsetting grade decline
• BOS to be fully embedded during FY21 to further improve operating
performance and to offset grade decline of 7% at Pampa Norte
Spence Growth Option on budget
• First copper: December 2020 to March 2021; ramping up over 12 months
• Will support ~300 ktpa at Spence for first four years, including current
leaching operations
• Exploring options to unlock latent capacity at leaching operations
18 August 2020
Financial results
30
Note: BOS – BHP Operating System; SGO – Spence Growth Option.
Escondida Pampa Norte
Mine development strategy to support access to higher grade(Copper production, kt) (Concentrator head grade, expit mine movement, FY14=100)
Spence volumes expected to increase to ~300 ktpa with SGO(Copper production, kt) (Average grade, expit mine movement, FY14=100)

0
1
2
3
4
5
6
0
50
100
150
200
250
300
350
FY17 FY18 FY19 FY20 FY21e FY22e FY23e FY24e
18 August 2020 31
Asset performance and plans
Nickel West
Olympic Dam and Nickel West sustainably increasing production and returns
Building strong foundations
• Estimate of Ore Reserves increased by over 90% since FY17
• Major planned maintenance and transition to Venus and Yakabindie mines complete
• Undercut at B11, BHP’s first block cave development, will be completed in Q1 FY21
Future options
• Honeymoon Well acquisition in progress
• Commence ~5,000 m of exploration drilling at Seahorse in FY21
Olympic Dam
Focused on operational stability
• Multi-year asset integrity program progressing well and tracking to plan
• Reliability to drive runtime and cost reductions across the value chain
Safe and reliable performance in the medium term
• Draw down of surplus stockpiles in FY21 following strong mine development
• Completed 400 km of underground drilling to inform resource optionality plans
• Scheduled major smelter maintenance (SCM21) in H1 FY22 will lift smelter
bottleneck in latter part of five year plan
Significant increase in nickel Ore Reserves(contained nickel, kt)
0
1,000
2,000
FY11 FY12 FY13 FY14 FY15 FY16 FY17 FY18 FY19 FY20
Proven Probable
↑ ~90% to
1,740ktNi
Financial results
Note: Refer to disclaimer on slide 2 and detailed tables for Nickel West Ore Reserves in the Appendix slides 45 to 46.
Strong Mine Performance will underpin increased production(CuEq* production, Kt) (Development, ‘0000 m; Run of Mine Stock, Mt)
* CuEq at 30 June 2020 Spot Prices for Au, Ag and U.
CuEq production (LHS)UG Development (RHS)Run of Mine (RHS)
Smelter maintenance
Target Operating Window

200
250
300
10
15
20
FY15 FY16 FY17 FY18 FY19 FY20 FY21e Mediumterm
Unit costs Production
Value growth through continuous improvement; South Flank on track for first production in mid-CY21
Asset performance and plans
Reliable delivery of record production and lower costs
• Record annualised run rate >300 Mtpa Q4 FY20
• Uplift in car dumper reliability enabled by BOS, improved maintenance
strategies and mine performance
• Autonomous truck roll-out underway at Newman East
• Continuous improvement in supply chain reliability to enable 290 Mtpa
South Flank progressing on track (76% complete)
• First production expected mid-CY21
Strong operating performance
• Record volumes at Broadmeadow, Caval Ridge and Poitrel
• Focus on improving truck and shovel productivity over the medium term to
enable continuous wash plant feed
• Autonomous truck roll-out underway at Goonyella Riverside and Daunia
• Market-responsive approach to growth
18 August 2020
Financial results
32
Strip ratio headwinds to unwind to 2025(Unit Costs, US$/t) (Prime to product strip ratio)
WAIO Queensland Coal
Unit costs below $13/t in medium term, with South Flank online(Unit costs, US$/t) (Iron ore production, Mtpa)
Q4 run rate (RHS)
0
7
14
FY14 FY15 FY16 FY17 FY18 FY19 FY20 FY21e Mediumterm
30
60
90
Unit costs Strip ratio
Notes: BOS – BHP Operating System ; FY21 and medium-term unit cost guidance are based on exchange rates of AUD/USD 0.70

Samarco and Renova FoundationResettlement remains a priority social program but progress slowed by COVID-19
18 August 2020
Financial results
33
Communities
Compensation
• BRL$2.5 billion indemnification and
financial aid paid to June 2020
• More than 10,000 general damages claims
resolved
Local support initiatives
• BRL$600 million in new funding for local
health and infrastructure around Doce
River basin, to help diversify economy,
create access to local tourist hubs
• Fund to fight COVID-19 of BRL$275 million
in the communities affected by the
Samarco dam failure
• Creation of > 6,500 jobs and prioritisation
of local workforce
Samarco restart
• Received LOC (Corrective Operating
Licence) in October 2019 - key licence
required to progress to restart with one
concentrator
• Works for construction of filtration plant
slowed by COVID-19
• Plan to restart after filtration plant
completion, provided all safety
requirements are met and final Samarco
shareholders’ approval is received
• Decommissioning plan for the two
upstream dams in the Germano complex
ongoing; works started in April 2020
Bento Rodrigues resettlement
Resettlement
• Bento Rodrigues and Paracatu:
construction of key public buildings and
houses is progressing; Gesteira: urban
plan being discussed with community
Exceptional items
18 August 2020
Financial results
34
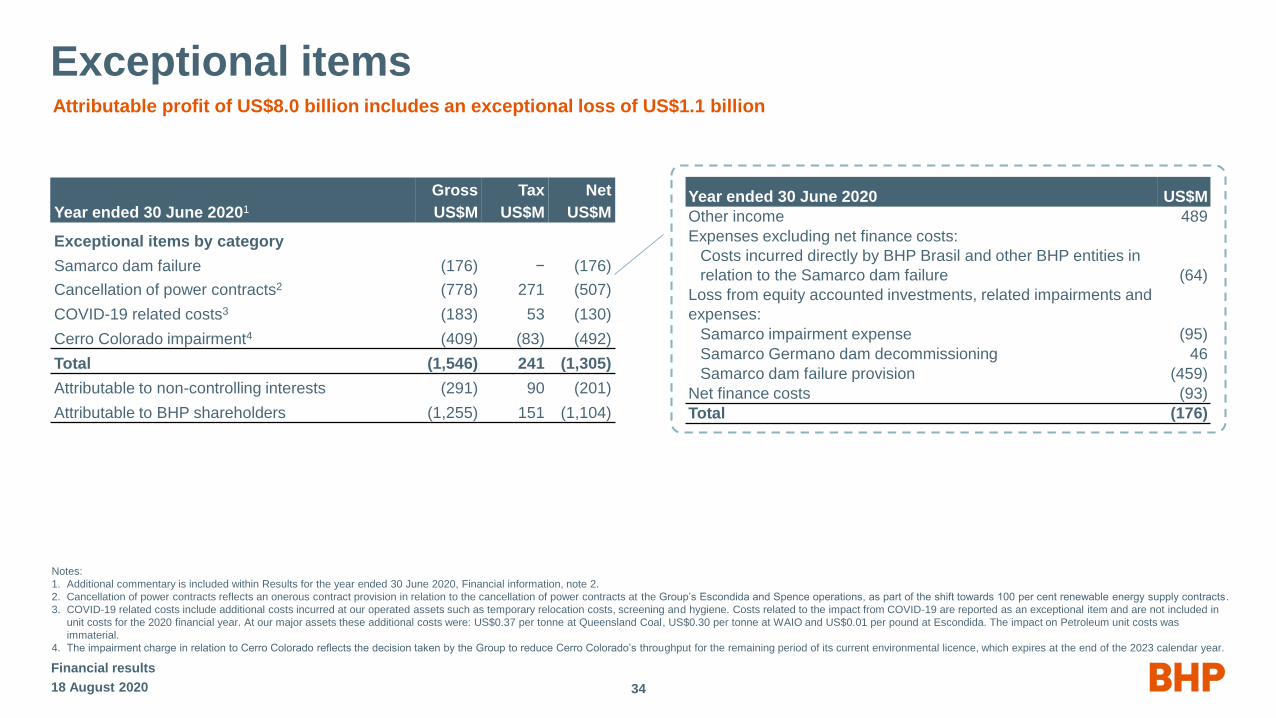
Attributable profit of US$8.0 billion includes an exceptional loss of US$1.1 billion
Year ended 30 June 20201
Gross
US$M
Tax
US$M
Net
US$M
Exceptional items by category
Samarco dam failure (176) − (176)
Cancellation of power contracts2 (778) 271 (507)
COVID-19 related costs3 (183) 53 (130)
Cerro Colorado impairment4 (409) (83) (492)
Total (1,546) 241 (1,305)
Attributable to non-controlling interests (291) 90 (201)
Attributable to BHP shareholders (1,255) 151 (1,104)
Year ended 30 June 2020 US$M
Other income 489
Expenses excluding net finance costs:
Costs incurred directly by BHP Brasil and other BHP entities in
relation to the Samarco dam failure (64)
Loss from equity accounted investments, related impairments and
expenses:
Samarco impairment expense (95)
Samarco Germano dam decommissioning 46
Samarco dam failure provision (459)
Net finance costs (93)
Total (176)
Notes:
1. Additional commentary is included within Results for the year ended 30 June 2020, Financial information, note 2.
2. Cancellation of power contracts reflects an onerous contract provision in relation to the cancellation of power contracts at the Group’s Escondida and Spence operations, as part of the shift towards 100 per cent renewable energy supply contracts.
3. COVID-19 related costs include additional costs incurred at our operated assets such as temporary relocation costs, screening and hygiene. Costs related to the impact from COVID-19 are reported as an exceptional item and are not included in
unit costs for the 2020 financial year. At our major assets these additional costs were: US$0.37 per tonne at Queensland Coal, US$0.30 per tonne at WAIO and US$0.01 per pound at Escondida. The impact on Petroleum unit costs was
immaterial.
4. The impairment charge in relation to Cerro Colorado reflects the decision taken by the Group to reduce Cerro Colorado’s throughput for the remaining period of its current environmental licence, which expires at the end of the 2023 calendar year.

Movements in working capital(US$ billion)
9.2 9.4
12.0
0.2 1.8
6.9 1.0 1.0(8.1)
0
5
10
15
FY19 Derivatives FY19restated
IFRS 16initial
recognition
Free cashflow
Dividendspaid
Dividendspaid
to NCI
Othermovements
FY20% of portfolio
11%
Subsidiaries
Asset financing 11%
3%
C$
Bonds
40% 32%
US$
Bonds4
Euro
Bonds4
Capital markets 89%
14%
Sterling
Bonds4
Movements in net debt(US$ billion)
Working capital and balance sheetNet debt of US$12.0 billion and gearing of 18.7%
Debt maturity profile3
(US$ billion)
1
2
18 August 2020
Financial results
35
Notes:
1. NCIs: dividends paid to non-controlling interests of US$1.0 billion predominantly relate to Escondida.
2. Other: Non-cash fair value movement relates to foreign exchange variance due to the revaluation of local currency denominated cash and debt to USD, movements in interest rates and impact of new and renewed leases in FY20
3. Debt maturity profile: all debt balances are represented in notional USD values and based on financial years; as at 30 June 2020; subsidiary debt is presented in accordance with IFRS 10 and IFRS 11.
4. Debt maturity profile: includes hybrid bonds (28% of portfolio: 14% in USD, 10% in Euro, 4% in Sterling) with maturity shown at first call date.
(1.0)
0.0
1.0
2.0
Chilepower
contracts
Closed sitesrehabilitation
Inventorybuild
WAIOroyalty
Pricerelatedimpacts
Other
0.6
0.8
(0.7)(0.2) (0.1)
(0.4)
Includes employee provision
movements, timing of operational
payments and embedded
derivative movements
Split broadly between increasing
operational stability and
maintenance strategies
0
2
4
6
8
FY21 FY22 FY23 FY24 FY25 FY26 FY27 FY28 FY29 FY30 PostFY30

No material impact on NPAT; calculation of minimum dividend unaffected
Net debt: definition and IFRS 16
IFRS16
Key impacts
of IFRS 16
on Net Debt1
Net debt
definition
• Removes distinction between operating and finance leases; introduces new identification criteria
• Results in operating leases being recognised on balance sheet; no change to treatment of existing finance leases
• No change to underlying cash flows
• Short term, variable payment and low-value leases will remain off-balance sheet and continue to be recorded as operating expenses
Operating lease commitments brought onto balance sheet from 1 July 2019
18 August 2020
Financial results
36
• Net debt target range US$12-17 bn
– changes in net debt definition to include debt-related derivatives of ~US$0.2 bn on 1 July 2019 (unrelated to IFRS 16)
– reviewed definition and, from 1 January 2020, excluded vessel lease contracts (arising from IFRS 16) that are priced with reference to a
freight index to reduce net debt volatility for decision making in relation to the Capital Allocation Framework (31 December 2019 restated for
comparative purposes)
Note:
1. Excludes existing finance leases and index-priced vessel leases (including Continuous Voyage Charter contracts that reference the volatile C5 Dry Baltic freight index and are remeasured at each period end).
• Lease liability FY20 – US$1.6 bn increase
– initial recognition of ~US$1.8 bn on 1 July 2019
– additional new leases commencing in FY20 ~US$0.4 bn
increase
– lease payments ~US$0.5 bn decrease
• Lease Liability FY21
– additional new leases commencing in FY21 and renewals of
existing lease arrangements (~US$1.3 bn increase, including the
SGO desalination plant lease of ~US$0.6 bn)
– lease payments ~US$0.6 bn decrease

IFRS 16 Leases: FY20 impacts
Balance sheet1 Income statement Cash flow statement Disclosures Financial metrics
Right of use assets
(PP&E)
US$2.8 bn1
Lease liabilities
(Interest bearing liabilities)
US$2.8 bn2
Operating costs
US$0.6 bn
EBITDA
US$0.6 bn
Depreciation
US$0.6 bn
Interest
US$0.04 bn
Operating cash outflow
US$0.6 bn
Investing cash flow
no impact
Financing cash outflow
US$0.6 bn
Operating lease
commitments (IAS 17)
~US$1.9 bn
Short term, variable, low
value leases
Net debt
US$1.6 bn
EBITDA margin
2%
No impact on
net cash flows
No material impact on
income statement
Accounting change only; no impact to net cash flows
Unit cash costs
2-4% (no change to guidance)
ROCE
negligible impact
Gearing
2%3
18 August 2020
Financial results
37
Notes:
1. As at 30 June 2020. Excludes decrease for change in classification of onerous lease provisions on implementation of IFRS 16 and reclassification to receivable of sub-leased assets.
2. Includes index-priced vessel liabilities of ~US$1.2 bn.
3. Gearing at 30 June 2020 adjusted to exclude IFRS 16 is 16.6 %.

IFRS 16 Leases: FY20 impacts
38
Accounting changes only, no impact to net cash flows
WAIO2
Queensland Coal2
Escondida2
Petroleum2
Marketing/G&U3
Group
Notes:
1. Difference between depreciation impact and EBITDA reflects interest impact and differences between profile of depreciation and lease payments.
2. Impact primarily relates to other leases (including mining and other equipment, rigs and accommodation). There is no change to the treatment of intercompany freight expenses that are allocated from G&U.
3. Impact primarily relates to freight contracts and office buildings. Freight costs are no longer included in underlying EBITDA for G&U, as operating leases are now recognised on the balance sheet with associated depreciation and interest charges expensed over the term of the lease.
There is no change to how the expense is allocated to and recorded within assets.
Unit cost
No change to unit
cost guidance
3%
4%
2%
2%
Balance sheet
Lease liabilities
US$2.8 bn
US$0.12 bn
US$0.15 bn
US$0.06 bn
US$0.41 bn
US$1.78 bn
Income statement
Depreciation1
US$0.6 bn
US$0.05 bn
US$0.12 bn
US$0.01 bn
US$0.03 bn
US$0.33 bn
EBITDA1
US$0.6 bn
US$0.08 bn
US$0.12 bn
US$0.03 bn
US$0.02 bn
US$0.29 bn
Other US$0.32 bn US$0.08 bn US$0.07 bn
18 August 2020
Financial results

Jansen Stage 1 Scarborough
Saskatchewan, Canada Australia
Shaft equipping, mine development, processing facility, site
infrastructure and outbound logistics
13 subsea wells tied back to a semisubmersible FPU2; dry gas
pipeline ~435 km in length transports dry gas from the FPU to
the onshore LNG plant at Pluto
Operator BHP Woodside (73.5%)
BHP ownership 100% 26.5%
Capex (US$m)
5,300 – 5,700
Sustaining capital ~US$15/t (real) long term average;
+/- 20% in any given year
1,400 – 1,900 (BHP share)
Phase / timingFeasibility study phase
Final investment decision expected mid-CY21
Feasibility study phase
Final investment decision expected H2 CY21
First production / Project
delivery
~5 years construction timeframe
~2 years from first production to ramp upFY25 onwards
Volumes 4.3 – 4.5 Mtpa (Potassium chloride, KCL)6.5 Mtpa (100% basis, LNG); and
160 MMscf/d (100% basis at peak, domestic gas)
Other considerations
6% royalty
Federal and Provincial Corporate income tax and Potash
Production Tax1
Jansen Stage 1 expected mine life of 100 years
Non-binding Heads of Agreement signed in November 2019,
which, amongst other terms, includes agreement on a
competitive tariff for gas processing through the Pluto LNG
facility.
Projects in feasibility
18 August 2020
Financial results
39
1. Tax consideration for Jansen Stage 1 project includes Royalties, Federal and Provincial Corporate Income taxes, and Potash Production Tax (PPT). Withholding tax on dividend payments under the current corporate structure is 5%.
2. FPU: Floating production unit.

Technology
18 August 2020
Financial results
40
Streamlined, more effective and nimble function leading charge to solve asset challenges
Innovation Best of technologies to improve
performance and safety trialled at BHP
Innovation Centre in Newman, rolled
out at scale
Testing grounds
RestructuredReorientated to apply technology more
effectively – more quickly and at scale.
30% reduction in overhead costs and
35% reduction in workforce
Effectiveness
Collaboration Shift to strategic partnerships to access
cross-industry expertise, with focus on
technology, manufacturing, mining
services and start-ups
Partnerships
IntegrationCIO live in Santiago in July 2019;
follows centres in coal and iron ore
Remote operating
Asset centricDigital centres focused on advanced
analytics, decision automation being
rolled out. First launched in coal, 3 more
planned for major assets by end CY21
Machine learning
4 sites3 more approved across iron ore, coal for
conversion to autonomous haulage since
late 2019. Drills being converted, trucks
under study at Escondida and Spence
Automation
Note: CIO - Copper Integrated Operations.

Improving through standardisation and ways of working
18 August 2020
Financial results
41
Maintenance and Engineering Centre of Excellence (MECoE) Operations Services (OS)
Combines advanced planning capability, defect elimination and value
analytics to deliver exceptional performance
MECoE partnered with Iron Ore Port and Rail teams to optimise supply chain
performance
• Enabled 300 Mtpa inflow run-rate in Q4 through availability uplift and
improved process cycle time (+10%)
• 5% increase in maintenance plan adherence, removing rework and
improving stability
• 35% improvement in shutdown duration compliance over past two years
• Unlocked Port capacity by utilising more reliable and higher performing
product pathways, identified through advanced analytic techniques
Empowering our people to continuously improve through standardised systems, processes and ways of working
Established in 2018 with a focus on culture and sustainability improvements
• Diverse hiring focus with 34% female representation, up 8% in FY20
• OS specific training increased hazard identification by up to 25%
Enabler for operational excellence through focus on skills uplift
• 13% reduction in average unscheduled equipment downtime
• 5% reduction in key production equipment delays and variability in delays 3%
• 7% increase in truck utilisation compared to non-OS operations
• Lower cost through local hiring and productivity improvements
Improved labour productivity at operations with OS deployed (Indexed non-OS baseline, $/equivalent movement1)
Advanced maintenance practices lifting iron ore throughput(Mtpa run rate) (Availability uplift, index Q1 FY19=100)
Coal:Maintenance
Iron Ore:Maintenance
Coal:Production
Iron Ore:Production
Baseline OS
↓ 22%↓ 16%
↓ 12%
↓ 17%
95
100
105
110
115
220
245
270
295
320
Q1 FY19 Q2 FY19 Q3 FY19 Q4 FY19 Q1 FY20 Q2 FY20 Q3 FY20 Q4 FY20
Inflow run-rate Car dumper availability
Note: Equivalent movement represents material moved (i.e. tonnes of iron ore or BCM of coal).
Maintenance improvement achieved through an uplift in equipment availability to deliver higher volumes.

BHP guidance
Group FY21e FY22e
Capital and exploration expenditure (US$bn) ~7 ~8.5 Cash basis.
Including:
Maintenance 2.1 Includes non-discretionary capital expenditure to maintain asset integrity, reduce risks and meet compliance requirements. Also includes
capitalised deferred development and production stripping (FY21e: US$0.8 billion). Includes US$0.1 billion for petroleum.
Improvement 2.5Includes Petroleum infill drilling and South Flank.
Latent capacity 0.2 Includes WAIO to 290 Mtpa and West Barracouta.
Major growth 1.5 Includes Spence Growth Option, Mad Dog Phase 2, Jansen, Ruby and Atlantis Phase 3.
Exploration 0.7 Includes US$0.45 billion Petroleum and ~US$60 million Copper exploration programs planned for FY21.
Petroleum FY21e Medium term
Petroleum production (MMboe) 95-102 ~104 Decline of ~1.5% p.a. over medium term includes projects yet to be sanctioned. ~104 MMboe represents average over medium term.
~100 MMboe is expected in FY25
Capital expenditure (US$bn) 1.2 Sanctioned Capex
(BHP share)
First production Production
(100% basis at peak)
Mad Dog Phase 2 February 2017 US$2.2 bn CY22 140,000 boe/d
West Barracouta December 2018 ~US$140 m CY21 104 MMscf/d
Atlantis Phase 3 February 2019 ~US$700 m CY20 38,000 boe/d
Ruby August 2019 ~US$340 m(~US$280 m excl. pre-commitment)
CY21 16,000 bopd (oil) and
80 MMscf/d (gas)
Exploration expenditure (US$m) ~450 Focused on Trinidad & Tobago and the US Gulf of Mexico.
Unit cost (US$/boe) 11 – 12 <13 Costs to increase in medium term as a result of natural field decline. Excludes inventory movements, embedded derivatives movements,
freight, third party product purchases and exploration expense. Based on exchange rate of AUD/USD 0.70.
18 August 2020
Financial results
42

BHP guidance (continued)
Copper FY21e Medium term
Copper production (kt) 1,480 – 1,645 Escondida: 940 – 1,030 kt; Olympic Dam: 180 – 205 kt; Pampa Norte 240 – 270 kt; Antamina: 120 – 140 kt (zinc 140 – 160 kt).
Capital and exploration expenditure (US$bn) 2.3 Includes ~US$60 million exploration expenditure.
Sanctioned Capex
(BHP share)
First production Production
(100% basis)
Spence Growth Option August 2017 US$2.46 bn December 2020 –March
2021
~185 ktpa of
incremental copper
(over first 10 years)
Escondida
Copper production (kt, 100% basis) 940 – 1,030 ~1,200 ~1,200 kt represents average per annum over medium term.
Unit cash costs (US$/lb) 1 – 1.25 <1.10 Excludes freight; net of by-product credits; based on an exchange rate of USD/CLP 769.
Iron Ore FY21e Medium term
Iron ore production (Mt) 244 – 253 Excludes production from Samarco. Major maintenance campaign on car dumper 3 planned for September 2020 quarter.
Capital and exploration expenditure (US$bn) 1.6 Sanctioned Capex
(BHP share)
First production Production
(100% basis)
South Flank June 2018 US$3.1 bn Mid-CY21 80 Mtpa sustaining mine
Western Australia Iron Ore
Iron ore production (Mt, 100% basis) 276 – 286 290
Unit cash costs (US$/t) 13 – 14 <13 Excludes freight and government royalties; based on an exchange rate of AUD/USD 0.70.
Sustaining capital expenditure (US$/t) ~4 Medium term average; +/- 50% in any given year. Includes South Flank; Excludes costs associated with automation programs.
18 August 2020
Financial results
43

BHP guidance (continued)
18 August 2020
Financial results
44
Coal FY21e Medium term
Metallurgical coal production (Mt) 40 – 44 46 – 52 Expected deterioration in market outlook due to the impact of COVID-19.
Energy coal production (Mt) 22 – 24 NSWEC: 15 – 17 Mt; Cerrejón: ~7 Mt.
Capital and exploration expenditure (US$bn) 0.7
Queensland Coal
Production (Mt, 100% basis) 71 – 77
Unit cash costs (US$/t) 69 – 75 58 – 66 Excludes freight and royalties; based on an exchange rate of AUD/USD 0.70.
Sustaining capital expenditure (US$/t) ~9 Medium term average; +/- 50% in any given year. Excludes costs associated with automation programs.
Other FY21e
Other capex (US$bn) 0.6 Includes Nickel West and Jansen.
Including: Jansen current scope (US$m) ~285

Key Underlying EBITDA sensitivities
Approximate impact1 on FY21 Underlying EBITDA of changes of: US$ million
US$1/t on iron ore price2 233
US$1/bbl on oil price3 32
US$1/t on metallurgical coal price 37
US¢1/lb on copper price2 32
US$1/t on energy coal price2 16
US¢1/lb on nickel price 1.6
AUD (US¢1/A$) operations4 124
CLP (US¢1/CLP) operations4 32
18 August 2020
Financial results
45
Notes:
1. EBITDA sensitivities: assumes total volume exposed to price; determined on the basis of BHP’s existing portfolio.
2. EBITDA sensitivities: excludes impact of equity accounted investments.
3. EBITDA sensitivities: excludes impact of change in input costs across the Group.
4. EBITDA sensitivities: based on average exchange rate for the period

Ore Reserves - Competent Person Statement
46
Deposit (1) (2) (3) Cut-off Ore TypeProved Ore Reserves Probable Ore Reserves Total Ore Reserves Reserve
Life
(years)
BHP
Interest
%Mt %Ni Mt %Ni Mt %Ni ktNi metal
Leinster (4)(5) ≥0.40%Ni OC 3.5 0.74 1.8 0.66 5.3 0.72 38 8 100
≥0.90%Ni UG – – 5.1 1.6 5.1 1.6 82
SP – – 0.89 0.75 0.89 0.75 7
Mt Keith (6) Variable between 0.35%Ni and 0.40%Ni
and ≥ 0.18% recoverable Ni
OC 65 0.57 19 0.55 84 0.57 479 15 100
SP 6.2 0.58 0.90 0.45 7.1 0.58 41
Cliffs (7) ≥1.2%Ni UG 0.10 1.9 1.0 2.0 1.1 2.0 22 4 100
Yakabindie (8) ≥0.35%Ni OP 119 0.56 44 0.61 163 0.57 929 15 100
Venus (9) ≥0.9%Ni UG – – 9.3 1.5 9.3 1.5 140 13 100
Competent Person Statement
The information in this presentation that relates to Nickel West Ore Reserves estimate as at 30 June 2020 is based on information prepared by the Competent Persons for each deposit in accordance with the Australian Securities Exchange Listing Rules Chapter t
2014 and Australasian Code for Reporting of Exploration Results, Mineral Resources and Ore Reserves, December 2012 (JORC Code). The Competent Persons are C Barclay for Leinster, Cliffs and Venus; D Brosztl and C Barclay for Mt Keith and Yakabindie.
M Menicheli is the Competent Person compiling the BHP Nickel West Ore Reserve figures from FY2011 to FY2019. The FY2011 and FY2012 Ore Reserves were first reported by the Company in accordance with the ‘Australasian Code for Reporting of Exploration
Results, Mineral Resources and Ore Reserves, 2004 and from FY2013 to FY2019 were first reported by the Company in accordance with the ‘Australasian Code for Reporting of Exploration Results, Mineral Resources and Ore Reserves, December 2012’ in the
respective BHP and BHP Billiton Annual Reports, available to view on www.bhp.com.
All Competent Persons listed above are full-time employees of BHP and are current Members of the Australasian Institute of Mining and Metallurgy (MAusIMM). All Competent Persons have sufficient experience relevant to the style of mineralisation and type of
deposit under consideration and to the activity which they are undertaking to qualify as a Competent Person as defined in the 2012 Edition of the ‘Australasian Code for Reporting of Exploration Results, Mineral Resources and Ore Reserves’. All Competent Persons
consent to the inclusion in this presentation of the matters based on their information in the form and context in which it appears.
Ore Reserves
Ore Reserves as presented are estimates reported in 100 per cent terms. All tonnes and quality information have been rounded, hence small differences may be present in the totals. No metallurgical recoveries have been applied to the calculation of contained nickel
metal. Drill spacing used to define Ore Reserves classification and metallurgical recoveries are presented in footnotes (1) and (3) respectively. Total Ore Reserves presented in the graph on slide 31 is based on totals tabled on slide 46.
Nickel West Ore Reserves as at 30 June 2020
(1) Approximate drill hole spacings used to classify the reserves were:
Deposit Proved Reserves Probable Reserves
Leinster 25m × 25m 25m × 50m
Mt Keith 40m × 40m 80m × 80m
Cliffs 25m × 25m (and development) 25m × 25m
Yakabindie 40m × 60m 80m × 60m
Venus 25m x 25m 50m x 50m
(2) Ore delivered to the process plant.
(3) Metallurgical recoveries for the operations were:
Deposit Metallurgical Recovery
Leinster Leinster UG: Approximately 88%, Leinster OC: Approximately 80%
Mt Keith 63%
Cliffs 83%
Yakabindie 63%
Venus 88%
(4) Leinster - Ore Reserves includes operations and projects.
(5) Leinster - The increase in OC Ore Reserves was due to improved resource classification which enabled increase conversion to
Ore Reserve. The decrease in the Reserve Life was due to an increase in the nominated production rate from 0.6Mtpa to 1.4Mtpa.
Incorporated within the Reserve Life calculation were OC and UG ore types, which contribute 3 years and 8 years respectively.
(6) Mt Keith - The decrease in Ore Reserves was mainly due to depletion. The increase in Reserve Life was due to decrease in
nominated production rate from 8Mtpa to 6Mtpa.
(7) Cliffs - The increase in Ore Reserves and Reserve Life was mainly due to an update in the mine design.
(8) Yakabindie - The increase in Ore Reserves was mainly due to an update in mine design.
(9) Venus – The increase in Ore Reserves and Reserve Life was mainly due to changes in mining method from Longhole Open
Stope to Sub-Level Cave.
18 August 2020
Financial results

Nickel West Total FY2011 to FY2020 Ore Reserves (100% basis)
47
Deposit
Financial
Year
Proved Ore Reserves (Mt) Probable Ore Reserves(Mt) Total Ore Reserves BHP
Interest
%Mt %Ni Mt %Ni Mt %Ni ktNi
Nickel West
2020 194 0.57 82 0.78 276 0.63 1740 100
2019 182 0.57 77 0.73 258 0.61 1580 100
2018 78 0.60 52 0.73 130 0.66 852 100
2017 86 0.62 49 0.74 135 0.66 896 100
2016 42 0.64 7 0.77 49 0.66 323 100
2015 53 0.65 5 0.76 58 0.67 388 100
2014 97 0.63 14 0.64 111 0.64 706 100
2013 106 0.68 21 0.90 127 0.72 913 100
2012 115 0.64 27 0.89 142 0.68 969 100
2011 141 0.62 17 1.36 158 0.70 1110 100
18 August 2020
Financial results

Footnotes
18 August 2020
Financial results
48
1. Slide 7: High Potential Injury frequency: number of injuries from events where there was the potential for a fatality per million hours worked, presented on a total operations basis.
2. Slide 7: Based on the copper equivalent for major assets (Queensland Coal, WAIO, Petroleum and Escondida).
3. Slide 10: Adjusted effective tax rate and Adjusted effective tax rate incl. royalties: excludes the influence of exchange rate movements and exceptional items.
4. Slide 11: Price: net of price-linked costs.
5. Slide 11: Controllable cash costs: Strong cost performance driven by consumption efficiencies at Escondida, net favourable inventory movements across our assets in line with mine plans and planned rebuilds for operational stability following drawdowns in the prior year supported
by further reduction in overheads. This was partially offset by increased planned maintenance activities at a number of our assets during the year.
6. Slide 12: Segment EBITDA: percentage contribution to Group Underlying EBITDA, excluding Group and unallocated items (G&U includes Potash, Nickel West and closed mines previously reported in Petroleum reportable segment). Energy coal and Nickel have not been presented.
7. Slide 12: Iron ore: unit cost, C1 unit cost excluding third party royalties, EBITDA margin and ROCE refer to Western Australia Iron Ore.
8. Slide 12: WAIO C1 cost: excludes third party royalties, exploration expenses, depletion of production stripping, demurrage, exchange rate gains/losses, net inventory movements and other income.
9. Slide 12: Petroleum: EBITDA margin excludes closed mines which is now reported within Group and unallocated items. ROCE excludes exploration and closed mines which is now reported within Group and unallocated items.
10. Slide 12: FY21 and medium-term unit cost guidance are based on exchange rates of AUD/USD 0.70 and USD/CLP 769. Average exchange rates for FY20 of AUD/USD 0.67 and USD/CLP 771. FY20 unit costs at guidance exchange rates of AUD/USD 0.70 and USD/CLP 683.
11. Slide 14: Dividend: represents final dividend determined by the Board for FY19 and paid in September 2019, and interim dividend determined by the Board for H1 FY20 and paid in March 2020.
12. Slide 14: NCIs: dividends paid to non-controlling interests of US$1 billion predominantly relate to Escondida.
13. Slide 15: Shareholder returns: dividends determined since FY16.
14. Slide 15: Prior period comparatives have been restated to reflect the change in net debt calculation. Net debt was restated from US$9.2 billion to US$9.4 billion as at 30 June 2019.
15. Slide 16: WAIO, Cerrejón, NSWEC & Petroleum Exploration: ROCE truncated for illustrative purposes.
16. Slide 16: Antamina and Cerrejón: equity accounted investments; average capital employed represents BHP’s equity interest.
17. Slide 16: External factors is not a comprehensive list of possible drivers for ROCE balances. Assets may have several external factors that impact the balance; this key is highlighting the largest external influence to the ROCE balance in FY20.
18. Slide 20: Food security threatened by land degradation, water quality and availability, climate change impacts.
19. Slide 20: Steep disincentive pricing (e.g. carbon price, taxes on non-sustainable forestry, nitrogen fertiliser run-off).


