197
I N T E R N A T I O N A L M O N E T A R Y F U N D
I n t e r n a t I o n a l M o n e t a r y F u n d
Financial Sector Taxation:
The IMF’s Report to the G-20
and Background Material
Editors:
Stijn Claessens, Michael Keen, and Ceyla Pazarbasioglu
International Monetary Fund
September 2010

Acknowledgements: Chapter 1 of this collection reproduces the report that was prepared at the request of the G-20 for their Heads of State Meeting in Toronto, June 2010. The report was prepared by an IMF staff team consisting of Stijn Claessens, Gianni De Nicolò, Giovanni Dell’Ariccia, David Hoelscher, Gregorio Impavido, Michael Keen, Manmohan Kumar, Luc Laeven, Michael Moore, Ceyla Pazarbasioglu, Victoria Perry, Lev Ratnovski, Nancy Rawlings, and Daehaeng Kim. The project was directed by John Lipsky, Olivier Blanchard, Carlo Cottarelli, and José Viñals. Many participants in several workshops, government officials, representatives of civil society organizations and of financial institutions, and others contributed valuable inputs and comments. The effort also benefitted from comments provided on the IMF website. The editors would like to thank Helen Hwang for her extensive work in producing the document. Disclaimer: The views expressed in this book are those of the authors and should not be reported as or attributed to the International Monetary Fund, its Executive Board, or the governments of any of its members.
i
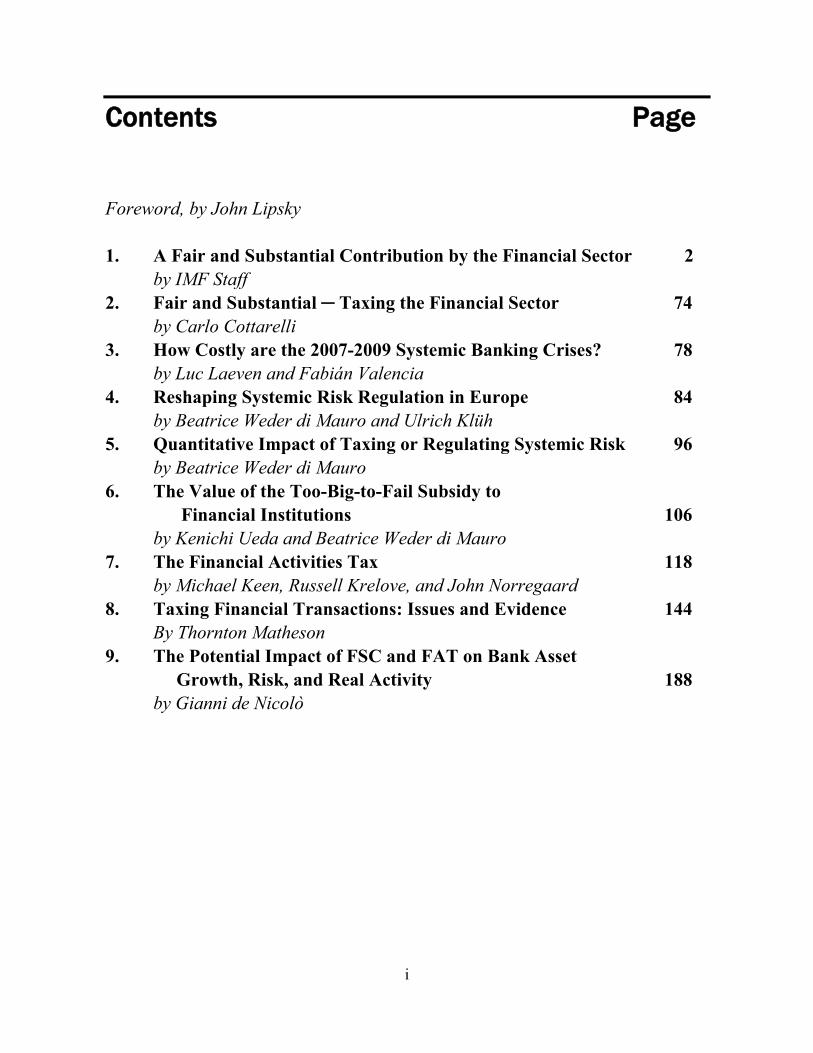
Contents Page Foreword, by John Lipsky
1. A Fair and Substantial Contribution by the Financial Sector 2 by IMF Staff 2. Fair and Substantial ─ Taxing the Financial Sector 74
by Carlo Cottarelli 3. How Costly are the 2007-2009 Systemic Banking Crises? 78
by Luc Laeven and Fabián Valencia 4. Reshaping Systemic Risk Regulation in Europe 84
by Beatrice Weder di Mauro and Ulrich Klüh 5. Quantitative Impact of Taxing or Regulating Systemic Risk 96
by Beatrice Weder di Mauro 6. The Value of the Too-Big-to-Fail Subsidy to Financial Institutions 106
by Kenichi Ueda and Beatrice Weder di Mauro 7. The Financial Activities Tax 118
by Michael Keen, Russell Krelove, and John Norregaard 8. Taxing Financial Transactions: Issues and Evidence 144
By Thornton Matheson 9. The Potential Impact of FSC and FAT on Bank Asset
Growth, Risk, and Real Activity 188 by Gianni de Nicolò

ii

iii
Foreword At their September 2009 Pittsburgh Summit, G20 Leaders requested the International Monetary Fund to prepare a report on how the financial sector could make a ‘fair and substantial contribution’ to meeting the costs associated with government interventions to repair it. In response, a talented team of Fund experts was assembled, recognizing both the topic’s importance and the analytical challenge it posed. The question of how best to reconfigure the tax system to serve this purpose – while aligning it with a regulatory regime that itself is under significant reforms – goes to the core of the difficulties faced in dealing with financial system failures. Surprisingly, previous academic work and policy debates provided very little guidance in this critical subject. Moreover, the issue was – and remains – both politically charged and highly controversial. This made the project one of the most difficult and fascinating that the IMF has undertaken in recent years. The report that we delivered to the G20 Leaders Toronto Summit provided a concise summary of our analysis and views. Not surprisingly, policymakers’ reactions varied widely – in some countries, policies are being implemented along the lines suggested. In other cases, the proposals were met with strong objections. Our final report was based on extensive background work – more than could be accommodated in the appendices. This publication combines the final report to the Leaders with the complete supporting work. The additional material addresses in some detail a series of important issues, including:
Calculating the best level/rate of a Financial Stability Contribution. Combining such a Contribution with other reforms, such as higher capital adequacy
requirements. Treating cross-border activities under a Financial Activities Tax. Evaluating the efficiency of financial transaction taxes.
Our goal in assembling this material is to encourage and support further analysis of financial sector tax issues. While the subject remains challenging, it merits sustained study. We hope that our contribution will be useful. John Lipsky First Deputy Managing Director International Monetary Fund September 2010

1
Financial Sector Taxation: The IMF’s Report to the G-20 and Background Material
2
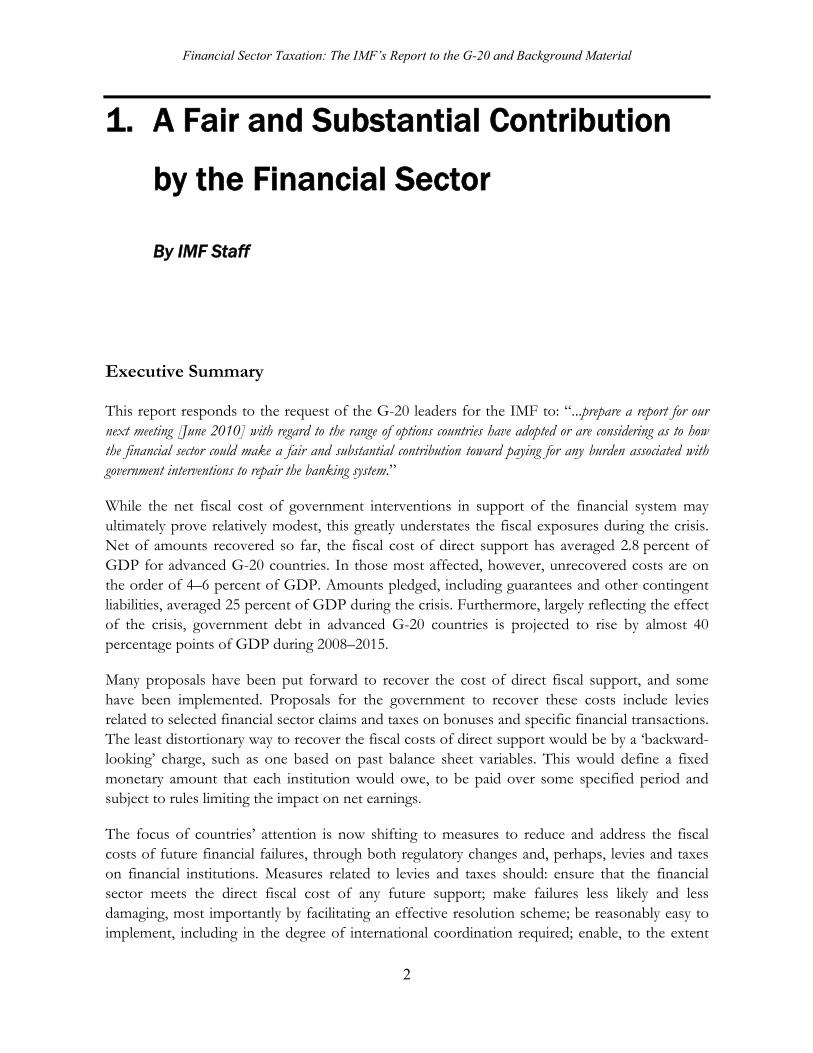
1. A Fair and Substantial Contribution
by the Financial Sector
By IMF Staff Executive Summary This report responds to the request of the G-20 leaders for the IMF to: “...prepare a report for our next meeting [June 2010] with regard to the range of options countries have adopted or are considering as to how the financial sector could make a fair and substantial contribution toward paying for any burden associated with government interventions to repair the banking system.”
While the net fiscal cost of government interventions in support of the financial system may ultimately prove relatively modest, this greatly understates the fiscal exposures during the crisis. Net of amounts recovered so far, the fiscal cost of direct support has averaged 2.8 percent of GDP for advanced G-20 countries. In those most affected, however, unrecovered costs are on the order of 4–6 percent of GDP. Amounts pledged, including guarantees and other contingent liabilities, averaged 25 percent of GDP during the crisis. Furthermore, largely reflecting the effect of the crisis, government debt in advanced G-20 countries is projected to rise by almost 40 percentage points of GDP during 2008–2015.
Many proposals have been put forward to recover the cost of direct fiscal support, and some have been implemented. Proposals for the government to recover these costs include levies related to selected financial sector claims and taxes on bonuses and specific financial transactions. The least distortionary way to recover the fiscal costs of direct support would be by a ‘backward-looking’ charge, such as one based on past balance sheet variables. This would define a fixed monetary amount that each institution would owe, to be paid over some specified period and subject to rules limiting the impact on net earnings.
The focus of countries’ attention is now shifting to measures to reduce and address the fiscal costs of future financial failures, through both regulatory changes and, perhaps, levies and taxes on financial institutions. Measures related to levies and taxes should: ensure that the financial sector meets the direct fiscal cost of any future support; make failures less likely and less damaging, most importantly by facilitating an effective resolution scheme; be reasonably easy to implement, including in the degree of international coordination required; enable, to the extent
Financial Sector Taxation: The IMF’s Report to the G-20 and Background Material
3
desired, an additional fiscal contribution from the financial sector to recognize that the costs to countries of crises exceed the fiscal cost of direct support; and address existing tax distortions at odds with financial stability concerns. A package of measures may be needed to attain these objectives.
Measures that impose new costs on financial institutions will need to reflect and be coordinated with regulatory changes under consideration. This is critical for ensuring policy coherence, enabling market participants to plan accordingly, and avoiding adverse effects on economic growth from placing an excessive burden on the financial sector.
After analyzing various options, this report proposes two forms of contribution from the financial sector, serving distinct purposes:
A “Financial Stability Contribution” (FSC) linked to a credible and effective resolution mechanism. The main component of the FSC would be a levy to pay for the fiscal cost of any future government support to the sector. This could either accumulate in a fund to facilitate the resolution of weak institutions or be paid into general revenue. The FSC would be paid by all financial institutions, initially levied at a flat rate (varying though by type of financial institutions) but refined thereafter to reflect individual institutions’ riskiness and contributions to systemic risk—such as those related to size, interconnectedness and substitutability—and variations in overall risk over time.
Any further contribution from the financial sector that is desired should be raised by a “Financial Activities Tax” (FAT) levied on the sum of the profits and remuneration of financial institutions, and paid to general revenue.
International cooperation would be beneficial, particularly in the context of cross-border financial institutions. Countries’ experiences in the recent crisis differ widely, and so do their priorities as they emerge from it. But none is immune from the risk of future failures and crises. Unilateral actions by governments risk being undermined by tax and regulatory arbitrage. Effective cooperation does not require full uniformity, but agreement on broad principles, including the bases and minimum rates of the FSC and FAT. Cooperation would promote a level playing field, especially for closely integrated markets, and greatly facilitate the resolution of cross-border institutions when needed. Risk adjustment of the FSC would facilitate wide participation in its adoption, providing some automatic adjustment for countries’ and institutions’ varying circumstances. Countries without contribution schemes should avoid actions that undermine the effectiveness of schemes implemented elsewhere.
Actions are also needed to reduce current tax distortions that run counter to regulatory and stability objectives. The pervasive tax bias in favor of debt finance (through the deductibility of interest but not the return to equity under most corporate tax regimes) could be addressed by a range of reforms, as some countries have already done. Aggressive tax planning in the financial sector could be addressed more firmly.
Financial Sector Taxation: The IMF’s Report to the G-20 and Background Material
4
1.1 Introduction This report responds to the request of the G-20 leaders, at the 2009 Pittsburgh summit, for the IMF to: “...prepare a report for our next meeting [June 2010] with regard to the range of options countries have adopted or are considering as to how the financial sector could make a fair and substantial contribution toward paying for any burden associated with government interventions to repair the banking system.” In doing so, it also reflects the call made by G-20 ministers and central bank governors in April 2010, to whom an interim report was presented, for the IMF to undertake “further work on options to ensure domestic financial institutions bear the burden of any extraordinary government interventions where they occur, address their excessive risk taking and help promote a level playing field, taking into consideration individual country’s circumstances.”
The backdrop to this work is a fragile economic recovery and an active, full agenda for financial sector regulatory reform. This makes it important that possible changes to tax arrangements for financial institutions be considered in conjunction with proposed regulatory reforms to ensure policy coherence, enable market participants to plan accordingly, and avoid adverse effects on financial intermediation and growth from placing an excessive burden on the financial sector.
The report benefitted from survey responses from G-20 members, and discussions with officials, industry and civil society. Section II assesses the costs of the recent crisis, with specific reference to the cost of direct fiscal support provided to the financial sector, and evaluates the measures adopted and considered by countries in its wake. Section III focuses on future failures and crises, developing objectives against which to evaluate potential measures to limit and cover their fiscal cost, and assessing specific options. Section IV proposes a way forward. Supporting material and further discussion are provided in appendices.
1.2 The Recent Crisis: Public Support Provided and Measures to Recover It
1.2.1 Public Support Provided
The financial crisis required many G-20 governments to provide extensive support to their financial sectors, especially in advanced countries.1 Measures included capital injections, asset purchase and protection schemes, guarantees, provision of liquidity and other support by central banks, and expanded deposit insurance coverage. Reflecting its origin, advanced economies—a few in particular—were more affected by the crisis than most emerging economies.
In the advanced G-20 economies, pledged public support was massive, but was used only in part, and is in part being repaid. Excluding guarantees (some 11 percent of advanced G-20 GDP); resources made available for direct government support averaged about 6.2 percent of GDP. Reflecting the return of market confidence that it helped encourage, however, much of this pledged support was not used, and gross direct support amounted to 3.5 percent of GDP. This
1Appendix 1 provides a more detailed analysis.
Financial Sector Taxation: The IMF’s Report to the G-20 and Background Material
5
cost has been reduced by repayments and fees paid by banks (for example, for asset protection schemes and the provision of guarantees and deposit insurance). The fiscal cost of direct support, net of amounts recovered as of end-2009, is estimated to average 2.8 percent of GDP.2
While the net fiscal costs may ultimately prove relatively modest, they greatly understate the fiscal exposures experienced during the crisis and the wider costs. Although some countries had very low or no fiscal cost, in other cases, costs unrecovered as of end-2009 were high: 6.1 percent of GDP in the United Kingdom, 4.8 percent in Germany, and 3.6 percent in the United States. Moreover, the wider fiscal, economic and social costs related to the financial crisis are even higher. The general government debt of the G-20 advanced economies is projected to increase on average by almost 40 percentage points of GDP over 2008–15, an increase in large part related to the crisis. Looking to the wider economy, the cumulative output loss so far in those G-20 countries that experienced a systemic crisis is about 26 percent of GDP.3
1.2.2 Measures Adopted or Considered To pay for the fiscal costs of the crisis, two main types of measures have been adopted (or are under legislative consideration): levies on selected financial sector claims and taxes on bonuses.4
The government of the United States has proposed a Financial Crisis Responsibility (FCR) fee to recover intervention costs. Banks and thrifts, insurance and other companies that own insured depository institutions and broker dealers with assets of more than $50 billion would be subject to an annual levy of 0.15 percent on—as initially proposed—total liabilities excluding Federal Deposit Insurance Corporation (FDIC)-assessed deposits and insurance policy reserves. The FCR fee is estimated to raise $90 to $117 billion over a 10 to 12 year period. It will be left in place until the cost of the Troubled Asset Relief Program (TARP) is fully covered (consistent with the requirement of cost recovery in the TARP legislation). The proposal is currently under legislative review, with the most recent revision being to use risk-weighted assets minus equity and insured liabilities as the base.
The United Kingdom and France have introduced temporary bonus taxes. The “Bank Payroll Tax” in the U.K., which expired on April 5, 2010, taxed at 50 percent all bonus payments in excess of ₤25,000, and is projected to raise ₤2 billion. The scheme in France, which applied to bonuses paid during accounting year 2009, was also charged at 50 percent above a broadly similar
2Given the experience of gradual cost recovery in past crises, the medium-term net costs of direct support measures could be still lower in some cases. Indeed, data for 2010 suggest that in some countries recoveries may bring the net costs down substantially. 3The output losses are estimated as the difference between trend and revised expected GDP for the 4-year period beginning with the crisis year, where trend GDP is estimated over the 20-year period prior to the crisis year and expected GDP is taken from the April 2010 World Economic Outlook projections. Fiscal costs are essentially transfers, and so not directly comparable to output losses: the resource loss from the former corresponds only to the associated efficiency losses from the policies needed to finance them. 4Annex Table 1 and Appendix 2 provide details of these schemes and of forward-looking mechanisms referred to later.
Financial Sector Taxation: The IMF’s Report to the G-20 and Background Material
6
threshold, and is projected to raise about €360 million. Unlike the FCR fee, these schemes are not intended to recover any specific amount.
The public debate prompted by the crisis has produced many other proposals for cost recovery. One, for instance, is to limit the use of tax losses built up by financial institutions during the crisis. Some advocates of a financial transactions tax (FTT) also view its potential for recovering the fiscal cost of the crisis as one of its merits. Many of these proposals, however, including for an FTT, are for permanent taxes—not simply recovering the costs of the recent crisis—and so are assessed in Section III on forward looking measures.
1.2.3 Assessment The least distortionary way to recover the fiscal costs related to the recent crisis would be by a ‘backward-looking’ tax, meaning one assessed on some attribute—with balance sheet variables a logical choice—that was determined prior to the announcement of the tax. This would define a fixed monetary amount that each institution would have to pay, over some specified period and subject perhaps to rules limiting the impact on net earnings. The advantage of this approach is twofold: first, there would be very little scope for avoiding the tax (hence very little need for international coordination). Second, its incidence—the real burden of the tax—would likely fall largely on owners or managers in the financial sector, since the amount of tax due could not be affected by changing behavior. Care would be needed in selecting the base so as to avoid legal challenge as retrospective taxation; and, as with any retroactive measure, there would be risk of reducing the credibility of the tax policy framework. Other forms of cost recovery, in contrast, mean that the amount payable can be affected by decisions not yet taken, and so will potentially affect financial markets participants’ behavior (including through avoidance).
The focus of countries’ attention is now shifting from recovering the direct fiscal costs of the recent crisis to reducing and addressing the costs of future financial failures and crises. The rest of this report concentrates on these issues.
1.3 Measures to Limit and Help Meet the Costs of Future Crises
1.3.1 Objectives
Regulatory changes under consideration by international standard setters aim to reduce the risks of financial failure. It is assumed in the following discussion that these initiatives will address many of the risks in individual regulated institutions (such as over-leveraging and liquidity mismatches) that contributed to the recent crisis. They should also help reduce systemic excessive
Financial Sector Taxation: The IMF’s Report to the G-20 and Background Material
7
risk-taking.5 It is also anticipated that the new regulatory standards and policies will be adopted and implemented by all G-20 members.
Even with the efforts to improve market discipline and strengthen regulation and supervision, there will always be failures of financial institutions. Financial institutions have to take risks in order to perform their intermediation and maturity transformation roles. As for any business, the possibility of failure is essential to enforce market discipline and discourage excessive risk taking. However, for these incentives to work effectively, it is essential to ensure that the costs of failure are borne fairly and efficiently, and do not endanger the broader financial system or real economy. Measures to pay for and contain the fiscal costs of future financial failures should be guided by two key objectives. They should:
Ensure that the financial sector pays in full for any fiscal support it receives. Expecting taxpayers to support the sector during bad times while allowing owners, managers, and/or creditors of financial institutions to enjoy the full gains of good times misallocates resources and undermines long-term growth. The unfairness is not only objectionable, but may also jeopardize the political ability to provide needed government support to the financial sector in the future. Full cost coverage could be achieved by a mixture of ‘ex ante’ payments reflecting the expected costs of future failures, and, as with the proposed FCR fee in the U.S., ‘ex post’ recovery charges (charged after failure occurs). Sole reliance on ‘ex post’ recovery, however, will be argued below to have substantial drawbacks in terms of both incentives and fairness.
Reduce the probability and the costliness of crises. Measures should reduce incentives for financial institutions to become too systemically important to be permitted to fail, and should discourage excessive risk-taking. This has two aspects:
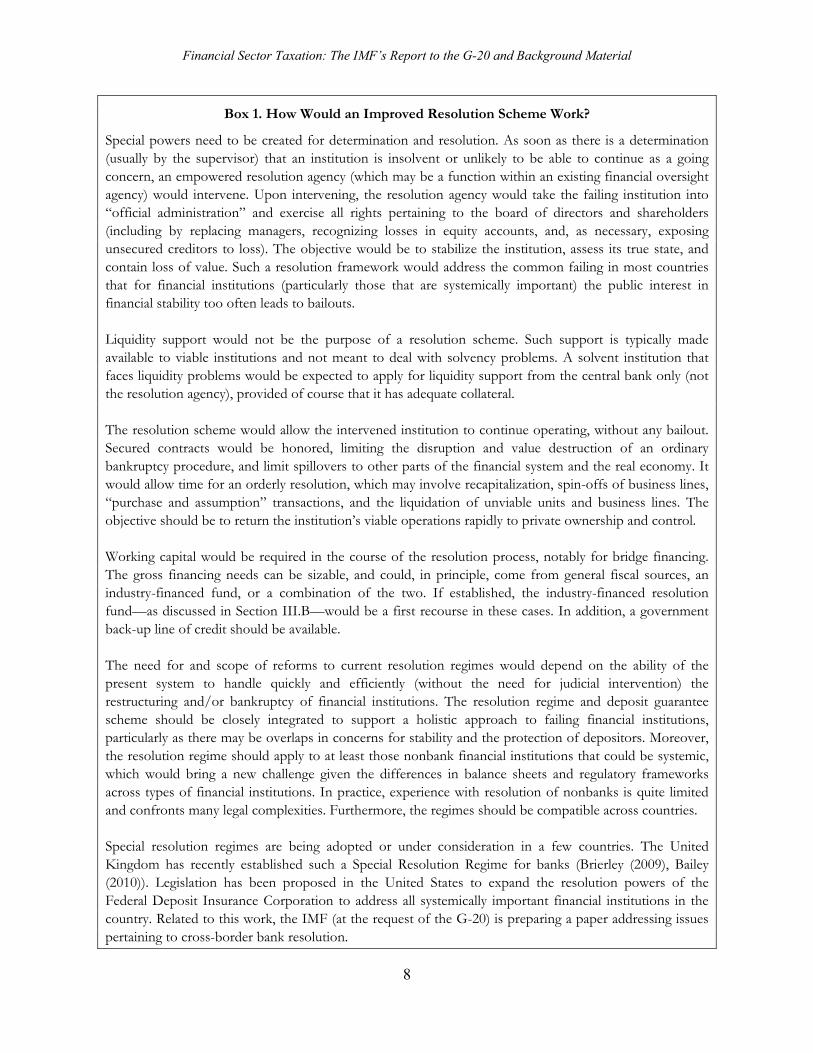
First, and importantly, the adoption of improved and effective resolution regimes—to resolve weak institutions in a prompt and orderly manner, including through interim administration by the state (Box 1). Such regimes are emphatically not for bail outs: the crisis has shown that they are essential precisely in order to make bail outs less likely, by reducing the likelihood that governments will be forced, for fear of systemic implications, to provide fiscal support to shareholders and unsecured creditors. Such resolution mechanisms require resources, and, as a cost of doing business, it is appropriate that the financial sector pay for them through some form of charge.
5The Basel Committee (2009) has proposed a number of reforms to the regulatory framework to improve the soundness of individual institutions and address deficiencies highlighted in the crisis. The Financial Stability Board has been tasked to deliver proposals for lowering the probability and impact of systemic financial institutions’ failures through strengthened regulatory and resolution frameworks that ensure these firms internalize the externalities they impose on the system, including by increasing the quantity and quality of (contingent) capital they are required to hold.
Financial Sector Taxation: The IMF’s Report to the G-20 and Background Material
8
Box 1. How Would an Improved Resolution Scheme Work?
Special powers need to be created for determination and resolution. As soon as there is a determination (usually by the supervisor) that an institution is insolvent or unlikely to be able to continue as a going concern, an empowered resolution agency (which may be a function within an existing financial oversight agency) would intervene. Upon intervening, the resolution agency would take the failing institution into “official administration” and exercise all rights pertaining to the board of directors and shareholders (including by replacing managers, recognizing losses in equity accounts, and, as necessary, exposing unsecured creditors to loss). The objective would be to stabilize the institution, assess its true state, and contain loss of value. Such a resolution framework would address the common failing in most countries that for financial institutions (particularly those that are systemically important) the public interest in financial stability too often leads to bailouts. Liquidity support would not be the purpose of a resolution scheme. Such support is typically made available to viable institutions and not meant to deal with solvency problems. A solvent institution that faces liquidity problems would be expected to apply for liquidity support from the central bank only (not the resolution agency), provided of course that it has adequate collateral. The resolution scheme would allow the intervened institution to continue operating, without any bailout. Secured contracts would be honored, limiting the disruption and value destruction of an ordinary bankruptcy procedure, and limit spillovers to other parts of the financial system and the real economy. It would allow time for an orderly resolution, which may involve recapitalization, spin-offs of business lines, “purchase and assumption” transactions, and the liquidation of unviable units and business lines. The objective should be to return the institution’s viable operations rapidly to private ownership and control. Working capital would be required in the course of the resolution process, notably for bridge financing. The gross financing needs can be sizable, and could, in principle, come from general fiscal sources, an industry-financed fund, or a combination of the two. If established, the industry-financed resolution fund—as discussed in Section III.B—would be a first recourse in these cases. In addition, a government back-up line of credit should be available. The need for and scope of reforms to current resolution regimes would depend on the ability of the present system to handle quickly and efficiently (without the need for judicial intervention) the restructuring and/or bankruptcy of financial institutions. The resolution regime and deposit guarantee scheme should be closely integrated to support a holistic approach to failing financial institutions, particularly as there may be overlaps in concerns for stability and the protection of depositors. Moreover, the resolution regime should apply to at least those nonbank financial institutions that could be systemic, which would bring a new challenge given the differences in balance sheets and regulatory frameworks across types of financial institutions. In practice, experience with resolution of nonbanks is quite limited and confronts many legal complexities. Furthermore, the regimes should be compatible across countries. Special resolution regimes are being adopted or under consideration in a few countries. The United Kingdom has recently established such a Special Resolution Regime for banks (Brierley (2009), Bailey (2010)). Legislation has been proposed in the United States to expand the resolution powers of the Federal Deposit Insurance Corporation to address all systemically important financial institutions in the country. Related to this work, the IMF (at the request of the G-20) is preparing a paper addressing issues pertaining to cross-border bank resolution.
Financial Sector Taxation: The IMF’s Report to the G-20 and Background Material
9
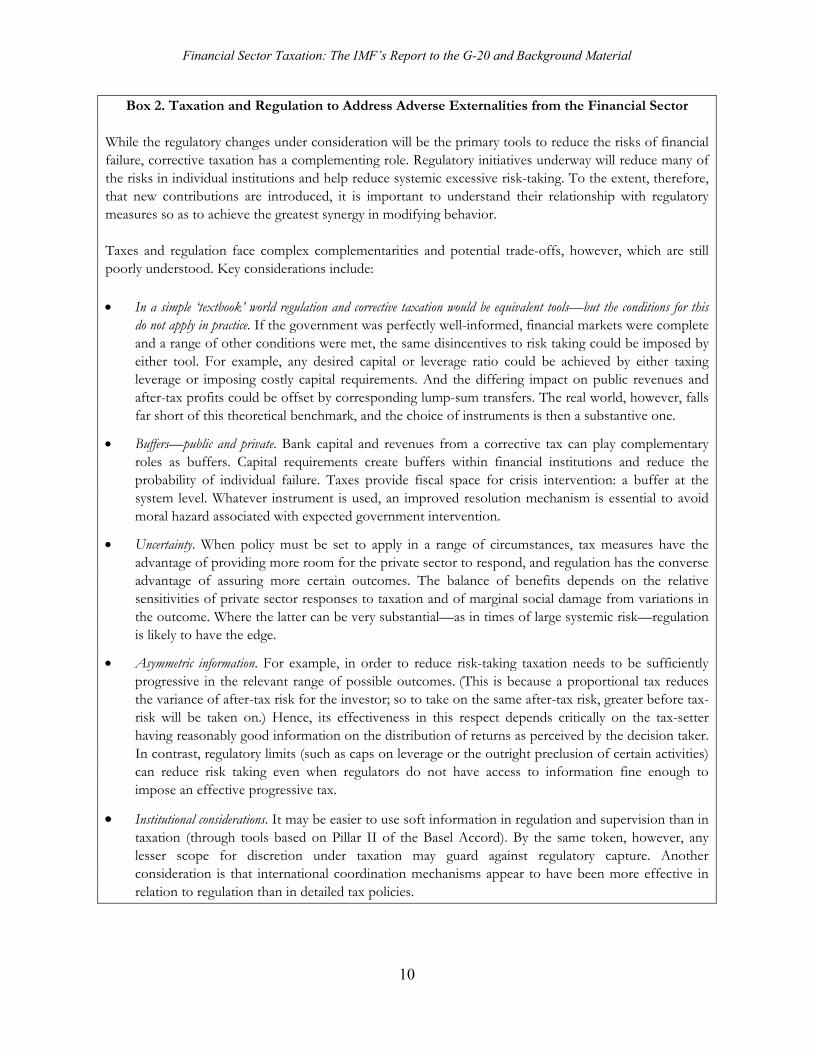
Second, taxes and contributions may have a role in supplementing regulation in addressing adverse externalities from financial sector decisions, notably through the creation of systemic risks and excessive risk taking.6 Understanding of the proper roles of corrective taxation and regulation in this context is, however, quite limited. The issues, which are complex, are reviewed in Box 2 and at more length in Appendix 3. What is clear is that the design of any new contributions introduced to deal with the direct fiscal costs of failure should take into account the implications for incentives. They should be structured, in coordination with other regulatory initiatives, to have beneficial effects in reducing inappropriate private sector behavior and so make it less likely that fiscal costs will arise at all.
Measures should be guided by three additional objectives. They should:
Be reasonably easy to implement, accommodate differences in national financial structures, and recognize both national sovereignty and potential mutual gains from collective action. New measures need to be readily implementable across various classes of financial institutions, and avoid creating scope for tax arbitrage. Understandably, countries have differing priorities and experiences as they emerge from the crisis. However, they all are vulnerable to failures and systemic crisis. Given the close integration of global financial markets, agreement on broad principles underlying measures will be beneficial and may facilitate cross-border resolution.
Enable, if desired, a contribution of the financial sector to reflect the wider fiscal and economic costs of financial crises. Some may feel recovery of direct fiscal costs to be too narrow a goal. Fairness also requires that tax payments not be undermined by unacceptably aggressive tax planning.7
Address existing tax distortions, create few new ones, and ensure a reasonable overall burden of regulation and taxation. Ideally, new measures would address or mitigate existing tax distortions (notably the tax bias in favor of debt),8 so improving the efficiency of resource allocation and reducing excessive leverage. Furthermore, recognizing the special importance of financial intermediation to wider economic performance, it is critical that the design of new levies/charges take into account the expected costs of future regulatory policies. This is needed to avoid imposing, through both explicit and implicit taxation, excessive costs on financial institutions.
6As discussed, for example, in Acharya et al (2009), Bank of England (2009), Shin (2010b), U.K. Treasury (2009), and Weder di Mauro (2010). 7The issue has been little studied, but recent work by Markle and Shackelford (2010) suggests that effective corporate tax rates tend to be lower for financial activities than in almost any other sector, and several G-20 tax administrations have taken initiatives specifically targeted at tax planning—on their own behalf and for others—by financial institutions. 8This arises because interest is deductible against corporate tax while the return to equity typically is not.
Financial Sector Taxation: The IMF’s Report to the G-20 and Background Material
10
Box 2. Taxation and Regulation to Address Adverse Externalities from the Financial Sector While the regulatory changes under consideration will be the primary tools to reduce the risks of financial failure, corrective taxation has a complementing role. Regulatory initiatives underway will reduce many of the risks in individual institutions and help reduce systemic excessive risk-taking. To the extent, therefore, that new contributions are introduced, it is important to understand their relationship with regulatory measures so as to achieve the greatest synergy in modifying behavior. Taxes and regulation face complex complementarities and potential trade-offs, however, which are still poorly understood. Key considerations include:
In a simple ‘textbook’ world regulation and corrective taxation would be equivalent tools—but the conditions for this do not apply in practice. If the government was perfectly well-informed, financial markets were complete and a range of other conditions were met, the same disincentives to risk taking could be imposed by either tool. For example, any desired capital or leverage ratio could be achieved by either taxing leverage or imposing costly capital requirements. And the differing impact on public revenues and after-tax profits could be offset by corresponding lump-sum transfers. The real world, however, falls far short of this theoretical benchmark, and the choice of instruments is then a substantive one.
Buffers—public and private. Bank capital and revenues from a corrective tax can play complementary roles as buffers. Capital requirements create buffers within financial institutions and reduce the probability of individual failure. Taxes provide fiscal space for crisis intervention: a buffer at the system level. Whatever instrument is used, an improved resolution mechanism is essential to avoid moral hazard associated with expected government intervention.
Uncertainty. When policy must be set to apply in a range of circumstances, tax measures have the advantage of providing more room for the private sector to respond, and regulation has the converse advantage of assuring more certain outcomes. The balance of benefits depends on the relative sensitivities of private sector responses to taxation and of marginal social damage from variations in the outcome. Where the latter can be very substantial—as in times of large systemic risk—regulation is likely to have the edge.
Asymmetric information. For example, in order to reduce risk-taking taxation needs to be sufficiently progressive in the relevant range of possible outcomes. (This is because a proportional tax reduces the variance of after-tax risk for the investor; so to take on the same after-tax risk, greater before tax-risk will be taken on.) Hence, its effectiveness in this respect depends critically on the tax-setter having reasonably good information on the distribution of returns as perceived by the decision taker. In contrast, regulatory limits (such as caps on leverage or the outright preclusion of certain activities) can reduce risk taking even when regulators do not have access to information fine enough to impose an effective progressive tax.
Institutional considerations. It may be easier to use soft information in regulation and supervision than in taxation (through tools based on Pillar II of the Basel Accord). By the same token, however, any lesser scope for discretion under taxation may guard against regulatory capture. Another consideration is that international coordination mechanisms appear to have been more effective in relation to regulation than in detailed tax policies.
Financial Sector Taxation: The IMF’s Report to the G-20 and Background Material
11
No single instrument is likely to achieve all these objectives. A package of measures may therefore be needed.
Instruments that are being considered can be grouped into two broad categories:
Levies on financial institutions: charged on financial institutions to cover the net fiscal cost of direct public support to financial institutions and help reduce excessive risk-taking.
Other tax instruments: to ensure a wider revenue contribution from the sector, to tax rents (i.e., payments in excess of the minimum competitively required), and/or to potentially address adverse effects of financial sector behavior.
1.3.2 Levies on Financial Institutions
Several countries have established or proposed levies to help meet the cost of future crises. The governments of Germany, France, Italy, Sweden, the U.K., and the U.S.,9 and the European Commission have proposed levies on their financial service industries, covering their banks and in some cases other classes of financial institutions (such as insurance corporations) as well. (Annex Table 1 and Appendix 2 provide an overview). Some of these proposals envisage that the proceeds of the levy would accumulate in a fund, others that they would go to general government revenues.
Such levies require an effective resolution regime to avoid the perception that the receipts would be used to support failing institutions (see Box 2). The legislation setting out the resolution scheme needs to define the principles underlying the levy, including the implementing authority. With the levy tightly linked to the resolution mechanism, its monitoring and collection would likely best reside (subject to overarching guidelines) with the resolution agency.
In designing a levy, several aspects are critical:
Perimeter of the levy: The perimeter (i.e., the institutions that would pay the levy) could be narrow (such as banks only) or broad (i.e., all financial institutions). A narrow perimeter would single out specific institutions and create incentives for systemic risks to migrate. A broad perimeter, with appropriate allowances for riskiness in the base and rate, would address these concerns and better cover institutions that could become systemic in the future. In addition, it would recognize that all institutions benefit from the public good of enhanced financial stability provided by the resolution scheme. It would also help create a broad constituency to provide some level of accountability that any funds raised are used efficiently and remain available for financial sector support. Finally, singling out a narrow group of institutions to pay the levy could worsen moral hazard by suggesting that they are less likely to fail than those outside the scheme. These considerations suggest that the levy should be imposed on all financial institutions.
9Initially proposed in both the House and Senate versions of pending legislation.
Financial Sector Taxation: The IMF’s Report to the G-20 and Background Material
12
Base of the levy: Box 3 concludes that a broad balance sheet base, including some off-balance
sheet items, but excluding capital (e.g., Tier one for banks) and with some allowance for insured liabilities, would meet the objectives of reducing risk, enhancing fairness, and raising revenues reasonably efficiently.10 The base definition will differ by institution type (e.g., an insurance company would typically have a lower base than a bank, reflecting the lower volatility of its funding).
Rate of the levy: The rate should be adjusted to address institutions’ specific risks and their contribution to systemic risk (see Box 3).11 The setting of the rate could draw on experiences of past crises and their fiscal costs, and should take into account the risk profile of the financial system (including its structure and regulatory framework). Empirical analysis (Appendix 4) suggests that, given present institutional structures in major G-20 countries, (implicit) government support provides too big to fail financial institutions with a funding benefit between 10 and 50 basis points, with an average of about 20 basis points. The rate for non-systemic and less risky financial institutions could be substantially lower, implying a lower overall rate. As risks vary over the cycle, the rate would have to be adjusted so as to help make the financial system less pro-cyclical.
Implementation: There should be an adequate phase-in period to avoid harming the ability of financial institutions to strengthen their capital base and adjust to the new regulatory regime, while continuing to support growth. The rate could initially be uniform by broad classes of financial institutions, but should be refined over time, to reflect individual financial institutions’ risks. As regulatory reforms begin to reduce systemic risk—especially through enhanced resolution regimes—the rate could be reassessed. Past experiences suggest, as a rough guide, that for many countries the costs to be provisioned for would approximate 2–4 percent of GDP.12 Assuming the average contribution rate to be 10 basis points and to be applied on a broad base of liabilities with a broad perimeter of financial institutions, this provisioning would be achieved for the major G-20 countries over about 10 years. Analysis suggests that such a charge would have only a very modest impact on credit expansion and economic growth (see Appendix 4).
10Excluding equity also goes some way to counterbalancing the tax preference for debt under the corporate tax. 11Since the purpose of the levy is to ensure that financial institutions face an appropriate cost structure, the amount of levy paid should be deductible, like any other, under the corporate income tax. (Account will need to be taken of this in setting the rate of the levy, since deductibility will reduce corporate tax revenues). Similarly, while the incidence of the levy may well be passed wholly or in part to users of financial services (as discussed in Appendix 4), this is appropriately so, just as with any other cost. 12For countries in which the financial sector is particularly large relative to GDP, the risks to be provisioned for should be correspondingly higher. More generally, the rate of the levy should reflect differences in the structures of financial systems, e.g., as between emerging markets and advanced countries.
Financial Sector Taxation: The IMF’s Report to the G-20 and Background Material
13
Box 3. A Levy on Financial Institutions: Base and Rate
The amount paid by any institution should reflect its contribution to systemic risk. Financial institutions differ in how much they contribute to systemic risk and consequently in the potential social costs of their failure. This different contribution should be reflected in the choice of the base to vary by type of financial institution (for example, banks versus insurance companies); and rate to vary within institution type (for example, across different banks) depending on their individual risk profile. The process of setting the rate and base would necessarily entail coordination between the regulatory agencies and the deposit insurance agencies in the case of banks. The base of the levy would include balance sheet measures. The composition of the balance sheet of financial institutions captures risk considerations better than other variables (such as the volume of financial transactions or profitability). In deciding which components of the balance sheet to include, two issues arise: (i) whether the base should be represented by assets or liabilities; and (ii) whether it should be broad or narrow (e.g., include or not off-balance sheet items).
● There are tradeoffs between using assets and liabilities for the base of the levy. The use of risk-weighted assets has the merit of international comparability, given the broad acceptance of the Basel capital requirements and the methodology for determining risk weighted assets. One particular asset-based approach would be to tax the holding of level 2 and 3 trading assets–those assets not readily marked to market using observed prices, which could serve to discourage the buildup of assets that proved less liquid during the crisis.13 A levy on risk-weighted assets could, however, duplicate the effects of regulations also targeted at riskiness on the asset side (e.g., the Basel Committee capital requirements).
● A broad base on the liability side of the balance sheet may be preferable, as it allows a lower rate for any given
amount of revenue, and so limits the risk of unintended distortion. Such a base would also reflect that the cost of resolution arises from the need to support liabilities. However, it would be important to exclude equity (so not to discourage capital accumulation). In principle, other liabilities could also be excluded to reflect their risk-characteristics or to avoid double taxation, such as subordinated debt, government guaranteed debt and intra-group debt transactions (an approach taken by Sweden). Indeed, the levy could be applied only to select liabilities (such as wholesale funding, short-term debt or foreign funding) with the explicit objective of discouraging such activities. However, the narrower the base concept, the higher the risks of arbitrage, evasion, and unintended effects. To avoid double imposition, insured liabilities could be excluded or, better, a (nonrefundable) credit given for payment of premiums in respect of insured liabilities.
● Off-balance sheet items could be included to the extent that they represent a significant source of systemic risk.
Any treatment of derivatives and other qualified financial contracts should be consistent with the forthcoming Basel Committee guidelines related to the measurement of leverage ratios. Accounting standards should also be taken into account, though ideally this concern would be addressed through a converged accounting standard. For example, the treatment of derivatives under European IFRS causes balance sheets to be much larger than under U.S. GAAP.
In sum, a broad balance sheet base on the liabilities side, excluding capital (e.g., Tier one for banks) and possibly including off-balance sheet items, and with a credit for payments in respect of insured liabilities is preferable. The rate could be flat initially but risk-adjusted in the future. A uniform rate has the benefit of ease of implementation, but does not contribute to reducing riskiness and systemicness. A risk-adjusted rate could be designed to address the contribution to systemic risk. Ideally, the rate would vary according to the size of the systemic risk externality, e.g., based on a network model which would take into account all possible channels of contagion. In practice, however, existing models are not able to fully capture all propagation channels. Therefore, the degree of systemic relevance has to be estimated based on a series of indicators, as also contemplated by the Basel Committee in designing a capital add-on charge for systemic banks (see also IMF (2010)). As with some deposit insurance schemes, risk-differentiation could reflect both quantitative information (e.g., compliance with capital requirements) and qualitative assessments (e.g., a scoring system based on supervisory information). Quantitative indicators could include measures such as size, interconnectedness and complexity. When systemic risk can be identified to arise from specific activities (e.g., excessive reliance on short-term and wholesale funding), the rate could be adjusted accordingly.
13Lepetit (2010).
Financial Sector Taxation: The IMF’s Report to the G-20 and Background Material
14
The proceeds of a levy could finance a resolution fund, or they could feed into general revenues (Box 4). Proposals in several countries link such a levy to the creation not only of a more effective resolution scheme but also to a fund. Sweden has established a financial stability fund to be capitalized by the financial sector. Germany is preparing legislation that will improve its ability to deal with failing financial institutions, including through imposing a levy on commercial banks to build a resolution fund. Maintaining a levy, even when a fund is built up, to feed general revenues would preserve its beneficial corrective impact on the behavior of financial institutions.
An advantage of a dedicated resolution fund is that it could help empower a resolution agency. While in some countries this function is assigned to an existing agency, such as the deposit insurance agency or the central bank, others may wish to establish a newly empowered agency, with the financing coming via a fund, that could: (i) take on the duties of managing the resolution of failing financial institutions (e.g., temporary operation of institutions, the disposition of assets, sale of business units), and (ii) determining the application of the levy (e.g., establishment of the base, perimeter, and rate in coordination with the supervisor). Establishing a dedicated fund would help secure the necessary income to support these administrative functions while maintaining the necessary independence of such a function from the standard budget process.
As gross financing needs can be large, a contingent credit line will be needed. As in the recent crisis, the initial gross support needed quickly may substantially exceed the final net costs. As a result, the revenue raised through the levy may be less than the up-front financing needs. This financing gap requires that the resolution agency have access to a credit line provided by the government to complement the resources provided by the levy (as with pre-funded deposit insurance agencies). Such a credit line would also avoid the perception that governments’ capacity to support the resolution of institutions during crises would be limited to the revenues collected through the levy. Because the availability of this credit line is a continuing commitment on the government’s general resources, it requires that a separate additional fee—no doubt much smaller than the levy—be paid by industry, with (for simplicity) the same base as for the levy, and accruing to general revenues.14
The design of levies, and funds if established, should be guided by an internationally accepted set of principles, especially with a view to facilitating the resolution of cross-border institutions. These principles might cover the determination of the target size of the fund (if established), the level of annual levies and the base on which they are imposed, the treatment of foreign branches and foreign subsidiaries, and the treatment of different classes of creditors in case of resolution. This would facilitate cooperation across countries and help ensure a level playing field, including by avoiding double charging/taxation. Most importantly, it could facilitate resolution of cross-border institutions. The creation of a multi-country (e.g., pan-European) fund can be envisaged and is almost a necessity for closely integrated financial markets. It would provide a large impetus to addressing presently unresolved legal and operational issues—such as differing national insolvency regimes, lack of common triggers for intervention actions and approaches to supervision, and varying deposit guarantee schemes across countries.
14For ease of implementation, the resolution agency might collect both the levy and the fee, remitting the latter to government.

Financial Sector Taxation: The IMF’s Report to the G-20 and Background Material
15
Box 4. Should There be a Fund?
It makes no substantive difference to the public sector’s financial position whether a levy accrues to general revenues or to a fund that invests in government securities. Payment to general revenue leads, in the absence of changes to other taxes or spending, to less need for the government to sell debt on the open market. Payment to a fund which then purchases government debt has the same effect. The only difference is that payment to general revenues reduces the gross amount of debt issued, whereas payment into a fund leaves it unchanged, but with part of debt now held by a public entity—the fund. In both cases, net public debt—the net amount owed to the private sector by the government and the fund combined, which determines the interest burden—is lower, and by the same amount. The table below illustrates, for a levy of 100.
Flows of Payments Government debt
Private sector Fund Government Revenues
Gross debt Net debt
No fund -100 0 +100 -100 -100
Fund -100 +100 0 0 -100
When failure occurs and cash is needed, the impact is again the same: with no fund, financing needs can be met by the government selling new debt on the open market; with a fund, financing needs are met by selling its holdings of government debt or passing them to institutions which may sell them.
Other considerations, related to market and public perceptions, and institutional constraints, can favor either approach:
If not tied explicitly to an effective resolution regime, a fund may worsen moral hazard by creating an expectation that institutions will receive support from the government (through some combination of official support that pre-empts burden sharing by debt and equity holders) rather than being resolved. Payment into general revenue does not eliminate this risk (as was evident in the recent crisis). Hence, the need for a strengthened resolution scheme in either case.
If a fund becomes too large, it may be vulnerable to diversion to purposes other than financial stability. This can be limited by capping the size of the fund and ensuring the fund’s mandate is well established to guard its independence. Payments, however, should continue into general revenues.
Payment to general revenues may risk receipts being spent rather than used to reduce government
debt. This may happen, for instance, if fiscal policy is focused on deficit or gross debt targets that remain unchanged when the levy is collected. However, the extent to which setting up a fund would allay this risk depends on its institutional classification. On standard statistical conventions, a fund would be part of “general government” if the government sets its broad policies. Its receipts would then be regarded as general government revenues and could be used to meet any fiscal rules at the general government level.
In some countries (e.g., Germany), the constitution requires that the proceeds of a tax imposed only
on some taxpayers be earmarked for their benefit.
Financial Sector Taxation: The IMF’s Report to the G-20 and Background Material
16
Recovery charges, imposed after a crisis has occurred, could supplement the ex ante levy. This would avoid the government having to sustain the cost of supporting the financial sector. Ex post recovery charges do, however, have significant drawbacks. First, they impose a burden only on industry survivors; failed institutions pay nothing. Second, ex post financing may be pro-cyclical, requiring the industry to meet costs precisely when it is least able to do so. Thus, while they should complement a system of ex ante charges, sole reliance solely on ex post charges would be unwise. The base for such an ex post charge, when needed, could be similar to that of the levy.
1.3.3 Possible Additional Tax Instruments There may be reasons to consider additional tax measures beyond a levy of the type just discussed, including:
The large fiscal, economic and social costs of financial crises may suggest a contribution of the financial sector to general revenues beyond covering the fiscal costs of direct support.
As discussed in broad terms above, taxes might have a role in correcting adverse externalities arising from financial sector, such as the creation of systemic risks and excessive risk taking. Specific proposals include for taxes on short-term and/or foreign exchange borrowing, on high rates of return (to offset any tendency for decision makers to attach too little weight to downside outcomes), and for corrective taxes related to notions of systemic risks and interconnectedness (see Appendix 4). The presumption is that receipts from these taxes would go to general revenue, although they need not equal the damage—however defined—that they seek to limit or avert.15 Of course, explicitly corrective taxes (on systemic risk, for instance) would need to be considered in close coordination with regulatory changes (such as additional capital requirements for systemically important institutions).
The rest of this section focuses on two possible instruments directed largely to revenue-raising,16 though in each case their behavioral and hence potentially corrective impact cannot be ignored.
1.3.4 Taxing Financial Transactions
The recent crisis has renewed interest in the possibility of a general tax on financial transactions. It is important to assess such proposals on their policy merits. Suggestions for some form of financial transactions tax (FTT) differ, including in their goals and degree of detail; one particular
15This is because corrective taxes need to address the marginal social damage from some activity, which may differ from the average damage. 16There are other possibilities, including for instance a surcharge on the rate of corporate income tax applied to financial institutions (European Commission, 2010).
Financial Sector Taxation: The IMF’s Report to the G-20 and Background Material
17
form is for a ‘Tobin tax’ on foreign exchange transactions. The common feature, focused on here, is applicability of the tax to a very wide range of transactions. Advocates argue that an FTT could raise substantial amounts. For example, a tax of one basis point has been estimated to raise over $200 billion annually if levied globally on stock, bonds and derivative transactions, and a 0.5 basis point Tobin tax on spot and derivative transactions in the four major trading currencies to raise $20–40 billion.
The FTT should not be dismissed on grounds of administrative practicality.17 Most G-20 countries already tax some financial transactions.18 Perhaps the broadest coverage is in Argentina, which taxes payments into and from current accounts, and in Turkey, which taxes all receipts of banks and insurance companies. Other countries charge particular financial transactions, as with the 0.5 percent stamp duty on locally-registered shares in the U.K. Collecting taxes on a wide range of exchange-traded securities (and, possibly, derivatives) could be straightforward and cheap if withheld through central clearing mechanisms, as experience with the U.K. stamp duty shows. Certainly the widespread use of a few clearance and settlement systems is helpful for implementing transaction taxes more generally. Of course, some important practical issues are not yet fully resolved. Questions remain, for example, as to whether such a tax might drive transactions into less secure channels. But implementation difficulties are not unique to the FTT, and sufficient basis exists for practical implementation of at least some form of FTT to focus on the central question of whether such a tax would be desirable in principle.
There may indeed be a case to supplement a levy of the kind described above with some other form of taxation, but an FTT does not appear well suited to the specific purposes set out in the mandate from G-20 leaders. With multiple objectives potentially to be served, as discussed in Section III.A, some instrument additional to the levy set out above may be needed. But an FTT is not the best instrument for these purposes:
It is not the best way to finance a resolution mechanism of the kind discussed above, since the volume of transactions is not a good proxy for either the benefits it conveys to particular institutions or the costs they are likely to impose on it.
It is not focused on core sources of financial instability. An FTT would not target any of the key attributes—institution size, interconnectedness, and substitutability—that give rise to systemic risk; adjusting the tax rate to reflect such considerations would be possible in principle, but highly complex in practice. (More generally, if the aim is to discourage particular types of transactions, this could be done more effectively by taxing or regulating them directly). Corrective arguments for an FTT are focused on rather different aspects of financial market performance (Box 5).
17Staff working papers reviewing both policy and administrative aspects of the FTT will be completed shortly. 18Appendix 5 reviews this and other aspects of the current tax treatment of the financial sector in the G-20.
Financial Sector Taxation: The IMF’s Report to the G-20 and Background Material
18
Box 5. A Corrective Role for an FTT?
Several arguments have been made for an FTT as a way to improve financial market performance, but there are significant drawbacks: “An FTT would reduce “wasteful” financial transactions.” Some stress the very large increase in the ratio of
financial transactions to global GDP as suggestive of socially unproductive financial activity. But, even apart from data issues, quite what that ratio would ideally be is far from clear. While there are reasons to suppose the sector may in some cases be too large, this is best addressed by other means, as discussed in the next section.
“An FTT would reorient financial transactions toward long-term investment based on fundamentals, and reduce speculative bubbles.” An FTT would indeed eliminate some short-term trading. And while some of this may well be felt to have little social value, it is difficult to distinguish ‘undesirable’ from ‘desirable’ short-term trading—or to assess their relative importance. Not all short-term trading is trend-following; some is contrarian. Nor is it clear that lower transactions costs intensify cyclical market price swings: asset bubbles arise even in markets with very high transactions costs, such as real estate. If the aim is to discourage particular short-term transactions, regulation or targeted taxes are more effective.
“An FTT would reduce market price volatility.” It is now generally recognized that this is not always true in either theory (thinning of markets, for instance, can increase volatility) or practice (the empirical finding generally being that transactions taxes either do not affect price volatility or increase it).
“An FTT would not distort real investment and hedging.” While an FTT would have the greatest impact on low-margin, short-term trading, it would also increase the cost of capital for all firms issuing taxed securities, since investors would require higher returns to compensate them for reduced liquidity. This increase would be greater for issuers of more frequently traded securities, such as large corporations, since expected costs of trading activity would be capitalized into security prices. Some studies find that these effects are quite large, and hence could have a significant adverse impact on long-term economic growth.
Its real burden may fall largely on final consumers rather than, as often seems to be supposed, earnings in the financial sector. No doubt some would be borne by owners and managers of financial institutions. But a large part of the burden may well be passed on to the users of financial services (both businesses and individuals) in the form of reduced returns to saving, higher costs of borrowing19 and/or increases in final commodity prices. Indeed, this is more likely the more general the adoption of the tax, since that helps industry pass on the cost to its customers. Because it is levied on every transaction, the cumulative, ‘cascading’ effects of an FTT—tax being charged on values that reflect the payment of tax at earlier stages—can be significant and non-transparent. It is not obvious that the incidence would
19Schwert and Seguin (1993), for example, estimate that a 0.5 percent securities transactions tax in the U.S. would increase the cost of capital by 10–180 basis points.
Financial Sector Taxation: The IMF’s Report to the G-20 and Background Material
19
fall mainly on either the better-off or financial sector rents.20 In sum, while the incidence of an FTT remains unclear—as with other taxes considered in this report—it should not be thought of as a well-targeted way of taxing any rents earned in the financial sector.
More widely, care should be taken in assessing the potential efficiency of an FTT in raising revenue:21
It is a weakness of the FTT that it taxes transactions between businesses, including indirectly through the impact on the prices of non-financial products. The argument that an FTT would cause little distortion because it would be levied at a very low rate on a very broad base is not persuasive: it is a central principle of public finance that if the sole policy objective is to raise revenue then taxing transactions between businesses (which many financial transactions are) is unwise: distorting business decisions reduces total output, so that more could be raised by taxing that output directly. A tax levied on transactions at one stage ‘cascades’ into prices at all further stages of production. This is why, for instance, most countries have found the VAT—which effectively excludes transactions between businesses—to be a more efficient revenue-raiser than turnover taxes.22 In pure revenue-raising terms, there are more efficient instruments than an FTT.
Experience shows that—even leaving aside the question of whether transactions could, or would, escape the tax if imposed only by a few countries—financial transactions seem to be particularly vulnerable to avoidance by engineering. An example is the use of ‘contracts in differences’23 in the U.K. Looking forward, anti-avoidance rules would be needed to deal with notional principal contracts (such as swaps) more generally. As with any cascading tax, there would be an incentive to avoid the tax by integration (conducting transactions within rather than between businesses): absent special provisions, the result could be larger financial institutions.
1.3.5 A Financial Activities Tax A ‘Financial Activities Tax’ (FAT), levied on the sum of profits and remuneration of financial institutions, could raise significant revenue and be designed to serve a range of purposes.24 While, like the FTT, a FAT would (absent special arrangements) tax business transactions—because no credit would be given to their customers for FAT paid by financial institutions—alternative
20Most current proponents of an FTT do not envisage that its base would include current account bank transactions, but it is cautionary to recall that while some had advocated this as a relatively progressive form of taxation, such evidence as there is suggests the opposite: Arbeláez, Burman, and Zuluaga (2005). 21 See, for instance, Schmidt (2007), Schulmeister, Schratzenstaller and Picek (2008), and Spratt (2006). 22Under a turnover tax, tax paid on inputs ‘sticks’; under a VAT, a credit is provided for input tax so as to ensure that, while tax is collected from the seller, it ultimately does not affect businesses’ input prices. 23 These reallocate the income associated with share ownership without changing ownership itself. 24Broadly speaking, since value added is simply the sum of profits and wages, a FAT would bear the same relationship to an FTT as the VAT does to a turnover tax—a FAT in effect taxes net transactions of financial institutions, whereas an FTT taxes gross transactions.
Financial Sector Taxation: The IMF’s Report to the G-20 and Background Material
20
definitions of profits and remuneration for inclusion in the base of the FAT enable it to pursue a range of objectives. Appendix 6 elaborates on the design and revenue potential of these alternative forms of FAT now discussed.
A FAT would approximate a tax on rents in the financial sector25 if the base included only high levels of remuneration and with the profit component also defined appropriately, to in effect exclude a normal return to capital. To the extent that this is achieved, it would be both non-distorting and meet equity objectives that have been prominent in public debate.
A FAT could be designed in other ways, to serve other of the objectives above:
With inclusion of all remuneration, a FAT would effectively be a tax on value added, and so would partially offset the risk of the financial sector becoming unduly large because of its favorable treatment under existing VATs. For technical reasons, financial services are commonly VAT-exempt—which means that, purely for tax reasons, the financial sector may be under-taxed and hence perhaps ‘too big’ 26 (see Appendix 5). Taxing value-added in the financial sector directly would mitigate this. To avoid worsening distortions, the tax rate would need to be below current standard VAT rates. The size of financial sector value-added in many countries suggests that even a relatively low-rate FAT could raise significant revenue in a fair and reasonably efficient way: in the U.K., for instance, a 5 percent FAT (with all salaries included in the base), might raise about 0.3 percent of GDP (Appendix 6).
With inclusion of profits only above some high threshold rate of return, the FAT would become a tax on ‘excess’ returns in the financial sector. As such, it would mitigate excessive risk-taking that can arise from the undervaluation by private sector decision-makers of losses in bad outcomes (because they are expected to be borne by others), since it would reduce the after-tax return in good outcomes.27 Of course (and as noted in Box 2), there may be more effective (tax and regulatory) ways to do this.
A FAT should also be relatively straightforward to implement, since it would draw on the practices of established taxes. Taxing profits and withholding on remuneration are everyday functions of almost every tax administration. Clearly there would be technical issues to resolve, but most are of a kind that tax administrations are used to dealing with. Indeed some jurisdictions already have taxes of this general type. And while there would be difficulties in potential shifting of profits and remuneration to low-tax jurisdictions, a low rate FAT might not add greatly to current incentives for tax planning—and indeed would not greatly change them if adopted at broadly similar rates in a range of countries.
25Philippon and Reshef (2008) estimate that in recent years rents accounted for 30–50 percent of the wage differential between the financial sector and the rest of the economy in the U.S. 26 Relative, that is, to a situation in which the VAT applied uniformly to financial services and all other goods and services. This argument does not apply to the U.S. and Saudi Arabia, the only G-20 countries without a VAT (though for the former, financial services benefit from relatively low taxation of services in general). 27The argument for progressive profit taxation on these grounds is developed by John, John and Senbet (1991).
Financial Sector Taxation: The IMF’s Report to the G-20 and Background Material
21
Like an FTT, a FAT would tend to reduce the size of the financial sector—but with less uncertainty as to its impact on the structure of financial markets, effective implementation and, to some extent, incidence. While the FAT will fall on intermediate transactions, it differs from the FTT in not directly distorting activities of financial institutions (although also encouraging integration in the sector). Insofar as it falls other than on rents, it would tend to reduce the size of the sector without changing its activities. Box 6 elaborates on the nature, incidence and implementation of a FAT (its design and revenue potential being discussed further in Appendix 6).28
While much detail remains, its potential merits are such that the combination of a FAT and a levy of the kind described above offers a coherent package for addressing the objectives set out above.
1.3.6 International Considerations Even countries that provided little or no support to their financial sectors during the recent crisis should consider forward-looking contribution schemes. Many countries may emerge from the crisis with little or no fiscal cost—whether gross or net—of direct support to the sector. That is a good reason not to impose backward-looking charges, but no reason to dismiss the possibility of putting in place now clear strategies to pay for the future failures and crises from which no country can prudently regard itself as immune. Almost all G-20 countries have experienced a systemic financial crisis within the last few decades. Furthermore, the massive contingent liabilities incurred during the crisis and its large broader fiscal costs suggest it is prudent to provision for the future.
Distortions will arise if the contribution measures are adopted by only some countries, though they may not be as large as some that already exist. The mobility of capital and sophistication of financial institutions and markets mean that the effectiveness of contribution schemes—as of regulatory measures—can be undermined by the relocation and restructuring of financial activities. And to the extent that they cannot be completely negated in this way, the application of different schemes will distort competition between financial institutions based in different jurisdictions. It is worth bearing in mind, however, that corporate tax rates already vary across advanced and emerging countries by more than twenty percentage points; an FSC that amounts to, on average, 10 basis points, taking in the order of 3 percent of pre-tax earnings (see Appendix 4), would intensify these differences only modestly if applied in some but not all countries.29
28A staff working paper on the FAT is under preparation. 29Similarly, a low rate FAT from which exported financial services were excluded would do little to tilt the competitive playing field. The greatest (and significant) difficulties would be with the form of FAT intended to discourage risk-taking, which would need to be set at a fairly high statutory rate to have the intended effect.
Financial Sector Taxation: The IMF’s Report to the G-20 and Background Material
22
Box 6. The Nature and Incidence of a Financial Activities Tax
The FAT has, in many respects, the nature of a VAT: as for VAT, there would be no direct impact on the structure of the activities undertaken by financial institutions themselves, as liability depends on profit, not on how it is earned or on the volume of turnover. Of course, one difference from a VAT is that the tax would also fall on businesses, not just on final consumers. The incidence of, and revenue from, a FAT would depend on the precise definition of the base: The base could include profits above a “normal” level and “high” remuneration, in this way
targeting rents. The closer the tax is to falling on rents, the less is the incentive for it to be passed on to customers rather than borne by owners and managers. Regarding profits, in order to tax “rents” the definition of profits would have to differ from that used for income tax purposes. It would need to be closer to that implicit in the standard VAT.30 Setting a higher reference rate of return converts the tax into one on ‘excess’ returns above that rate, as discussed in the text. Regarding remuneration, excluding remuneration above some critical level can be only a very rough way of targeting rents, since it does not distinguish between rents and returns due to high productivity. Fairness may call for similar taxation of high remuneration in other sectors too, through the income tax, but a case might be made that the regulatory apparatus creates distinct scope for rents in the financial sector, including through the existence of institutions that are too-big-to-fail. And if the rents are not there, a well-designed tax of this kind will, in principle, simply raise no revenue.
If the FAT were applied to all remuneration, it would likely be passed on to purchasers of financial services, since business customers, like final consumers, would receive no credit for it. This would be appropriate if the objective were to correct for the light taxation of financial services. There are indeed precedents for taxing the sum of profits and remuneration in the financial sector. Israel applies such a tax; the province of Quebec in Canada has a related tax; Italy applies a tax with broadly similar structure to all activities, including finance and insurance. France levies an additional tax on remuneration for firms, including financial, whose output is largely untaxed under the VAT.
The danger of significant distortions can be limited by international cooperation—which does not mean identical application everywhere. Competitive and other distortions will be less if the leading financial centers adopt contribution measures based on similar principles. Both theory and practice suggest that the collective losses from non-cooperative tax-setting can be limited, while respecting differing national circumstances, by common adoption of minimum tax rates. Countries might agree, for example, to impose an FSC on some broadly common base at no less than some specified rate, allowing any that wish to charge a higher rate. 30The standard VAT is in effect a tax on wages and profits with the latter defined in terms of ‘cash flow’ (investment fully deductible, no depreciation or deduction for interest). An equivalent (in present value) outcome can be mimicked under a FAT by defining taxable receipts and expenses to include principal amounts, by taxing only net distributions to shareholders, or by providing an allowance for both interest expense and a notional return on equity (together with economic depreciation).
Financial Sector Taxation: The IMF’s Report to the G-20 and Background Material
23
Risk-adjustment would facilitate participation, by reassuring countries that have very strong supervisory systems, including good resolution schemes—so that risks are well-managed—that they are not burdening their financial institutions inappropriately. Acknowledging that no country is immune from financial failures, the charge could nevertheless be set lower in countries where institutions contribute less to systemic risks, national as well as international. On the other hand, non-participation carries the risk of attracting high risk activities, with consequent distortions in international capital flows and challenges for regulation and, potentially, higher risk of future failures.
Countries that adopt contribution schemes would benefit from coordinating their design. Some commonality of base, in particular, may not only serve to reduce financial institutions’ compliance costs but also avoid double taxation (e.g., if one jurisdiction levies tax on a worldwide basis and another on the basis of residence) or unintended zero taxation (if both use a residence test, but on a different basis).31 Coordination will also facilitate resolution of cross-border institutions.
Countries that do not adopt contribution schemes should act as ‘good neighbors’ to those that do. Just as the G-20 has enjoined tax havens not to undermine the tax systems of other countries, so countries that choose not to adopt new contribution schemes should take reasonable steps not to hamper implementation in those that do. This may mean, for instance, refraining from offering particularly favorable tax treatment to activities or institutions that are a focus of such schemes. International cooperation should include a willingness, subject to appropriate safeguards, to exchange relevant information between authorities in different jurisdictions when appropriate, to allow enforcement of those charges. Where more than one authority could collect contributions, it is important to determine which authority will be responsible for resolution and potential costs of failures.
1.4 A Way Forward
1.4.1Elements of Reform32 The direct fiscal costs of financial sector failures should be contained and covered by a “Financial Stability Contribution” (FSC) linked to a credible and effective resolution mechanism. The main component of this FSC would be a levy to provision for the net fiscal cost of direct support to the financial sector and help reduce excessive risk-taking; a second and smaller component would be a fee to pay for the availability of a credit line to ensure that the gross financing needs can be met even if the resources accumulated through the levy are insufficient. The first element
31Accounting practices may be important here: IFRS as employed in the European Union and U.S. GAAP in the United States, for example, can result in very large differences in balance sheet bases because of differing accounting treatment, particularly of derivatives. Allowing for adjustments to the base or differing (minimum) rates may mitigate this difficulty, but close and cooperative attention to detail will be critical. 32Annex Table 2 summarizes.
Financial Sector Taxation: The IMF’s Report to the G-20 and Background Material
24
could—but does not need to—feed a resolution fund that would put aside the levies paid by the industry to cover the expected costs of resolving failed institutions. The second would go to general revenue regardless of the existence of a fund. The rate of the FSC should be refined over time to reflect explicitly systemic risk. The FSC would ensure that the sector helps meet the costs of any potential resolutions and would reduce systemic risk. If properly designed and resourced, resolution mechanisms will avoid governments in the future being forced to bail out institutions deemed too important, too big, or too interconnected to fail. The FSC could be supplemented, if needed, by a temporary ex post recovery charge.
Any further contribution desired from the financial sector should be raised by a “Financial Activities Tax” (FAT) levied on the sum of the profits and remuneration of financial institutions, and paid to general revenue. Depending on its design, the FAT would ensure that the financial sector contributes to the wider fiscal costs associated with financial crises, address some equity concerns, help offset tax distortions that may result in the financial sector being too large, and/or reduce excessive risk-taking.
International cooperation would be beneficial given the importance and complexity of cross-border financial institutions. The experiences of countries in the recent crisis differ widely, and so do their priorities as they emerge from it. But no country is immune from the risk of future—and inevitably global—financial crisis. Unilateral actions risk being undermined by tax and regulatory arbitrage, and may jeopardize national industries’ competitiveness. Coordinated action, especially by the leading financial sectors, would promote a level playing field, ease implementation, and facilitate the treatment of cross-border institutions. Effective cooperation does not require full uniformity, but broad agreement on the principles, including on the base (adjusting for accounting differences), minimum rate, risk-adjustment, and on avoiding double taxation across countries. The need is likely to be less for the FSC than for (some forms of) the FAT: in principle, risk-adjustment of the former would mean that countries which fear penalizing their own relatively safe financial sector would simply find that their levy was correspondingly lower.
1.4.2 Other Considerations and Next Steps While new instruments are clearly required, action is also needed to reduce current tax distortions that run counter to regulatory and stability objectives. The pervasive tax bias in favor of debt finance could be addressed by any of a range of reforms to the corporate income tax, such as providing a tax deduction for some notional return on equity (and possibly limiting that for interest too), as several countries have already done. Aggressive tax planning in the financial sector could be addressed more firmly, perhaps building on the cooperation already established in relation to tax havens.
Implementation of these measures needs to be coordinated with that of the wider regulatory reform agenda, and the effects on the wider economy carefully assessed. Regulatory and tax policies towards the financial sector have been formed largely independently of each other. A more holistic approach is needed to ensure that they are properly aligned in both the incentives and the overall burden they imply for the sector. It is important that the reforms be carefully designed so as not to harm the industry’s ability to rebuild its capital base, and to ensure that

Financial Sector Taxation: The IMF’s Report to the G-20 and Background Material
25
shadow banking or other distortions are not encouraged by over-regulating or over-taxing some parts of the financial sector.
The IMF stands ready to undertake further analysis of the issues and proposals raised in this report, particularly in the context of the joint IMF/FSB/BCBS work on assessing the cumulative quantitative impact of regulation and tax burdens on the financial sector. Clearly there is scope too for more analysis of the desirable forms, level, scope, and impact of any new levies or taxes.
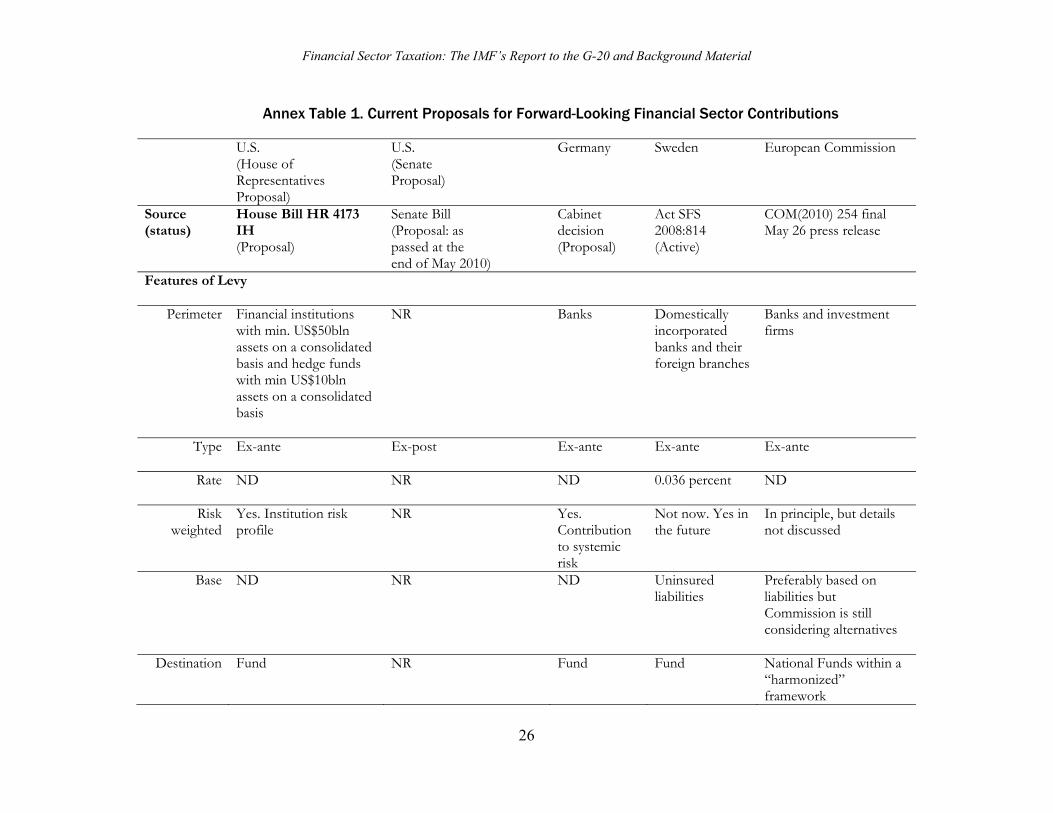
Financial Sector Taxation: The IMF’s Report to the G-20 and Background Material
26
Annex Table 1. Current Proposals for Forward-Looking Financial Sector Contributions U.S.
(House of Representatives Proposal)
U.S. (Senate Proposal)
Germany Sweden European Commission
Source (status)
House Bill HR 4173 IH (Proposal)
Senate Bill (Proposal: as passed at the end of May 2010)
Cabinet decision (Proposal)
Act SFS 2008:814 (Active)
COM(2010) 254 final May 26 press release
Features of Levy
Perimeter Financial institutions with min. US$50bln assets on a consolidated basis and hedge funds with min US$10bln assets on a consolidated basis
NR Banks Domestically incorporated banks and their foreign branches
Banks and investment firms
Type
Ex-ante Ex-post Ex-ante Ex-ante Ex-ante
Rate ND NR ND 0.036 percent
ND
Risk weighted
Yes. Institution risk profile
NR Yes. Contribution to systemic risk
Not now. Yes in the future
In principle, but details not discussed
Base ND NR ND Uninsured liabilities
Preferably based on liabilities but Commission is still considering alternatives
Destination
Fund NR Fund Fund National Funds within a “harmonized” framework
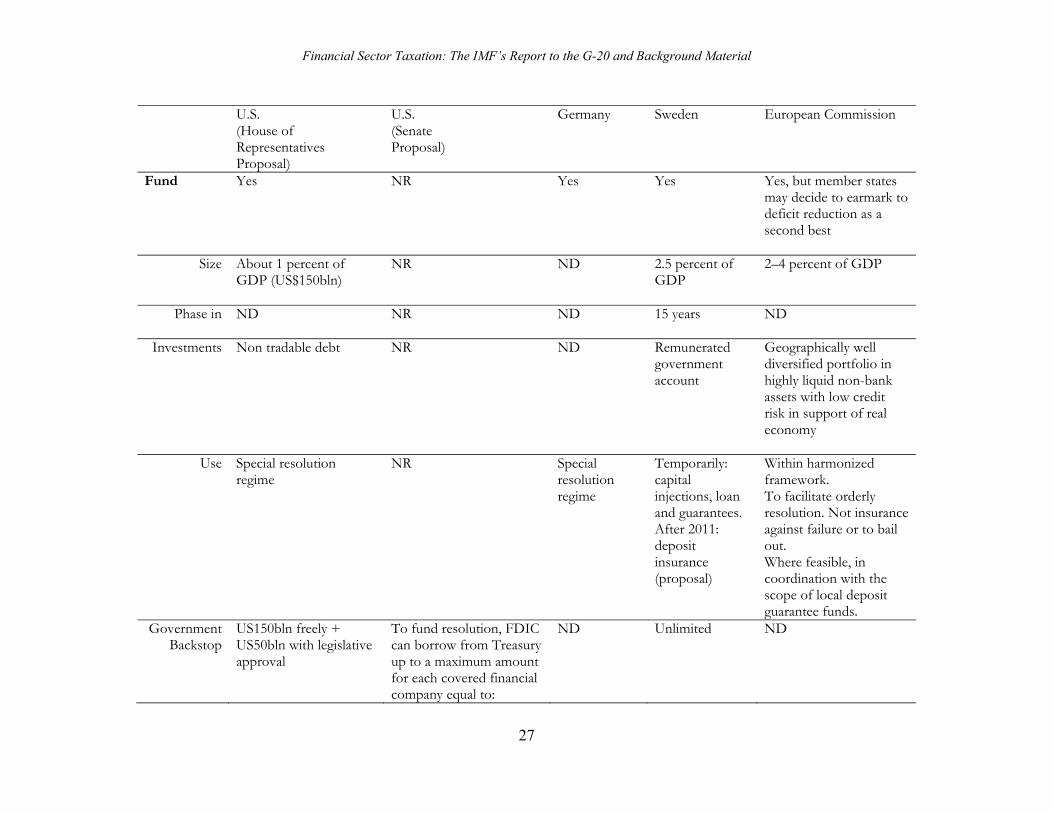
Financial Sector Taxation: The IMF’s Report to the G-20 and Background Material
27
U.S. (House of Representatives Proposal)
U.S. (Senate Proposal)
Germany Sweden European Commission
Fund Yes NR Yes Yes Yes, but member states may decide to earmark to deficit reduction as a second best
Size About 1 percent of GDP (US$150bln)
NR ND 2.5 percent of GDP
2–4 percent of GDP
Phase in
ND NR ND 15 years ND
Investments Non tradable debt NR ND Remunerated government account
Geographically well diversified portfolio in highly liquid non-bank assets with low credit risk in support of real economy
Use Special resolution regime
NR Special resolution regime
Temporarily: capital injections, loan and guarantees. After 2011: deposit insurance (proposal)
Within harmonized framework. To facilitate orderly resolution. Not insurance against failure or to bail out. Where feasible, in coordination with the scope of local deposit guarantee funds.
Government Backstop
US150bln freely + US50bln with legislative approval
To fund resolution, FDIC can borrow from Treasury up to a maximum amount for each covered financial company equal to:
ND Unlimited ND
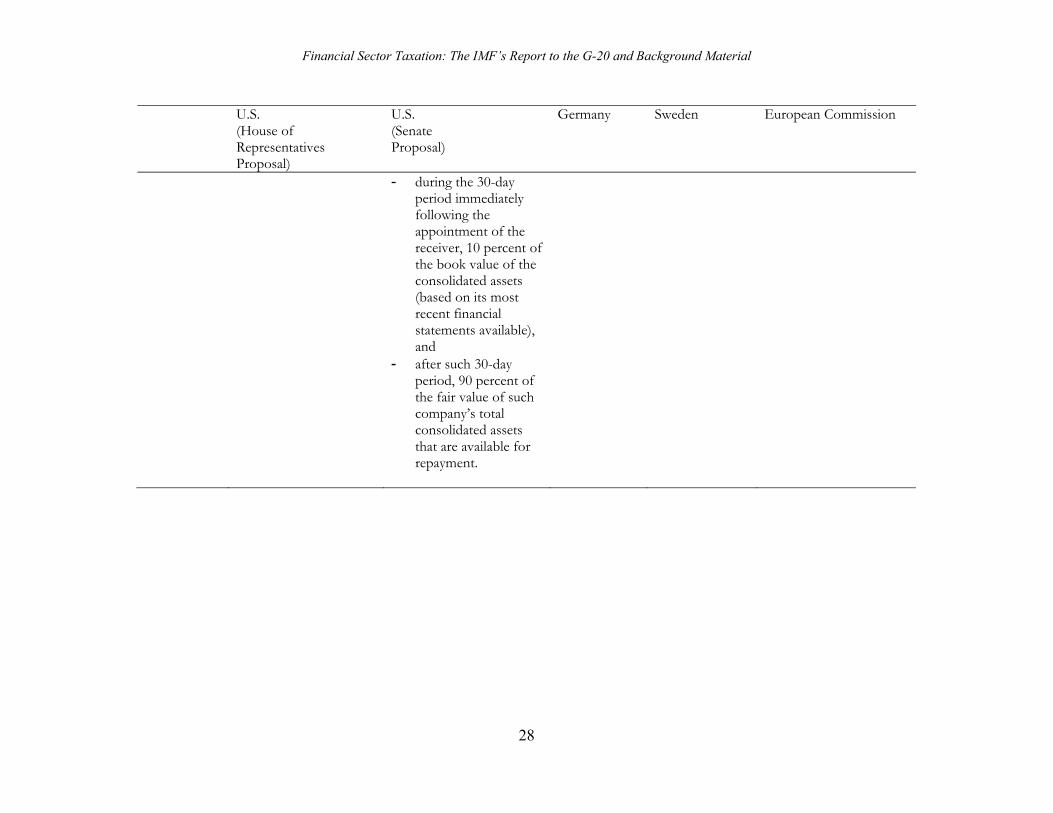
Financial Sector Taxation: The IMF’s Report to the G-20 and Background Material
28
U.S. (House of Representatives Proposal)
U.S. (Senate Proposal)
Germany Sweden European Commission
- during the 30-day period immediately following the appointment of the receiver, 10 percent of the book value of the consolidated assets (based on its most recent financial statements available), and
- after such 30-day period, 90 percent of the fair value of such company’s total consolidated assets that are available for repayment.
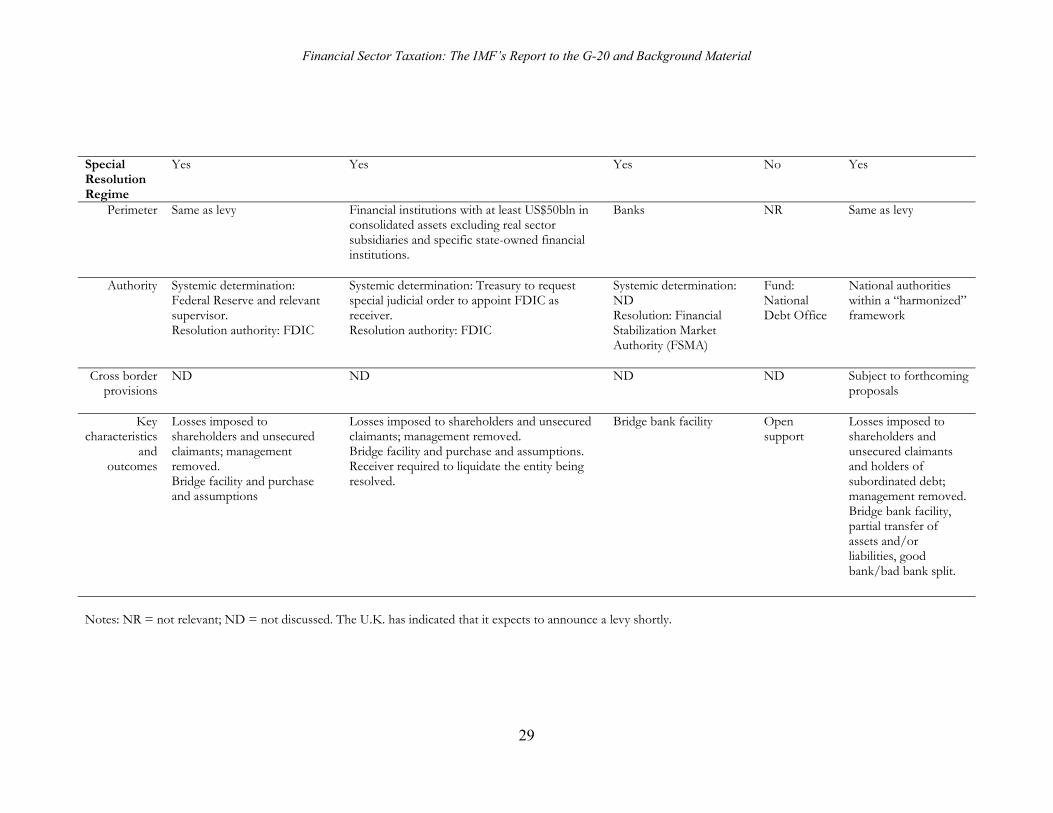
Financial Sector Taxation: The IMF’s Report to the G-20 and Background Material
29
Special Resolution Regime
Yes Yes Yes No Yes
Perimeter Same as levy Financial institutions with at least US$50bln in consolidated assets excluding real sector subsidiaries and specific state-owned financial institutions.
Banks NR Same as levy
Authority Systemic determination: Federal Reserve and relevant supervisor. Resolution authority: FDIC
Systemic determination: Treasury to request special judicial order to appoint FDIC as receiver. Resolution authority: FDIC
Systemic determination: ND Resolution: Financial Stabilization Market Authority (FSMA)
Fund: National Debt Office
National authorities within a “harmonized” framework
Cross border provisions
ND ND ND ND Subject to forthcoming proposals
Key characteristics
and outcomes
Losses imposed to shareholders and unsecured claimants; management removed. Bridge facility and purchase and assumptions
Losses imposed to shareholders and unsecured claimants; management removed. Bridge facility and purchase and assumptions. Receiver required to liquidate the entity being resolved.
Bridge bank facility Open support
Losses imposed to shareholders and unsecured claimants and holders of subordinated debt; management removed.Bridge bank facility, partial transfer of assets and/or liabilities, good bank/bad bank split.
Notes: NR = not relevant; ND = not discussed. The U.K. has indicated that it expects to announce a levy shortly.
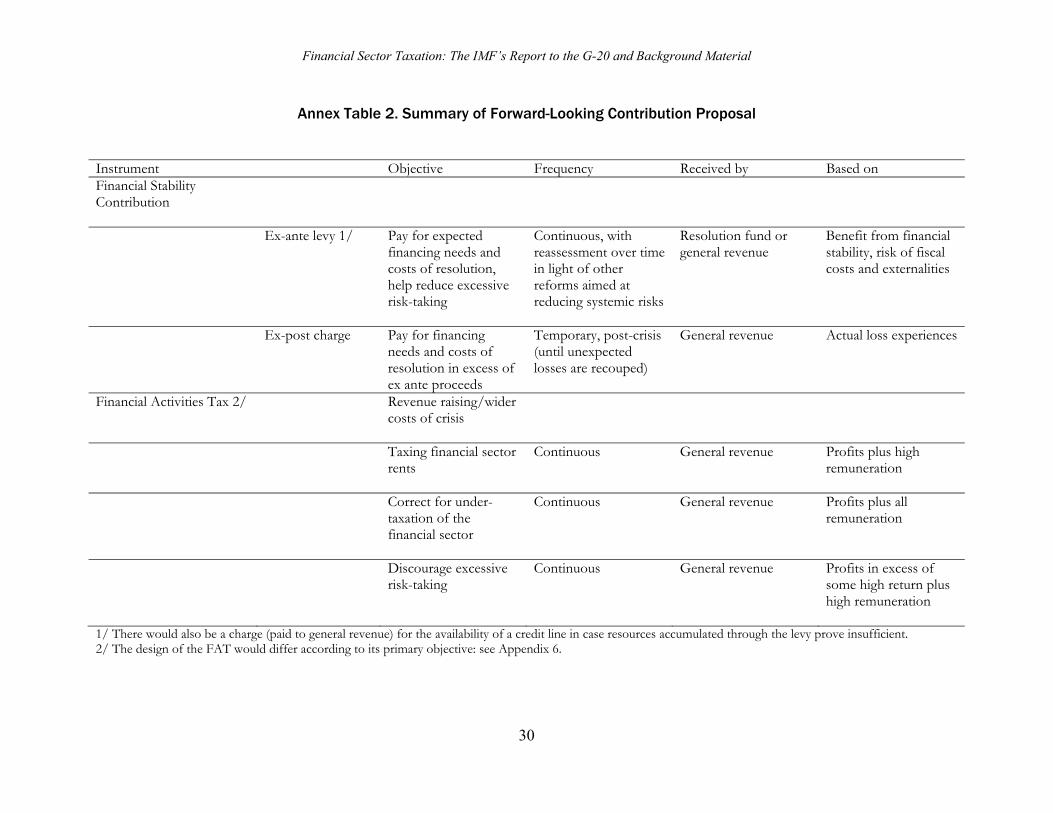
Financial Sector Taxation: The IMF’s Report to the G-20 and Background Material
30
Annex Table 2. Summary of Forward-Looking Contribution Proposal
Instrument Objective Frequency Received by Based on Financial Stability Contribution
Ex-ante levy 1/ Pay for expected financing needs and costs of resolution, help reduce excessive risk-taking
Continuous, with reassessment over time in light of other reforms aimed at reducing systemic risks
Resolution fund or general revenue
Benefit from financial stability, risk of fiscal costs and externalities
Ex-post charge Pay for financing needs and costs of resolution in excess of ex ante proceeds
Temporary, post-crisis (until unexpected losses are recouped)
General revenue Actual loss experiences
Financial Activities Tax 2/ Revenue raising/wider costs of crisis
Taxing financial sector rents
Continuous General revenue Profits plus high remuneration
Correct for under-taxation of the financial sector
Continuous General revenue Profits plus all remuneration
Discourage excessive risk-taking
Continuous General revenue Profits in excess of some high return plus high remuneration
1/ There would also be a charge (paid to general revenue) for the availability of a credit line in case resources accumulated through the levy prove insufficient. 2/ The design of the FAT would differ according to its primary objective: see Appendix 6.
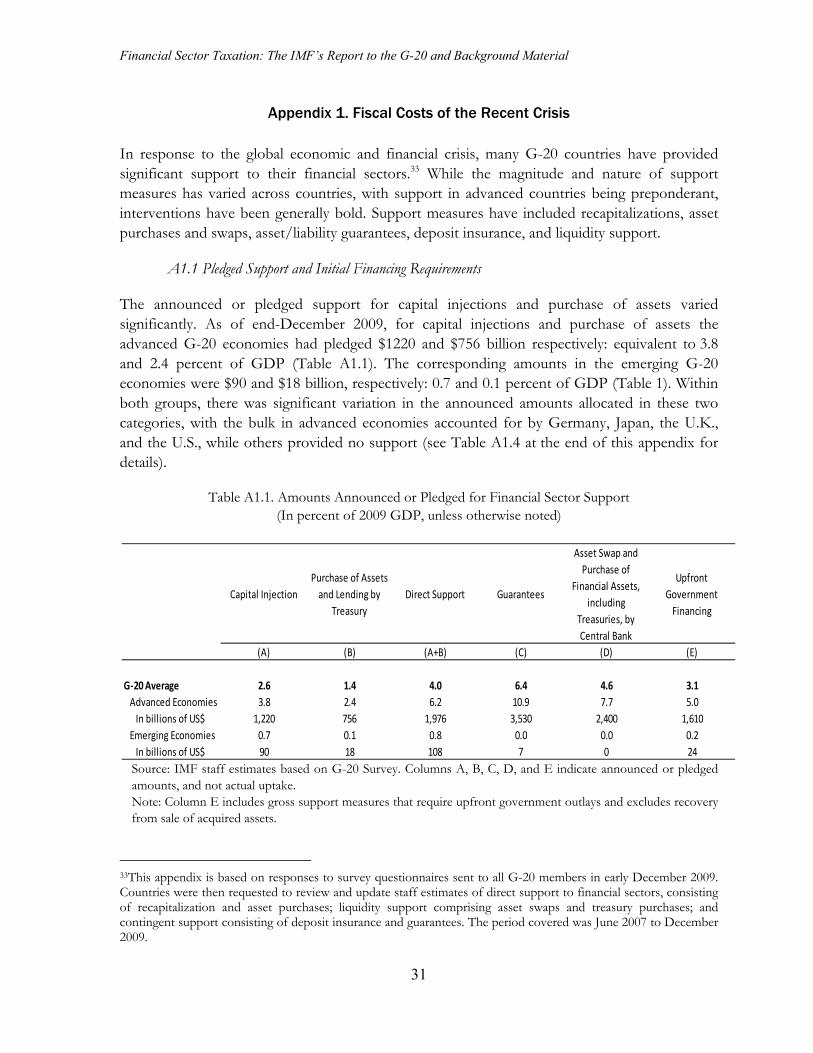
Financial Sector Taxation: The IMF’s Report to the G-20 and Background Material
31
Appendix 1. Fiscal Costs of the Recent Crisis In response to the global economic and financial crisis, many G-20 countries have provided significant support to their financial sectors.33 While the magnitude and nature of support measures has varied across countries, with support in advanced countries being preponderant, interventions have been generally bold. Support measures have included recapitalizations, asset purchases and swaps, asset/liability guarantees, deposit insurance, and liquidity support.
A1.1 Pledged Support and Initial Financing Requirements
The announced or pledged support for capital injections and purchase of assets varied significantly. As of end-December 2009, for capital injections and purchase of assets the advanced G-20 economies had pledged $1220 and $756 billion respectively: equivalent to 3.8 and 2.4 percent of GDP (Table A1.1). The corresponding amounts in the emerging G-20 economies were $90 and $18 billion, respectively: 0.7 and 0.1 percent of GDP (Table 1). Within both groups, there was significant variation in the announced amounts allocated in these two categories, with the bulk in advanced economies accounted for by Germany, Japan, the U.K., and the U.S., while others provided no support (see Table A1.4 at the end of this appendix for details).
Table A1.1. Amounts Announced or Pledged for Financial Sector Support (In percent of 2009 GDP, unless otherwise noted)
Source: IMF staff estimates based on G-20 Survey. Columns A, B, C, D, and E indicate announced or pledged amounts, and not actual uptake. Note: Column E includes gross support measures that require upfront government outlays and excludes recovery from sale of acquired assets.
33This appendix is based on responses to survey questionnaires sent to all G-20 members in early December 2009. Countries were then requested to review and update staff estimates of direct support to financial sectors, consisting of recapitalization and asset purchases; liquidity support comprising asset swaps and treasury purchases; and contingent support consisting of deposit insurance and guarantees. The period covered was June 2007 to December 2009.
Capital Injection
Purchase of Assets
and Lending by
Treasury
Direct Support Guarantees
Asset Swap and
Purchase of
Financial Assets,
including
Treasuries, by
Central Bank
Upfront
Government
Financing
(A) (B) (A+B) (C) (D) (E)
G-20 Average 2.6 1.4 4.0 6.4 4.6 3.1
Advanced Economies 3.8 2.4 6.2 10.9 7.7 5.0
In billions of US$ 1,220 756 1,976 3,530 2,400 1,610
Emerging Economies 0.7 0.1 0.8 0.0 0.0 0.2
In billions of US$ 90 18 108 7 0 24
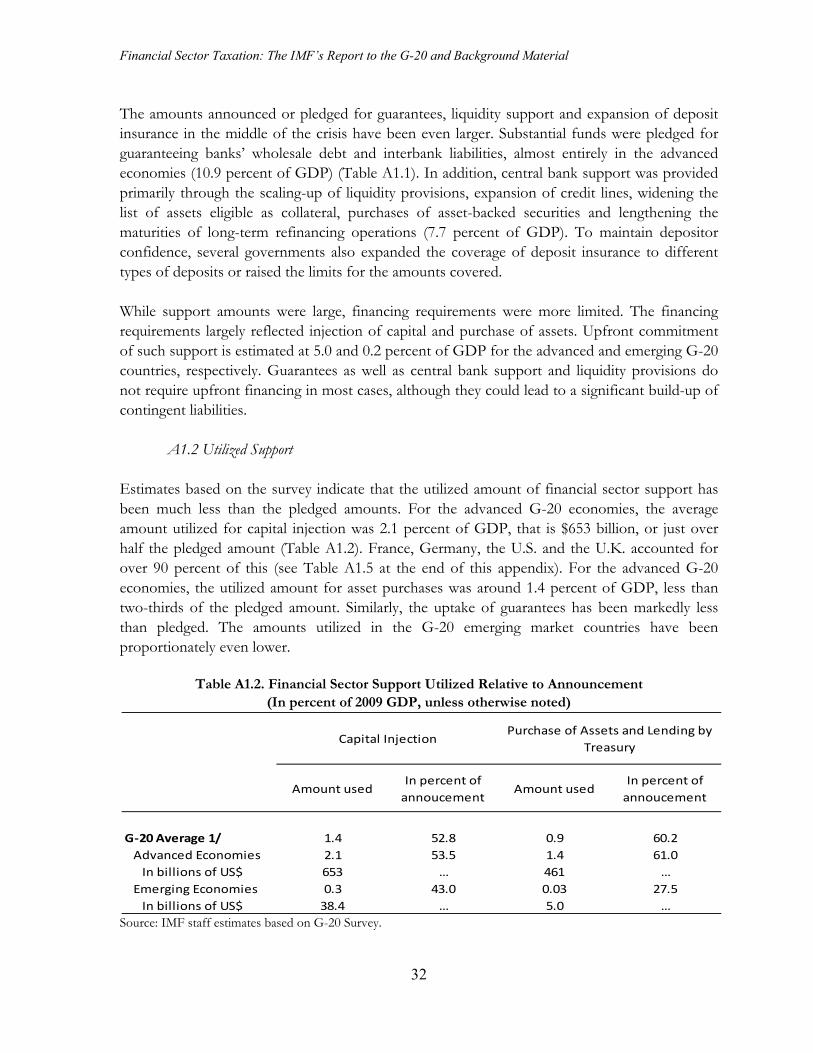
Financial Sector Taxation: The IMF’s Report to the G-20 and Background Material
32
The amounts announced or pledged for guarantees, liquidity support and expansion of deposit insurance in the middle of the crisis have been even larger. Substantial funds were pledged for guaranteeing banks’ wholesale debt and interbank liabilities, almost entirely in the advanced economies (10.9 percent of GDP) (Table A1.1). In addition, central bank support was provided primarily through the scaling-up of liquidity provisions, expansion of credit lines, widening the list of assets eligible as collateral, purchases of asset-backed securities and lengthening the maturities of long-term refinancing operations (7.7 percent of GDP). To maintain depositor confidence, several governments also expanded the coverage of deposit insurance to different types of deposits or raised the limits for the amounts covered. While support amounts were large, financing requirements were more limited. The financing requirements largely reflected injection of capital and purchase of assets. Upfront commitment of such support is estimated at 5.0 and 0.2 percent of GDP for the advanced and emerging G-20 countries, respectively. Guarantees as well as central bank support and liquidity provisions do not require upfront financing in most cases, although they could lead to a significant build-up of contingent liabilities.
A1.2 Utilized Support Estimates based on the survey indicate that the utilized amount of financial sector support has been much less than the pledged amounts. For the advanced G-20 economies, the average amount utilized for capital injection was 2.1 percent of GDP, that is $653 billion, or just over half the pledged amount (Table A1.2). France, Germany, the U.S. and the U.K. accounted for over 90 percent of this (see Table A1.5 at the end of this appendix). For the advanced G-20 economies, the utilized amount for asset purchases was around 1.4 percent of GDP, less than two-thirds of the pledged amount. Similarly, the uptake of guarantees has been markedly less than pledged. The amounts utilized in the G-20 emerging market countries have been proportionately even lower.
Table A1.2. Financial Sector Support Utilized Relative to Announcement (In percent of 2009 GDP, unless otherwise noted)
Source: IMF staff estimates based on G-20 Survey.
Amount usedIn percent of
annoucementAmount used
In percent of
annoucement
G-20 Average 1/ 1.4 52.8 0.9 60.2
Advanced Economies 2.1 53.5 1.4 61.0
In billions of US$ 653 … 461 …
Emerging Economies 0.3 43.0 0.03 27.5
In billions of US$ 38.4 … 5.0 …
Capital InjectionPurchase of Assets and Lending by
Treasury
Financial Sector Taxation: The IMF’s Report to the G-20 and Background Material
33
There are several reasons for the generally low utilized amounts. In part, they reflect the precautionary nature of initial pledges, reflecting the uncertainties prevailing at the time and the need to err on the side of caution so as to increase market confidence. In part, the lower rates reflected more efficient use of government resources, e.g., using capital injections rather than asset purchases. They also reflected increasing stability of market conditions and improving bank liquidity (uptakes slowed down markedly after initial recapitalizations). In some cases, lags in implementation of programs for recapitalization and purchase of assets may have also played some role.
A1.3 Recovery of Assets and Net Cost of Support Measures Many of the support arrangements were structured so that the financial sector pays, at least in part, for the cost of the support over time. Recoveries related to the capitalization efforts will reflect repurchases, dividends, and the sale of warrants. For asset protection schemes, banks paid to participate and were charged an exit fee for signing up and when exiting. Fees were also received for the provision of guarantees, and for deposit insurance funds monies were sometimes recouped from special levies assessed on the banking sector. As economic conditions and markets have stabilized, some recovery of assets has begun, but recovery to date has been relatively low. 34 Survey responses35 suggest that to-date, recovery—mainly through repurchase of shares, fees, and interest income, and to a very small extent the sale of assets—amounts on average to about 0.8 percent of GDP (that is, $237 billion) (Table A1.3). Taking into account these data, the net direct cost of recapitalization and asset purchases are estimated to average 2.8 percent of GDP ($877 billion) for the advanced G-20 economies and 1.8 percent of GDP for the G-20 as a whole. This gives a recovery rate to-date of 21 percent. While this is significantly lower than the average (55 percent) in past crises in advanced countries, historically, recovery has occurred over a period of five to seven years.36 Total expenditures in public recapitalization to address the crisis have been only slightly below historical norms, while guarantee measures have been used more extensively.37
34For cross-country consistency, ‘recovery’ here does not include unrealized gains on assets acquired by the public sector as part of the financial sector support package, but occurs only when these gains are realized as the assets are divested. 35The information requested was for recovery projected for the next three years, but most authorities provided data only on recovery to-date. 36Though volatile, a mark-to-market valuation of the assets acquired by the government during the crisis could provide some indication of the extent of future recovery by divesting the assets. For example, in the United Kingdom, £69.7 billion worth of common stocks were purchased for recapitalizing banks, £2.56 billion of which have been sold. The market value of the common stocks still held by the government was around £57.6 billion at end-2009, and increased further to £70 billion as of end-April, 2010, implying that if divested now, this particular support measure is likely to generate net gains to the government. 37Bank recapitalization expenditure for countries undergoing a systemic crisis in the past has averaged 8 percent of GDP (Laeven and Valencia, 2008). According to Laeven and Valencia’s (2010) definition, only three G-20 countries experienced a systemic crisis in 2007–09 (U.S., U.K. and Germany) and their direct fiscal costs averaged 4.8 percent of GDP.
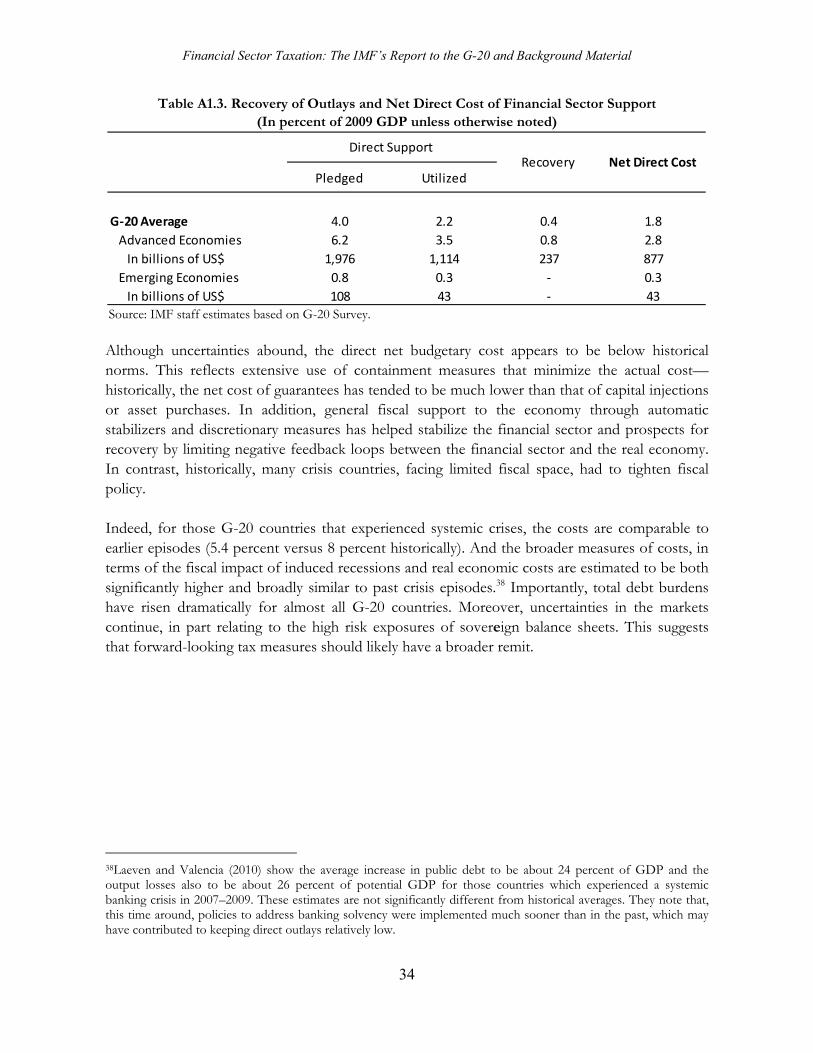
Financial Sector Taxation: The IMF’s Report to the G-20 and Background Material
34
Table A1.3. Recovery of Outlays and Net Direct Cost of Financial Sector Support (In percent of 2009 GDP unless otherwise noted)
Source: IMF staff estimates based on G-20 Survey. Although uncertainties abound, the direct net budgetary cost appears to be below historical norms. This reflects extensive use of containment measures that minimize the actual cost—historically, the net cost of guarantees has tended to be much lower than that of capital injections or asset purchases. In addition, general fiscal support to the economy through automatic stabilizers and discretionary measures has helped stabilize the financial sector and prospects for recovery by limiting negative feedback loops between the financial sector and the real economy. In contrast, historically, many crisis countries, facing limited fiscal space, had to tighten fiscal policy. Indeed, for those G-20 countries that experienced systemic crises, the costs are comparable to earlier episodes (5.4 percent versus 8 percent historically). And the broader measures of costs, in terms of the fiscal impact of induced recessions and real economic costs are estimated to be both significantly higher and broadly similar to past crisis episodes.38 Importantly, total debt burdens have risen dramatically for almost all G-20 countries. Moreover, uncertainties in the markets continue, in part relating to the high risk exposures of sovereign balance sheets. This suggests that forward-looking tax measures should likely have a broader remit.
38Laeven and Valencia (2010) show the average increase in public debt to be about 24 percent of GDP and the output losses also to be about 26 percent of potential GDP for those countries which experienced a systemic banking crisis in 2007–2009. These estimates are not significantly different from historical averages. They note that, this time around, policies to address banking solvency were implemented much sooner than in the past, which may have contributed to keeping direct outlays relatively low.
Pledged Utilized
G-20 Average 4.0 2.2 0.4 1.8
Advanced Economies 6.2 3.5 0.8 2.8
In billions of US$ 1,976 1,114 237 877
Emerging Economies 0.8 0.3 - 0.3
In billions of US$ 108 43 - 43
Recovery Net Direct CostDirect Support
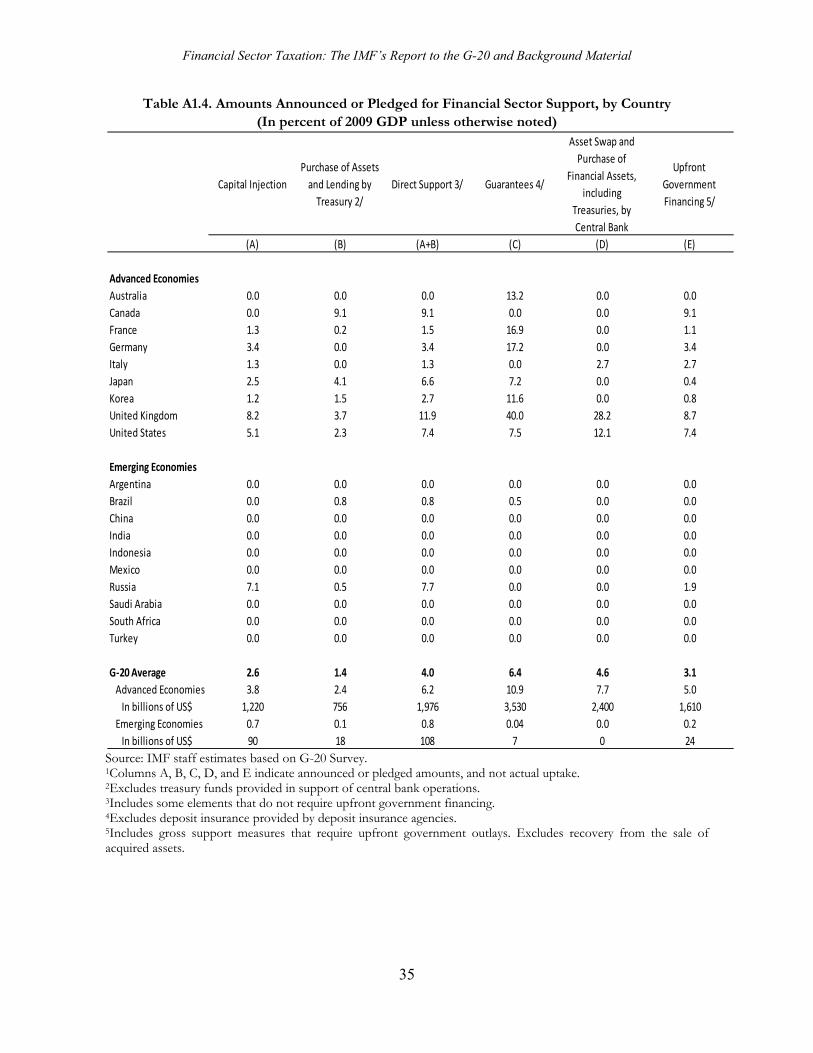
Financial Sector Taxation: The IMF’s Report to the G-20 and Background Material
35
Table A1.4. Amounts Announced or Pledged for Financial Sector Support, by Country (In percent of 2009 GDP unless otherwise noted)
Source: IMF staff estimates based on G-20 Survey. 1Columns A, B, C, D, and E indicate announced or pledged amounts, and not actual uptake. 2Excludes treasury funds provided in support of central bank operations. 3Includes some elements that do not require upfront government financing. 4Excludes deposit insurance provided by deposit insurance agencies. 5Includes gross support measures that require upfront government outlays. Excludes recovery from the sale of acquired assets.
Capital Injection
Purchase of Assets
and Lending by
Treasury 2/
Direct Support 3/ Guarantees 4/
Asset Swap and
Purchase of
Financial Assets,
including
Treasuries, by
Central Bank
Upfront
Government
Financing 5/
(A) (B) (A+B) (C) (D) (E)
Advanced Economies
Australia 0.0 0.0 0.0 13.2 0.0 0.0
Canada 0.0 9.1 9.1 0.0 0.0 9.1
France 1.3 0.2 1.5 16.9 0.0 1.1
Germany 3.4 0.0 3.4 17.2 0.0 3.4
Italy 1.3 0.0 1.3 0.0 2.7 2.7
Japan 2.5 4.1 6.6 7.2 0.0 0.4
Korea 1.2 1.5 2.7 11.6 0.0 0.8
United Kingdom 8.2 3.7 11.9 40.0 28.2 8.7
United States 5.1 2.3 7.4 7.5 12.1 7.4
Emerging Economies
Argentina 0.0 0.0 0.0 0.0 0.0 0.0
Brazil 0.0 0.8 0.8 0.5 0.0 0.0
China 0.0 0.0 0.0 0.0 0.0 0.0
India 0.0 0.0 0.0 0.0 0.0 0.0
Indonesia 0.0 0.0 0.0 0.0 0.0 0.0
Mexico 0.0 0.0 0.0 0.0 0.0 0.0
Russia 7.1 0.5 7.7 0.0 0.0 1.9
Saudi Arabia 0.0 0.0 0.0 0.0 0.0 0.0
South Africa 0.0 0.0 0.0 0.0 0.0 0.0
Turkey 0.0 0.0 0.0 0.0 0.0 0.0
G-20 Average 2.6 1.4 4.0 6.4 4.6 3.1
Advanced Economies 3.8 2.4 6.2 10.9 7.7 5.0
In billions of US$ 1,220 756 1,976 3,530 2,400 1,610
Emerging Economies 0.7 0.1 0.8 0.04 0.0 0.2
In billions of US$ 90 18 108 7 0 24
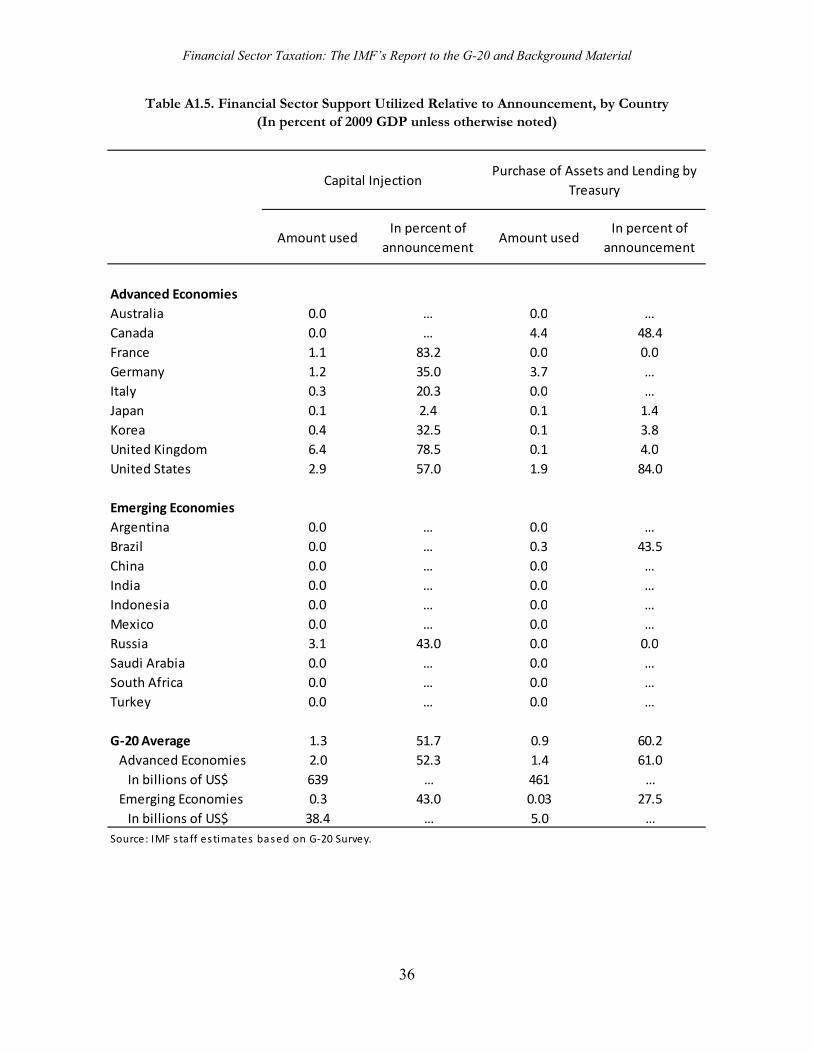
Financial Sector Taxation: The IMF’s Report to the G-20 and Background Material
36
Table A1.5. Financial Sector Support Utilized Relative to Announcement, by Country (In percent of 2009 GDP unless otherwise noted)
Amount usedIn percent of
announcementAmount used
In percent of
announcement
Advanced Economies
Australia 0.0 … 0.0 …
Canada 0.0 … 4.4 48.4
France 1.1 83.2 0.0 0.0
Germany 1.2 35.0 3.7 …
Italy 0.3 20.3 0.0 …
Japan 0.1 2.4 0.1 1.4
Korea 0.4 32.5 0.1 3.8
United Kingdom 6.4 78.5 0.1 4.0
United States 2.9 57.0 1.9 84.0
Emerging Economies
Argentina 0.0 … 0.0 …
Brazil 0.0 … 0.3 43.5
China 0.0 … 0.0 …
India 0.0 … 0.0 …
Indonesia 0.0 … 0.0 …
Mexico 0.0 … 0.0 …
Russia 3.1 43.0 0.0 0.0
Saudi Arabia 0.0 … 0.0 …
South Africa 0.0 … 0.0 …
Turkey 0.0 … 0.0 …
G-20 Average 1.3 51.7 0.9 60.2
Advanced Economies 2.0 52.3 1.4 61.0
In billions of US$ 639 … 461 …
Emerging Economies 0.3 43.0 0.03 27.5
In billions of US$ 38.4 … 5.0 …
Source: IMF s taff es timates based on G-20 Survey.
Capital InjectionPurchase of Assets and Lending by
Treasury
Financial Sector Taxation: The IMF’s Report to the G-20 and Background Material
37
Appendix 2. Contribution-Related Measures Adopted or Proposed This appendix describes eight tax or contribution-related initiatives adopted or proposed since the crisis: the Financial Crisis Responsibility levy proposed in the U.S., the temporary taxes on bonuses adopted in France and the U.K., the permanent tax on bonuses and stock options introduced in Italy (all pure tax instruments), the proposed levy in Germany and dissolution fund in the U.S., the Swedish stability fund (all linked to initiatives on resolution) and the resolution funds and levy proposed by the European Commission.
A2.1 Financial Crisis Responsibility Fee in the U.S.
On January 14, 2010, the Obama Administration announced that it would seek to impose a 0.15 percent tax on the liabilities of large financial institutions to repay the budgetary expenditures associated with the financial crisis. Covered institutions would include firms that were insured depository institutions, bank holding companies, thrift holding companies, insurance or other companies that owned insured depository institutions, or securities broker-dealers as of January 14, 2010, or that become one of these types of firms thereafter. Both domestic firms and U.S. subsidiaries of foreign firms with assets of more than $50 billion would be subject to the “Financial Crisis Responsibility” fee (FCR). The proposed nature of the base has evolved during legislative discussion, the suggestion at the time of this report being that it comprise total (risk weighted) assets minus Tier one capital minus FDIC assessed deposits (or insurance reserves, as appropriate). The Administration estimates that (net of corporate income tax, against which it is deductible) the FCR will raise $90 billion during 2011–2020. The Congressional Budget Office (CBO) estimates that total the cost of the TARP will be about $99 billion, plus $200 million annually in administrative costs. Some $47 billion of these costs were generated by bailouts of the three U.S. automakers, which will not be subject to the FCR fee. The Administration has said, consistent with a cost-recovery provision in the TARP legislation, that the fee will be left in place until the TARP is fully paid off. The CBO estimates that about 60 entities currently qualify for taxation under the FCR. A few of these, such as AIG, GMAC Financial Services, and CIT Group, generated TARP losses. However, most did not generate losses, as they either (i) did not participate in TARP, (ii) are current on preferred dividends, or (iii) have repaid their TARP loans. All covered firms did, however, benefit generally from the financial system support provided by the bailout. The Administration anticipates that about 60 percent of FCR fees will be paid by the 10 largest institutions. U.S. corporations will be taxed under the FCR based on their worldwide consolidated assets, while foreign entities will be taxed based only on their U.S. assets. The incidence of the FCR will depend on the level of competition in markets for financial products. Because only a subset of large financial institutions will be taxed, competition from untaxed entities not subject to the FCR fee may prevent them passing along the costs to their
Financial Sector Taxation: The IMF’s Report to the G-20 and Background Material
38
clients. In this case, employees and/or current shareholders would bear the cost of the tax in the form of lower compensation and/or share values, respectively; if the market for financial skills were sufficiently competitive, the real cost of the fee would be borne solely by shareholders. The CBO projects that due to its low rate, the FCR will not have a significant economic impact. Affected financial institutions may reduce their debt slightly in response to the tax or become more dependent on deposits. However, the CBO notes that the fee could give an incentive to taxed institutions to assume more risk in order to recoup reduced profitability. Other commentators note that the effect of the fee could vary greatly among markets and products, with high-margin activities being little affected but low-margin activities, such as repurchase financing and foreign exchange trading, being sharply curtailed.
A2.2 Bank Levy in Germany
On March 31, 2010, the German government announced plans to introduce a systemic risk-adjusted levy and a new resolution arrangement for banks and banking groups. The perimeter of the levy includes all banks, and the rate of the levy will be set to reflect systemic risk. Systemic risk will be determined on the basis, inter alia, of the size of a bank’s liabilities, excluding capital and deposits, and its interconnectedness with other financial market participants. The purpose of the levy is to mitigate incentives leading to excessive systemic risk by internalizing the negative externalities of systemic relevance. Thus, the bank levy is designed to be corrective, and likely to be permanent. The Federal Ministry of Finance is to monitor the level of the levy and the burden on German banks.
The levy is to be paid into a stability fund which will finance a special resolution regime for systemically relevant banks. Financial supervisors will be given expanded legal powers to intervene in banks, and to transfer systemically important parts of a bank to a private-sector third party or a state-owned bridge bank, in order to enable an orderly wind down of non-systemic assets. Additional characteristics of the proposed resolution fund and process are: (i) resolution powers will include the ability to provide capital injections, guarantees and reorganization/restructure to preserve the value as an ongoing concern of the institution; (ii) the state-owned bridge company could then be sold to the private sector or liquidated, depending on the outcome of the restructuring process; (iii) the fund is not to be used to provide liquidity support, with such measures being provided ex ante through the mutual support arrangements in the three pillar system; and (iv) the size of the fund is not yet determined.
The fund and the special resolution regime will be entrusted to the Federal Agency for Financial-Market Stabilisation (FMSA). The FMSA was created in 2008 to manage the recapitalization and restructuring of failing financial institutions during the financial crisis. It is now planned to become a permanent financial restructuring and resolution agency, and will be in charge of collecting the levy.
Ongoing discussions anticipate that there will be a government backstop. However, it is not yet decided whether it will be explicit, and if so of what size, or implicit and determined case by case.
Financial Sector Taxation: The IMF’s Report to the G-20 and Background Material
39
A2.3 Temporary Bank Payroll Tax in the U.K.
The U.K. implemented, from December 9, 2009, a temporary tax on bonuses paid to bank employees: the “Bank Payroll Tax” (BPT). The stated objectives of the BPT were to address “remuneration practices that contributed to excessive risk-taking by the U.K. banking industry” and “encourage banks to consider their capital position and to make appropriate risk-adjustments when settling the level of bonus payments.” It was intended to cover the period until the U.K. introduces new financial regulation legislation to better regulate remuneration practices. The BPT applies at a (tax-exclusive) rate of 50 percent to the excess of discretionary payments over ₤25,000 made by banks and building societies to their employees until April 5, 2010. Taxable institutions include banks, U.K. resident investment companies, U.K. resident financial trading companies in a banking group, building societies, U.K. branches of foreign banks and U.K. branches of a foreign financial trading company in a banking group. The tax is charged on amounts in excess of the threshold and applies only to amounts awarded between announcement of the BPT on December 9, 2009 and April 5, 2010. The gross bonuses remain subject to income tax and social security contributions, resulting in effective marginal rates on bonuses of up to 64 percent. Payments are not deductible against the corporate income tax. Tax due is to be remitted by taxable institutions on or before August 31, 2010. Anti-avoidance rules attempted to prevent banks bypassing the tax—for example, by using loans which are in substance earnings, or by deferring payment. Bonuses paid in the form of certain types of approved shares or share options are not subject to the BPT. Originally forecast to raise ₤550 million (0.04 percent of GDP), the BPT is now projected to raise about ₤2 billion.39 The initial estimate apparently assumed that introduction of the tax would radically curb bonus payments—in other words, that the burden of the tax would ultimately be borne, at least in large part, by the employees. Experience appears to have been otherwise.
A2.4 Temporary Bonus Tax in France
France has implemented a temporary tax on bonuses granted in the accounting year 2009 (including deferred bonuses, bonuses awarded as shares and guaranteed bonuses). The tax is payable by credit institutions and investment firms—except asset management companies—based in France subject to French corporate income tax. The tax is therefore payable by French branches of foreign financial institutions of this kind. The tax is levied at 50 percent (tax-inclusive) on the excess of bonuses over €27,500. The tax is assessed on bonuses paid to “financial market professionals whose activities are likely to have a material impact on the company's risk exposure” and financial market professionals controlling
39This is projected to be reduced to £1.3 billion by behavioral responses reducing receipts from the personal income tax and social contributions.
Financial Sector Taxation: The IMF’s Report to the G-20 and Background Material
40
such individuals. The scope of the tax includes variable compensation of traders (forex, fixed income, securities or derivatives traders), but does not include compensation of employees in support or control positions (back and middle office employees). Nor does it include brokerage activities, management portfolio services, merger and acquisition business, or financial analysis. Revenue is projected at €360 million. The proceeds of this tax were initially to be allocated (up to €270 million) to the French Deposit Guarantee Fund (reflecting the E.U.-wide extension of the guarantee from €70,000 to €100,000 per depositor). However, amendments were filed for the proceeds to be allocated to the financing of OSEO, a public institution in charge of financing innovation as well as support of SMEs.
A2.5 Permanent Tax on Bonuses and Stock Options in Italy
Italy has recently introduced a permanent tax on bonuses and stock options paid to managers and independent professionals working in the financial sector. Implemented by decree (subject to parliamentary approval), the tax takes effect from January 1, 2010. Its stated objective is to curb the use of bonuses and stock options as forms of remuneration in consideration of their “distortionary effects on the financial system and the world economy…as highlighted in the G-20 meetings.” The tax is charged at 10 percent on all bonuses and stock option gains exceeding three times managers’ fixed remunerations. Its scope is broad, covering managers and independent professionals working in banks and other financial institutions. The tax is applied in addition to the personal income tax, and brings the highest effective marginal tax rate on these forms of remuneration in the sector to 53 percent. The yield is expected to be about €10 million per year. This assumes that only high income individuals (with income above €100,000 a year), working in the financial sector, would receive bonuses and stock options.
A2.6 Systemic Dissolution Fund in the U.S.
A2.6a House Bill
Design of the Fund The U.S. systemic dissolution fund is foreseen in Bill HR 4173 IH. It would be established within the Treasury, managed by the FDIC, and invest in non-tradable government debt. Its purpose would be to facilitate the orderly dissolution of any covered financial company. Covered financial institutions are all large and potentially systemic financial companies. The financial companies included in the scheme would be those with at least $50 billion, or $10 billion in the case of hedge funds, in consolidated assets adjusted for inflation. These include banks,
Financial Sector Taxation: The IMF’s Report to the G-20 and Background Material
41
thrifts, insurance companies, other companies that own insured depository institutions and broker dealers. The fund has both minimum and maximum sizes. The minimum has not yet been defined. The maximum is $150 billion: this is roughly 1 percent of U.S. GDP, and is rationalized as the size of the fund that would have been necessary to dissolve the systemically important institutions in the autumn of 2008 that instead were then deemed too big to fail.
A2.6b Use of the Fund The dissolution fund is conceived within a new extra judiciary (administrative) and fast track resolution regime to dissolve systemically important financial institutions that were deemed “too big to fail” during the recent crisis. The traditional regimes in the bankruptcy code (chapter 11 and chapter 7) remain the default exit mechanisms for all ailing companies. The new regime is similar to that existing for FDIC-insured banks and is intended to instill confidence, for both the market and policymakers, that closing systemically important institutions will not lead to a systemic collapse. In particular, the regime leverages on the rule making powers of the FDIC and on the use of a bridge company with its own access to liquidity to provide continuity during the receivership process, while better preserving the value of financial assets for the benefit of creditors. The use of a bridge company is key to the proposed resolution regime. This tool allows the receiver to transfer assets and contracts from the failed firm to the bridge institution in order to retain franchise value and avoid fire sales of financial contracts. Under the proposed resolution process, financial market contracts could be transferred to the bridge institution run by the governmental receiver without triggering netting and liquidation rights. This could prove vital to avoid panic. The bridge financial institution can also maintain other systemically significant functions such as payments processing, securities lending, and the settlement of ongoing government securities or other transactions. Most critically, the bridge financial institution allows time to avoid a sudden loss of critical services and promotes market confidence.
The dissolution fund is used as working capital for the bridge company and cannot be used to provide open support to ailing companies. The bridge financial institution option, and the continuity it can provide, requires access to liquidity for ongoing operations. To achieve this, the proposed special resolution process includes ready access to liquidity for the bridge financial institution from a resolution fund provided from assessments paid by the industry. The fund can only be used to cover the receivership costs incurred by the FDIC in overseeing or acting as a receiver and the costs associated with the operations of the bridge company for the dissolution of covered financial institutions under the new extra judiciary, administrative, dissolution regime.
Financial Sector Taxation: The IMF’s Report to the G-20 and Background Material
42
A2.6c Assessment Fee
The fee would take several factors into account: (i) actual or expected losses to the fund; (ii) risk factors represented by the financial company to the financial system, in order to make the assessment risk-based; (iii) other assessments eventually paid by the institution to avoid double imposition of both the FCR and other fees (under the Federal Deposit Insurance Corporation (FDIC) Act, the Securities Investors Protection Corporation (SIPC) Act, the Federal Credit Union (FCU) Act, and relevant state insurance rehabilitation, restructuring and insolvency proceedings); and (iv) general economic conditions affecting financial companies, this serving to introduce a countercyclical element in the assessment. The details for the calculation of the assessment are yet to be defined. It is unclear how the assessment will vary according to the actual or expected losses to the fund, the risks posed by the covered financial institutions and general economic conditions. Only general risk criteria for basing the assessment are defined in the draft law including: (i) on and off-balance sheet concentration risk; (ii) activities of companies and affiliates; (iii) market share; (iv) exposure to sudden calls on liquidity; (v) amount and nature of leverage; (vi) amount and nature of financial obligations to and claims on other financial companies; (vii) amount and nature of reliance on short term and other sources of funding; (viii) company’s relevance as a source of credit to the real sector and liquidity to the financial sector; (ix) amount and nature of the company’s liabilities; and (x) other factors that the FDIC may determine as appropriate. The assessment fee would continue to be paid once the targeted amount of the fund is reached, then going to general revenues.
A2.6d Borrowing Authority from the State The FDIC can borrow from the Treasury but up to a ceiling. The FDIC can freely borrow from the Treasury up to the maximum size of $150 billion. It can also seek to borrow for an extra $50 billion, but such a request must be forwarded by the President of the United States to the legislature for approval. The government has priority claims on dissolution proceeds. Amounts realized from the dissolution of any covered financial institutions will be used to repay funds borrowed from the government and to re-capitalize the dissolution fund.
A2.6e Senate Bill At the time of writing (May 2010), the U.S. Senate approved a different version of the bill. Similarly to the House version of the bill, the Senate version (called “Restoring American Financial Stability Act”) maintains the orderly resolution authority modeled on bank resolution statute. In particular, the FDIC retains its core resolution powers to take control of the institution as receiver, to act quickly to sell all or any selected assets and liabilities to a third party (regardless of priorities among creditors and without the consent of any affected party or court approval ) or,
Financial Sector Taxation: The IMF’s Report to the G-20 and Background Material
43
if a third party buyer cannot be found at fair value, to establish one or more temporary bridge financial companies to hold the part of the business worth preserving until it can be sold to one or more third parties at fair value or liquidated in an orderly fashion. Some limitations on cherry-picking are introduced to “avoid or mitigate serious adverse effects to financial stability of the United States.” Finally, the Senate bill requires the receiver to liquidate and wind up a company in resolution. The decision to intervene is different. The Senate bill differs from the House bill in requiring the Treasury Secretary to obtain an order from the U.S. District Court authorizing, within 24 hours, the appointment of the FDIC as receiver. It differs too in limiting the assessment perimeter to financial institutions with at least $50 billion in consolidated assets. It also excludes non-financial subsidiaries and specific government entities. Unlike the House version, the orderly liquidation fund is not prefunded. Orderly resolution costs would be funded by the FDIC by borrowing from Treasury up to a maximum amount for each covered financial company equal to 10 percent (in the first 30 days) of book value of covered financial company consolidated assets and up to 90 percent of the fair value of assets that are available for repayment (after the initial 30 days). In addition, the FDIC would be required to repay its borrowings from Treasury within 60 months, if necessary, by imposing assessments on (almost) any claimant that received payments from the FDIC, and, if this is insufficient, from large financial companies with at least US$50 billion in consolidated assets. There are other important differences from the House bill. No haircuts would be possible for secured creditors, i.e., they would receive full payment. The Senate version prohibits funds being used to prevent the liquidation of a firm. All funds should be recovered either through disposition of assets of a covered financial company or assessments on the financial sector, to ensure no taxpayer losses. Insurance companies are liquidated or rehabilitated under applicable state law.
A2.7 Financial Stability Fund in Sweden40
The Swedish financial stability fund is one of five instruments available to the Swedish government to protect financial stability. The other four (some temporary) include: (i) bank guarantees; (ii) capital injections; (iii) emergency support; and (iv) deposit insurance.
A2.7a Use and Design of the Financial Stability Fund The financial stability fund is managed by the National Debt Office and is the financing vehicle of the aforementioned schemes. It was introduced in Act SFS 2008:814 on state support to credit institutions, which gives the government a broad mandate to deal with situations that risk serious
40A more detailed description of these instruments is contained in “State Aid N533/2008 Support Measures for the Banking Industry in Sweden,” European Commission C (2008) 6538.
Financial Sector Taxation: The IMF’s Report to the G-20 and Background Material
44
disturbance to the Swedish financial system. The National Debt Office has been appointed as Support Authority and can intervene on behalf of the government.
A2.7b Coverage The scheme covers deposit taking institutions incorporated in Sweden. It is thus essentially limited to banks, and includes all foreign branches of Swedish deposit-taking institutions and local subsidiaries of foreign banks, while excluding foreign subsidiaries of Swedish deposit-taking institutions and local branches of foreign deposit-taking institutions.
A2.7c Size of the Fund and Government Backstop The fund is targeted to reach 2.5 percent of GDP in 15 years. Initially, the government allocated public resources to the fund in the amount of 0.5 percent of GDP. Whether the fee will continue to be paid once this cap is reached has not yet been determined. The fund is supported by an unlimited government back stop. Since it is conceived as an emergency financial stability measure, the fund is supported by the full credit of the government, and the National Debt Office has wide powers to access additional government resources should the fund prove insufficient. The fund is expected to merge with the deposit insurance fund in 2011. The systemic financial stability fund was conceived as a funding vehicle for temporary financial stability schemes introduced in the aftermath of the recent financial crisis. Current bank support schemes are to expire in 2011. At that date, the systemic financial stability fund is expected to merge into the deposit insurance fund. No details are currently available on whether the stability fund will add to or gross up the deposit insurance fund.
A2.7d The Stability Fee Covered institutions pay a flat-rate fee levied on a portion of their liabilities. The fee rate is 0.036 percent, payable annually, but transition rules allowed banks to pay only 50 percent of the prescribed rate for 2009 and 2010. The fee base is all liabilities other than: (i) equity capital; (ii) junior debt securities that are included in the capital base according to capital adequacy rules; (iii) internal debt transactions between those companies within the group that pay stability fees; and (iv) an average of the (government) guaranteed liabilities. Thus, institutions do not have to pay twice; both for the explicit guarantee and the more general charge for financial stability. The fee will be risk based from 2011. No details are available on how risk weighting will be implemented or how it will be merged with the deposit insurance fee.
Financial Sector Taxation: The IMF’s Report to the G-20 and Background Material
45
A2.8 Bank Resolution Funds and Levy in the E.U.41
The European Commission has proposed a network of bank resolution funds. In May 2010, it proposed a network of national funds for all banks and investment firms,42 functioning under a “harmonized” framework.
A2.8a Use and Design of the Funds The funds are intended to facilitate orderly resolution of ailing institutions within a new crisis management framework. The funds are not intended to be used to provide insurance against failure or to bail out failing banks. They are intended as part of a new crisis management framework encompassing: (i) prevention measures (such as risk assessments, preparation of recovery and resolution plans); (ii) early intervention measures (implementation of recovery plans); (iii) use of bank resolution funds (for bridge bank facility, partial transfer of assets and liabilities, separation of good bank/bad bank) as needed in coordination with deposit insurance funds; and (iv) liquidation (liquidation/wind up of all or parts of the failed institution). Within such a framework, shareholders are expected to be wiped out, management removed and losses imposed on unsecured creditors and holders of subordinated debt.
A2.8b Rate and Base Bank resolution funds would be funded ex ante through a resolution levy. No details are available at the time of writing regarding the type of levy and rate proposed. It is envisioned that the levy perimeter would coincide with the resolution perimeter and the proposal makes reference to the size of the fund of between 2 and 4 percent of GDP. However, it is unclear whether this would be defined in terms of national or E.U.-wide GDP. While favoring a liability base, the Commission is still assessing which base would be most appropriate, given some key principles. While the Commission suggests that banks’ liabilities would be the most appropriate indicators of the amounts that might be needed to resolve a bank, it is assessing alternative bases for the contributions to bank resolution funds. It states that base and rate should: (i) avoid any possible arbitrage; (ii) reflect appropriately risks; (iii) take into account the systemic nature of certain financial entities; (iv) be based on the possible amounts that could be needed if resolution becomes necessary; and (v) avoid competitive distortions.
41See Press release COM(2010) 254 final. 42In accordance with the scope of application of the EU banking legislation, i.e., the Capital Requirements Directive 2006/48/EC, the reference to “bank” is to be understood to include banks and investment firms.

Financial Sector Taxation: The IMF’s Report to the G-20 and Background Material
46
A2.8c Governance Considerations Governance considerations may dictate specific countries to divert levies to general budget as a second best option. The Commission recognizes that some Member States could find it attractive to use levies to reduce their public deficits. For the longer term, however, it fears that failure to establish dedicated resolution funds may increase the dependence of the financial sector on public funds should new crises occur, and reinforce the moral hazard problem associated with ‘too big to fail’ institutions. Furthermore, it recognizes that levies paid into the general budget risk being diverted for other uses.
Financial Sector Taxation: The IMF’s Report to the G-20 and Background Material
47
Appendix 3. Regulation and Taxation of the Financial Sector Policy and academic debates have paid little attention to the potential use of corrective taxes as a tool of financial sector prudential policy, and to comparing and integrating them with regulatory measures. Taxation has long played a central role in addressing a range of externalities, notably environmental. The special features and problems of the financial sector, however, have been addressed almost entirely through regulatory tools. The reasons why fundamental instrument choices have been so different in these two areas have rarely been articulated or investigated. This leaves open a range of questions, for example, as to which should be preferred when they act as substitutes and, whether there are circumstances in which they act as complements.
The roles of regulation and taxation can be considered in relation to both micro-prudential risks (relating to individual institution) and—of more practical importance in the present context—macro-prudential (systemic) risk. Regulation has been the dominant response at the micro-prudential level, with tax policies towards the financial sector largely guided by the general principle of neutrality across. While a change in focus of current micro-prudential approaches away from regulation is highly unlikely and perhaps undesirable, the effective absence of coherent macro-prudential policies made clear by the crisis leaves room for debate on the relative merits of tax and regulation in that context. Indeed, regulatory and supervisory failings in dealing with systemic risk, and the consequent strong impact on public finances, have prompted wide interest in the potential for sector-specific tax measures.
Resolving these issues requires a better understanding of the complementarities and tradeoffs between regulation and taxation in dealing with negative financial sector externalities. This appendix provides a brief review of the issues. It starts by identifying the negative externalities that either regulation or taxation needs to address. It then outlines a number of tax measures (mostly macro-prudential) suggested by recent research and in policy debates. It further discusses some dimensions in which taxation and regulation may complement each other, or be substitutes for each other, in reaching the goals of a stable financial sector and cost-efficient financial intermediation.
A3.1 Financial Sector Externalities
The rationale for regulatory or corrective tax measures in the financial sector is to address externalities arising from market failures.43 In this context, it is important to distinguish between micro-prudential and macro-prudential externalities.
43Regulatory or tax measures may also be applied to the financial sector for other reasons, such as consumer protection, or for reasons not distinct from those applied elsewhere (as with the corporate income tax, for instance). These are not considered here. Furthermore, this discussion focuses on negative externalities from the financial sector, though there is also much evidence of positive externalities on financial sector development on the real economy (see Levine, 2005 for a review). These positive externalities can call for government involvement, for example, in the provision of institutional infrastructures.
Financial Sector Taxation: The IMF’s Report to the G-20 and Background Material
48
Micro-prudential externalities are predominantly driven by limited liability and asymmetric information. Limited liability means that bank losses in excess of equity capital (or more precisely in excess of the bank’s charter value) are of no direct concern to owners or managers and so, to the extent that risk is not fully priced by creditors at the margin, leads to excessive risk-taking. Deposit insurance premia can in effect act as a corrective tax to offset such inefficiency (while at the same time generating resources to provide the insurance), but the superior information of the financial institution makes appropriate risk adjustment of the charge problematic. And even when risk is properly priced by creditors, the effects of limited liability can be amplified by explicit or implicit government guarantees, which will further reduce market discipline by allowing lower borrowing rates. In these circumstances, market forces alone cannot correct excessive risk taking and consequent mis-allocation of resources. Existing regulation of banks, insurers, and other financial institutions responds to these externalities through a series of capital and liquidity requirements and other micro-prudential regulations, coupled with in-depth supervision and the ability to impose corrective measures.
Macro-prudential externalities relate to systemic risk. The failure or distress of one institution can have domino effects on other institutions or clients. Key channels are (as discussed for instance in Brunnermeier et al (2009)): direct financial exposures, market exposures (when leverage and funding constraints at many institutions lead to fire-sales and downward asset price spirals), or reputational exposures (when asymmetric information causes creditors to run from many financial institutions when faced with uncertainty). Additionally, externalities may arise in forms of ‘excessive’ volatility of asset prices, including exchange rates (with deviations of prices from fundamental values potentially hampering investment and growth),44 and related excessive volatility of financial and capital flows (Shin, 2010b). However, establishing analytically and empirically the degree to which there might be excessive volatility in asset prices or capital flows has been challenging (Brunnermeier (2001) and Shiller (2005) review).
Recent experience has confirmed that negative externalities can be especially large during financial crises. The overall effect of systemic risk on the financial system and the real economy can be significantly larger than the initial shock (as was evident when troubles in the relatively small U.S. subprime mortgage market generated disproportionately wide and deep repercussions). Moreover, financial institutions may impose risks on others, while leaving their own balance sheets relatively un-exposed (as in the case of risks created by the distribution of risky financial innovations, e.g., complex securitizations). Systemic financial crises almost always result in significant fiscal costs (for direct financial system support, as well as for automatic stabilizers and possible discretionary stimulus programs) and large economic costs (a cyclical loss of output and possibly an impact on potential growth: see Estevão and Severo (2010) and Laeven and Valencia (2010)).
Two factors can amplify financial sector externalities, particularly macro-prudential ones:
44Schulmeister (2010) develops this argument.
Financial Sector Taxation: The IMF’s Report to the G-20 and Background Material
49
The presence of large and complex financial institutions. So severe are the costs of their failure that financial markets will typically expect governments to support these institutions to avoid further adverse consequences. This leads to (additional) moral hazard in the form of taking on more risks, and shifting risks and costs to the public sector. Ex-ante, financial markets are distorted, leading to funding advantages for such financial institutions: in effect, there is a fiscal externality from the expectation of government support that is reflected in borrowing costs and capitalized in market values. Ex-post, bailouts entail fiscal costs. Much of the current policy agenda is consequently aimed at reducing the risks associated with institutions that are “too-big-to-fail.”
The inherent pro-cyclicality of the financial system. During cyclical upswings, financial institutions build up leverage and risk without having the incentive to consider sufficiently the fallout for the rest of the financial system and the real economy of the adjustment that will become necessary when markets eventually do correct. Risk is typically “under-priced,” leading to rapid asset price appreciation and financial institutions taking on additional exposures. These booms, in turn, often involve increases in non-core short-term liabilities, including in foreign exchange and “carry-trade.” This can, although need not, create adverse general equilibrium impacts when they create systemic risks.
The tools to address macro-prudential externalities are still limited. The recent crisis has highlighted the potentially daunting costs of macro-prudential externalities. Yet existing regulatory structures are predominantly micro-prudential. Distinctly novel types of policy may be needed to help reduce macro-prudential externalities and systemic risks.
Broadly speaking, two types of corrective tax for the financial sector have been proposed:45 A systemic risk tax. Several studies have suggested imposing a corrective tax based on the
expected marginal contributions of individual financial institutions to systemic losses incurred in a financial crisis. Studies suggest capturing marginal losses through Co-Value-at-Risk (CoVaR, the value at risk of financial institutions conditional on other institutions being in distress; Adrian and Brunnermeier, 2009) or the Marginal Expected Capital Shortfall (MES, the expected marginal share of an institution’s loss in overall financial sector loss in a crisis; Acharya et al., 2009). By basing the corrective tax on these measures, institutions would be incentivized to reduce their marginal contribution to systemic risks. One difficulty, however, is that the statistical measurement of marginal systemic risk contributions may prove too complex for direct use in taxation or indeed regulation. Proposals suggest addressing this problem by linking the tax to simple regulatory ratios. Specifically, they identify size, leverage, maturity mismatch (associated with the use of short-term funding), as well as the standalone investment banking business model, as important metrics explaining cross-sectional variation in marginal systemic risk contributions.
45This is not an exhaustive list of policies that might be used to tackle macro-prudential risks.
Financial Sector Taxation: The IMF’s Report to the G-20 and Background Material
50
A tax on short-term wholesale funding. The over-reliance of financial institutions on wholesale funding, particularly short-term but also in foreign exchange, has been one of the key sources of vulnerability during the recent crisis (Huang and Ratnovski (2008), Brunnermeier (2009), Perotti and Suarez (2010), Shin (2010a)). While wholesale funding allows lenders to expand their supply of credit, there is risk of over-reliance on its very risky short-term or currency-mismatched forms. A corrective tax could discourage the use of short-term wholesale funding by raising its cost. Specifically, the tax rate could be calibrated on the difference between short-term and acceptable medium-term borrowing costs in normal times. Note that while such a tax would limit the routine reliance on short-term funding, it would not prevent its use should the need arise.
Some recent policy proposals have a corrective motivation. For instance, the levy announced by the German government (see Appendix 2) aims to mitigate incentives towards creating excessive systemic risk, by internalizing the negative externalities of systemic relevance. The FCR as originally proposed by the U.S. administration also has some corrective elements: intended to be levied on the debts of financial firms with more than $50 billion in consolidated assets, it would provide a deterrent against excessive leverage by the largest financial firms. However, the rate of charge is probably not high enough to cause a large change in the behavior or risk profiles of financial institutions, and hence to significantly alter the risk that government outlays will be needed to cover future losses.
A “Financial Stability Contribution” (FSC) could be designed to have corrective effects. In line with academic proposals, the FSC tax base could be the systemic risk-related by relating its rate to the structure of bank liabilities (similar to the tax on short-term wholesale funding). And it could reflect other determinants of systemic risk, such as size, leverage, and duration of funding.
The Relative Merits of, and Complementarities Between, Taxation and Regulation
Taxation and regulations can both be used to address externalities, but there are many open questions. What then are the advantages that each offers in relation to financial sector externalities? When are they complements, and when substitutes? Are there outcomes that can be achieved with one tool but not the other?
In a ‘textbook’ world, with the government having perfect information and there being no uncertainty, taxation and regulation are equivalent, in the sense that anything that can be achieved under one can be achieved under the other.46 For example, a tax on excessively high VAR could substitute for capital adequacy requirements in controlling bank risk. Similarly, any effect of corrective taxation on bank behavior could in theory be replicated by bank capital requirements, assuming that additional capital is consistently available to banks at a cost. So the effects of a systemic risk tax, for example, could be replicated through a systemic risk capital surcharge. In
46This is so, at least, for technically ‘well-behaved’ problems. Note too that this equivalence presumes that the income effect of tax measures can, if desired be undone by returning revenue raised to the taxpayer as a lump sum payment.
Financial Sector Taxation: The IMF’s Report to the G-20 and Background Material
51
addition to these broad conceptual equivalences, taxation and regulation share some common challenges in their practical implementation (Box A3.1).
Important differences between regulation and taxation arise, however, from uncertainty and imperfect information. For example, under fairly general conditions, leverage limits will always reduce risk taking, while taxes need to be “progressive enough” with respect to risk or else they will increase (rather than decrease) risk-taking incentives. Implementation issues can also play an important role. We further compare the merits of taxation versus regulation as corrective tools in what follows, using costly capital surcharges as the regulatory tool.
A3.2 Merits of Taxation as a Corrective Tool As a price-based corrective tool, taxes can be more directly geared toward certain activities and have a smoother (more continuous) impact on bank finances. A corrective tax can directly be linked to an identified source of systemic risk for a financial institution. Achieving the equivalent (in terms of discouraging a specific source of risk) effect through a capital surcharge would also require an estimation of the financial institution’s cost of capital (such that the capital surcharge times the cost of capital is equivalent to the tax) which can be complex as the cost of capital varies over time and across institutions. Also, taxes impose on banks smooth and continuous costs (e.g., yearly payments). In contrast, higher capital requirements can impose discrete and significant costs if conditions make it difficult to raise new capital. This makes taxes potentially a more dynamically efficient instrument: the imposition of a tax would not involve high up-front cost, so there will be a lower risk of adverse effects such as deleveraging. Similarly, taxes might offer banks and regulators more flexibility during a crisis, when raising additional capital to satisfy the surcharges could be prohibitively costly and undesirable from a cyclical point of view. Taxes create fiscal space and help reduce the fiscal impact of failure of financial institutions, provided an appropriate resolution framework is in place. Fiscal revenues can be viewed as a form of government-facilitated co-insurance of financial institutions against idiosyncratic risks, and as a payment for fiscal support that may become necessary during a systemic crisis. Insofar as taxes improve the ability of governments to intervene effectively, they reduce the impact of distress of financial institutions. Similar to other forms of insurance, however, government-provided buffers may increase moral hazard (more risk-taking on part of financial institutions and/or less efficient government interventions under the perception of softer budget constraints for financial sector support). Therefore an effective resolution framework, balancing insurance and moral hazard considerations, is essential.
Financial Sector Taxation: The IMF’s Report to the G-20 and Background Material
52
Box A3.1. Regulation and Taxation: Common Challenges There are some important similarities in the design problems facing regulatory and tax policies: incidence, perimeter, calibration, and coordination. Incidence—Who bears the real incidence of regulation and taxes in the financial sector? This matters for assessing the fairness of alternative measures. (Importantly, incidence is less important in efficiency terms: what matters is the impact of policy on the marginal private costs of particular actions, with the precise working out of that on market prices immaterial). Such issues would include, for instance, the question of how far the real burden of any of the potential taxes discussed below would fall on rents earned in the financial sector and how far it would be passed on to customers. Perimeter—The set of firms to be taxed or regulated needs to be defined when designing the scope of prudential rules or taxes. One key objective is ensuring that institutions transferring risk are adequately supervised or taxed. Issues arise too as to the extent to which measures aimed at the financial sector can or should be ring-fenced from the rest of the economy: whether, for instance, debt bias in financial activities can coherently be addressed without addressing it for all companies. Calibration—Determining the appropriate corrective actions requires understanding how the financial sector will respond to policy, and deciding how large the relevant externalities are (to what degree, for instance, they should include wider costs to the real economy). The need for this, and the consequent difficulty of doing so, is made more explicit by the tax approach; it arises too for regulatory policies, though it may then be less visible. International coordination—The effectiveness of possible measures is likely to depend on the extent of international cooperation in their design and enforcement. The sophisticated and globalized nature of financial services industries leads to substantial international spillovers from both regulatory decisions (as experienced with the extension of deposit insurance schemes in the recent financial crisis) and tax choices (including through the use of low-tax jurisdictions). Not only realizing opportunities but also avoiding mutual damage may call for significant policy cooperation when considering the taxes and charges applied to financial sector. Taxes might be easier to implement across sectors. A new and consistent instrument might be easier to harmonize or introduce relative to redesigning currently segmented sectors or those financial markets’ activities lacking regulation.
A3.3 Merits of Regulation (specifically, Capital Surcharges) as a Corrective Tool Correcting systemic risk through capital surcharges would build on a strong existing institutional framework.47 Financial regulators have significant experience interacting with and supervising the financial sector. As a result, the rules for capital surcharges can potentially be more detailed and more easily adjusted than those for taxes. In addition, Pillar II of the Basel Accord already allows regulators to use soft information and consider individual circumstances. In contrast, taxes are normally based on relatively hard information and are non-discriminatory in nature; discretion might be possible but is limited. Also, addressing systemic risk through regulatory means would 47Requiring some forms of contingent capital is another tool that could be used to create buffers, albeit one that remains largely untried.
Financial Sector Taxation: The IMF’s Report to the G-20 and Background Material
53
simplify international co-ordination by relying on existing institutional arrangements (e.g., the Basel Committee for Banking Supervision).
Capital surcharges create buffers, and can directly reduce the probability of failure or distress of a financial institution. A reduction in the probability of failure is particularly important in case of large, complex, and international institutions that are difficult to resolve efficiently, even when the necessary fiscal resources and resolution framework are in place. Also, capital surcharges increase the ‘skin in the game’ (i.e., risk exposure) of bank equity-holders, potentially providing an overall reduction in moral hazard and enhancing market discipline, even reducing systemic risk concerns.48 Capital surcharges may have stronger corrective effects when taxes cannot be made risk-sensitive enough. Taxes, in general, reduce profitability and the charter value of a bank, leaving equity holders, and potentially key employees, with less ‘skin in the game.’ Unless taxes are sufficiently risk-sensitive, this would lead to higher risk-taking. In contrast, most capital-based measures, however crude, serve to reduce an institution’s risk. Capital surcharges may therefore be preferred when supervisors do not possess sufficient information to implement risk-sensitive taxes. (Note that this is an additional argument in favor of basing a prospective systemic risk tax on bank liabilities rather than assets: liability risks are easier to capture consistently across banks, e.g., by focusing on duration and concentration.)
A3.4 Uncertainty
Strict regulatory limits (such as on leverage or precluding certain activities) have particular appeal when small misjudgments of the private sector reaction function can result in large adverse consequences. They are also useful when the costs to the private sector of adapting to (or avoiding) regulation are relatively low, and/or when marginal social damage is very sensitive to the outcome of private decisions.49 The non-linear nature of financial stress—with periods of calm, at times erupting in financial turmoil and crises—suggests that hard limits may have a role in complementing tax and surcharge-based measures.
Overall, the discussion suggests that taxes may be a useful complement to regulation in addressing macro-prudential concerns.
48The effects of higher capital adequacy requirements on risk taking are in principle ambiguous, however, since they may lead financial institutions to take more risk to offset the costs: Hellman, Murdock and Stiglitz (2002). 49See Weitzman (1974). Note that the uncertainty as to the magnitude of potential social damage stressed above is not directly relevant to the choice between tax and regulatory surcharges, since it does not in itself affect the outcome under either.
Financial Sector Taxation: The IMF’s Report to the G-20 and Background Material
54
Appendix 4. The FSC: Rate, Revenue and Financial and Economic Implications This appendix discusses: (i) possible rationales for the FSC and its rate; (ii) measuring the too big to fail subsidy; (iii) likely impact on bank performance, internal buffers and revenue collection; (iv) issues related to pass-through and incidence; and (v) likely impact on lending and economic growth.
A4.1 Possible Rationales for the FSC and its Rate Banks can benefit from implicit guarantee that lower their costs of funding, the value of which is a proxy for the incentives to become systemically relevant. One of the reasons financial institutions have incentives to become large and complex is that they enjoy an implicit state guarantee through becoming too-big-to-fail (TBTF). The provision of state guarantees is a competitive distortion. Investors know that TBTF institutions are safer bets than other institutions, even those with otherwise similar characteristics. This creates funding cost benefits for TBTF institutions which they can use to gain market share at the expense of other institutions. Levies can be set so as to have institutions pay for the implicit (TBTF) subsidies they receive and to reduce their incentives to become TBTF. Levies, taxes and capital surcharges can be used to correct for the negative externalities of TBTF. Levies can be used to correct for the externalities financial institutions generate, including the creation of systemic risk. Many of these externalities also arise from TBTF practices. In theory, a Pigouvian tax could reduce systemic risks to the socially optimal level, if it was set to exactly internalize systemic risk externalities. Alternatively, a surcharge on capital could achieve the same objective. A prerequisite for both types of approaches—taxation or regulation—is some measure of the size of systemic risk externalities. What is a fair level of a capital surcharge on systemic banks? And what is an appropriate Pigouvian tax on systemic risk? This section estimates the TBTF subsidy as a guide to the level at which a levy could be set. Before the recent financial crisis, regulators in many countries tried to create uncertainty about the extent of state guarantees through a policy of “constructive ambiguity.” The financial crisis led to a series of events and policy decisions that radically changed these expectations. For instance, the declaration by the G-20 heads of state in 2008 that no systemically relevant institution would be allowed to fail marks a drastic change in the TBTF policy across a large number of countries by turning an implicit into an explicit state guarantee. Therefore expectations about the burden sharing of any losses between taxpayers, debt holders and equity holders varied over time.
Financial Sector Taxation: The IMF’s Report to the G-20 and Background Material
55
A4.2 Measuring Private Benefits from Too-Big-to-Fail Policies
We use two approaches to estimate the value of the TBTF subsidy: an event study and a ratings study:50
Event study. The value of the subsidy can be inferred from how market values respond differentially to major events involving changes in TBTF practices. We use the CDS market and the stock market for large financial institutions and nonfinancial corporations in the U.S. and Europe (controlling for some institutional characteristics).51 Based on this approach, the value of the TBTF subsidy transferred to large financial institutions in excess of the benefits received by nonfinancial firms is estimated to be equivalent to an annual rate on total assets of about 10 bp to 50 bp, with an average of about 20 bp. This estimate is based on incremental changes in TBTF policy and practices, and so may underestimate the total TBTF value.
State support. The competitive advantage in funding associated with TBTF policies can be estimated using rating agencies’ expectations of state support to financial institutions. Rating agencies provide a rating as to each institution’s own financial strength without government support, and a rating for the support expected from the government for the institution. By regressing the overall ratings on these two subcomponents, the relative importance of the government support can be estimated.52 The regressions are based on top 10 banks from each G-20 country and conducted using end-2007 and end-2009 data, before and after major events—including the declaration by the G-20 in December 2008 that no systemically relevant institution would be allowed to fail. The regressions show that there is a marginal increase in the value of the too-big-to-fail subsidy governments provided in 2009 for advanced economies. The funding cost advantage varies with financial strength ratings, but is estimated to be on average 65 bp. This advantage, however, captures both the government subsidy and the competitive advantage of too big to fail banks, which means that the reasonable levy rate should be somewhat smaller.
These approaches suggest that the TBTF subsidy is on average 20 bp. Based on the aforementioned two different approaches, estimates indicate that the TBTF subsidy currently enjoyed by large and complex financial institutions would be offset by an annual levy on total
50There is a small literature that has tried to estimate the value of the TBTF subsidy. Rime (2005) and Soussa (2000) use the rating agencies’ expectation of state support to financial institutions to back out the value of the subsidy, and estimate the value of the subsidy to range from 5 bp to 128 bp, depending on the credit rating of the bank. Baker and McArthur (2009) use the difference in funding costs of small and large U.S. banks before and after the change in the TBTF policy which was established with TARP as proxy for the value of the TBTF subsidy. Their estimates of value of the subsidy range from 9 bp to 49 bp. See also Haldane (2009) for estimates of the funding advantages due to TBTF. 51The specific events we analyze are the bailout of Bear Stearns; the bankruptcy of the Lehman Brothers; the introduction of TARP; the failure of IKB in Germany; the nationalization of Northern Rock in the U.K.; and the EU Summit declaration of no failures of large financial institutions. 52As the support rating measure captures not only government support but also potential support from parent companies, foreign bank ownership is controlled for when estimating state support.
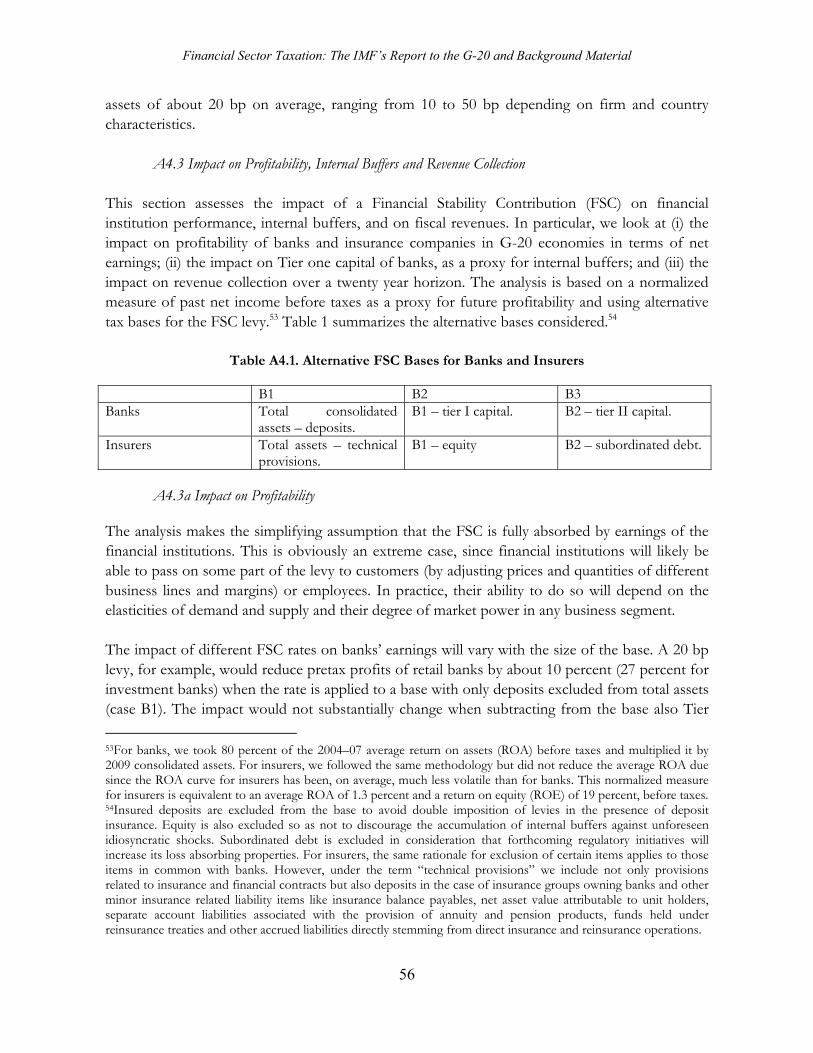
Financial Sector Taxation: The IMF’s Report to the G-20 and Background Material
56
assets of about 20 bp on average, ranging from 10 to 50 bp depending on firm and country characteristics.
A4.3 Impact on Profitability, Internal Buffers and Revenue Collection This section assesses the impact of a Financial Stability Contribution (FSC) on financial institution performance, internal buffers, and on fiscal revenues. In particular, we look at (i) the impact on profitability of banks and insurance companies in G-20 economies in terms of net earnings; (ii) the impact on Tier one capital of banks, as a proxy for internal buffers; and (iii) the impact on revenue collection over a twenty year horizon. The analysis is based on a normalized measure of past net income before taxes as a proxy for future profitability and using alternative tax bases for the FSC levy.53 Table 1 summarizes the alternative bases considered.54
Table A4.1. Alternative FSC Bases for Banks and Insurers
B1 B2 B3 Banks Total consolidated
assets – deposits. B1 – tier I capital. B2 – tier II capital.
Insurers Total assets – technical provisions.
B1 – equity B2 – subordinated debt.
A4.3a Impact on Profitability
The analysis makes the simplifying assumption that the FSC is fully absorbed by earnings of the financial institutions. This is obviously an extreme case, since financial institutions will likely be able to pass on some part of the levy to customers (by adjusting prices and quantities of different business lines and margins) or employees. In practice, their ability to do so will depend on the elasticities of demand and supply and their degree of market power in any business segment. The impact of different FSC rates on banks’ earnings will vary with the size of the base. A 20 bp levy, for example, would reduce pretax profits of retail banks by about 10 percent (27 percent for investment banks) when the rate is applied to a base with only deposits excluded from total assets (case B1). The impact would not substantially change when subtracting from the base also Tier
53For banks, we took 80 percent of the 2004–07 average return on assets (ROA) before taxes and multiplied it by 2009 consolidated assets. For insurers, we followed the same methodology but did not reduce the average ROA due since the ROA curve for insurers has been, on average, much less volatile than for banks. This normalized measure for insurers is equivalent to an average ROA of 1.3 percent and a return on equity (ROE) of 19 percent, before taxes. 54Insured deposits are excluded from the base to avoid double imposition of levies in the presence of deposit insurance. Equity is also excluded so as not to discourage the accumulation of internal buffers against unforeseen idiosyncratic shocks. Subordinated debt is excluded in consideration that forthcoming regulatory initiatives will increase its loss absorbing properties. For insurers, the same rationale for exclusion of certain items applies to those items in common with banks. However, under the term “technical provisions” we include not only provisions related to insurance and financial contracts but also deposits in the case of insurance groups owning banks and other minor insurance related liability items like insurance balance payables, net asset value attributable to unit holders, separate account liabilities associated with the provision of annuity and pension products, funds held under reinsurance treaties and other accrued liabilities directly stemming from direct insurance and reinsurance operations.
Financial Sector Taxation: The IMF’s Report to the G-20 and Background Material
57
one equity (case B2) and Tier two equity (case B3), reflecting the fact that banks are highly leveraged institutions. Banks would be impacted in proportion to the size of their deposits base: the smaller the deposit base, the higher the charge. The impact on insurer earnings are more muted. A 20 bp FSC would reduce pretax profits by between 5 percent on average when the rate is applied to a base with only technical provisions excluded from total assets. The impact of the charge is reduced to only 3 percent if it also excludes equity and subordinated debt. At other charges, the impact on earnings changes linearly. For all financial institutions combined, a 10 bp FSC would amount to some 3 percent of profits.
A4.3b Impact on Internal Buffers
For banks, the FSC could have an impact on Tier one capital adequacy ratio. If all net earnings are fully retained to increase capital, such capital increase would be curtailed one-by-one by the FSC. Assuming unchanged dividends, a 20 bp FSC would reduce by between 10 bp to 60 bp the growth of the Tier one capital adequacy ratio for banks.
A4.3c Revenue
The amount of FSC contributions can also be estimated. We assume the perimeter to be limited to the banking sector (i.e., insurance companies and other financial institutions are not included in the estimates), and the base to be total consolidated liabilities of domestic institutions, excluding total deposits and equity (but not subordinated debt). Under these assumptions, and using 2008 data consolidated banking dataset for E.U. countries which are readily available, the amount collected with a 10 bp FSC would accumulate over ten years to, on average, 2 percent of GDP. There are large differences in the rates of accumulation across countries, however, reflecting the different sizes of the domestic banking sectors relative to GDP and different deposits to assets ratio. Among the large European economies, Germany, France and the U.K. display the highest accumulations, having very sizable banking sectors relative to their economies and relatively low deposits to assets. Spain and Italy, on the other hand, have low accumulation given their smaller, deposit-rich banking sectors.
A4.4 Pass-through and Incidence of a Financial Sector Tax Any assessment of the quantitative impact of a tax must distinguish between tax revenue and tax incidence. The latter concerns which groups will ultimately bear the tax burden. The tax incidence, or tax burden, does not depend on who is legally liable for the tax, but on the price elasticities of demand and supply, and wider competitive conditions, in the different markets in which the tax subject operates. This, in turn, will depend on the circumstances the institution faces in different markets for equity, debt, deposits or loans and fees. Moreover, these elasticities will depend on how widespread the adoption of the tax is. However, the relevant elasticities are not readily observable and mostly not available for G-20 countries’ banking systems. Instead, we
Financial Sector Taxation: The IMF’s Report to the G-20 and Background Material
58
provide a range of possible impacts of an FSC using different calibrations and assumptions on the adjustment margins of a stylized bank.55 A simple framework is used to explore this. We study a lending decision in which the private benefits of making the loan have to be at least equal to the cost of making it. The benefits of the loan include the effective interest rate on the loan (including annualized effects of fees) plus any additional pecuniary benefits that the bank can reap from making the loan. For instance, the relationship with a customer on the credit market can have a positive value, which exceeds the value of the loan if the bank is able to cross-sell its investment banking products. The costs of making loans include the cost of funds, any expected credit losses, and administrative expenses, where we allow the cost of deposits to differ from that of other forms of debt and equity. The cost of deposit funding includes all cost incurred in collecting deposits, e.g., the deposit insurance premium and costs of running a branch network. Similarly to the previous section, the FSC is assumed to be charged on non-deposit debt liabilities and to be tax deductible. Alternatively, it could be modeled as a tax on total liabilities with a tax credit for the amount of deposit insurance premiums already paid. Using alternative assumptions about the pass-through from the FSC, ranging from one extreme in which the entire burden is carried by borrowers of the bank, to the other, in which the full burden is carried by bank profits, we can arrive at lower and upper bound estimates of the impact of a FSC on loan rates. Based on these calibrations, with full pass-through, an FSC of about 20 bp on liabilities would increase loan rates by about 10bp. On the other hand, with the full impact of higher costs absorbed by profits, a 20 bp FSC would reduce the return on equity by about 2 percent. In a more intermediate case, where banks pass on part of the burden to borrowers to limit the drop in bank profits, an FSC of 20 bp would increase loan rates by about 5 bp.
A4.5 Impact of Financial Sector Taxation on Lending and Real Activity An increase in bank taxation is likely to have a negative impact on bank asset growth, since a reduction of after-tax returns discourages expansion. In addition, reduced after-tax earnings make rates of return lower as retaining earnings are less, adversely affecting capital formation, which in turn discourages asset growth. A reduction in (after-tax) profitability can also have a negative impact on financial stability by increasing bank risk. The potential impact of financial sector taxation on lending activity, real activity, and financial stability is likely to be negative but small. Estimates based on panel data regressions using historical data on U.S. banks, as well as data from other banking systems, indicate that a lower return on assets due to an increase in bank taxation has a direct negative effect on capital formation. In addition, a higher effective tax rate discourages asset growth and lowers future
55The stylized model of a lending decision is based on Elliot (2009) and Doluca et al (2010).
Financial Sector Taxation: The IMF’s Report to the G-20 and Background Material
59
earnings, while it increases the probability of default.56 The quantitative impact of different configurations of an FSC and FAT can be assessed using the estimated parameters, including its distribution across different types of banks, such as large versus small banks.57 The impact of an FSC of 20 bp on total debt on banks’ asset growth is estimated to be limited: on average, about 0.05 percentage points. A Financial Activities Tax (FAT) of about 2 percent on pretax profits would not significantly alter this. However, for some banks the negative impact of these taxes on asset growth can be severe, in particular for large banks. The negative impact of an FSC of 20 bp and a FAT of 2 percent on the probability of default is also small, with the increase across banks not exceeding 0.1 percent. The impact of such an FSC and FAT on GDP growth is also limited on average, though more severe for countries with more systemic (large) banks.58 The potential real effects of an FSC have been also evaluated using a Dynamic Stochastic General Equilibrium (DSGE) model. In this model, the FSC is imposed on intermediaries’ liabilities, and thus raises their financing costs, but this is partially passed through into higher lending rates. An output loss results as lending rates increase and credit volumes decrease, leading to lower investment. Two scenarios are performed. In one, the FSC remains at a rate of about 20 basis points per annum. In the other, reflecting the expectation of lower risks and costs of failures due to improved regulatory, supervisory and resolution regimes, the FSC is reduced to zero after 10 years. Under two scenarios, the real impact of the FSC is quantitatively modest. In the scenario with a sustained FSC, the level of real output is about 0.3 percent permanently lower because of the decline in investment (due to higher costs and lower volume of credit). In addition, by increasing the cost of debt for banks, the FSC leads to some substitution of bank deposits with bank equity, making the systems more stable. For the temporary FSC, output drops by less than 0.3 percent at its trough (within the fourth year), mainly because of a decline in investment due to the high interest rate for risky lending, with the cumulative output loss to be about 1.5 percent. As the FSC is reduced to zero, economic activity returns to normal within about four years.
56A quantitative estimate of the impact of a given increase in corporate taxation on bank asset growth, bank risk, and real activity is obtained in two steps. First, forecasting models of equity formation, bank asset growth and the probability of bank default are estimated using a large panel of U.S. banks. Second, the impact on real activity is gauged estimating the elasticity of GDP growth on asset growth for a large panel of countries, and projecting the implied change in GDP growth deriving from predictions of changes in bank asset growth. 57In this scenario analysis, we consider an FSC at rates of 10, 50 and 100 bp applied to either total debt or total liabilities net of equity capital, and the profit component of a FAT applied at 200 bp of profits before taxes. 58To estimate the impact of these taxes on real activity, we first estimated the elasticity of GDP growth to bank asset growth, based on a large panel of 48 developed and emerging market countries during 1980–2007. We estimate this elasticity to be about 0.07 percent. This elasticity is obtained by taking the correlation between the log of GDP growth and the log of the growth rate of bank credit to GDP, and assuming the latter ratio is approximately the same as the log growth rate of total bank assets to GDP, and rescaling.
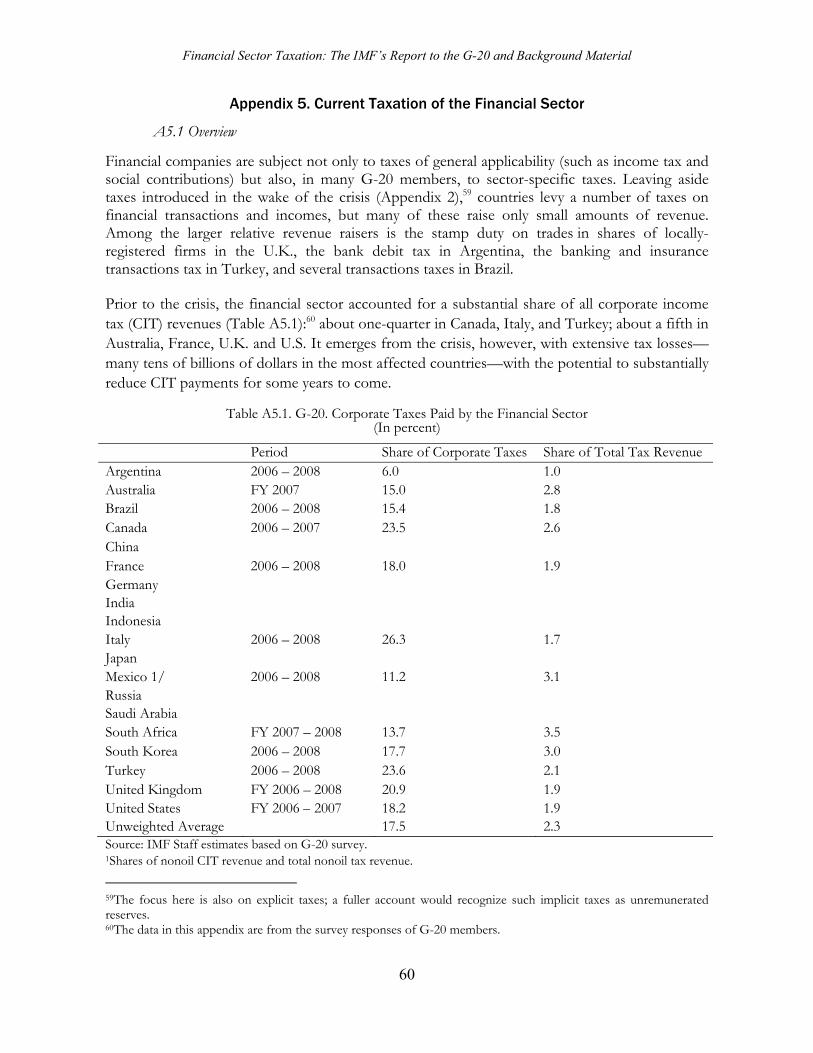
Financial Sector Taxation: The IMF’s Report to the G-20 and Background Material
60
Appendix 5. Current Taxation of the Financial Sector A5.1 Overview
Financial companies are subject not only to taxes of general applicability (such as income tax and social contributions) but also, in many G-20 members, to sector-specific taxes. Leaving aside taxes introduced in the wake of the crisis (Appendix 2),59 countries levy a number of taxes on financial transactions and incomes, but many of these raise only small amounts of revenue. Among the larger relative revenue raisers is the stamp duty on trades in shares of locally-registered firms in the U.K., the bank debit tax in Argentina, the banking and insurance transactions tax in Turkey, and several transactions taxes in Brazil. Prior to the crisis, the financial sector accounted for a substantial share of all corporate income tax (CIT) revenues (Table A5.1):60 about one-quarter in Canada, Italy, and Turkey; about a fifth in Australia, France, U.K. and U.S. It emerges from the crisis, however, with extensive tax losses—many tens of billions of dollars in the most affected countries—with the potential to substantially reduce CIT payments for some years to come.
Table A5.1. G-20. Corporate Taxes Paid by the Financial Sector (In percent)
Period Share of Corporate Taxes Share of Total Tax RevenueArgentina 2006 – 2008 6.0 1.0 Australia FY 2007 15.0 2.8Brazil 2006 – 2008 15.4 1.8 Canada 2006 – 2007 23.5 2.6 China France 2006 – 2008 18.0 1.9 Germany India Indonesia Italy 2006 – 2008 26.3 1.7 Japan Mexico 1/ 2006 – 2008 11.2 3.1 Russia Saudi Arabia South Africa FY 2007 – 2008 13.7 3.5 South Korea 2006 – 2008 17.7 3.0 Turkey 2006 – 2008 23.6 2.1 United Kingdom FY 2006 – 2008 20.9 1.9 United States FY 2006 – 2007 18.2 1.9Unweighted Average 17.5 2.3Source: IMF Staff estimates based on G-20 survey. 1Shares of nonoil CIT revenue and total nonoil tax revenue.
59The focus here is also on explicit taxes; a fuller account would recognize such implicit taxes as unremunerated reserves. 60The data in this appendix are from the survey responses of G-20 members.
Financial Sector Taxation: The IMF’s Report to the G-20 and Background Material
61
A5.2 Other Significant Taxes on the Financial Sector in the G-20 include: Argentina: Credits and debits on current accounts have been taxed since 2001. This raises significantly more than CIT on financial institutions and, over the period 2006–2008 raised about half as much as the CIT on all sectors. Brazil: Until the end of 2007, Brazil levied a bank debit tax (the Provisional Contribution on Financial Transactions), that raised about three times the amount raised by the CIT on financial companies. This was replaced by a higher rate for financial firms (the Social Contribution on New Corporate Profits), of 15 percent, rather than the standard rate of 9 percent, and an increase in the tax on financial operations (IOF). For 2008, these two taxes raised about three times the revenue raised by CIT on financial institutions. Turkey: The Banking and Insurance transactions tax falls on all transactions of banks and insurance companies. It raises about as much revenue as CIT on financial companies, and about 2 percent of total tax revenue.61 U.K.: The stamp duty on secondary sales of shares and trusts holding shares raised over the three years on average about 40 percent as much as the CIT on financial institutions. Several countries reported significant VAT revenue from the financial sector. This accounted for about 12 percent of VAT revenue in Australia, 6 ½ percent in Canada and about 7 percent in Mexico. This revenue reflects both any VAT charged on fee-based financial services and VAT paid on inputs that—due to the exemption of the sector discussed in the next further—is not recovered.
A5.3 Issues Though generally agreed not to have triggered the crisis,62 deep-rooted tax biases in most G-20 tax systems may run counter to financial stability concerns. They may result in financial firms taking on too much risk, including by being over-leveraged, and, perhaps, in the sector being too large.
A5.4 Debt bias The deductibility against corporate income tax (CIT) of interest on debt, but not the return to equity, creates a tax preference for debt over equity finance.63 There is strong evidence that this leads to noticeably higher leverage for non-financial companies.64 While there is no comparable body of analysis for financial institutions, there is also little reason to suppose the effect to be any
61In addition, there is levied on financial companies a Resource Utilization Support Fund (classified as nontax revenue), that raises about ¾ as much as the CIT on financial companies. 62Hemmelgarn and Nicodeme (2010), IMF (2009), Lloyd (2009), Slemrod (2009) and McDonald and Johnson (2010).
Financial Sector Taxation: The IMF’s Report to the G-20 and Background Material
62
less: even regulated institutions commonly hold a buffer of capital beyond regulatory requirements, leaving scope for tax effects. The proliferation prior to the crisis of hybrid instruments65 attracting interest deduction yet allowable (subject to limits) as regulatory capital, strongly suggests tax incentives at work, conflicting with regulatory objectives. There are several ways in which current CIT favoring leverage could be reduced or eliminated:66
Thin capitalization rules, which deny interest deduction once debt ratios or interest payments exceed some threshold, are becoming more widespread (in terms of both the countries deploying them and the circumstances to which they apply). They can reduce the bias towards debt, albeit with the weakness that they make little if any allowance for enterprises’ distinct circumstances.
A Comprehensive Business Income Tax (CBIT) would deny interest deductibility for CIT
altogether. Symmetrically, it would exempt interest received (to avoid multiple taxation within the corporate sector). The transitional problems in moving to a CBIT would be significant (in relation to debt issued in full expectation of deductibility, for instance). The CBIT would also result in financial institutions paying little or no CIT (having no tax due on interest received, but non-interest deductible costs), though in aggregate this might be more than offset by increased payments by other companies.
An Allowance for Corporate Equity (ACE) would retain interest deductibility but also provide a
deduction for a notional return on equity. There is experience with such schemes: Brazil has had a CIT with these features for many years, Belgium has recently adopted one, and Austria, Croatia and Italy have all had CITs with elements of an ACE. There is some evidence that such schemes have indeed reduced leverage.67 While the adoption of an ACE would mean a revenue loss, this can be limited by transitional provisions. (The gain would also be less for financial firms than others, since they tend to be much more highly geared). It can be further limited by applying the same notional return (which strong arguments suggest should approximate some risk-free return) to equity as well as debt,68 which would have the further advantage of eliminating any distinction between debt and equity for tax purposes.
63This could in principle be offset by taxes at personal level (relatively light taxation of capital gains favors equity, for instance). In practice, however, the importance of tax-exempt and non-resident investors, the prevalence of avoidance schemes focused on creating interest deductions, and the common discourse of market participants suggest that debt is often strongly tax-favored. 64 Weichenrieder and Klautke (2008). 65Such as Trust Preferred Securities: Engel, Erickson and Maydew (1999). 66There are possibilities beyond those listed here, such as movement to ‘cash-flow’ forms of CIT. 67Staderini (2001) and Pricen (2010). Wider experience with the ACE is reviewed by Klemm (2007); overviews of design issues are in OECD (2007) and IMF (2009b). 68As proposed by Kleinbard (2007).
Financial Sector Taxation: The IMF’s Report to the G-20 and Background Material
63
Fundamental CIT reform, needed to address the fundamental tax bias to excess leverage, could be an important part of a package for better taxation of the financial sector. The reforms just sketched would need to be far-reaching to be useful. Application only to financial institutions might seem tempting, but would create tax arbitrage problems (providing ACE treatment only for financial firms, for instance, would require anti-avoidance rules to prevent non-financial business being held by financial firms). Accompanying changes to individual taxation may also be needed. These would be difficult reforms, but the payoff to reducing a fundamental bias to excess leverage could be substantial.
A5.5 The Indirect Taxation of Financial Services It is common practice to ‘exempt’ financial services (other, to varying degrees, than those charged for as an explicit fee) under the VAT, meaning that that tax is not charged to the purchaser but tax paid on related inputs is not recovered. Financial services are in this sense ‘input-taxed.’69 The reason for the widespread use of exemption lies in the conceptual difficulty that arises when payment for service is implicit in a spread (between borrowing and lending rates of interest, for instance): taxing the overall spread may be easy, but proper operation of the VAT requires some way of allocating that tax between the two sides of the transaction so as to ensure that registered businesses receive a credit but final consumers do not.
Exemption means that business use of financial services tends to be over-taxed, while use by final consumers in under-taxed. The prices charged by financial institutions will likely reflect the unrecovered VAT charged on their inputs, so that business users will pay more than they would have in the absence of the VAT. Normally, the credit mechanism of the VAT ensures that prices paid by registered businesses on their purchases are not affected by the VAT; exemption means that this is not so either for financial institutions themselves, or their customers (or, through further cascading, the customers of their customers). This runs counter to the principle, underlying the VAT, that transactions between businesses should not be taxed unless doing so addresses some clear market failure. For final consumers, on the other hand, exemption likely means under-taxation, since the price they pay does not reflect the full value added by financial service providers, but only their use of taxable inputs. Views differ, however, as to whether or not a low rate on the use of financial services by financial consumers. Some argue for taxation of financial services at a relatively low rate, because, for instance, their use frees time for paid work, so that favorable treatment helps counteract the general tendency of taxation to discourage work effort.
The net impact of exemption is likely to be less tax revenue and a larger financial sector. The differing impacts on business and final use make the impact of exemption on the overall level of VAT revenue, and the extent of financial activity, ambiguous. Such evidence as there is, however, suggests that revenue would be increased by taxing (only) final use of financial services at the
69Insurance premiums are commonly subject to additional excises, so that the arguments which follow do not apply with the same force.
Financial Sector Taxation: The IMF’s Report to the G-20 and Background Material
64
standard VAT rate (Huizinga (2002), Genser and Winkler (1997)). The effect on the size of the sector depends on relative price sensitivities of business and final use, but the same evidence creates some presumption that the exemption of many financial services under current VATs result in the financial sector being larger than it would be under a perfectly functioning, single-rate VAT.
It is now understood how, in principle, to dispense with exemption—but no country does so. Treating all inflows to financial institutions (including of principal) as taxable sales and all outflows as taxable receipts achieves this.70 Understanding of this remains relatively new, however, and such approaches are untried in practice. And reforms of VATs have proved difficult in general, as the slow progress in improving the VAT treatment of financial services in the E.U. indicates. As noted in the text, some countries have found more ad hoc responses to the distortions created by exemption to be appropriate.
70For example, the government then receives positive tax, in present value, from a consumer depositing funds in a bank to the extent that the interest rate on that deposit is below the governments’ discount rate. For any transaction with a VAT-registered business, there is an offsetting credit for every liability, so that implementation can be simplified by excluding such transactions from tax (‘zero-rating’ them): see Poddar and English (1997), and Huizinga (2002).
Financial Sector Taxation: The IMF’s Report to the G-20 and Background Material
65
Appendix 6. The Financial Activities Tax: Design Issues and Revenue Potential This appendix elaborates on some of the key issues in designing the three forms of FAT described in the text, and provides a rough indication of their revenue potential.71
A6.1 Design Issues The FAT as an improvement to the taxation of financial services—‘FAT1’ This form of FAT would be an addition method VAT applied to financial services. Definition of the profit component. Leaving international trade aside (for the moment), the standard consumption-type VAT, being a tax on sales of real goods and services less purchases of non-labor inputs, is implicitly a tax on the sum of wages and ‘profits’ defined in cash flow terms (that is, with full expensing of investment and no deduction for financial costs). A key feature of this form of profit taxation is that it is neutral with respect to marginal financing and investment decisions, and it would be appropriate to build this property into a FAT1. Leading candidates for doing so are: (1) an ‘R+F’ definition of the profit component, taxing and deducting both real and financial transactions (including principal amounts); (2) an ACE definition. These are very similar in their neutrality properties and in the present value of the revenue they yield, though they would not yield the same revenue in every period. The former would be closer to the cash flow form implicit in current VATs (and would require adjusting the standard corporate tax base to disallow interest and deprecation but allow full expensing of investment), the latter would be closer to current corporate tax arrangements (simply adding a deduction for a notional return on equity, and perhaps restricting that on interest to the same rate). Interaction with the invoice-credit VAT. A VAT can be implemented coherently by applying either the credit-invoice or the addition method to all sectors. Difficulties arise, however, in trying to combine the two. These are most evident in relation to crediting arrangements, two questions arising: Should payment of uncreditable ‘normal’ input VAT by financial institutions be allowed
as a credit against FAT? There is a strong case against this, since that input VAT captures value added at previous stages, with the FAT itself capturing that added by the financial institution. The absence of such a credit also preserves an incentive to self-supply implied by exemption that mitigates the tendency to outsourcing which would otherwise be created by taxing wages and profits at a higher rate in the financial sector than elsewhere in the economy.
71Fuller discussion is provided in a forthcoming staff working paper.
Financial Sector Taxation: The IMF’s Report to the G-20 and Background Material
66
Should a credit be provided to purchasers of financial services? This is a more substantive issue. Some credit would be needed to avoid cascading and production inefficiencies. But it cannot be done with precision, since the FAT would not identify tax paid by transaction. While some form of rough ‘flat rate’ credit could be devised,72 a simple pragmatic approach would be to provide no credit but charge the FAT at lower than the generally prevailing VAT rate in order to limit the damage.
Border adjustment. To serve as a tax on final consumption of financial services, FAT1 would ideally be levied, like the VAT, on a destination basis: tax would ultimately be charged, that is, according to where such services are finally consumed, not where they are produced. The standard way to implement this under the VAT is by taking exports out of tax (including with refund of input tax) and bringing imports into tax. This ‘zero-rating’ could be mimicked under the FAT (with either type of profit component), but the difficulty arises that exports to nonfinancial companies would then go untaxed (those to financial companies, on the other hand, being appropriately taxed under the FAT applied abroad). The consequent distortion and dilution of revenue could in principle be mitigated by applying the VAT to exported services but sharing revenue across countries in line with the destination principle. Perimeter. The intention being to subject all financial services to indirect taxation, all enterprises conducting more than de minimis financial activities should be liable to FAT1. Clearly FAT1 cannot be a fully satisfactory substitute for perfecting the treatment of financial services within current credit-invoice VATs. But it may in some cases usefully help offset current imperfections, and spur more determined efforts to reform existing VATs.
A6.2 The FAT as a Tax on Rents—‘FAT2’ This form of FAT is intended as a tax on any returns to capital and labor in the financial sector above the minimum their providers require. As such, FAT2 (and FAT3 below) are akin to direct rather than (as FAT1) indirect taxes. Scope. Reflecting this orientation, there is no reason to consider border adjustment of the kind discussed above. Instead, the jurisdictional application of FAT2 would be by either the source of the rents or the residence of the recipient, and in this would presumably follow the established practice of each country applying the tax. Surplus earnings. The profit component of FAT2 could be any of the variants mentioned above as being neutral at the margin (with perhaps some preference for the ACE form as closer to current income tax practices). The wage component is much more problematic, since there is no similar mechanism for taxing ‘rents’ earned by labor. Identifying that part of any individual’s
72Kerrigan (2010).
Financial Sector Taxation: The IMF’s Report to the G-20 and Background Material
67
earnings due to effort or skill is extremely difficult in practice, so that a pragmatic approach would need to be adopted. This might be done, for instance, by comparing the earnings of top earners in the financial sector with those of top earners in other sectors. Perimeter. There is again no reason to exclude other than de minimis financial activities.
A6.3 The FAT as a Tax on Risk-taking—‘FAT3’ This form of FAT is intended to change behavior, discouraging risk-taking by taxing high returns more heavily than low. Identifying ‘excess’ returns. The base of FAT3 would be the return in excess of some threshold rate set some way above a normal return. The key consideration in setting the threshold rate is that it bring into tax the upside return to unduly risky activities but not the downside (so introducing the element of progressivity over the relevant range needed to affect risk-taking). This is of course essentially a matter of judgment, and the danger of taxing high returns due to skill or effort is unavoidable. Structuring the tax. Such a tax would likely be most readily implemented by combining an ACE-type profit tax with imputed return set equal to the threshold rate and a tax on the remuneration component of the same broad type as FAT2 (perhaps with greater exclusion, to catch only the upper tail of surplus earnings). Two questions arise. The first is whether the base should be excess returns to equity or to assets. Investors’ ease of shifting between debt and equity suggests the latter. Applying the tax only to equity returns would have the merit, however, of tending to offset the bias to debt finance under existing corporate taxes. The second is whether returns for this purpose should be cumulated over some period. This though would blunt the edge of the tax in reaching unusual returns; and companies will likely in any event have some ability to self-average by shifting receipts and spending between taxable periods. Statutory rate. To have a marked impact on risk-taking, the rate would likely need to be set so high as to make some degree of international cooperation necessary if significant profit-shifting and distortion is to be avoided.
A6.4 Revenue Potential The revenue potential of the various forms of FAT will differ across countries, depending on the relative size, profitability and wage structures of their financial sectors, and may be constrained by the need to apply low rates where the impact on competitiveness or the risk of avoidance are of concern. By way of illustration, Table A1.6 uses (aggregate) national account data for the financial sectors of OECD countries—readily available and internationally comparable—to suggest the magnitude of the potential base under each form of FAT. Revenue (absent any behavioral response) can then be inferred by multiplying these figures by the statutory rate. All these
Financial Sector Taxation: The IMF’s Report to the G-20 and Background Material
68
estimates—which are for the pre-crisis year 2006—are to be interpreted, however, as no more than indicating broad orders of magnitude.
The estimated FAT1 base is reported in Column 4. This is calculated as the sum of a profit component that broadly matches the R+F base (being gross operating profits (column 1) less gross fixed capital outlays (column 2)) and total wage costs (column 3). Averaging around 4.7 percent of GDP (excluding Luxembourg), the base is clearly sizable in many countries, and the corresponding revenue non-negligible. A FAT1 at 5 percent, for instance, is estimated to raise about 0.14 percent of GDP in Norway, and 0.31 percent of GDP in the United Kingdom. The extremely high base in Luxembourg points to the importance for many countries of the border adjustment issue discussed above,73 though there are no comparable and readily available data on exports of financial services in OECD countries with which to pursue this.
The FAT2 base estimates in column 6 use the same profit component as FAT174 but (in the absence of complete and comparable data on sectoral wage distributions) the wage component (column 5) simply assumes 12 percent of wage costs to be ‘surplus.’ (This is calculated as 40 percent of the wage differential,75 in the U.K., between the top 25 percent of earners in the financial sector and the top 25 percent in the wider economy). Though not to be taken as having any precision, the estimates point to a substantial reduction (by more than half, on average) of the base.
The FAT3 estimates in column 8 use the same wage component as in FAT2 but calculate the profit-related part (column 7) as the excess of after-tax net income in the banking sector over benchmark return on equity (ROE) of 15 percent.76 The aggregate for each country is calculated as the sum of this additional return multiplied by equity.77 The simple average base for FAT3 is about 1.2 percent of GDP, and in some countries the base is sizable.
73One implication is that if FAT1 were to be border adjusted then its base might be narrower than under the alternative forms. 74While an ACE-type base might be preferred for FAT2 and FAT3. 75Reflecting the estimate of Philippon and Reshef (2008) for the U.S. that 30-50 percent of the wage differential between financial and nonfinancial sectors is rent. 76This corresponds to a much higher pre-tax return. 77The ROE and equity series are derived from the BankScope database. This reports data both at consolidated and unconsolidated levels; following others in the literature, we identify unique banks by using a static variable that ranks banks within a country by total assets. As the ranking is available only for the most recent year but ROE in excess of the threshold is calculated for 2006s, this identification method is conservative in that it likely understates the FAT3 tax base.
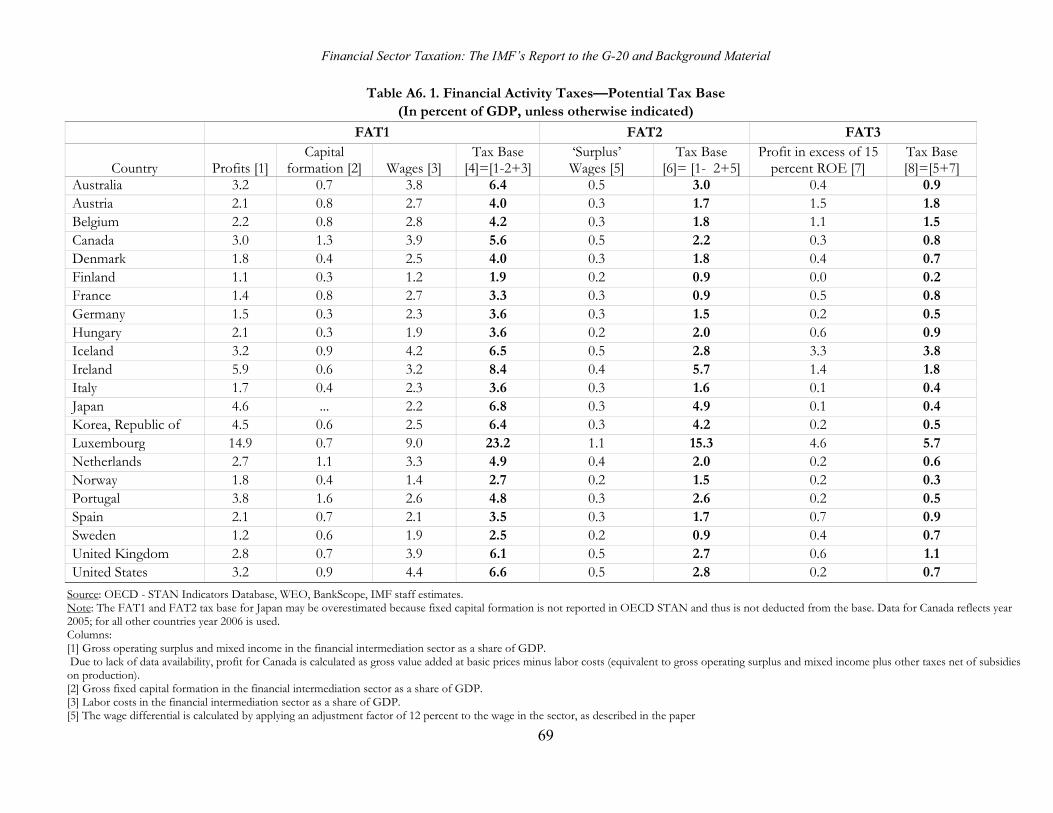
Financial Sector Taxation: The IMF’s Report to the G-20 and Background Material
69
Table A6. 1. Financial Activity Taxes—Potential Tax Base (In percent of GDP, unless otherwise indicated)
FAT1 FAT2 FAT3
Country
Profits [1] Capital
formation [2]
Wages [3] Tax Base
[4]=[1-2+3]‘Surplus’ Wages [5]
Tax Base [6]= [1- 2+5]
Profit in excess of 15 percent ROE [7]
Tax Base [8]=[5+7]
Australia 3.2 0.7 3.8 6.4 0.5 3.0 0.4 0.9Austria 2.1 0.8 2.7 4.0 0.3 1.7 1.5 1.8Belgium 2.2 0.8 2.8 4.2 0.3 1.8 1.1 1.5Canada 3.0 1.3 3.9 5.6 0.5 2.2 0.3 0.8Denmark 1.8 0.4 2.5 4.0 0.3 1.8 0.4 0.7Finland 1.1 0.3 1.2 1.9 0.2 0.9 0.0 0.2France 1.4 0.8 2.7 3.3 0.3 0.9 0.5 0.8Germany 1.5 0.3 2.3 3.6 0.3 1.5 0.2 0.5Hungary 2.1 0.3 1.9 3.6 0.2 2.0 0.6 0.9Iceland 3.2 0.9 4.2 6.5 0.5 2.8 3.3 3.8Ireland 5.9 0.6 3.2 8.4 0.4 5.7 1.4 1.8Italy 1.7 0.4 2.3 3.6 0.3 1.6 0.1 0.4Japan 4.6 ... 2.2 6.8 0.3 4.9 0.1 0.4Korea, Republic of 4.5 0.6 2.5 6.4 0.3 4.2 0.2 0.5Luxembourg 14.9 0.7 9.0 23.2 1.1 15.3 4.6 5.7Netherlands 2.7 1.1 3.3 4.9 0.4 2.0 0.2 0.6Norway 1.8 0.4 1.4 2.7 0.2 1.5 0.2 0.3Portugal 3.8 1.6 2.6 4.8 0.3 2.6 0.2 0.5Spain 2.1 0.7 2.1 3.5 0.3 1.7 0.7 0.9Sweden 1.2 0.6 1.9 2.5 0.2 0.9 0.4 0.7United Kingdom 2.8 0.7 3.9 6.1 0.5 2.7 0.6 1.1United States 3.2 0.9 4.4 6.6 0.5 2.8 0.2 0.7
Source: OECD - STAN Indicators Database, WEO, BankScope, IMF staff estimates. Note: The FAT1 and FAT2 tax base for Japan may be overestimated because fixed capital formation is not reported in OECD STAN and thus is not deducted from the base. Data for Canada reflects year 2005; for all other countries year 2006 is used. Columns: [1] Gross operating surplus and mixed income in the financial intermediation sector as a share of GDP. Due to lack of data availability, profit for Canada is calculated as gross value added at basic prices minus labor costs (equivalent to gross operating surplus and mixed income plus other taxes net of subsidies on production). [2] Gross fixed capital formation in the financial intermediation sector as a share of GDP. [3] Labor costs in the financial intermediation sector as a share of GDP. [5] The wage differential is calculated by applying an adjustment factor of 12 percent to the wage in the sector, as described in the paper
Financial Sector Taxation: The IMF’s Report to the G-20 and Background Material
70
References Acharya, Viral, Lasse Pedersen, Thomas Philippon, and Matthew Richardson, 2009,
“Regulating Systemic Risk,” in Viral Acharya and Matthew. Richardson (eds.), Restoring Financial Stability: How to Repair a Failed System, Wiley, March.
Adrian, Tobias, and Markus Brunnermeier, 2009, “CoVaR,” Federal Reserve Bank of
New York Staff Reports, No. 348. Arbeláez, María, Leonard Burman, and Sandra Zuluaga, 2005, “The Bank Debit Tax In
Colombia,” in Richard M. Bird, James M. Poterba and Joel Slemrod (eds.), Fiscal Reform in Colombia (Cambridge: MIT Press).
Bailey, A., 2010,”The U.K. Bank Resolution Regime” at www.bis.org/review/r091207e.pdf. Baker, Dean, and Travis McArthur, 2009, “The Value of the “Too Big to Fail” Big Bank
Subsidy,” Center for Economic and Policy Research (Washington) Issue Brief September.
Bank of England, 2009, “The Role of Macro-prudential Policy,” Discussion Paper. Basel Committee, 2009, “Consultative Proposals to Strengthen the Resilience of the
Banking Sector,” at http://www.bis.org/press/p091217.htm. Brierley, Peter, 2009, “The U.K. Special Insolvency Regime for failing Banks in and
International Context,” Financial Stability Paper No. 5 (Bank of England). Doluca, Hasan, Ulrich Klueh, Marco Wagner, and Beatrice Weder di Mauro, 2010,
“Reducing Systemic Relevance: A Proposal,” Discussion paper of the German Council of Economic Experts, GCEE.
European Commission, 2010, “Innovative Financing at a Global Level,” Commission
Staff Working Document SEC (2010) 409 final. Financial Stability Board, 2009, “FSB Principles for Sound Compensation Practices.” Genser, Bernd, and P. Winker, 1997, “Measuring the Fiscal Revenue Loss of VAT
Exemption in Commercial Banking,” Finanzarchiv, Vol. 54, pp. 565–85. Haldane, Andrew, 2009, “Banking on the State,” presented at the 12th Annual Federal
Reserve of Chicago International Banking Conference, September 25, 2009. www.bankofengland.co.uk/publications/speeches/2009/speech409.pdf.
Hellman, Thomas, Kevin Murdock, and Joseph Stiglitz, 2000, "Liberalization, Moral
Hazard in Banking and Prudential Regulation: Are Capital Requirements Enough?" American Economic Review, Vol. 90, No. 1, pp. 147–65.
Financial Sector Taxation: The IMF’s Report to the G-20 and Background Material
71
Hemmelgarn, Thomas, and Gaëtan Nicodème, 2010, “The 2008 Financial Crisis and Tax Policy,” Working Paper 20, European Commission Directorate-General for Taxation and Customs Union.
Huizinga, Harry, 2002, “Financial Services VAT,” Economic Policy¸ Vol. 17,
pp. 499-534. Huang, Rocco, and Lev Ratnovski, 2008, “The Dark Side of Bank Wholesale Funding,”
mimeo, International Monetary Fund. John, Kose, Teresa John and Lemma Senbet, 1991, “Risk-shifting Incentives of
Depository Institutions: A New Perspective on Federal Deposit Insurance Reform,” Journal of Banking and Finance, Vol. 15, pp. 895–915.
International Monetary Fund, 2009, “Debt Bias and Other Distortions: Crisis-related
Issues in Tax Policy,” available at http://www.imf.org. ———, FSB, and BCBS, 2009, Guidance to Assess the Systemic Importance of Financial
Institutions, Markets and Instruments: Initial Considerations. ———, 2010, Global Financial Stability Report, Meeting New Challenges To Stability
and Building a Safer System, April, Chapter 2, Systemic Risk and the Redesign of Financial Regulation, April.
Kerrigan, Arthur, 2010, “The Elusiveness of Neutrality – Why is it so Difficult to Apply
VAT to Financial Services?” International VAT Monitor, March-April 2010, pp. 103–12.
Kleinbard, Edward, 2007, “Designing an Income Tax on Capital,” in Henry J. Aaron,
Leonard Burman and Eugene Steuerle (eds), Taxing Capital Income, pp.165–210 (Washington, D.C: Urban Institute Press).
Klemm, Alexander, 2007, “Allowances for Corporate Equity in Practice,” CESifo
Economic Studies, Vol. 53, pp.229–62. Laeven, Luc, and Fabian Valencia, 2010, “Resolution of Banking Crises: The Good, The
Bad, and The Ugly” IMF Working Paper No. 10/146, Washington, D.C. Landier, Augustin, and Kenichi Ueda.2009, “The Economics of Bank Restructuring:
Understanding the Options,” IMF Staff Position Note, SPN/09/12, International Monetary Fund (Washington).
Lepetit, Jean-François,2010, “Rapport sur le risque systémique.” Levine, Ross, 2005, “Finance and Growth: Theory and Evidence,” mimeo (University of
Minnesota).
Financial Sector Taxation: The IMF’s Report to the G-20 and Background Material
72
Lloyd, Geoffrey, 2009, “Moving Beyond the Crisis: Using Tax Policy of Support Financial Stability,” mimeo, OECD.
Markle, Kevin S., and Douglas A. Shackelford, 2010, “Cross-country Comparisons of
Effective Tax Rates,” Working Paper (University of North Carolina). McDonald, Jason, and Shane Johnson, 2010, “Tax Policies to Improve the Stability of
Financial Markets,” mimeo, Department of the Treasury, Australia. Organization for Economic Cooperation and Development, 2007, Fundamental Reform of
Corporate Income Tax (Paris: OECD). Perotti, Enrico, and Javier Suarez, 2009a, “Liquidity Insurance for Systemic Crises,”
CEPR Policy Insight No. 31, February. –––––, 2009b, “Liquidity Risk Charges as a Macro-prudential Tool, CEPR Policy Insight
No. 40, November. Philippon, Thomas, and Ariell Reshef, 2008, “Wages and Human Capital in the U.S.
Financial Industry: 1909–2006,” mimeo (New York University). Poddar, Satya, and Morley English, 1997, “Taxation of Financial Services Under a Value-
Added Tax: Applying the Cash-flow Method,” National Tax Journal, Vol. 50, pp. 89–111.
Pricen, Savina, 2010, “How Does a Tax Allowance for Corporate Equity Affect Capital
Structure: An Empirical Evaluation,” mimeo (Louvain School of Management). Rime, Bertrand, 2005, “Do ‘Too Big to Fail’ Expectations Boost Large Banks Issuer
Ratings?” Manuscript, Swiss National Bank. Schmidt, Rodney, 2007, “The Currency Transaction Tax: Rate and Revenue Estimates”
(North-South Institute, Ottawa). Schulmeister, Stephan, 2010, “Boom-bust Cycles and Trading Practices in Asset Markets,
the Real Economy and the Effects of a Financial Transactions Tax,” Working Paper 364/2010 (Öesterreichisches Institut für Wirtschaftsforschung, Vienna).
Schulmeister, Stephan, Margit Schratzenstaller, and Oliver Picek, 2008, “A General
Financial Transaction Tax: Motives, Revenues, Feasibility and Effects” (Öesterreichisches Institut für Wirtschaftsforschung, Vienna).
Schwert, G.W., and P. Seguin, 1993, “Securities Transaction Taxes: An Overview of
Costs, Benefits and Unresolved Questions,” Financial Analysts Journal, pp. 27-35.
Financial Sector Taxation: The IMF’s Report to the G-20 and Background Material
73
Shin, Hyun Song, 2010a, "Financial Intermediation and the Post-Crisis Financial System," BIS Working Paper No. 304
Shin, Hyun Song, 2010b, "Non-Core Liabilities Tax as a Prudential Tool" policy memo, http://www.princeton.edu/~hsshin/www/NonCoreLiabilitiesTax.pdf
Slemrod, Joel, 2009, “Lessons for Tax Policy in the Great Recession,” National Tax Journal, Vol. LXII, pp. 387–97.
Soussa, Farouk, 2000, “Too Big to Fail: Moral Hazard and Unfair Competition?” Chapter
1 in collective volume, Financial Stability and Central Banks: Selected Issues for financial Safety Nets and Market Discipline, Bank of England (London).
Spratt, S., 2006, “A Sterling Solution: Implementing a Stamp Duty on Sterling to Finance
International Development” (London: Stamp Out Poverty). Staderini, A., 2001, “Tax Reforms to Influence Corporate Financial Policy: The Case of
the Italian Business Tax Reform of 1997-98,” Banca d’Italia Working Paper No. 423.
U.K. Treasury, 2009, Risk, Reward and Responsibility: The Financial Sector and Society. Weder di Mauro, Beatrice, 2010, “Taxing Systemic Risk: Proposal for a Systemic Risk
Charge and a Systemic Risk Fund,” mimeo (University of Mainz). Weichenrieder, Alfons, and Tina Klautke, 2008, “Taxes and the Efficiency Costs of
Capital Distortions,” CESifo Working Paper, No. 2431. Weitzman, Martin, 1974, “Prices Versus Quantities,” Review of Economic Studies¸
Vol. 61, pp. 477–91.
Financial Sector Taxation: The IMF’s Report to the G-20 and Background Material
74
2. Fair and Substantial ─ Taxing the
Financial Sector By Carlo Cottarelli
We knew we were in for a tough time when the leaders of the Group of Twenty (G-20) asked the IMF to give them our views, at their summit coming up in June 2010, on “… the range of options countries have adopted or are considering as to how the financial sector could make a fair and substantial contribution toward paying for any burden associated with government interventions to repair the banking system.” Everyone has strong feelings these days on the taxation of the financial sector. Taxpayers who financed the rescue of the financial sector during the recent crisis want their money back—or at least not to get caught again. Some want to see more of the money coursing through the financial system turned to public use. The industry worries about new taxes coming on top of the swathe of regulatory reforms that likely lies ahead for them. And some governments in countries whose financial sector weathered the storm pretty well wonder why they should now ask it for cash. Responding to the request from the G-20 leaders puts us in the middle of all these concerns. Last week the IMF gave an interim report to the G-20 finance ministers focused on the specific question we were asked: what are the options in raising money from the financial sector to pay for the costs of government intervention from which it benefits. That report is confidential, but—you may have noticed—has still managed to attract a lot of attention. So let me set out how our thinking on this stands. Our aim is to take a cool look at the issues about which everyone gets so heated. The options we have come up with so far—this interim report will be revised for the June summit—won’t please everyone (or, maybe, anyone), but can, we hope, help move the public debate ahead by bringing some economic and financial analysis to bear. In doing this we looked forward more than back. Revenge is not a good principle for tax design, but averting and preparing for future harm is. 2.1 What is to be Done? The challenge is to ensure that financial institutions bear the direct fiscal costs that any future failures or crises will impose—and maybe somewhat more, given all the other costs that bank failure can impose on the economy.
Financial Sector Taxation: The IMF’s Report to the G-20 and Background Material
75
We also need to make these events both less likely to happen and less costly when they do. We think two types of tax can play a role. A ‘Financial Stability Contribution’—I come to bury Caesar, not to bail him out One reason the crisis was such a painful mess was that many governments did not have the tools to wind down failing institutions in a quick and orderly manner. All too often their only options, both hugely unpleasant, were to either (1) let a systemic institution fail and bear the chaotic fallout or (2) pump in enough public support to keep it alive, so confirming the prior suspicion that these institutions were indeed too big to fail. Governments lacked a way to ‘resolve’—a new word even for many economists—large failing institutions. Resolution means equity holders would be wiped out, management replaced, and unsecured creditors take a loss—a ‘haircut’—on their claims. All this should be nasty enough for owners and managers to reduce any problems of ‘moral hazard’ (taking too much risk in the expectation that someone else will bear the costs if things turn out badly). But most countries still don’t have such a mechanism. Financial stability requires creating them. 2.2 So where does the idea of a contribution come in? Resolution requires upfront cash, to reduce uncertainty for creditors (and the creditors’ creditors…) by quickly giving some value to their claims. And the industry should pay for this: it is, or should be, a cost of doing business just like paying for deposit insurance, or maintaining their information systems. This is what we call a Financial Stability Contribution (FSC). It would ensure that the industry does indeed pay a reasonable chunk of these resolution costs before a crisis occurs, with this amount topped up, if needed, by ‘ex post’ charges after disaster strikes (much as the Financial Crisis Responsibility fee proposed in the United States aims to recoup some of the costs of public support). 2.3 Costs of the Crisis Incidentally, as a first step, we tried to figure out how much the recent crisis has cost governments in terms of the direct support they provided to the financial sector. The answer is: so far, about 2.7 percent of GDP for the group of advanced G-20 countries. More for some, less for others – including most emerging market countries. That’s a sizable sum, but the risks during the crisis were even larger, with guarantees and other contingent liabilities averaging around 25 percent of GDP for the advanced G-20. And all that ignores indirect fiscal costs caused by the recession and (to a lesser extent) stimulus measures—which is causing a surge in public debt—and, perhaps most cruelly, of all, a cumulative loss of output of around 27 percent of GDP. The FSC would start as a simple levy on some balance sheet (and, possibly, off-balance sheet) variables, but then be refined to strengthen the link with each institution’s
Financial Sector Taxation: The IMF’s Report to the G-20 and Background Material
76
contribution to systemic risk—giving them some incentive to reduce it. It would be permanent (to keep that beneficial effect at work, at least until regulatory solutions are felt to have done enough) and paid by all financial institutions (because they all benefit from the greater financial stability the resolution mechanism provides). Whether the revenue from such a charge should be treated just like other tax revenue or instead feed an earmarked fund to help with resolutions is secondary. The fiscal impact is the same (assuming of course, other policies are not affected by whether there is or not an earmarked fund): the government has to sell fewer bonds on the open market, either because it has more tax revenue or because it has a captive customer in the fund. The main argument for a fund is that it could provide more assurance that the agency in charge of resolution has ready access to the resources it needs. 2.4 A ‘Financial Activities Tax’ A FAT is just a tax on the sum of the profits and remuneration paid by financial institutions. That sounds simple, and, in essence, it is. But why an extra tax on financial institutions? Here, I’m afraid, things get a bit nerdy. So brace up for what is coming. Profits plus all remuneration is value added. So a tax of this kind would be a kind of Value-Added Tax or VAT. And that could make sense because current VATs don’t work well for financial services, which are largely VAT-exempt. This means that a FAT of this kind could make the tax treatment of the financial sector more like that other sectors and so help offset a tendency for the financial sector, purely for tax reasons, to be too large—or too fat. Now suppose that the base included only remuneration above some high level, and only profits above a ‘normal’ rate of return. Then the base of the FAT may not be a bad proxy for taxes on ‘rents’—return in excess of competitive levels—earned in the sector. Some might find taxing that excess fair. Or one might include only profits above some level well above normal. Taxing away some of these high returns in good times may help correct for any tendency to excessive risk-taking implied by financial institutions not attaching enough weight to outcomes in bad times (whether because of limited liability, or because they think themselves too big to fail). 2.5 What about a Financial Transactions Tax? We also looked at the idea of a general financial transactions tax (FTT)—the last few months have left us in no doubt as to the seriousness of the public support this enjoys. This would be a tax paid every time a share, bond, or other financial instrument is bought or sold, and/or whenever foreign currency is bought or sold. Our work is not yet complete—this is an interim report, remember—but, while some forms of FTT may be feasible (indeed most G-20 countries already tax some financial transactions), we don’t think this is the best way of meeting the two key objectives set out above. An FTT

Financial Sector Taxation: The IMF’s Report to the G-20 and Background Material
77
is not focused on reducing systemic risk and it isn’t effective at taxing rents in the financial sector—much of the burden may well fall on ordinary consumers. Moreover, the financial services industry is very good at devising schemes to get around such a tax and (this is also true, to be fair, of the FSC and FAT, but we suspect to a lesser extent). One way to think about the comparison is that just as a FAT is like a VAT, an FTT is like a turnover tax—and most countries have long found that the VAT is better at raising revenue: in the jargon, more efficient. All this doesn’t mean we rule out an FTT in other contexts—but it is not the most effective way to address the task at hand. 2.6 Should Everyone do This? Several countries that did not need to pour large resources into their financial institutions are naturally reluctant to lumber them with more charges. At the same time, financial institutions are so adept at tax and regulatory arbitrage that those countries who do want to act fear they may be undercut by those who don’t. But this tension is not as great as it may seem. If financial history teaches us anything, it is that no one should think themselves immune from failures and crisis. Moreover, if the FSC in particular is properly risk-adjusted, countries with safer systems will simply face a smaller contribution. And importantly, the last thing we want to do is to repress/bury the financial sector by imposing a heavy burden; like the food supply, it means too many good things for economic growth. 2.7 Next What we gave to G-20 ministers was an interim report, and we will be working more on this in the light of their discussion last Friday. We will continue too to listen to what others tell us. One theme of our work that has already been widely stressed is that any tax initiatives need to be coordinated with regulatory ones—so we have some number-crunching, as well as tougher times, ahead of us. Still, we hope to contribute to the debate on what really matters in all this: how to reduce the risk, and costliness, of future financial failures.
Financial Sector Taxation: The IMF’s Report to the G-20 and Background Material
78
3. How Costly Are The 2007-2009
Systemic Banking Crises? By Luc Laeven and Fabián Valencia
Direct fiscal costs to support the financial sector were smaller this time as a consequence of swift policy action and significant indirect support from expansionary monetary and fiscal policy, the widespread use of guarantees on liabilities, and direct purchases of assets. While these policies have reduced the real impact of the current crisis, they have increased the burden of public debt and the size of government contingent liabilities, raising concerns about fiscal sustainability in some countries. 3.1 Introduction Many countries around the world experienced one way or another effects of the financial crisis that started in the U.S. in 2007. The severity of the shock varied across countries mainly with the degree of cross-border exposures to troubled markets, and the extent to which homegrown imbalances were present. However, not all of the countries affected ended up suffering a systemic banking crisis. Therefore, in assessing the consequences of systemic banking crises, a natural starting point is defining the threshold that turns an episode of distress into a systemic crisis. An uncontroversial definition of a systemic banking crisis is a situation where a large fraction of banking system capital has been depleted (e.g., Caprio et al., 2005; Laeven and Valencia, 2008; and Reinhart and Rogoff, 2009). However, implementing this definition implies relying heavily on qualitative information, given the difficulty in measuring economic losses. Laeven and Valencia (2010) propose a crisis definition based on the range and scale of policy interventions that improves upon this qualitative strategy. Laeven and Valencia (2010)’s definition requires the fulfillment of two conditions: Significant signs of financial distress in the banking system (i.e., significant bank runs, losses, and liquidations) and significant banking policy intervention measures in response to significant losses in the banking system (see Laeven and Valencia, 2010 for a detailed description of thresholds and definitions of policy intervention measures). The year that both criteria are met marks the beginning of a systemic banking crisis. Based on this definition, 13 countries experienced a systemic banking crisis during 2007-2009: Austria, Belgium, Denmark, Germany, Iceland, Ireland, Latvia, Luxembourg, Mongolia, Netherlands, Ukraine, United Kingd77om, and United States. 10 additional countries are listed as borderline cases, representing episodes where the definition is almost
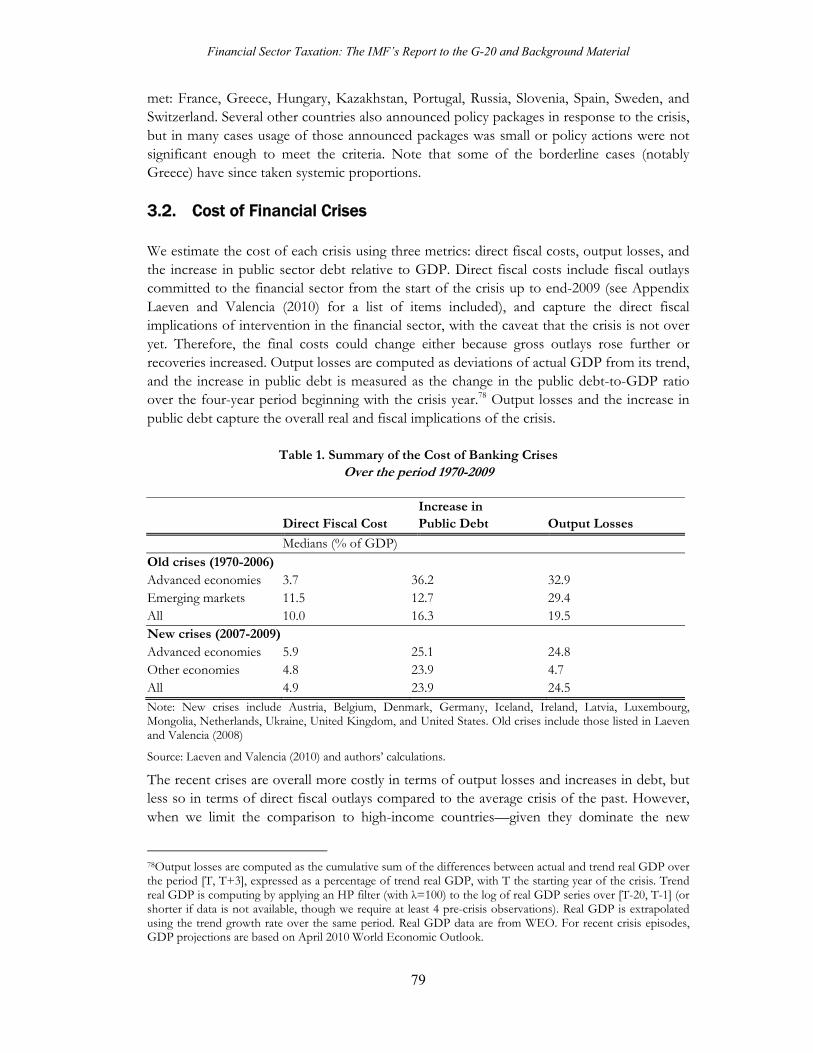
Financial Sector Taxation: The IMF’s Report to the G-20 and Background Material
79
met: France, Greece, Hungary, Kazakhstan, Portugal, Russia, Slovenia, Spain, Sweden, and Switzerland. Several other countries also announced policy packages in response to the crisis, but in many cases usage of those announced packages was small or policy actions were not significant enough to meet the criteria. Note that some of the borderline cases (notably Greece) have since taken systemic proportions. 3.2. Cost of Financial Crises We estimate the cost of each crisis using three metrics: direct fiscal costs, output losses, and the increase in public sector debt relative to GDP. Direct fiscal costs include fiscal outlays committed to the financial sector from the start of the crisis up to end-2009 (see Appendix Laeven and Valencia (2010) for a list of items included), and capture the direct fiscal implications of intervention in the financial sector, with the caveat that the crisis is not over yet. Therefore, the final costs could change either because gross outlays rose further or recoveries increased. Output losses are computed as deviations of actual GDP from its trend, and the increase in public debt is measured as the change in the public debt-to-GDP ratio over the four-year period beginning with the crisis year.78 Output losses and the increase in public debt capture the overall real and fiscal implications of the crisis.
Table 1. Summary of the Cost of Banking Crises Over the period 1970-2009
Direct Fiscal Cost
Increase inPublic Debt Output Losses
Medians (% of GDP)Old crises (1970-2006) Advanced economies 3.7 36.2 32.9 Emerging markets 11.5 12.7 29.4All 10.0 16.3 19.5 New crises (2007-2009) Advanced economies 5.9 25.1 24.8 Other economies 4.8 23.9 4.7 All 4.9 23.9 24.5 Note: New crises include Austria, Belgium, Denmark, Germany, Iceland, Ireland, Latvia, Luxembourg, Mongolia, Netherlands, Ukraine, United Kingdom, and United States. Old crises include those listed in Laeven and Valencia (2008)
Source: Laeven and Valencia (2010) and authors’ calculations.
The recent crises are overall more costly in terms of output losses and increases in debt, but less so in terms of direct fiscal outlays compared to the average crisis of the past. However, when we limit the comparison to high-income countries—given they dominate the new
78Output losses are computed as the cumulative sum of the differences between actual and trend real GDP over the period [T, T+3], expressed as a percentage of trend real GDP, with T the starting year of the crisis. Trend real GDP is computing by applying an HP filter (with λ=100) to the log of real GDP series over [T-20, T-1] (or shorter if data is not available, though we require at least 4 pre-crisis observations). Real GDP is extrapolated using the trend growth rate over the same period. Real GDP data are from WEO. For recent crisis episodes, GDP projections are based on April 2010 World Economic Outlook.
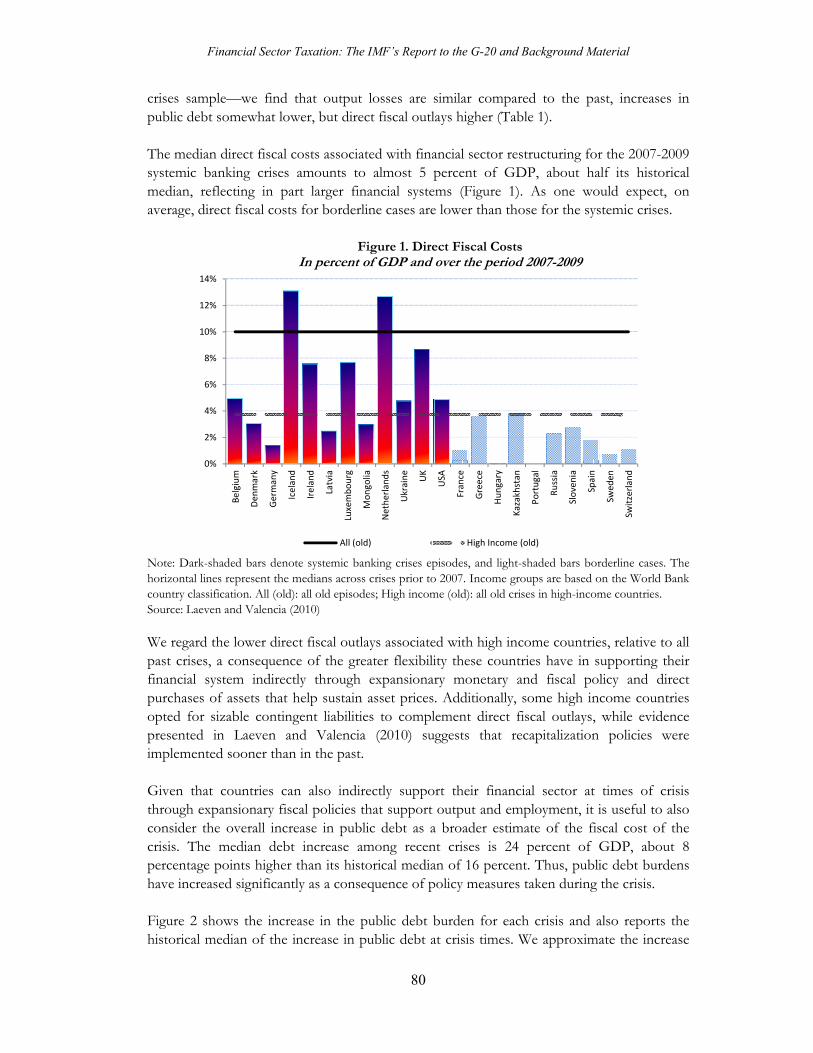
Financial Sector Taxation: The IMF’s Report to the G-20 and Background Material
80
crises sample—we find that output losses are similar compared to the past, increases in public debt somewhat lower, but direct fiscal outlays higher (Table 1). The median direct fiscal costs associated with financial sector restructuring for the 2007-2009 systemic banking crises amounts to almost 5 percent of GDP, about half its historical median, reflecting in part larger financial systems (Figure 1). As one would expect, on average, direct fiscal costs for borderline cases are lower than those for the systemic crises.
Figure 1. Direct Fiscal Costs In percent of GDP and over the period 2007-2009
Note: Dark-shaded bars denote systemic banking crises episodes, and light-shaded bars borderline cases. The horizontal lines represent the medians across crises prior to 2007. Income groups are based on the World Bank country classification. All (old): all old episodes; High income (old): all old crises in high-income countries. Source: Laeven and Valencia (2010) We regard the lower direct fiscal outlays associated with high income countries, relative to all past crises, a consequence of the greater flexibility these countries have in supporting their financial system indirectly through expansionary monetary and fiscal policy and direct purchases of assets that help sustain asset prices. Additionally, some high income countries opted for sizable contingent liabilities to complement direct fiscal outlays, while evidence presented in Laeven and Valencia (2010) suggests that recapitalization policies were implemented sooner than in the past. Given that countries can also indirectly support their financial sector at times of crisis through expansionary fiscal policies that support output and employment, it is useful to also consider the overall increase in public debt as a broader estimate of the fiscal cost of the crisis. The median debt increase among recent crises is 24 percent of GDP, about 8 percentage points higher than its historical median of 16 percent. Thus, public debt burdens have increased significantly as a consequence of policy measures taken during the crisis. Figure 2 shows the increase in the public debt burden for each crisis and also reports the historical median of the increase in public debt at crisis times. We approximate the increase
0%
2%
4%
6%
8%
10%
12%
14%
Bel
giu
m
Den
mar
k
Ger
man
y
Icel
and
Irel
and
Latv
ia
Luxe
mb
ou
rg
Mo
ngo
lia
Net
her
lan
ds
Ukr
ain
e
UK
USA
Fran
ce
Gre
ece
Hu
nga
ry
Kaz
akh
stan
Po
rtu
gal
Ru
ssia
Slo
ven
ia
Spai
n
Swed
en
Swit
zerl
and
All (old) High Income (old)
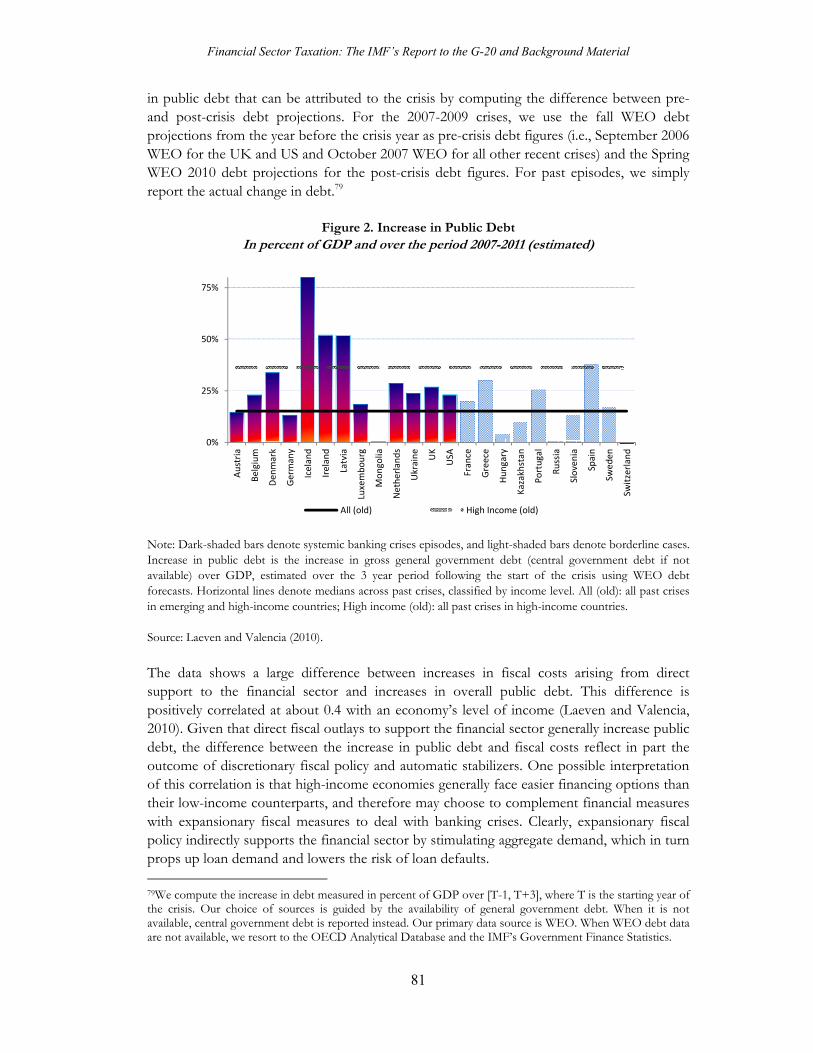
Financial Sector Taxation: The IMF’s Report to the G-20 and Background Material
81
in public debt that can be attributed to the crisis by computing the difference between pre- and post-crisis debt projections. For the 2007-2009 crises, we use the fall WEO debt projections from the year before the crisis year as pre-crisis debt figures (i.e., September 2006 WEO for the UK and US and October 2007 WEO for all other recent crises) and the Spring WEO 2010 debt projections for the post-crisis debt figures. For past episodes, we simply report the actual change in debt.79
Figure 2. Increase in Public Debt In percent of GDP and over the period 2007-2011 (estimated)
Note: Dark-shaded bars denote systemic banking crises episodes, and light-shaded bars denote borderline cases. Increase in public debt is the increase in gross general government debt (central government debt if not available) over GDP, estimated over the 3 year period following the start of the crisis using WEO debt forecasts. Horizontal lines denote medians across past crises, classified by income level. All (old): all past crises in emerging and high-income countries; High income (old): all past crises in high-income countries. Source: Laeven and Valencia (2010). The data shows a large difference between increases in fiscal costs arising from direct support to the financial sector and increases in overall public debt. This difference is positively correlated at about 0.4 with an economy’s level of income (Laeven and Valencia, 2010). Given that direct fiscal outlays to support the financial sector generally increase public debt, the difference between the increase in public debt and fiscal costs reflect in part the outcome of discretionary fiscal policy and automatic stabilizers. One possible interpretation of this correlation is that high-income economies generally face easier financing options than their low-income counterparts, and therefore may choose to complement financial measures with expansionary fiscal measures to deal with banking crises. Clearly, expansionary fiscal policy indirectly supports the financial sector by stimulating aggregate demand, which in turn props up loan demand and lowers the risk of loan defaults. 79We compute the increase in debt measured in percent of GDP over [T-1, T+3], where T is the starting year of the crisis. Our choice of sources is guided by the availability of general government debt. When it is not available, central government debt is reported instead. Our primary data source is WEO. When WEO debt data are not available, we resort to the OECD Analytical Database and the IMF’s Government Finance Statistics.
0%
25%
50%
75%
Au
stri
a
Bel
giu
m
De
nm
ark
Ger
man
y
Icel
and
Irel
and
Latv
ia
Luxe
mb
ou
rg
Mo
ngo
lia
Net
her
lan
ds
Ukr
ain
e
UK
USA
Fran
ce
Gre
ece
Hu
nga
ry
Kaz
akh
stan
Po
rtu
gal
Ru
ssia
Slo
ven
ia
Spai
n
Swe
de
n
Swit
zerl
and
All (old) High Income (old)
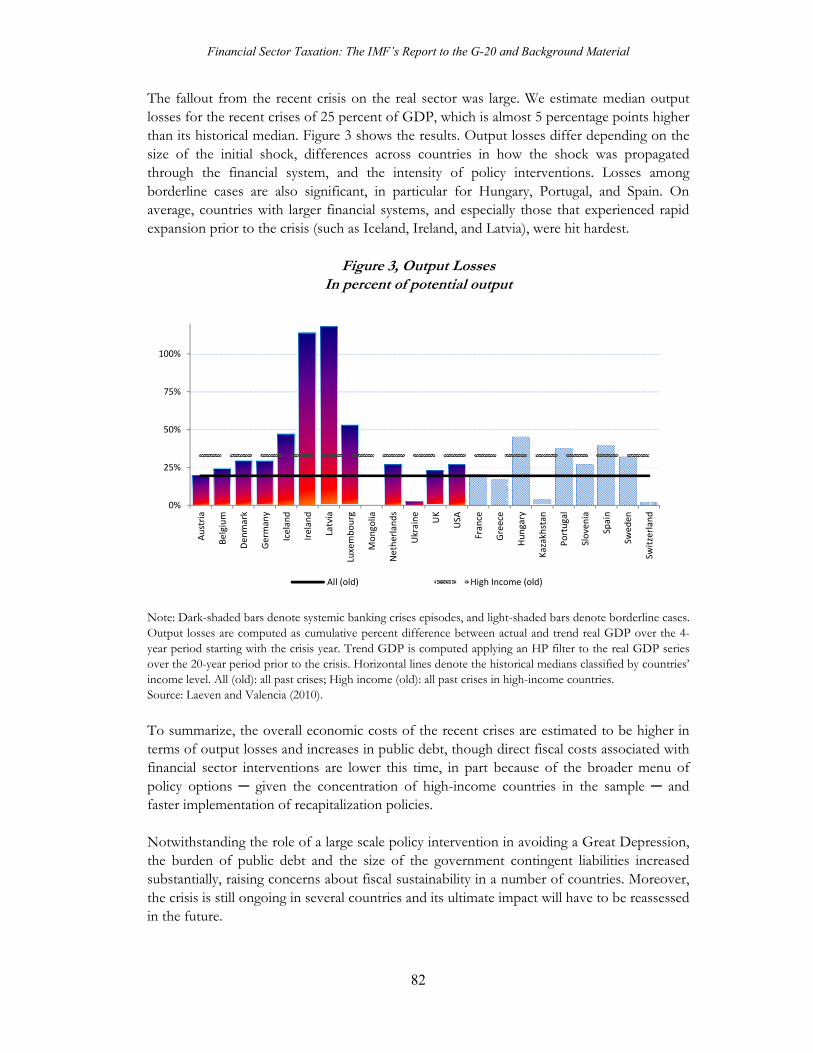
Financial Sector Taxation: The IMF’s Report to the G-20 and Background Material
82
The fallout from the recent crisis on the real sector was large. We estimate median output losses for the recent crises of 25 percent of GDP, which is almost 5 percentage points higher than its historical median. Figure 3 shows the results. Output losses differ depending on the size of the initial shock, differences across countries in how the shock was propagated through the financial system, and the intensity of policy interventions. Losses among borderline cases are also significant, in particular for Hungary, Portugal, and Spain. On average, countries with larger financial systems, and especially those that experienced rapid expansion prior to the crisis (such as Iceland, Ireland, and Latvia), were hit hardest.
Figure 3, Output Losses In percent of potential output
Note: Dark-shaded bars denote systemic banking crises episodes, and light-shaded bars denote borderline cases. Output losses are computed as cumulative percent difference between actual and trend real GDP over the 4-year period starting with the crisis year. Trend GDP is computed applying an HP filter to the real GDP series over the 20-year period prior to the crisis. Horizontal lines denote the historical medians classified by countries’ income level. All (old): all past crises; High income (old): all past crises in high-income countries. Source: Laeven and Valencia (2010). To summarize, the overall economic costs of the recent crises are estimated to be higher in terms of output losses and increases in public debt, though direct fiscal costs associated with financial sector interventions are lower this time, in part because of the broader menu of policy options ─ given the concentration of high-income countries in the sample ─ and faster implementation of recapitalization policies. Notwithstanding the role of a large scale policy intervention in avoiding a Great Depression, the burden of public debt and the size of the government contingent liabilities increased substantially, raising concerns about fiscal sustainability in a number of countries. Moreover, the crisis is still ongoing in several countries and its ultimate impact will have to be reassessed in the future.
0%
25%
50%
75%
100%
Au
stri
a
Be
lgiu
m
Den
mar
k
Ger
man
y
Icel
and
Irel
and
Latv
ia
Luxe
mb
ou
rg
Mo
ngo
lia
Net
her
lan
ds
Ukr
ain
e
UK
USA
Fran
ce
Gre
ece
Hu
nga
ry
Kaz
akh
stan
Po
rtu
gal
Slo
ven
ia
Spai
n
Swed
en
Swit
zerl
and
All (old) High Income (old)
Financial Sector Taxation: The IMF’s Report to the G-20 and Background Material
83
References
Caprio, Gerard, Daniela Klingebiel, Luc Laeven, and Guillermo Noguera, 2005, “Banking Crisis Database,” in Patrick Honohan and Luc Laeven (eds.), Systemic Financial Crises: Containment and Resolution. Cambridge, U.K.: Cambridge University Press.
Laeven, Luc, and Fabian Valencia, 2008, “Systemic Banking Crises: A New Database,” IMF
Working Paper No. 08/224, Washington, D.C. Laeven, Luc, and Fabian Valencia, 2010, “Resolution of Banking Crises: The Good, The
Bad, and The Ugly” IMF Working Paper No. 10/146, Washington, D.C. Reinhart, Carmen, and Kenneth Rogoff, 2009, This Time is Different: Eight Centuries of Financial
Folly, Princeton University Press.
Financial Sector Taxation: The IMF’s Report to the G-20 and Background Material
84
_________________________________ 4. Reshaping Systemic Risk
Regulation in Europe
By Beatrice Weder di Mauro and Ulrich Klüh
The global financial crisis has exposed numerous weaknesses with respect to the modus operandi of financial markets and financial regulation.80 Since the start of the crisis, many reforms have been initiated, ranging from changes to capital and liquidity regulation to changes to the institutional structure of supervision. Still, progress on the more fundamental question of how to fix incentives in the private and public sectors has been limited, both on the global level and in particular on the European level.
On the global level, the first set of major gaps relates to concrete steps to reduce procyclicality. However, much would be gained if all the reform proposals envisioned by the G20, the Financial Stability Board and the Basel Committee on Banking Supervision, ranging from an internationally consistent leverage ratio to anti- cyclical capital and provisioning requirements would be implemented stringently and complemented with a framework for contingent capital and convertible capital instruments.81 If, in addition, central banks widen the scope of their mission by giving fluctuations in asset prices and leverage a more prominent role in policy formulation, the major remaining issue would be to review critically the potential procyclical effects of accounting regimes.
The focus of this paper is a second set of gaps—namely the treatment of financial institutions that are considered “too-important-to-fail” either because of the potential systemic consequences of failure, or because of more subtle reasons, including their political connectedness. In this respect, it is interesting to note that the crisis has not brought up fundamentally new issues. Rather in our view, it has resolved a number of longstanding debates. Positions that have long been challenged for lack of evidence have received substantial empirical support. In addition, the crisis has brought broader scientific, public and political attention to these debates.
80This article draws on a proposal put forward in the German Council of Economic Expert’s (GCEE’s) Annual Report (“Die Zukunft nicht aufs Spiels setzen,” Jahresgutachten 2009/10, Sachverständigenrat zur Begutachtung der gesamtwirtschaftlichen Entwicklung), and is based on material from a joint paper with H. Doluca and M. Wagner (“Reducing Systemic Relevance: A Proposal,” GCEE Discussion Papers No. 02-2010) as well as on Ulrich Klueh, “Financial Safety Net Design and Systemic Stability,” Shaker Verlag, 2006. 81Basel Committee for Banking Supervision, 2009, for a survey of reform initiatives that are either under way or are considered by the international community.
Financial Sector Taxation: The IMF’s Report to the G-20 and Background Material
85
As a consequence of recent experiences, many governments and academics seem to be aware of the extent to which implicit government guarantees for financial institutions with special characteristics (their size, interconnectedness, complexity, and political clout) are a crucial factor in shaping perverse incentives. Before the crisis, many academics would not have agreed to the assertion that “Too-important-to-fail” would be the single most important problem for policymakers.
82 In the view of many observers, the crisis has made clear that the time inconsistency of policy interventions—the fact that ex post, or in a crisis, institutions would be bailed out with taxpayer money, has been indeed the major driving force behind the developments that led to the crisis.83 As a consequence, any overhaul of financial regulation has to prioritize the solutions to this problem of time inconsistency.
4.1 Fixing Incentives: Gaps in the European Reform Agenda
While meaningful reforms that take into account time inconsistency and redefine the relationship between the state and the financial sector have proceeded slowly everywhere, gaps in reforms are particularly pronounced in Europe. We see four major problems. First, there is no agreement on the right tools to reduce the systemic relevance of individual systemic institutions, either on the academic or on the political front. A number of proposals have been made, ranging from systemic risk capital charges over living wills, to a return to narrow banking, but none of these proposals seems to satisfactorily resolve the issue. While disagreement over how to proceed is not a European phenomenon, the European Union faces an additional challenge that has not even come to the surface: in order to preserve a level playing field and prevent free rider behavior, all meaningful solutions would require that a pan-European institution take care of decisions to either directly reduce the size and alter the structure of the operations of financial institutions, or indirectly increase the burden on those that choose to be systemically relevant.
Second, and closely related, steps to relocate responsibility for the supervision of financial institutions that operate cross-border to the European level have been too limited to take into account one of the major lessons of the crisis—an internationally active financial institution needs international supervision and intervention regimes that are equipped with micro-prudential data and the right to intervene when necessary. Steps undertaken so far suffer from two main deficiencies. First, the envisioned structure, in which the European Systemic Risk Board (ESRB) is in charge of macro-prudential issues the European System of Financial Supervisors (ESFS) generates a network of national micro-prudential regulatory authorities working jointly with the three newly-created sector supervisory bodies (European Supervisory Authorities, or ESAs), insufficiently integrate macro and micro-prudential oversight. Even though information exchange is a component of the new regime, it remains unclear and, in the view of many, it is unlikely to share all necessary information with the institution with most integrative powers—the European Central Bank (ECB). This information deficit points to the second, more fundamental, problem. Rather than making a decisive step towards a centralized European solution close to or at the ECB, a highly complex and coordination-intensive bureaucracy has been set up. Even though some powers were given to the newly created bodies, they essentially remain paper tigers.
82Mishkin (2006). 83Alessandri and Haldane (2009) provide an intriguing account of the view that the major factors behind the crisis are not to be found either in the private or the public sector, but in incentives resulting from the failed relationship between the two.
Financial Sector Taxation: The IMF’s Report to the G-20 and Background Material
86
Third, progress in the area of resolution regimes and burden sharing has been slow. The lack of efficient resolution regimes for systemically relevant banks was one of the reasons why almost all banks—no matter their size—have been bailed out. It is not possible to take action without dispersing severe shocks through the financial system, thus reinforcing the credibility deficit of the government, without insolvency regimes that account for the special characteristics of financial institutions, More than in other parts of the world, the crisis has exposed the European Union’s lack of an effective crisis management framework for cross-border financial institutions. National approaches differ in institutional settings, measures and procedural requirements, as well as in the definition of the formal point of insolvency. Sovereign authorities have strong incentives to operate only on the national level, within the boundaries of closed regimes that would be inadequate even in a closed economy setting.84 As a consequence, authorities ring-fenced a bank’s assets within their territory and applied national resolution tools at the level of each entity rather than at the level of the cross-border group. Even though the crisis caught the institutional framework for crisis management off-guard, only some countries have reshaped their resolution framework so far. The work on a European scheme for a cross-border resolution regime does not seem to proceed perceptibly. The major reason for the standstill is in our view that the crucial issue of burden-sharing between the private and the public sector on the one hand, and between different nation states on the other, has not been addressed vigorously enough.
Finally, not enough emphasis has been given to the question of how to increase the responsiveness of supervisory authorities to emerging problems in the financial system. For many good and bad reasons, public authorities are reluctant to intervene early, that is, even before systemic risk materializes.85
While before the crisis, prompt corrective action frameworks were high on the agenda of many professional observers, the impetus for reform seems to have rather decreased than increased.86
4.2 Time Inconsistency: Scale and Scope of the Problem
Against this backdrop, chances are that the crisis will not lead to a holistic policy response and that the fundamental incentive problems rooted in the failed relationship between financial institutions and the state remain unaddressed. This is deeply regrettable, as the scale and nature of the problem has never been more apparent. As to the scale, financial institutions have received unprecedented amounts of financial assistance from central banks and taxpayers. The financial advantage that many of these institutions have enjoyed because of implicit and explicit guarantees has proven to be large enough to distort incentives in very unfavourable directions.87
As to the nature of the problem, many observers now agree that what is at work is a fundamental commitment problem of the state that has become worse over time. Public authorities are forced to emphasize the ex post cost of being tough on banks, reducing the positive ex ante incentive effects of timely and strict corrective measures. The difference 84European Commission (2009) and IMF (2000). 86 Mayes (2009). 87Baker and McArthur (2009), illustrates the financial privilege that results from Too-big-to–fail policies. They show that systemically relevant banks enjoy a substantial funding advantage that increased dramatically after the near collapse of the system in September 2008.
Financial Sector Taxation: The IMF’s Report to the G-20 and Background Material
87
between ex ante and ex post optimality, in turn, can give rise to time inconsistency of regulatory policies. This means that the preference of an authority to follow a certain policy changes in the course of events: a welfare-maximizing supervisor would like to commit to a tough intervention policy to restrain risk-taking by banks. He therefore announces to intervene whenever capital falls below a certain threshold. However, as soon as banks expect a strict policy stance, there is an incentive to be soft ex post, to avoid the externalities resulting from intervention. Anticipating this, banks will adjust their beliefs concerning intervention. This leads to excessive risk-taking or a failure to implement proper risk-management technologies. When the overall situation deteriorates, the state of the banking system may be such that a forbearing policy becomes unavoidable. Expectations of lenient intervention can become self-fulfilling. In recent decades, the significance of these guarantees has increased dramatically, as the amount of truly liquid assets and capital on banks’ balance sheet has decreased. A ratchet effect appears to be at work, by which each crisis leads to an update of bailout expectations and thus a deterioration of the state’s position in its contractual relationship with the financial sector.88 9
While the scale and nature of the problem has been manifest, its scope has received less attention. Why do supervisors have a tendency to exercise forbearance? Before the crisis, a large number of studies stressed the role of supervisory forbearance as well as the time inconsistency of bank intervention policies. It is useful to go back to this literature, to highlight the fact that supervisors might be passive for manifold reasons, and that one should distinguish two fundamentally different sources of the observed reluctance to be tough on banks: good and bad ones.
On the one hand, forbearance can result from a divergence between ex post and ex ante efficiency. In these cases, forbearance is rooted in the understandable desire to avoid the negative externalities of an overly tough intervention policy. Generally, it is possible to distinguish three types of these externalities. A first group of factors has dominated debates in the context of the crisis—fundamentally healthy financial institutions may suffer from the contagious consequences of a policy that emphasizes the positive ex ante incentives from stringent closure rules or rescue policies. Besides contagion through direct linkages between intermediaries,89 a particular concern is the potential for “fire sales” on financial markets. These can be the result of depressed asset values due to the information costs of liquidation, or of purely expectation-based phenomena, like sun-spots, panics and self-fulfilling runs. The related systemic costs from tough intervention will often be an increasing function of a number of characteristics of financial institutions:
- The systemic impact of a bank failure increases with the size of the bank, since large players are usually more active in payment systems and inter- bank markets. Consequently, closing down large institutions will typically be more risky in systemic terms, and thus less likely.
- Rather than looking at bank size, it is also possible to look at the position of an intermediary within the financial system. Even relatively small institutions can be highly interconnected. In particular, when overall leverage is high, failure to pay can lead to fire sales, a drying-up of liquidity, and other contagious effects. The problems become particularly severe if the intermediary holds very complex positions, which cannot be
88Alessandri and Haldane, November 2009. 89De Bandt and Hartmann, 2000.
Financial Sector Taxation: The IMF’s Report to the G-20 and Background Material
88
disentangled easily.
- Finally, intervention costs can increase over-proportionally with the number of banks under stress, a problem that has been coined the “Too- many-to-fail” problem. The problem also arises because of a lack of alternative uses for the assets of failed banks: When a large number of institutions experience problems, it becomes progressively more difficult to find surviving banks that are able to acquire failed institutions.90
A second group of factors closely related to issues of systemic risk is that bank intervention may have macroeconomic spillover effects. In specific circumstances, these should be avoided in order to achieve ex-post optimality. Nonetheless, it is worth noting that the downturn usually associated with a weakening of banks’ balance sheets should not per se be regarded as a reason to abstain from a tough policy. However, two specific macroeconomic consequences have the potential to amplify problems in the banking sector in a way that justifies at least some cautiousness:
When the failure of one bank leads to falling asset values, a chain reaction can set in. If such a process results in a period of debt-deflation, the economy might be stuck in a situation in which neither policy nor the business cycles are able to engineer a recovery.
Large-scale banking problems can lead to a breakdown of statistical relationships between macroeconomic aggregates.91 Bank failures might therefore be followed by larger uncertainties concerning the right policy stance, misguided macroeconomic decision-making, and finally a further increase in instability.
A third group of factors is related to the specific functions of financial intermediaries. Due to their economic role and the informational environment they operate in, banks acquire certain characteristics that may lead to a necessarily lax policy. In particular, the denial of bank assistance or recapitalization combined with hard-bitten intervention rules can lead to:
- A loss of relationship capital, i.e. the sale or transfer of assets to agents with less specific collection abilities, and, as a result, diminishing asset values within the industrial sector.92
- Excessive toughness of banks vis-à-vis good borrowers, again resulting in excessive burdens for producers of non-financial products. This excessive toughness can either lead to premature liquidations of existing projects or reduction in credit availability for borrowers with intact relationships to weak banks.
- Frictions in the area of corporate restructuring, since the fear of regulatory control will induce banks not to disclose and liquidate weak borrower types. For example, one can show that in normal times, regulators may want to stress their toughness in bank closure, but in crisis times, it is socially optimal to be soft, because that is the only way to achieve truthful reporting and the liquidation of inefficient firms.93 It is important to note, however, that there is an opposing effect, as forbearance may also induce a bank to gamble for resurrection
90Acharya, and Yorulmazer (2007). 91Goodhart and Huang (1999). 92Diamond and Rajan, ( 200 0 , and Diamond and Raghuram Rajan ( 2001 ) . 93Aghion, Bolton and Fries (1999).
Financial Sector Taxation: The IMF’s Report to the G-20 and Background Material
89
jointly with weak borrowers.
The long list of potential reasons for a divergence between ex ante and ex post optimality in bank intervention illustrates how tough it will be to reduce the perverse incentives that result from ex post laxness of policies—time inconsistency. The problem is magnified, however, because forbearance can also be the result of a divergence between social, supervisory, and political objectives. For many reasons, there might be a wedge between the objectives of the supervisory bureaucracy or the political class on the one, and society on the other hand. In particular, the objective function of supervisors may miss (or include) arguments (not) present in the social welfare function:
- Political-economic factors, which include the desire to avoid the recognition of problems in a situation where to do so has large political costs, for example shortly in advance of an election. Besides such a deviation of political discount factors from social ones, policymakers’ incentives might be characterized by a bias towards certain interest groups or subgroups of the electorate, including the stakeholders of state-owned financial institutions.
- Career concerns and monetary incentives, i.e. the desire to be on familiar terms with the supervised industry, in particular to increase future employment opportunities or to receive side payments.
- Supervisory reputation, i.e. the desire to be considered a successful supervisor (by the public, the media, politicians, or the industry). Such motives can be considered a special case of career concerns.94 15
- Inconsistent or incomplete assignment of tasks. Safety net organizations might be characterized by a combination of objectives or tasks that cannot be aligned with an optimal intervention policy.
- Supervisory risk aversion related to lawsuits, i.e., the desire to avoid problems due to shareholders’ potential legal actions after an intervention. This problem has proven to be of prime importance in many recent crises.
The forbearance that results from these types of incentive problems typically leads to opportunistic behavior vis-à-vis the political sector or (in case politics seizes control of intervention functions) vis-à-vis certain interest groups. In short, it leads to regulatory capture.
4.3 Addressing Incentive Problems Implies Reducing Systemic Risk
4.3.1 Relevance
So what should be done to reduce the perverse incentives that arise in this context, and to make policies more time-consistent? A first set of policies would aim at reducing the ex post cost of intervention, in particular by reducing the amount of systemic consequences that 94The preconditions for and consequences of such preferences are exemplified in the contribution by Boot, and Thakor (1993).
Financial Sector Taxation: The IMF’s Report to the G-20 and Background Material
90
result in case of a failure. On the one hand, this can be done through making the infrastructure of financial markets more robust to the unwinding of large complex financial institutions, for example, through reducing the importance of Over-the-Counter derivatives for so called Centralized Clearing Counterparties (CCPs). Efforts in this direction are underway, and the decisive question will be whether the policies that push financial institutions onto these arrangements will be stringent enough.
But changing infrastructural arrangements will only be one element to reduce the ex post intervention cost. Also needed are policy tools to directly reduce the systemic relevance of individual institutions, so that the macroeconomic effects of strict intervention become less unpredictable and devastating. The larger and more interconnected and complex a financial institution is and the stronger its propagation effects are, the higher is the probability that it will be bailed out in case of financial distress. Hence, the higher the systemic relevance of a financial institution, the lower is the risk premium that an investor requires to put his money at stake. This is not least reflected in rating reports that explicitly distinguish between “stand alone” ratings and ratings taking into account implicit public guarantees. For the decision-maker of an individual financial institution, being systemically relevant thus comes with an important advantage. The return on equity can be increased by increasing the negative impact of one’s own failure on the rest of the system. The systemic risk that results from such behavior, however, is a negative externality.
There are two basic types of regulatory tools to deal with such externalities: those that regulate quantities and those that influence prices. Examples of quantity regulation include direct limits on size and type and of business model, while examples of price regulation are taxes and fees. The problem with direct quantitative restrictions is that they are likely to be inefficient. There are advantages of having certain types of activities carried out jointly, usually for economies of scale and scope. The technology of each firm determines the extent of these advantages and is usually private information of the respective firm. Consequently, cutting-off a certain activity from a financial institution could be beneficial in some cases, but counter-productive in others. Ideally, one would like to allow the bank to keep a certain systemic activity when economies of scope are pronounced, but take it away when the joint operation is just the reflex to perverse incentives to become large and complex. Similar problems occur with other quantity tools like living wills, but these carry the additional disadvantage that the institutions themselves keep too much sway with respect to the identification of critical breaking points
For these reasons, supervisors tend to favor price tools, mostly surcharges on the capital requirements of particularly systemic institutions, i.e. an extension of the current Basel accord. The main problem is that those capital requirements are already used for multiple purposes—they are supposed to act as a buffer against unexpected loss as well as limit risk taking. These two goals are not necessarily compatible. In addition, there are proposals to use capital requirements to control liquidity risks and attenuate pro-cyclicality. The result is a system with three to four goals and only one instrument. This will inevitably involve trade-offs, lead to a system of capital requirements that is highly complex; opaque and prone to manipulation; constant re- interpretation; and forbearance.
Another problem with using capital adequacy regulation to make systemic relevance costly is that it could lead to a further surge of the less regulated parts of the system, sometimes called the shadow banking system. The aim of such a levy is to internalize the negative externality of being too-important-to- fail. But in case of setting a systemic surcharge on capital requirements, capital remains on balance sheet, and the control over funds remain
Financial Sector Taxation: The IMF’s Report to the G-20 and Background Material
91
with the banks. Banks with plenty of capital on their books will try to lever it up through loopholes in the system. Not only do financial institutions have pronounced incentives to find loopholes in regulatory capital requirements to take a highly leveraged, one-way bet on the economy, they may also create loopholes by creating new financial innovations.
A final and related problem of systemic risk capital surcharges is that non-bank systemic financial institutions would be difficult to incorporate in such a regime. Prudential minimum capital requirements are and should be confined to certain institutions, not least because the presence of entities that operate without strict requirements can be beneficial for financial stability—regulatory constraints on minimum capital can lead to negative feedback loops, and financial institutions operating without them can act as buyers of last resort whenever capital restrictions cause fire sales. This does not imply, however, that some of these institutions pose systemic risks that should be internalized. Thus, a sensible approach should in principle enable the public to impose costs on non-banks, including insurance companies and hedge funds. Docking on to Basel II would make this nearly impossible.
4.4 Systemic Risk Levies and Cross-Border Resolution in Europe
Against this backdrop, we think it is better to take an alternative route. In particular, we argue that an effective way of enforcing the responsibility of financial institutions is to internalize the negative externalities by imposing a pan-European levy on systemic relevance. For institutions operating across borders, the levy would need to be determined and implemented by a European agency that takes into account international interconnectedness. Implemented optimally, the tax rate should be set at such a level as to eliminate the implicit funding cost advantage of systemic institutions. The main conceptual difference with systemic risk capital charges would be that the resulting levy would be taken off the balance sheet of an institution. This would allow policymakers to combine such an ex-ante collected systemic risk fee with a systemic risk fund, which would serve, at least, as a partially pre- funded (cross-border) resolution tool. The combination of fee and resolution fund would constitute an integrated framework which would allow the public to effectively discipline systemic institutions.
In the European context, such a European Stabilization Fund would also be the nucleus of a Pan-European resolution regime. A robust financial stability framework requires strong regulation and supervision and adequate deposit insurance arrangements. For the overall framework to be effective, these tools need to be complemented with dedicated resolution regimes to stabilize and control the systemic impact of a failing financial institution. Any sensible reform to reduce the systemic relevance of financial institutions has to tackle the problem of how to unwind them. Even if a fee on systemic relevance reduces the amount of systemic risk emitted, some institutions will find it optimal to pay the fee and remain an institution the failure of which would cause substantial damage to the rest of the system. Only effective resolution mechanisms can make the threat of intervening in these institutions credible.
To establish effective resolution regimes nationally and internationally, one needs two ingredients—a robust legal regime and arrangements for burden sharing, both between the public and the private sector and among different nation states. In our view, the British Banking Act 2009 provides a good starting point from which to reform national legal regimes. Under this framework, it is possible to take into account the special characteristics of systemically relevant financial institutions. Therefore, the likelihood that failing systemically important institutions will not be supported using public funds increases, thus
Financial Sector Taxation: The IMF’s Report to the G-20 and Background Material
92
enhancing the government’s credibility.
The British regime does not provide a clear mechanism for burden sharing. In addition, it is a purely national framework that does not address sufficiently the winding down cross-border institutions. In the European context, the problem of burden-sharing becomes particularly relevant, as national fiscal authorities insist, for both good and bad reasons, on remaining in control whenever public funds are involved. This is problematic, because a crucial characteristic of bank resolution is the freezing of pending operations due to internationally warranted creditor protection. The freezing of cash flows is supposed to guarantee the creditors a maximum of payout from insolvency. However, this simultaneously could cause financial distress in counterparty institutions and disperse the shock throughout the financial system. In our view, reserves are necessary to finance an institution during the resolution process while avoiding systemic shocks caused by regulatory action.
To facilitate burden-sharing, having a war chest for the resolution authority should be an essential element of a regulatory regime for financial institutions in Europe. While many emphasize the risk of moral hazard through the availability of funds, one should at least recognize that there is an opposing effect. By avoiding the hectic weekend negotiations between public and private rescuers from different countries that have characterized the recent crisis, one would increase the credibility of intervention.
4.5 Further Steps Necessary
By making it costly to become systemically relevant and by setting up a European Stabilization Fund, the EU would make a decisive step towards a more robust framework for financial regulation. However, the Fund and levy would have to be complemented with further measures. As outlined above, the reasons for time inconsistent policies are manifold. Systemic relevance is the single most important factor, but certainly not the only one. Other incentive problems have to be addressed by setting up an institutional architecture that puts responsibility in the hand of those that have a maximum degree of independence from the industry and national governments, that are willing to emphasize ex ante optimality in the sense of a tough stance on weak financial institutions and that internalize international spill-over effects as well as level- playing field considerations.
An important reform element is thus to find “institutional arrangements” to attenuate further the problems resulting from the specific nature of financial intermediaries and their close relationship with governments. In principle, there are two ways of doing this: (i.) Handing over responsibility to a particularly tough and independent body akin to a conservative central banker and (ii.) creating legal arrangements that force a more interventionist approach, in particular through prompt corrective action frameworks.
While the crisis has rightly convinced many governments that regulatory and supervisory responsibilities (rulemaking and monitoring) should be re-allocated to the strongest player available, which in many cases happens to be the central bank, the re-allocation of the responsibilities to supra-national bodies has stalled. Moreover, progress in the area of prompt corrective action has been limited or even non-existent. In our view, these are important gaps of current reform initiatives, in particular because there are good arguments to integrate resolution regimes with frameworks for prompt corrective action. Through such integration, the resolution regime receives early intervention options in addition to resolution instruments. Most importantly, such elements would establish clear triggers for bank intervention and resolution, thus contributing to the credibility of supervisors.
Financial Sector Taxation: The IMF’s Report to the G-20 and Background Material
93
In principle, the European Stabilization Fund envisioned above could form the nucleus for a European Resolution Authority. This arrangement would then have to be complemented with a Prompt-Corrective-Action regime that specifies under which conditions responsibility for an institution is handed over from the supervisor to the resolution authority. Overall, the joint implementation of a systemic risk levy, a European Stabilization Fund and a regime for early intervention would form the basis for a true re-allocation of supervisory powers to the level at which supervised entities themselves operate.
4.6 Conclusion
Summing up, the core element of a new European framework that takes systemic relevance and time inconsistency seriously should be a levy (or “tax”) the level of which (or “tax rate”) rises with the systemic relevance of an institution. The proceeds from the levy should be contributed into a European Stability Fund which is endowed with control rights, in particular early intervention and resolution powers; if the Fund reaches a certain threshold size, the continuing flow of contributions is distributed to the government(s). The Stability Fund would take care of institutions active in cross-border transactions; institutions that operate within the national borders would receive similar treatment through national arrangements that mirror the European one. All systemic institutions should be charged The Fund’s authority should also extend to insurance firms and other intermediaries that are too interconnected with the banking system to fail, able to cause fire sales, and maturity transformations.
Financial Sector Taxation: The IMF’s Report to the G-20 and Background Material
94
References
Acharya, A.P., Viral V, and Tanju Yorulmazer, “Too Many to Fail-An Analysis of Time- inconsistency in Bank C losure Policies,” Journal of Financial Intermediation, Vol. 16(1), pp. 1-31, January.
Alessandri, A P., and H. G. Haldane, 2009, “Banking on the State,” Bank of England, November.
Basel Committee for Banking Supervision, 2009, “Consultative proposals to strengthen the resilience of the banking sector announced by the Basel Committee” (December).
Boot, Arnoud W., and Anjan V. Thakor, 1993, “Self-Interested Bank Regulation,” American Economic Review, Vol, Vl. 83(2), pp. 206-12.
Diamond, Douglas, and Raghuram Rajan (2000) “A Theory of Bank Capital,” The Journal of Finance, Vol. 55 (6), pp. 2431-2465
Diamond, Douglas, and Raghuram Rajan (2001) “Liquidity Risk, Liquidity Creation, and Financial Fragility: A Theory of Banking,” Journal of Political Economy, No.109, pp. 287-327.
European Commission, 2009, “An EU Framework for Cross-Border Crisis Management in the Banking Sector,” COM 561 final, 2009.
Goodhart, Charles E., and H. Huang (1999) “A Model of the Lender of Last Resort”, IMF Working Papers 99/39, International Monetary Fund 1999, Washington D.C.
IMF, 2009, “The Need for Special Resolution Regimes for Financial Institutions - The Case of the European Union,” IMF Working Paper WP/09/200, International Monetary Fund.
Mayes, D., “Early Intervention and Prompt Corrective Action in Europe,” Research Discussion Papers Nr. 17/2009, Bank of Finland, 2009.
Mishkin, Frederic, 2006, “How Big a Problem is Too Big to Fail? A Review of Gary Stern and Ron Feldman's Too Big to Fail: The Hazards of Bank Bailouts,” Journal of Economic Literature, Vol. 44 (4), pp. 988-1004.
Rochet, Jean-Charles, “Why are there so Many Banking Crises?” CESifo Economic Studies Vol. 49, No. 2, pp. 141-56.

Financial Sector Taxation: The IMF’s Report to the G-20 and Background Material
95
Financial Sector Taxation: The IMF’s Report to the G-20 and Background Material
96
5. Quantitative Impact Of Taxing Or
Regulating Systemic Risk By Beatrice Weder di Mauro
Any assessment of the quantitative impact of a tax must start by distinguishing between tax revenue and tax incidence. The latter determines which group, will be the ultimate bearer of the tax burden. The tax incidence or tax burden does not depend on where the revenue is collected, but on the price elasticity of demand and supply on the different markets where the tax subject operates. For example, the burden of a tax on unsecured debt might fall on shareholders, debt holders, depositors, or on employees, borrowers and other customers of a bank, depending on which of the margins the bank is able to adjust. This, in turn, will depend on the competitive pressures the institute faces in the markets for equity, debt, deposits or loans and fees. Moreover, the relevant elasticities may depend on how widespread the adoption of the tax is. For example if debt is more mobile than equity and not all countries adopt, tax incidence could be largely on equity return. Or if adoption is very general the incidence might be larger on borrowing rates. Of course the same is true for quantitative regulations such as capital requirements. Sometimes there appears to be a tendency to argue that the burden of a FSC would fall entirely on profits while the burden of higher capital requirements would be passed on entirely to the borrowers, either through higher lending costs or through credit rationing. However, the determinants of the ultimate incidence are the same for both types of regulatory intervention: faced with higher costs the extent to which banks reduce the return on equity or increase the interest rates on loan will depend on the market structure and on the competitive position of the bank in this market. The problem is that the relevant elasticities are not readily observable and mostly not available for G20 countries banking systems. The aim of this note is to provide a range of possible impacts of a FSC using different calibrations and assumptions on the adjustment margins of a stylized bank. 5.1 A Stylized Lending Decision We use a stylized model of a lending decision based on Elliot 2009 and expanded in a paper of the German Council of Economic Experts (Doluca et.al 2010). We first assume that the bank can only adjust one margin: it can either pass on the full burden of the tax or regulation to borrowers or to shareholder. This allows us to determine the upper bounds of the effect
Financial Sector Taxation: The IMF’s Report to the G-20 and Background Material
97
of a FSC or leverage ratios on loan rates and on profits. Using the same basic assumptions we then compare these results with the effects of an increase in the leverage ratio. After establishing the higher bounds, we assume that – at least over time – financial institutions will use several adjustment margins and present an intermediate case where the burden is carried by more than one group. The framework is fairly simple. We study a lending decision in which the benefits of making the loan have to be at least equal to the cost of making the loan. In particular the following condition has to be satisfied:
(i+O)*(1-t)>=E*re+(D1*r1+D2*(r2+FSC)+C+A)*(1-t), where
i = effective interest rate on the loan,O = other offsetting benefits to the bank of making the loan,t = marginal corporate income tax rate for the bank,E = proportion of equity backing the loan,re= rate of return on the marginal equity,D1 = proportion of deposits funding the loan,r1 = effective marginal cost on D1, D2 = proportion of debt funding the loan,r2 = effective marginal cost of D2,FSC = Financial stability contribution,C= the credit spread A = administrative and other expenses related to the loan. The after tax benefits of the loan consist in i, the effective interest rate on the loan (including annualized effects of fees) and O any additional pecunary benefits that the bank can reap from making the loan. For instance, the relationship with a customer on the credit market can have a positive value, which exceeds the value of the loan if the bank is able to cross-sell its investment banking products. On the right hand side of the equation are all the costs of making the loan in particular, the cost of funds, any expected credit losses and administrative expenses. The cost of funding are composed of E the proportion of equity backing the loan, and re the return on equity and the proportion of debt funding the loan and the return on debt. Furthermore, following Doluca et. al 2010 we distinguish between two types of debt funding D1 deposits and D2 other debt. This is useful since the effective marginal interest rate on the two types of funding is different, introducing another possible adjustment margin on the liability side. The marginal cost of deposits is r1 and the marginal cost of debt is r2. ,The cost of deposit funding includes all cost incurred in collecting deposits, e.g. the deposit insurance premium and costs of running a branch network.
Financial Sector Taxation: The IMF’s Report to the G-20 and Background Material
98
FSC is the financial stability contribution which is be charged on D2. As in the interim report to the G20 the FSC is assumed to be tax deductible. We first calculate the effects of the levy on the interest rate of the loan using the following assumptions.
Assumptions
O = 1%t = 30%E = 4%re= 15%
D1 = 30%r1 = 2%D2 = 66%r2 = 5%C= 0,5%A = 1,5%
We assume that the proportion of equity backing the loan is 4%, the proportion of deposits funding the loan is 30 % and therefore 66% is debt funding. For r1 we use the assumption of Elliot and set the rate on deposits at 2% (though Elliot does not distinguish between r1
and r2) Debt funding r2 is assumed to be more expensive (5%) and the credit spread is assumed to be 0,5% . All other variables we use the calibration of Elliott (2009), which are meant to reflect a typical large U.S. commercial bank. Using these variables the effective interest rate that the bank would charge on the loan would be 6.26 percent. 5.2 Upper Bound Estimates We first assume that the entire burden is carried by the customers of the bank, in particular by the borrowers. It is worth reiterating that this is an extreme assumption since it presumes that the bank faces no competitive pressures from other banks or other financial intermediaries and can fully pass through additional cost to the credit margin.
5.2.1 Full Pass-through to Loan Rate Table 1 shows the result of this simulation for different rates of FSC. As noted above, without a FSC and given our assumptions the bank would charge an interest rate on the loan of 6.26 percent. Even with full pass-through, an FSC of 10 bp increases the loan rate by only 7 bp.
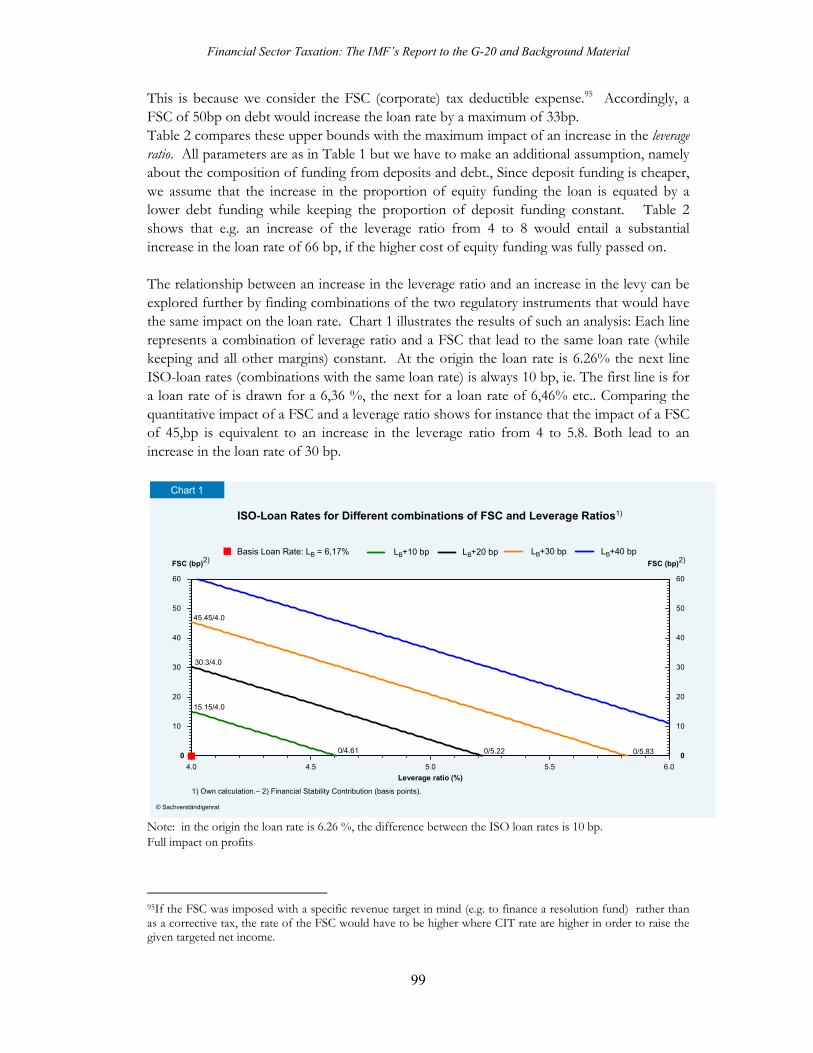
Financial Sector Taxation: The IMF’s Report to the G-20 and Background Material
99
This is because we consider the FSC (corporate) tax deductible expense.95 Accordingly, a FSC of 50bp on debt would increase the loan rate by a maximum of 33bp. Table 2 compares these upper bounds with the maximum impact of an increase in the leverage ratio. All parameters are as in Table 1 but we have to make an additional assumption, namely about the composition of funding from deposits and debt., Since deposit funding is cheaper, we assume that the increase in the proportion of equity funding the loan is equated by a lower debt funding while keeping the proportion of deposit funding constant. Table 2 shows that e.g. an increase of the leverage ratio from 4 to 8 would entail a substantial increase in the loan rate of 66 bp, if the higher cost of equity funding was fully passed on. The relationship between an increase in the leverage ratio and an increase in the levy can be explored further by finding combinations of the two regulatory instruments that would have the same impact on the loan rate. Chart 1 illustrates the results of such an analysis: Each line represents a combination of leverage ratio and a FSC that lead to the same loan rate (while keeping and all other margins) constant. At the origin the loan rate is 6.26% the next line ISO-loan rates (combinations with the same loan rate) is always 10 bp, ie. The first line is for a loan rate of is drawn for a 6,36 %, the next for a loan rate of 6,46% etc.. Comparing the quantitative impact of a FSC and a leverage ratio shows for instance that the impact of a FSC of 45,bp is equivalent to an increase in the leverage ratio from 4 to 5.8. Both lead to an increase in the loan rate of 30 bp.
Note: in the origin the loan rate is 6.26 %, the difference between the ISO loan rates is 10 bp. Full impact on profits
95If the FSC was imposed with a specific revenue target in mind (e.g. to finance a resolution fund) rather than as a corrective tax, the rate of the FSC would have to be higher where CIT rate are higher in order to raise the given targeted net income.
10
20
30
40
50
60
0
FSC (bp)2)
10
20
30
40
50
60
0
FSC (bp)2)
4.0 4.5 5.0 5.5 6.0
Leverage ratio (%)
1) Own calculation.– 2) Financial Stability Contribution (basis points).
© Sachverständigenrat
Chart 1
ISO-Loan Rates for Different combinations of FSC and Leverage Ratios1)
Basis Loan Rate: L = 6,17%B LB+10 bp LB+20 bp LB+30 bp LB+40 bp
15.15/4.0
30.3/4.0
45.45/4.0
0/4.61 0/5.22 0/5.83
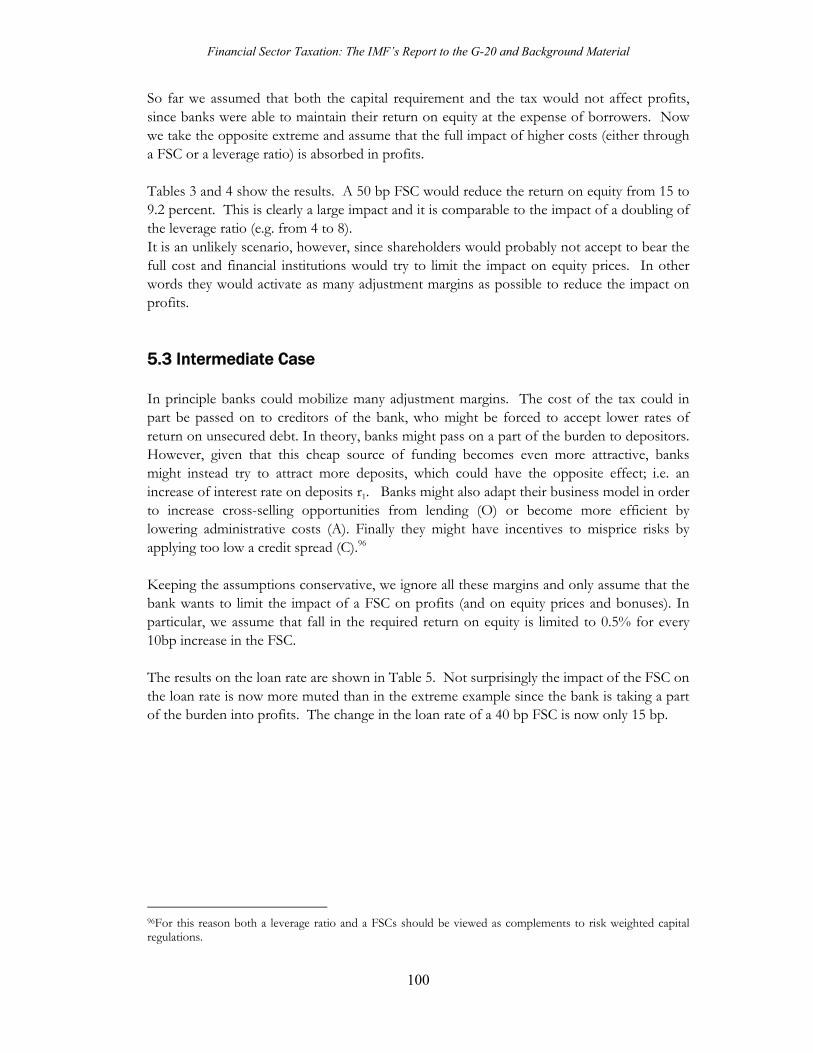
Financial Sector Taxation: The IMF’s Report to the G-20 and Background Material
100
So far we assumed that both the capital requirement and the tax would not affect profits, since banks were able to maintain their return on equity at the expense of borrowers. Now we take the opposite extreme and assume that the full impact of higher costs (either through a FSC or a leverage ratio) is absorbed in profits. Tables 3 and 4 show the results. A 50 bp FSC would reduce the return on equity from 15 to 9.2 percent. This is clearly a large impact and it is comparable to the impact of a doubling of the leverage ratio (e.g. from 4 to 8). It is an unlikely scenario, however, since shareholders would probably not accept to bear the full cost and financial institutions would try to limit the impact on equity prices. In other words they would activate as many adjustment margins as possible to reduce the impact on profits. 5.3 Intermediate Case In principle banks could mobilize many adjustment margins. The cost of the tax could in part be passed on to creditors of the bank, who might be forced to accept lower rates of return on unsecured debt. In theory, banks might pass on a part of the burden to depositors. However, given that this cheap source of funding becomes even more attractive, banks might instead try to attract more deposits, which could have the opposite effect; i.e. an increase of interest rate on deposits r1. Banks might also adapt their business model in order to increase cross-selling opportunities from lending (O) or become more efficient by lowering administrative costs (A). Finally they might have incentives to misprice risks by applying too low a credit spread (C).96 Keeping the assumptions conservative, we ignore all these margins and only assume that the bank wants to limit the impact of a FSC on profits (and on equity prices and bonuses). In particular, we assume that fall in the required return on equity is limited to 0.5% for every 10bp increase in the FSC. The results on the loan rate are shown in Table 5. Not surprisingly the impact of the FSC on the loan rate is now more muted than in the extreme example since the bank is taking a part of the burden into profits. The change in the loan rate of a 40 bp FSC is now only 15 bp.
96For this reason both a leverage ratio and a FSCs should be viewed as complements to risk weighted capital regulations.
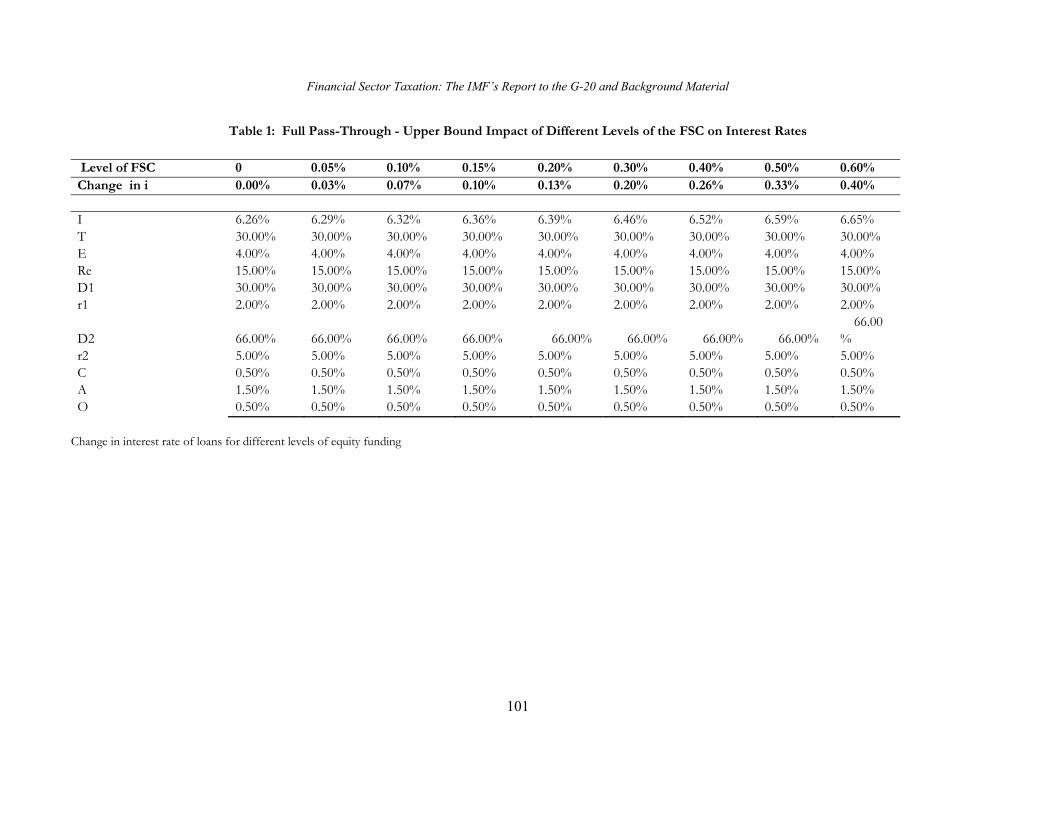
Financial Sector Taxation: The IMF’s Report to the G-20 and Background Material
101
Table 1: Full Pass-Through - Upper Bound Impact of Different Levels of the FSC on Interest Rates
Level of FSC 0 0.05% 0.10% 0.15% 0.20% 0.30% 0.40% 0.50% 0.60% Change in i 0.00% 0.03% 0.07% 0.10% 0.13% 0.20% 0.26% 0.33% 0.40%
I 6.26% 6.29% 6.32% 6.36% 6.39% 6.46% 6.52% 6.59% 6.65% T 30.00% 30.00% 30.00% 30.00% 30.00% 30.00% 30.00% 30.00% 30.00% E 4.00% 4.00% 4.00% 4.00% 4.00% 4.00% 4.00% 4.00% 4.00%Re 15.00% 15.00% 15.00% 15.00% 15.00% 15.00% 15.00% 15.00% 15.00% D1 30.00% 30.00% 30.00% 30.00% 30.00% 30.00% 30.00% 30.00% 30.00%r1 2.00% 2.00% 2.00% 2.00% 2.00% 2.00% 2.00% 2.00% 2.00%
D2 66.00% 66.00% 66.00% 66.00% 66.00% 66.00% 66.00% 66.00% 66.00
% r2 5.00% 5.00% 5.00% 5.00% 5.00% 5.00% 5.00% 5.00% 5.00% C 0.50% 0.50% 0.50% 0.50% 0.50% 0.50% 0.50% 0.50% 0.50%A 1.50% 1.50% 1.50% 1.50% 1.50% 1.50% 1.50% 1.50% 1.50% O 0.50% 0.50% 0.50% 0.50% 0.50% 0.50% 0.50% 0.50% 0.50%
Change in interest rate of loans for different levels of equity funding
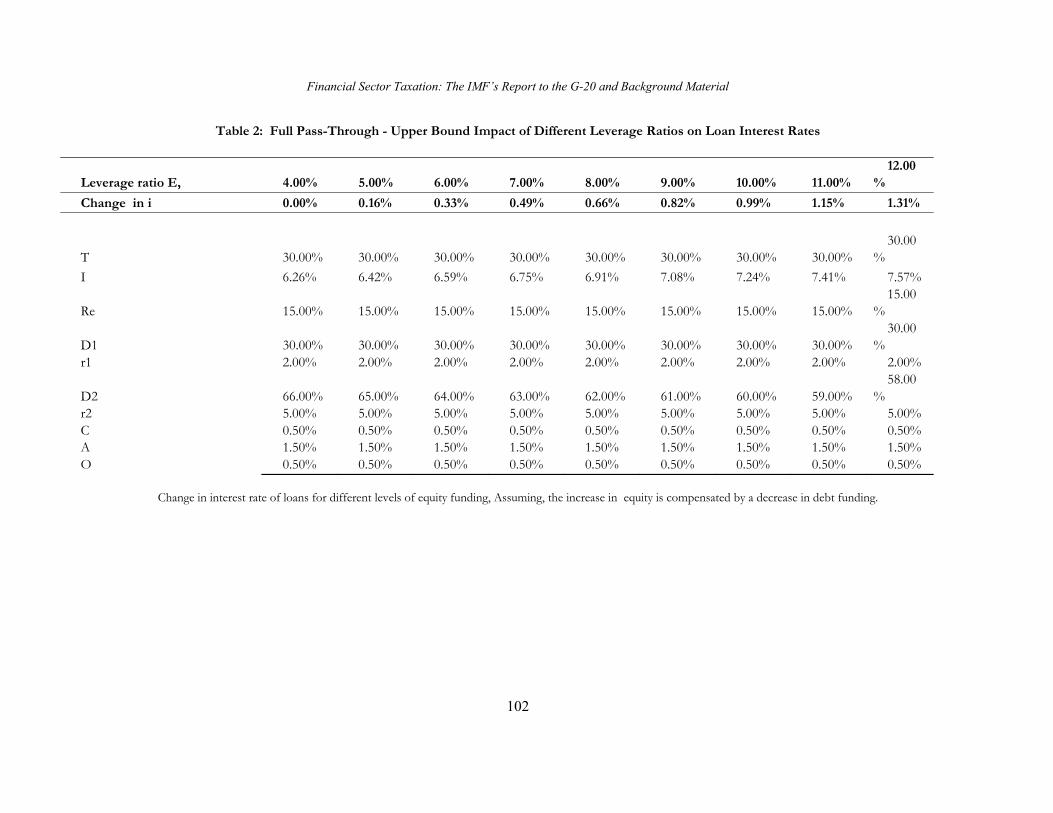
Financial Sector Taxation: The IMF’s Report to the G-20 and Background Material
102
Table 2: Full Pass-Through - Upper Bound Impact of Different Leverage Ratios on Loan Interest Rates
Leverage ratio E, 4.00% 5.00% 6.00% 7.00% 8.00% 9.00% 10.00% 11.00% 12.00
%
Change in i 0.00% 0.16% 0.33% 0.49% 0.66% 0.82% 0.99% 1.15% 1.31%
T 30.00% 30.00% 30.00% 30.00% 30.00% 30.00% 30.00% 30.00% 30.00
%
I 6.26% 6.42% 6.59% 6.75% 6.91% 7.08% 7.24% 7.41% 7.57%
Re 15.00% 15.00% 15.00% 15.00% 15.00% 15.00% 15.00% 15.00% 15.00
%
D1 30.00% 30.00% 30.00% 30.00% 30.00% 30.00% 30.00% 30.00% 30.00
% r1 2.00% 2.00% 2.00% 2.00% 2.00% 2.00% 2.00% 2.00% 2.00%
D2 66.00% 65.00% 64.00% 63.00% 62.00% 61.00% 60.00% 59.00% 58.00
% r2 5.00% 5.00% 5.00% 5.00% 5.00% 5.00% 5.00% 5.00% 5.00%C 0.50% 0.50% 0.50% 0.50% 0.50% 0.50% 0.50% 0.50% 0.50% A 1.50% 1.50% 1.50% 1.50% 1.50% 1.50% 1.50% 1.50% 1.50%O 0.50% 0.50% 0.50% 0.50% 0.50% 0.50% 0.50% 0.50% 0.50%
Change in interest rate of loans for different levels of equity funding, Assuming, the increase in equity is compensated by a decrease in debt funding.
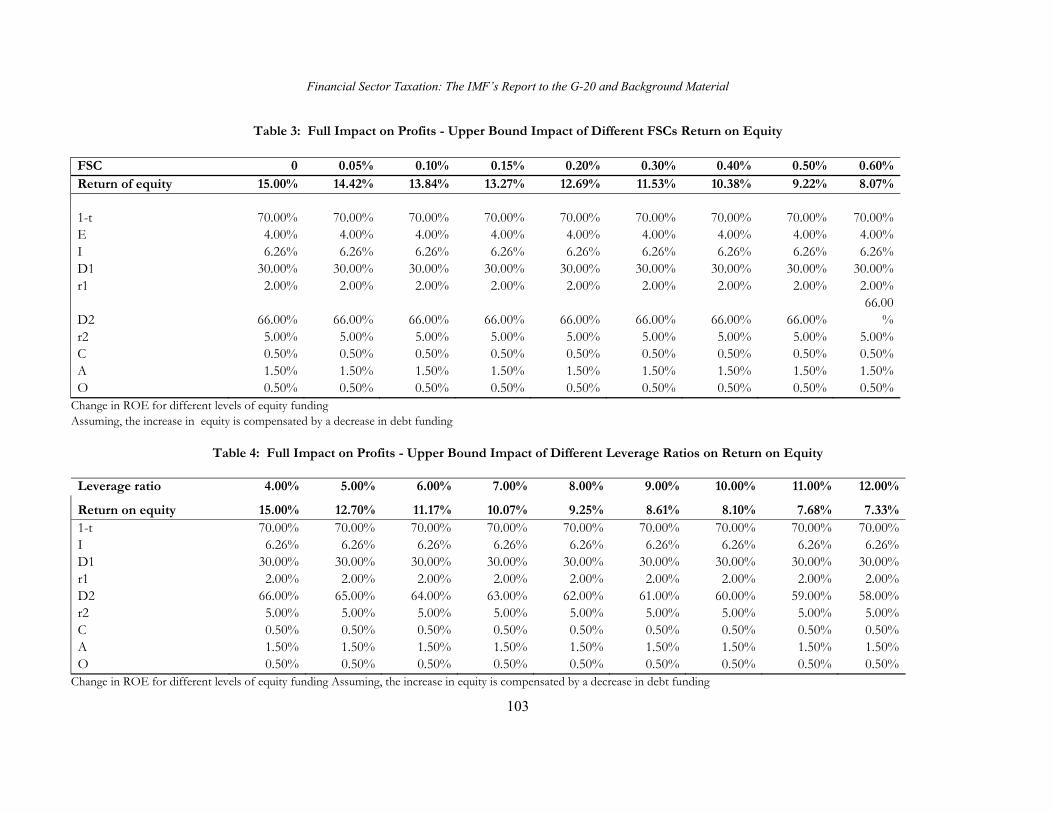
Financial Sector Taxation: The IMF’s Report to the G-20 and Background Material
103
Table 3: Full Impact on Profits - Upper Bound Impact of Different FSCs Return on Equity
FSC 0 0.05% 0.10% 0.15% 0.20% 0.30% 0.40% 0.50% 0.60%Return of equity 15.00% 14.42% 13.84% 13.27% 12.69% 11.53% 10.38% 9.22% 8.07%
1-t 70.00% 70.00% 70.00% 70.00% 70.00% 70.00% 70.00% 70.00% 70.00%E 4.00% 4.00% 4.00% 4.00% 4.00% 4.00% 4.00% 4.00% 4.00%I 6.26% 6.26% 6.26% 6.26% 6.26% 6.26% 6.26% 6.26% 6.26%D1 30.00% 30.00% 30.00% 30.00% 30.00% 30.00% 30.00% 30.00% 30.00%r1 2.00% 2.00% 2.00% 2.00% 2.00% 2.00% 2.00% 2.00% 2.00%
D2 66.00% 66.00% 66.00% 66.00% 66.00% 66.00% 66.00% 66.00%66.00
%r2 5.00% 5.00% 5.00% 5.00% 5.00% 5.00% 5.00% 5.00% 5.00%C 0.50% 0.50% 0.50% 0.50% 0.50% 0.50% 0.50% 0.50% 0.50%A 1.50% 1.50% 1.50% 1.50% 1.50% 1.50% 1.50% 1.50% 1.50%O 0.50% 0.50% 0.50% 0.50% 0.50% 0.50% 0.50% 0.50% 0.50%
Change in ROE for different levels of equity funding Assuming, the increase in equity is compensated by a decrease in debt funding
Table 4: Full Impact on Profits - Upper Bound Impact of Different Leverage Ratios on Return on Equity Leverage ratio 4.00% 5.00% 6.00% 7.00% 8.00% 9.00% 10.00% 11.00% 12.00%
Return on equity 15.00% 12.70% 11.17% 10.07% 9.25% 8.61% 8.10% 7.68% 7.33%1-t 70.00% 70.00% 70.00% 70.00% 70.00% 70.00% 70.00% 70.00% 70.00%I 6.26% 6.26% 6.26% 6.26% 6.26% 6.26% 6.26% 6.26% 6.26%D1 30.00% 30.00% 30.00% 30.00% 30.00% 30.00% 30.00% 30.00% 30.00%r1 2.00% 2.00% 2.00% 2.00% 2.00% 2.00% 2.00% 2.00% 2.00%D2 66.00% 65.00% 64.00% 63.00% 62.00% 61.00% 60.00% 59.00% 58.00%r2 5.00% 5.00% 5.00% 5.00% 5.00% 5.00% 5.00% 5.00% 5.00%C 0.50% 0.50% 0.50% 0.50% 0.50% 0.50% 0.50% 0.50% 0.50%A 1.50% 1.50% 1.50% 1.50% 1.50% 1.50% 1.50% 1.50% 1.50%O 0.50% 0.50% 0.50% 0.50% 0.50% 0.50% 0.50% 0.50% 0.50%
Change in ROE for different levels of equity funding Assuming, the increase in equity is compensated by a decrease in debt funding
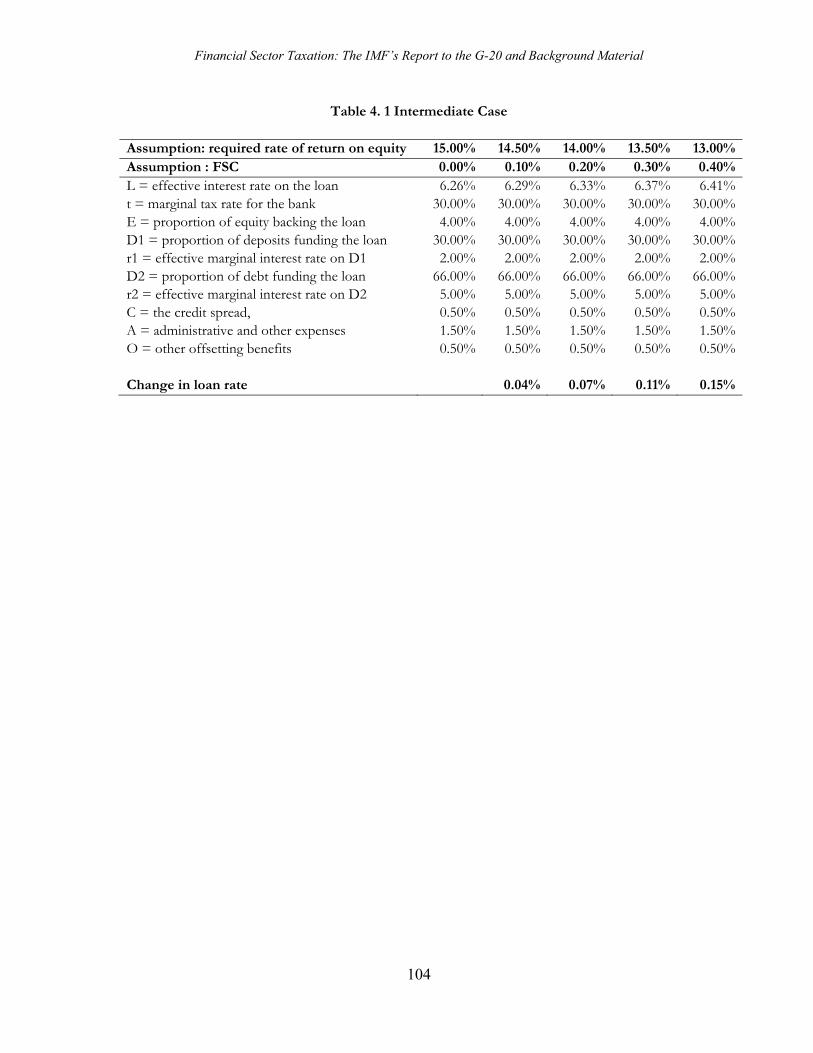
Financial Sector Taxation: The IMF’s Report to the G-20 and Background Material
104
Table 4. 1 Intermediate Case
Assumption: required rate of return on equity 15.00% 14.50% 14.00% 13.50% 13.00%Assumption : FSC 0.00% 0.10% 0.20% 0.30% 0.40%L = effective interest rate on the loan 6.26% 6.29% 6.33% 6.37% 6.41%t = marginal tax rate for the bank 30.00% 30.00% 30.00% 30.00% 30.00%E = proportion of equity backing the loan 4.00% 4.00% 4.00% 4.00% 4.00%D1 = proportion of deposits funding the loan 30.00% 30.00% 30.00% 30.00% 30.00%r1 = effective marginal interest rate on D1 2.00% 2.00% 2.00% 2.00% 2.00%D2 = proportion of debt funding the loan 66.00% 66.00% 66.00% 66.00% 66.00%r2 = effective marginal interest rate on D2 5.00% 5.00% 5.00% 5.00% 5.00%C = the credit spread, 0.50% 0.50% 0.50% 0.50% 0.50%A = administrative and other expenses 1.50% 1.50% 1.50% 1.50% 1.50%O = other offsetting benefits 0.50% 0.50% 0.50% 0.50% 0.50%
Change in loan rate 0.04% 0.07% 0.11% 0.15%
Financial Sector Taxation: The IMF’s Report to the G-20 and Background Material
105
References Doluca, Hasan, Ulrich Klueh, Marco Wagner, and Beatrice Weder di Mauro, 2010, “Reducing
Systemic Relevance: A Proposal,” Discussion Paper No. 4 of the German Council of Economic Experts.
Elliott, Douglas J., 2009, Quantifying the Effects on Lending of Increased Capital Requirements,
Pew Financial Reform Project, Briefing Paper No. 7.
Financial Sector Taxation: The IMF’s Report to the G-20 and Background Material
106
6. The Value of the Too-Big-to-Fail Subsidy to Financial Institutions
By Kenichi Ueda and Beatrice Weder di Mauro This paper aims at estimating the value of the Too-Big-To-Fail (TBTF) subsidy to financial firms. Claimants to TBTF financial institutions receive ex-post transfers from taxpayers when governments are forced into bail-outs. These transfers lower funding costs and subsidize excessive risk-taking on the part of TBTF institutions. They also distort competition with other financial institutions that do not enjoy the state implicit guarantee. In theory, a well-designed tax on financial institutions could undo these distortionary effects, and thereby reduce the probability and magnitude of financial crises. A precondition for designing such a corrective tax is to estimate the value of the TBTF subsidy. In this paper, we offer two different approaches to estimating of the value of this subsidy. One is based on exploiting the expectations of state support embedded in ratings and the second is based on event studies of the recent mayor changes in the TBTF regime. The results suggest that the subsidy to TBTF firms is in the range of 10-50 basis points. 6.1 Introduction In the wake of the financial crisis there has been an increasing interest in using corrective taxes on financial institutions to eliminate the distortions arising from bail outs.97 In theory, the goal of such a corrective tax would be to undo the distortion created by ex-post subsidies and thus it should be closely linked to the ex-ante private benefit, i.e. the value implied in the subsidy. The problem in designing such as tax is that there are very few studies of the value of this subsidy. This paper aims at providing such estimates. Too-big-to-fail (TBTF) institutions enjoy explicit and implicit subsidies, which create distortive incentives on various levels. First, large complex institution will enjoy lower funding costs and can seek riskier returns to generate a higher private value knowing that they will be protected in case of failure. This risk shifting behavior in turn may create more frequent bailouts and elevate systemic risks. This in turn increases the expected state support and creates perverse incentives to become systemically relevant by becoming larger and more complex. The result is that in a
97See e.g. the proposals for a financial stability charge of the IMF to the G20 (IMF 2010), the proposal of the German Council of Economic Experts ( Doluca, Klueh, Wagner an d Weder di Mauro 2010)
Financial Sector Taxation: The IMF’s Report to the G-20 and Background Material
107
crisis the costs of non-bail out increase to the point where the state is forced to provide the support and thus fulfill the initial expectation. Second, when indeed a bailout becomes necessary, an extra subsidy may be called for to restore the balance sheet problem of large banks. This would occur e.g. as the government needs to provide sweeteners for shareholders to induce them to vote to participate in the rescue plan (see Landier and Ueda, 2009). Finally, the implicit state guarantee has a further unintended consequence by changing the interaction within the financial sector. Namely, it distorts the competitive positions of TBTF financial institutions vs. institutions that do not enjoy this protection. Investors know that TBTF institutions are safer bets than other institutions with similar characteristics (e.g., profitability and indebtedness). This creates additional private benefits for TBTF banks, which can gain market share or profitability at the expense of the non protected institutions. In this paper we take two approaches to quantify reasonable ranges for a tax rate on TBTF institutions to correct distortions. In the first approach, we estimate the funding cost advantages of the protected banks using representative samples from G20 countries. In the second approach, we estimate the excess bailout benefits to TBTF institutions in crisis. Both can be viewed as a proxy of the incentives to become systemically relevant. By reducing such private benefits by a tax system, TBTF institutions would not seek excessively larger size. The measurement of the value of the TBTF subsidy is fraught with difficulties. First, the private benefits to banks eventually are allocated to depositors, debt holders, shareholders, pensioners, workers, and managers. Depending on the bailout scheme, how they are allocated may dramatically differ, especially for shareholders. In some schemes, shareholders would be wiped out while in other schemes shareholders also receive subsidies. Second, there is uncertainty about the extent of the state guarantee, in fact before the recent financial crisis regulators frequently tried to increase this uncertainty through “constructive ambiguity” about their willingness to provide support. Since investors usually not sure about the extent of state support and moreover willingness to provide support may vary over time, the expectation could also have changed over time. Thus, the value of the subsidy might have changed over time. Third the value of the subsidy may vary with the financial strength of the firm. A state guarantee is worth more for a firm with a very weak own financial strength than for strong firm. In our first approach, we use rating information to estimating the TBTF subsidy, which was in place even before the crisis. 98 Large complex financial institutions have enjoyed implicit state guarantees long before this last financial crisis. Some Rating agencies (Fitch and Moodys) provide regular quantitative estimates of the expected support that a particular financial institution would receive in case of crisis. The overall rating (and the funding cost) of financial institutions thus, depends on two factors: on their own financial strength and on the expected amount of support. For instance, in spite low own financial strength ratings and the German Landesbanken continued to enjoy very high overall ratings. This is because Moodys continued
98See Rime (2005) and Soussa (2000), for similar approaches also using rating agencies expectation of state support to financial institutions to back out the value of the subsidy. Other papers using rating include Sironi (2002) and Morgan and Stiroh (2005).
Financial Sector Taxation: The IMF’s Report to the G-20 and Background Material
108
expecting full state support - the explicit guarantee had been replaced with an implicit guarantee and Landesbanken continued enjoying this funding subsidy. Our second approach to estimate TBTF subsidy is to compare the funding costs before and after major events during the financial crisis that materially affected the expectation of bail-out., both in the US and in Europe. Arguably the massive state intervention to safe the financial system following the disorderly insolvency of Lehrman Brothers represents the largest natural experiment and shift in the TBTF regime. We exploit a number of bail-out announcements to study their incremental effect on the value of the subsidy both to shareholders and to debt holders. A somewhat related paper is by Baker and McArthur (2009), who find that the value of the subsidy are in the range from of 9 bp for the low of 49 bp for the high estimate. They use the difference in funding costs of small and large US banks before and after the in the change in the TBTF policy which was established with TARP. However, their study does not control for other factors that may affect the funding differences, such as differences in bank’s financial strength. This could be problematic, since large banks may have hurt more from the sharp fall of values of complex financial instruments (i.e., the competitive distortion might have been wider). Moreover, Baker and McArthur use only quarterly averages of funding rates. Therefore their estimate is likely to be contaminated by other policies and factors affecting investment decisions during the period. Therefore we will use an event study below, which takes account of these issues.99 Most existing studies consider only benefits to debt holders. They do not include possible benefits that may go to shareholders or employees. Thus, they may be underestimating the total value of the subsidy. Also, they often cover only as small set of countries and do not include the present crisis. Therefore we provide own estimates. We use two approaches to estimate the value of the subsidy: a ratings study and an event study. 6.2 Rating Study To study the value of state support embedded in ratings we use large bank ratings by FITCH from G20 countries as well as Spain and Switzerland to study current events. Namely, the ten largest banks (in terms of market capitalization or assets) are selected for each country. We study two points in time, end 2007 and end 2009. The endogenous variable is the overall ratings (Ratings), which is explained by the ratings for individual bank’s financial strength (FSR) and the expected support rating (Support). The FSR is stand alone rating, i.e. the one the financial institution would have if it was not supported by anybody. Support can be forthcoming either from the parent companies or from the
99Veronesi and Zingales (2009) also conducted an event study on Paulson Plan (10/13/2009). They calculate benefits to banks and costs to taxpayers and find both large. However, they do not calculate the benefits to economy as a whole.
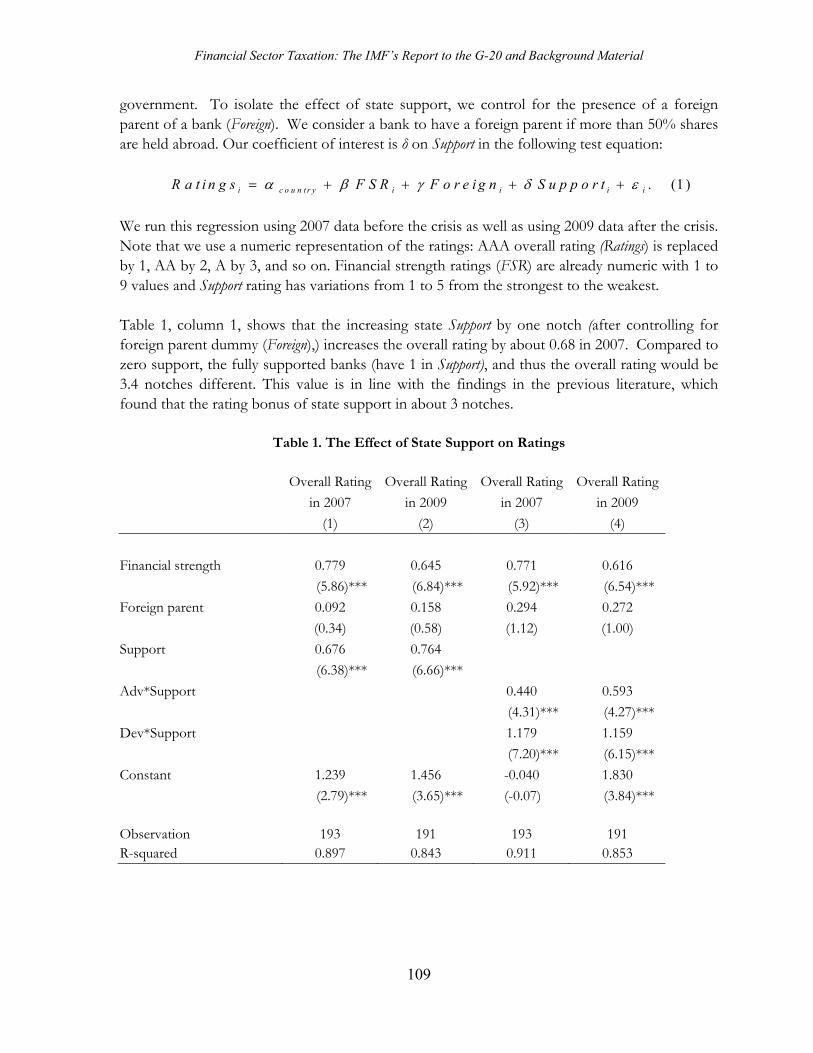
Financial Sector Taxation: The IMF’s Report to the G-20 and Background Material
109
government. To isolate the effect of state support, we control for the presence of a foreign parent of a bank (Foreign). We consider a bank to have a foreign parent if more than 50% shares are held abroad. Our coefficient of interest is δ on Support in the following test equation:
. (1 )i c o u n t r y i i i iR a t i n g s F S R F o r e i g n S u p p o r t
We run this regression using 2007 data before the crisis as well as using 2009 data after the crisis. Note that we use a numeric representation of the ratings: AAA overall rating (Ratings) is replaced by 1, AA by 2, A by 3, and so on. Financial strength ratings (FSR) are already numeric with 1 to 9 values and Support rating has variations from 1 to 5 from the strongest to the weakest. Table 1, column 1, shows that the increasing state Support by one notch (after controlling for foreign parent dummy (Foreign),) increases the overall rating by about 0.68 in 2007. Compared to zero support, the fully supported banks (have 1 in Support), and thus the overall rating would be 3.4 notches different. This value is in line with the findings in the previous literature, which found that the rating bonus of state support in about 3 notches.
Table 1. The Effect of State Support on Ratings Overall Rating Overall Rating Overall Rating Overall Rating
in 2007 in 2009 in 2007 in 2009
(1) (2) (3) (4)
Financial strength 0.779 0.645 0.771 0.616
(5.86)*** (6.84)*** (5.92)*** (6.54)***
Foreign parent 0.092 0.158 0.294 0.272
(0.34) (0.58) (1.12) (1.00)
Support 0.676 0.764
(6.38)*** (6.66)***
Adv*Support 0.440 0.593
(4.31)*** (4.27)***
Dev*Support 1.179 1.159
(7.20)*** (6.15)***
Constant 1.239 1.456 -0.040 1.830
(2.79)*** (3.65)*** (-0.07) (3.84)*** Observation 193 191 193 191 R-squared 0.897 0.843 0.911 0.853
Financial Sector Taxation: The IMF’s Report to the G-20 and Background Material
110
Column 2 shows that the value of the benefit difference increased slightly in 2009. Foreign parent support, on the other hand, is not significant in either year. Individual financial strength matters too; more than the state support in 2007 but less than the state support in 2009. The result shows that even before the crisis expectation for the benefits from state support was high. However, this result may be a result of including developing countries where the government is relatively more powerful. Thus, we estimate the effect of state support for advanced and development economy separately as
. (2)_ _i country i i A i D iRatings FSR Foreign Adv Support Dev Support In Table 1, column 3 and 4 show the results of this specification for 2007 and 2009, respectively. As expected, expectations for the state support for banks have less effect on the overall rating in the advanced countries. While going from zero to full support translates into 5.8 notches difference in the overall ratings in the developing countries in 2007, it is 2.2 for the advanced countries. However, it increased to 3.0 notch impact in 2009 in the advanced countries, while there is no change for the developing countries. The crisis and the policy response in the advanced countries have increased investors’ benefits in the advanced countries. This 3-notch impact in advanced countries is comparable to the study by Soussa (2000) and Rimes (2005). Using the probabilities of default associated with a three notch rating increase, Soussa (2000) then translates this into a funding advantage for different maturities of debt issuance. When issuing debt of a five-year finds that state support translate into a funding of 5-8bp for A rated banks, of 23 bp for a BBB rated bank, 61 bp for a BB rated bank and 128 bp for a B rated bank. Thus, the value of the subsidy ranges from 5 bp to 128 bp depending on the riskiness of the institution. On average value of the subsidy is 65 bp. However, the required tax rate to correct this funding distortion may be smaller. The reason is that the competitive distortion may magnify the funding gap between TBTF firms and other. TBTF firms’ have lower costs, which the can use to gain market share and profitability. As a result, funding costs of other financial firms may increase. Therefore the effect of the subsidy can be magnified in the funding cost differentials. This in turn implies that tax to eliminate the estimated funding cost advantage is smaller than the private benefit to the TBTF firms. 6.3 Event Study Before the recent financial crisis, regulators in many countries tried to create uncertainty about the extent of state guarantees though a policy of “constructive ambiguity”. Therefore, the expectations about the burden sharing between tax payers, debt holder and equity holders may have varied. The financial crisis leads to a series of event that radically changed these expectations. For instance, the declaration of the EU summit in October 2009 that no systemically relevant institution would be allowed to fail marks a drastic changing in the TBTF
Financial Sector Taxation: The IMF’s Report to the G-20 and Background Material
111
policy across a large number of countries and by turning an implicit into an explicit state guarantee. The various events during this crisis provide something akin to a natural experiment, which we use below to calculate the change in the subsidy to both share and debt holders. We use financial data of large financial and nonfinancial corporations to study the specific events. For U.S. firms, the events are the bailout of Bear Sterns on Saturday, March 15, 2008, the bankruptcy of the Lehman Brothers on Sunday, September 14, 2009, and the introduction of TARP between September 19 and October 3, 2009. For European firms, the events are the nationalization of IKB on Monday, July 30, 2007, the nationalization of Northern Rock on Sunday, February 17, 2008, and the EU summit declaration on Sunday, October 12, 2009. For each event, we look at the CDS market and the stock market. As CDSs are not well traded for small banks, we use 25 large companies in Dow Jones index in the US and some 50 large companies in Europe (in terms of the market capitalization as of end-2007) as a comparator to the large financial firms (45 in U.S. and 57 in Europe). We use the daily abnormal return of the small window that shows significant result, for example, between Friday and Monday when the events happened in the weekend. For the events that happened during weekdays, especially the TARP, we also checked whether the announcements were made before the closing time of the stock exchange (i.e., NYSE for the US, LSE for the Europe). Abnormal returns are defined as the extra returns relative to the average return between 2 weeks ago and 4 weeks ago from each event (in the earliest event for the TARP case).
( 3 ),i c c i c i iC D S F in a n c ia l s D u m m y Z
and
(4).i s s i s i iS tockreturn F inancia lsdum m y Z
Here, the control variables, Z, include profitability (return on asset), indebtedness (debt-to-asset ratio), liquidity position (interest coverage ratio), valuation (PER), and default risk (distance-to-default based on the Black-Scholes-Merton formula) based on the end-2007 data. Table 2 shows that regression results associated with the smallest window that shows the statistically significant results. In case of TARP, there is no significance result. This is probably due to the fact that the details of TARP was not available when announced and that the approval was politically uncertain for a prolonged period. Other events provide us at least one significant window either in the CDS market or in the stock market, or both. Bear Stearns bailout did not help the creditor of other banks to feel safer and thus there is no significant effects—for firms with high default probability creditors indeed felt safer but this effect appeared to be present also for nonfinancial firms. However, the shareholder was stunned to see Bear Stearns’ shareholder values were wiped out. Thus, this event destroyed overall value for financial companies. Lehman Brothers’ case was opposite. The sudden collapse created no
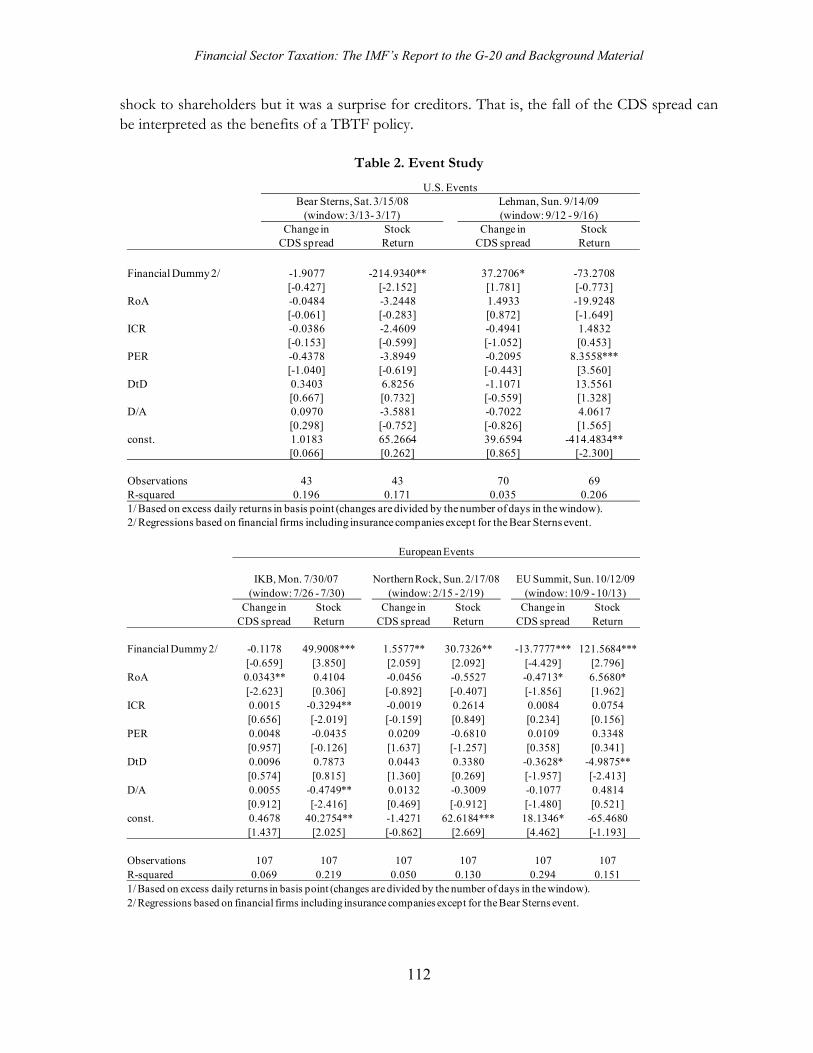
Financial Sector Taxation: The IMF’s Report to the G-20 and Background Material
112
shock to shareholders but it was a surprise for creditors. That is, the fall of the CDS spread can be interpreted as the benefits of a TBTF policy.
Table 2. Event Study
U.S. EventsBear Sterns, Sat. 3/15/08 Lehman, Sun. 9/14/09
(window: 3/13- 3/17) (window: 9/12 - 9/16)Change in Stock Change in Stock
CDS spread Return CDS spread Return
Financial Dummy 2/ -1.9077 -214.9340** 37.2706* -73.2708[-0.427] [-2.152] [1.781] [-0.773]
RoA -0.0484 -3.2448 1.4933 -19.9248[-0.061] [-0.283] [0.872] [-1.649]
ICR -0.0386 -2.4609 -0.4941 1.4832[-0.153] [-0.599] [-1.052] [0.453]
PER -0.4378 -3.8949 -0.2095 8.3558***[-1.040] [-0.619] [-0.443] [3.560]
DtD 0.3403 6.8256 -1.1071 13.5561[0.667] [0.732] [-0.559] [1.328]
D/A 0.0970 -3.5881 -0.7022 4.0617[0.298] [-0.752] [-0.826] [1.565]
const. 1.0183 65.2664 39.6594 -414.4834**[0.066] [0.262] [0.865] [-2.300]
Observations 43 43 70 69R-squared 0.196 0.171 0.035 0.2061/ Based on excess daily returns in basis point (changes are divided by the number of days in the window).2/ Regressions based on financial firms including insurance companies except for the Bear Sterns event.
European Events
IKB, Mon. 7/30/07 Northern Rock, Sun. 2/17/08 EU Summit, Sun. 10/12/09(window: 7/26 - 7/30) (window: 2/15 - 2/19) (window: 10/9 - 10/13)
Change in Stock Change in Stock Change in Stock CDS spread Return CDS spread Return CDS spread Return
Financial Dummy 2/ -0.1178 49.9008*** 1.5577** 30.7326** -13.7777*** 121.5684***[-0.659] [3.850] [2.059] [2.092] [-4.429] [2.796]
RoA 0.0343** 0.4104 -0.0456 -0.5527 -0.4713* 6.5680*[-2.623] [0.306] [-0.892] [-0.407] [-1.856] [1.962]
ICR 0.0015 -0.3294** -0.0019 0.2614 0.0084 0.0754[0.656] [-2.019] [-0.159] [0.849] [0.234] [0.156]
PER 0.0048 -0.0435 0.0209 -0.6810 0.0109 0.3348[0.957] [-0.126] [1.637] [-1.257] [0.358] [0.341]
DtD 0.0096 0.7873 0.0443 0.3380 -0.3628* -4.9875**[0.574] [0.815] [1.360] [0.269] [-1.957] [-2.413]
D/A 0.0055 -0.4749** 0.0132 -0.3009 -0.1077 0.4814[0.912] [-2.416] [0.469] [-0.912] [-1.480] [0.521]
const. 0.4678 40.2754** -1.4271 62.6184*** 18.1346* -65.4680[1.437] [2.025] [-0.862] [2.669] [4.462] [-1.193]
Observations 107 107 107 107 107 107R-squared 0.069 0.219 0.050 0.130 0.294 0.1511/ Based on excess daily returns in basis point (changes are divided by the number of days in the window).2/ Regressions based on financial firms including insurance companies except for the Bear Sterns event.
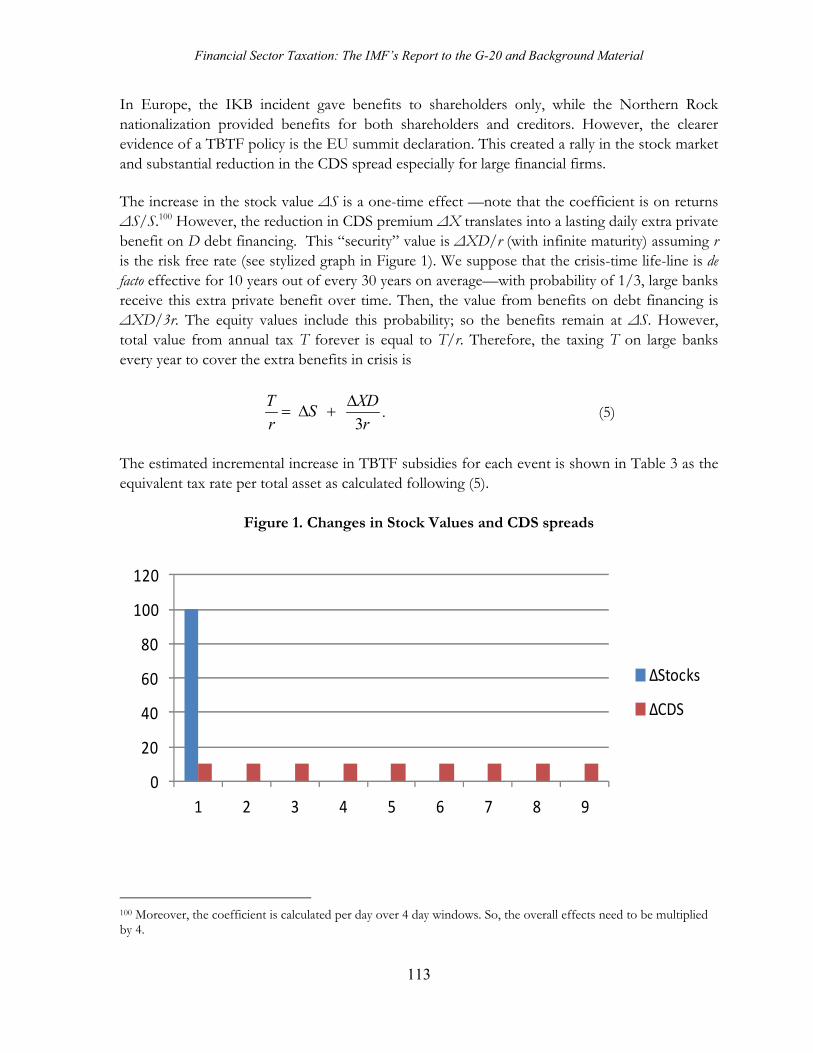
Financial Sector Taxation: The IMF’s Report to the G-20 and Background Material
113
In Europe, the IKB incident gave benefits to shareholders only, while the Northern Rock nationalization provided benefits for both shareholders and creditors. However, the clearer evidence of a TBTF policy is the EU summit declaration. This created a rally in the stock market and substantial reduction in the CDS spread especially for large financial firms. The increase in the stock value ΔS is a one-time effect —note that the coefficient is on returns ΔS/S.100 However, the reduction in CDS premium ΔX translates into a lasting daily extra private benefit on D debt financing. This “security” value is ΔXD/r (with infinite maturity) assuming r is the risk free rate (see stylized graph in Figure 1). We suppose that the crisis-time life-line is de facto effective for 10 years out of every 30 years on average—with probability of 1/3, large banks receive this extra private benefit over time. Then, the value from benefits on debt financing is ΔXD/3r. The equity values include this probability; so the benefits remain at ΔS. However, total value from annual tax T forever is equal to T/r. Therefore, the taxing T on large banks every year to cover the extra benefits in crisis is
3
T XDS
r r
. (5)
The estimated incremental increase in TBTF subsidies for each event is shown in Table 3 as the equivalent tax rate per total asset as calculated following (5).
Figure 1. Changes in Stock Values and CDS spreads
100 Moreover, the coefficient is calculated per day over 4 day windows. So, the overall effects need to be multiplied by 4.
0
20
40
60
80
100
120
1 2 3 4 5 6 7 8 9
ΔStocks
ΔCDS
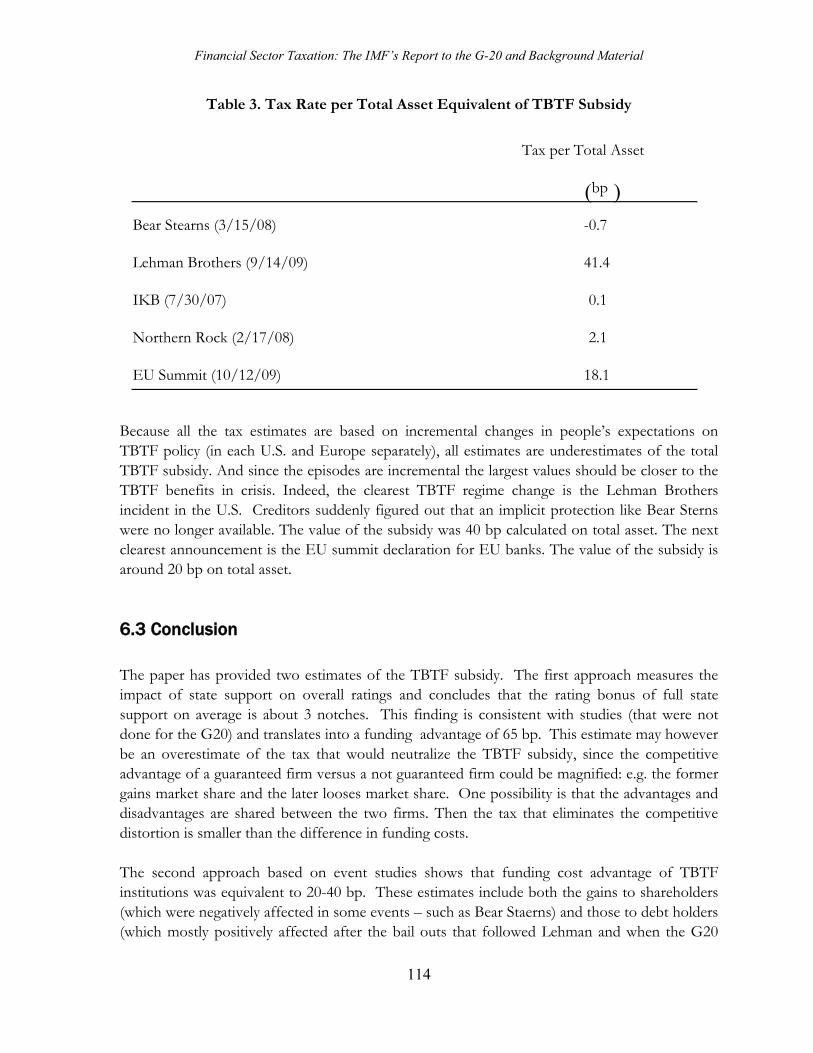
Financial Sector Taxation: The IMF’s Report to the G-20 and Background Material
114
Table 3. Tax Rate per Total Asset Equivalent of TBTF Subsidy
Because all the tax estimates are based on incremental changes in people’s expectations on TBTF policy (in each U.S. and Europe separately), all estimates are underestimates of the total TBTF subsidy. And since the episodes are incremental the largest values should be closer to the TBTF benefits in crisis. Indeed, the clearest TBTF regime change is the Lehman Brothers incident in the U.S. Creditors suddenly figured out that an implicit protection like Bear Sterns were no longer available. The value of the subsidy was 40 bp calculated on total asset. The next clearest announcement is the EU summit declaration for EU banks. The value of the subsidy is around 20 bp on total asset. 6.3 Conclusion The paper has provided two estimates of the TBTF subsidy. The first approach measures the impact of state support on overall ratings and concludes that the rating bonus of full state support on average is about 3 notches. This finding is consistent with studies (that were not done for the G20) and translates into a funding advantage of 65 bp. This estimate may however be an overestimate of the tax that would neutralize the TBTF subsidy, since the competitive advantage of a guaranteed firm versus a not guaranteed firm could be magnified: e.g. the former gains market share and the later looses market share. One possibility is that the advantages and disadvantages are shared between the two firms. Then the tax that eliminates the competitive distortion is smaller than the difference in funding costs. The second approach based on event studies shows that funding cost advantage of TBTF institutions was equivalent to 20-40 bp. These estimates include both the gains to shareholders (which were negatively affected in some events – such as Bear Staerns) and those to debt holders (which mostly positively affected after the bail outs that followed Lehman and when the G20
Tax per Total Asset
( bp )
Bear Stearns (3/15/08) -0.7
Lehman Brothers (9/14/09) 41.4
IKB (7/30/07) 0.1
Northern Rock (2/17/08) 2.1
EU Summit (10/12/09) 18.1

Financial Sector Taxation: The IMF’s Report to the G-20 and Background Material
115
declared a full guarantee). However they may be an underestimate of the total value of the guarantee, since they do not take into account that a positive value of the implicit guarantee was already priced in before the crisis. Overall our findings suggest that a corrective tax rate which extracts the TBRF subsidy should set initially in the range of 10-50 bp.
Financial Sector Taxation: The IMF’s Report to the G-20 and Background Material
116
References Baker, Dean, and Travis McArthur, 2009, “The Value of the ‘Too Big to Fail’ Big Bank
Subsidy,” Issue Brief, September, Center for Economic and Policy Research (Washington).
Doluca, Hasan, Ulrich Klueh, Marco Wagner, and Beatrice Weder di Mauro, 2010, “Reducing
Systemic Relevantce: A Proposal,” Discussion paper No 4 of the German Council of Economic Experts,
International Monetary Fund, 2010, “A fair and substantial contribution by the financial sector,”
Interim Report for the G-20, March. Landier, Augustin, and Kenichi Ueda, 2009, “The Economics of Bank Restructuring:
Understanding the Options,” IMF Staff Position Note, SPN/09/12, International Monetary Fund (Washington).
Morgan, Donald, and Kevin Stiroh, 2005, “Too Big to Fail after All These Years,” Federal
Reserve Bank of New York Staff Report No 220. Rime, Bertrand, 2005, “Do ‘Too Big to Fail’ Expectations Boost Large Banks Issuer Ratings?”
Manuscript, Swiss National Bank. Soussa, Farouk, 2000, “Too Big to Fail: Moral Hazard and Unfair Competition?” Chapter 1 in
collective volume, Financial Stability and Central Banks: Selected Issues for financial Safety Nets and Market Discipline, Bank of England (London).
Veronesi, Pietro, and Luigi Zingales, 2009, “Paulson’s Gift,” manuscript, University of Chicago.

Financial Sector Taxation: The IMF’s Report to the G-20 and Background Material
117
Financial Sector Taxation: The IMF’s Report to the G-20 and Background Material
118
7. The Financial Activities Tax
By Michael Keen, Russell Krelove, and John Norregaard
This paper discusses the rationale, design, and potential revenue yield of alternative forms of the Financial Activities Tax (FAT) proposed in the G-20 report (Chapter 1).
7.1 Introduction By a FAT is simply meant a tax on the sum of profits and remuneration in the financial sector. Precisely how profits and remuneration are defined for this purpose, however, makes a substantial difference to both the economic impact of a FAT and its revenue yield. The FAT is thus a family of possible taxes, not a single tax in itself, with each member better addressed to serving some purposes rather than others. Three central members of this family, directed to different objectives, are considered in this paper. The aim is not to arrive at firm recommendations, nor to provide a detailed assessment of their likely impact on behavior. Rather the purpose is to identify issues that arise in their design, and possible solutions, and to give a broad sense of the revenue they might yield.
Section II considers the design of a FAT intended to alleviate long-standing imperfections in the tax treatment of the financial sector under the VAT and other current sales taxes; this is referred to as ‘FAT1’. Section III considers the design of FATs aimed to tax either all economic rents—payments in excess of the minimum required return to production factors—generated in the financial sector (FAT2) or only those in excess of some still higher rate of return (FAT3). Section IV provides some rough indication of the revenue potential of these FATs. 7.2 The FAT as A Tax on Financial Services The rationale for the commonplace exemption of financial services under the standard invoice-credit form of VAT101 is the practical difficulty of taxing them fully under such a system. This
101While exemptions of financial services are widespread in the EU, more recently-introduced VATs have brought more financial services, especially fee-based services and insurance, into the VAT net. New Zealand and South Africa have gone especially far along this road. For further information, see Poddar (2007).
Financial Sector Taxation: The IMF’s Report to the G-20 and Background Material
119
arises from the nature of value added in many types of financial activities.102 For financial services provided on a fee-paying basis, VAT can be charged in the usual way. The difficulty arises for services charged for in the margin on intermediation services (called here ‘margin-based transactions,’ MBT). Even though the aggregate valued-added created by intermediation can be identified—this is just the margin itself—proper operation of the VAT requires some way of allocating the tax on that margin between the two sides of the transaction so as to ensure that registered businesses receive a credit but final consumers do not.103 This could be done in principle by allocating the margin relative to some benchmark ‘pure’ interest rate, (or ‘pure’ exchange rate in the case of forex transactions) but difficulties in selecting such a rate—and the potential administrative and compliance costs involved—are such that this has been generally regarded as impracticable. A common response to these difficulties has been to exempt such services (meaning that no tax is chargeable on sales, but associated input tax is not recovered), which ensures that at least some revenue is raised from their provision.104
Exemption of MBT means that business use of financial services tends to be overtaxed.105 This is because the prices charged by financial institutions will likely reflect the unrecovered VAT charged on their inputs, so that business users will pay more than they would have in the absence of the VAT. Normally, the credit mechanism of the VAT ensures that prices paid by registered businesses on their purchases are not affected by the VAT; exemption means that this is not so either for financial institutions themselves or their customers (and, through further pass-throughs, the customers of their customers...). This effect—‘cascading’ of the tax—runs counter to the principle, underlying the VAT, that transactions between businesses should not be taxed unless doing so addresses some clear market failure.106 The distortion of production decisions consequent upon exemption is felt, for example, through the tax incentive for financial institutions to self-supply services (such as for security) rather than purchase externally (and so incur unrecovered VAT), in too little use of domestic financial services by business users, and a tendency to purchase financial services abroad (since services provided to a non-resident are commonly in effect zero-rated). For final consumers, on the other hand, exemption likely means
102The conceptual question of whether the consumption of financial services should be taxed at all is not addressed here: see Auerbach and Gordon (2002) and Boadway and Keen (2003). Here it is simply assumed—as a reasonable benchmark—that ‘ideal’ policy would comprise a uniform rate of tax on final consumption of all commodities, including financial services. 103See Schenk and Zee (2001). 104Bradford (1996) argues that an income tax has at least as much difficulty in taxing MBTs as does potential alternative consumption tax systems, for example a VAT. However, the problems manifest themselves at different places—at company rather than household level. 105In this and similar statements below, the comparison, recall, is with uniform taxation of all goods and services. 106This is the Diamond-Mirrlees (1971) theorem on production efficiency, which, strictly, requires other conditions to be satisfied, including an absence of restrictions on the distorting taxes that can be deployed, an ability to tax any pure profits directly, and perfect competition. While these are unlikely to be met in practice, their implications for tax design are so context-specific as to make production efficiency a useful benchmark for tax design.
Financial Sector Taxation: The IMF’s Report to the G-20 and Background Material
120
under-taxation, since the price they pay does not reflect the full value added by financial service providers, but only their use of taxable inputs.107
These differing impacts on business and final users make the theoretical impact on revenue and the extent of financial activity ambiguous.108 Such empirical evidence as there is, however, suggests that revenue would be increased by taxing (only) final use of financial services at the standard rate (Huizinga, 2002; and Genser and Winkler, 1997).109 The effect on the size of the sector depends on relative price sensitivities of business and final use: for example, if the elasticity of demand for MBT of business users is high and that of final consumer demand is low, then the exemption could in principle cause the financial sector to expand. However, the evidence just cited creates some presumption that the exemption of many financial services under the current VATs results in the financial sector being larger than it would be under a perfectly functioning, single rate VAT.
Of the G-20 countries, only the United States and Saudi Arabia do not have VATs. Many U.S. states and localities do though have retail sales taxes, under which services—including financial services—tend to be more lightly taxed than goods.110 Moreover, financial sector firms will pay sales tax on their purchases; thus the situation in the US with regard to subnational taxation is qualitatively similar to that in countries where providers are VAT exempt: no taxation of sales, but purchases taxable. Thus, it is likely that MBT in particular are undertaxed also in the United States.111
While the allocation issue discussed above has for many years been an intellectual obstacle to the inclusion of MBT in the VAT base, it is now understood how, in principle, this can be done, enabling exemption to be dispensed with. Treating all inflows to financial institutions (including of principal) as taxable sales and all outflows as taxable receipts achieves this. Intuitively, such an arrangement ensures that for any transaction between financial institutions and registered business zero total tax is collected, while tax payable in respect of transactions with final consumers has positive present value to the government only to the extent that interest received (or paid) is at a rate higher (or lower) than its discount rate. Box 1 elaborates on this cash-flow
107Exemption also gives rise to considerable practical difficulties, as VAT on inputs must be allocated between outputs for which credit is and is not to be provided. 108This is reinforced by the fact that numerous countries provide credit to exempt MBT providers for some portion of the input VAT paid. There are several mechanisms by which this is done. 109For example, Huizinga (2002), using a simple partial equilibrium approach, calculates a revenue increase in 1998 from partial expansion of the base in the EU of €10-15 billion, depending on elasticities. One should hesitate, however, before assuming that the impact elsewhere would be of similar magnitude—or even of the same sign. 110A number of subnational jurisdictions in the U.S. have separate insurance premium taxes; these firms would also bear retail sales tax to the extent that it falls on business purchases. 111For example, in 2008 in the USA the financial sector paid $28.2 billion in state and local general sales, excise and gross receipts taxes, equivalent to about 14 percent of total collections of these taxes, and equal to 0.2 percent of GDP.
Financial Sector Taxation: The IMF’s Report to the G-20 and Background Material
121
Box 1. Options for Full Taxation of Financial Services under an Invoice-Credit VAT112 A simple example may help understand how, and in what sense, the cash flow method properly taxes MBT services. Suppose a final consumer—someone, that is, other than registered business—deposits $100 in a bank, earning interest at 10 percent; so a year from now they will withdraw $110. At a VAT rate of 20 percent, the bank pays $20 on the initial inflow and then receives a credit of 22 at the time of withdrawal. The present value to the government of the tax payments is then positive to the extent that the rate on deposits is less than the governments’ own discount rate (which one expects to be the case because of the value of the safe-keeping and other services received by the depositor).113 Conversely, on a loan made by the bank to a final consumer—which gives rise to a credit now and tax payment later—the present value is strictly positive to the extent that the loan rate exceeds the government's discount rate. And if the depositor/borrower had been a registered business, on the other hand, in each period there would have been exactly offsetting credit and payment, and hence zero revenue. The basic cash flow method thus correctly allocates the VAT base between depositors and borrowers, and can be applied to all MBT, including life insurance and securities and derivatives trades. Under this method, the destination principle—taxing only final consumption by domestic residents—is straightforwardly implemented by zero rating cash inflows and outflows from and to nonresidents (the importance of these international aspects being discussed further below). A difficulty with this measure, however, is that it can create cash flow problems for businesses because principal amounts are taxable; in addition it may be administratively burdensome where there are large volumes of cash flows. Variants of the cash flow method have been proposed to address these perceived weaknesses. The Tax Calculation Account (TCA) approach uses tax suspense accounts for MBT, to relieve tax payments on principal flows until the transaction is unwound. Under this method, suspended amounts—such as the initial $20 in the example above—accrue interest at a rate reflecting the time value of money (for example, a short-term interbank rate). The suspended amount of tax or credit reverses when the principal flows reverse, for example, when a loan is repaid or a deposit is withdrawn. At that time the net tax payable is the tax applicable on the interest received minus the interest at the indexing rate on the deferred tax amount, on one side, and the credit applicable on the interest received plus the interest at the indexing rate on the deferred credit amount. Another refinement of the TCA approach, the zero-rating approach, zero-rates MBT transactions with registered VAT taxpayers while using the TCA accounting for non-VAT registrants only. In this case, the TCA accounting need not be done transaction-by-transaction, but on the basis of aggregates. The cash flow system and the TCA system were piloted in Europe during 1994–97, with some success, although certain problems led to the view that further improvement was possible with the introduction of zero-rating, as in the third option. For a variety of reasons, the EU has not proceeded with significant reform. No country has adopted any of these options for their VATs.
112This discussion follows that in Ebrill et al. (2001); Poddar (2003); and Poddar (2007) 113The example also makes clear that simply charging VAT on the gross interest received by an individual depositor, as some countries do, is a mistake because it provides no allowance for the time value of money, and so over-taxes the service received by the depositor: providing a credit for the initial deposit while taxing withdrawal of principal effectively provides such an allowance.
Financial Sector Taxation: The IMF’s Report to the G-20 and Background Material
122
form of VAT, and discusses also refinements that have been developed to take account of potentially undesirable cash flow impacts of taxing flows of principal.114
While all this come to be well understood, no country has yet adopted a fully-fledged cash flow approach to the VAT treatment of the financial sector—in large part because of the difficulty of reforming VATs built on quite different principles. 115 The problem of how to adequately treat financial services under the VAT has been examined by the European Commission for more than a decade, and remains on the EU tax policy agenda.116 Variants of the cash-flow method have received intensive analysis and some pilot testing, but have been rejected for the time being because of indications of high compliance costs. Driven in part by disputes before national courts in the member states and before the European Court of Justice, the search continues for partial improvements that would increase legal certainty, alleviate administrative and compliance costs, and reduce the impact of unrecoverable input VAT on the incentive for self-supply of services by financial institutions and their competitiveness in world markets for financial services.117 The prospects for fundamental improvement of the treatment of financial services under existing VATs appear, however, remote.
7.2.1 The FAT as a Tax on Value Added in the Financial Sector
The VAT applied to the generality of goods and services in almost all countries is of the consumption-type credit-invoice form, under which (leaving international trade aside, for the moment) each taxable entity is required to charge tax on its sales and pay VAT on its material purchases, including the full cost of investment. Net VAT due is then calculated as the difference between VAT charged on sales and VAT paid on purchases. As an accounting identity, this base is equal to the sum of profits (defined as discussed shortly) and wages.118 This observation suggests an alternative way to collect the tax: by taxing the sum of profits and wages.119 This is often referred to as the addition method for calculating VAT liability. Recognizing
114See Poddar and English (1997) and Huizinga (2002) 115The major impediments to and criticisms of these approaches are presented and discussed in Poddar (2007) and Kerrigan (2010). These involve the costs of learning a new system, complexities of TCA accounting, and concern over establishing a precedent of zero-rating business to business transactions, which might lead to further erosion of the standard invoice-credit mechanism. 116E.g., Proposal for a Council Directive amending Directive 2006/112/EC; Proposal for a Council Regulation laying down implementing measures for Directive 2006/112/EC. 117The main focus at present is on implementing “three pillars”: clarification of the rules governing the exemption for financial supplies, in particular redefinition of financial services which are subject to exemption; introduction of cost-sharing groups to reduce the incentives to self-supply; and introduction of a compulsory (to member states) option to tax; a voluntary (to taxpayers) option to tax is currently permitted, and offered by several members (Austria, Belgium, Estonia, France, Germany, and Lithuania; the details and mechanisms used differ significantly among this group). See De La Feria and Lockwood (2010), 118To see this note that revenue minus taxable purchases (the normal base for the VAT) equals wages plus operating profit plus depreciation plus interest paid minus investment (including change in inventory). But these last four items sum to cash flow profit (defined later), which does not tax new investment, since such expenses are deductible. For more discussion, see Cnossen (2009). 119Strictly, a VAT is equivalent to a tax on profits plus wages plus a lump sum tax on existing capital. See Ebrill et al. (2001), p. 19 for further elaboration. Since what is considered here is an addition method tax on only the financial
(continued)
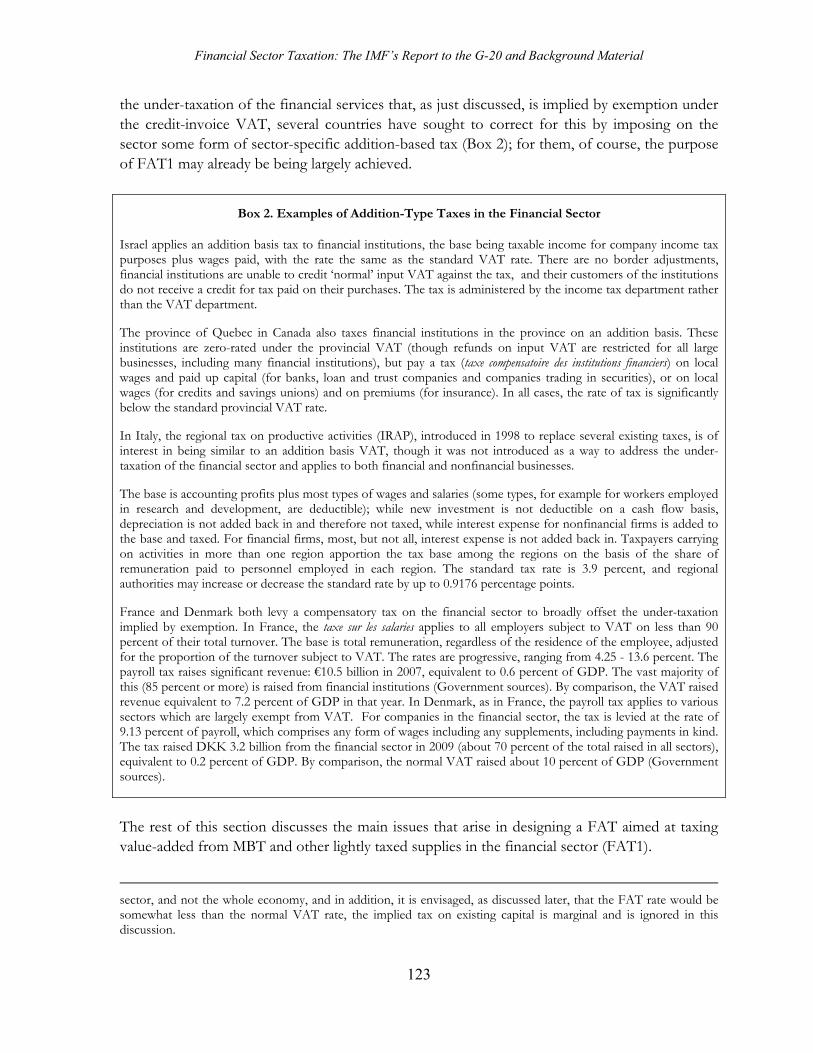
Financial Sector Taxation: The IMF’s Report to the G-20 and Background Material
123
the under-taxation of the financial services that, as just discussed, is implied by exemption under the credit-invoice VAT, several countries have sought to correct for this by imposing on the sector some form of sector-specific addition-based tax (Box 2); for them, of course, the purpose of FAT1 may already be being largely achieved.
Box 2. Examples of Addition-Type Taxes in the Financial Sector
Israel applies an addition basis tax to financial institutions, the base being taxable income for company income tax purposes plus wages paid, with the rate the same as the standard VAT rate. There are no border adjustments, financial institutions are unable to credit ‘normal’ input VAT against the tax, and their customers of the institutions do not receive a credit for tax paid on their purchases. The tax is administered by the income tax department rather than the VAT department.
The province of Quebec in Canada also taxes financial institutions in the province on an addition basis. These institutions are zero-rated under the provincial VAT (though refunds on input VAT are restricted for all large businesses, including many financial institutions), but pay a tax (taxe compensatoire des institutions financiers) on local wages and paid up capital (for banks, loan and trust companies and companies trading in securities), or on local wages (for credits and savings unions) and on premiums (for insurance). In all cases, the rate of tax is significantly below the standard provincial VAT rate.
In Italy, the regional tax on productive activities (IRAP), introduced in 1998 to replace several existing taxes, is of interest in being similar to an addition basis VAT, though it was not introduced as a way to address the under-taxation of the financial sector and applies to both financial and nonfinancial businesses.
The base is accounting profits plus most types of wages and salaries (some types, for example for workers employed in research and development, are deductible); while new investment is not deductible on a cash flow basis, depreciation is not added back in and therefore not taxed, while interest expense for nonfinancial firms is added to the base and taxed. For financial firms, most, but not all, interest expense is not added back in. Taxpayers carrying on activities in more than one region apportion the tax base among the regions on the basis of the share of remuneration paid to personnel employed in each region. The standard tax rate is 3.9 percent, and regional authorities may increase or decrease the standard rate by up to 0.9176 percentage points.
France and Denmark both levy a compensatory tax on the financial sector to broadly offset the under-taxation implied by exemption. In France, the taxe sur les salaries applies to all employers subject to VAT on less than 90 percent of their total turnover. The base is total remuneration, regardless of the residence of the employee, adjusted for the proportion of the turnover subject to VAT. The rates are progressive, ranging from 4.25 - 13.6 percent. The payroll tax raises significant revenue: €10.5 billion in 2007, equivalent to 0.6 percent of GDP. The vast majority of this (85 percent or more) is raised from financial institutions (Government sources). By comparison, the VAT raised revenue equivalent to 7.2 percent of GDP in that year. In Denmark, as in France, the payroll tax applies to various sectors which are largely exempt from VAT. For companies in the financial sector, the tax is levied at the rate of 9.13 percent of payroll, which comprises any form of wages including any supplements, including payments in kind. The tax raised DKK 3.2 billion from the financial sector in 2009 (about 70 percent of the total raised in all sectors), equivalent to 0.2 percent of GDP. By comparison, the normal VAT raised about 10 percent of GDP (Government sources).
The rest of this section discusses the main issues that arise in designing a FAT aimed at taxing value-added from MBT and other lightly taxed supplies in the financial sector (FAT1).
sector, and not the whole economy, and in addition, it is envisaged, as discussed later, that the FAT rate would be somewhat less than the normal VAT rate, the implied tax on existing capital is marginal and is ignored in this discussion.
Financial Sector Taxation: The IMF’s Report to the G-20 and Background Material
124
7.2.1 Defining Profits
The notion of ‘profit’ implicit in the standard form of VAT is not that used in most countries’ corporate income taxes: instead it is a ‘cash flow’ concept, with full expensing of investment (and no subsequent allowances for depreciation) and no deductions for the cost of finance. Such a tax bears only on rents, in the (somewhat loose) sense that the present value of tax paid is positive if and only if the return on investment exceeds the firm’s cost of capital. The tax is therefore, in principle neutral in the sense of having no impact on marginal financing or investment decisions. In thinking of a FAT as a potential surrogate form of VAT, it is thus natural to use some definition of ‘profit’ that mimics this neutrality feature. There are a number of ways in which this can be done.
The Meade Committee (1978), for example, identifies three forms of cash flow tax with this neutrality property. These differ in their suitability for the financial sector:
The R base, which includes only nonfinancial transactions in the base—and so is closely analogous to the definition implicit on the standard VAT for nonfinancial companies—is clearly inappropriate for businesses engaged in providing MBS, because in ignoring financial transactions it would effectively leave them untaxed.
The R + F base is arrived at by adding to net real flows (sales of products, services and fixed assets minus purchases of materials, wages and fixed assets) the amount of net financial flows (the increase in borrowing plus interest less repayments of borrowing and interest paid). Importantly, these flows correspond to those taxed in the cash flow VAT for MBS discussed in the previous section. The difference is that for the cash flow VAT, flows need to be recorded transaction by transaction to ensure full integration into the credit-invoice VAT, whereas under the R + F base only aggregate flows need be recorded.
The S base is calculated as the sum of dividends paid plus repurchase of shares minus new shares issued plus dividends received: the base, that is, is net distributions to shareholders. From the balance sheet identity, the S base is exactly equivalent to the R + F base.
An alternative approach, the Allowance for Corporate Equity (ACE), is closer in spirit to the accrual accounting used for the corporate income tax. Under this approach, from profits calculated for business taxation—which allows a deduction for interest expense—a further deduction is allowed for a notional return on equity (i.e., subscribed capital plus accumulated retained earnings).120 For banks, this would be similar to allowing an interest deduction in relation to Tier 1 capital. There is experience with such schemes: Belgium and Latvia have recently adopted 120A key issue in designing the ACE, not delved into here, is the choice of this notional rate. To ensure neutrality of the tax, a risk-free rate is appropriate if firms are sure to receive the proper allowances at an unchanging tax rate: see Bond and Devereux (2003).
Financial Sector Taxation: The IMF’s Report to the G-20 and Background Material
125
ACEs; Brazil has had a CIT with ACE-like features for many years; a Tax Reform Committee in the Netherlands has recently proposed an ACE for that country121; and Austria, Croatia and Italy have all had CITs with elements of an ACE. As a variant of this approach (with the merit of eliminating any need to distinguish debt and equity for tax purposes), the notional return on equity could also be applied to debt rather than using actual interest payments (Kleinbard, 2007).
It is well known that the R + F base, the S base and the ACE are equivalent, in principle—not in the sense that they would yield the same tax revenue in each period (in this the ACE will differ from the others) but in that all would leave investment and financing decisions undistorted. They imply the same tax revenue in present value, up to some constant that is irrelevant in the sense of being fixed by past behavior.122
A coherent base for FAT1, intended to address the under-taxation of financial services in many current sales tax systems, might thus comprise a uniform tax on profits defined by one of the methods above (other than the R-base) plus payments to workers as measured, for example, using the definitions and rules currently provided for the income taxation of businesses and individuals.
Among the possible profit concepts, the ACE is closest to the treatment under current business taxation; the only adjustments to the business tax base needed to implement a FAT1 of this type would be to add labor costs back in, and deduct an allowance for equity. The familiarity with most of the concepts involved, to both taxpayers and tax officers, is an advantage; it could pave the way, not least, for speedy implementation. The cash flow R+F approach is perhaps closer to treatment under the standard invoice-credit VAT, but involves an unfamiliar and more complicated set of adjustments: in addition to adjustments to put real flows on a cash flow basis (that is, add back in wages and depreciation and deduct fixed capital investments (including change in inventories)), adjustments must be made for financial flows of principal amounts of new deposits and lending.
When profits thus defined are negative in any period, the base would be less than total wages; this is equivalent to carrying the loss forward with interest. It is unlikely that loss on capital account would exceed the wage bill, but it is possible. In principle the excess should (again in order to mimic the standard VAT) be refunded or carried forward with interest. However, while respecting negative tax liabilities in this way would be the theoretically pure approach, the most practical may be to provide no offset for negative FAT liabilities: that is, the taxpayer would not carry forward losses (or receive a current tax rebate). An intermediate, pragmatic approach
121The Tax System Research Committee, established by the Dutch Ministry of Finance to examine the country’s tax system, published its report on possible reforms on April 7, 2010. 122An ACE, for example, is equivalent to an S-base cash flow tax plus an allowance for initial capital. Note that the ACE, but not the cash flow taxes, retains its neutrality when the tax rate is expected to change over time (Sandmo, 1979). One potential practical difference between ACE and a cash flow tax is that for the former the normal return to equity capital must be explicitly specified, while it is implicit under the cash flow tax (in the rate of return that businesses discount flows over different periods).
Financial Sector Taxation: The IMF’s Report to the G-20 and Background Material
126
would be to place a ceiling on FAT refunds equal to VAT paid on inputs that would otherwise be blocked; this would, however, reduce VAT revenue.
7.2.2 Cascading and Crediting Issues
Two questions of crediting arise.
1. A Credit for Business Purchases from Financial Institutions?
A value added tax can in principle be implemented by the application to all firms and sectors of either the invoice-credit or the addition method. Difficulties arise, however, in combining the two. If nonfinancial firms were also subject to an addition-based form of VAT, they would in effect receive full credit for FAT passed through to their purchases of financial services: this would simply increase their spending, and hence reduce their VAT liability, by the same amount. Thus the tax would not cascade. This is not the case, however, when nonfinancial firms are subject to an invoice-credit VAT: in this case they could take credit only on the basis of invoices reporting FAT paid. And that does not come naturally to the FAT, since levying of the tax does not require that payment be allocated to particular transactions. In this case, the FAT risks cascading and causing production inefficiencies of qualitatively the same kind as arise from exemption under the current VAT. This would be a significant drawback if the FAT1 were levied at a level comparable with current standard VAT rates.
A simpler and once again pragmatic response would be to temper this distortion (at some revenue cost) by levying FAT1 at a rate significantly below existing VAT standard rates in most countries. Further analysis of input-output relation would be needed to assess the severity of this potential problem and likely appropriate responses.
One response is to provide credits for business purchasers calculated in some more or less ad hoc way. A potentially workable approximation of this kind has been suggested, and it and similar approaches are worthy of further analysis and consideration.123 It is notable, nonetheless, that no country which has introduced a compensatory addition-method VAT for financial services has permitted input tax credits to business users.
2. Credit for Input VAT Paid by Financial Institutions?
A related question is that of how to treat normal VAT paid on purchases by financial institutions used in the provision of VAT-exempt services.
Allowing them to be credited against the FAT would reduce or eliminate the cascading effect of the existing VAT. But there are strong arguments against doing so. First, it eliminates that cascading only by in effect eliminating tax on value added at previous stages of production. 123Kerrigan (2010) suggests that it is possible to calculate the total taxable base for VAT purposes from statutory income statements, and then allocate the margin on financial services provided in supplies to taxable businesses for VAT purposes. See also Merril and Edwards (1996).
Financial Sector Taxation: The IMF’s Report to the G-20 and Background Material
127
Combined uncredited VAT with the FAT on financial institutions succeeds in fully taxing value added up to the stage of financial service provision. For sales to final consumers, the combination thus correctly taxes cumulated value added. The only difficulty remaining is then the potential cascading into purchases by registered businesses discussed above. Second, allowing an input tax credit would more than reverse the current incentive to self-supply noted above; financial institutions could then lower the combined burden of the FAT and VAT by outsourcing activities. The balance of these considerations seems to favor not allowing a credit for VAT paid against the FAT liability.124
7.2.3 Border Adjustment
Consistent with the destination principle that is the international norm in indirect taxation—taxing consumption where it occurs, not production—most countries that exempt financial services under their VATs allow direct exports of exempt services to be in effect zero-rated; that is, the exporting financial institution is allowed to take input tax credits for tax on purchases attributable to the export without charging any tax on the provision of the service.125 (In the EU, only exports outside of the common zone are zero-rated). The question arises whether, and if so how, to take exported financial services out of (and bring imported services into) FAT1.126
To match the destination basis of the standard VAT, ‘zero-rating’ might seem appropriate under FAT1. Under the R+F approach, for instance, this would mean including only inflows from domestic transactions in taxable receipts and not allowing deductions for other than domestic outflows; for example, deposits or borrowing from a nonresident would not generate taxable income and neither would its repayment be relieved from tax. Conversely, lending to nonresidents would not generate tax relief, and repayments of the lending would not be taxable.127 This is analogous to the treatment of exports under the VAT, in that sales to nonresidents do not bear tax. It requires that transactions with nonresidents can be identified and aggregated.
With regard to the wage component of the FAT, placing this on a destination basis requires excluding wages associated with export supplies and including any wage costs incurred abroad in relation to domestic supplies. In practice, this would likely mean adopting some relatively simple method of apportionment; for example, including in the base of the FAT only the share of wages corresponding to the share of domestic in total receipts.
124This does not rule out, for both suppliers of financial services and their taxable customers that special rules and optional treatments can be permitted under the tax in well-defined special cases. For example, special treatment is allowed under the French payroll tax in certain circumstances, although the extent of their use is unknown, and thought to be minor (Poddar, 2003). This approach would also likely increase the incentive to providers to move geographically to take up the option to tax as permitted by the EU and adopted in several EU countries. 125Tax is then ‘reverse charged,’ being self-assessed by the purchaser (and typically immediately credited against their own output VAT). 126Keen and Hellerstein (2009) present the case for preferring the destination principle on grounds of economic principle, while stressing that zero-rating of exports is not the only way in which it can be implemented. 127Auerbach, Devereux, and Simpson (2010).
Financial Sector Taxation: The IMF’s Report to the G-20 and Background Material
128
There is, however, a basic difficulty with this approach to cross-border transactions under FAT1: the value added in financial services sold across national boundaries will then remain untaxed even if all countries apply a FAT1 of this sort. This feature is inherent in the logic of the addition basis of the tax, under which any slice of value added that is not separately taxed will—absent some adjustment that would be especially hard to implement across countries—remain untaxed. (This is in contrast to the invoice-credit method, for instance, under which any failure to impose tax at some stage of production is corrected for by the taxation of the full value of sales—which will reflect that value added—at the next).
Two consequences follow from this. The first is an erosion of revenue. Not only will countries with large financial sectors not collect as much revenue as might be imagined if a large share of output is exported; that loss will not be offset by greater revenue in some other jurisdiction. The second is that there will be an incentive—for both financial and nonfinancial companies—to acquire (or provide) financial services abroad, rather than domestically. While a similar pro-import bias is commonplace under existing VATs—exemption means that financial services purchased domestically will likely reflect unrecovered input VAT, whereas imports will be zero-related in the country of export—the effect would be amplified under a FAT of this form.
These concerns suggest merit in not zero-rating the FAT1 but instead levying it on the origin-basis—that is, without excluding exports from or including imports in the base—to which the addition method is inherently better-suited. If so desired, revenue-sharing arrangements could be adopted to align the final allocation of revenues with the consumption-based pattern associated with the destination principle.
7.2.4 Perimeter and Other Issues
The general principle of the VAT is that all firms above some threshold size are liable to the tax, and the same would naturally be applied to financial institutions under FAT1. This implies that all those above some threshold level of activity would be required to register for the FAT. In practice, this threshold would likely, and appropriately, be so low that any entity with substantial financial activities would be included in the tax
The question arises as to how to treat enterprises conducting both financial and nonfinancial activities. Under a standard VAT, no problems would arise in the mixed case (the only issue would be how to allocate input VAT between exempt financial and other outputs); however the motivation for the FAT is to avoid the complexity and the system costs of the full VAT treatment of financial services (and, in any case, the failure of countries to adopt it). A reasonable pragmatic approach would be to bring into the FAT only supplies by firms whose business is dominated by financial services (subject to anti-avoidance rules to deter artificial mixing of activities). If necessary, firms might be required to segregate accounts between financial and nonfinancial activities, similar to the separation between foreign and domestic transactions, discussed above in respect of border adjustments.
Financial Sector Taxation: The IMF’s Report to the G-20 and Background Material
129
The nature of the FAT applied to fee-based and other financial services currently taxable under the VAT also raises several challenges. One option is to exclude these from FAT while retaining their current VAT treatment; then revenues and costs relevant to determining the FAT base would be limited to those applying to supplies of services exempt from VAT.128 A second option is to tax these supplies under the FAT as well as (though perhaps at a reduced rate) under the VAT. This approach would introduce residual cascading into areas where the VAT has been successful in removing it. A third approach is to eliminate VAT on these services and tax them solely under the FAT. There would likely be a significant revenue loss with this approach where, as envisaged, the FAT rate is significantly below the standard VAT rate, at the same time that it re-introduces residual cascading. The balance of considerations may thus support the first approach, involving a partition of financial institution activities. The tax treatment of financial institutions would then be a hybrid, with some supplies taxed under the VAT, and the remainder taxed under the FAT.
Several countries tax some types of insurance under VAT.129 It would be appropriate to maintain that treatment. However, a number of other countries exempt general insurance from VAT (most countries exempt life insurance) but levy a compensatory tax, often in the form of a tax on the premium. In some cases, the revenue raised by premium taxes is significant.130 The question arises as to how best to integrate such taxes with a FAT1. Eliminating the premium taxes and bringing general insurance under FAT1 would likely cost revenue at the relatively low FAT rates—below generally prevailing rates of VAT—that were argued above may be appropriate. An alternative approach would be to maintain the premium taxes and in addition bring the supplies under the FAT, either maintaining the current premium rate, so that the tax burden and revenue would increase, or accompanying inclusion in the FAT with a compensating reduction in premium tax rates. A third alternative would be to maintain the premium taxes, and treat these supplies similarly to financial services supplies currently taxed under the VAT; i.e., exclude these supplies and their associated costs in calculating the FAT base.131
128This treatment of wages corresponds to that used in the French payroll tax; the tax base is the calculated by adjusting the wage bill by the share of total output that is represented by exempt supplies. 129Singapore taxes agency services under the VAT, in particular brokerage for life and general insurance, and premiums on general insurance. In New Zealand, the VAT applies to general insurance, operating similarly to the cash flow approach. The Australian GST includes in the base financial agency services and non-life insurance. South Africa taxes general insurance under its VAT, along with almost all explicit fee-based services. The New Zealand approach differs from that in the other countries mentioned by allowing, correctly, an input tax credit to the insurer based on claims paid. 130The UK, for example, levies an insurance premium tax, at rates of 5 percent (applying to most general insurance) and 17.5 percent (on a small number of products, representing about 2 ½ percent of the value of taxable insurance premiums). About 80 percent of all insurance, including all long-term insurance is exempt from the tax. In 2008/09, the tax raised £ 2.3 billion, equivalent to 0.5 percent of total tax revenue, and equal to about 0.2 percent of GDP. In other countries, insurance can face a combination of premium taxes, property transfer taxes, property taxes, and taxes on capital or assets, at both the national and subnational government levels. See also Chen and Mintz (2003) for further information and discussion. 131Most life insurance services are provided directly to households, so that concern about cascading is muted. Thus the addition method of taxation should be relatively efficient in this case. Equal treatment would need to be maintained between various forms of investments, so that superannuation funds, life insurance companies, and investment management companies should be treated symmetrically.
Financial Sector Taxation: The IMF’s Report to the G-20 and Background Material
130
7.3 The FAT as a Tax on Rents This section discusses the design of the FAT as a tax aimed at pure rents accruing to owners and managers132 in the financial sector. In one form (‘FAT2’), this would be intended as a non-distorting source of revenue: taxing rents is always attractive in this sense, of course, but may have particular appeal in relation to the financial sector as a source of revenue contributing to the fiscal and other costs of financial failures and crises beyond that implied by any corrective or other distinct charges levied on financial institutions (Keen, 2010). In another form, the tax would be constructed to charge rents in such a way as to discourage risk-taking behavior in the financial sector (“FAT3”). Whereas the previous section considered the case for levying FAT on a destination basis— the norm under indirect taxation— the motivation for FAT2 and FAT3 lies on the income side, so that questions of border adjustment do not naturally arise. Thus for most of this section it will be assumed that tax is to be levied on an origin (broadly equivalent to source) basis. Issues arising in attempting to adjust the tax for residence of shareholders are discussed briefly below. The differing motivations for these members of the FAT family may also have implications for the likely appropriate tax rate. The origin basis may make the base of the tax more sensitive to cross-country differences, for instance; and to have a significant impact on risk-taking, the rate required under FAT3 would likely be noticeably above that appropriate to guard against, cascading under FAT1. It is useful to begin with a conceptual partition of the returns to capital into three components: a risk-free, pure time value of money return (the ‘normal’ return); 133 risky returns (where the actual return may vary substantially from the expected return); and inframarginal returns (economic rent). An income tax bears on the normal return plus the economic rent. A consumption-type tax (the cash flow tax or ACE discussed earlier) would not tax the normal return, but only the inframarginal return. The reason that neither taxes risky returns (as long as gains and losses are treated symmetrically, which in practical terms this means that losses can be written off against other taxed income) is that in the face of such a tax taxpayers can scale up the value of their investments to realize the same distribution of after-tax returns as they face in the absence of tax.134
132There are certainly reasons why one might in principle want to tax rents accruing to shareholders and to labor at different rates, such as: different mobility elasticities of labor and capital; lock-in effects; avoidance possibilities through relabeling capital rent as labor rent or conversely; differing equity weights attached to the two groups. It would indeed be possible to amend the forms of FAT now described in such ways. Uniformity across the two types is of course simpler, and stresses the important notion that rents may indeed accrue to some workers as well as to managers. 133This discussion follows Kleinbard (2007). 134This is the fundamental insight of Domar and Musgrave (1944): if we view a tax on capital income as one on the safe return to capital and on the excess returns that compensate for risk, only the former component has economic impact: if the safe return to capital is taxed, there will be a wealth effect associated with the capital income tax that can lead to a reduction in risk-bearing. Of course the exclusion of the risk component is self-evident for a
(continued)
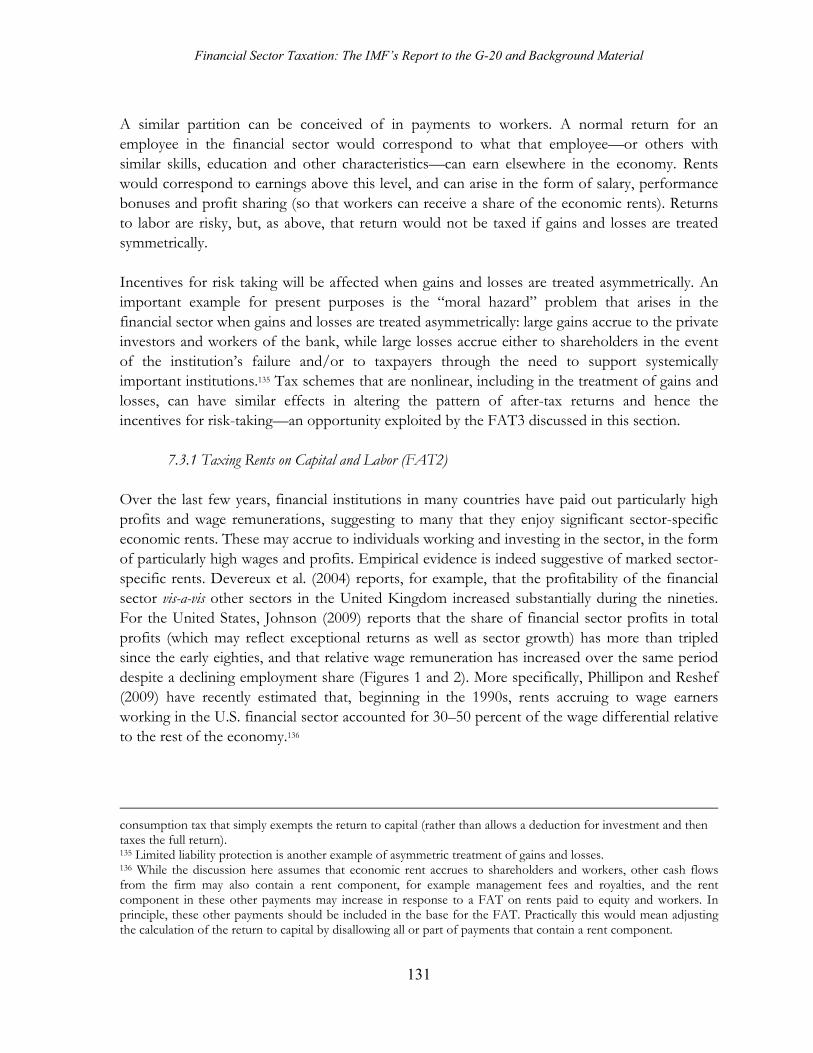
Financial Sector Taxation: The IMF’s Report to the G-20 and Background Material
131
A similar partition can be conceived of in payments to workers. A normal return for an employee in the financial sector would correspond to what that employee—or others with similar skills, education and other characteristics—can earn elsewhere in the economy. Rents would correspond to earnings above this level, and can arise in the form of salary, performance bonuses and profit sharing (so that workers can receive a share of the economic rents). Returns to labor are risky, but, as above, that return would not be taxed if gains and losses are treated symmetrically. Incentives for risk taking will be affected when gains and losses are treated asymmetrically. An important example for present purposes is the “moral hazard” problem that arises in the financial sector when gains and losses are treated asymmetrically: large gains accrue to the private investors and workers of the bank, while large losses accrue either to shareholders in the event of the institution’s failure and/or to taxpayers through the need to support systemically important institutions.135 Tax schemes that are nonlinear, including in the treatment of gains and losses, can have similar effects in altering the pattern of after-tax returns and hence the incentives for risk-taking—an opportunity exploited by the FAT3 discussed in this section.
7.3.1 Taxing Rents on Capital and Labor (FAT2) Over the last few years, financial institutions in many countries have paid out particularly high profits and wage remunerations, suggesting to many that they enjoy significant sector-specific economic rents. These may accrue to individuals working and investing in the sector, in the form of particularly high wages and profits. Empirical evidence is indeed suggestive of marked sector-specific rents. Devereux et al. (2004) reports, for example, that the profitability of the financial sector vis-a-vis other sectors in the United Kingdom increased substantially during the nineties. For the United States, Johnson (2009) reports that the share of financial sector profits in total profits (which may reflect exceptional returns as well as sector growth) has more than tripled since the early eighties, and that relative wage remuneration has increased over the same period despite a declining employment share (Figures 1 and 2). More specifically, Phillipon and Reshef (2009) have recently estimated that, beginning in the 1990s, rents accruing to wage earners working in the U.S. financial sector accounted for 30–50 percent of the wage differential relative to the rest of the economy.136
consumption tax that simply exempts the return to capital (rather than allows a deduction for investment and then taxes the full return). 135 Limited liability protection is another example of asymmetric treatment of gains and losses. 136 While the discussion here assumes that economic rent accrues to shareholders and workers, other cash flows from the firm may also contain a rent component, for example management fees and royalties, and the rent component in these other payments may increase in response to a FAT on rents paid to equity and workers. In principle, these other payments should be included in the base for the FAT. Practically this would mean adjusting the calculation of the return to capital by disallowing all or part of payments that contain a rent component.
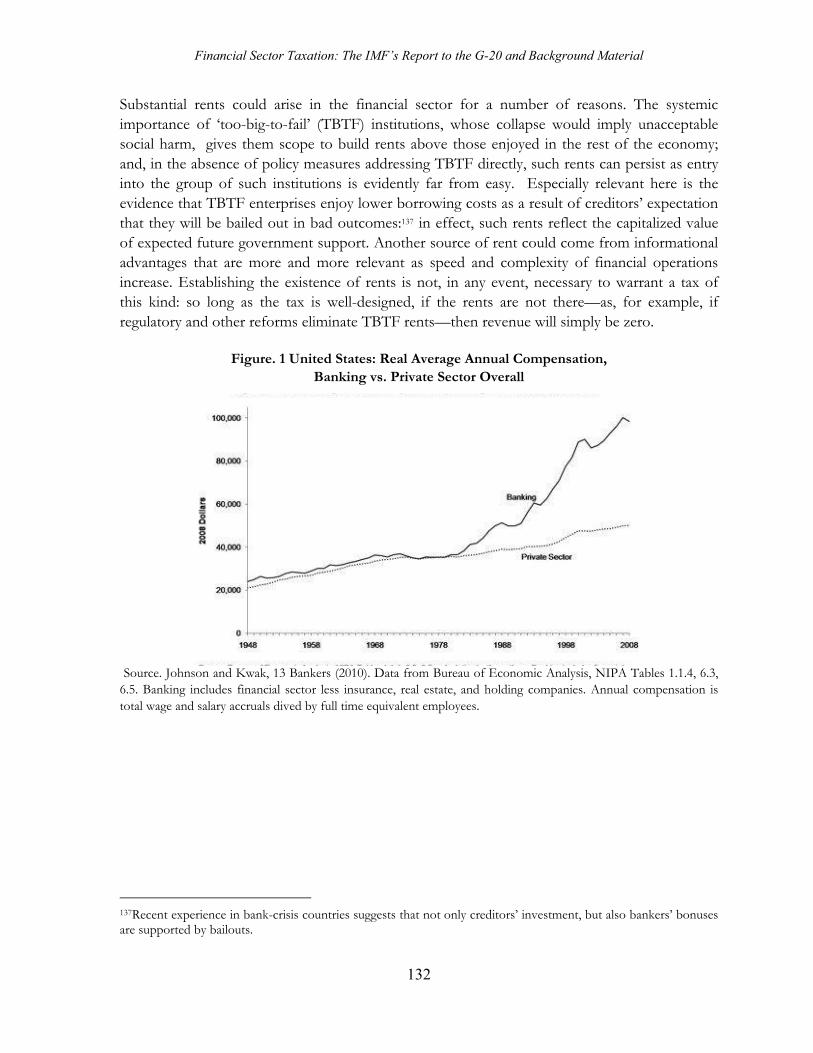
Financial Sector Taxation: The IMF’s Report to the G-20 and Background Material
132
Substantial rents could arise in the financial sector for a number of reasons. The systemic importance of ‘too-big-to-fail’ (TBTF) institutions, whose collapse would imply unacceptable social harm, gives them scope to build rents above those enjoyed in the rest of the economy; and, in the absence of policy measures addressing TBTF directly, such rents can persist as entry into the group of such institutions is evidently far from easy. Especially relevant here is the evidence that TBTF enterprises enjoy lower borrowing costs as a result of creditors’ expectation that they will be bailed out in bad outcomes:137 in effect, such rents reflect the capitalized value of expected future government support. Another source of rent could come from informational advantages that are more and more relevant as speed and complexity of financial operations increase. Establishing the existence of rents is not, in any event, necessary to warrant a tax of this kind: so long as the tax is well-designed, if the rents are not there—as, for example, if regulatory and other reforms eliminate TBTF rents—then revenue will simply be zero.
Figure. 1 United States: Real Average Annual Compensation,
Banking vs. Private Sector Overall
Source. Johnson and Kwak, 13 Bankers (2010). Data from Bureau of Economic Analysis, NIPA Tables 1.1.4, 6.3, 6.5. Banking includes financial sector less insurance, real estate, and holding companies. Annual compensation is total wage and salary accruals dived by full time equivalent employees.
137Recent experience in bank-crisis countries suggests that not only creditors’ investment, but also bankers’ bonuses are supported by bailouts.
Financial Sector Taxation: The IMF’s Report to the G-20 and Background Material
133
Figure 2. United States: Real Corporate Profits: Financial vs. Nonfinancial Sectors
Source: Johnson and Kwak (2010) Data from Bureau of Economic Analysis, NIPA Tables 1.1.4, 6.16. Financial sector excludes Reserve banks. Annual through 2007, quarterly Q1 2008 – Q3 2009.
Taxing rents is an economically efficient way to collect revenue. In a closed economy, a tax on pure rents (i.e. income in excess of normal returns) is non-distortionary because economic agents have no incentive to change their behavior in response to the tax: to maximize their after-tax earnings they will take the same decisions as needed to maximize their before tax earnings. The same would apply in an open economy when the source of rents is specific to a particular location. When rents are not tied to particular locations, a similar result will still broadly apply if there is some degree of international coordination (e.g. on tax bases and minimum tax rates), and/or the tax is levied at sufficiently low rates so as not to significantly alter incentives for location. Effective international tax coordination is difficult to enforce, however, and sources of rents are unlikely to be very location-specific in the financial sector, where activities are inherently very mobile.
The FAT can be used to extract for the budget a part of any rents accruing to the financial sector. Identifying and taxing pure profits on capital is similar to identifying capital rents under a VAT-like FAT. As discussed above, pure profits can be identified using a cash flow approach (the R+F or S-base) or by providing an allowance for corporate equity (ACE). Levying either of these on a source basis would be straightforward, and indeed, as noted earlier, some countries already do so.
Conceptualizing and taxing rents received by labor is much less straightforward—the underlying difficulty being that of measuring an individual’s human capital—and there is no mechanism for doing so comparable to the forms of corporate tax discussed above. While attempting to tax any rents in payments to labor is inherently a very imprecise exercise, reasonable approximations can
Financial Sector Taxation: The IMF’s Report to the G-20 and Background Material
134
be considered, as recent experience with bonus taxes in the UK, France and, more recently, Italy has shown.
In theory, wages contain an element of rent to the extent that they are above the level set in competitive markets for similar jobs. In practice, labor markets are rarely perfectly competitive. Hence, rents—perhaps better called ‘surplus wages’ to stress the imprecision involved—could be defined pragmatically as earnings above those paid in the rest of the economy for similar jobs or labor skills required for a specific job (e.g. education, occupational category, and work experience). In this context, surplus wages could be defined relative to some economy-wide benchmark. At each time and place, some absolute level could be identified above which earnings are regarded as surplus and subject to a FAT. For example, the 2009 “Bank Payroll Tax” in the U.K taxed bonus payments exceeding £25,000 at a 50 percent rate, and a similar tax on bonus payments was applied in France.138 However, these taxes implicitly defined surplus wages for the financial sector rather arbitrarily and captured only specific forms of income accruing to employees, i.e. bonus payments. In Italy, the tax applies as a 10 percent levy on all bonuses and stock option gains that exceed three times the fixed remuneration received by managers and independent professionals working in the financial sector.
A reasonable proxy for surplus earnings in the financial sector is likely to be broadly defined to include all payments accruing to employees. These should include any income accruing in the form of wages, bonus payments, gains on stock options and other payments and gains. Any of these payments can represent devices through which the employee obtains part of the surplus income and rents generated in the financial sector.
Ensuring that a tax falls only on pure economic rents to capital requires full loss offsetting, for example by adopting carry forward provisions, ideally with interest.139 While this would in principle be the appropriate treatment under FAT2, there are several reasons why carry-forward may be disallowed. First, this would simplify administration and compliance with the tax; second, the implied asymmetric treatment of gains and losses would represent a tax on risk taking that might be considered desirable (see below). Similarly on the labor remuneration side, there may be little to be gained by offsetting bad outcomes; taxing gains only, while effectively applying a zero rate to losses, may represent only a marginal increase in the progressivity of the taxation of labor incomes.
Since rent taxes are in principle nondistortionary, there is an efficiency case to apply FAT2, like FAT1, to all financial institutions. Administrative and compliance costs, however argue for a narrower boundary, limiting the tax to institutions where significant rent generation could be expected. This is likely to include at least the large and potentially TBTF institutions, and extend to institutions that undertake the same activities as the traditional financial sector enterprises
138 Details are in IMF (2010). 139Another possibility would be a contemporaneous deduction against income for corporate income tax or other business income tax purposes, in the case where the income tax liability is positive.
Financial Sector Taxation: The IMF’s Report to the G-20 and Background Material
135
which could be expected to be served by the same labor force; thus hedge funds, for example, might also be included.
7.4 Discouraging Risk-Taking (FAT3)
High returns in the financial sector can be a sign of excessive risk-taking. As noted above, this may result from an asymmetry between who bears the costs and who bears the benefits of financial operations—whether as a consequence of limited liability or TBTF. Specifically, managers, shareholders and investment managers in the financial sector may not bear the cost of possible failures to the same extent that they enjoy the benefits of success. If so, they have an incentive to take on more risks than is socially desirable, since the costs of failure may ultimately be passed onto other parties and onto society as a whole.140 What part of the excess returns is due to inappropriate risk-taking is not easy to assess, but taxation may play a role in guarding against excess risk-taking. To do this it is necessary, as discussed above, to treat losses and gains asymmetrically. One way to do this is by taxing high returns—above the normal return that is the benchmark for FAT2—at a higher rate.141 A FAT of this type (FAT3) could thus complement regulation in discouraging excessive risk-taking in the financial sector. Quite how high the tax rate on high returns would need to be to have any marked effect on risk-taking is unclear, though it seems likely to be substantially higher than the order of magnitude suggested above for a FAT1.
Excessive risk-taking that increases the probability that public resources will be needed for the orderly resolution of a failed institution, or which risks triggering a systemic crisis, is in the nature of a harmful economic externality—situations in which the private and social costs and/or benefits diverge. The usual remedy for a harmful externality is a tax on the activity; an appropriately determined tax is referred to as a Pigovian tax. Thus a progressive tax on risk-taking can be thought of as a Pigovian tax to remedy a harmful externality.
Observers have identified potential incentives to excessive risk-taking not only for shareholders, but also for senior management and other employees of financial institutions. In principle, a tax on excess returns can apply to all of these stakeholders. For workers, this would likely mean a tax similar to that discussed above, only now with the threshold set at an appropriately higher
140There are a number of dimensions to the distorted incentives for risk-taking. Merhan, Bolton, and Shapiro (2010) for example, emphasize the fact that mangers who act to maximize shareholder returns ignore the impact of their decisions on bondholders; this is salient for financial sector firms that tend to be much more highly geared than nonfinancial firms. Another aspect is discussed by Rajan (2008), who argues that investment managers can create false “alpha”—the return to superior investment skill—by taking on hidden tail risks; this type of investment produces a steady positive return most of the time as compensation for a rare, very negative return. These returns are not alpha, since they are wiped out when the risk materializes. 141Put more technically, the current regulatory, tax and resolution regimes yield return structures that are “convex.” Convex returns encourage risk taking. A tax that lowers after-tax returns in the best outcomes makes the after-tax return schedule less convex, incentivizing lower levels of risk-taking. A formal argument for using progressive taxation to deliberately discourage risk-taking is in John and Senbet (1991).
Financial Sector Taxation: The IMF’s Report to the G-20 and Background Material
136
level. This higher threshold would exclude more workers, but these would tend to be the employees who are least able by their actions to influence the risk profile of the enterprise’s balance sheet. Indeed, as with the French and Italian bonus taxes, remuneration might be included only of those employees having a material impact on risk decisions.
The problem of defining an excess return to capital is most easily addressed in the case of an accrual-concept tax on capital income, the usual corporate income tax (CIT) or an ACE. In this case, the surplus return can be defined as the return to equity, or related to regulatory capital, in excess of some threshold rate of return set well above normal. Measuring excess rent on a periodic basis is more difficult under a cash flow version of a tax on rent, such as an R + F base. The base would then correspond to an adequately high positive cash flow in the accounting period; but it is difficult to identify a threshold cash flow that reasonably corresponds to an excess rent that would not involve in effect calculating the return on an accrual basis.142 Thus, in this case, there is a preference for a direct accrual-based approach to measuring the base.
The issue of loss offsets is more complicated in the case of FAT3 than for the previous variants. This is because the question arises as to whether excess returns should be assessed period-by-period or cumulatively over some period of time. While a case can be made for some smoothing, perhaps by assessing realized rates of return by some moving average over some years, there are also arguments against. One is that enterprises are in any event likely to have some ability to shift taxable items between years, and so undertake some self-averaging. More fundamentally, because the aim of the tax is to treat gains and losses asymmetrically to discourage excessive risk-taking, the best approach may well be not to allow loss offsets, carry forward or explicit averaging.
The problem of excessive risk-taking can arise in all financial institutions. However the negative externality associated with the bad incentives is strongest for the systemically important institutions. FAT3 should cover at least these institutions. The perimeter can be broadened beyond that wherever the gain in the form of revenue and better incentives outweighs the efficiency, administration and compliance costs.
One final issue is worth some discussion. Several countries tax the incomes of their multinational corporations on a worldwide basis, and allow a credit for income tax paid on profits earned by subsidiaries and branches in other countries. The question arises of how the home country could treat the financial activities taxes discussed in this paper. For FAT1, the issue is moot in the sense that the tax is thought of as an indirect tax (similar to a VAT, currently not creditable). For FAT2 and FAT3, if the profit element corresponds to an ACE-type tax, it would presumably be creditable against corporate income tax (as the Croatian ACE and profit-part of the Italian IRAP were determined to be creditable against US corporate income tax). However the treatment would in some respects be subject to negotiation and agreement under double taxation arrangements. Where the intent of the tax is to change incentives to address a
142Progressive cash-flow based taxes are fairly common in the natural resource sector, but in that context cumulative returns are naturally tied to a specific project.

Financial Sector Taxation: The IMF’s Report to the G-20 and Background Material
137
distortion, crediting the tax attenuates the incentive, and for that reason would not be desirable. The FAT tax rate could be raised to compensate for the home-country credit, but not all countries tax worldwide profit and grant a credit, so there could arise differential treatment by nationality and consequently clientele effects. For this reason, a strictly territorial approach for FAT may be appropriate, though then the potential for distortion of location decisions and tax competition between countries would loom larger. A similar argument would apply for the remuneration component under FAT2 or FAT3 with regard to the home country’s personal income tax; this is reinforced by the fact that the labor component is a tax on the company and not on the individual.
7.5 Revenue Potential
The potential revenue yield of the various forms of FAT will differ across countries, depending on the relative size, profitability and wage structures of their financial sectors—as well as on details of design—and may be constrained by the need to set moderately low rates where the impact on competitiveness or the risk of avoidance are of concern. By way of illustration, Table 1 uses (aggregate) national account data for the financial sectors of OECD countries—readily available, and internationally comparable—and a commonly used database of individual banks across a large number of countries (Bankscope) to suggest the magnitude of the potential base under each form of FAT. Revenue (absent any behavioral response) can then be inferred by multiplying these figures by the statutory tax rates. All these estimates, which are for the pre- crisis year 2006, are to be interpreted, however, as no more than indicating broad orders of magnitude.
The estimated base of FAT1, levied on an origin basis, is reported in column 4 of Table 1. This is calculated as the sum of a profit component that broadly matches the R+F base (being gross operating profits (column 1) less gross fixed capital outlays (column 2)) plus total wage costs (column 3) in the financial sector in each of the countries. Averaging around 4 ¾ percent (excluding the outlier Luxembourg), the base is clearly sizable in many countries, and the corresponding revenue non-negligible. A FAT1 rate of 5 percent, for instance, is estimated to raise about 0.14 percent of GDP in Norway, and 0.31 percent of GDP in the United Kingdom. The extremely high base in Luxembourg points to the importance for many countries of the border adjustment issue discussed above,143 though there are no comparable and readily available data on exports of financial services in OECD countries with which to pursue this.
The estimates of the FAT2 base in column 6 use the same profit component as FAT1144 but (in the absence of complete and comparable data on sector wage distributions) the wage component
143One implication is that if FAT1 were to be border adjusted then its base would be narrower than under the alternative forms. 144As discussed above, an ACE-type base might be preferred for FAT2 and FAT3. Given the relationship noted earlier, that would imply somewhat lower revenue, in present value, than the base estimated in the table would imply.
Financial Sector Taxation: The IMF’s Report to the G-20 and Background Material
138
(column 5) simply assumes 12 percent of wages costs to be ‘surplus’. (This is calculated as 40 percent of the wage differential145 in the U.K. between the top 25 percent of earners in the financial sector and the top 25 percent in the wider economy). Though not to be taken as having precision, the estimates point to a substantial reduction (a halving, on average) of the base—indicative of the large share of high earnings in financial sector value added. The FAT3 estimates in column 8 use the same wage component as for FAT2 but calculate the profit-related part (column 7) as the excess of net income above a benchmark ROAE (return on average equity) of 15 percent for those banks whose ROAE is above the benchmark. The aggregate base for each country is calculated as the sum of each bank’s excess ROAE multiplied by the equity of that bank. The ROAE and equity series are derived from the Bankscope database.146 The simple average base for FAT3 is about 1.2 percent of GDP; in some countries, the base is strikingly high.
7.6 Conclusion
The paper has examined a number of central issues that arise in designing a financial activities tax, and outlined three options. These are intended to serve different objectives, and so, it should be stressed, are not mutually exclusive: it may be appropriate, for instance, to combine a FAT1 serving as a ‘fix’ for the VAT with a FAT3 aimed at risk-taking. Of course, for any of these options many design details that are not discussed here will need to be considered and decided upon—and the appropriate treatment may well depend on the current provisions, including administrative, regarding the income tax and VAT. Clearly too there is considerable scope for analyzing further the economic impact of the various forms of FAT. But there is good reason to suppose that the FAT variants may, in particular contexts, have significant economic merit—though it should be stressed that it is better to fix the VAT treatment of financial services than to use a FAT1 as fix147—and, moreover, that the revenue yield is potentially significant in a large number of countries.
145Reflecting the estimate of Philippon and Reshed (2008) for the U.S. that 30–50 percent of the wage differential between the financial and nonfinancial sectors is rent. 146Bankscope reports data both at the consolidated and unconsolidated level and, following similar approaches in the literature, we identify unique banks by using a static variable that ranks banks within a country by total assets. As the ranking is available only for the most recent year but excess profit is calculated at year-2006 levels, this identification method should be considered conservative in that it likely understates the FAT3 tax base 147In particular, a number of countries that have introduced VAT more recently have established that VAT can be successfully applied to a much larger list of financial services than is the practice in countries with older VATs. See in particular Poddar (2007) for some specific proposals.
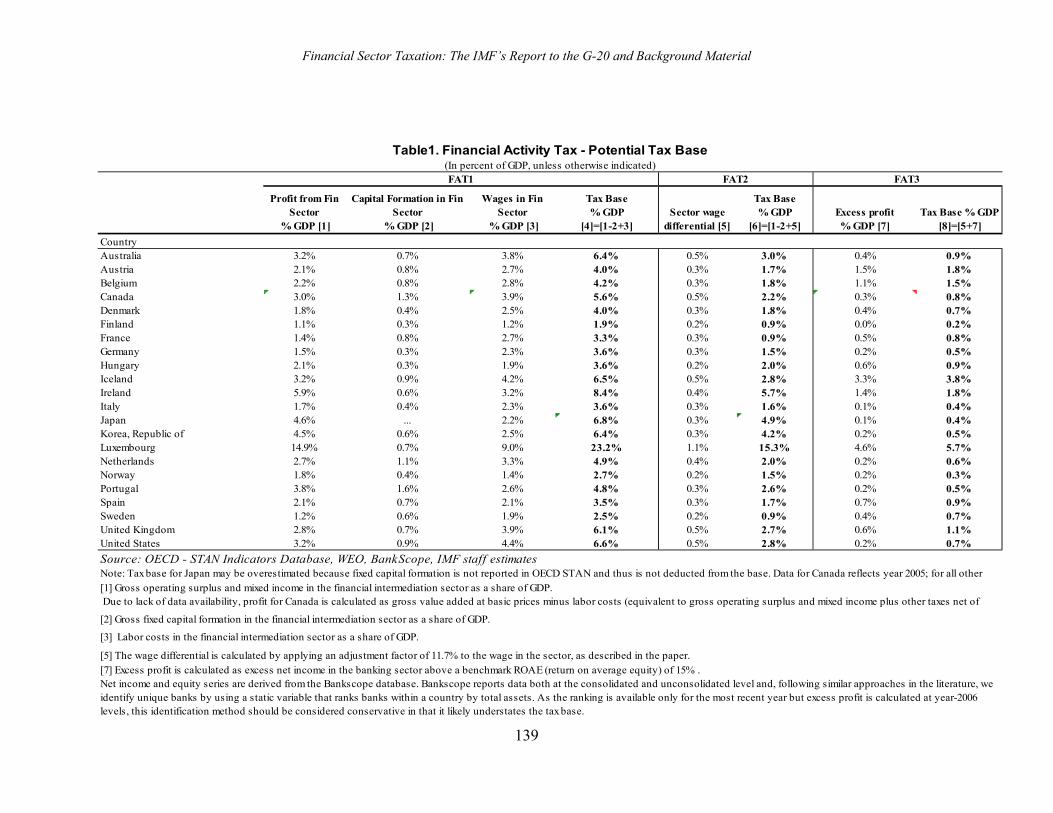
Financial Sector Taxation: The IMF’s Report to the G-20 and Background Material
139
Profit from Fin Sector
% GDP [1]
Capital Formation in Fin Sector
% GDP [2]
Wages in Fin Sector
% GDP [3]
Tax Base % GDP
[4]=[1-2+3]Sector wage
differential [5]
Tax Base % GDP
[6]=[1-2+5]Excess profit % GDP [7]
Tax Base % GDP [8]=[5+7]
CountryAustralia 3.2% 0.7% 3.8% 6.4% 0.5% 3.0% 0.4% 0.9%Austria 2.1% 0.8% 2.7% 4.0% 0.3% 1.7% 1.5% 1.8%Belgium 2.2% 0.8% 2.8% 4.2% 0.3% 1.8% 1.1% 1.5%Canada 3.0% 1.3% 3.9% 5.6% 0.5% 2.2% 0.3% 0.8%Denmark 1.8% 0.4% 2.5% 4.0% 0.3% 1.8% 0.4% 0.7%Finland 1.1% 0.3% 1.2% 1.9% 0.2% 0.9% 0.0% 0.2%France 1.4% 0.8% 2.7% 3.3% 0.3% 0.9% 0.5% 0.8%Germany 1.5% 0.3% 2.3% 3.6% 0.3% 1.5% 0.2% 0.5%Hungary 2.1% 0.3% 1.9% 3.6% 0.2% 2.0% 0.6% 0.9%Iceland 3.2% 0.9% 4.2% 6.5% 0.5% 2.8% 3.3% 3.8%Ireland 5.9% 0.6% 3.2% 8.4% 0.4% 5.7% 1.4% 1.8%Italy 1.7% 0.4% 2.3% 3.6% 0.3% 1.6% 0.1% 0.4%Japan 4.6% ... 2.2% 6.8% 0.3% 4.9% 0.1% 0.4%Korea, Republic of 4.5% 0.6% 2.5% 6.4% 0.3% 4.2% 0.2% 0.5%Luxembourg 14.9% 0.7% 9.0% 23.2% 1.1% 15.3% 4.6% 5.7%Netherlands 2.7% 1.1% 3.3% 4.9% 0.4% 2.0% 0.2% 0.6%Norway 1.8% 0.4% 1.4% 2.7% 0.2% 1.5% 0.2% 0.3%Portugal 3.8% 1.6% 2.6% 4.8% 0.3% 2.6% 0.2% 0.5%Spain 2.1% 0.7% 2.1% 3.5% 0.3% 1.7% 0.7% 0.9%Sweden 1.2% 0.6% 1.9% 2.5% 0.2% 0.9% 0.4% 0.7%United Kingdom 2.8% 0.7% 3.9% 6.1% 0.5% 2.7% 0.6% 1.1%United States 3.2% 0.9% 4.4% 6.6% 0.5% 2.8% 0.2% 0.7%
[2] Gross fixed capital formation in the financial intermediation sector as a share of GDP.
[3] Labor costs in the financial intermediation sector as a share of GDP.
[5] The wage differential is calculated by applying an adjustment factor of 11.7% to the wage in the sector, as described in the paper.
[7] Excess profit is calculated as excess net income in the banking sector above a benchmark ROAE (return on average equity) of 15% . Net income and equity series are derived from the Bankscope database. Bankscope reports data both at the consolidated and unconsolidated level and, following similar approaches in the literature, we identify unique banks by using a static variable that ranks banks within a country by total assets. As the ranking is available only for the most recent year but excess profit is calculated at year-2006 levels, this identification method should be considered conservative in that it likely understates the tax base.
Note: Tax base for Japan may be overestimated because fixed capital formation is not reported in OECD STAN and thus is not deducted from the base. Data for Canada reflects year 2005; for all other
[1] Gross operating surplus and mixed income in the financial intermediation sector as a share of GDP. Due to lack of data availability, profit for Canada is calculated as gross value added at basic prices minus labor costs (equivalent to gross operating surplus and mixed income plus other taxes net of
FAT1 FAT2
Source: OECD - STAN Indicators Database, WEO, BankScope, IMF staff estimates
FAT3
Table1. Financial Activity Tax - Potential Tax Base(In percent of GDP, unless otherwise indicated)
Financial Sector Taxation: The IMF’s Report to the G-20 and Background Material
140
References Auerbach, Alan, Michael P. Devereux, and Helen Simpson, 2010, “Taxing Corporate Income,”
pp.837-913 in James Mirrlees and others (eds), Dimensions of Tax Design: The Mirrlees Review (Oxford: Oxford University Press for Institute for Fiscal Studies).
Auerbach, Alan, and Roger. H. Gordon, 2002, “Taxation of Financial Services under a VAT,”
American Economic Review, 92(2), pp. 411–16. Bakker, Carl, and Phil Chronican, 1985, “Financial Services and the GST,” Victoria University of
Wellington Discussion Paper. Boadway, Robin, and Michael Keen, 2003, “Theoretical Perspectives on the Taxation of Capital
Income and Financial Services,” in Taxation of Financial Intermediation, ed. by Honohan, pp. 31–80.
Bond, Stephen R., and Michael P. Devereux, 2003, “Generalised R-based and S-based Taxes
under Uncertainty,” Journal of Public Economics 87, pp. 1291–1311. Bradford, David, 2003, “The X-Tax in the World Economy,” CEPS Working Paper No. 93,
August, 2003. Bradford, David, 1996, “Treatment of Financial Services under Income and Consumption
Taxes,” in Economic Effects of Fundamental Tax Reform, ed. by Henry J. Aaron, William Gale (Washington: Brookings Institution Press).
Chen, Duanjie, and Jack Mintz, 2003, “A Comparison between Property and Casualty Insurance
Taxation in Canada and Other G-7 Countries,” Tax Notes International, Vol. 37, No. 1, pp. 47–67.
Cnossen, Sijbren, 2009, “A VAT Primer for Lawyers, Economists, and Accountants,” Tax Notes
International, July 27, 2009, pp. 319–32. Cnossen, Sijbren, 1999, “VAT Treatment of Financial Services,” in International Studies in
Taxation: Law and Economics, ed. by Gustaf Lindencrona, Sven-Olof Lodin and Bertil Wiman (Kluwer Law International).
Cnossen, Sijbren, 1993, “Issues in Adopting and Designing a Value-Added Tax;” in Key Issues in
Tax Reform, ed. by C. Sandford, Fiscal Publications.
Financial Sector Taxation: The IMF’s Report to the G-20 and Background Material
141
De La Feria, Rita, and Ben Lockwood, 2010, “Opting for Opting In? An Evaluation of the European Commission’s Proposals for Reforming VAT on Financial Services,” Fiscal Studies, Vol. 31, pp.171–202.
De La Feria, Rita, and Michael Walpole, 2009, “Options for Taxing Financial Supplies in Value-Added Tax: EU VAT and Australian GST Models Compared,” International and Comparative Law Quarterly, Vol. 58, No. 4, pp. 897–932.
Devereux, Michael P., Rachel Griffith and Alex Klemm, 2004, “Why Has the UK Corporation Tax Raised So Much Revenue?” Fiscal Studies, Vol. 25(4), pp. 367–388.
Diamond, Peter, and James Mirrlees, 1971; “Optimal Taxation and Public Production I: Production efficiency,” American Economic Review, Vol. 61, pp. 8–27.
Domar, Evsey, and Richard Musgrave, 1944, “Proportional Income Taxation and Risk-Taking,” Quarterly Journal of Economics, Vol. 58, pp. 388–422.
Ebrill, Liam, Michael Keen, Jean-Paul Bodin, and Victoria Summers, 2001, The Modern VAT (Washington: International Monetary Fund).
Edgar, Tim, 2007, “The Search for Alternatives to the Exempt Treatment of Financial Services under a Value-Added Tax,” in GST in Retrospect and Prospect, ed. by Richard Krever and David White (Brookers).
Edgar, Tim, 2001, “Exempt Treatment of Financial Intermediation Services under a Value-Added Tax: An Assessment of the Alternatives,” Canadian Tax Journal, Vol. 49 (5), pp. 1133–1219.
European Union, 2008, “Background Paper Requested by the Council Presidency: Financial and Insurance Services,” March.
Genser, Bernd, and Peter Winker, 1997, “Measuring the Fiscal Revenue Loss of VAT Exemption in Commercial Banking,” Finanzarchiv, Vol. 54, pp. 565–85.
Grubert, Harry, and T. Scott Newlon, 1995, “The International Implications of Consumption Tax Proposals,” National Tax Journal, 48(4), pp. 619–47.
Huizinga, Harry, 2002, “A European VAT on Financial Services?” Economic Policy, October, pp. 498–534.
IMF, 2010, “A Fair and Substantial Contribution by the Financial Sector,” Final Report for the G-20, at www.imf.org/external/np/g20/pdf/062710b.pdf.
John, Kose, Teresa John, and Lemma Senbet, 1991, “Risk-Shifting Incentives of Depository Institutions: A New Perspective on Federal Deposit Insurance Reform,” Journal of Banking and Finance, Vol. 15, pp. 895–915.
Financial Sector Taxation: The IMF’s Report to the G-20 and Background Material
142
Johnson, Simon, and James Kwak, 2010, 13 Bankers: The Wall Street Takeover and the Next Financial Meltdown (Pantheon).
Keen, Michael, 2010, “The Taxation and Regulation of Financial Institutions,” mimeo, IMF.
———, and Walter Hellerstein, 2009, “Interjurisdictional Issues in the Design of a VAT,” Tax Law Review, forthcoming.
Kerrigan, Arthur, 2010, “The Elusiveness of Neutrality—Why is it so Difficult to Apply VAT to Financial Services,” International VAT Monitor, March-April 2010, pp. 103–12.
Kleinbard, Edward, 2005, “The Business Enterprise Income Tax: A Prospectus,” Tax Notes 106, pp. 97–107.
Kleinbard, Edward, 2007, “Designing an Income Tax on Capital,” in Taxing Capital Income, ed. by Henry Aaron, Leonard Burman, and C. Eugene Steuerle (The Urban Institute Press).
Meade, James E., 1978, The Structure and Reform of Direct Taxation, Report of a committee chaired by J.E. Meade, George Allen and Unwin.
Merhan, Hamid, Patrick Bolton, and Joel Shapiro, 2010, “Executive Compensation and Risk Taking,” draft, Columbia University.
Merrill, Peter, and Chris Edwards, 1996, “Cash-flow Taxation of Financial Services,” National Tax Journal, 49 (3), pp. 487–500.
Mintz, Jack, 1995, “The Business Transfer Tax as a Consumption Tax,” Tax Notes International, Jan 2, 1995.
Neubig, Thomas, 1984, “The Taxation of Financial Institutions after Deregulation,” National Tax Journal, Vol. 37, No. 4, pp. 351–59.
Philippon, Thomas, and Ariell Reshef, 2009, “Wages and Human Capital in the US Financial Industry: 1909–2006.” CEPR Discussion Paper No. 7282.
Poddar, Satya, 2007, “VAT on Financial Services, Searching for a Workable Alternative,” in GST in Retrospect and Prospect, ed. by Richard Krever and David White (Brookers).
———, 2003, “Consumption Taxes: The Role of the Value-Added Tax,” in Taxation of Financial Intermediation, ed. by P. Honohan (World Bank and Oxford University Press).
———, and Morley English, 1997, “Taxation of Financial Services Under a Value-Added Tax: Applying the Cash-flow Approach,” National Tax Journal, Vol. 50, No. 1, pp. 89–111.
Rajan, Raghuram, 2008, “Bankers’ Pay is Deeply Flawed,” Financial Times, January 8.
Financial Sector Taxation: The IMF’s Report to the G-20 and Background Material
143
Sandmo, Agnar, 1979. “A Note on the Neutrality of the Cash Flow Corporation Tax,” Economics Letters, Vol. 4, pp. 173–76.
Schenk, Alan, and Howell Zee, 2001, “Treating Financial Services under a Value-Added Tax:
Conceptual Issues and Country Practices,” Tax Notes International, June 25.
Zee, Howell, 2006, “VAT Treatment of Financial Services: A Primer on Conceptual Issues and Country Practices,” Intertax (Netherlands), Vol. 34 (10), pp. 458–74.
Financial Sector Taxation: The IMF’s Report to the G-20 and Background Material
144
8. Taxing Financial Transactions: Issues
and Evidence By Thornton Matheson148
In reaction to the recent financial crisis, increased attention has recently been given to financial transaction taxes (FTTs) as a means of (1) raising revenue for a variety of possible purposes and/or (2) helping to curb financial market excesses. This paper reviews existing theory and evidence on the efficacy of an FTT in fulfilling those tasks, on its potential impact, and on key issues to be faced in designing taxes of this kind. 8.1 Introduction At their Pittsburgh meeting in September 2009, the G20 leaders tasked the IMF to explore “the range of options countries have adopted or are considering as to how the financial sector could make a fair and substantial contribution toward paying for any burdens associated with government interventions to repair the banking system.” In its response, IMF (2010) adopted a dual approach: First, it recommended the adoption of levies on financial institutions to pay for the resolution of troubled institutions in the event of future failures and crises. Second, it examined the possibility of raising revenue from the sector’s activities more generally (IMF, 2010). The report considered the possible use of financial transactions taxes (FTTs) for the latter purpose, but ultimately favored the use of a “financial activities tax” (FAT) levied on the sum of financial institutions profits and wages, variously defined. The report did not, however, rule out the use of FTTs for other purposes.
FTTs – in particular, taxes on securities transactions - have indeed come under widespread scrutiny as a result of the recent financial crisis as well as general global economic developments. FTTs have gained support among several G20 governments, including France and Germany;149 H.M. Treasury (2009) considers the implications of adopting an FTT for financial markets. In
148The author is indebted to Franklin Allen, Julian Alworth, Alan Auerbach, Isaias Coelho, Carlo Cottarelli, Randall Dodd, Timothy Edgar, Douglas Gale, David Hillman, Michael Keen, Albert Kyle, Victoria Perry, Stephan Schulmeister, session participants at the National Tax Association Spring Symposium 2010, representatives of civil society, and the many individuals who posted their views on the topic on the IMF website, for their comments and insights. 149Wall Street Journal (2010).
Financial Sector Taxation: The IMF’s Report to the G-20 and Background Material
145
March the European Parliament released a study of FTTs (European Parliament, 2010) and charged the European Commission with developing plans for a European FTT. Numerous civil society organizations (CSOs), including the Leading Group on Innovative Financing for Development, also support adoption of some form of a global FTT, either on all securities transactions or on foreign currency transactions. This report therefore focuses on securities and foreign exchange transaction taxes (STTs and CTTs, respectively). Supporters of FTTs generally wish to use them to achieve one or both of the following goals: (1) raising revenue from the financial sector to help pay for the costs of the recent financial crisis or for global development; and (2) reducing financial market risk and helping to prevent asset price bubbles. This report evaluates the efficacy of FTTs in accomplishing these alternative goals, as well as considering other tax and regulatory measures that could help achieve them. Political and administrative issues regarding FTT enactment are beyond the scope of this paper. Many G20 countries currently impose some sort of financial transactions tax, most commonly an ad valorem tax on share trades of 10–50 basis points. On average, these taxes tend to raise less than 0.5 percent of GDP, although their yields fluctuate over the market cycle. The general trend in STTs over the past two decades has been downwards, as governments seek to lower capital costs and boost the competitiveness of domestic financial markets in the face of globalization. This report summarizes the existing literature on FTTs and delineates areas that require further research. Despite common use of FTTs, many aspects of their economic impact remain largely unexplored. The literature shows a predictable effect of FTTs on asset valuation and trading volume, with implications for liquidity and price discovery, in various markets. However, their effect (or that of transaction costs more generally) on market dynamics, including short- and long-term price volatility, are not well understood. There is also little written on the incidence of FTTs or their distortions relative to other types of taxes. Though FTTs appear to conform to the tax policy precept of levying a low rate on a broad base, they conflict with the precept that, because gross transaction taxes cascade and distort production, they should therefore be avoided when more efficient tax instruments are available. Section II categorizes the different types of financial transactions taxes. Section III reviews the current use of financial transaction taxes and their revenue yields in the G20 countries and selected non-G20 financial centers. Section IV reviews the economics of securities transaction taxes, including their incidence and behavioral effects. Section V discusses design considerations for a hypothetical STT to minimize distortions and evasion against this background, and Section VI concludes. 8.2 A Typology of Financial Transactions Taxes
Several different tax instruments are referred to generally as “financial transaction taxes.” This paper defines a securities transactions tax (STT) as a tax on trades in all or certain types of securities (equity, debt and their derivatives). It may include original issuance (similar to a capital levy), or be restricted to secondary market trades. Though an STT may be levied as a flat fee per trade, it is more commonly an ad valorem tax based on the market value of the securities.
Financial Sector Taxation: The IMF’s Report to the G-20 and Background Material
146
A currency transaction tax (CTT), or Tobin tax, is a securities transactions tax imposed specifically on foreign exchange transactions and possibly also their derivatives: currency futures, options and swaps. It is often used as a pecuniary foreign exchange control in lieu of administrative and regulatory measures.150 A capital levy or registration tax is imposed on increases in business capital in the form of capital contributions, loans and/or issuance of stocks and bonds. It may encompass all forms of business capital or be limited to a particular type of capital (e.g., debt or equity) or form of business, such as corporations or partnerships. A registration tax may also be charged to individuals on bank loans and/or mortgages. A bank transaction tax (BTT) is a tax on deposits and/or withdrawals from bank accounts. Most commonly seen in Latin American and Asia, BTTs are usually imposed on an ad valorem basis as a percentage of the deposit or withdrawal. BTTs effectively tax purchases of goods and services, investment products and factor payments paid for with funds intermediated by banks.151 Some G20 countries levy insurance premium taxes. These special sales taxes are often imposed on insurance premiums in order to compensate for real or perceived undertaxation of the insurance industry under an income tax and/or value added tax.152 A real estate transaction tax is levied on the value of land and/or structures when sold. This type of tax is quite common at both national and subnational levels. Real estate cannot migrate offshore, and buyers frequently must pay this tax to register title to their property and ensure their ownership rights (while sellers wish to ensure that their futures liabilities are eliminated). The base of a real estate transaction tax is thus less elastic than the base of a securities transaction tax, making it easier to enforce. This report will focus on STTs and CTTs, since it is these taxes that government and CSOS have most frequently been promoting in order to raise revenue from the financial sector and possibly also to regulate financial markets. 8.3 Current Financial Transaction Taxes and Revenue Yields
G20 countries currently levy several different types of financial transaction taxes (Table 1).
8.3.1 Equity
150For a discussion of pecuniary and non-pecuniary foreign exchange controls, see Arivoshi, and others (2000). 151For analysis of BTTs, see for example Arbalaez et al. (2002) and Kirilenko and Summers (2003). The literature on BTTs is summarized in Box 1 on page 10. 152On the difficulty of taxing the insurance industry, see Zee (2004).
Financial Sector Taxation: The IMF’s Report to the G-20 and Background Material
147
The most common form of FTT is an STT on secondary trading in equity shares. China, India, Indonesia, Italy, South Africa, South Korea, and the United Kingdom all tax purchase and/or sale of company shares.153 These STTs may apply only to shares traded on official exchanges, only to shares traded off exchange, or both. They may also apply only to corporate shares, or to shares in non-corporate businesses as well. They are generally ad valorem taxes based on the market value of the shares being exchanged, with the tax rate varying between 10 and 50 basis points. The UK and Brazil, however, levy a one-time higher-rate tax of 1.5 percent on equities of domestic company shares listed abroad as depository receipts. Among non-G20 members with major financial centers, Hong Kong, Switzerland, Singapore and Taiwan also impose stock transaction taxes of 10–30 basis points.
STTs on equity are sometimes extended to equity derivatives as well. India, for example, taxes equity futures and options as well as the underlying shares. Futures are taxed on the basis of their delivery price, while options are taxed both on the premium and on the strike price, if exercised.154 U.K. stamp duty is levied on the strike price of equity options, if exercised, but is not applied to the option premium; it also applies to the delivery price of U.K. equities purchased via futures contracts.
Some G20 countries levy non-tax charges on listed shares. The United States’ Securities and Exchange Commission (SEC), its equity market regulator, imposes a 0.17 basis point charge on stock market transactions to fund its regulatory operations.155 Turkey charges companies listing on their stock exchange an initial fee of 10 basis points, followed by a 2.5 basis point annual maintenance charge.
The trend in share transaction taxes over the past several decades has been downward. The United States eliminated its stock transaction tax as early as 1966. Germany eliminated its stock transaction tax in 1991 and its capital duty in 1992. Japan eliminated its share transaction tax in 1999. Australia eliminated its federal stamp duty on share transfers in 2001. Italy sharply reduced its capital and transaction duties in 2000, and France eliminated its share transaction tax in 2009. Paramount to this trend are concerns about raising businesses’ cost of capital and impairing the development and competitiveness of domestic financial markets, given increased cross-border mobility of capital.
153Argentina has provincial STTs. 154The Indian securities transaction tax was introduced in 2004 as replacement for India’s unsuccessful capital gains tax. Japan also has an optional 1 percent transactions tax on stock sales, which investors may elect in lieu of paying a 10–20 percent capital gains tax. 155The SEC resets the fee rate semiannually to meet a revenue target.

Financial Sector Taxation: The IMF’s Report to the G-20 and Background Material
148
Table 1: Securities Transaction Taxes in G20 and Selected Other Countries, 2010
Country Capital Levy Equity Bonds/Loans Forex Options Futures Capital inflow
Argentina na
Federal stamp duty on share transfers abolished 2001
Provincial stamp tax, usually at 1%, may affect bonds and debentures. na na na na
Australia na State-level taxes may apply to shares
State-level taxes may apply to loans and bonds. na na na na
Brazil na
1.5% tax on equity issued abroad as depository receipts (reduced from 3% 2008)
1.5% tax on loans (reduced from 3% in 2008).
0.38% on forex; 5.28% on short-term forex (<90 days). na na
2% tax on capital inflows to stock and bond markets since 2009
Canada na na na na na na na
China na 0.1% of principal na na na na na
France
5% of capital contributions not subject to VAT
15-30 bps tax abolished 1/1/2008 na na na na na
Germany na na na na na na na
India na
0.25% on stock price; 0.025% on intraday transactions; local stamp taxes may also apply
Local stamp duties may apply
0.017% on premium; 0.125% on strike 0.017% of delivery price na
Indonesia na
0.1% on value of shares; local stamp duties may also apply.
Local stamp duties may apply na na na na
Italy
Euro 168 flat fee on share issuance; 3% on business purchases
0.01-0.14% of shares traded off exchange.
0.25-2% on loan principal na na na na
Japan Registration tax of 0.4% on mergers and trusts. na na na na na na
Mexico na na na na na na na
Russia
Capital duty of 0.2% of value of new share issues, but not upon formation or IPO of
company
Capital duty of 0.2% of value of new bond
issues, but not upon formation or IPO of
company

Financial Sector Taxation: The IMF’s Report to the G-20 and Background Material
149
Saudi Arabia na na na na na na na
South Africa na 0.25% of value; new share issues excluded. na na na na na
South Korea 0.1-0.4% tax on capital formation
0.5% on value of shares in corporations or partnerships
Turkey Stock issuance charge 0.2%
Initial charge for obtaining stock market quote: 0.1%; annual maintenance charge 0.025%
0.6-0.75% bond issuance charge
0.1% tax on foreign exchange transactions by financial institutions eliminated 2008
UK na
Stamp duty 0.5% on secondary sales of shares and trusts holding shares. na na
50 bps on strike price, if executed. 50 bps on delivery price na
US na
SEC fees on stock trading: 0.0013%; NY state tax: $0.05 per share up to $350 per trade. na na na na na
Non-G20 Countries
Chile 0.1-1.2% tax on bond issuance
Hong Kong 10 basis points
Singapore 20 basis points
Switzerland 1% on share issuance in excess of CHF 1 mn.
15 bps on domestic shares; 30 bps on foreign shares.
6-12 bps on bond issuance
Taiwan 30 basis points 10 basis points on corporate bond principal
10-60 basis points on premiums.
Up to 0.025 basis points on interest rate futures; up to 6 basis points on stock index and other futures
Source: International Bulletin for Fiscal Documentation, IMF staff
Financial Sector Taxation: The IMF’s Report to the G-20 and Background Material
150
Most countries’ laws distinguish between initial share offerings and secondary market trades. Taxes on share trades frequently exempt new share issuance, as in the U.K., but a capital levy on original issuance is sometimes imposed in addition to or as part of a transaction tax. Within the G20, Korea, Russia, and Turkey all impose some sort of tax on original issuance of equity. Elsewhere in Europe, Greece, Spain Cyprus, Austria, Poland, and Portugal also impose capital levies.
Like share transaction taxes, the trend in capital levies is downward. The European Union has encouraged the reduction and/or elimination of capital levies by capping them at 1 percent and prohibiting transactions taxes on new share offerings in the interest of fostering the development of EU capital markets.156 In 2006, the European Commission recommended the abolition of all capital duties by 2010 “in order to support the development of EU companies…to create more jobs and growth” (European Commission, 2006).
8.3.2 Debt
Transaction taxes or capital levies may also be applied to debt finance, though taxes on loans and bonds are less common in the G20 than taxes on equity. At the national level, Brazil, Italy, Russia, Switzerland, and Turkey impose taxes on some forms of debt finance. Unlike equity STTs, bond taxes are usually levied solely on issuance rather than secondary transactions. However, Taiwan levies a 10 basis point transaction tax on corporate bond trades.
8.3.3 Foreign Exchange
Among the G20 countries, only Brazil levies a CTT on foreign exchange. (Turkey eliminated its 10 basis-point CTT in 2008.) Brazil’s general tax rate is 0.38 percent, but it also levies higher rates of 2.38 and 5.38 percent on certain transactions, and many transactions, such as those for exports, are tax-exempt. In November 2009, Brazil also imposed a 2 percent tax on foreign purchases of Brazilian stocks and bonds in an effort to stem the appreciation of the real in the face of buoyant capital inflows.157
8.3.4 Revenue
Revenue experience from securities transaction taxes over the past two decades has varied widely (Table 2). France, Japan, Germany and Italy, which eliminated their stock market transaction taxes during this period, collected at most 0.2 percent of GDP in revenues from
156European Council Directive 85/303/EEC. 157Explicit taxes on foreign exchange can perform a similar role to implicit taxation in the form of capital controls, though the latter are not considered here. For a recent analysis of foreign exchange controls, see Ostry et al. (2010).
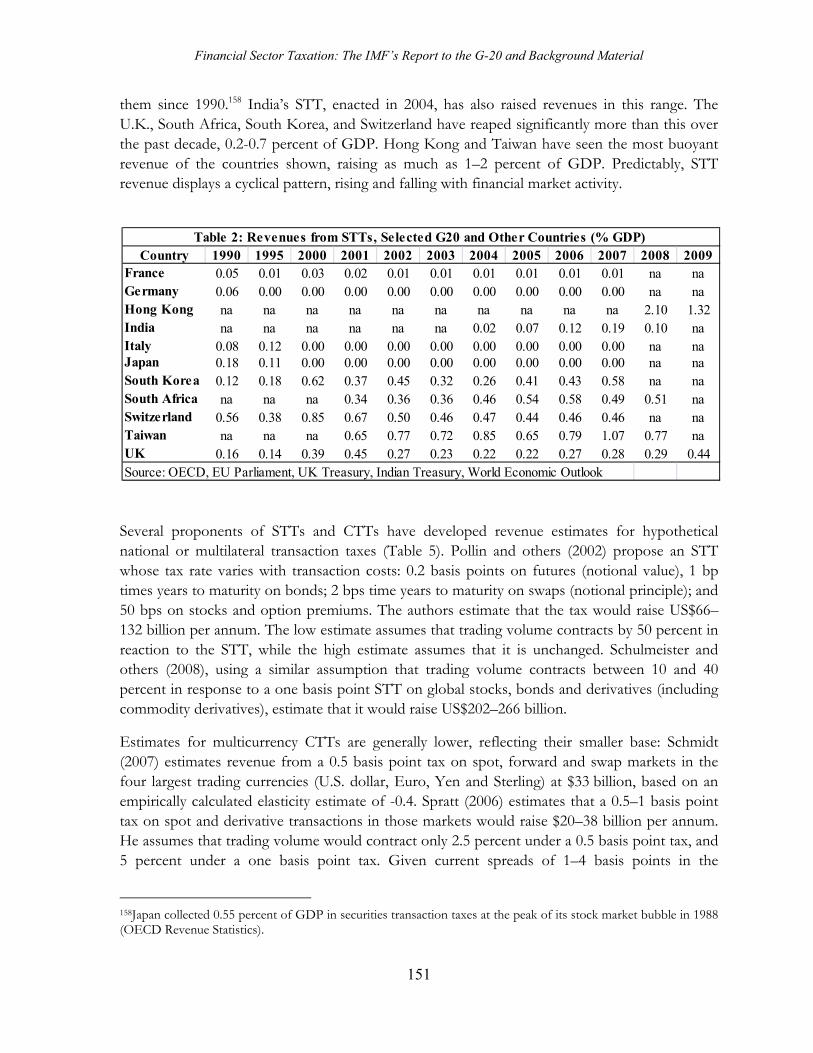
Financial Sector Taxation: The IMF’s Report to the G-20 and Background Material
151
them since 1990.158 India’s STT, enacted in 2004, has also raised revenues in this range. The U.K., South Africa, South Korea, and Switzerland have reaped significantly more than this over the past decade, 0.2-0.7 percent of GDP. Hong Kong and Taiwan have seen the most buoyant revenue of the countries shown, raising as much as 1–2 percent of GDP. Predictably, STT revenue displays a cyclical pattern, rising and falling with financial market activity.
Several proponents of STTs and CTTs have developed revenue estimates for hypothetical national or multilateral transaction taxes (Table 5). Pollin and others (2002) propose an STT whose tax rate varies with transaction costs: 0.2 basis points on futures (notional value), 1 bp times years to maturity on bonds; 2 bps time years to maturity on swaps (notional principle); and 50 bps on stocks and option premiums. The authors estimate that the tax would raise US$66–132 billion per annum. The low estimate assumes that trading volume contracts by 50 percent in reaction to the STT, while the high estimate assumes that it is unchanged. Schulmeister and others (2008), using a similar assumption that trading volume contracts between 10 and 40 percent in response to a one basis point STT on global stocks, bonds and derivatives (including commodity derivatives), estimate that it would raise US$202–266 billion.
Estimates for multicurrency CTTs are generally lower, reflecting their smaller base: Schmidt (2007) estimates revenue from a 0.5 basis point tax on spot, forward and swap markets in the four largest trading currencies (U.S. dollar, Euro, Yen and Sterling) at $33 billion, based on an empirically calculated elasticity estimate of -0.4. Spratt (2006) estimates that a 0.5–1 basis point tax on spot and derivative transactions in those markets would raise $20–38 billion per annum. He assumes that trading volume would contract only 2.5 percent under a 0.5 basis point tax, and 5 percent under a one basis point tax. Given current spreads of 1–4 basis points in the
158Japan collected 0.55 percent of GDP in securities transaction taxes at the peak of its stock market bubble in 1988 (OECD Revenue Statistics).
Country 1990 1995 2000 2001 2002 2003 2004 2005 2006 2007 2008 2009France 0.05 0.01 0.03 0.02 0.01 0.01 0.01 0.01 0.01 0.01 na naGermany 0.06 0.00 0.00 0.00 0.00 0.00 0.00 0.00 0.00 0.00 na naHong Kong na na na na na na na na na na 2.10 1.32India na na na na na na 0.02 0.07 0.12 0.19 0.10 naItaly 0.08 0.12 0.00 0.00 0.00 0.00 0.00 0.00 0.00 0.00 na naJapan 0.18 0.11 0.00 0.00 0.00 0.00 0.00 0.00 0.00 0.00 na naSouth Korea 0.12 0.18 0.62 0.37 0.45 0.32 0.26 0.41 0.43 0.58 na naSouth Africa na na na 0.34 0.36 0.36 0.46 0.54 0.58 0.49 0.51 naSwitzerland 0.56 0.38 0.85 0.67 0.50 0.46 0.47 0.44 0.46 0.46 na naTaiwan na na na 0.65 0.77 0.72 0.85 0.65 0.79 1.07 0.77 naUK 0.16 0.14 0.39 0.45 0.27 0.23 0.22 0.22 0.27 0.28 0.29 0.44Source: OECD, EU Parliament, UK Treasury, Indian Treasury, World Economic Outlook
Table 2: Revenues from STTs, Selected G20 and Other Countries (% GDP)
Financial Sector Taxation: The IMF’s Report to the G-20 and Background Material
152
interdealer market for the major currencies, these elasticities of trading volume with respect to the STT rate of 0.05–0.2 seem low.
8.3.5 Bank Transaction Taxes
Country experiences with bank transaction taxes (BTTs) can be instructive for STTs. Like securities transactions, bank deposits offer the allure of a large base – usually much larger than GDP – so that a substantial amount of revenue can be raised with a fairly low rate. BTTs are easily administered, with a small number of large financial institutions withholding and remitting the tax on their customers’ transactions. BTTs are thus often introduced by countries experiencing fiscal crises as a swift means of raising substantial revenue. BTTs in use in Latin America in 2009 had rates ranging from 15 to 150 basis points and yielded between 0.3 and 1.9 percent of GDP (Coelho, 2009). However, though BTTs appear to offer an easy fiscal handle, their revenues have a tendency to erode over time, as taxpayers learn to avoid them by using cash payments, multiple check endorsements, and offshore bank accounts. Both Kirilenko and Summers (2004) and Baca-Campodonico et al. (2006) find that, for a given tax rate, BTT revenues decline over time. Therefore, governments frequently resort to raising the rate in an effort to shore up revenues, but this often results in an even sharper contraction of the base. Consequently, BTT rates tend to be unstable, and the taxes are frequently repealed within a few years of their enactment. BTT use swelled in Latin America and Asia over the past decade due largely to financial crises in those regions, peaking in 2005, when eight Latin countries and five Asian countries imposed them. Of these 13 taxes, however, only eight remained in force by 2009 (Coelho, 2009). BTTs can impede the functioning of both financial markets and the real economy. Since banks collecting BTTs usually charge higher interest rate spreads to recoup profitability, investment is discouraged. Higher interest rates also raise the cost of government borrowing, lowering the net fiscal benefit from a BTT. Charging a BTT on investment-related transfers creates a lock-in effect identical to that of an STT, such that some countries (e.g., Brazil) have created special investment accounts within which transfers are BTT-exempt. By reducing financial intermediation, BTTs undermine savings, investment and growth, particularly in emerging market economies. Kirilenko and Summers (2004) find the bank transaction base in three Latin American countries contracted 28-47 percent in response to BTT imposition, corresponding to deadweight losses of 30-45 percent of BTT revenue. As a gross transactions tax, BTTs can cascade through the production chain, resulting in multiple layers of tax on goods and services produced using bank-mediated transfers. BTTs therefore also tend to encourage vertical integration of production processes, regardless of efficiency. Due to cascading, the incidence of a transaction tax, whether BTT or STT, can be complex and unpredictable. Though a BTT is sometimes portrayed as progressive, it may not primarily fall on financial institutions or their owners, but on their customers. Arbalaez, et al. (2005) describe the BTT as a consumption tax with a rate that varies arbitrarily across products; its incidence thus
Financial Sector Taxation: The IMF’s Report to the G-20 and Background Material
153
depends on the transaction intensity of consumer products as well as on consumption patterns, and will fall more heavily on small businesses than on large, integrated producers. 8.4 The Economics of Securities Transaction Taxes
8.4.1 Evolution of the Debate
Financial transaction taxes have inspired large theoretical, empirical, and (not least) polemical literatures debating their pros and cons. One of the earliest and most illustrious proponents of a securities transaction tax on stocks was Keynes, who highlighted the key tension in the FTT debate: the desire to curb speculative bubbles vs. the desire not to impair the financing of real enterprise. The development of liquid financial markets enables entrepreneurs to raise capital and diversify their risk, greatly expanding a society’s capacity to undertake large-scale investment; it also enables savers to increase their returns and diversify their risk. Simultaneously, however, the availability of a liquid market can decouple investment from an assessment of fundamental asset yields and focus it on (short-term) capital gains. Thus, near-term returns can be driven not by fundamentals but by “what average opinion believes average opinion” of the future price to be—that is, by speculation (Keynes, 1936). The second major proponent of a financial transaction tax levied specifically on foreign exchange transactions was Tobin (1978). Tobin proposed a one percent tax on all foreign exchange transactions to be levied multilaterally by world governments in order to limit cross-border capital flows that impair country governments’ efforts to regulate aggregate demand. The CTT is thus a pecuniary form of exchange control that would render unprofitable many cross-border financial transactions, particularly short-term round-trip flows. Numerous authors have furthered the debate on transaction taxes. Proponents (e.g., Stiglitz, 1989; Summers and Summers, 1989) claim that an STT would curtail short-term speculation, thereby reducing wasted resources, market volatility and asset mispricing. Opponents (e.g., Habermeier and Kirilenko, 2003; Schwert and Seguin, 1993) focus on the fact that an STT would result in lower asset prices, increased cost of capital for businesses, and lower returns to savings. They also fear that it would reduce liquidity, producing greater price volatility and interfering with price discovery, and lead to widespread tax evasion and distortion of financial markets. Sections IV-B through IV-D evaluate the theory and empirical evidence behind these competing claims. Concern over the negative impact of FTTs on financial market function has led their advocates to call for lower tax rates than originally proposed by Keynes or Tobin. Whereas Keynes called for a “substantial Government transfer tax” and Tobin for a tax rate of one percent on foreign exchange, today’s FTT advocates call for rates as low as one-half basis point in order to avoid impairing liquidity or driving activity offshore (Pollin and others, 2002; Schulmeister and others, 2008; Schmidt, 2007; Kapoor and others, 2007; Spratt, 2006; European Parliament, 2010). In this literature, the focus of imposing an FTT has largely shifted from financial market regulation to
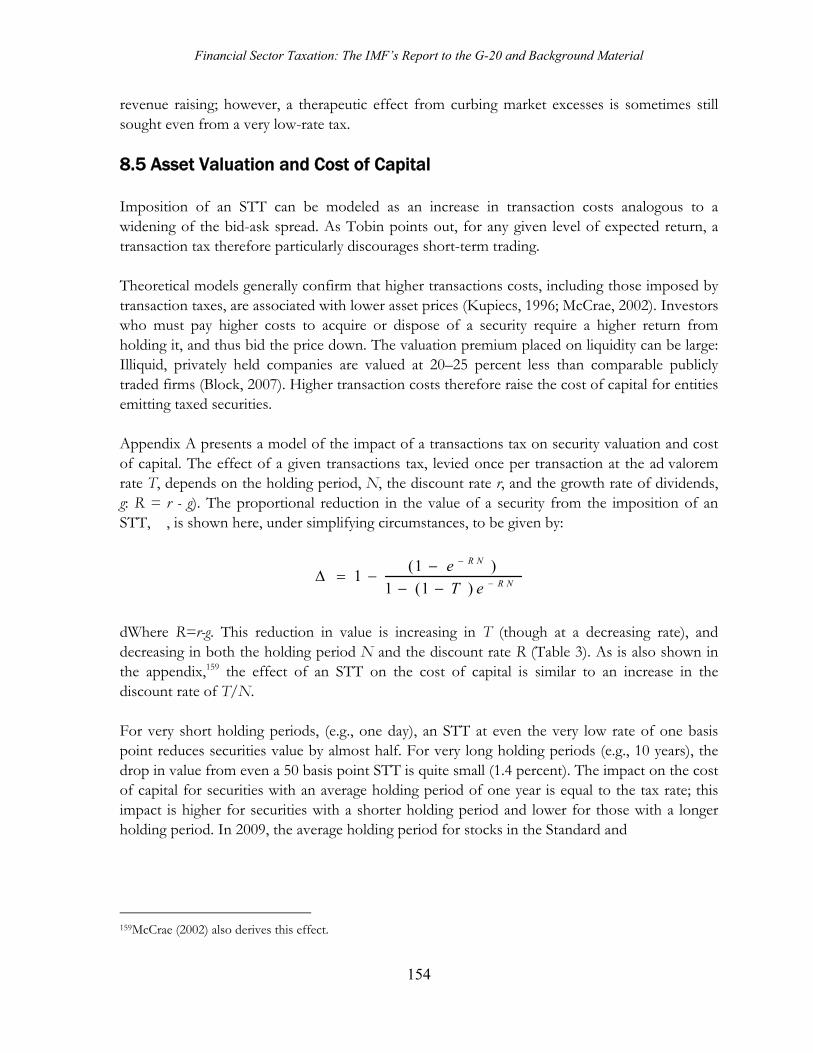
Financial Sector Taxation: The IMF’s Report to the G-20 and Background Material
154
revenue raising; however, a therapeutic effect from curbing market excesses is sometimes still sought even from a very low-rate tax. 8.5 Asset Valuation and Cost of Capital
Imposition of an STT can be modeled as an increase in transaction costs analogous to a widening of the bid-ask spread. As Tobin points out, for any given level of expected return, a transaction tax therefore particularly discourages short-term trading. Theoretical models generally confirm that higher transactions costs, including those imposed by transaction taxes, are associated with lower asset prices (Kupiecs, 1996; McCrae, 2002). Investors who must pay higher costs to acquire or dispose of a security require a higher return from holding it, and thus bid the price down. The valuation premium placed on liquidity can be large: Illiquid, privately held companies are valued at 20–25 percent less than comparable publicly traded firms (Block, 2007). Higher transaction costs therefore raise the cost of capital for entities emitting taxed securities. Appendix A presents a model of the impact of a transactions tax on security valuation and cost of capital. The effect of a given transactions tax, levied once per transaction at the ad valorem rate T, depends on the holding period, N, the discount rate r, and the growth rate of dividends, g: R = r - g). The proportional reduction in the value of a security from the imposition of an STT, �, is shown here, under simplifying circumstances, to be given by:
(1 )1
1 (1 )
R N
R N
e
T e
dWhere R=r-g. This reduction in value is increasing in T (though at a decreasing rate), and decreasing in both the holding period N and the discount rate R (Table 3). As is also shown in the appendix,159 the effect of an STT on the cost of capital is similar to an increase in the discount rate of T/N. For very short holding periods, (e.g., one day), an STT at even the very low rate of one basis point reduces securities value by almost half. For very long holding periods (e.g., 10 years), the drop in value from even a 50 basis point STT is quite small (1.4 percent). The impact on the cost of capital for securities with an average holding period of one year is equal to the tax rate; this impact is higher for securities with a shorter holding period and lower for those with a longer holding period. In 2009, the average holding period for stocks in the Standard and
159McCrae (2002) also derives this effect.
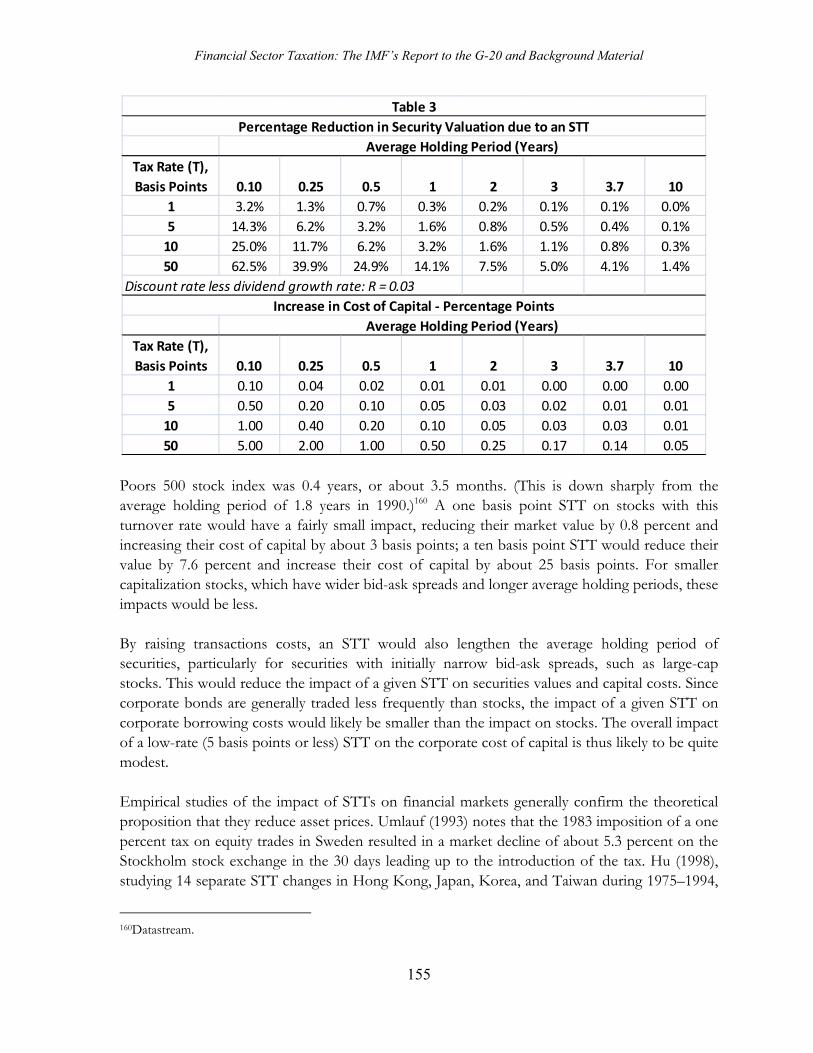
Financial Sector Taxation: The IMF’s Report to the G-20 and Background Material
155
Poors 500 stock index was 0.4 years, or about 3.5 months. (This is down sharply from the average holding period of 1.8 years in 1990.)160 A one basis point STT on stocks with this turnover rate would have a fairly small impact, reducing their market value by 0.8 percent and increasing their cost of capital by about 3 basis points; a ten basis point STT would reduce their value by 7.6 percent and increase their cost of capital by about 25 basis points. For smaller capitalization stocks, which have wider bid-ask spreads and longer average holding periods, these impacts would be less. By raising transactions costs, an STT would also lengthen the average holding period of securities, particularly for securities with initially narrow bid-ask spreads, such as large-cap stocks. This would reduce the impact of a given STT on securities values and capital costs. Since corporate bonds are generally traded less frequently than stocks, the impact of a given STT on corporate borrowing costs would likely be smaller than the impact on stocks. The overall impact of a low-rate (5 basis points or less) STT on the corporate cost of capital is thus likely to be quite modest. Empirical studies of the impact of STTs on financial markets generally confirm the theoretical proposition that they reduce asset prices. Umlauf (1993) notes that the 1983 imposition of a one percent tax on equity trades in Sweden resulted in a market decline of about 5.3 percent on the Stockholm stock exchange in the 30 days leading up to the introduction of the tax. Hu (1998), studying 14 separate STT changes in Hong Kong, Japan, Korea, and Taiwan during 1975–1994,
160Datastream.
Tax Rate (T),
Basis Points 0.10 0.25 0.5 1 2 3 3.7 10
1 3.2% 1.3% 0.7% 0.3% 0.2% 0.1% 0.1% 0.0%
5 14.3% 6.2% 3.2% 1.6% 0.8% 0.5% 0.4% 0.1%
10 25.0% 11.7% 6.2% 3.2% 1.6% 1.1% 0.8% 0.3%
50 62.5% 39.9% 24.9% 14.1% 7.5% 5.0% 4.1% 1.4%
Discount rate less dividend growth rate: R = 0.03
Tax Rate (T),
Basis Points 0.10 0.25 0.5 1 2 3 3.7 10
1 0.10 0.04 0.02 0.01 0.01 0.00 0.00 0.00
5 0.50 0.20 0.10 0.05 0.03 0.02 0.01 0.01
10 1.00 0.40 0.20 0.10 0.05 0.03 0.03 0.01
50 5.00 2.00 1.00 0.50 0.25 0.17 0.14 0.05
Increase in Cost of Capital - Percentage Points
Average Holding Period (Years)
Average Holding Period (Years)
Percentage Reduction in Security Valuation due to an STT
Table 3
Financial Sector Taxation: The IMF’s Report to the G-20 and Background Material
156
finds that on average, a 23 percent rise in transaction costs (including the tax rate) causes an immediate one percent decline in daily market returns. Based on a review of the literature, Schwert and Seguin (1993) estimate that imposition of a 0.5 percent STT in the U.S. would increase the cost of capital by between 10 and 180 basis points. Oxera (2007) estimates that abolition of the 0.5 percent U.K. stamp duty would increase share prices by 7.2 percent and reduce the cost of capital by between 66 and 80 basis points. The impact of an STT on a company’s cost of capital depends positively on the frequency with which its shares are traded. Bond and others, (2004) find that the 50 percent cut in Britain’s Stamp Duty enacted in 1986 increased share prices, particularly for shares with high turnover rates. They predict that eliminating the remaining 50 basis point stamp duty would increase share prices between 2.5 and 6.3 percent, depending negatively on dividend yield and positively on market turnover. This finding corroborates Amihud and Mendelson’s (2000) finding of the existence of liquidity clienteles, in which investors with longer (shorter) time horizons specialize in trading less (more) liquid assets. STTs are therefore capitalized more heavily into the prices of assets with high turnover, such as large-capitalization stocks.
8.5.1 Turnover, Liquidity and Price Discovery
As noted above, because STTs render some trades unprofitable, they reduce trading volume.161 This generally also reduces liquidity, defined as the price impact from a given trade (Amihud and Mendelson, 1986 and 1992; Kupiecs, 1996). Lower liquidity can in turn slow price discovery, the process by which financial markets incorporate the effect of new information into asset prices (Froot and Perold, 1995; Frino and West, 2003). By contrast, Subrahmanyam (1998) and Dupont and Lee (2007) present models in which the impact of a securities transaction tax on liquidity may be either positive or negative, depending on market microstructure.162 In empirical studies, higher transaction costs are usually found to decrease trading volume, with a broad range of elasticities across markets (Table 4). Some studies calculate elasticities solely with respect to a tax change, others to bid-ask spreads, and some to total transaction costs. Where the elasticity of trading volume with respect to a subcomponent of transactions costs (such as STT or bid-ask spreads) is measured, the implied elasticity with respect to total transactions costs will be higher.
161Kiefer (1990) notes that, because institutional investors generally face lower non-tax transaction costs than retail investors, an STT will reduce institutional trading more than retail trading. 162Imposition of an STT can have varying effects on liquidity in markets with asymmetrical information. Subrahmanyam finds that introducing a transactions tax reduces liquidity in oligopolistic markets, since it causes Cournot-competitive traders to scale back their trading; however, in the presence of a monopolist market maker, introduction of an STT may not decrease liquidity, and may even raise it if the monopolist market maker has information that other traders lack, because the tax effectively reduces the information asymmetry in the market. Similarly, Dupont and Lee find that in a market with informed and liquidity traders, an STT may increase liquidity by driving informed traders out of the market.
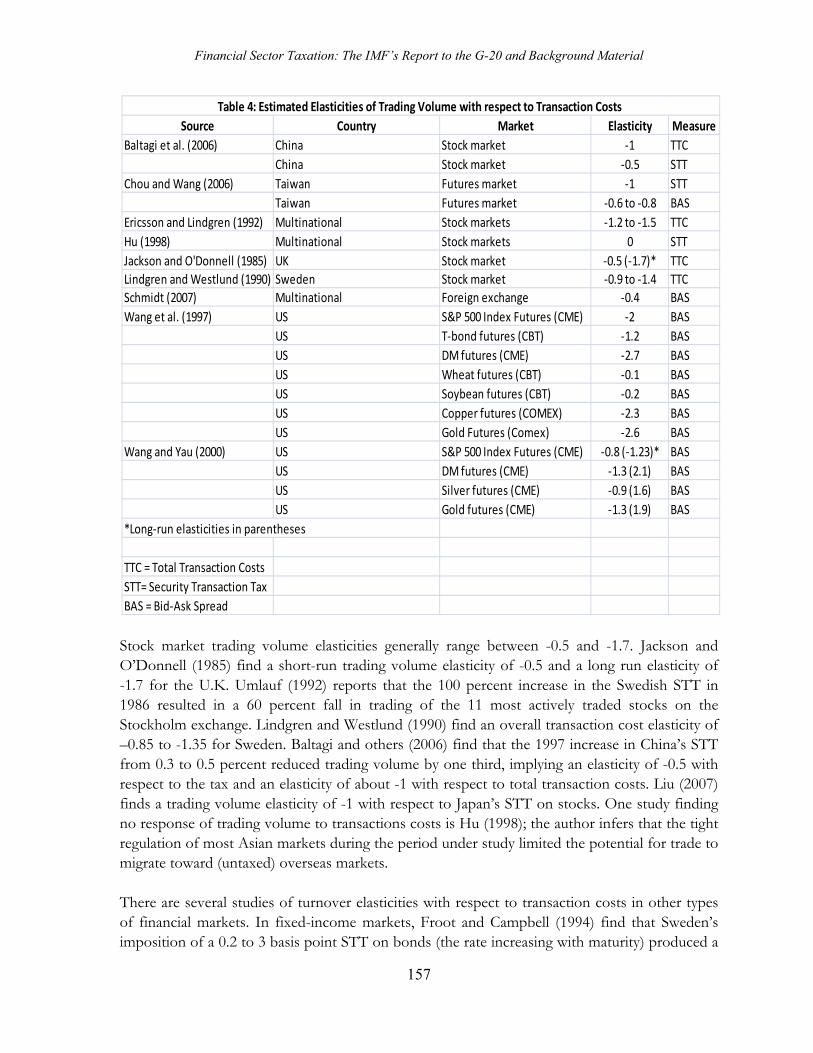
Financial Sector Taxation: The IMF’s Report to the G-20 and Background Material
157
Stock market trading volume elasticities generally range between -0.5 and -1.7. Jackson and O’Donnell (1985) find a short-run trading volume elasticity of -0.5 and a long run elasticity of -1.7 for the U.K. Umlauf (1992) reports that the 100 percent increase in the Swedish STT in 1986 resulted in a 60 percent fall in trading of the 11 most actively traded stocks on the Stockholm exchange. Lindgren and Westlund (1990) find an overall transaction cost elasticity of –0.85 to -1.35 for Sweden. Baltagi and others (2006) find that the 1997 increase in China’s STT from 0.3 to 0.5 percent reduced trading volume by one third, implying an elasticity of -0.5 with respect to the tax and an elasticity of about -1 with respect to total transaction costs. Liu (2007) finds a trading volume elasticity of -1 with respect to Japan’s STT on stocks. One study finding no response of trading volume to transactions costs is Hu (1998); the author infers that the tight regulation of most Asian markets during the period under study limited the potential for trade to migrate toward (untaxed) overseas markets. There are several studies of turnover elasticities with respect to transaction costs in other types of financial markets. In fixed-income markets, Froot and Campbell (1994) find that Sweden’s imposition of a 0.2 to 3 basis point STT on bonds (the rate increasing with maturity) produced a
Source Country Market Elasticity Measure
Baltagi et al. (2006) China Stock market -1 TTC
China Stock market -0.5 STT
Chou and Wang (2006) Taiwan Futures market -1 STT
Taiwan Futures market -0.6 to -0.8 BAS
Ericsson and Lindgren (1992) Multinational Stock markets -1.2 to -1.5 TTC
Hu (1998) Multinational Stock markets 0 STT
Jackson and O'Donnell (1985) UK Stock market -0.5 (-1.7)* TTC
Lindgren and Westlund (1990) Sweden Stock market -0.9 to -1.4 TTC
Schmidt (2007) Multinational Foreign exchange -0.4 BAS
Wang et al. (1997) US S&P 500 Index Futures (CME) -2 BAS
US T-bond futures (CBT) -1.2 BAS
US DM futures (CME) -2.7 BAS
US Wheat futures (CBT) -0.1 BAS
US Soybean futures (CBT) -0.2 BAS
US Copper futures (COMEX) -2.3 BAS
US Gold Futures (Comex) -2.6 BAS
Wang and Yau (2000) US S&P 500 Index Futures (CME) -0.8 (-1.23)* BAS
US DM futures (CME) -1.3 (2.1) BAS
US Silver futures (CME) -0.9 (1.6) BAS
US Gold futures (CME) -1.3 (1.9) BAS
*Long-run elasticities in parentheses
TTC = Total Transaction Costs
STT= Security Transaction Tax
BAS = Bid-Ask Spread
Table 4: Estimated Elasticities of Trading Volume with respect to Transaction Costs
Financial Sector Taxation: The IMF’s Report to the G-20 and Background Material
158
sharp drop in trading volume. Trading in long-term bonds, for which there existed several untaxed alternatives including corporate loans and variable rate notes, fell a remarkable 85 percent upon announcement of the tax, though bill volume fell a more modest 20 percent. The authors attribute the sharp drop in bond trading volume to the availability of untaxed substitutes, including bank loans and variable rate notes (an OTC product traded without a broker). In the foreign exchange market, Schmidt (2007) estimates the elasticity of foreign exchange trading with respect to transaction costs for a multilateral tax on the four largest trading currencies (U.S. dollar, euro, sterling, and yen) at -0.4.163 This relatively low elasticity reflects the broad multilateral base, which reduces opportunities for avoidance. In futures markets, Wang, and others (1997) and Wang and Yau (2000) find a negative relationship between bid-ask spreads and trading volume in seven U.S. futures markets. They also estimated long-run elasticities to exceed short-run elasticities. Chou and Wang (2006) find that a 50 percent reduction in Taiwan’s STT on futures markets resulted in a commensurate increase in trading volume, controlling separately for changes in the bid-ask spread. Several studies find evidence that STTs lead to reallocation of trading volume both across markets and across borders—an important aspect of trading volume elasticity with respect to STTs. Umlauf (1993) and Froot and Campbell (1994), studying the Swedish STT, find that it resulted in a massive migration of trading in Swedish stocks from Stockholm to London, as noted above. Froot and Campbell also find that the Swedish tax shifted fixed-income trading activity within Sweden from fixed-income securities and futures markets to the markets for corporate loans, variable-rate notes, forward rate agreements, and swaps, none of which were subject to the tax. Similarly, Chou and Wang (2006) find that the reduction of the STT on Taiwanese futures markets induced a significant migration of trade from Singapore to Taiwan. These findings highlight the importance of an STT’s design to its effectiveness and administrability: The high rate and narrow base of Sweden’s STT and the availability of foreign trading venues in Taiwan undermined their STT performance. These issues will be dealt with in greater detail in Section V. A few studies attempt to measure the impact of transaction costs, including STTs, on the price discovery process. These studies generally examine changes in the autocorrelation of market returns in response to changes in STT rates. In theory, efficient price discovery would mean zero or very low autocorrelation of returns, since new information would be immediately incorporated into new market valuations. With a transaction tax reducing trades, information may be incorporated into trading more slowly, resulting in greater autocorrelation of returns. Liu (2007) finds that the reduction of Japanese STT in 1989 reduced the first order autocorrelation observed in Japanese stock price changes, bringing their level of autocorrelation more in line
163Schmidt’s measure of transaction costs is the bid-ask spread, Since this is endogenous to trading volume (higher turnover usually lowers bid-ask spreads due to lower liquidity and inventory risk), Schmidt estimates a two-stage least squares using external trade as an instrument for trading volume in the bid-ask spread equation.
Financial Sector Taxation: The IMF’s Report to the G-20 and Background Material
159
with that of untaxed Japanese depository receipts trading on the U.S. stock market. Similarly, Batalgi, and others (2006) find that an increase in China’s STT rate increases the autocorrelation of returns.
8.5.2 Market Dynamics and Efficiency
Adoption of a broad-based STT has often been promoted to curb perceived negative externalities in financial markets. The reasoning behind these prescriptions is generally as follows: Falling transactions costs have led to an explosion of short-term securities and derivatives trading. Most short-term trading is speculative noise-trading, based on trend-following technical analysis rather than fundamentals, and it therefore promotes excess volatility and asset bubbles. By raising transactions costs, an STT would curb short-term trading, thereby reducing volatility and asset mispricing. Further, short-term trading is a zero-sum game that adds no real value to the economy, and is therefore a waste of resources. (Schulmeister, and others, 2008).
8.5.3 Transaction Costs and Trading Volume
Transaction costs have indeed fallen dramatically across financial markets over the past 35 years due to advances in information technology, deregulation and product innovation. In the U.S. equity market, commission deregulation (1975) and decimalization (2000) both substantially lowered transactions costs. Bid/ask spreads on the NYSE now average about 0.1 percent (Jiang, and others, 2009), vs. 1.3 percent in the mid-1980s (Clark, and others, 1992). In the foreign exchange market, bid-ask spreads for major currencies are currently as little as 1–4 basis points, half the level of a decade ago. Spreads in interest rate futures and swaps are also on the order of a few basis points. Development of the interest rate and credit default swap markets has enabled investors to tailor their fixed-income exposure more cheaply than by trading the underlying bonds. As economic theory would predict, this steep decline in financial transaction costs has produced an increase in financial transactions relative to real activity. The value of world financial transactions, which was 25 times world GDP in 1995, rose to70 times that value by 2007 (European Parliament, 2010). The growth of transactions has been concentrated in derivatives markets, which often have much lower transaction costs relative to notional values than spot markets. Growth in interest rate and equity derivatives transactions has far outstripped growth in business investment in North America and Europe, while the ratio of spot transactions to investment has remained fairly steady (Schulmeister, and others, 2008).164 As theory would also predict, lower transactions costs have particularly spurred short-term trading. The past decade has witnessed explosive growth in algorithm or computer-driven trading that relies on high-speed transactions. In 2009, algorithm trading accounted for at least 164These statistics measure derivatives by their notional amounts, which can greatly overstate net exposures.
Financial Sector Taxation: The IMF’s Report to the G-20 and Background Material
160
60 percent of U.S. equity trading volume (up from about 30 percent in 2006), and 30–40 percent of European and Japanese equity trading. Algorithm trading also accounts for 10–20 percent of foreign exchange trading volume, 20 percent of U.S. options volume, and 40 percent of U.S. futures volume (Reuters, 2009). Much algorithm trading is aimed at providing best execution of orders posted by institutional investors; however, a significant portion represents “high frequency trading” (HFT), in which computer programs drive trading as well as execution decisions. High-frequency trading can have very short-term intraday trading horizons aimed at exploiting minor price fluctuations. This explosion of (short-term) securities and derivatives trading raises several concerns. The growing dominance of computer-generated trades raises the risk of market dislocation due either to technical malfunction or to cascading of correlated trades.165 Algorithm trading is suspected of being more highly correlated than human trading, which if true could increase “herding” behavior and exacerbate price trends. Finally, growth in derivatives trading, often favored over spot trading due to lower capital requirements and transactions costs, implies a corresponding growth in leverage, which increases liquidity and default risk, and may promote asset bubbles (Allen and Gale, 2000).
8.5.4 Volatility
There are two types of volatility that could be affected by the presence of an STT: short-term price volatility166 and long-term asset price swings, which may develop into bubbles and crashes. These concepts are sometimes not clearly differentiated in the literature. Both are of concern to market participants, since they both distort price signals about fundamental asset values; however, long-term mispricing is of greater concern from a social point of view, since market bubbles and crashes have serious macroeconomic externalities. While market tops and bottoms are often marked by high short-term price volatility, the two types of volatility are not necessarily correlated: For example, six months prior to the sharp slide in U.S. equity markets that began in September 2007, volatility of the S&P 500 as measured by the VIX volatility index had been at historical lows for an extended period. The theoretical relationship between an STT and short-term price volatility is ambiguous. In general, if an STT reduces trading volume, it may decrease liquidity or, equivalently, may increase the price impact of trades, which will tend to heighten price volatility. However, the net effect of an STT on volatility depends on market microstructure and the composition of trading. The tax may reduce activity by “noise traders,” who trade on spurious information such as past price movements and are thought to destabilize markets (De Long, and others, 1990a; Froot, and others 1992). However, it may also suppress activity by informed traders and arbitrageurs, whose 165Examples of this in the U.S. stock market include the October 1987 crash attributed to “program trading” and the May 2010 “flash crash.” 166Kupiecs (1996) also distinguishes between short-term price volatility and return volatility; he demonstrates that, while introduction of an STT may lower price volatility, by reducing asset prices it unambiguously increases return volatility, which is of greater concern to investors.
Financial Sector Taxation: The IMF’s Report to the G-20 and Background Material
161
trading tends to push prices toward their fundamental values.167 And even activity by noise traders adds to market liquidity, so that driving them out of the market has a double-edged effect. Both Song and Zhang (2005) and Pellizzari and Westerhoff (2007) present models demonstrating that volatility may either rise or fall upon introduction of an STT, depending on the market microstructure. This inability of an STT to discriminate between discouraging stabilizing and destabilizing trading activity is a principal reason for its rejection by many analysts. Since theoretical models cannot resolve the impact of STTs on short-term volatility, the question of their effect is left to empirical investigation. Several empirical studies examine the impact of exogenous changes in STTs and other types of transaction costs on financial markets. Almost invariably, these studies consider short-term price volatility, rather than long-term asset mispricing, and most show either no effect of transaction costs on volatility or a positive effect.168 Roll (1989), studying the relationship between transaction costs and volatility across 23 countries, finds no consistent relationship. Baltagi, and others (2006) also find no impact of China’s STT increase on volatility. Several studies do find a positive relationship between transaction costs (including STTs) and volatility. Jones and Seguin (1997) find that U.S. stock commission deregulation, which led to a decline in transaction costs, led to decreased price volatility. Hau (2006) finds that this relationship holds for the French equities market as well, where tick-size reduction led to a fall in volatility. Green and others (2000) find that increases the U.K. stamp duty generally lead to higher short-term price volatility. There is some evidence that trading activity itself generates short-term price volatility. Studies of intra-week market closures in both the U.S. (French and Roll, 1986) and Japanese (Barclay, and others, 1990) stock markets show that, controlling for the arrival of new information, price volatility is higher during trading sessions than between them. French and Roll thus conclude that a significant portion of stock price volatility is generated by trading itself (although information arrival counts for a larger share). Thus, a transactions tax that generally depresses trading activity could reduce that source of short-term price volatility. There is a lack of research on the relationship between transaction costs and long-term price volatility, or bubbles and crashes. The economic literature (e.g., Allen and Gale, 2000, Reinhart and Rogoff, 2009, and Akerlof and Shiller, 2008) generally attributes bubbles and crashes to excesses of the leverage cycle: As asset prices rise during an economic expansion, lenders are
167In De Long, and others (1990a), it is the interaction between uninformed noise traders and informed traders that destabilizes prices: Informed traders, anticipating a rise in demand from noise traders, buy the asset to sell to noise traders at a price in excess of fundamental value. 168 An exception to this is Green, and others (2000), which attempts to decompose volatility into market, fundamental, and excess volatility. They find that the U.K. stamp duty positively affects market and excess volatility, but negatively affects fundamental volatility. However, their proxy for fundamental volatility, the short-term risk-free interest rate, is somewhat unconvincing. Short-term government rates are largely driven by the central banking system rather than stock market investors, and increases in stock transaction taxes may drive liquidity into the fixed-income market, thereby increasing liquidity and reducing short-term interest rate volatility.
Financial Sector Taxation: The IMF’s Report to the G-20 and Background Material
162
more willing to extend credit and reduce collateral requirements for their acquisition, which further raises asset prices, until the market becomes overextended and the reverse cycle sets in. In the wake of the financial crisis, a growing body of literature is exploring methods of combating excessive leverage to prevent bubbles: e.g., Geanakoplos (2010), Adrian and Shin (2009), Barlevy (2008). Though transactions costs may play a role in determining market cycles, they are clearly not a decisive factor. Bubbles and crashes are common in real estate markets, where transaction costs (including taxes) are extremely high compared to securities transaction costs, generally on the order of several percentage points. This suggests that a low-rate STT will not prevent asset bubbles. By deterring transactions, an STT might slow the upswing of the asset cycle; however, it could also slow a correction of prices toward their fundamental values. A transactions tax on derivatives or other leveraged trades would have a side effect of discouraging leverage, particularly if the tax base were the notional value of the underlying security; in that case, reducing the equity deployed in the trade would not reduce the tax liability, so the effective tax rate would rise with leverage. Rather than generally discouraging securities transactions, a more direct means of preventing asset bubbles would be to discourage leveraged asset purchases via increased margin requirements or collateralization, particularly during the upswing of the market cycle. Does the increased short-term trading brought about by lower transaction costs fuel asset price swings? Froot, and others (1992) show that short-term trading can result in “herding” behavior that causes securities prices to depart from fundamental values if traders focus on non-fundamental information such as technical analysis. Gehrig and Menkhoff (2007) find that short-term trading tends to focus on technical analysis. However, not all technical analysis consists of momentum-following strategies; it also comprises contrarian strategies that counteract price movements. And though technical trading may dominate short-term activity, it is also frequently used to inform longer-term investments.169 An experimental analysis by Bloomfield, and others (2009), in which uninformed “noise” traders trade with informed traders, finds that the uninformed trade as contrarians against recent price movements. While their activity increases liquidity, it deters price discovery. A transactions tax reduces trading by both noise and informed traders, and thus does not improve pricing efficiency. Studying computer-driven foreign exchange trading in 2006–07, Chaboud, and others (2009) find that algorithm trades are more correlated than other trades; however, they also find that computer-driven trades do not increase price volatility.
169Dow theory, one of the earliest forms of technical analysis, was developed during the 19th century, when transaction costs were substantially higher. A basic tenet of technical analysis is that price formations that develop over longer periods predict future price movements more powerfully than short-term price formations (Murphy, 1986).
Financial Sector Taxation: The IMF’s Report to the G-20 and Background Material
163
8.6 Efficiency and “Waste”
Financial market critics frequently describe short-term trading as a waste of resources and promote an STT as a means of reducing the negative value added from “excessive” trading. Keynes (1936) and Stiglitz (1989) argue that chasing short-term gains, though it may augment some individuals’ profits, is a zero-sum game for society as a whole. By this argument, given the transaction price and subsequent price movement of a security, one trader’s gain from a trade equals another trader’s loss, and since trading consumes resources, value added from trading is therefore negative. Imposing an STT would therefore raise welfare by reducing wasted resources. This argument appears to hinge on the perceived value of marginal liquidity, given a certain level of trading. Few would contravene the view that, beginning from a state of complete illiquidity, the creation of a liquid securities market adds value to the economy. As previously noted, the opportunity for entrepreneurs and savers to diversify their risk and access liquidity when needed can greatly increase productivity and welfare. Even in highly developed financial markets, investors clearly value liquidity, since they accept a lower return from more liquid securities (Amihud and Mendelson, 2005). This suggests that emerging market countries wishing to promote financial market development should be particularly wary of introducing an STT.170 Once markets have an “adequate” level of liquidity, however, additional trading activity may appear to add no value, a viewpoint evinced by Lord Turner, Chairman of the U.K. Financial Services Agency, who stated, “Market liquidity is beneficial up to a point but not beyond that point” (Financial Times, 2010). Financial interests, conversely, maintain that short-term trading provides value in terms of liquidity and price discovery for all market participants, even at current trading levels. For example, Hendershott, and others (2010), studying U.S. equity trading for 2003–07, find that algorithm trading lowers the cost of trading and facilitates price discovery, although their study does not quantify the incremental value of these benefits to market participants. Even if the marginal benefit of liquidity were zero, however, it is not clear that an STT would be justifiable to reduce resources “wasted” on trading, since market participants may have motives for trading apart from financial returns. Hedgers, for example, may consistently lose money on derivatives transactions, but derive an offsetting benefit from risk reduction. Similarly, Barber and Odean (1998, 1999) show that retail investors—particularly males—trade excessively, reducing their investment returns by paying too much in transaction costs. The authors attribute this behavior to overconfidence; however, it may also contain an element of consumption, like gambling or golf, for which traders are willing to pay in the form of lower investment returns.
170Analogously, Kirilenko and Summers (2003) show that the deadweight loss from a BTT is less significant in Brazil than elsewhere in Latin America, which they attribute to its more highly developed financial system.
Financial Sector Taxation: The IMF’s Report to the G-20 and Background Material
164
8.6.1 Incidence A large part of the burden of an STT would fall on owners of traded securities, at the time the tax was introduced, as the value of stocks, bonds and derivatives subject to the STT fell by the present value of the expected future STT liabilities on those securities. Like any tax on capital income, the distribution of this effect would likely be highly progressive: High-income individuals possess a disproportionate share of financial assets, and so would suffer from the initial fall in taxed securities prices. For example, in the United States in 2007 (Table 5), the top decile in terms of income owned 81 percent of bonds, 63 percent of stocks, 57 percent of investment funds, and 56 percent of retirement account assets. Dividing the population into deciles by net wealth, these shares are significantly higher. The tax would also affect older taxpayers disproportionately: At least 52 percent of these four asset groups are held by taxpayers 55 and older, and at least 88 percent are held by taxpayers 45 and older. In the longer run, market forces would work to equalize the after-tax return to capital in the taxed and untaxed capital markets. The increase in the cost of capital to firms issuing taxed securities would reduce their demand for capital relative to firms whose finance was untaxed; or, firms would finance more of their investment from untaxed sources, such as bank loans. The lower supply of taxed securities and the increased demand for untaxed forms of capital would lower the yield (or raise the price) on taxed securities and raise the yield (or lower the price) on untaxed capital until their after-tax price equalized.171 This effect would, of course, be the same for any tax initially imposed on capital income. How much overall investment would fall as a result of the STT would depend on the relative elasticities of capital supply and demand. In a small, open economy, the after-tax return on capital is determined on the world market. In response to imposition of the STT, capital would flow out until its after-tax return was restored to the world market level. In the long run, capital owners would therefore not bear the burden of the STT; it would fall on workers, who as a result of the smaller capital stock would be less productive and receive lower wages. If, however, the capital supply is less than perfectly elastic, the STT will lower the return on capital, and capital owners will share the burden of the tax with workers.172
171This discussion, which is analogous to the effect of the corporate income tax on corporate and non-corporate capital found in Harberger (1962), is adapted from Kiefer (1990). 172For a discussion of the incidence of capital income taxes on workers vs. capital owners, see for example Randolph (2006) and Hassett and Mathur (2006).
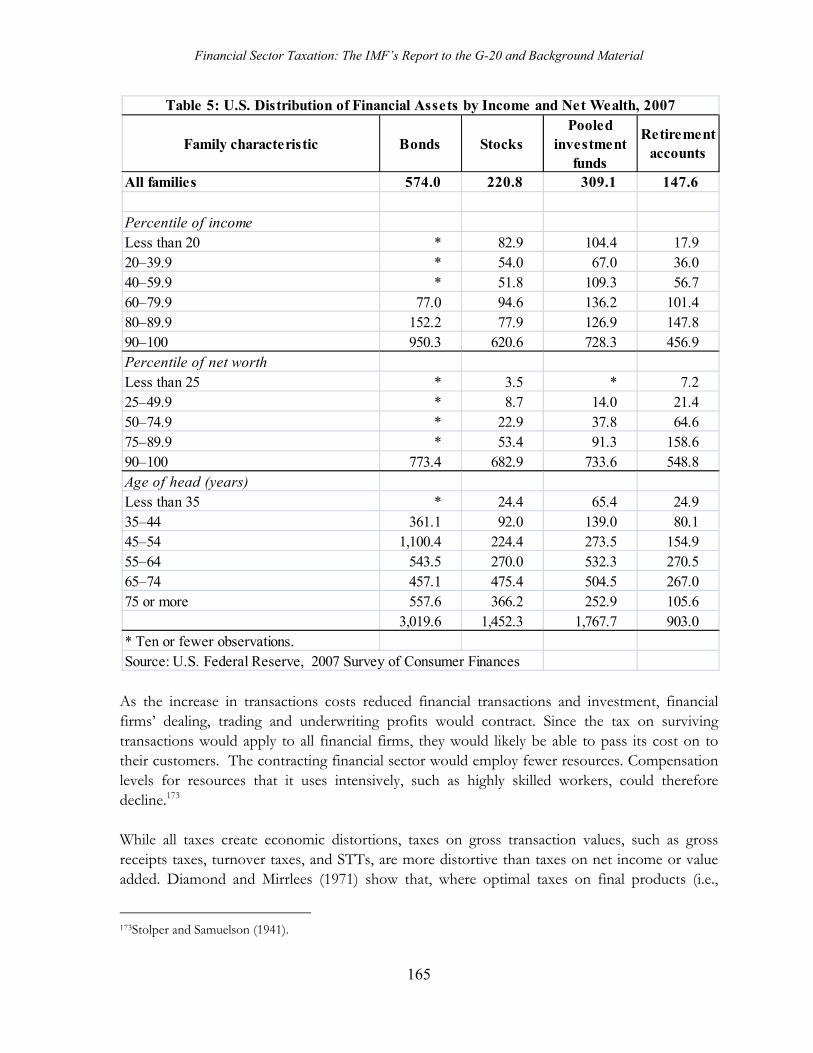
Financial Sector Taxation: The IMF’s Report to the G-20 and Background Material
165
As the increase in transactions costs reduced financial transactions and investment, financial firms’ dealing, trading and underwriting profits would contract. Since the tax on surviving transactions would apply to all financial firms, they would likely be able to pass its cost on to their customers. The contracting financial sector would employ fewer resources. Compensation levels for resources that it uses intensively, such as highly skilled workers, could therefore decline.173 While all taxes create economic distortions, taxes on gross transaction values, such as gross receipts taxes, turnover taxes, and STTs, are more distortive than taxes on net income or value added. Diamond and Mirrlees (1971) show that, where optimal taxes on final products (i.e.,
173Stolper and Samuelson (1941).
Family characteristic Bonds StocksPooled
investmentfunds
Retirement accounts
All families 574.0 220.8 309.1 147.6
Percentile of incomeLess than 20 * 82.9 104.4 17.920–39.9 * 54.0 67.0 36.040–59.9 * 51.8 109.3 56.760–79.9 77.0 94.6 136.2 101.480–89.9 152.2 77.9 126.9 147.890–100 950.3 620.6 728.3 456.9Percentile of net worthLess than 25 * 3.5 * 7.225–49.9 * 8.7 14.0 21.450–74.9 * 22.9 37.8 64.675–89.9 * 53.4 91.3 158.690–100 773.4 682.9 733.6 548.8Age of head (years)Less than 35 * 24.4 65.4 24.935–44 361.1 92.0 139.0 80.145–54 1,100.4 224.4 273.5 154.955–64 543.5 270.0 532.3 270.565–74 457.1 475.4 504.5 267.075 or more 557.6 366.2 252.9 105.6
3,019.6 1,452.3 1,767.7 903.0* Ten or fewer observations. Source: U.S. Federal Reserve, 2007 Survey of Consumer Finances
Table 5: U.S. Distribution of Financial Assets by Income and Net Wealth, 2007
Financial Sector Taxation: The IMF’s Report to the G-20 and Background Material
166
consumer goods) are available, taxes on intermediate transactions (e.g., business purchases of inputs) should be avoided because they distort production decisions and thus lead to an inefficient allocation of resources. Since different industries use taxed inputs with varying intensity, and the cost of transactions taxes paid is not creditable against transaction taxes charged, such taxes cascade through the production process in arbitrary ways, burdening some sectors more heavily than others and distorting production decisions. Securities transactions generally function as intermediate inputs. Corporations issue securities to raise capital. Hedgers trade securities to manage risk. Dealers charge buyers a markup and sellers a discount; for them, an STT is a tax on both inputs and outputs. For traders and professional managers, who seek to augment the value of capital by shifting it among securities, the tax applies to the “production process” itself. Individual investors, who seek to transform current earnings into higher future consumption, have a similar relationship to the tax as professional investors, but their trading activity may also contain a significant element of consumption. An STT disproportionately burdens sectors and activities that issue or trade securities more heavily. These sectors include the financial sector itself, which is the single largest commercial consumer of financial services,174 as well as pension funds, public corporations, firms engaged in international commerce, and public entities (assuming that the tax was imposed on government bonds). The cascading effect of a transactions tax would impose multiple layers of tax on some transactions, so that even an apparently low-rate STT might result in a high tax burden on some activities.
8.6.2 Alternatives to an STT Because gross transaction taxes distort production decisions, they should in principle be avoided where more efficient taxes, such as those on net income or consumption, are available. This section considers options other than an STT for both curbing financial sector excesses and raising revenue from the financial sector, the two rationales most frequently cited for adopting an STT. In addition to the arguments for using an STT to address market bubbles discussed in the previous section, the European Parliament (2010) considers a low-level STT as a method of second-best financial regulation to limit the potential dangers from inadequate financial regulation. By this argument, the fast pace of financial innovation and trade distribute risks in ways that are often opaque and poorly understood by both regulators and market participants alike. Derivatives, through their implicit leverage, have the power to shift and concentrate financial risk in ways that are difficult to measure and monitor, while automated trading can cause sudden cascades in market activity. Dislocations from these types of developments have surfaced repeatedly in recent decades, from the 1987 U.S. market crash (program trading) to the
174Input-output tables, U.S. Department of Commerce: www.bea.gov.
Financial Sector Taxation: The IMF’s Report to the G-20 and Background Material
167
current financial crisis (securitization and credit default swaps). The European Parliament therefore argues that, where the regulatory regime is imperfect, it may make sense to slow the pace of poorly understood but potentially explosive financial activity with a general STT; it could be imposed provisionally, until such time as more optimal financial taxes and regulations could be established. Where the goal is to curb financial market excesses, STTs offer a less specific remedy for the excessive leverage that is believed to cause them than other tax and/or regulatory solutions. Financial complexity does not derive solely or even primarily from trading activity. The buildup of hidden financial risks in the recent crisis resulted predominantly from excess leverage, risk concentration and product innovation such as asset securitization, which would have been largely unaffected by a transactions tax. An STT also does not directly address systemic risk. To discourage leverage at the institutional level, a tax on balance sheet debt (net of insured deposits and equity), such as the financial sector contribution (FSC), could be used (IMF, 2010). The FSC could be tailored to tax systemically important institutions more heavily, since their risks pose a greater danger to the broad economy. Another means of combating leverage at the firm level is reform of the corporate income tax (CIT), which encourages debt over equity finance due to its disparate treatment of interest and earnings. To discourage debt finance while raising revenue, interest deductibility could be reduced or even eliminated, as in a comprehensive business income tax175; alternatively, an allowance for corporate equity (ACE) could be introduced, with a corresponding reduction of interest deductibility to conserve revenue. As noted in the previous section, to discourage excessive leverage at the level of securities transactions, increased collateral or margin requirements could be used. An STT levied on the full notional value of leveraged transactions, including derivatives, could also have this effect. If the goal is to raise revenue from the financial sector, one option is to improve the application of the standard VAT to financial services. Due to the difficulty of taxing services compensated through a financial margin, such as lending, deposit-taking and market-making, financial services are often exempted under VATs. This practice overtaxes their provision to businesses, who do not receive a credit for the VAT paid on financial sector inputs, but undertaxes them to consumers, who do not pay VAT on the value added by financial institutions. Huizinga (2002) estimates that this results in net undertaxation of financial services. Extension of VAT coverage to include all fee-based financial services, as is currently the practice in South Africa, for example, would partially rectify these distortions. Systems for applying VAT to bank interest margins have also been developed but not yet implemented.176
175Taxation of interest at the investor level would correspondingly be eliminated, though this reform generally results in a revenue increase due to the presence of tax-exempt and foreign investors. 176Poddar (2007), Poddar and English (1997). Application of VAT to trading/market-making, which is compensated through the bid-ask spread commingled with capital gains, remains problematic.
Financial Sector Taxation: The IMF’s Report to the G-20 and Background Material
168
To the extent that reforming the VAT still leaves financial services undertaxed, an “financial activities tax” (FAT), described in IMF (2010) and Krelove (2010), could be applied, either to a comprehensive value added base or to compensation and profits above a certain threshold—i.e., to financial sector rents. Since either type of FAT would not be creditable to business users of financial services, it would cause some cascading. However, insofar as a FAT taxes net value added rather than the gross value of transactions, it should be less distortive than an FTT in raising a given amount of revenue. Because an FTT is levied on gross transaction value while the FAT is levied only on the value added by the financial institutions, the FTT rate necessary to raise the same revenue as an FAT would be much lower. However, despite having a higher rate the FAT would be less distortive because it would cause less cascading. 8.7 STT Design This section addresses the major design issues that face countries that wish to raise revenue using an STT. Specification of an STT can greatly influence the elasticity of the tax base and revenue performance. The broader the tax base in terms of including potential substitutes for taxed securities, the less likely it is that revenues will erode over time as traders and investors seek to avoid the tax. Taxing both debt and equity instruments will also reduce distortion of investment and financing decisions. Given a revenue target, a broad base will also permit a lower rate, which in addition to reducing distortions will reduce incentives for specific classes of financial market participants to seek exemption from the STT. In general, it is not possible to design an STT that imposes the same tax burden on all financial contracts that deliver the same economic outcomes. Financial theory, such as “put-call parity,” shows that economically identical contracts can be structured in myriad ways that have varying transactional intensity and would thus incur different amounts of transaction tax (Campbell and Froot, 1993). In selecting an STT base and rate for different derivatives, arbitrage opportunities should of course be taken into account, but since weaving a seamless transaction tax regime is impossible, practical considerations such as taxing readily identifiable quantities should play a significant role. 8.8 Tax Base The first decision that must be made in introducing an STT is to what financial instruments it should apply: stocks, bonds, foreign exchange and/or their derivatives. In choosing the base, the relationship between taxed and untaxed instruments should be considered. For example, taxing equities without taxing bonds could strengthen the debt bias imposed by the deductibilty of interest but not of the return to equity under the standard corporate income tax (IMF, 2009). Not taxing debt instruments could complicate the base of a tax on foreign exchange, since products such as foreign exchange swaps combine elements of foreign exchange trading with fixed income investment. Taxing securities without taxing their derivatives could result in
Financial Sector Taxation: The IMF’s Report to the G-20 and Background Material
169
migration of trade from the spot market to derivatives markets, with an accompanying increase in leverage and risk. To limit such distortions, an STT should be applied to transactions in all types of traded securities—equity, debt and foreign exchange—and their derivatives. Taxation of public sector debt is likely to be controversial, however. Imposing higher transaction costs on sovereign debt will raise government borrowing costs, and so could potentially generate a net fiscal loss. Where government bonds markets are not well developed, reducing their liquidity could also interfere with their provision of a pricing benchmark. Failure to tax public bonds in the same manner as private bonds would, however, draw liquidity out of the private bond market, raising capital costs for private issuers. 8.9 Derivatives
As noted above, an STT applied to securities should also be applied to their derivatives to prevent trading activity from migrating from spot to derivatives markets.177 One example of this is the U.K. market for “contracts for difference” (CFDs), short-term equity swaps that, because they are cash-settled, do not result in share purchase and therefore incur no stamp duty. The U.K. market for CFDs has grown rapidly since its inception in the early 1990s, in part due to its exemption from stamp duty.178 Similarly, the Brazilian foreign exchange tax has spurred the creation of an (untaxed) cash-settled futures market that is large relative to the (taxed) spot market for the Brazilian real. What is the appropriate tax base for derivatives? On-market futures and swaps have zero market value when initiated, so this cannot serve as their base. Futures and forwards, which incur a certain obligation to deliver the underlying (or its cash value) at a certain point in the future, can be taxed either on the basis of the spot price or upon the delivery price. These two prices are closely linked: the delivery price is in theory equal to the initial spot price compounded forward to the maturity date at the risk-free rate plus (minus) any cost (benefit) of carrying the underlying commodity or security. The U.K. and India, which levy stamp duty on equity futures, tax them on the basis of the delivery price. Swaps, which represent a 100 percent leveraged investment in the reference asset, could be taxed on their notional value. In theory, swaps should even be taxed at twice the rate of trades in the underlying security, since they represent offsetting long and short positions in that asset. Swaps
177If the cost of an STT is capitalized into securities values, then the value of those securities’ derivatives will be reduced. However, this does not mean that derivatives can be exempted from taxation with no effect. Taxing only the spot market will drive trading into untaxed derivatives markets, lowering the capitalized discount of the tax in the spot market. In the extreme, except for initial issuance of securities (which may be exempt under the STT), all trading would take place in derivatives markets; the capitalized discount of the STT would be zero; and the tax would collect no revenue and have no impact on securities prices. 178In 2009, CFDs accounted for 40 percent of trading on the London Stock Exchange (City Credit Capital, 2010).
Financial Sector Taxation: The IMF’s Report to the G-20 and Background Material
170
present a unique enforcement challenge: Since no principle changes hands, an obvious way to avoid an STT applied to the notional principle of a swap would be to divide the principle by an arbitrarily large factor and multiply all its payments by the same factor. This would leave the cash flows of the instrument unchanged but arbitrarily shrink the size of the tax base. Therefore STT legislation should specify that if swap cash flows are multiplied by a factor, the notional principle on which the tax is based should also be multiplied by the same factor. Since most swaps specify a market rate (e.g., LIBOR or the return on a particular equity) on at least one leg of the swap, this anti-abuse rule would likely stem most abuses; it may sometimes be necessary, however, to “normalize” some swap rates to a market rate of return. Options have several parameters: the option’s initial market value, or premium; the strike price, at which the option holder may buy or sell the underlying security; and the spot price or notional value of the underlying security.179 An option may be taxed on the value of the premium, plus the value of the strike price, if executed (as in India). Alternatively, only the strike price may be taxed, if executed (as in the U.K.). Or, option transactions could be taxed on the spot value of the underlying at the time of the transaction. In selecting a tax regime for options, tax arbitrage opportunities among options, futures and spot trades must be taken into account. Taxing option transactions on their full notional value will have the effect of penalizing their inherent leverage, since the premium for out-of-the-money options (which carry the most leverage) is a fraction of the underlying’s notional value. Figure 1 shows the tax revenue generated by these different regimes on three hypothetical transactions, with an STT rate of one percent: (1) purchase of a stock at $100 and its subsequent sale (“spot trade”); (2) purchase of an at-the-money one-year option for that stock and its subsequent sale, if profitable (“option trade”); and (3) purchase of an at-the-money option on that stock and its subsequent exercise, if profitable (“option exercise”). The “spot trade, spot tax” case shows the STT revenue collected on purchase and sale of the stock, as the underlying spot price varies. The “option trade, spot tax” shows the revenue collected from purchase and sale of the option, where the tax base is the market value of the underlying stock. It differs from the first regime only because, for low values of the underlying, it does not pay the option holder to sell the option if the STT incurred by doing so exceeds the premium value; instead, the option is allowed to expire. The “option trade, premium tax” case shows the revenue from an STT levied on the option premium from purchase and sale of the option. It reflects the typical convex relationship of call option value to the underlying spot price. The “option exercise, premium and strike tax” show the revenue from an STT levied on both premium and strike price.
179The premium may be a small fraction of the spot price for an out-of-the-money option. For a call option, the premium varies negatively with the strike price, while the reverse is true for a put option. If an option matures out of the money, it is not executed and the strike price is never paid.
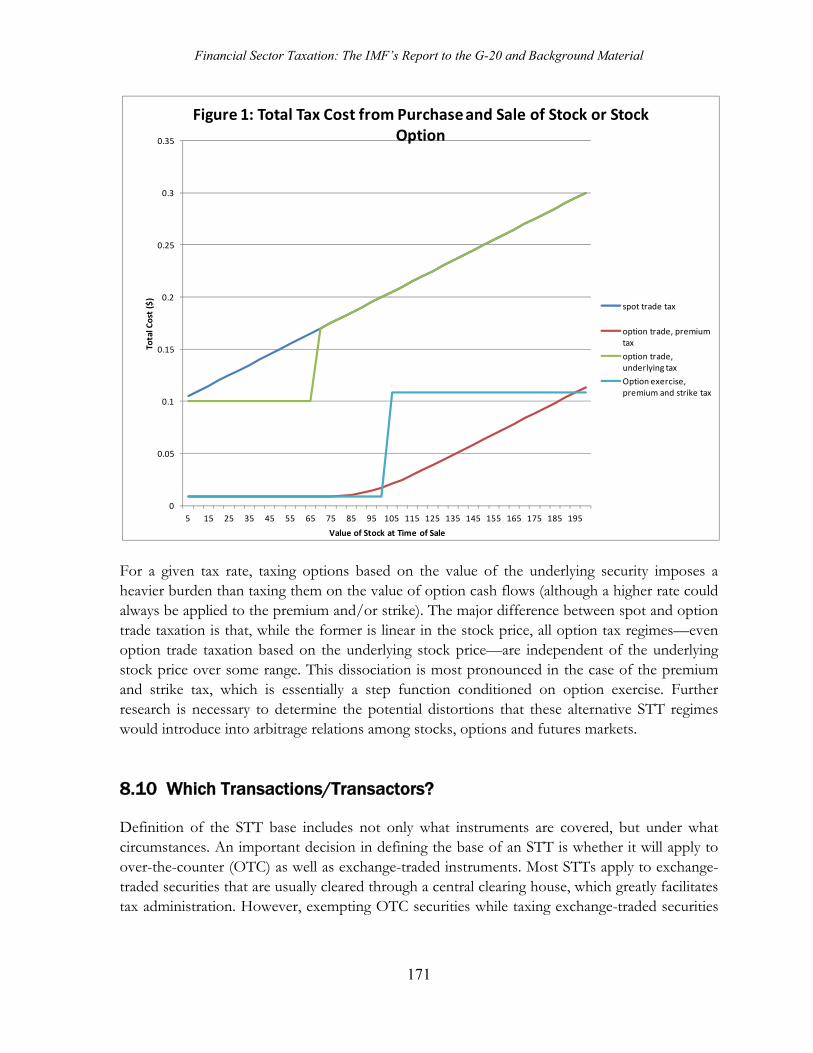
Financial Sector Taxation: The IMF’s Report to the G-20 and Background Material
171
For a given tax rate, taxing options based on the value of the underlying security imposes a heavier burden than taxing them on the value of option cash flows (although a higher rate could always be applied to the premium and/or strike). The major difference between spot and option trade taxation is that, while the former is linear in the stock price, all option tax regimes—even option trade taxation based on the underlying stock price—are independent of the underlying stock price over some range. This dissociation is most pronounced in the case of the premium and strike tax, which is essentially a step function conditioned on option exercise. Further research is necessary to determine the potential distortions that these alternative STT regimes would introduce into arbitrage relations among stocks, options and futures markets. 8.10 Which Transactions/Transactors?
Definition of the STT base includes not only what instruments are covered, but under what circumstances. An important decision in defining the base of an STT is whether it will apply to over-the-counter (OTC) as well as exchange-traded instruments. Most STTs apply to exchange-traded securities that are usually cleared through a central clearing house, which greatly facilitates tax administration. However, exempting OTC securities while taxing exchange-traded securities
0
0.05
0.1
0.15
0.2
0.25
0.3
0.35
5 15 25 35 45 55 65 75 85 95 105 115 125 135 145 155 165 175 185 195
Tota
l Co
st (
$)
Value of Stock at Time of Sale
Figure 1: Total Tax Cost from Purchase and Sale of Stock or Stock Option
spot trade tax
option trade, premium tax
option trade, underlying tax
Option exercise, premium and strike tax
Financial Sector Taxation: The IMF’s Report to the G-20 and Background Material
172
provides an incentive for more securities to be traded over the counter, which has non-fiscal costs in terms of less transparency to financial market participants (HM Treasury, 2009).180 To provide an incentive for standardized products to be traded on exchanges, governments might even wish to apply a higher STT rate to OTC instruments; however, a tax on OTC products would likely be more costly to administer and enforce, since financial institutions would have to report their own transactions rather than remit the tax through a clearing house.
Countries implementing an STT must also choose whether to tax original issuance, only secondary market trades, or both. The U.S. transactions tax abolished in 1965, for example, taxed both issuance and secondary market trades, but levied a higher rate on issuance (10 basis points, vs. 4 basis points on secondary market trades). The difference between a capital levy and an STT on secondary market trades is that the latter burdens more actively traded securities (usually those of larger issuers) more heavily, since their anticipated higher turnover produces a greater tax discount. A uniform tax on securities issuance may therefore be fairer insofar as it levies the same charge on the issuance of all types of companies; conversely, taxing large issuers more heavily could be viewed as leveling the playing field for smaller issuers, who generally face a higher cost of capital due to the lower liquidity of their securities. In fixed-income markets, the question of taxing original issuance vs. secondary trades highlights the distinction between loans and bonds. Traditionally, only bonds were traded, while loans (including mortgages) were held by the original lender. Accordingly, a tax on secondary trading would apply only to bonds. The issue here is similar to that with stocks: For issuers of a minimum size, the cost of issuing bonds is lower than that of issuing debt, so large companies face a lower cost of capital than small companies who are restricted to the loan market. Imposition of an STT on secondary market trades would therefore raise the cost of capital for larger companies that issue bonds relative to smaller companies (who are restricted to borrowing in the loan market). Current practices in fixed-income markets, however, complicate the distinction between (non-traded) loans and (traded) bonds. With securitization, many types of loans—e.g., mortgages, consumer, automotive, and commercial—are contributed to a securitization trust, whose tranches are tradable securities. Even if originations are exempted under an STT, securitizations should be taxed like secondary trades in order to prevent discontinuities between the bond and CDO markets. In the bond market, liquidity has migrated over the past two decades from trading in bonds to trading in credit and interest rate swaps. The average rate of total U.S. bond market turnover has consequently fallen from 8.5 times per year in 2005 to 5.9 times per year in 2009.181 Rather than engage in transactions involving an exchange of principal, fixed-income investors increasingly
180In recognition of this, the Obama administration has set a goal of encouraging more derivatives to become exchange-traded (U.S. Treasury, 2009). 181SIFMA, www.sifma.org/research
Financial Sector Taxation: The IMF’s Report to the G-20 and Background Material
173
find it cheaper to remain fully invested and tailor their interest rate and credit exposures in the swap market. This development highlights the importance of taxing derivatives as well as the underlying securities to avoid exacerbating the migration of trading from securities to derivatives markets. Since many derivatives, particularly OTC products, do not trade actively, an STT should cover their initial issuance as well as any subsequent trades. Trades in pass-through entities that pool or securitize taxable securities, including investment trusts (e.g., unit trusts, mutual funds, and exchange-traded funds), should be subject to an STT. Otherwise, the STT could be avoided by pooling securities that would be taxed if traded individually and trading them in a trust. For this reason, trades in investment trusts are taxable under the UK stamp duty.182 However, taxation of pooled investment funds that actively trade securities poses the problem of whether to tax trades by the fund, trades of shares of the fund itself, or both. Taxing both would lead to double taxation, but taxing only at one level or the other would create opportunities for avoidance. If only fund trades were taxed, then funds could hold narrow portfolios that investors could buy and sell tax-free; if only fund shares were taxed, then investors could avoid tax by holding actively managed funds.183 Designation of the STT base can greatly influence its elasticity and the consequent erosion of revenues over time. For example, the Swedish transaction tax on equities, in effect from 1984 through 1991, was only levied on trades placed through registered Swedish brokers and thus functioned as a type of sales tax on Swedish brokerage services.184 As such, it was easily avoided by using non-Swedish brokers to trade Swedish equities, and much of the volume from the Swedish stock exchange migrated to London. By contrast, the U.K. stamp duty is a tax on the registration of shares in U.K. registered companies. Investors purchasing shares in U.K. companies anywhere in the world must pay stamp duty in order to ensure their legal claim on the shares. There is therefore less incentive for share trading to migrate outside the home country. Generally speaking, the base of an STT should be set as comprehensively as possible in order to deter avoidance, and should also take advantage of legal and administrative handles (such as share registration or contract recognition) to ensure compliance. The evolution of centralized clearance mechanisms in most major financial markets can provide an important handle for STT administration.185 STT proponents note that these mechanisms can make STT extremely cost-efficient to administer: For example, the U.K. stamp duty, collected largely through the CREST central clearance system, costs 0.09 pence per pound sterling to collect, vs. an all-tax average cost of 1.11 pence. However, since financial trading mechanisms are in a state of constant flux, the base of an STT should not be defined in relation to any particular market structure. The past two decades have been marked by rapid innovation not only in financial products but also in trading platforms due to technological innovation and
182Taxation of unit trusts under the U.K. stamp duty is subject to certain restrictions. HM Treasury (2010). 183Kiefer (1990). 184The Swiss transactions tax shares this structure. 185A separate paper is planned on administrative aspects of FTTs.
Financial Sector Taxation: The IMF’s Report to the G-20 and Background Material
174
increasing global integration. Numerous new exchanges, notably electronic platforms such as Archipelago (now part of the NYSE), have arisen to challenge traditional trading floors. This has been accompanied by intense mergers and acquisition activity, such as the formation of Euronext from the Amsterdam, Brussels and Paris bourses and its merger with NYSE. Design of an STT should take this type innovation into account, and not apply a tax on the basis of existing trading or clearance structures, since these may soon give way to new forms. In addition to determining which transactions are covered by an STT, its designers may exempt certain transactions based on the status of the transactor. For example, to avoid tax cascading, U.K. stamp duty provides “intermediary relief” to market-makers in equities. This provides a blanket exemption for bank trading in U.K. equities, including proprietary trading for the bank’s own profit. (It is not, however, a blanket exemption for all financial institutions: Hedge funds, pension funds and insurance companies are subject to stamp duty, but registered charities are not.) While reduction of cascading is a sound reason for exempting trades by financial intermediaries, providing a complete exemption for all their trades undermines the STT base and invites avoidance. To the extent possible, financial institutions should be taxed on trades undertaken for their own account, although in practice these may be difficult to distinguish from intermediary trades, since many banks combine trading and market-making activities.
Another important consideration in base definition is territoriality. An STT may be applied to transactions based on the location of the trade, the nationality of the transactors, and/or the nationality of the securities issuer. The definition of the tax’s territoriality will have implications for potential evasion and administrability. A tax that applies to transactions on a particular country’s financial exchanges may drive trading activity offshore. A tax that applies to all trades made by a country’s taxpayers, regardless of the trading location, would in theory avoid this incentive, but there would be an obvious compliance problem with regard to the reporting of offshore transactions. 8.11 Tax Rate Decisions to be made in selecting an STT rate include whether to use an ad valorem or flat rate structure, and whether to tax different markets at different rates according to the elasticity of their base or their non-tax transaction costs. Most STTs are ad valorem, based on the value of the traded security, although some are structured as flat fees. For example, New York State levies a tax of up to five cents per share on within-state stock trades with a cap of $350 per trade,186 and in 1993 the Clinton Administration proposed a fixed 14-cent tax on trades of futures and options on futures. Relative to the more commonly seen ad valorem rate structure, fixed-rate STTs tax small trades and/or trades in low-value securities more heavily than large trades. They thus encourage order aggregation, which 186Since 1981, the New York State tax, which was enacted in 1905, has been subject to full rebate upon application.
Financial Sector Taxation: The IMF’s Report to the G-20 and Background Material
175
would counteract the current trend toward “order shredding”, or breaking large trades into small packets, which has resulted from trading automation. Insofar as order shredding aims at minimizing the market impact of trade execution, order aggregation may undermine trading efficiency. Another consideration in setting STT rates is their relationship to non-tax transaction costs. Imposing the same rate of tax on notional values traded in markets with different pretax transaction costs will raise total transaction costs proportionately more in markets with lower initial trading costs. If policymakers wish to tax transactions on the basis of their resource costs, or to minimize disruption of pretax patterns of trade, they may choose to impose lower rates of tax on markets with lower pretax transactions costs. Pollin, and others (2002) proposed such a tax for the U.S., and some countries appear to have followed this principle in designing STTs. India, for example, taxes stock option premiums and futures prices at lower rates than stocks (1.7 basis points vs. 12.5 basis points). However, as Campbell and Froot (1993) point out, market resource costs may include externalities. If leverage is believed to be a source of systemic risk, then policymakers may not wish to apply low tax rates to derivatives, whose structure contains inherent leverage, even though they tend to have low transaction costs. Similarly, OTC markets are generally more opaque than registered exchanges, offering less pricing and positional information to both transactors and regulators. Partly on account of this informational asymmetry, spreads in OTC markets tend to be higher than on exchanges, as market makers both earn higher rents and demand compensation for greater risk. The same rate STT applied to both exchange-traded and OTC products will therefore increase costs on OTC markets proportionately less, but policymakers may wish to raise them at least proportionately in order to push as many transactions as possible onto exchanges.187 In the bond market, the impact of a uniform STT may vary according to the maturity of the instrument. If, for example, only original issuance were taxed, then one ten-year bond would pay ten times less tax than ten one-year bonds with the same principle amount. This could induce issuers to issue longer maturities, altering their risk profiles. This problem also applies to swaps. Due to this distortion, some countries (e.g., Sweden) have set a lower rate on short-term paper than longer-term paper. Similarly, Pollin, and others (2002) propose multiplying a base STT rate on bonds and swaps by the number of years to maturity. As long-term bonds mature, they would need to be subjected to lower rates of transaction tax. 187In selecting the OTC rate, however, policymakers must take into account the higher compliance and enforcement costs for OTC transactions, which may offset the benefit of discouraging opacity.
Financial Sector Taxation: The IMF’s Report to the G-20 and Background Material
176
8.12 Multilateralism This evaluation has generally assumed that individual governments are responsible for imposing STTs, since fiscal policy is generally determined at the national level. However, the ever increasing integration of world financial markets and consequent global impact of the recent financial crisis have led G-20 countries to consider greater fiscal coordination, particularly with regard to financial sector taxation (IMF, 2010). International fiscal coordination raises challenging governance issues, including allocation of the authority to determine the tax rate and base, which are beyond the scope of this report. However, the effect of international coordination on revenue collection and allocation will be briefly considered. Unilateral STTs, even if levied on fairly narrow bases, are certainly feasible as witnessed by their use in numerous developed countries. The fact that major financial centers such as the U.K., Switzerland, Hong Kong, Singapore, and South Africa levy forms of STTs indicates that such taxes do not automatically drive out financial activity to an unacceptable extent. Indeed, given the apparent agglomeration effects in financial activity, established financial centers may face a less elastic base than peripheral countries. Other factors than taxes, including regulatory regimes, legal institutions, and clientele location, also impact the cost of transacting in a particular financial center. Nonetheless, since increasing cross-border integration of financial markets presents a challenge to the imposition of unilateral STTs, collaborate in imposing an STT will reduce the elasticity of the tax base and enhance revenue collection. Given the movement to introduce an STT or CTT on a multilateral basis, the question arises as to how the revenue from such a multilateral tax should be apportioned. Since financial activity tends to concentrate in certain locations, countries such as the U.K. that host major financial centers will have greater capacity to raise revenue with an STT than others, whose companies and investors may transact in foreign financial centers. If there is a multinational agreement to enact an STT or CTT and the relative size of pact members’ financial sectors is disproportionate to their GDP, then total revenue from the tax could be reallocated according, for example, to the member countries’ GDP or total use of financial services. 8.13 Conclusions and Policy Recommendations The two main purposes for which an STT is generally promoted are revenue raising and financial market regulation. To raise a given level of revenue, using a more efficient tax instrument causes fewer economic distortions and thus allows higher income and welfare levels. Because gross transaction taxes are inefficient, distorting production and cascading through the supply chain in unpredictable ways, more efficient tax measures should be considered before an STT, such as broadening the base of an existing VAT or introducing an FAT. This is also the case if the policy goal is to reduce income inequality by taxing high profits and compensation in the financial sector.
Financial Sector Taxation: The IMF’s Report to the G-20 and Background Material
177
An STT is also an inefficient instrument for regulating financial markets. Empirical research shows that STTs reduce trading volume, which reduces liquidity and may slow price discovery, and do not reduce short-term price volatility. While more research is needed to determine the effect, if any, of transaction costs on the formation of asset bubbles, economic literature currently posits that bubbles are caused by excessive leverage, not excessive transactions. Instruments that explicitly target leverage, such as higher margin and collateral requirements, would therefore be more specific to addressing this issue than an STT. An STT on the notional value of derivatives, which have built-in leverage, could also help address this problem to some extent. To discourage leverage at the firm level, policymakers could reduce the debt bias from corporate income taxation and/or introduce a tax on balance-sheet debt such as the FSC. Countries that nonetheless seek to use an STT to raise significant revenue from the financial sector should apply a low rate tax to all securities and derivatives transactions, including OTC transactions, in order to minimize associated financial market distortions. Studies of existing STTs and other transaction costs suggest that the elasticity of trading volume with respect to transactions costs ranges broadly between -0.4 and -2.6, depending on the market studied. Markets with products for which there are more untaxed substitutes, such as derivatives or foreign listings, have higher elasticities. A broad-based STT will therefore be more difficult to avoid than a narrow-based tax, although the base of any STT is vulnerable to erosion over time in the face of financial innovation and international financial market integration. Due to the large size of the base, a low-rate STT on stocks, bonds, foreign exchange and their derivatives could raise substantial revenues. Current estimates of the revenue potential of a low-rate (0.5-1 basis point) multilateral CTT on the four major trading currencies suggest that it could raise about $20–40 billion annually, or roughly 0.05 percent of world GDP. A one basis point STT on global stocks, bonds and derivatives is estimated to raise approximately 0.4 percent of world GDP. To the extent that STTs are levied on a multilateral basis, their base will be less elastic than national STTs, and hence a given level of revenue can be raised with a lower rate. It is difficult to make a strong economic case for introducing a CTT, since it would raise much less revenue on a considerably more elastic base. STTs reduce security values and raise the cost of capital for issuers, particularly issuers of frequently traded securities. However, the impact of a low-rate (less than 5 basis points) STT on corporate securities would be fairly modest. If an STT of 5 bps reduced turnover on the S&P 500 to the average level of 2005 (0.8 years), it would initially lower stock values by roughly 2 percent and raise the cost of capital by 6 basis points. Since corporate bond holding periods are typically longer, the effect of a same-rate tax on debt finance would be less.188 The impact on financial markets from a low-rate, broad-based (applying to OTC and derivatives trades) STT would likely be fairly modest, beyond its reduction of very short-term trading. 188SIFMA data (http://www.sifma.org/research) indicate that the average holding period for corporate bonds in 2009 was 1.6 years.
Financial Sector Taxation: The IMF’s Report to the G-20 and Background Material
178
Multilateral introduction of such a tax would reduce cross-border distortion of trading, though it would raise challenging governance issues. However, the reduction in short-term trading would be unlikely to have any beneficial effect on market function, either. Administrative costs of an STT are likely to be low relative to other taxes, if central clearing mechanisms such as the U.K. CREST are used to collect revenues. However, to avoid pushing transactions off exchanges with the resultant increase in risk and loss of transparency, any STT on exchange-traded securities should also apply to over-the-counter transactions. In the short-run, imposition of an STT would burden current securities owners, as securities values decline. The incidence of this effect would be quite progressive. In the longer-run, the burden of an STT shifts to all capital owners, if the supply of capital is relatively inelastic. The more elastic the supply of capital, the more the long-run burden of an STT would fall on labor, as the capital stock and labor productivity shrank. Financial activity, particularly short-term trading, would fall in response to a broad-based STT, lowering financial sector profits. Release of resources from the contracting financial sector could lower the equilibrium return to highly skilled labor. Financial firms would likely pass the cost of STT on surviving activity on to clients. An STT would impose higher costs on entities that use finance more intensively, such as financial institutions, institutional investors (including pension funds), publicly listed companies, and firms involved in cross-border trade and investment. As a tax on gross transactions, the STT would cascade through financial activities, so although it applied a low rate to a broad base, its cumulative impact in certain activities could be substantial.
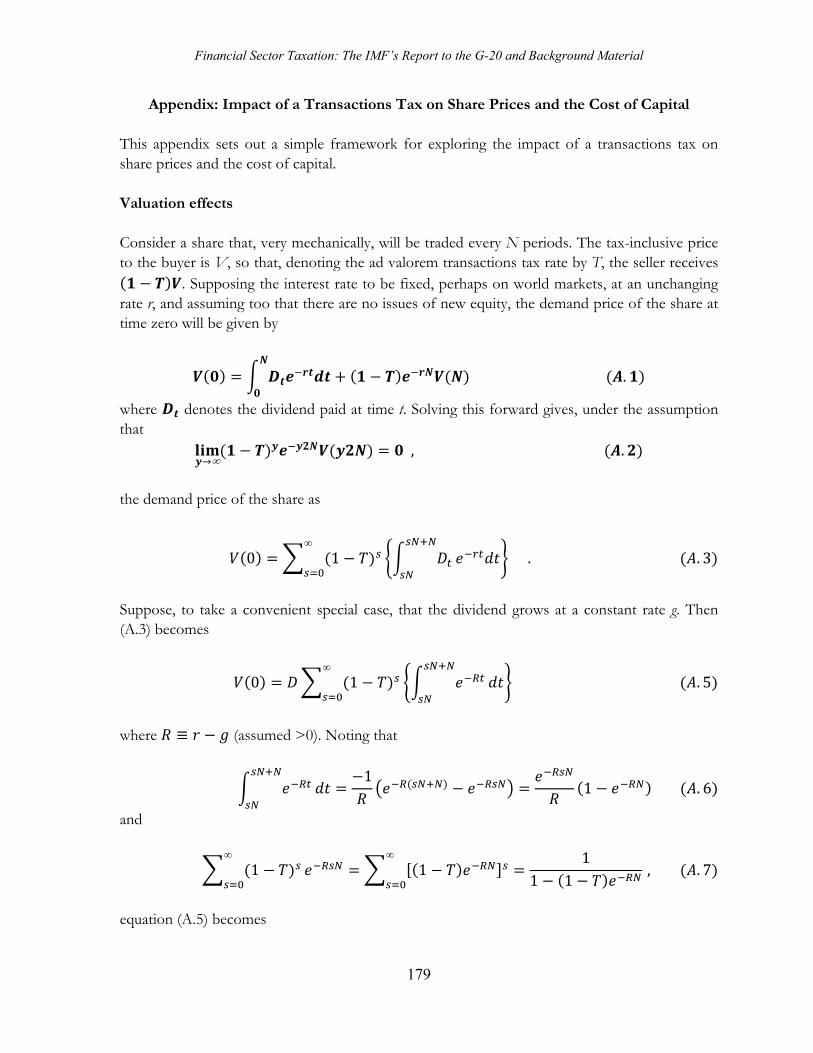
Financial Sector Taxation: The IMF’s Report to the G-20 and Background Material
179
Appendix: Impact of a Transactions Tax on Share Prices and the Cost of Capital This appendix sets out a simple framework for exploring the impact of a transactions tax on share prices and the cost of capital. Valuation effects Consider a share that, very mechanically, will be traded every N periods. The tax-inclusive price to the buyer is V, so that, denoting the ad valorem transactions tax rate by T, the seller receives
. Supposing the interest rate to be fixed, perhaps on world markets, at an unchanging rate r, and assuming too that there are no issues of new equity, the demand price of the share at time zero will be given by
.
where denotes the dividend paid at time t. Solving this forward gives, under the assumption that
∞ , .
the demand price of the share as
0 1∞
. . 3
Suppose, to take a convenient special case, that the dividend grows at a constant rate g. Then (A.3) becomes
0 1∞
. 5
where (assumed >0). Noting that
11 . 6
and
1∞
11
1 1
∞
, . 7
equation (A.5) becomes

Financial Sector Taxation: The IMF’s Report to the G-20 and Background Material
180
01
1 1 . . 8
Since the asset price in the absence of taxation is D/R, the proportional reduction in its (buying) price due to the tax is
∆ 11
1 1 . 9
1 1 . 10
which is increasing (as one would expect) and concave in T, the implication of the latter being that the marginal proportional reduction in price from the tax is greater the lower is the initial tax rate. A further sense of the likely valuation effects comes on using the approximation 1 in (A.8) to find
V 01 1 1 1 , . 11
so that, taking 0, the valuation effect of the transaction tax is like an increase in discount rate by an amount 1/ Effect on the cost of capital The framework above is not well-suited to deriving the impact of the tax on investment incentives, since the tax has no impact on policies that affect dividends only in the interval in which the tax is not traded. As an alternative approach, note from (A.5) that the transactions tax acts like a permanently increasing dividend tax rate (starting from a level of zero). Exploiting this analogy, suppose that (again assuming no new equity sales) that the firm’s maximand is
1 1 . 12
where is the dividend tax rate at t and dividends are given by ,, where I denotes investment and 1 the capital stock, with being its rate of deprecation (the further assumption being made here of no debt finance). The maximand can then be written
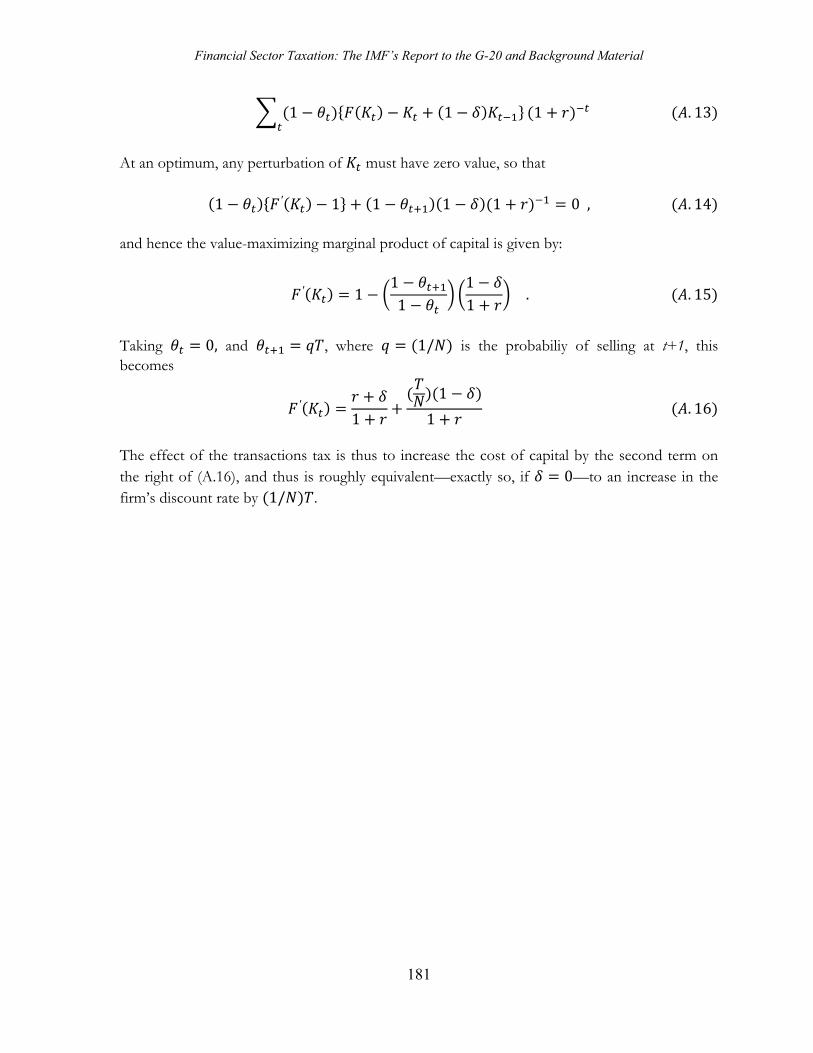
Financial Sector Taxation: The IMF’s Report to the G-20 and Background Material
181
1 1 1 . 13
At an optimum, any perturbation of must have zero value, so that
1 ′ 1 1 1 1 0 , . 14 and hence the value-maximizing marginal product of capital is given by:
′ 111
11
. . 15
Taking 0, and , where 1/ is the probabiliy of selling at t+1, this becomes
′
1
1
1 . 16
The effect of the transactions tax is thus to increase the cost of capital by the second term on the right of (A.16), and thus is roughly equivalent—exactly so, if 0—to an increase in the firm’s discount rate by 1/ .
Financial Sector Taxation: The IMF’s Report to the G-20 and Background Material
182
References Adrian, T., and H.S. Shin, 2009, “The Shadow Banking System: Implications for Financial
Regulation,” Federal Reserve Bank of New York Staff Reports, No. 382. Akerlof, and Shiller, 2008, Animal Spirits (Princeton, NJ: Princeton University Press). Allen, F., and D. Gale, 2000, “Bubbles and Crises,” The Economic Journal, 110, January,
pp. 236-55. Amihud, Y., and H. Mendelson, 1992, “Transaction Taxes and Stock Values, In Modernizing
U.S. Securities Regulations, ed., by Kenneth Lehna and Robert Kamphius ( Burr Ridge, Illinois: Irwin Professional Publishing), pp. 477–502.
Amihud, Y., H. Mendelson, and L. H. Pedersen, 2005, “Liquidity and Asset Prices,” Foundation
and Trends in Finance, Vol. 1(4): pp. 1–96. Arbelaez, M.A., L. Burman, and S. Zuluaga, 2002, “The Bank Debit Tax in Colombia,” Mimeo
(Washington: International Monetary Fund). Arivoshi, A., and others, “Capital Controls: Country Experiences with their Use and
Liberalization,” IMF Occasional Paper No. 190 (Washington: International Monetary Fund).
Barber, B., and T. Odean, 2000 “Trading Is Hazardous to Your Wealth: the Common Stock
Investment Performance of Individual Investors,” Journal of Finance Vol. 55(2): pp. 773–806.
———, 2001, “Boys Will be Boys: Gender, Overconfidence, and Common Stock Investment,”
Quarterly Journal of Economics, Vol. 116(1): pp. 261–92. Barlevy, G., 2008, “A Leverage-based Model of Speculative Bubbles,” Federal Reserve Bank of
Chicago, WP 2008–01. Balta gi, B, D. Li, and Q Li, 2006, “Transaction Tax and Stock Market Behavior: Evidence from
an Emerging Market,” Empirical Economics 31: pp. 393–408. Block, S., 2007, “The Liquidity Discount in Valuing Privately Owned Companies,” Journal of
Applied Finance, Vol. 17(2): pp. 33–40. Bond, S., M. Hawkins, and A. Klemm, 2004, “Stamp Duty on Shares and its Effect on Share
Prices,” Institute for Fiscal Studies, London, Working Paper WP04/11.
Financial Sector Taxation: The IMF’s Report to the G-20 and Background Material
183
Campbell, J., and K. Froot, 1993, “International Experience with Securities Transaction Taxes,” NBER Working Paper 4587.
Chou, R., and G. Wang, 2006, “Transaction Tax and Market Quality of the Taiwan Stock Index
Futures,” Journal of Futures Markets, Vol. 26(12): pp. 1195–1216. City Credit Capital, 2010, “Introduction to Contracts for Difference,” [email protected]. De Long, B., A. Schleifer, L. Summers, and R. Waldmann, 1989, “Positive Feedback Investment
Strategies and Destabilizing Rational Speculation.” NBER Working Paper 2880. ———, 1990, Noise Trader Risk in Financial Markets, Journal of Political Economy, Vol. 98(4), pp.
703–28. Diamond, P., and J. Mirrlees, 1971, “Optimal Taxation and Public Production 1: Production
Efficiency,” American Economic Review, Vol. 61(3): pp. 8–27. Dupont, D., and G. Lee, 2007, “Effects of Securities Transaction Taxes on Depth and Bid-Ask
Spread,” Economic Theory, Vol. 31, pp. 393–400. Epps, T., 1976, “The Demand for Brokers’ Services: the Relation between Security Trading
Volume and Transaction Cost,” Bell Journal of Economics, Spring, pp. 163–94. European Commission, 2006, IP/06/1673, http://europa.eu. European Parliament, Directorate General for Internal Policies, 2010, “Financial Transaction
Tax: Small is Beautiful” (Brussels). Financial Times, 2010, “FSA Head’s Tough Stance Likely to Unsettle the City,” www.FT.com,
March 18. French, K., and R. Roll, 1986, “Sotck Return Variances: The Arrival of Information and the
Reaction of Traders,” Journal of Financial Economics, Vol. 17, pp. 5–26. Frino, A., and A. West, 2003, “The Impact of Transaction Costs on Price Discovery: Evidence
from Cross-listed Stock Index Futures Contracts,” Pacific Basin Finance Journal, Vol. 11, pp. 139–51.
Froot, and Perold, 1995, “New Trading Practices and Short-Run Market Efficiency,” Journal of
Futures Markets, Vol. 15(7), pp. 731–65. Froot, K., D. Scharfstein, and J. Stein,1992, “Herd on the Street: Informational Inefficiencies in
a Market with Short-Term Speculation,” Journal of Finance, Vol. 47(4): pp. 1461–1484.
Financial Sector Taxation: The IMF’s Report to the G-20 and Background Material
184
Geanakoplos, J., 2010, “Solving the Present Crisis and Managing the Leverage Cycle,” Yale University, Cowles Foundation Discussion Paper No. 1751.
Gehrig, T., and L. Menkhoff, 2007, “Extended Evidence on the Use of Technical Analysis in
Foreign Exchange,” International Journal of Finance and Economics 11(4), pp. 327-38. Genser, B., and P. Winker, 1998, “Measuring the Fiscal Revenue Loss of VAT Exemption in
Commercial Banking,” Finanzarchiv, Vol. 54, pp. 563–85. Glosten, L., and P. Milgrom, 1985, “Bid, Ask and Transaction Prices in a Specialist Market with
Heterogeneously Informed Traders,” Journal of Financial Economics, Vol. 14, pp. 71–100. Gorton, G., and K.G. Rouwenhorst, 2005, “Facts and Fantasies about Commodity Futures,”
Yale International Center for Finance Working Paper No. 04–20. Green, C., P. Maggioni, and V. Murinde, 2000, “Regulatory Lessons for Emerging Stock
Markets from a Century of Evidence on Transactions Costs and Share Price Volatility in the London Stock Exchange,” Journal of Banking and Finance, Vol. 24, pp. 577-601.
Grubert, H., and J. Mackie, 2000, “Must Financial Services Be Taxed Under a Consumption
Tax?” National Tax Journal, Vol. 53(1), pp. 23–40. Habermeier, K., and A. Kirilenko, 2003, “Securities Transaction Taxes and Financial Markets,”
in Taxation of Financial Intermediation, ed., by P. Honohan (New York: Oxford University Press), pp. 325–44.
Harberger, A., “The Incidence of the Corporate Income Tax,” Journal of Political Economy
Vol. 70(3), pp. 215–40. Hau, H, 2006, “The Role of Transaction Costs for Financial Volatility: Evidence from the Paris
Bourse,. Journal of the European Economic Association, Vol. 4(4): pp. 862-90. HM Treasury, 2010, “Stamp Tax Handbook” (London). ———, 2009, “Risk, Reward and Responsibility: The Financial Sector and Society” (London). Hu, S., 1998, “The Effects of the Stock Transaction Tax on the Stock Market—Experience
from Asian Markets,” Pacific Basin Finance Journal, Vol. 6, pp. 347–64. Huizinga, H., 2002, “A European VAT on Financial Services,” Economic Policy, Vol. 35,
pp. 499–534.
Financial Sector Taxation: The IMF’s Report to the G-20 and Background Material
185
International Monetary Fund, 2010, “A Fair and Substantial Contribution: A Framework for Taxation and Resolution to Improve Financial Stability,” Draft report to the G20 (Washington: International Monetary Fund).
———, 2009, “Debt Bias and Other Distortions: Crisis-Related Issues in Tax Policy,” IMF
Board Paper (Washington: International Monetary Fund). Jones, C., and P. Seguin, 1997, “Transactions Costs and Price Volatility: Evidence from
Commission Deregulation,” American Economic Review, Vol. 87(4), pp. 728–37. Kapoor, S., D. Hillman, and S. Spratt, 2007, “Taking the Next Step—Implementing a Currency
Transaction Development Levy,” Munich Personal RePEc Archive Paper 4054. Keynes, J. M., 1936, General Theory of Employment, Interest Rates and Money (New York:
Harcourt Brace & World). Kiefer, D., 1990, “The Securities Transactions Tax: an Overview of the Issues,” CRS Report for
Congress 90–350 (Washington: Congressional Research Service). Kirilenko, A., and V. Summers, 2003, “Bank Debit Taxes: Yield vs. Disintermediation,” in
Taxation of Financial Intermediation, ed., by P. Honohan, (New York: Oxford University Press), pp. 313–24.
Kupiec, P., 1996, “Noise Traders, Excess Volatility, and a Securities Transaction Tax,” Journal of
Financial Services Research, Vol. 10: pp. 115–29. Kyle, A., 1985, “Continuous Auctions and Insider Trading,” Econometrica, Vol. 53(6),
pp. 1315–1335. Kyle, A., 2010, “Speculation, Leverage and Price Volatility,” seminar presented at the
International Monetary Fund, Washington, D.C., March 11. Liu, S., 2007, “Securities Transaction Tax and Market Efficiency: Evidence from the Japanese
Experience,” Journal of Financial Services Research, Vol. 32, pp. 161–76. McCrae, Julian, 2002, “The Impact of Stamp Duty on the Cost of Capital,” Institute for Fiscal
Studies mimeo. Mende, A., and L. Menkhoff, 2003, “Tobin Tax Effects Seen from the Foreign Exchange
Market’s Microstructure,” International Finance, Vol. 6(2), pp. 227–47. Murphy, J., 1986, “Technical Analysis of the Futures Markets,” New York Institute of Finance,
New York.
Financial Sector Taxation: The IMF’s Report to the G-20 and Background Material
186
Ostry, J., A. Ghosh, K. Habermeier, M. Chamon, M. Qureshi, and D. Reinhardt, 2010, “Capital Inflows: The Role of Controls,” IMF Staff Position Note 10/04 (Washington: International Monetary Fund).
Oxera, 2007, “Stamp Duty: Its Impact and the benefits of its Abolition,” Report prepared for
Association of British Insurers, City of London Corporation, Investment Management Association and London Stock Exchange (London).
Pellizzari, P., and F. Westerhoff, 2007, “Some Effects of Transaction Taxes Under Different
Microstructures,” University of Technology Sydney Quantitative Finance Research Centre Paper 212.
Philippon, T., 2009, “Wages and Human Capital in the U.S. Financial Industry: 1909–
2006,” NBER Working Paper 14644. Poddar, S., 2007, “VAT on Financial Services: Searching for a Workable Compromise,” mimeo. ———, and M. English, 1997, ‘Taxation of Financial Services Under a Value-Added Tax:
Applying the Cash-Flow Method,’ National Tax Journal, pp. 89–111. Pollin, R., D. Baker, and M. Schaberg, 2001, “Securities Transaction Taxes for U.S. Financial
Markets,” Political Economy Research Institute, University of Massachusetts Amherst, Working Paper 20.
Reinhart, C., and K. Rogoff, 2009, “This Time is Different: Eight Centuries of Financial Folly,”
(Princeton, New Jersey: Princeton University Press). Reuters, 2009, “High Frequency Trading Surges Across the Globe,” www.reuters.com,
December 2. Roll, R., 1989, “Price Volatility, International Market Links and Their Implication for Regulatory
Policies,” Journal of Financial Services Research, Vol. 3(2-3), Vol. 211-246. Schenk, A., 2009, “Taxation of Financial Services (Including Insurance) Under a United States
Value Added Tax,” Paper presented at the American Tax Policy Institute, (Washington, D.C.).
Schmidt, R., 2007, “The Currency Transaction Tax: Rate and Revenue Estimates” (Ottawa:
North-South Institute). Schwert, G.W., and P. Seguin, 1993, “Securities Transaction Taxes: an Overview of Costs,
Benefits and Unresolved Questions,” Financial Analysts Journal, September-October, pp. 27–35.
Financial Sector Taxation: The IMF’s Report to the G-20 and Background Material
187
Schulmeister, S., M. Schratzenstaller, and O. Picek, 2008, “A General Financial Transaction Tax:
Motives, Revenues, Feasibility and Effects,” Oesterreichisches Institut fuer Wirtschaftsforschung working paper, Vienna.
Song, F., and J. Zhang, 2005, “Securities Transaction Tax and Market Volatility,” Economic
Journal, Vol. 115: pp. 1103–1120. Spratt, S., 2006, “A Sterling Solution: Implementing a Stamp Duty on Sterling to Finance
International Development,” Stamp Out Poverty (London). Stiglitz, J., 1989, “Using Tax Policy to Curb Speculative Short-Term Trading,” Journal of Financial
Services Research, Vol. 3(2-3), pp. 101–15. Stiglitz, Joseph, 1969, “The Effects of Income, Wealth and Capital Gains Taxation on Risk-
Taking,” Quarterly Journal of Economics, Vol. 83(2), pp. 263–83. Stolper, W.F., and P.A. Samuelson, 1941, “Protection and Real Wages,” Review of Economic Studies,
Vol. 9, pp. 58–73. Strauss-Kahn, D., 1992, “Maitrisons la Mondialisation,” in La Flamme et La Cendre, Bernard
Grasset (Paris), pp. 133–65. Subrahmanyam, A., 1998, “Transaction Taxes and Financial Market Equilibrium,” Journal of
Business, Vol. 71(1), pp. 81–117. Summers, L., and V. Summers, 1989, “When Financial Markets Work Too Well: A Cautious
Case for a Securities Transaction Tax,” Journal of Financial Services Research, Vol. 3, pp. 261–86.
Tobin, J, 1978, “A Proposal for International Monetary Reform,” Eastern Economic Journal,
Vol. 4(3–4), pp. 153–59. Umlauf, S., 1993, “Transaction Taxes and the Behavior of the Swedish Stock Market,” Journal of
Financial Economics, Vol. 33, pp. 227–40. United States Department of the Treasury, 2009, “General Explanations of the Administration’s
Fiscal Year Revenue Proposals” (Washington, D.C.). Wall Street Journal, 2010, “Germany, France to Push EU for Financial Transaction Tax,” July 2. Wang, G., J. Yau, and T. Baptiste, 1997, “Trading Volume and Transaction Costs in Futures
Markets,” Journal of Futures Markets, Vol. 17(7), pp. 757–80. Zee, H., 2004, Taxing the Financial Sector (Washington: International Monetary Fund).
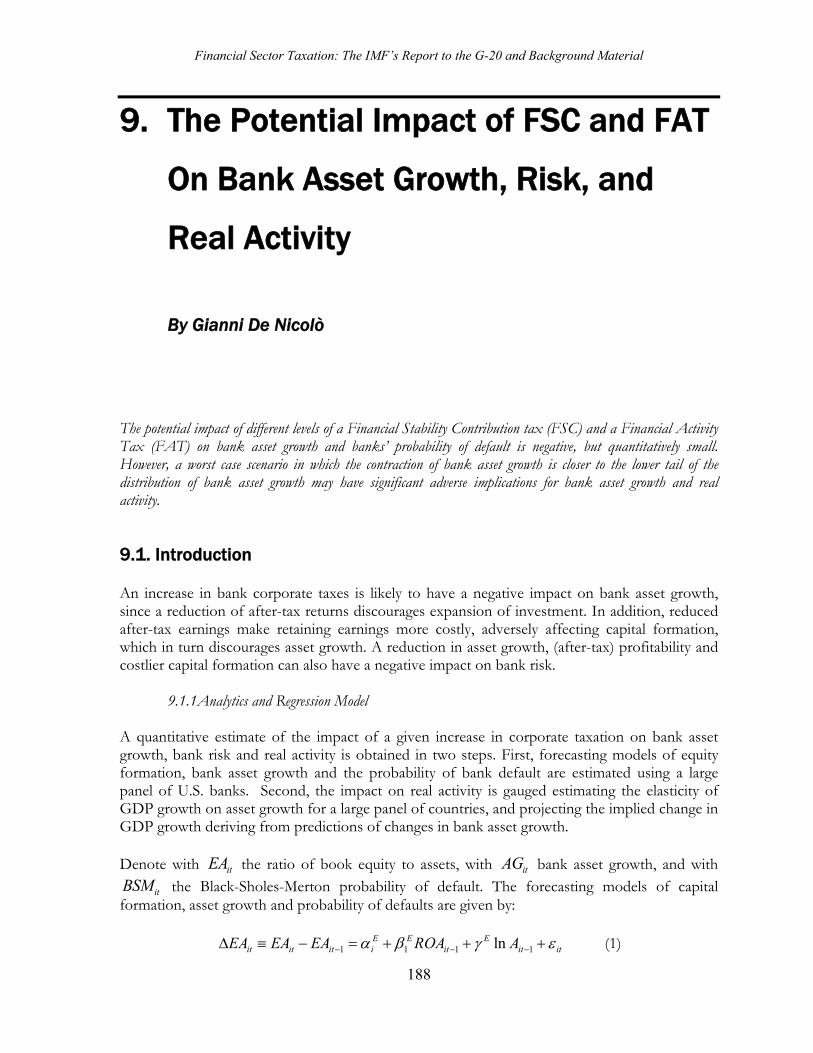
Financial Sector Taxation: The IMF’s Report to the G-20 and Background Material
188
9. The Potential Impact of FSC and FAT
On Bank Asset Growth, Risk, and
Real Activity
By Gianni De Nicolò
The potential impact of different levels of a Financial Stability Contribution tax (FSC) and a Financial Activity Tax (FAT) on bank asset growth and banks’ probability of default is negative, but quantitatively small. However, a worst case scenario in which the contraction of bank asset growth is closer to the lower tail of the distribution of bank asset growth may have significant adverse implications for bank asset growth and real activity. 9.1. Introduction An increase in bank corporate taxes is likely to have a negative impact on bank asset growth, since a reduction of after-tax returns discourages expansion of investment. In addition, reduced after-tax earnings make retaining earnings more costly, adversely affecting capital formation, which in turn discourages asset growth. A reduction in asset growth, (after-tax) profitability and costlier capital formation can also have a negative impact on bank risk.
9.1.1Analytics and Regression Model
A quantitative estimate of the impact of a given increase in corporate taxation on bank asset growth, bank risk and real activity is obtained in two steps. First, forecasting models of equity formation, bank asset growth and the probability of bank default are estimated using a large panel of U.S. banks. Second, the impact on real activity is gauged estimating the elasticity of GDP growth on asset growth for a large panel of countries, and projecting the implied change in GDP growth deriving from predictions of changes in bank asset growth.
Denote with itEA the ratio of book equity to assets, with itAG bank asset growth, and with
itBSM the Black-Sholes-Merton probability of default. The forecasting models of capital formation, asset growth and probability of defaults are given by:
1 1 1 1lnE E Eit it it i it it itEA EA EA ROA A (1)
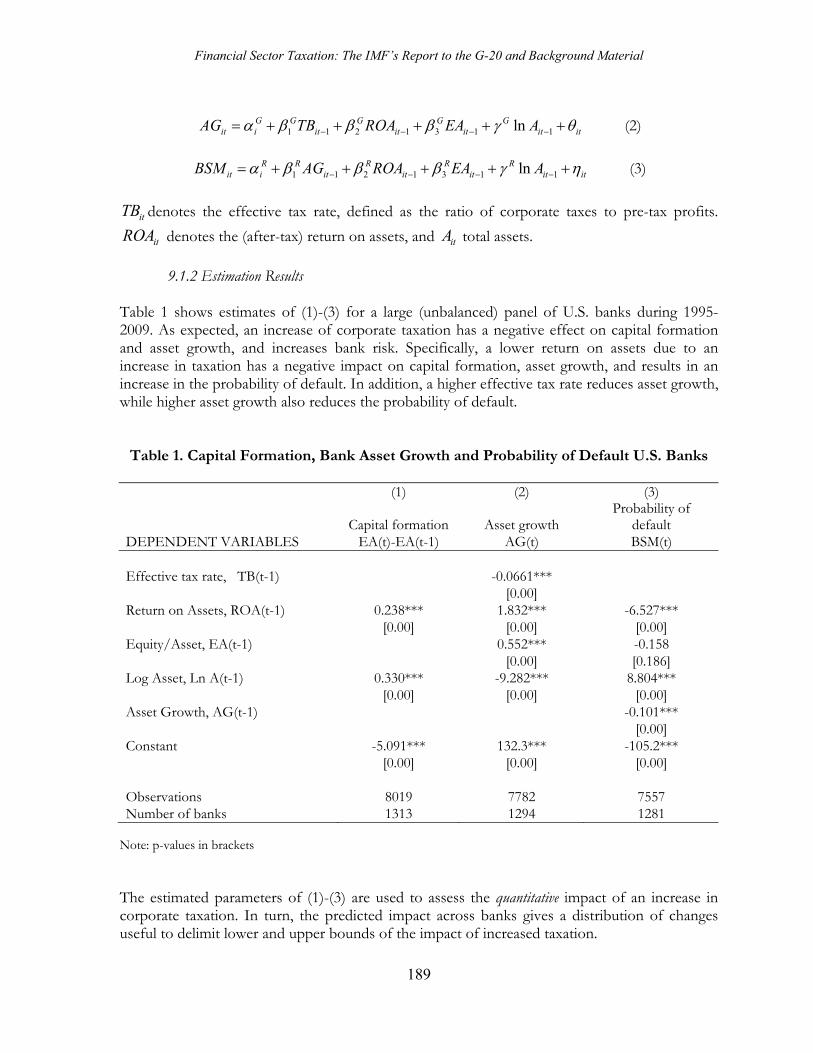
Financial Sector Taxation: The IMF’s Report to the G-20 and Background Material
189
1 1 2 1 3 1 1lnG G G G Git i it it it it itAG TB ROA EA A (2)
1 1 2 1 3 1 1lnR R R R Rit i it it it it itBSM AG ROA EA A (3)
itTB denotes the effective tax rate, defined as the ratio of corporate taxes to pre-tax profits.
itROA denotes the (after-tax) return on assets, and itA total assets. 9.1.2 Estimation Results
Table 1 shows estimates of (1)-(3) for a large (unbalanced) panel of U.S. banks during 1995-2009. As expected, an increase of corporate taxation has a negative effect on capital formation and asset growth, and increases bank risk. Specifically, a lower return on assets due to an increase in taxation has a negative impact on capital formation, asset growth, and results in an increase in the probability of default. In addition, a higher effective tax rate reduces asset growth, while higher asset growth also reduces the probability of default.
Table 1. Capital Formation, Bank Asset Growth and Probability of Default U.S. Banks
(1) (2) (3)
Capital formation Asset growth Probability of
default DEPENDENT VARIABLES EA(t)-EA(t-1) AG(t) BSM(t) Effective tax rate, TB(t-1) -0.0661***
[0.00] Return on Assets, ROA(t-1) 0.238*** 1.832*** -6.527***
[0.00] [0.00] [0.00] Equity/Asset, EA(t-1) 0.552*** -0.158
[0.00] [0.186] Log Asset, Ln A(t-1) 0.330*** -9.282*** 8.804***
[0.00] [0.00] [0.00] Asset Growth, AG(t-1) -0.101***
[0.00] Constant -5.091*** 132.3*** -105.2***
[0.00] [0.00] [0.00]
Observations 8019 7782 7557 Number of banks 1313 1294 1281
Note: p-values in brackets
The estimated parameters of (1)-(3) are used to assess the quantitative impact of an increase in corporate taxation. In turn, the predicted impact across banks gives a distribution of changes useful to delimit lower and upper bounds of the impact of increased taxation.
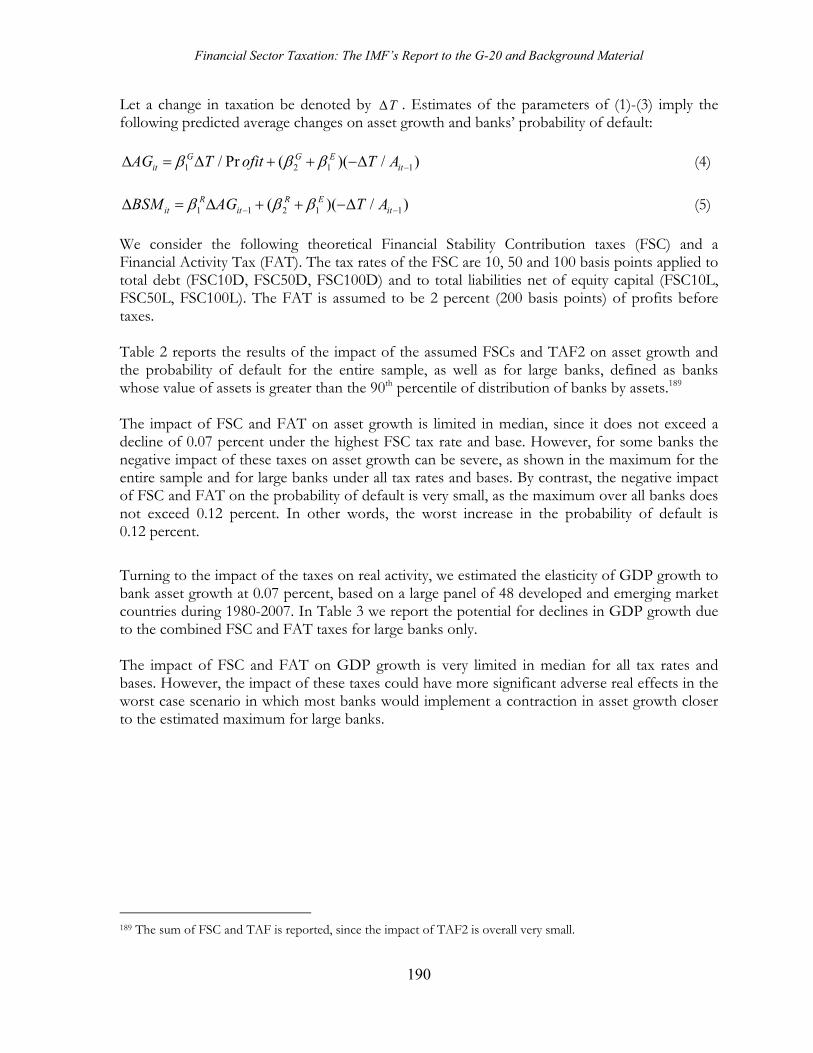
Financial Sector Taxation: The IMF’s Report to the G-20 and Background Material
190
Let a change in taxation be denoted by T . Estimates of the parameters of (1)-(3) imply the following predicted average changes on asset growth and banks’ probability of default:
1 2 1 1/ Pr ( )( / )G G Eit itAG T ofit T A (4)
1 1 2 1 1( )( / )R R Eit it itBSM AG T A (5)
We consider the following theoretical Financial Stability Contribution taxes (FSC) and a Financial Activity Tax (FAT). The tax rates of the FSC are 10, 50 and 100 basis points applied to total debt (FSC10D, FSC50D, FSC100D) and to total liabilities net of equity capital (FSC10L, FSC50L, FSC100L). The FAT is assumed to be 2 percent (200 basis points) of profits before taxes.
Table 2 reports the results of the impact of the assumed FSCs and TAF2 on asset growth and the probability of default for the entire sample, as well as for large banks, defined as banks whose value of assets is greater than the 90th percentile of distribution of banks by assets.189 The impact of FSC and FAT on asset growth is limited in median, since it does not exceed a decline of 0.07 percent under the highest FSC tax rate and base. However, for some banks the negative impact of these taxes on asset growth can be severe, as shown in the maximum for the entire sample and for large banks under all tax rates and bases. By contrast, the negative impact of FSC and FAT on the probability of default is very small, as the maximum over all banks does not exceed 0.12 percent. In other words, the worst increase in the probability of default is 0.12 percent.
Turning to the impact of the taxes on real activity, we estimated the elasticity of GDP growth to bank asset growth at 0.07 percent, based on a large panel of 48 developed and emerging market countries during 1980-2007. In Table 3 we report the potential for declines in GDP growth due to the combined FSC and FAT taxes for large banks only. The impact of FSC and FAT on GDP growth is very limited in median for all tax rates and bases. However, the impact of these taxes could have more significant adverse real effects in the worst case scenario in which most banks would implement a contraction in asset growth closer to the estimated maximum for large banks.
189 The sum of FSC and TAF is reported, since the impact of TAF2 is overall very small.
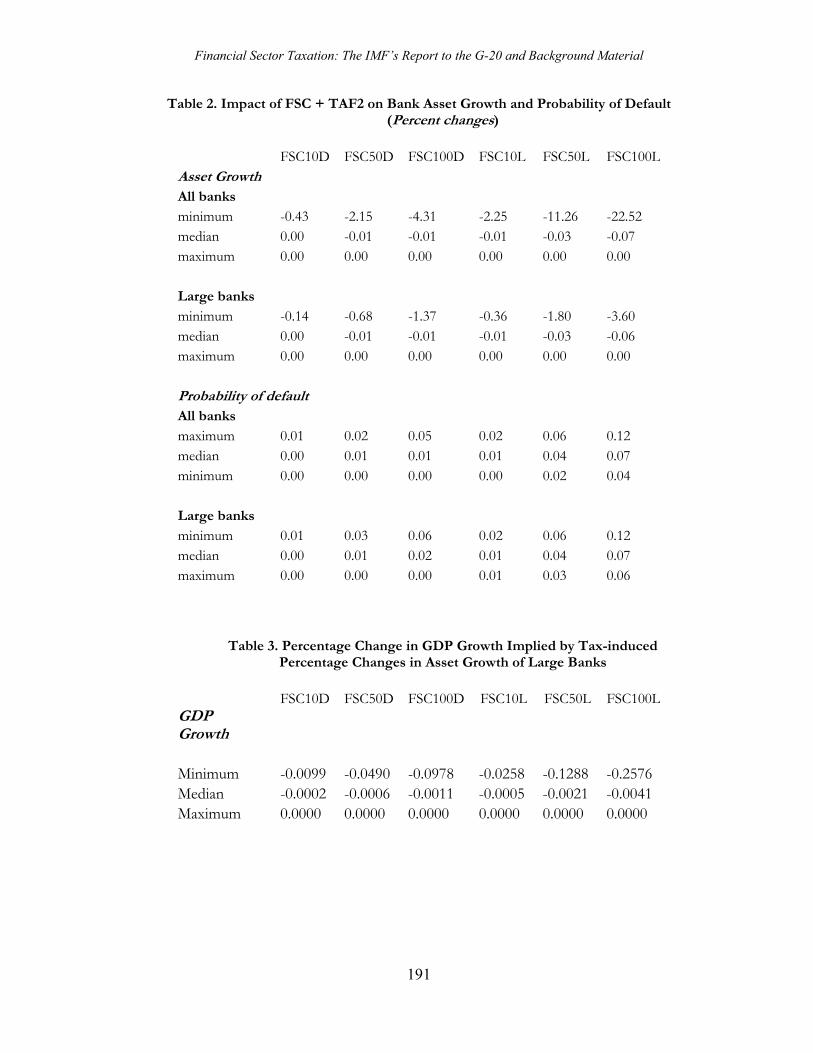
Financial Sector Taxation: The IMF’s Report to the G-20 and Background Material
191
Table 2. Impact of FSC + TAF2 on Bank Asset Growth and Probability of Default (Percent changes)
FSC10D FSC50D FSC100D FSC10L FSC50L FSC100L
Asset Growth All banks minimum -0.43 -2.15 -4.31 -2.25 -11.26 -22.52 median 0.00 -0.01 -0.01 -0.01 -0.03 -0.07 maximum 0.00 0.00 0.00 0.00 0.00 0.00
Large banks minimum -0.14 -0.68 -1.37 -0.36 -1.80 -3.60 median 0.00 -0.01 -0.01 -0.01 -0.03 -0.06 maximum 0.00 0.00 0.00 0.00 0.00 0.00
Probability of default All banks maximum 0.01 0.02 0.05 0.02 0.06 0.12 median 0.00 0.01 0.01 0.01 0.04 0.07 minimum 0.00 0.00 0.00 0.00 0.02 0.04
Large banks minimum 0.01 0.03 0.06 0.02 0.06 0.12 median 0.00 0.01 0.02 0.01 0.04 0.07 maximum 0.00 0.00 0.00 0.01 0.03 0.06
Table 3. Percentage Change in GDP Growth Implied by Tax-induced Percentage Changes in Asset Growth of Large Banks
FSC10D FSC50D FSC100D FSC10L FSC50L FSC100L
GDP Growth
Minimum -0.0099 -0.0490 -0.0978 -0.0258 -0.1288 -0.2576 Median -0.0002 -0.0006 -0.0011 -0.0005 -0.0021 -0.0041 Maximum 0.0000 0.0000 0.0000 0.0000 0.0000 0.0000


