12
Financial Sector ASSOCIATE: ALEX SHALIAN ANALYSTS: SEAN CARROLL, JOHN STANTON, MIKE MILO, MATT VOLPE
| Date post: | 25-Jan-2017 |
| Category: |
Documents |
| Upload: | alex-shalian |
| View: | 82 times |
| Download: | 0 times |

Financial SectorASSOCIATE: ALEX SHALIAN
ANALYSTS: SEAN CARROLL, JOHN STANTON, MIKE MILO, MATT VOLPE

Macro Outlook
● Bullish or Bearish?
● Bullish on the Financial Sector
● Going through 08’ crisis recovery causing undervaluation
● The Financial sector has the lowest average P/E Ratio as well as P/BV in comparison to the other sectors. The average P/E Ratio for financials is around 14 with a P/BV of 1.3 (Based on 2015 Estimates)
● Healthy US economy will drive overall growth in this sector
● How would a Fed rate hike impact the financial sector? (70% chance fed raises rates)
● Through its capacity to lend, to insure and to manage a growing base of assets, it is in the sweet spot to benefit from a rising interest rate environment.
● Financials benefit from rising interest rates because the interest margin expands, creating more profit, and the increased economic activity that caused the rate hike generally means more loan demand

Citigroup and Morgan Stanley Macro Correlation
Outperforming the sector as a whole over past yearand continues to beat estimates by quarter
Both Morgan Stanley and Citigroup have normal correlation relative to the industry

CitiGroup [C]● Market Cap: 158.39B● Assets: 1.91 trillion
● Headquarters: New York
● Approx. 200 million customer accounts with business in more than 160 countries and jurisdictions
● Products and services include consumer banking and credit, corporate and investment banking, securities brokerage, transaction services, and wealth management
● Michael Corbat(CEO) has made Citi a stronger and safer institution and improved the quality and consistency of earnings
● Enhance its position as a leading global bank for both institutions and individuals, by building on its unique global network, deep emerging markets expertise, client relationships and product expertise
Close @ $53.49

Metrics Used (Citibank Inc.)
Valuation:
● Market Cap - $158.39 B ---> ($46.27 B)
● Price/Earnings (P/E) - 11.98 ---> (11.93)
● Enterprise Value - $293.58 B ---> ($142.33 B)
● Price/Book - 0.79 ---> (1.27)
● Book Value - $74.14 ---> ($36.98)
Growth:
● EPS Growth (TTM vs. Prior TTM) - 56.34 % ---> (43.73 %)
● Capital Spending Growth (Last 5 years) - 24.19 % ---> (1.99 %)
● Free Cash Flow - $65.27 B ---> ($25.07 B)

CitiGroup [C]
Positive movement
Price as of 11/16/15
Stock growth since 2012: 90%

Analyst Recommendations
Firms making RecommendationsARGUS RESEARCH
B OF A M L
BARCLAYS CAPITA
BUCKINGHAM RES
CLSA AMERICAS
DEUTSCHE BK SEC
EDWARD JONES
J.P. MORGAN
JEFFERIES & CO.
KEEFE BRUYETTE
OPPENHEIMER HLD
WELLS FARGO SEC
Majority of analyst recommend a strong buy

Morgan Stanley [MS]
● Total Assets: 834.1B
● Headquarters: New York
● Located in 43 countries
● Offers Wealth Management, Investment banking, sales and trading and Investment management services
● Morgan Stanley has unveiled plans of offering savings accounts and deposit certificates in a bid to attract a larger clientele next year. They plan to tap assets that customers are currently keeping with banks such as JPMorgan and Bank of America
● Currently, Morgan Stanley has a portfolio of 3.5 million wealth management clients; however, only 1% of them use retail banking services.
● Clients who actively use Morgan Stanley's banking products hold on average 7 percent more assets at the firm than those who don't. The annual fees that customers pay are often based on a percentage of the client's assets at the firm
Close @ $33.59
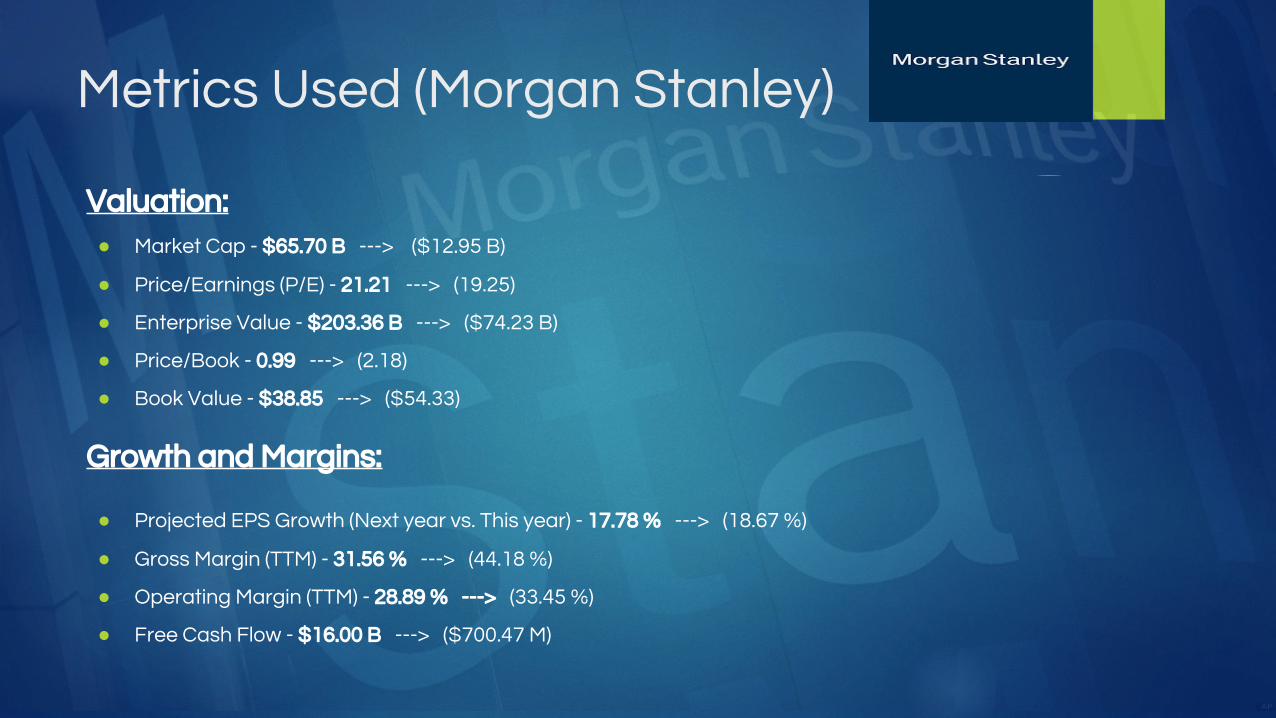
Metrics Used (Morgan Stanley)
Valuation:
● Market Cap - $65.70 B ---> ($12.95 B)
● Price/Earnings (P/E) - 21.21 ---> (19.25)
● Enterprise Value - $203.36 B ---> ($74.23 B)
● Price/Book - 0.99 ---> (2.18)
● Book Value - $38.85 ---> ($54.33)
Growth and Margins:
● Projected EPS Growth (Next year vs. This year) - 17.78 % ---> (18.67 %)
● Gross Margin (TTM) - 31.56 % ---> (44.18 %)
● Operating Margin (TTM) - 28.89 % ---> (33.45 %)
● Free Cash Flow - $16.00 B ---> ($700.47 M)

Morgan Stanley [MS]
Positive movement
Price as of 11/16/15
Stock growth since 2012: over 130%

Morgan Stanley [MS]
Firms making RecommendationsARGUS RESEARCH
B OF A M L
BARCLAYS CAPITA
BUCKINGHAM RES
CLSA AMERICAS
DEUTSCHE BK SEC
EDWARD JONES
J.P. MORGAN
JEFFERIES & CO.
KEEFE BRUYETTE
OPPENHEIMER HLD
WELLS FARGO SEC
0 Analysts recommend a sell


