Working Paper 14/2009 26 August 2009 FINANCIAL SERVICES SECTOR AS A DRIVER OF PRODUCTIVITY GROWTH IN HONG KONG Prepared by Frank Leung, Gaofeng Han and Kevin Chow Research Department Abstract Hong Kong has seen strong growth in labour productivity since 2002. Sectoral breakdown shows that the advance in output per labour has been mainly supported by the expansion in financial and trade related activities attributable to the vibrant increase in offshore trade and exports of financial services. Using the data envelopment analysis (DEA) method, we find that the observed increase in labour productivity has been underpinned by the rise in total factor productivity (TFP). Based on a panel dataset of major economic sectors, regression analysis suggests that exports of services and the China factor are the two key determinants of TFP growth in Hong Kong. JEL Classification Numbers: D24; F15 Keywords: Total factor productivity, labour productivity, economic integration Author’s E-Mail Address: [email protected]; [email protected]; [email protected]The views and analysis expressed in this paper are those of the authors, and do not necessarily represent the views of the Hong Kong Monetary Authority.
Transcript
Working Paper 14/2009 26 August 2009
FINANCIAL SERVICES SECTOR AS A DRIVER OF PRODUCTIVITY GROWTH IN HONG KONG
Prepared by Frank Leung, Gaofeng Han and Kevin Chow
Research Department
Abstract
Hong Kong has seen strong growth in labour productivity since 2002. Sectoral breakdown shows that the advance in output per labour has been mainly supported by the expansion in financial and trade related activities attributable to the vibrant increase in offshore trade and exports of financial services. Using the data envelopment analysis (DEA) method, we find that the observed increase in labour productivity has been underpinned by the rise in total factor productivity (TFP). Based on a panel dataset of major economic sectors, regression analysis suggests that exports of services and the China factor are the two key determinants of TFP growth in Hong Kong. JEL Classification Numbers: D24; F15 Keywords: Total factor productivity, labour productivity, economic integration Author’s E-Mail Address: [email protected]; [email protected]; [email protected]
The views and analysis expressed in this paper are those of the authors, and do not necessarily represent the views of the Hong Kong Monetary Authority.
- 2 -
Executive Summary:
Over the past quarter of a century, labour productivity in Hong Kong grew at an average rate of 4.0% a year, much higher than developed economies in Asia and other advanced economies like the US and UK. Labour productivity grew by 5.0% a year during 2002-07, which was attributable to the vibrant expansion in offshore trade and exports of financial services.
Breakdown by economic sector shows that the recent gain in overall labour
productivity was driven by the strong growth in output per labour in financial- and trade-related sectors. Reflecting this, per-employee compensation registered the largest increment in the financial and insurance sectors.
While service outsourcing and increases in per-employee equipment spending help
increase productivity and competitiveness of the labour force in Hong Kong, the strong growth in total factor productivity (TFP) is found to be the major reason behind the rise in output per labour.
Using the method of data envelopment analysis (DEA) and a panel data of ten
economic sectors, TFP is estimated to have grown by 3.5% a year during 1987-2007, and increased notably to 9.3% a year during 2002-07. Breakdown by sector shows that financial, insurance and banking sectors registered the fastest TFP growth over the past two decades, mainly reflecting the benefits from technological progress.
Panel regression analysis shows that growth in service exports and China’s service
sector are the two key determinants of TFP growth in Hong Kong, while the effect of human capital is not significant, either due to the lack of a comprehensive measure, or a reflection that human capital has not been a constraining factor in TFP growth. This probably reflects the benefits of accelerated globalisation of services trade, and the success of Hong Kong in capturing business opportunities brought about by trade and financial liberalisation measures undertaken by the Mainland authorities.
Growth in labour productivity slowed notably in 2008 and is expected to turn negative
in 2009 as Hong Kong has been hit hard by the US-led global financial crisis of 2007-2009. Looking beyond the crisis, while the financial systems in the US and the EU are set to shrink as a result of the crisis, financial systems in Asia in general and Mainland China in particular have huge potential to grow. By further strengthening its role as a gateway of capital flows in and out of the Mainland, a testing ground for the internationalisation of the renminbi, and also the premier asset-management centre in Asia, Hong Kong should be able to continue its productivity growth in the foreseeable future.
- 3 -
I. Introduction 1 Over the past quarter of a century, the Hong Kong economy quadrupled its size from HK$0.4 trillion in 1980 to HK$1.6 trillion in 2007, equivalent to an annual real growth rate of 5.2%. This is much faster than the 1.1% annual expansion in the number of employed persons. As a result, output per labour, a conventional measure of labour productivity, grew at an average rate of 4.0% per year. While growth in labour productivity in Hong Kong is slower than that in the emerging Asian economies like Mainland China and India, it is appreciably higher than developed economies such as Japan and Korea in the region, and advanced economies like the US, UK and Germany. Given that Hong Kong is a small city and lacks natural resources, what have been the underlying driving forces behind the rapid growth of labour productivity over the years? One of the apparent factors is the transformation from a manufacturing-based to a service-oriented economy, which has added significant value to labour services in Hong Kong. During the 1980s, growth in labour productivity was mainly driven by manufacturing activities, attributable to the vibrant expansion in domestic exports and re-export trade. Following the relocation of production base and assembly lines by domestic manufacturers to Mainland China, the service sector has played an important role in driving labour productivity growth since the 1990s. With the domestic economy gearing towards higher value-added services in the face of intense global competition, labour productivity in trade-related and financial services experienced remarkable growth during 2002-07, in part attributable to the boom in offshore trade and exports of financial services. This paper aims at identifying the sources and determinants of productivity growth in Hong Kong. Section II highlights the key developments in labour productivity and explains the reasons behind the strong growth in labour productivity in recent years. Section III estimates total factor productivity (TFP) of the service sector using the data envelopment analysis (DEA) method by decomposing TFP growth into efficiency changes and technological progress, and discusses the differences in TFP growth across different service sectors. Section IV identifies the determinants of TFP growth and discusses the effect of China factor on productivity growth in Hong Kong. Section V concludes. II. SOURCES OF LABOUR PRODUCTIVITY GROWTH IN HONG KONG Labour productivity in Hong Kong, measured by output per labour, grew by 5.0% a year during 2002-07, notably higher than the annual growth rate of 3.8% in the 1990s and 4.3% in the 1980s. Comparing with other regional economies, growth in labour productivity in Hong Kong has
- 4 -
been the fastest over the past five years except for Mainland China (Chart 1). The strong growth in labour productivity partly reflects the vibrant economic expansion since 2003, with real GDP rising at an annual rate of 6.4% during 2002-07, much faster than the 1.3% growth in employment (Chart 2). The decline in labour productivity growth in 2008 reflected a sharper slowdown in output growth relative to employment growth, largely a result of the US-led global economic downturn.
Chart 1: Labour productivity growth in Asia, 2002-07
Chart 2: Labour productivity and output growth in Hong Kong
10.1
5.0
3.9
3.7
3.6
3.5
3.3
3.1
2.9
1.8
0 2 4 6 8 10 12
Mainland
Hong Kong
Malaysia
Thailand
Indonesia
Philippines
Korea
Taiwan
Singapore
Japan
% Annual growth
-15
-10
-5
0
5
10
15
80 82 84 86 88 90 92 94 96 98 00 02 04 06 08
% yoy
0
5
10
15
20
25
30% yoy
Real GDP growth (lhs)
Labour productivitygrowth (rhs)
Employment growth (lhs)
Sources: CEIC and staff estimates. Sources: Census and Statistics Department (C&SD) and staff estimates.
The rapid growth in labour productivity seen in the late 1980s and early 1990s reflected the transformation from a manufacturing-based to a service-oriented economy. Following the relocation of production plants and assembly lines to the southern part of Mainland China in the 1980s, the number of manufacturing employment in Hong Kong has diminished significantly. While some manufacturing employees were relocated to work on the Mainland to supervise the operations and provide training to the Mainland workers, those working in the Hong Kong office specialised in services such as sourcing, marketing and product design. As a result, job losses in the manufacturing sector were nearly offset by job creation in the import/export sectors between the late 1980s and early 1990s (Chart 3). Reflecting the higher value-added services provided by labour in import/export trade than manufacturing, real payroll per person has been growing faster in the former than the latter.
- 5 -
Chart 3: Contribution to employment
growth by economic sector Chart 4: Labour productivity and real
payroll per person
-10
-8
-6
-4
-2
0
2
4
6
8
82 84 86 88 90 92 94 96 98 00 02 04 06
% yoy
Mfg Utilities Construction
Domestic trade & I/E Transport & Comm Financial
Personal Employment growth 0
1
2
3
4
5
6
7
85 87 89 91 93 95 97 99 01 03 05 07
% yoy (5-year moving avg)
Real payroll per person
Output per labour
Sources: C&SD and staff estimates. Sources: C&SD and staff estimates. In the aftermath of the Asian financial crisis in 1998 and the bursting of the global IT bubble in 2001, growth in labour productivity slowed markedly as the downturn in domestic demand and a protracted period of deflation weighed on output growth. Labour productivity growth picked up again in 2003 reflecting the strong economic recovery following the end of the SARS pandemic in the second half of the year. However, the advance in labour productivity in recent years has been different from the past in two aspects. First, despite the strong growth in labour productivity recently, the overall increase in real labour income remains weak. For example, during 2002-07, while labour productivity grew by an average of 5.0% per year, real payroll per person only rose by an average of 1.1% (Chart 4). Secondly, the recent gain in labour productivity has been concentrated in financial, communications and trade-related services, registering double-digit growth rates of 10-15% between 2002 and 2007 (Chart 5). The concentration of labour productivity growth in the financial and trade-related sectors reflects the rise in their contribution to GDP over the past decade (Chart 6). One noteworthy development is that the strong growth in labour productivity in the communications sector in part reflects the outsourcing of telecommunication services, which explains the contraction in the number of employee in recent years.
- 6 -
Chart 5: Labour productivity growth
by sector(average of 2002-07 )1 Chart 6: Distribution of value added
by economic sector (1990 vs 2007)
0
2
4
6
8
10
12
14
16
Wholesale &retail
I/E Restaurants &hotels
Transport &storage
Communications Financing
% yoy
2002-07 average Overall
% Distribution of value-added by economic sector
30 20 10 0 10 20 30
Imports & exports
Finance & insurance
Property related
Social & personal services
Transport & communicationBusiness services
Wholesale & retailRestaurants & hotels
Mfg & industrial
1990 2007
1. Labour productivity is calculated by output per man hour in each sector.
Sources: C&SD and staff estimates.
Sources: C&SD and staff estimates.
The divergent movement between growth in labour productivity and real payroll per person could be attributable to a number of factors. First, the use of different price indices in estimating volume measures may lead to a slower growth rate in real payroll per person than labour productivity. Past developments show that the growth rate of composite CPI is higher than that of GDP deflator, and there has been a notable gap between the two since 2002 (Chart 7). Since real payroll per person is estimated by deflating nominal payroll by the CPI, its growth rate has been lower than that of labour productivity in recent years. Secondly, real payroll per person mainly capture labour compensation in money terms including salary, overtime earnings and discretionary bonuses. However, fringe benefits, employer’s social security expenditure and payments in kind, such as company quarters and options are not included in the payroll statistics. A more comprehensive measure is the compensations of employee estimated from production-based GDP statistics, which includes both monetary and non-monetary rewards to labour. Chart 8 shows that real compensations of employee and labour productivity move in the same direction most of the time, with both measures rising strongly following the economic recovery starting in 2003.
- 7 -
Chart 7: Composite CPI and GDP deflator
Chart 8: Compensations of employee and labour productivity
-10
-5
0
5
10
15
80 82 84 86 88 90 92 94 96 98 00 02 04 06 08
% yoy
CPI
GDP deflator-4
-2
0
2
4
6
8
10
12
14
80 82 84 86 88 90 92 94 96 98 00 02 04 06 08
% yoy
Real compensation of employee
Labour productivity
Sources: C&SD and staff estimates. Sources: C&SD and staff estimates. The strong growth in labour compensations in recent years has been mainly driven by the marked rise in remunerations to employees engaged in the financial and insurance sectors, which account for more than half of the increase in compensations of employee on average (Chart 9). The sizable compensations to financial sector employee reflected the large bonus payments and share options distributed by financial institutions following the financial market boom in 2006 and 2007. This also partly explains the discrepancy between the payroll and labour compensation statistics in the financial sector over the past few years (Chart 10). While the financial sector employees saw the largest pay rise during the economic expansion in 2004-07, there was a broad-based increase in labour remuneration across different economic sectors such as tourism, domestic trade, imports/exports and business services.
Chart 9: Compensation of employee by economic activity
Chart 10: Per-employee annual nominalpayroll and total compensation in
Sources: C&SD and staff estimates. Sources: C&SD and staff estimates.
- 8 -
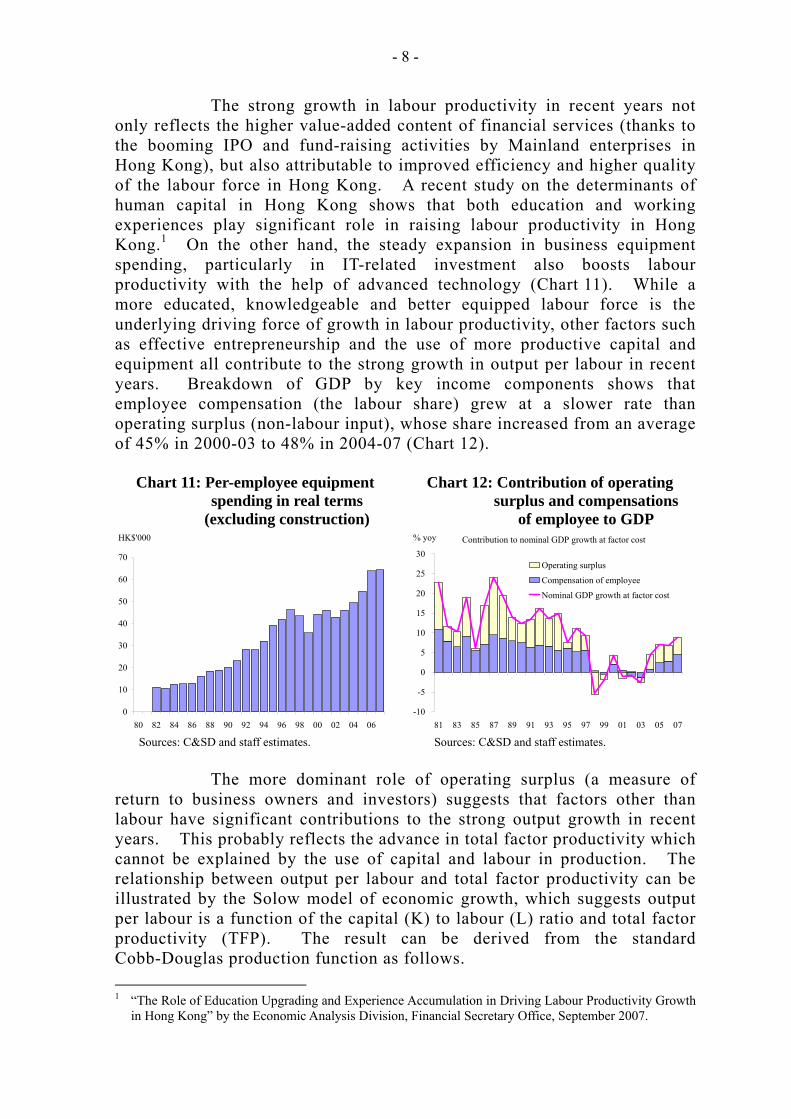
The strong growth in labour productivity in recent years not only reflects the higher value-added content of financial services (thanks to the booming IPO and fund-raising activities by Mainland enterprises in Hong Kong), but also attributable to improved efficiency and higher quality of the labour force in Hong Kong. A recent study on the determinants of human capital in Hong Kong shows that both education and working experiences play significant role in raising labour productivity in Hong Kong.1 On the other hand, the steady expansion in business equipment spending, particularly in IT-related investment also boosts labour productivity with the help of advanced technology (Chart 11). While a more educated, knowledgeable and better equipped labour force is the underlying driving force of growth in labour productivity, other factors such as effective entrepreneurship and the use of more productive capital and equipment all contribute to the strong growth in output per labour in recent years. Breakdown of GDP by key income components shows that employee compensation (the labour share) grew at a slower rate than operating surplus (non-labour input), whose share increased from an average of 45% in 2000-03 to 48% in 2004-07 (Chart 12).
Chart 11: Per-employee equipment spending in real terms
(excluding construction)
Chart 12: Contribution of operating surplus and compensations
of employee to GDP
0
10
20
30
40
50
60
70
80 82 84 86 88 90 92 94 96 98 00 02 04 06
HK$'000 Contribution to nominal GDP growth at factor cost
-10
-5
0
5
10
15
20
25
30
81 83 85 87 89 91 93 95 97 99 01 03 05 07
% yoy
Operating surplus
Compensation of employee
Nominal GDP growth at factor cost
Sources: C&SD and staff estimates. Sources: C&SD and staff estimates. The more dominant role of operating surplus (a measure of return to business owners and investors) suggests that factors other than labour have significant contributions to the strong output growth in recent years. This probably reflects the advance in total factor productivity which cannot be explained by the use of capital and labour in production. The relationship between output per labour and total factor productivity can be illustrated by the Solow model of economic growth, which suggests output per labour is a function of the capital (K) to labour (L) ratio and total factor productivity (TFP). The result can be derived from the standard Cobb-Douglas production function as follows. 1 “The Role of Education Upgrading and Experience Accumulation in Driving Labour Productivity Growth
in Hong Kong” by the Economic Analysis Division, Financial Secretary Office, September 2007.
- 9 -
Y = a Kα Lβ (1)
Dividing both sides of equation (1) by L, and assuming constant return to scale, i.e., α + β = 1, output per labour is determined by a (a measure of TFP) and the capital to labour ratio (K / L).2
Y / L = a (K / L)α (2) Equation (2) suggests that growth in labour productivity (Y/L) is positively related to changes in K/L and TFP growth.3 Since TFP is not observable, it has to be estimated based on output, capital stock and labour force. One of the implications of the Solow growth model is that TFP growth is a key factor explaining differences in economic growth among developed economies where their capital to labour ratios reach the optimal levels. It is believed that technological innovation and accumulation of human capital are key determinants of TFP growth. III. ESTIMATION OF TFP GROWTH IN HONG KONG A variety of techniques have been developed in the economic literature to measure total factor productivity (TFP) growth for different types of data. For time series data, TFP is usually estimated as the Solow residual in a linear regression based on equation (1). For panel dataset with sectoral breakdown, the stochastic frontier approach and data envelopment analysis method are the two commonly used techniques to measure TFP growth. Under the stochastic frontier approach, a random coefficient model is used to estimate the maximum value of coefficient of each input period by period. The estimates are used to form the production frontier (potential output) for each sector over time. TFP growth is then estimated based on the distance between potential output and the realised output, and shifts in production frontiers. Under the data envelopment analysis (DEA) method, non-parametric linear programming technique is employed to find the production frontier without resorting to regressions. Calculation of TFP growth and its components under the DEA method is illustrated in Chart 13, where only one input is assumed for simplicity. 2 The assumption of constant return to scale is verified in Annex D. 3 TFP is usually described as the Solow residual, as this is the part of output growth that cannot be
explained through capital accumulation.
- 10 -
Chart 13: Decomposition of output growth
Source: HKMA staff.
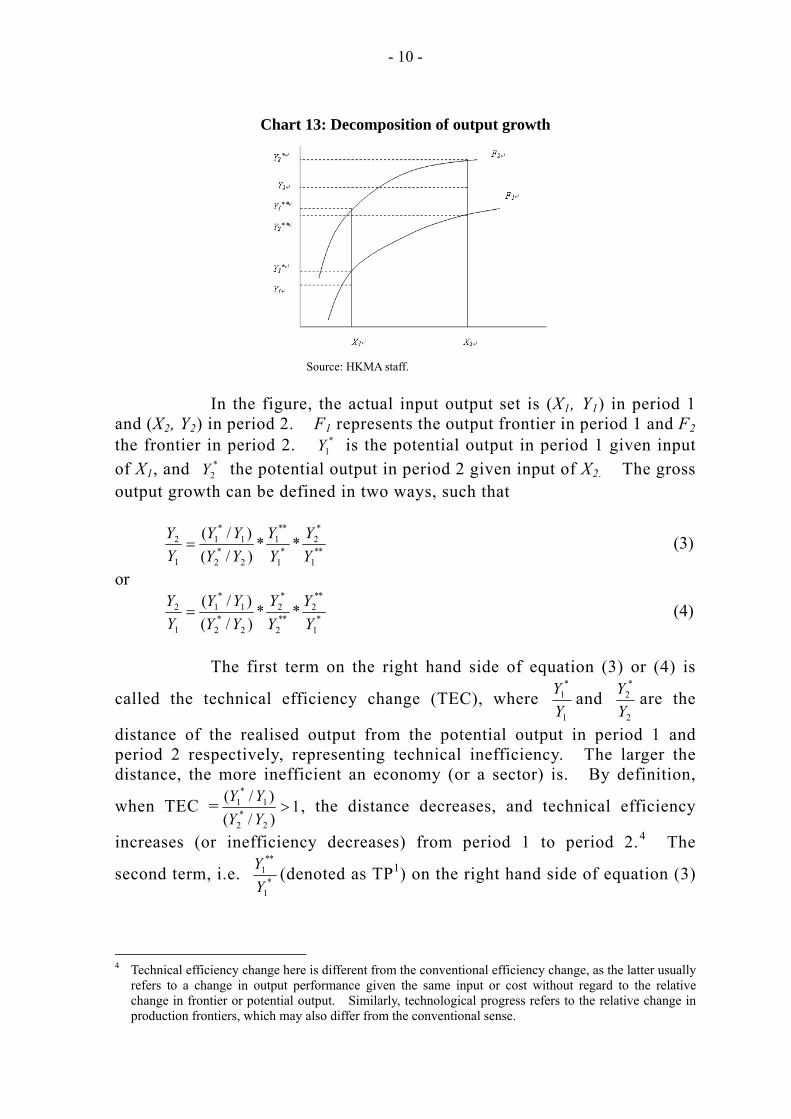
In the figure, the actual input output set is (X1, Y1) in period 1 and (X2, Y2) in period 2. F1 represents the output frontier in period 1 and F2 the frontier in period 2. *
1Y is the potential output in period 1 given input of X1, and *
2Y the potential output in period 2 given input of X2. The gross output growth can be defined in two ways, such that
**1
*2
*1
**1
2*
2
1*
1
1
2 **)/()/(
YY
YY
YYYY
YY
= (3)
or
*1
**2
**2
*2
2*
2
1*
1
1
2 **)/()/(
YY
YY
YYYY
YY
= (4)
The first term on the right hand side of equation (3) or (4) is
called the technical efficiency change (TEC), where 1
*1
YY and
2
*2
YY are the
distance of the realised output from the potential output in period 1 and period 2 respectively, representing technical inefficiency. The larger the distance, the more inefficient an economy (or a sector) is. By definition,
when TEC = 1)/()/(
2*
2
1*
1 >YYYY , the distance decreases, and technical efficiency
increases (or inefficiency decreases) from period 1 to period 2.4 The
second term, i.e. *1
**1
YY (denoted as TP1) on the right hand side of equation (3)
4 Technical efficiency change here is different from the conventional efficiency change, as the latter usually
refers to a change in output performance given the same input or cost without regard to the relative change in frontier or potential output. Similarly, technological progress refers to the relative change in production frontiers, which may also differ from the conventional sense.
- 11 -
or **2
*2
YY (denoted as TP2) on the right hand side of equation (4), measures the
shift of production frontier with the same inputs and is called technological
progress (TP). Finally, **1
*2
YY in equation (3) (denoted as 1
xdY ), or *1
**2
YY in
equation (4) (denoted as 2xdY ) measures the change in potential output with
respect to either one of the frontiers due to changes in inputs. Equations (3) and (4) can be rewritten as
11
1
2 ** xdYTPTECYY
= = TFP1* 1xdY (3’)
and 22
1
2 ** xdYTPTECYY
= = TFP2* 2xdY (4’)
Next defining the Malmquist TFP index M(Yt+1, Xt+1, Yt, Xt) as a geometric average written as
M(Yt+1, Xt+1, Yt, Xt) = 5.0**
11
*22
*11
**22 ]
)/()/(*
)/()/([
YYYY
YYYY (5)
By rearranging equation (5), it is easy to verify that
Equation (6) shows that the Malmquist TFP index is a geometric average of TFPs defined in gross output growth equations (3’) and (4’), which can be decomposed into two components of TEC and TP according to equations (3) and (4). Annual sectoral survey data for 1986-2007 are employed to estimate and decompose TFP growth for Hong Kong by the DEA method (details on the dataset are explained in Annex A, and the linear programming problem under the DEA method is explained in Annex B). Chart 14 shows the aggregate TFP growth for the service sector of the Hong Kong economy estimated from the DEA method (see Table A2 in Annex C for the estimated figures). In most years TFP growth was positive, though there were exceptions in certain periods. As we will show below, in 1989 and 1995 there was a real estate correction, in 1998 there was Asian financial crisis, and in 2001 there was the burst of global IT bubble. During these periods, TFP witnessed negative growth. Starting from 2002, TFP growth picked up again, and kept rising since then. By looking at the two components of TFP growth, it is hard to tell if there exists any pattern of movement for the
- 12 -
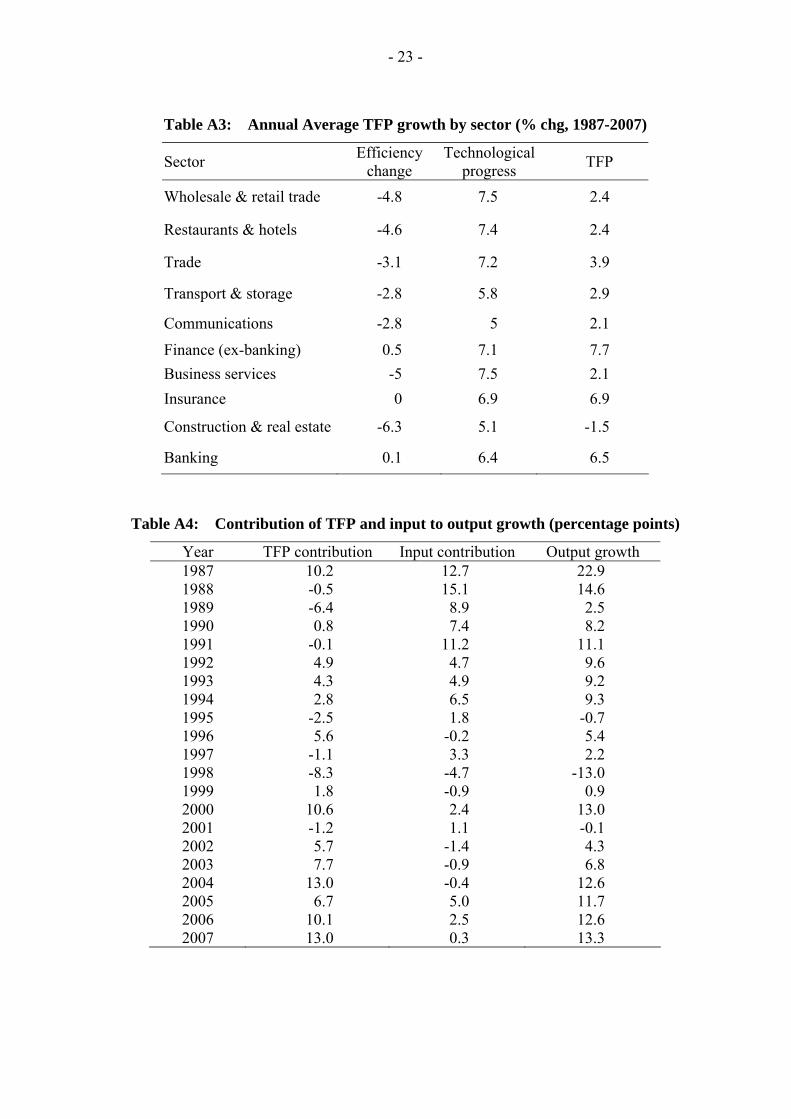
growth in technological progress and efficiency change before 2000. However, starting from 1999, technological progress became the main contributor to TFP growth, while the contribution from technical efficiency change was negative particularly after 2002. Chart 14: TFP growth and its components Chart 15: TFP growth in major
Source: Staff estimates. Source: Staff estimates. Chart 15 shows annual average sectoral TFP growth in major economic sectors during 1987-2007 (see Table A3 in Annex C for the estimated figures). All sectors achieved positive growth in technological progress. However, evidence for improvements in technical efficiencies was weak. On average, only the financial industry including non-bank financial services, insurance, and banking services, achieved slightly positive efficiency changes.5 Nevertheless, the selected economic sectors except construction and real estate achieved positive TFP growth. This partly reflected the sluggish residential investment following the burst of the property price bubble in 1997. The estimated TFP growth can be used to disaggregate output growth into contributions from TFP and factor inputs. 6 According to equations (3’), (4’) and (6), contribution from inputs is ( 1
xdY * 2xdY )0.5, which
is a geometric average of input contributions assessed with two output frontiers. As shown in Chart 16, both output and TFP growths were dragged down by real estate market corrections in 1989 and 1995, the Asian financial crisis in 1997-98 and the burst of global IT bubble in 2001
5 The combination of small efficiency changes and high technological progress in financial sectors suggests
that the best available technologies are mostly originated from these sectors during the sample period. The magnitude of negative efficiency changes in one sector is the difference in output growth between this sector and the best performing sector, given the same input in these two sectors at any given point in time.
6 Note that the aggregate growth rate of gross value added of different sectors differs from expenditure based GDP growth rate. Our sample only covers 10 sectors and excludes primary and manufacturing industries, public utilities, community, social and personal services and ownership of premises, which accounted for 2.4%, 2.5%, 17% and 10% of GDP at factor cost respectively in 2008. The expenditure-based GDP grew at 7.1%, 7.0%, 6.4% and 2.4% respectively in 2005, 2006, 2007 and 2008.
- 13 -
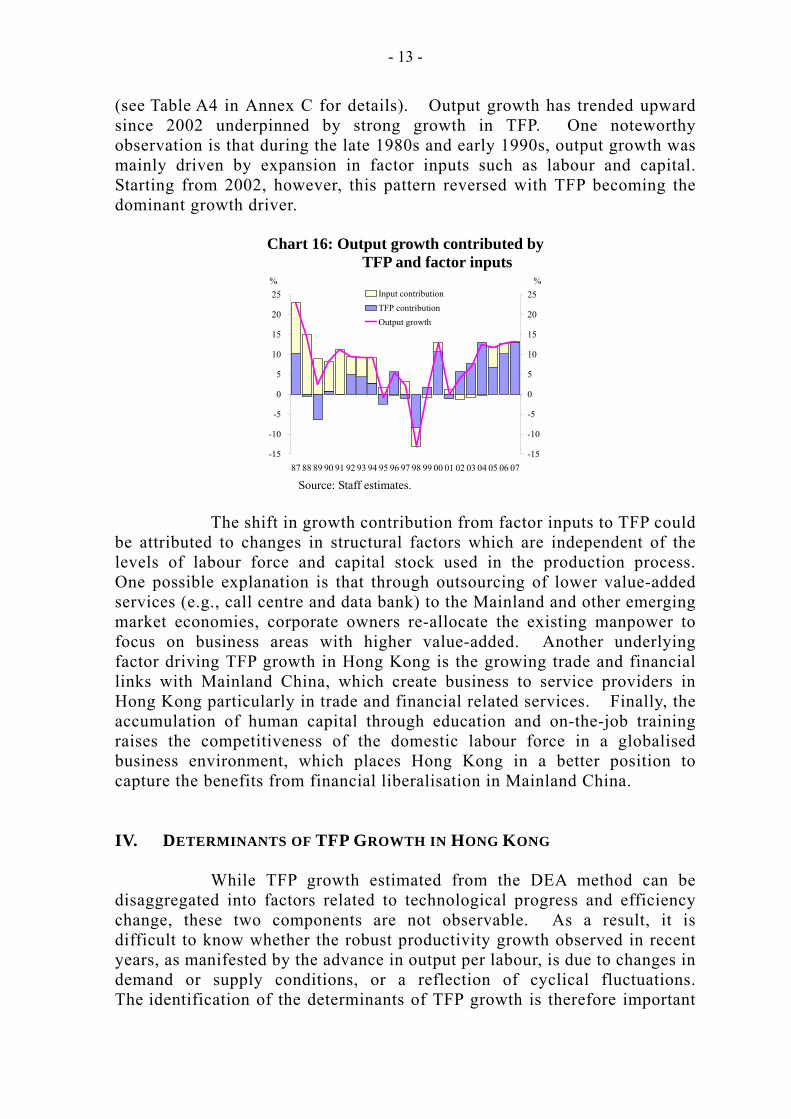
(see Table A4 in Annex C for details). Output growth has trended upward since 2002 underpinned by strong growth in TFP. One noteworthy observation is that during the late 1980s and early 1990s, output growth was mainly driven by expansion in factor inputs such as labour and capital. Starting from 2002, however, this pattern reversed with TFP becoming the dominant growth driver.
Chart 16: Output growth contributed byTFP and factor inputs
Source: Staff estimates. The shift in growth contribution from factor inputs to TFP could be attributed to changes in structural factors which are independent of the levels of labour force and capital stock used in the production process. One possible explanation is that through outsourcing of lower value-added services (e.g., call centre and data bank) to the Mainland and other emerging market economies, corporate owners re-allocate the existing manpower to focus on business areas with higher value-added. Another underlying factor driving TFP growth in Hong Kong is the growing trade and financial links with Mainland China, which create business to service providers in Hong Kong particularly in trade and financial related services. Finally, the accumulation of human capital through education and on-the-job training raises the competitiveness of the domestic labour force in a globalised business environment, which places Hong Kong in a better position to capture the benefits from financial liberalisation in Mainland China. IV. DETERMINANTS OF TFP GROWTH IN HONG KONG While TFP growth estimated from the DEA method can be disaggregated into factors related to technological progress and efficiency change, these two components are not observable. As a result, it is difficult to know whether the robust productivity growth observed in recent years, as manifested by the advance in output per labour, is due to changes in demand or supply conditions, or a reflection of cyclical fluctuations. The identification of the determinants of TFP growth is therefore important
- 14 -
in understanding the reasons behind the strong growth in labour productivity. This also helps throw some light on the future prospects of TFP growth in Hong Kong. Historical data shows that the estimated TFP growth and world output growth are positively related, suggesting that demand-side (cyclical) factors may play an important role in determining productivity growth in Hong Kong (Chart 17). On the other hand, various studies show that human capital is a key supply-side (structural) factor driving TFP growth in the long run. This is particularly the case in mature economies like the US and some EU countries. The situation faced by Hong Kong, however, is somewhat different from that in developed or emerging market economies. Hong Kong is a service-oriented economy with a highly developed financial sector; its labour market is flexible, and its labour force is competitive and internationally mobile. Moreover, Hong Kong is increasingly integrated with Mainland China, which is one of the fastest growing economies in the world. Facing the enormous business opportunities in China and increased global competition, Hong Kong has seen a concentration of highly educated people engaged in the financial service sector, yielding the highest per-employee compensation among the key service industries (Chart 18).
Chart 17: Estimated TFP growth and world output growth
Chart 18: Labour compensation vs labour with tertiary education
Proportion of employee with tertiary education (%)
Per-employeecompensation
('000) Finance ex-bank
Banking
Business services
Insurance
Trade
Communications
Transport &storage
Propertyrelated
Wholesale &retail
Restaurants& hotels
Sources: C&SD, IMF and staff estimates. Sources: C&SD and staff estimates. While the accumulation of human capital through better education and innovations is believed to be the underlying driving force of TFP growth in Hong Kong, the recent boom in per-labour output and compensation could be attributed to the China factor, particularly in the financial services area. For example, over the past two decades (1987-2007) financial sector TFP grew by an average 7-8% a year, comparable to the 9-10% annual growth in value-added. During 2002-07, annual TFP growth in the financial sector accelerated to 18% from 6% in 1987-2001. Apparently, such a significant gain in financial sector
- 15 -
productivity cannot be explained by the accumulation of human capital alone.7 Previous studies by the HKMA show that the rapid growth in financial sector output in recent years is related to the strong demand for financial services by Mainland entities, such as the listing of H-shares and increased cross-border financial fund flows. Based on some crude assumptions on the structure of financial service fees and charges, our estimates suggest that nearly one-third of financial service exports in Hong Kong can be attributed to the China factor.8 To assess the relative impact of demand- and supply-side factors on TFP growth and estimate the contribution from the China factor, four key determinants are identified and used in the regression analysis. First, Hong Kong is an international trade and financial centre. Trade and financial sector openness play an important role in determining TFP growth, as these two sectors account for 40% of GDP. While merchandise trade figures are often used to characterise trade openness, exports of services is a more relevant indicator of competitiveness of the Hong Kong economy, given that over 90% of its GDP is related to services and more than one-fifth of its income is generated from trade in services. Secondly, human capital can also be an important structural factor driving TFP growth over the longer term. The major challenge of incorporating human capital into the regression model is that there is no simple and single measure of labour quality. In general, level of education, years of working experience and the degree of innovations are key attributes of human capital. However, sectoral data on years of working experience of employees and spending on research and innovations are not available. Thus, the proportion of employees with tertiary education in the labour force is used as a proxy for human capital in the ten selected economic sectors. Thirdly, the Mainland’s demand for services provided by Hong Kong can be used to capture the contribution of China factor to TFP growth in Hong Kong. Mainland China has been the largest buyer of services produced in Hong Kong. However, since the compilation of statistics on trade in services by country only started from 1995, the time series cannot be used in the regression model which covers the sample period from 1987 to 2007. Alternatively, the growth rate of the Mainland’s service industry is used as a proxy of the China factor. The idea is that financial liberalisation in China will increase the significance of the service sector in GDP, and the Hong Kong economy is expected to benefit from such a move, particularly in financial related services.
7 The ratio of tertiary educated employees to total employees in the financial sector increased from 51% in
2002 to 60% in 2007. 8 For details please refer to “Service Exports: The Next Engine of Growth for Hong Kong?” by Frank
Leung, Kevin Chow, Jessica Szeto and Dickson Tam, HKMA Working Paper 04/2008, April 2008.
- 16 -
In addition to the above determinants, world GDP growth is used as an explanatory variable in the regression model to control for the effect of cyclical fluctuations on TFP growth. The sample covers 1987-2007 and annual growth data are used for TFP, Hong Kong’s service exports, China’s service industry and world GDP, while the proportion of employee with tertiary education is expressed in first difference. A panel consisting of TFP growth, service export growth and human capital in the ten economic sectors (see Table A1 in Annex A) is used to estimate the regression coefficients, while growth of China’s service industry and world GDP growth are homogenous across the selected sectors. Raw data are mainly collected from CEIC, IMF and Census and Statistics Department. Of the explanatory variables used in the panel regression, growth of service exports in Hong Kong could be affected by productivity shock in Hong Kong, changes in China’s service sector growth or world GDP growth. To correct for the simultaneity problem between service exports and TFP growth, the two-stage least square (2SLS) method is employed to obtain an unbiased estimate of the coefficient, using the lag of service exports as the instrument. The estimation results of the panel regression are summarised in Table 1.
Table 1: Estimation results of panel regression (1987-2007)
Model (1) (2) (3) Dependent variable : TFP growth Constant -0.055* -0.028 -0.095** (0.033) (0.025) (0.039) Service export growth by sector 0.213*** 0.239*** 0.213*** (0.055) (0.054) (0.055) Human capital by sector 5.340 5.209 2.863 (8.967) (9.021) (8.993) China’s service sector growth 0.757** 0.727** (0.328) (0.326) World GDP growth 1.638** 1.558** (0.804) (0.796) Observations 210 210 210 R2 12.1% 11.7% 13.8% Note: Standard errors in parentheses. *** denotes significance at 1% level, ** at 5% level and * at 10% level.
Three different specifications have been used to test whether service sector growth in China and world GDP growth have any effect on TFP growth in Hong Kong. Model (1) does not control for the cyclical
- 17 -
effect on TFP growth while Model (2) excludes service sector growth in China. The estimation results suggest that these two factors are significant and positively related to TFP growth in Hong Kong. Comparison of the coefficients of growth in service exports between Models (1) and (2) show that part of its effect on TFP growth is captured by growth in the service industry in China. This probably reflects the fact that China demand is a key driver of service exports in Hong Kong, thanks to the growing economic and financial integration between the two economies. Overall, Model (3) has the strongest explanatory power on TFP growth in Hong Kong over the past two decades, as indicated by the highest R2. All the estimated coefficients are of correct signs, and most of them are significant except for human capital, which is the proportion of employees with tertiary education in the labour force.9 One possible reason is that the education level of labour is just one of the key attributes of human capital, while working experience and the degree of innovations also play important roles in enhancing productivity and competitiveness of the labour force, which are difficult to measure in practice. An alternative interpretation is that human capital has not been a constraining factor in TFP growth, given Hong Kong’s flexible labour market. The panel regression results of Model (3) suggest that a one-percentage-point increase in growth of service exports in Hong Kong and China’s service industry will, on average, raise TFP growth in Hong Kong by 0.21 and 0.73 percentage points respectively. The larger impact of China’s service sector growth on Hong Kong’s TFP growth suggests that the China factor could be a key underlying driver of the robust productivity growth in Hong Kong. V. CONCLUSIONS This paper analyses the major source of productivity growth in Hong Kong. The strong gain in labour productivity in recent years is attributable to a rapid growth in output per labour in financial and trade related sectors, which are the two largest service industries in Hong Kong in terms of value added. The advance in productivity also raises labour income in real terms across sectors. However, with the relative stable labour share in GDP, the strong growth in output per labour is likely to have been driven by the gain in total factor productivity. Using a linear programming method, the estimated TFP growth picked up notably during 2002-07, which coincided with the rapid expansion in trade in services. Regression analysis suggests that growth of exports of services and the service sector in Mainland China are the two key drivers of overall productivity growth in Hong Kong. This probably reflects the 9 Other definitions of human capital are also tried, such as the growth rate of the proportion of employees
with secondary school education to the labour force, but there is no significant improvement.
- 18 -
benefits of accelerated globalisation of services trade, and the success of Hong Kong in capturing business opportunities brought about by trade and financial liberalisation measures undertaken by the Mainland authorities. Looking ahead, more financial sector liberalisation measures are expected to be implemented by the Mainland authorities to facilitate an orderly outflow of capitals given the rapid accumulation of private wealth and to promote the international use of the renminbi. With the launch of the pilot scheme of Mainland-Hong Kong trade settlement in renminbi and related banking services in renminbi in July 2009, the pace of financial liberalisation is likely to pick up. The development of Shanghai into an international financial centre (IFC) will also foster competition and cooperation between Hong Kong and the Mainland in various financial services areas. These new developments will strengthen the role of Hong Kong as an IFC by underpinning exports of financial services and productivity growth in Hong Kong. Growth in labour productivity slowed notably in 2008 and is expected to turn negative in 2009 as Hong Kong has been hit hard by the US-led global financial crisis of 2007-2009. Looking beyond the crisis, while the financial systems in the US and the EU are set to shrink as a result of the global financial crisis of 2007-2009, financial systems in Asia in general and Mainland China in particular have huge potential to grow. By further strengthening its role as a gateway of capital flows to and out of the Mainland, a testing ground for the internationalisation of the renminbi, and also the premier asset-management centre in Asia, Hong Kong should be able to continue its productivity growth in the foreseeable future.
- 19 -
Annex A
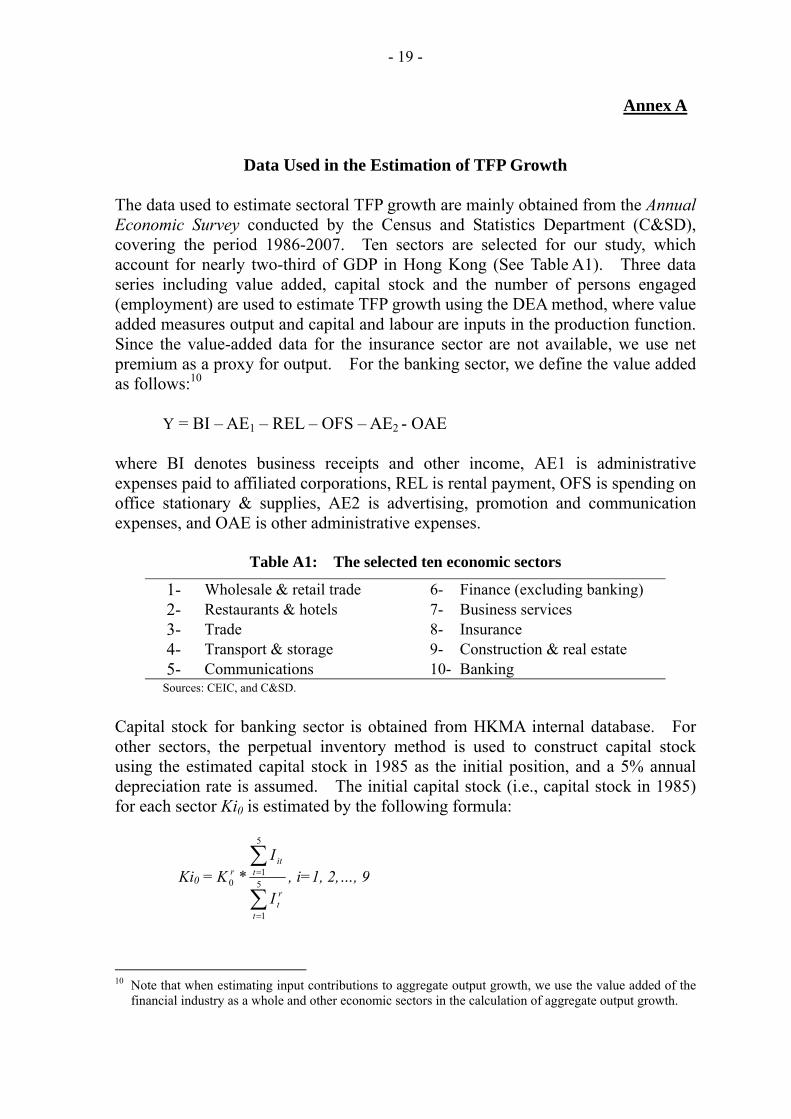
Data Used in the Estimation of TFP Growth The data used to estimate sectoral TFP growth are mainly obtained from the Annual Economic Survey conducted by the Census and Statistics Department (C&SD), covering the period 1986-2007. Ten sectors are selected for our study, which account for nearly two-third of GDP in Hong Kong (See Table A1). Three data series including value added, capital stock and the number of persons engaged (employment) are used to estimate TFP growth using the DEA method, where value added measures output and capital and labour are inputs in the production function. Since the value-added data for the insurance sector are not available, we use net premium as a proxy for output. For the banking sector, we define the value added as follows:10 Y = BI – AE1 – REL – OFS – AE2 - OAE where BI denotes business receipts and other income, AE1 is administrative expenses paid to affiliated corporations, REL is rental payment, OFS is spending on office stationary & supplies, AE2 is advertising, promotion and communication expenses, and OAE is other administrative expenses.
Table A1: The selected ten economic sectors
1- Wholesale & retail trade 6- Finance (excluding banking) 2- Restaurants & hotels 7- Business services 3- Trade 8- Insurance 4- Transport & storage 9- Construction & real estate 5- Communications 10- Banking
Sources: CEIC, and C&SD.
Capital stock for banking sector is obtained from HKMA internal database. For other sectors, the perpetual inventory method is used to construct capital stock using the estimated capital stock in 1985 as the initial position, and a 5% annual depreciation rate is assumed. The initial capital stock (i.e., capital stock in 1985) for each sector Ki0 is estimated by the following formula:
Ki0 =∑
∑
=
=5
1
5
10 *
t
rt
tit
r
I
IK , i=1, 2,…, 9
10 Note that when estimating input contributions to aggregate output growth, we use the value added of the
financial industry as a whole and other economic sectors in the calculation of aggregate output growth.
- 20 -
where rK 0 is the capital stock of the selected industry in base year, rtI is gross
additions to fixed assets in that industry in year t, both are obtained from HKMA internal database. itI is gross additions to fixed assets in sector i in year t. Both the value added and gross additions to fixed assets are converted into 2000 prices.
- 21 -
Annex B
Technical note on the DEA Method According to Coelli (1996), the four components of the Malmquist TFP growth index in equation (5) can be estimated by solving the following linear programming problem under the assumption of constant return to scale.
-θYit + Yt+1λ≧0, i=1,2,…,10 Xit -Xt+1λ≧0, i=1,2,…,10 λ≧0 (B4) where Yt is a 1×10 vector, Xt a 2×10 vector, Yit a scalar, Xit a 2×1 vector, λ a 10×1 vector and θ a scalar. The above four linear programming problems are solved for each of the 10 sectors year by year in the sample period.
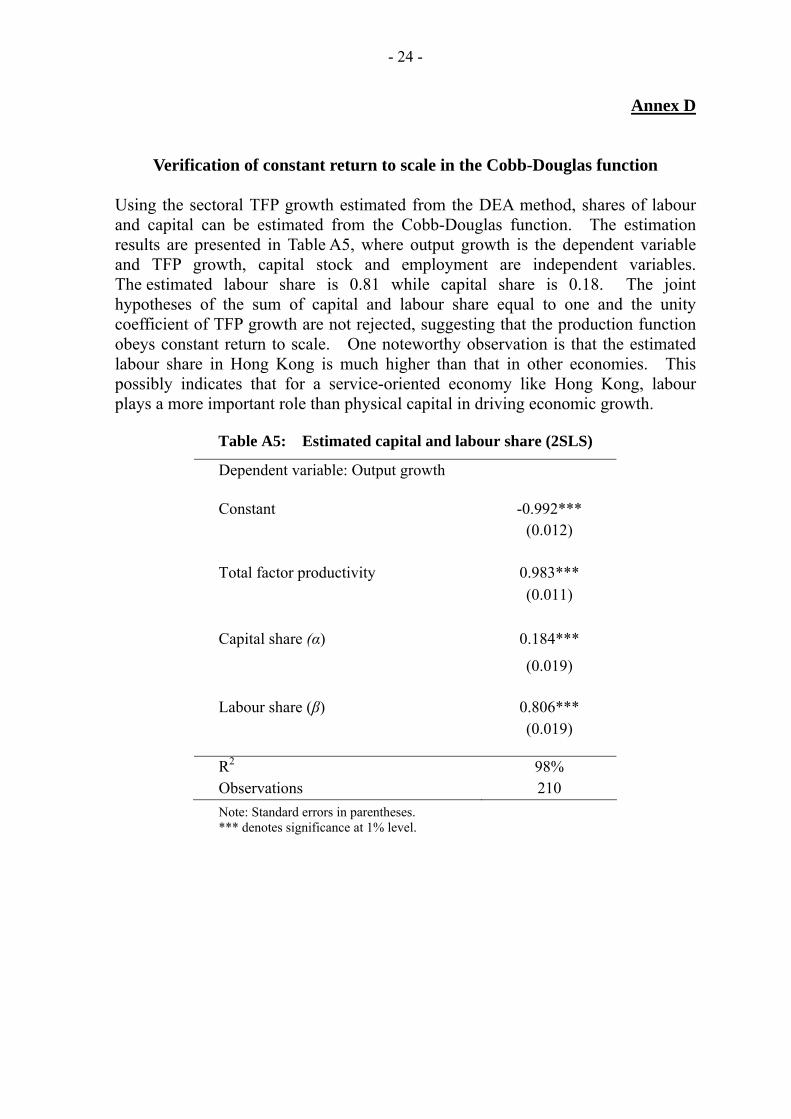
Verification of constant return to scale in the Cobb-Douglas function Using the sectoral TFP growth estimated from the DEA method, shares of labour and capital can be estimated from the Cobb-Douglas function. The estimation results are presented in Table A5, where output growth is the dependent variable and TFP growth, capital stock and employment are independent variables. The estimated labour share is 0.81 while capital share is 0.18. The joint hypotheses of the sum of capital and labour share equal to one and the unity coefficient of TFP growth are not rejected, suggesting that the production function obeys constant return to scale. One noteworthy observation is that the estimated labour share in Hong Kong is much higher than that in other economies. This possibly indicates that for a service-oriented economy like Hong Kong, labour plays a more important role than physical capital in driving economic growth.
Table A5: Estimated capital and labour share (2SLS)
Dependent variable: Output growth Constant -0.992*** (0.012) Total factor productivity 0.983*** (0.011) Capital share (α) 0.184***
(0.019) Labour share (β) 0.806*** (0.019) R2 98% Observations 210 Note: Standard errors in parentheses. *** denotes significance at 1% level.
- 25 -
REFERENCES Bauer, Paul W., Allen N. Berger, and David B. Humphrey, “Efficiency and
productivity growth in U.S. Banking”, in Harold O. Fried, and C.A. Knox Lovell, and Shelton S. Schmidt (ed.), Measurement of Productive Efficiency, Oxford University .Press, 1993, pp 386-pp413.
Berger, Allen N., and Loretta J. Mester, “Explaining the Dramatic Changes in
Performance of U.S. Banks: Technological Change, Deregulation, and Dynamic Changes in Competition,” Journal of Financial Intermediation V12(3), pp. 57-95, Jan. 2003.
Chou,Win Lin and Kar-Yiu Wong, “Economic Growth and International Trade: the
Case of Hong Kong,” Pacific Economic Review 6 (3), pp. 313 – 329, Oct. 2001. Corrado, Carol, Paul Lengermann, Eric J. Bartelsman, and J. Joseph Beaulieu,
“Sectoral Productivity in the United States: Recent Developments and the role of IT,” Financial and Economics Discussion Series 2007-24, Federal Reserve Board, March 2007.
Coelli, Tim, “A guide to DEAP version 2.1: a DATA Envelopment Analysis
(Computer) Program,” CEPA Working Paper 96/08, 1996. Crespi, Francesco and Mario Pianta, “Demand and Innovation in Productivity
Growth,” International Review of Applied Economics 22(6), pp. 655-672, 2008. Dachraoui, Kais and Tarek M. Harchaoui, “A Frontier Approach to Canada-U.S.
multifactor productivity performance,” Economic Analysis (EA) Research Paper Series, Statistics Canada, Analytical Studies Branch, March 2003.
Fare, R., S. Grosskopf, and C.A.K. Lovell, Production Frontiers, Cambridge
University Press, 1994. Leung, Frank, Kevin Chow, Jessica Szeto, and Dickson Tam, “Service Exports: the
Next Engine of Growth for Hong Kong?” HKMA Working Paper 04/2008, April 2008.
- 26 -
Fecher, Fabienne and Pierre Pestieau, “Efficiency and Competition in OECD
Financial Services,” in Harold O. Fried, and C.A. Knox Lovell, and Shelton S. Schmidt (ed.), Measurement of Productive Efficiency, Oxford University Press, pp374-pp385, 1993.
He, Dong, and Wenlang Zhang, “The Domestic Importance of China’s Foreign
Trade: How Dependent is the Chinese Economy on Exports and in What Sense Has its Growth Been Export-led?” HKMA Working Paper, July 2008.
Kose, M. Ayhan, Eswar S. Prasad, and Marco E. Terrones, “Does Openness to
International Financial Flows Contribute to productivity Growth?” HKMA-UCSC Conference Paper, June 2008.
Miller, Stephen M., and Mukti P. Upadhyay, “The Effects of Openness, Trade
Orientation, and Human Capital,” Journal of Development Economics 63(2), pp. 399-423, Dec. 2000.
Rezitis, Anthony N., “Productivity Growth in the Greek Banking Industry: A
Non-Parametric Approach,” Journal of Applied Economics IX(1), pp119-138, May 2006.
Sung, Yun-Wing and Kar-Yiu Wong “Growth of Hong Kong before and after its
Reversion to China: the China Factor,” Pacific Economic Review5(2), pp. 201-228, June 2000.
Worthington, Andrew, “The Determinants of Non Bank Financial Institution