29
Financial Stability Board Report as of 30 September 2011

Financial Stability Board Reportas of 30 September 2011

Financial Stability board report 2contentS
credit inveStment portFolio . . . . . . . . . . . . . . . . . . . . . . . . . . . . . . . . . . . . . . . . . . . . . . . . . . . . . . . . . . . . . . . . . . . . . . . . . . . . . . . . . . . . 4
Portfolio overview . . . . . . . . . . . . . . . . . . . . . . . . . . . . . . . . . . . . . . . . . . . . . . . . . . . . . . . . . . . . . . . . . . . . . . . . . . . . . . . . . . . . . . . . . . . . . . . . . . . 4
1.1 Breakdown of Credit Investment Portfolio (CIP) . . . . . . . . . . . . . . . . . . . . . . . . . . . . . . . . . . . . . . . . . 4
1.2 Rating Migration . . . . . . . . . . . . . . . . . . . . . . . . . . . . . . . . . . . . . . . . . . . . . . . . . . . . . . . . . . . . . . . . . . . . . . . . . . . . . . . . . . . . . . . . . 5
1.3 Annual result 2010 and additional result Q1 – Q3 / 2011 . . . . . . . . . . . . . . . . . . . . . . . . . . . . . . 6
Portfolio details . . . . . . . . . . . . . . . . . . . . . . . . . . . . . . . . . . . . . . . . . . . . . . . . . . . . . . . . . . . . . . . . . . . . . . . . . . . . . . . . . . . . . . . . . . . . . . . . . . . . . . 8
2.1 SIV Carrera . . . . . . . . . . . . . . . . . . . . . . . . . . . . . . . . . . . . . . . . . . . . . . . . . . . . . . . . . . . . . . . . . . . . . . . . . . . . . . . . . . . . . . . . . . . . . . . . . . . 8
2.2 Other ABS . . . . . . . . . . . . . . . . . . . . . . . . . . . . . . . . . . . . . . . . . . . . . . . . . . . . . . . . . . . . . . . . . . . . . . . . . . . . . . . . . . . . . . . . . . . . . . . . . . . . 9
2.2 a Non-US RMBS . . . . . . . . . . . . . . . . . . . . . . . . . . . . . . . . . . . . . . . . . . . . . . . . . . . . . . . . . . . . . . . . . . . . . . . . . . . . . . . . . . . . . . . . . . . . 10
2.2 b EU High Yield CLO / CDO . . . . . . . . . . . . . . . . . . . . . . . . . . . . . . . . . . . . . . . . . . . . . . . . . . . . . . . . . . . . . . . . . . . . . . . . . . . . . . 11
2.2 c Student Loan ABS . . . . . . . . . . . . . . . . . . . . . . . . . . . . . . . . . . . . . . . . . . . . . . . . . . . . . . . . . . . . . . . . . . . . . . . . . . . . . . . . . . . . . . 12
2.2 d CMBS . . . . . . . . . . . . . . . . . . . . . . . . . . . . . . . . . . . . . . . . . . . . . . . . . . . . . . . . . . . . . . . . . . . . . . . . . . . . . . . . . . . . . . . . . . . . . . . . . . . . . . . . . . 13
2.2 e US CLO, CBO & TruPS CDO . . . . . . . . . . . . . . . . . . . . . . . . . . . . . . . . . . . . . . . . . . . . . . . . . . . . . . . . . . . . . . . . . . . . . . . . . . . . 15
2.2 f EU SME CLO . . . . . . . . . . . . . . . . . . . . . . . . . . . . . . . . . . . . . . . . . . . . . . . . . . . . . . . . . . . . . . . . . . . . . . . . . . . . . . . . . . . . . . . . . . . . . . . . 15
2.2 g Remaining ABS . . . . . . . . . . . . . . . . . . . . . . . . . . . . . . . . . . . . . . . . . . . . . . . . . . . . . . . . . . . . . . . . . . . . . . . . . . . . . . . . . . . . . . . . . . 16
2.3 Single Names . . . . . . . . . . . . . . . . . . . . . . . . . . . . . . . . . . . . . . . . . . . . . . . . . . . . . . . . . . . . . . . . . . . . . . . . . . . . . . . . . . . . . . . . . . . . 16
2.4 Hedge Funds / Other Funds . . . . . . . . . . . . . . . . . . . . . . . . . . . . . . . . . . . . . . . . . . . . . . . . . . . . . . . . . . . . . . . . . . . . . . . 18
2.5 Subprime-related Exposure . . . . . . . . . . . . . . . . . . . . . . . . . . . . . . . . . . . . . . . . . . . . . . . . . . . . . . . . . . . . . . . . . . . . . 18
Summary oF monoline expoSure . . . . . . . . . . . . . . . . . . . . . . . . . . . . . . . . . . . . . . . . . . . . . . . . . . . . . . . . . . . . . . . . . . . . . . . . . . . . 21
Exposure to Monolines . . . . . . . . . . . . . . . . . . . . . . . . . . . . . . . . . . . . . . . . . . . . . . . . . . . . . . . . . . . . . . . . . . . . . . . . . . . . . . . . . . . . . . . . . 21
Former Financial inStitutionS Group (FiG) . . . . . . . . . . . . . . . . . . . . . . . . . . . . . . . . . . . . . . . . . . . . . . . . . . . . . . . . . . . . 22
Former FIG . . . . . . . . . . . . . . . . . . . . . . . . . . . . . . . . . . . . . . . . . . . . . . . . . . . . . . . . . . . . . . . . . . . . . . . . . . . . . . . . . . . . . . . . . . . . . . . . . . . . . . . . . . . . . 22
FIG Portfolio Details . . . . . . . . . . . . . . . . . . . . . . . . . . . . . . . . . . . . . . . . . . . . . . . . . . . . . . . . . . . . . . . . . . . . . . . . . . . . . . . . . . . . . . . . . . . . . . 22
Former credit tradinG . . . . . . . . . . . . . . . . . . . . . . . . . . . . . . . . . . . . . . . . . . . . . . . . . . . . . . . . . . . . . . . . . . . . . . . . . . . . . . . . . . . . . . . . . . 25
Credit Trading . . . . . . . . . . . . . . . . . . . . . . . . . . . . . . . . . . . . . . . . . . . . . . . . . . . . . . . . . . . . . . . . . . . . . . . . . . . . . . . . . . . . . . . . . . . . . . . . . . . . . . . . 25
leveraGed Finance (lbo) . . . . . . . . . . . . . . . . . . . . . . . . . . . . . . . . . . . . . . . . . . . . . . . . . . . . . . . . . . . . . . . . . . . . . . . . . . . . . . . . . . . . . . . . . . . . . . . . . . . . . . . . . . . . . . . . . . . . . . . . . . . . . . . . . . . . . . . . . . . . . . . . . . . . . . . . . . . . . . . . . . . . . . . . . . . . . . . . . 26
Leveraged Finance of Global Head Corporates . . . . . . . . . . . . . . . . . . . . . . . . . . . . . . . . . . . . . . . . . . . . . . . . . . . . . 26
LBOs (part of Credit Investment Portfolio highlighted before) . . . . . . . . . . . . . . . . . . . . . . . . . . . . . . . . . . . . . . . . . . . . . . . . . . . . . . . . . 27
i.
1.
2.
ii.
1.
iii.
1.
2.
iv.
1.
v.
1.
2.
contentS

3Financial Stability board reportintroduction
publication of detailed information on HSH nordbank’s
portfolios which are affected by the Financial markets
crisis (as recommended by the Financial Stability board)
In .view .of .the .crisis .underway .on .financial .markets .since .
2007 .the .Financial .Stability .Board* .(FSB) .recommends .
that .banks .provide .greater .disclosure .on .portfolios .which .
are .affected .by .the .market .turmoil . .The .aim .is .to .in- .
crease .transparency .on .exposure .to .structured .credit .prod-
ucts .among .others .and .thereby .contribute .to .a .lasting .
stabili .sation .of .the .markets . .
These .disclosures .supplement .the .comments .on .the . .
Credit .Investment .Portfolio .in .the .risk .report .of .our .Interim .
Report .as .of .30 .September .2011 .and .also .deal .with .HSH . .
Nordbank’s .leverage .finance .portfolio, .the .former .Financial .
Institution .Group .(FIG) .portfolio, .the .exposure .to .US . .
monolines .and .the .former .Credit .Trading .portfolio, .all .of .
which .have .been .transferred .into .the .Bank’s .Restruc-
turing .Unit .(RU) .
* The FSB is a joint body made up of regulatory authorities from states and international organisations, appointed by the Finance Ministers and central bank Governors of the G7 countries to analyse the causes of the turbulence on financial markets and to develop recom mendations for strengthening the financial system.
Financial Stability board report

4
Breakdown of credit investment portfolio by asset class (Exposure as of 30 September 2011)
< 0.1 % EUR 0.01 billion Special Funds
47 % EUR 4.77 billion Other ABS
32 % EUR 3.27 billion Single Names
< 0.1 % EUR 0.02 billion Hedge Funds / Other Funds
1 % EUR 0.12 billion High Yield Loans / Convertibles
13 % Subprime EUR 1.37 billion thereof RMBS HEL: EUR 0.88 billion thereof COA / COC: EUR 0.49 billion
7 % SIV Carrera EUR 0.76 billion thereof Capital Notes: EUR 0.02 billion thereof Senior Notes: EUR 0.74 billion
Financial Stability board reportcredit inveStment portFolio
– .The .CIP .is .a .broadly .diversified .portfolio .
– .16 .4 .% .of .the .whole .portfolio .is .AAA .rated .and .further .
66 .4 .% .is .investment .grade .
– .The .Bank .continues .to .actively .reduce .the .Credit .
Investment .Portfolio . .Assets .with .an .exposure .of . .
EUR .0 .6 .billion .were .sold .since .year .end .2010 .
– .Furthermore, .maturities .and .full .or .partial .redemptions .
portfolio overview
breakdown oF credit inveStment portFolio (cip)
1.
1.1
amounted .to .EUR .1 .5 .billion .since .year .end .2010 . .Due .
to .FX .effects .the .portfolio .volume .in .Euro .equivalent .
rose .by .EUR .0 .4 .billion .in .Q3 .2011 .while .since .year .end .
2010 .the .FX .effects .amount .to .EUR .− .0 .04 .billion .
– .Taken .together, .the .CIP .notional .decreased .by .EUR .2 .1 .
billion .since .year .end .2010 .
47 %
32 %
1 %< 0.1 %
< 0.1 %
7 %
13 %
100 % = EUR 10.32 billion
i. credit inveStment portFolio

Financial Stability board report 5
Rating distribution and development of actual portfolio (in %) 1)
Upgrade
Downgrade
1) Carrera deconsolidation shown first time in Q4 / 2010.
credit inveStment portFolio
ratinG miGration1.2
aaa
aa
a
below a
62.1
25.5
9.8
2.5
16.4
30.5
24.4
28.7
0.7
0.2
20.1
26.9
46.6
0.7
16.0
1.2
4.7
0.7
initial miGration-in miGration-out September 11
1.6
20.0

Financial Stability board report 6credit inveStment portFolio
annual reSult 2010 and additional reSult Q1–Q3 / 20111.3
Results .include .effects .from .positions .that .have .reached .
maturity .or .were .liquidated .in .the .meantime . .
Gains .are .shown .with .positive, .losses .with .negative .sign .
Annual result 2010 (¤ million) Annual result 2010
Asset class iFrS category
exposure 31 dec. 2009
(¤ billion)
exposure 31 dec. 2010
(¤ billion) m-t-m p & l effect 1)revaluation
equity Surplus
change in hidden
reserve / loss2010
2.1 Synthetic CDO DFV 0.20 0.20 +11 +11 0 0
Special Fund AFS 0.18 0.05 +2 +2 0 0
2.2 SIV Carrera 4) LAR, AFS 0.07 0.85 0 −1 0 +1
2.3 Other ABS Mainly LAR 7.77 5.62 +391 +59 +4 +328
2.4Single Names
DFV, AFS, LAR, HFT 6.68 3.93 −126 −96 −34 +4
2.5Hedge Funds / Other Funds AFS 0.20 0.02 +3 +3 0 0
Others (Convertibles, NY HY Loan Portfolio) AFS, LAR 0.24 0.20 +13 0 0 +13
SUM 15.33 10.88 +294 −23 −30 +347
2.6
RMBS HEL LAR 1.13 0.98 +3 +3 3) 0 0
CDO of ABS, CDO of CDO 2) DFV, LAR 0.64 0.51 −26 −26 0 0
Subprime Portfolio 1.77 1.49 −23 −23 0 0
TOTAL SUM 17.10 12.37 +271 −46 −30 +347
1) P&L effects resulting from relevant M-T-M changes, net change in risk provisions and realized losses / gains. Interest results et al. are unconsidered.
2) Including third-party managed portfolio
3) In 2008, HSH Nordbank has changed its methodology concerning the calculation of intrinsic values and recoverable amounts for impaired RMBS HEL positions. The P/L benefit from this so-called level 3
valuation was EUR 370 million in 2008, but decreased to EUR 343 (2009), EUR 259 (2010) and rose again to EUR 301 (in Q3 / 2011).
4) The HSH-sponsored Structured Investment Vehicle Carrera has been deconsolidated in August 2010. Consequently, the remaining Capital Note (EUR 0.02 billion) and the senior facilities (EUR 0.74 billion)
consisting of repos and liquidity lines are reported within the asset class “SIV”. For details please see pg. 8 of this report. As of 31.12.2009 the Asset Class “SIV Carrera” consisted of capital notes of external SIV’s.

Financial Stability board report 7credit inveStment portFolio
Additional result 2011 (¤ million) Additional Result Q1 – Q3 / 2011
Asset class iFrS category
exposure 31 dec. 2010
(¤ billion)
exposure30 Sep. 2011
(¤ billion) m-t-m p & l effect 1)revaluation
equity Surplus
change in hidden
reserve / loss 2011
2.1 Synthetic CDO DFV 0.20 0.00 0 0 0 0
Special Fund AFS 0.05 0.01 +3 +3 0 0
2.2 SIV Carrera 4) LAR, AFS 0.85 0.76 0 0 0 0
2.3 Other ABS Mainly LAR 5.62 4.77 +23 +2 0 +21
2.4Single Names
DFV, AFS, LAR, HFT 3.93 3.27 −219 −181 −31 −8
2.5Hedge Funds / Other Funds AFS 0.02 0.02 0 0 +1 0
Others (Convertibles, NY HY Loan Portfolio) AFS, LAR 0.20 0.12 +1 0 0 +1
SUM 10.88 8.95 −192 −176 −31 +15
2.6
RMBS HEL LAR 0.98 0.88 +1 +3 3) 0 −2
CDO of ABS, CDO of CDO 2) DFV, LAR 0.51 0.49 −4 +10 0 −15
Subprime Portfolio 1.49 1.37 −3 +14 0 −17
TOTAL SUM 12.37 10.32 −195 −162 −31 −2
1) P&L effects resulting from relevant M-T-M changes, net change in risk provisions and realized losses / gains. Interest results et al. are unconsidered.
2) Including third-party managed portfolio
3) In 2008, HSH Nordbank has changed its methodology concerning the calculation of intrinsic values and recoverable amounts for impaired RMBS HEL positions. The P/L benefit from this so-called level 3
valuation was EUR 370 million in 2008, but decreased to EUR 343 (2009), EUR 259 (2010) and rose again to EUR 301 (in Q3 / 2011).
4) The HSH-sponsored Structured Investment Vehicle Carrera has been deconsolidated in August 2010. Consequently, the remaining Capital Note (EUR 0.02 billion) and the senior facilities (EUR 0.74 billion)
consisting of repos and liquidity lines are reported within the asset class “SIV”. For details please see pg. 8 of this report. As of 31.12.2009 the Asset Class “SIV Carrera” consisted of capital notes of external SIV’s.

Financial Stability board report 8credit inveStment portFolio
Carrera’s balance sheet
Siv carrera
1 ABS
2 Financial Institutions
3 Repos & Liq. Loans
4 Capital Notes (HSH Nordbank)
5 Capital Notes (3rd Parties)1
2
70 %
30 %
87 %
11 %2 %
3
54
aSSetS liabilitieS
portfolio details
Siv carrera
SIV (as of 30 September 2011)
Exposure
Capital Notes (¤ billion) 0.02
Senior Facility (¤ billion) 0.74
IFRS category LAR
2.
2.1
– .In .2010 .Carrera’s .portfolio .size .has .been .substantially .
reduced .from .EUR .2 .54 .billion .at .year-end .2009 .(fully .
consolidated .until .30 .September .2010) .to .EUR .0 .95 .bil-
lion .by .a .vertical .slice .transaction .
– .The .vehicle’s .asset .portfolio .consists .of .ABS .(70 .%) .and .
Financial .Institutions .(30 .%) . .
– .The .credit .risk .of .Carrera’s .asset .pool .is .concentrated . .
in .the .subordinated .Capital .Notes . .HSH .Nordbank .only .
holds .a .minority .interest .in .these .notes .(17 .% .of .all .
Notes) . .
– .The .senior .liabilities .are .fully .provided .by .HSH .Nord-
bank . .The .credit .risk .in .these .facilities .is .relatively . .
low .because .of .the .efficient .first-loss .protection .provided .

Financial Stability board report 9
Distribution by region and asset class (as of 30 September 2011)
21.2 % EUR 1.01 billion Student Loans ABS
20.5 % EUR 0.98 billion US CLO / CBO & TruPS
14.0 % EUR 0.67 billion CMBS
1.5% EUR 0.07 billion Commercial Real Estate CDO
0.8 % EUR 0.04 billion Emerging Markets ABS
27.5 % EUR 1.31 billion EU High Yield CLO / CDO
2.7 % EUR 0.13 billion EU SME CLO
< 0.1 % EUR 1.5 million Non-US Consumer ABS
9.0 % EUR 0.43 billion Non-US RMBS
2.7 % EUR 0.13 billion Others
Total (¤ billion) 4.77
P & L 11 (¤ million) +2
P & L 10 (¤ million) +59
credit inveStment portFolio
otHer abS2.2
as of 30 September 2011 (life-to-date)
Latent critical
Critical
1 Non-US RMBS
2 EU High Yield CLO / CDO
3 Student Loan ABS
4 CMBS
5 US CLO, CBO & TruPS CDO
6 EU SME CLO & Lease ABS
7 US Commercial Real Estate CDO
8 Emerging Markets ABS
9 Non-US Consumer ABS
Others
> 2 bn
> 1 bn
< 1 bn
3
Portfolio size (¤)
< 5 % 5 % – 10 % 10 % – 20 % > 20 %
M-T-M-loss
2
7
10
6
4
5
1 10
9
8
9.0 %
0.8 %
2.7 %
20.5 %
27.5 %
1.5 % 14.0 %
2.7 %< 0.1 %
21.2 %

Financial Stability board report 10
Distribution by Rating
35.1 % AAA
61.6 % Investment Grade (AA+ – BBB –)
3.3 % Below Investment Grade (BB+ – D)
credit inveStment portFolio
Non-US RMBS (as of 30 September 2011)
Exposure (¤ billion) 0.43
IFRS category LAR
– .The .current .portfolio .consists .of .high .quality .mostly . .
AAA .rated .Residential .Mortgage .Backed .Securities .
(‘RMBS’), .concentrated .mainly .in .the .UK .(50 .5 .%) .and .
Spain .(32 .1 .%) . .
– .The .Non-US .RMBS .portfolio .has .decreased .further .due .
to .redemptions .and .selective .tranche .sales . .68 .6 .% .of . .
the .current .portfolio .is .prime, .with .9 .9 .% .UK .buy-to-let .
(‘BTL’) .and .27 .7 .% .UK .non-conforming .(‘NC’) .
– .UK .Non-Conforming .portfolio .remains .sensitive .to .eco-
nomic .growth .and .interest .rates, .however .any . .
impact .will .be .limited, .as .this .sub-portfolio .benefits .
from .a .high .credit .enhancement .
– .More .than .75 .% .of .the .UK .Prime .RMBS .sub-portfolio . .
as .of .31 .December .2010 .is .on .course .to .be .repaid .by .the .
end .of .2011, .as .prime .lenders .start .to .support .their .
RMBS .vehicles .
– .Outlook: .The .economic .outlook .for .the .countries .of .
the .eurozone .in .general .and .the .UK .(in .total .50 .5 .% .of .
this .portfolio) .is .negative ./ .stable . .Rising .unemploy-
ment .rates .and ./ .or .higher .interest .rates .would .exert .
pressure .on .affordability ./ .mortgage .loan .performance .
and .on .house .prices . .
– .Extension .risk .exists .due .to .lower .prepayments . .
(limited .refinancing .opportunities) .and .clean .up .calls .
not .being .exercised .
non-uS rmbS2.2a 1
61.6 %
3.3 %
35.1 %

Financial Stability board report 11
Distribution by mortage type & country
12.9 % UK Prime
9.9 % UK BTL
27.7 % UK NC
0.6 % Argentina Prime
2.6 % Australia Prime
0.5 % Germany Prime
5.2 % Ireland Prime
6.6 % Italy Prime
1.9 % Portugal Prime
32.1 % Spain Prime
credit inveStment portFolio
EU High Yield CLO / CDO (as of 30 September 2011)
Exposure (¤ billion) 1.31
IFRS category LAR, DFV
– .The .portfolio .consists .primarily .of .managed, .arbitrage .
cash .flow .CLOs, .predominantly .backed .by .first .lien .
senior .secured .loans .and .managed .by .tier .one .managers .
with .extensive .track .records .
– .The .investment .standards .included .collateral .criteria .
such .as .ramp-up .status, .portfolio .quality .and .concentra-
tion .limits, .structural .criteria .(diversion .tests, .hair-
cuts), .portfolio .manager .quality .(internal .scoring) .and .
stress .tests .based .on .cash .flow .analysis .(break-even .
default .rates .under .conservative .recovery .assumptions) . .
– .Portfolio .is .almost .entirely .composed .of .original .
AAA ./ .AA .rated .tranches .
– .A .non .negligible .part .of .the .portfolio .is .post .reinvest-
ment .period .and .continues .to .delever .
– .Performance .of .CLO .portfolio .continued .to .improve . .
as .evidenced .by .growing .cushions .in .overcollateraliza-
tion .tests . .
– .US .economy .and .most .of .Europe .are .in .secular . .
deleveraging .cycles . .Combined .with .sovereign .austerity .
measures .being .implemented .with .expected .growth .
potential .to .be .limited .in .the .long .term, .especially .in .
Europe’s .peripheral .states . .
– .Fundamentals .might .therefore .deteriorate .which .should .
particularly .affect .CCC .rated .or .highly .leveraged . .
companies .facing .refinancing .risk, .especially .during .the .
maturity .wall .2014–2016 . .However, .the .impact .on . .
the .portfolio .should .be .limited .due .to .the .seniority .of .
the .positions .(i . .e . .high .subordination .and .other .struc-
tural .safeguards) .
– .Spreads .widened .for .senior .tranches .throughout .H1 .
2011, .due .to .Greece’s .ongoing .sovereign .crisis . .However, .
compared .to .mezzanine .tranches .prices .for .senior . .
positions .held .up .relatively .firmly, .thereby .reflecting .
markets .perception .of .senior .CLO .tranches .as . .
a .structurally .sound .and .relatively .safe .asset .class . .
eu HiGH yield clo / cdo2.2b 2
2.6 %
27.7 %
5.2 %
6.6 %
1.9 %
9.9 %
12.9 %
32.1 %
0.6 %
0.5 %

Financial Stability board report 12
Student Loan ABS (as of 30 September 2011)
Exposure (¤ billion) 1.01
IFRS category LAR
– .The .US .government .guaranteed .nature .of .the .FFELP .
Student .Loan .ABS .portfolio .represents .a .joint .probabil-
ity .of .default .consisting .of .the .performance .of .the .
underlying .portfolio .as .well .as .the .servicer’s .ability .to .
maintain .the .US .Government .Guaranty .of .at .least . .
96 .% .on .the .student .loans .
– .The .mark-to-market .of .the .Student .Loan .portfolio .has .
been .stable .to .the .previous .quarter .as .the .market .
shook .off .concerns .about .the .US .Government .down-
grade .
– .The .ratings .outlook .for .Student .Loan .ABS .sector .
remains .mainly .stable, .where .as:
. . . .S&P .downgraded .the .AAA .ratings .on .the .US .
Government .to .AA+ .from .AAA, .and .Moody’s .and . .
Fitch .affirmed .the .US .Government .ratings .of .
Aaa ./ .AAA .
. . . .As .a .result .of .S&P’s .rating .action .on .the .US .Govern-
ment, .they .have .begun .to .downgrade .select .senior .
student .loan .ABS .from .AAA .to .AA+ . .The .senior .
SLABs .in .the .HSH .portfolio .are .currently .on .nega-
tive .watch, .but .have .not .been .downgraded .yet . .
– .The .asset .performance .outlook .for .the .FFELP .student .
loan .ABS .is .stable .
. . . .FFELP .losses .have .remained .very .low .due .to .the .96 .% .
government .guarantee, .but .student .loan .defaults .
have .been .trending .up .due .to .the .elevated .unemploy-
ment .rate .in .the .US .
. . . .President .Obama .unveiled .new .details .for .student .
loan .programs .addressing .loan .consolidation . .
and .changes .to .the .income .based .repayment .plan . .
The .executive .order .allows .students .to .consolidate .
FFELP .student .loans .with .other .student .loans . .
and .refinance .into .a .US .Government .Direct .Loan . .
This .will .have .the .impact .of .increases .in .pre-
payments .for .FFELP .Student .Loan .ABS . .The .income .
based .plan .caps .student .loan .payments .from . .
15 .% .of .discretionary .income .to .10 .% .for .new .student .
loans .which .has .no .impact .on .seasoned .student .
loan .ABS .
Student loan abS 32.2c
credit inveStment portFolio
Distribution by guarantees (government / private)
96 % FFELP Guaranteed
4 % Private4 %
96 %

Financial Stability board report 13
Rating distribution
78.7 % AAA
1.0 % AA
0.9 % AA–
0.9 % A
1.5 % A–
11.3 % BBB
3.2 % BBB–
2.5 % BB
credit inveStment portFolio
US CMBS
– .The .CMBS .portfolio .comprises .mainly .conduit .deals .
backed .by .a .diversified .portfolio .of .different .property .
types .throughout .the .country .
– .Fundamentals .in .the .CRE .market .improve .and .consen-
sus .cumulative .loss .expectations .decrease, .and .delin-
quencies .trending .lower . .Property .prices .bottom .and .
begin .to .recover . .Rate .and .magnitude .of .recovery .
depends .on .asset .quality .and .location . .2011 .refinancing .
needs .are .modest; .maturity .wall .creeps .closer, .but .is .
manageable . .
– .Our .investments .are .in .the .more .senior .notes .of .the .cap-
ital .structures .of .these .transactions .and .we .believe .
that .the .structural .features .and .credit .enhancement .pro-
vide .adequate .shield .against .unexpected .losses .
cmbS
– .M-T-M .prices .in .the .US .CMBS .portfolio .have .decreased .
approximately .5 .points .as .compared .to .the .previous .
quarter .as .a .function .of .macro .economic .events .such .as .
the .European .Sovereign .Debt .Crisis . .Credit .performance .
continues .to .improve .
– .S&P .has .announced .a .change .in .CMBS .criteria .relat-
ing .to .DSCR .eligibility . .Given .the .senior .position .of .our .
portfolio, .we .don’t .anticipate .substantial .impact .
European & Asian CMBS
– .The .EMEA .CMBS .portfolio .consists .of .senior .European .
tranches . .
– .This .is .a .defensive .portfolio, .with .purchase .strategy .
based .on .deal .fundamentals . .Objectives .included .high .
quality .collateral .with .stable .rental .income .meeting .
stress .tests .on .a .loan .by .loan .basis, .credit .enhancing .
structural .features, .and .the .portfolio .rental .income .
based .on .diversified .tenant .base .
2.2d 4
CMBS (as of 30 September 2011)
Exposure (¤ billion) 0.67
IFRS category LAR, AFS, DFV
78.7 %
2.5 %
1.0 %0.9 %0.9 %1.5 %
11.3 %
3.2 %
Financial Stability board report 14
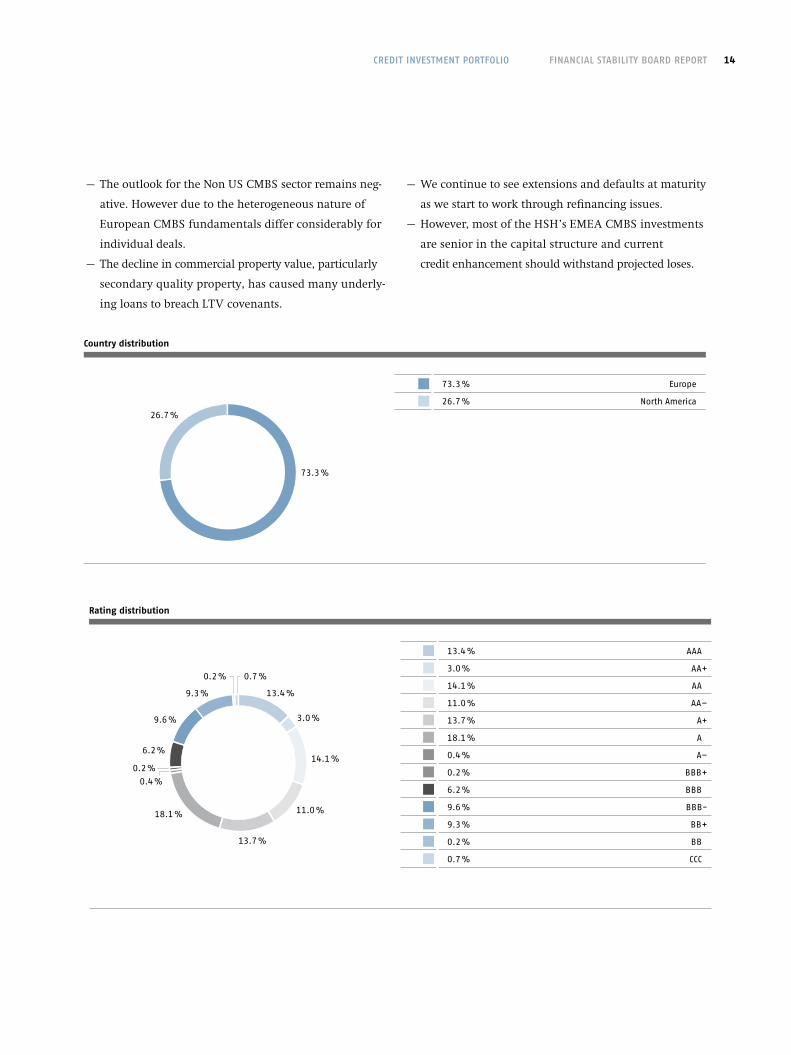
Rating distribution
13.4 % AAA
3.0 % AA+
14.1 % AA
11.0 % AA–
13.7 % A+
18.1 % A
0.4 % A–
0.2 % BBB+
6.2 % BBB
9.6 % BBB-
9.3 % BB+
0.2 % BB
0.7 % CCC
credit inveStment portFolio
0.4 %
13.7 %
0.2 % 0.7 %
9.6 %
9.3 %
18.1 %
13.4 %
3.0 %
14.1 %
11.0 %
0.2 %
6.2 %
Country distribution
73.3 % Europe
26.7 % North America
26.7 %
73.3 %
– .The .outlook .for .the .Non .US .CMBS .sector .remains .neg-
ative . .However .due .to .the .heterogeneous .nature .of .
European .CMBS .fundamentals .differ .considerably .for .
individual .deals .
– .The .decline .in .commercial .property .value, .particularly .
secondary .quality .property, .has .caused .many .underly-
ing .loans .to .breach .LTV .covenants .
– .We .continue .to .see .extensions .and .defaults .at .maturity .
as .we .start .to .work .through .refinancing .issues .
– .However, .most .of .the .HSH’s .EMEA .CMBS .investments .
are .senior .in .the .capital .structure .and .current . .
credit .enhancement .should .withstand .projected .loses .

Financial Stability board report 15credit inveStment portFolio
eu Sme clo 62.2f
– .Diversified .portfolio .of .European .small- .and .mid- .
sized .enterprise .CLOs, .a .few .other .European .CDOs .and .
some .Lease .ABS . .
Product: EU SME CLO (as of 30 September 2011)
Exposure (¤ billion) 0.13
IFRS category LAR
6
Product: US CLO, CBO & TruPS CDO (as of 30 September 2011)
Exposure (¤ billion) 0.98
IFRS category LAR
uS clo, cbo & trupS cdo 52.2e
5
– .This .portfolio .consists .primarily .of .managed .arbitrage .
US .cash .flow .CLOs .with .91 .4 .% .CLOs .backed .by . .
predominantly .first .lien .senior .secured .sub-investment .
grade .corporate .loans, .1 .1 .% .2000–2001 .vintage .short .
maturity .CBOs .backed .by .investment .grade .or .high .yield .
bonds .and .7 .5 .% .Trust .Preferred .CDOs .backed .by .
hybrid .Trust .Preferred .Securities .issued .by .small .US .
regional .banks .and .thrifts .
– .Defensively .selected .portfolio .with .a .focus .e . .g . .to .avoid .
large .structured .finance .buckets .within .CLOs . .In .
terms .of .ranking .76 .0 .% .of .the .USD .balance .are .first . .
priority .most .senior .tranches, .11 .3 .% .are .2nd .priority .
“Junior .AAA” .tranches, .10 .8 .% .are .originally .AA .
tranches .and .1 .9 .% .are .mezzanine .tranches .originally .
rated .A .or .BBB .
– .After .changing .their .CLO .rating .methodology .Moody’s .
upgraded .33 .of .HSH’s .senior .tranches .of .broadly . .
syndicated .loan .CLOs .back .to .their .original .Aaa .level . .
3 .exceptions .are .Aa1 ./ .Aa2 .rated . .The .weighted .average .
HSH .CLO .rating .is .currently .Aa1 .by .Moody’s .and .AA+ ./ . .
AA .by .S&P .
– .According .to .JP .Morgan .Global .High .Yield .and .Lever-
aged .Loan .Research .the .issuer-weighted .12 .months .
loan .default .rate .fell .to .0 .88 .% .in .October . .The .balance-
weighted .default .rate .fell .to .0 .50 .% . .The .annual .
default .forecast .is .2 .% .for .both .2012 .and .2013 .– .well .
below .the .4 .% .long-term .average .
– .Portfolio .is .made .up .of .senior .positions .securitized . .
by .granular .pools .and .is .well .diversified .over .European .
countries .and .industries . .
– .Portfolio .consists .mainly .of .seasoned .deals .that . .

Financial Stability board report 16
Single Names (as of 30 September 2011)
Exposure (¤ billion) 3.27
P & L 11 (¤ million) −181
P & L 10 (¤ million) −96
P & L 09 (¤ million) +136
IFRS category DFV, AFS, LAR, HFT
– .The .Single .Names .portfolio .consists .of .179 .deals . .
which .are .mainly .Asset .Swaps .and .Floating .Rate .Notes . .
There .is .only .one .CDS .left . .It .has .been .reduced .in . .
Q1–Q3 .2011 .through .active .sales .of .EUR .85 .million .
and .redemptions .of .about .EUR .575 .million .
– .The .average .rating .of .the .portfolio .is .Baa2 .with .the .
highest .single .issuer .concentration .in .Republic .of .Italy, .
SinGle nameS2.3
credit inveStment portFolio
remaininG abS
US COMMERCIAL REAL ESTATE CDO
(as of 30 Sep. 2011)
7– Only 11 % of the CRE CDOs are backed by riskier collateral origi-
nated in weaker vintages (2004 to 2007). 49 % of the CRE CDOs are 2001 through 2003 vintages which are performing relatively well. Two seasoned vintage positions (USD 110 million original notional) paid off last quarter. The remaining 49 % of the CRE CDOs are backed by AAA CMBS tranches which are stable.
– Many of the seasoned subordinated investments have expe-rienced rating volatility as a result of downgrades in the underlying mezzanine and subordinated CMBS securities in the collateral pool. In many cases the underlying mezza-nine and subordinated CMBS that are classified as credit risk or defaulted are backed by loans that are in the process of being restructured or refinanced which is negatively im-pacting the ratings of these securities, but are ultimately money good and trade at high levels in the market as a result of their high fixed rate coupons.
Exposure (¤ billion) 0.07
IFRS category LAR, DFV
EMERgINg MARkETS ABS(as of 30 Sep. 2011)
8– The credit crunch and the following global economic down-
turn have left marks on the EM ABS portfolio. Most of the EM Diversified Payment Rights ABS were downgraded to their underlying collateral rating as a consequence of the severe crisis within the monoline insurer industry starting in 2009 (avg. BBB+).
– Nevertheless the EM ABS portfolio continues to show a stable performance. With respect to the DPR ABS all debt service coverage ratios (DSCR) are in compliance as collections prove quite resilient to the economic slowdown of developed countries.
– The major part of this portfolio are Turkish Diversified Payment Rights ABS that continue to delever as planned. Even though we expect Turkey’s economy to cool off due to a combination of weaker external and domestic demand, this slowdown should not be a problem as export collections largely outpace debt service even in a stress scenario.
Exposure (¤ billion) 0.04
IFRS category LAR
NON-US CONSUMER ABS (as of 30 Sep. 2011)
9– Only one Italian consumer deal is left in this bucket.
Traditionally Italian consumers can be characterized by low indebtedness and high saving rates.
– Performance is in line with expectations and transaction will be fully redeemed at next payment date.
Exposure (¤ billion) < 0.01
IFRS category LAR
7 8 92.2g

Financial Stability board report 17credit inveStment portFolio
Rating distribution
10.4 % AAA
2.0 % AA+
4.7 % AA
27.0 % AA-
11.2 % A+
8.2 % A
9.9 % A-
11.1 % BBB+
3.5 % BBB
5.5 % BBB–
4.1 % BB+ and below
2.1 % NR
3.5 %2.0 %
10.4 %
27.0 %
2.1 %
5.5 %
4.7 %
9.9 %
8.2 %
4.1 %
11.2 %
11.1 %
Distribution by sector
75.7 % Financials
23.4 % Public Finance
0.9 % Corporates
75.7 %
23.4 %
0.9 %
Deutsche .Pfandbrief bank .and .Province .of .Quebec . . .
The .Top .3 .countries .in .terms .of .country .risk .are .USA, .
Germany .and .Spain .
– .Market .development .within .Q1 .to .Q3 .and .outlook: .
The .global .economy .has .endured .an .extraordinary .
series .of .shocks .since .the .start .of .the .year, .ranging .from .
one .of .the .worst .natural .disasters .in .history .to .armed .
intervention .by .Western .powers .in .an .Arab .oil-export-
ing .state .and .to .the .ongoing .debt .crisis .in .the .USA . .
and .the .euro .zone . .On .account .of .the .European .debt .
crisis .mainly .the .exposure .in .the .PIIGS .have .suffered . .
Especially .the .development .of .the .credit .spreads .of . .
our .Greece .bonds, .which .are .categorized .in .DFV, .have .
contributed .a .big .part .of .the .negative .P&L .
– .As .the .European .debt .crisis .has .not .been .solved .so .far .
and .the .investors .still .question .the .euro .zones .via- .
bility .as .a .currency .union .without .fiscal .and .political .
union, .it .is .expected .that .there .will .be .further .spread .
widening .in .Q4 .especially .with .negative .implication .on .
the .PIIGS .exposure . .

Financial Stability board report 18
as of 30 September 2011
64 % Home Equity Loans RMBS
36 % CDO of ABS, CDO of CDO
64 %
36 %
Subprime-related expoSure2.5
as of 30 September 2011 COA / COC HEL Total
Total exposure (¤ billion) 0.49 0.88 1.37
P & L 11 (¤ million) +10 +3 +14
P & L 10 (¤ million) −26 +3 −23
IFRS category LAR, DFV LAR LAR, DFV
credit inveStment portFolio
HedGe FundS / otHer FundS2.4
Hedge Funds
– .The .net .exposure .to .this .asset .category .has .been .reduced .
significantly .in .Q4 .2010 .and .Q3 .2011 .because .of .a .
cash .distribution .out .of .the .investment .to .HSH .leaving .
only .a .small .remaining .exposure .in .this .asset .class . .
Hedge Funds / Other Funds (as of 30 September 2011)
Net exposure (¤ billion) 0.02
P & L 11 (¤ million) 0
P & L 10 (¤ million) +3
P & L 09 (¤ million) −28
IFRS category AFS

Financial Stability board report 19credit inveStment portFolio
– .The .US .RMBS .portfolio .consists .primarily .of .subprime .
securities . .Weak .underwriting .standards, .fraudulent .
activities, .the .severe .decline .in .housing .and .poor .eco-
nomic .climate .experienced .over .the .last .few .years . .
led .to .persistently .high .delinquencies .and .foreclosures .
which .have .resulted .in .significant .losses .within .the .
transactions . .These .unprecedented .defaults .have .had . .
a .predominant .effect .within .RMBS .securitizations .
issued .between .2005 .and .2007 . .The .mezzanine .classes .
in .many .transactions, .particularly .2006 .and .2007 . .
vintage .are .expected .to .continue .to .experience .losses .as .
defaulted .loans .are .liquidated, .but .the .performance . .
of .the .remaining .loans .in .these .transactions .have .shown .
signs .of .stabilizing .
– .According .to .the .most .recent .data .from .the .Federal .
Housing .Finance .Agency, .home .prices .in .the .US .fell .
0 .6 .% .in .the .1st .quarter .of .2011 .from .the .previous .quar-
ter .as .a .result .of .persistent .high .unemployment .and .ele-
vated .inventories .of .homes .on .the .market . .The .year .
over .year .decline .was .5 .9 .% . .In .the .near .term, .the .US .
housing .market .is .expected .to .remain .soft .as . .
housing .inventories .remain .high .and .the .economy .con-
tinues .its .slow .recovery . .
– .The .US .mortgage .market .has .shown .some .moderate .
signs .of .stabilizing .after .several .quarters .of .decline . .
While .the .HSH .portfolio .delinquency .growth .rates .
have .been .leveling .off .for .most .of .the .portfolio, .losses .
continue .to .grow, .particularly .in .the .2006 .and .2007 .
transactions .due .to .large .pipelines .of .non-performing .
loans .and .declining .home .values .
– .Security .prices .have .declined .3 .points .from .42 .to .39 .due .
to .overall .price .declines .in .the .credit .markets .as .well . .
as .disappointing .news .related .to .home .prices .and .US .
unemployment .
– .The .rating .agencies .have .collectively .downgraded . .
the .large .majority .of .the .currently .outstanding .subprime .
RMBS .bonds .issued .from .2005 .to .2007 . .The .ratings .
actions .are .due .to .the .severe .decline .in .the .housing .mar-
ket, .increasing .losses .within .most .of .the .recent .issue .
subprime .transactions, .and .the .agencies’ .negative .out-
look .for .the .currently .outstanding .subprime .securi-
ties .particularly .among .2006 .and .2007 .vintage .transac-
tions . .The .bonds .which .have .retained .triple .or .double .
AA .rating .are .primarily .from .2004 .and .2005 .transac-
tions .which .had .performed .well .prior .to .the .crash . .
of .the .housing .market .and .which .continue .to .perform .
despite .very .adverse .market .conditions . .Mezzanine .
bonds .from .2006 .and .the .majority .of .2007 .bonds .may .
be .subject .to .further .ratings .volatility .as .the .transac-
tions .continue .to .underperform .
– .The .Obama .Administration .released .changes .to .the .
Home .Affordability .Refinance .Program .(HARP) .includ-
ing .lowering .fees, .removal .of .LTV .limitations, .reduc-
tion .in .appraisal .requirements, .unified .delinquency .
requirements, .and .waiver .of .certain .reps .and .war-
ranties .with .the .aim .to .make .it .easier .for .borrowers .to .
refinance .and .benefit .from .the .low .interest .rate .envi-
ronment .
RMBS of HEL (as of 30 September 2011)
Exposure (¤ billion) 0.88
P & L 11 (¤ million) +3
P & L 10 (¤ million) +3
P & L 09 (¤ million) −107
IFRS category LAR
rmbS oF Hel 1

Financial Stability board report 20credit inveStment portFolio
Distribution of Notional by vintage
2.9 % 2004 Vintage
19.2 % 2005 Vintage
60.4 % 2006 Vintage
17.6 % 2007 Vintage
2.9 %
19.2 %17.6 %
60.4 %
Rating distribution by vintage (in %)
2004 Investment Grade 90.3
Below Investment Grade 9.8
2005 Investment Grade 31.4
Below Investment Grade 68.6
2006 Investment Grade 2.6
Below Investment Grade 97.4
2007 Investment Grade 8.3
Below Investment Grade 91.7
RMBS HEL rating migration (in %)
AAA 60 29 15 4 1Impairment criterion
AA 35 9 7 8 8
A 4 13 4 1 3
Below A 1 49 74 87 88
Oct. 07 Dec. 08 Dec. 09 Dec. 10 Sep. 11
1

Financial Stability board report 21Summary oF monoline expoSure
expoSure to monolineS
Indirect monoline exposure (¤ million) 30 Sep. 2011 30 Jun. 2011
CIP 1) wrapped ABS 265.3 274.6
CIP wrapped Single Names 69.4 65.6
Global Markets London Single Names 67.8 69.7
Total 402.5 409.9
Synthetic CDO 2) 0 0
grand Total 402.5 409.9
1) CIP: Credit Investment Portfolio2) Last Synthetic CDO deal has been sold in Q1 / 2011
– .No .direct .monoline .exposure .
– .The .exposure .decreased .due .to .amortizations .by . .
EUR .25 .4 .million, .FX .effects .led .to .an .increase .of . .
EUR .18 .million .
– .The .total .P&L .effect .of .this .portfolio .amounts .to .EUR .
− .59 .7 .million .life-to-date, .consisting .of .impairments .of .
EUR .−15 .4 .million .and .valuation .losses .on .trading .
positions .of .EUR .− .44 .4 .million .
1.
Summary oF monoline expoSureii.
RMBS HEL loss coverage migration (in %)
> 2.0 96 17 3 3 5
> 1.5 4 32 5 4 12
Impairment criterion
> 1.0 0 41 43 43 44
< 1.0 0 10 49 50 40
Oct. 07 Dec. 08 Dec. 09 Dec. 10 Sep. 11

Financial Stability board report 22Former Financial inStitutionS Group
Former FiG1.
Former FIg (as of 30 September 2011)
Exposure (¤ billion) 1.79
Outstanding (¤ billion) 1.43
Undrawn (¤ billion) 0.36
P & L effect 2011 (¤ million) -7.6
IFRS category predominantly LAR
Former Financial inStitutionS Group (FiG)iii.
– .This .portfolio .comprises .Financial .Institutions .loan .
assets .that .have .been .allocated .to .the .Restructuring .Unit . .
It .consists .of .a .plain .vanilla .loan .book .to .financial .
institutions .(amounting .to .EUR .0 .72 .billion) .as .well . .
as .loans .which .are .structured .or .have .structured .ele-
ments .(amounting .to .EUR .1 .07 .billion) .
– .In .the .third .quarter .2011 .the .portfolio .has .been .reduced .
by .EUR .0 .14 .billion .(redemptions .and .FX .effects) . .
Total Exposure (¤ billion)
FIG Plain Vanilla . .0.68 | 0.04 0.72
FIG Structured . .0.75 | 0.32 1.07
outstanding undrawn
FiG portFolio detailS2.
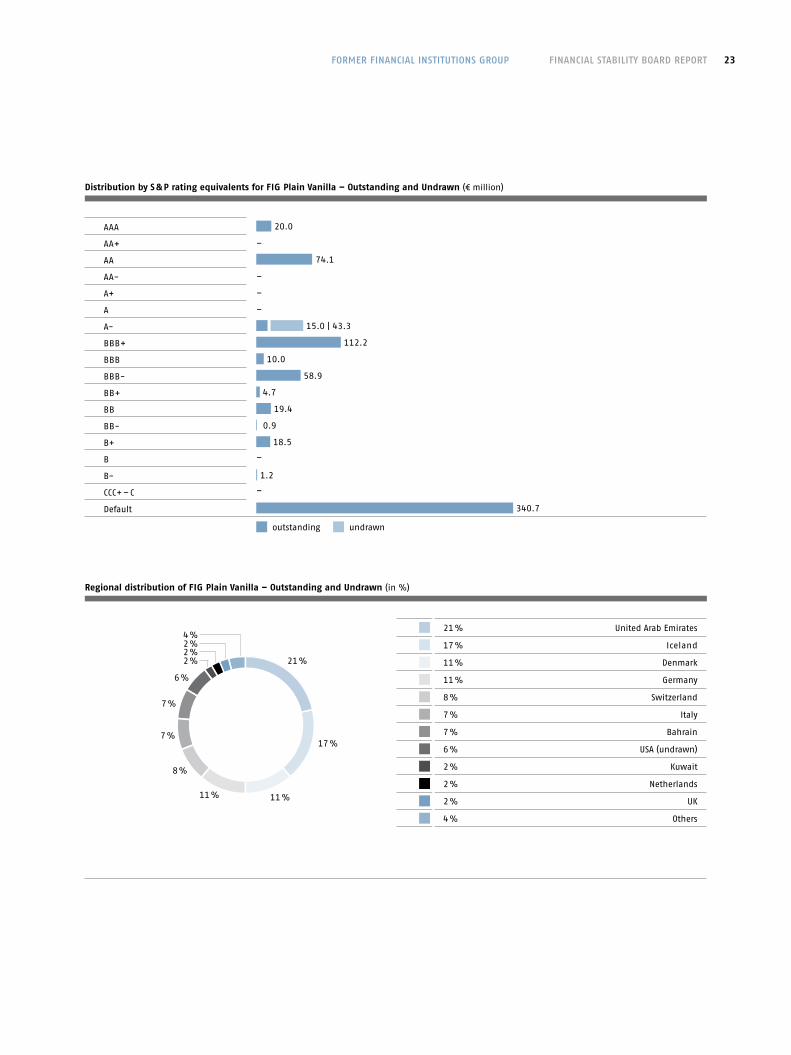
FIg Plain Vanilla (as of 30 September 2011)
Exposure (¤ billion) 0.72
Outstanding (¤ billion) 0.68
Undrawn (¤ billion) 0.04
P & L effect 2011 (¤ million) +3.92
IFRS category predominantly LAR
Financial Stability board report 23Former Financial inStitutionS Group
Distribution by S & P rating equivalents for FIg Plain Vanilla – Outstanding and Undrawn (¤ million)
AAA 20.0
AA+ –
AA 74.1
AA- –
A+ –
A –
A- 15.0 | 43.3
BBB+ 112.2
BBB 10.0
BBB- 58.9
BB+ 4.7
BB 19.4
BB- 0.9
B+ 18.5
B –
B- 1.2
CCC+ – C –
Default 340.7
outstanding undrawn
Regional distribution of FIg Plain Vanilla – Outstanding and Undrawn (in %)
21 % United Arab Emirates
17 % Iceland
11 % Denmark
11 % Germany
8 % Switzerland
7 % Italy
7 % Bahrain
6 % USA (undrawn)
2 % Kuwait
2 % Netherlands
2 % UK
4 % Others
21 %
11 %
17 %
11 %
8 %
7 %
2 %2 %2 %
6 %
7 %
4 %

Financial Stability board report 24Former Financial inStitutionS Group
Distribution by S & P rating equivalents for FIg Structured – Outstanding and Undrawn (¤ million)
AAA –
AA+ –
AA 11.1
AA- –
A+ 32.5 | 140.7
A 195.9 | 68.5
A- –
BBB+ –
BBB 5.3 | 7.1
BBB- –
BB+ 184.7 | 15.3
BB 27.9 | 10.2
BB- 3.6 | 4.5
B+ –
B –
B- 195.3
CCC+ – C 40.7 | 70.4
Default 68.0
outstanding undrawn
FIg Structured (as of 30 September 2011)
Exposure (¤ billion) 1.07
Outstanding (¤ billion) 0.75
Undrawn (¤ billion) 0.32
P & L effect 2011 (¤ million) −11.51
IFRS category predominantly LAR
Regional distribution of FIg structured – Outstanding and Undrawn (in %)
31 % Luxembourg (outstanding)
1 % Luxembourg (undrawn)
28 % UK (outstanding)
4 % UK (undrawn)
23 % USA (undrawn)
7 % USA (outstanding)
3 % Ireland (outstanding)
1 % Ireland (undrawn)
0.4 % Cayman Islands (outstanding)
31 %
1 %0.4 %
1 %
28 %
4 %
7%
23 %
3%

Financial Stability board report 25
credit tradinG1.
Credit Trading (as of 30 September 2011)
Exposure
Bonds (¤ million) 212.3
CDS net (¤ million) −0.6
IFRS category LAR / HFT
Former credit tradinGiv.
The .long ./ .short .CDS .portfolio .of .the .former .Credit . .
Trading .Book .consists .of: .
– .a .EUR .212 .million .outright .bond .portfolio .(97 .6 .% .
Financials; .62 .0 .% .investment .grade) .and .
– .a .downsized .long ./ .short .Single .Name .CDS .portfolio . .
Long .and .short .positions .are .fairly .equal .in .size, .most .
names .neutralize .each .other . .Overall, .the .bank .was: .
. . . .EUR .42 .0 .million .CDS .short .(HSH .Nordbank .as .
protection .buyer); .
. . . .EUR .41 .4 .million .CDS .long .(HSH .Nordbank .as .
protection .seller) .
Former credit tradinG
Distribution of notional by financial ratings for bonds (¤ million)
AAA –AA+ –AA –AA- 5.0
A+ 39.8
A 51.8
A- –BBB+ 17.0
BBB 17.9
BBB- –BB+ 7.8
CCC- 67.8
no rating 5.2

Financial Stability board report 26
Regional distribution of bonds (in %)
40.7 % UK
32.2 % USA
11.8 % Canada
9.2 % Netherlands
3.7 % Ireland
2.4 % Germany
Former credit tradinG / leveraGed Finance
32.2 %
11.8 %
3.7 %
40.7 %
2.4 %
9.2 %
leveraGed Finance oF Global Head corporateS 1.
Change in exposure from 30 June 2010 (¤ billion)
Exposure as of 30 June 2011 3.4
Net Change of Outstanding −0.2
Writedowns 0.0
Exposure as of 30 September 2011 3.2
Risk provision as of 30 September 2011 0.2
leveraGed Finance (lbo)v.
– .As .of .30 .September .2011 .funded .exposure .was .at .EUR .
2 .7 .billion, .unfunded .exposure .at .EUR .0 .5 .billion .

Financial Stability board report 27leveraGed Finance
Distribution by Regions (in %)
Germany 39
Sweden 15
Denmark 15
Finland 11
UK 9
Others 4
Norway 2
Switzerland 0
Australia 3
France 1
Distribution by Industry (in %)
Industrials (Non-Autom.) 45
Consumer Prod. / Services 14
IT, Media, Telcom, Software 10
Materials 4
Healthcare 8
Retail 7
Energy + Power 3
Others 3
Automotive 6
lbos (part oF credit inveStment portFolio HiGHliGHted beFore)
Change in exposure from 30 June 2011 (USD million)
Exposure as of 30 June 2011 108
Net Change of Outstanding 1
Writedowns 0
Exposure as of 30 September 2011 109
Risk provision as of 30 September 2011 1
2.
– .Part .of .Credit .Investment .Portfolio .(contained .in .NY .HY .
Loan .Portfolio)
– .As .of .30 .September .2011 .the .total .exposure .included .
USD .0 .4 .million .undrawn .Revolving .Credit .Facilities . .

Financial Stability board report 28leveraGed Finance
Distribution by Industry (term loans in USD million)
Business Services 23.8
Computer / High Tec 1.7
Diversified / Conglomerate Services 1.0
Healthcare, Education and Childcare 19.1
Leisure, Amusement, Motion Pictures, Entertainment 20.4
Media 4.9
Personal, Food and Miscellaneous Services 6.8
Retail Stores 2.4

HSH nordbank aG Gerhart-Hauptmann-Platz 50 20095 HamburgGermany Phone +49 40 3333–0 Fax +49 40 3333–34001
Martensdamm 624103 KielGermany Phone +49 431 900–01 Fax +49 431 900–34002
[email protected] www.hsh-nordbank.com


