86
Financial Stability Report 2015
Financial Stability Report 2015

Preface
In this report, CBUAE assesses vulnerabilities and risks in the domestic financial system and
covers the key developments that affected financial stability in 2015.
Stability risks have increased at the global and domestic front throughout the year 2015.
Lower commodity prices and the appreciation of the US dollar had a major impact on many
economies, including the United Arab Emirates (UAE). Those factors have weakened the
growth outlook and have increased uncertainties; however diversification of the UAE
economy along with strong support from the banking system have helped to cushion the
negative impact.
I am confident that sustained banking sector liquidity, large capital buffers, solid earnings
and enhanced banking supervision will allow banks to endure the challenging economic
conditions ahead.
In 2015, the CBUAE continued to enhance regulatory framework of licensed institutions in
response to the changing financial landscape. The priorities are on the introduction of a fully
compliant Basel III capital framework, new regulatory framework for non-bank financial
institutions and regulations addressing the key risk management requirements in banks.
Major reforms were also undertaken by CBUAE in order to make payment systems more
efficient and useful to the end users by promoting the use of electronic payments, reducing
cash transactions and at the same time managing the risks more efficiently.
Last, I would like to thank the Securities and Commodity Authority and the Insurance
Authority for their contributions to this report.
Mubarak Rashed Al Mansoori
Governor
Objective of this Financial Stability Report
By issuing this report, CBUAE intends to provide key information to major participants in
the industry in order to allow them a better understanding of risks in the UAE financial
sector.
Definition of Financial Stability
Financial stability describes a steady state in which the financial system, comprising of
banks, other financial institutions and financial markets, efficiently performs its key
functions, such as allocating resources, spreading risk as well as settling payments, and is
able to continue to do so in the event of shocks, stress situations and periods of profound
structural changes.
The report is based on data and information available as at 31 December 2015, unless
otherwise stated.
Data source is CBUAE unless stated otherwise.

Table of Contents
Executive Summary 1
UAE Economic and Monetary Developments 3
Assessment of Risk and Vulnerabilities 11
The Credit Cycle 11
Liquidity 14
Investment Portfolio 19
Banking Sector Overview 21
Financial Soundness Indicators (FSIs) 24
Financial Stability Trend Index 34
Real Estate Markets 39
Shadow Banking 44
Recent Developments 49
Regulatory Developments 49
Islamic Finance 52
UAE Stock Markets 57
The Insurance Sector 64
Financial Market Infrastructure and Payments 70
Appendixes 77
Annex: Key Financial Stability indicators 77
Annex: FSTI Methodology 78
Annex: List of Acronyms 80

1
Executive Summary
Economic growth in the UAE experienced a minor slowdown in 2015. The diversification
of the economy has helped to mitigate the impact of declining government spending as
evident by healthy, albeit declining, growth of non-oil activities.
Credit growth, continued to expand and remained supportive of the UAE economy. Total
domestic credit, which includes loans provided by UAE banks (domestic credit), bonds and
lending from abroad grew 6.3%, slower compared to previous years and might slow down
further in line with the CBUAE GDP forecasts. At the end of 2015 credit-to-non-oil GDP
gap was negative indicating an environment supportive of financial stability.
Despite the challenging economic conditions, the banking system remained solid with
strong capital and sustained profitability. Capital adequacy ratio stood at 18.3% while return
on assets stood at 1.5%. Liquidity position of the banking system remained resilient despite
a decline in government deposit and slower growth in other deposit categories. Capital
market funding continued to grow to account for 9% of banks’ funding profile. Despite
initial concerns, the decline in government deposits had little impact on the banking system
as withdrawn deposits were matched by liquid assets abroad.
The Financial Stability Trend Index (FSTI) has been enhanced to include a larger number of
indicators representing the UAE banking sector, UAE capital market and domestic
economic conditions to arrive at the financial stability stance of the UAE. During the year
2015, the index remained stable around its zero level indicating a limited build-up of
vulnerabilities.
Banks’ investment portfolio expanded with debt securities holdings amounting to 205
bAED. More than 80% of these securities are investment grade, with concentration in
medium and high quality ratings.
The real estate sector poses minimal threat to financial stability. A market correction was
registered in 2015 with 11% and 1% drop in sale prices in Dubai and Abu Dhabi
respectively. Banks’ lending to the real estate sector continues to decline.
Islamic finance in the UAE continued to develop with additional participation of foreign
banks offering Islamic services and growth of Islamic banking assets of 15% during the
year. Total assets expanded to reach 18.7% of total banking system assets.
Risk to financial stability from the shadow banking industry in the UAE is limited; the asset
size remained less than 3 % of the banking system.
Initiatives to strengthen risk management of the payments systems included enhanced
contingency planning and strengthened information security management. The CBUAE
drafted a comprehensive regulation on digital payments services and continued its active
participation at the regional level with the GCC RTGS and Arab Regional Payment System
project.
The CBUAE introduced a new liquidity regulation in accordance with Basel III liquidity
standards, as part of the plan to introduce a fully compliant Basel III framework.

2
During 2015, the Insurance Authority issued new standardized financial reporting forms and
began in depth inspections of all insurance companies with the goal of enforcing new
regulations issued at the end of 2014. The protection of rights of policyholders was
developed according to the frameworks applied internationally, in particular ICP No. (15)
issued by the International Association of Insurance Supervisors (IAIS).
The Emirates Securities Markets index decreased by 6.5% in 2015. It was driven by the
reduction in oil prices as well as the overall growth prospect of the entire region. The total
value of trades traded on both the Abu Dhabi Exchange and Dubai Financial Market stock
exchanges amounted to 209 bAED in 2015 compared to the 525 bAED in 2014. By
launching the Innovation Award for Capital Market Research (90,000 AED), the Securities
and Commodities Authority is promoting innovative research with the aim to tap into new
ideas and creative thinking for the benefit of the UAE’s regulatory authorities.

3
UAE Economic and Monetary Developments
Summary
Economic growth has slowed down in 2015. However, the diversification of
the economy has helped to mitigate the impact of declining oil prices as
evident by robust, growth of non-oil activities. The total CPI inflation is
driven by housing and utility prices, which account for more than 39% of
the consumption basket, giving rise to higher prices volatility in 2015. The
fiscal consolidation started in 2015 by reforming electricity and fuel
subsidies, intending to strengthen the fiscal sustainability over the medium-
term.
Economic Growth
Average oil prices declined by around 48% in 2015 compared to 2014, generating a
significant drop in oil revenues. The slowdown of the Chinese economy, a major trading
partner of the UAE, has also amplified the oil price adverse shock. On the other hand,
relatively higher diversification of the UAE economy has made it less vulnerable to such
fluctuations, with a bigger potential for non-oil private sector performance to drive
economic growth. In testament to more diversified export structure, net exports have had
an increasing contribution to economic growth over time, creating a balanced growth
picture, alongside the domestic demand. The contribution of net exports of goods and
services to the GDP has increased gradually over time from 6.5% in 2010, to reach around
20% in 2014. In addition, the financial system has deepened substantially in recent years
which increased the country’s resilience and boosted non-energy economic growth. These
financial developments promoted financial stability since they allowed for deeper and more
liquid financial sector with diverse instruments that help dampen the impact of shocks.
Based on the recent data release, the total real GDP grew by 3.4% in 2015, in contrast to
4.0% growth in 2014. The real oil GDP surged by around 2.8% in 2015. Concerning the
non-hydrocarbon economic activity, the real non-oil GDP growth slowed down in 2015 to
reach a growth rate of 3.7% against 5.5% in 2014. The CBUAE is forecasting a further
economic slowdown in 2016 (the growth rate of the total GDP is projected to reach 2.5%,
driven by a 3% growth in the non-oil GDP) on account of the persistence of low oil prices.
On the other hand, the economy is expected to rebound in 2017 in line with the recovery in
future oil price, with a total GDP growth projected at 2.9%.

4
Figure 1. GDP growth and economic activity in the U.A.E. (Source: Research and Statistics Department – CBUAE)
The Purchasing Manager’s Index (PMI) and the Dubai Economic Tracker (DET), indicators
of the economic activity, based on surveys of the non-oil economic developments in the
private sector in the UAE and Dubai, respectively, have decreased significantly in 2015.
While the absolute index value remains higher than the 50-threshold during the whole year,
the end-of-period PMI declined by 12% in 2015 compared to 2014, signaling slower -but
positive- growth in the non-oil private sector. The DET followed a similar path; the end-of-
period level declined by around 13% in 2015.
Figure 2. Non-oil economic Activity in the U.A.E (Source: MARKIT & Emirates NBD)
Consumer Price Index and Inflation
The inflation rate reached 4.1% in 2015, against a rate of 2.4% in 2014. The inflation jump
in 2015 generated a higher volatility of prices, leading to more uncertainty about the value of
collaterals and the financial risk. The inflation volatility is around 1.21 in 2015 against 0.6 in
2014. Volatility captures the continued increase in inflation for most of 2015, a trend that
was reversed in the last quarter of the year. These developments are driven mainly by the
housing inflation. Housing prices, covering rental price, electricity, and water and gas prices
1 The volatility is measured by the standard deviation
2.9%2.5%
3.4%4.0%
4.7%
6.8%
3.7%3.0%
3.7%
5.5%5.6%
6.4%
1.2%1.4%
2.8%
0.8%
2.9%
7.6%
2017 (p)2016 (p)2015201420132012
Real GDP (%)
Real Oil GDP (%)
Real non oil GDP (%)
40
45
50
55
60
65
40
45
50
55
60
65
Mar 14
Jun 14
Sep 14
Dec 14
Mar 15
Jun 15
Sep 15
Dec 15
DET
PMI
Threshold Level

5
constitute around 39% of the standard consumption basket in the UAE. They increased on
average by 8.8% in 2015, with a contribution to the total annual inflation of 3.4%, leading to
a total housing price volatility of 4.2 in 2015. In contrast, the housing CPI inflation was only
around 3.2% in 2014, with a contribution to the total CPI inflation by 1.2% and a volatility
of 2.5. The most volatile component in 2015 was the electricity price (see figure 3.3); which
increased by more than 23% due to the electricity subsidy reform in 2015 inducing a
volatility level of 8.2, against 2.5 in 2014. Housing rental prices increased by 8% in 2015 due
mainly to the widening gap between demand and supply. The volatility of rental prices
reached 4.4 in 2015 while it was around 3.4 one year earlier. The price of food and
transportation which constitute altogether 24% of the consumption basket increased by
1.2% and 2%, contributing to the total inflation by 0.17% and 0.2%, respectively in 2015.
Although education accounts only for 4% in the total consumption basket, its contribution
to the total inflation equals 0.15%. The cost of education increased by more than 3.7% in
2015, reflecting higher demand for private schooling.
Figure 3. CPI inflation of Housing sub-components (Source: Federal Competitiveness and Statistics Authority)
-5%
0%
5%
10%
15%
20%
25%
2010 2012 20152011 2013 20142009
Gas
Water
House Rent
Electricity

6
Figure 4. Contribution of different sub-components to the total CPI inflation (Source: Federal Competitiveness and Statistics Authority)
The development of the CPI inflation of different sub-components summarizes the change
of the CPI inflation of two major consumption blocks: tradable goods and non-tradable
goods. The tradable goods account for around 34% of the consumption basket, while the
non-tradable goods account for 66% where housing prices represent 59% of non-tradables.
The CPI inflation of non-tradables was the main driver of the total CPI inflation in 2015
and the most volatile component. Non-tradable inflation was around 3.8% in 2015, with a
volatility of 1, where the CPI of tradables increased only by 0.3% with a volatility level of
0.5. The contribution of the CPI inflation of non-tradables became dominant and increased
significantly during the last three years (0.5% in 2013, 1.7% in 2014).
Figure 5. Contribution of tradables and Non-tradables components to the total CPI inflation (Source: Federal Competitiveness and Statistics Authority)
0.6%
-1.5
-1.0
-0.5
0.0
0.5
1.0
1.5
2.0
2.5
3.0
3.5
4.0
4.5
5.0
-1.5
-1.0
-0.5
0.0
0.5
1.0
1.5
2.0
2.5
3.0
3.5
4.0
4.5
5.0
2015
4.1%
2014
2.4%
2013
1.1%
20122011
0.9%
2010
0.9%
2009
1.6%
Food
Beverages
Textiles and clothing
Housing = House rent, water, electricity and gas
Furniture
Medical care
Transportation
Communications
Culture
Education
Restaurants
Others goods and services
Total Inflation (RHS)
1.3%1.7%
3.8%
1.2% 1.1%0.6%
-0.5%0.5%
0.2%
0.7%
0.7%
2015201320122011 20142010
0.3%
2009
-0.3%
0.3%
Contribution of non-tradables
Contribution of tradables

7
Exchange Rate appreciation and Competitiveness
The nominal effective exchange rate is a weighted average of bilateral exchange rates with
respect to major trading partners. Competitiveness is a function of these movements,
coupled with relative price inflation between the UAE and major trading partners.
Reflecting developments of the US Dollar exchange rate, the effective real exchange rate
(REER) of the dirham (taking account of inflation differences with trading partners)2
appreciated by around 12% in 2015 compared to 2014, in contrast to a total appreciation by
about 15% during the period 2011-2015. Due to the pegging of the UAE dirham to the
dollar, these developments were a one-to-one projection of the US dollar appreciation
during the year. Nonetheless, the lower oil price and tighter government revenues had a
more marked negative effect on deposit growth in the banking sector. In fact, total bank
deposits increased by around 3.5% in 2015, a marked deceleration in growth compared to
previous years.
Figure 6. Real and Nominal Effective Exchange rates (Source: Bank of International Settlement (BIS))
On the other hand, the analysis of the bilateral exchange rate with main trading partners
shows a continuous appreciation of the Dirham against the currencies of both export and
import partners.
2 The REER is an average of the bilateral real exchange rates between the country and each of its trading
partners, weighted by the respective trade shares of each partner.
85%
90%
95%
100%
105%
110%
115%
2005 2006 2007 2008 2009 2010 2011 2012 2013 2014 2015
NEER
REER

8
Table 1. Dirham appreciation against currencies of top non-dollarized import partners (Source: Federal Competitiveness and Statistics Authority and Bloomberg)
Currency
Share of UAE
imports (%)
2014
Exchange
rate 2014
Exchange
rate 2015
% Change of
Currencies per
Dirham
2014
% Change of
Currencies per
Dirham
2015
Chinese Yuan 11.68 1.6776 1.7110 0.22 1.99
Indian Rupee 9.19 16.6094 17.4621 4.02 5.13
Germany
(EUR) 6.09 0.2053 0.2454 0.15 19.53
Japanese Yen 5.55 28.84 32.96 8.50 14.29
UK Pound 3.53 0.1654 0.1782 -5.00 7.74
Swiss Franc 3.38 0.2493 0.2621 -1.19 5.13
Italy (EUR) 3.09 0.2053 0.2454 0.15 19.53
South Korean
Won 2.95 286.8252 308.2172 -3.77 7.46
France (EUR) 2.54 0.2053 0.2454 0.15 19.53
Total 48.00
Weighted
Appreciation
0.56 4.45
9
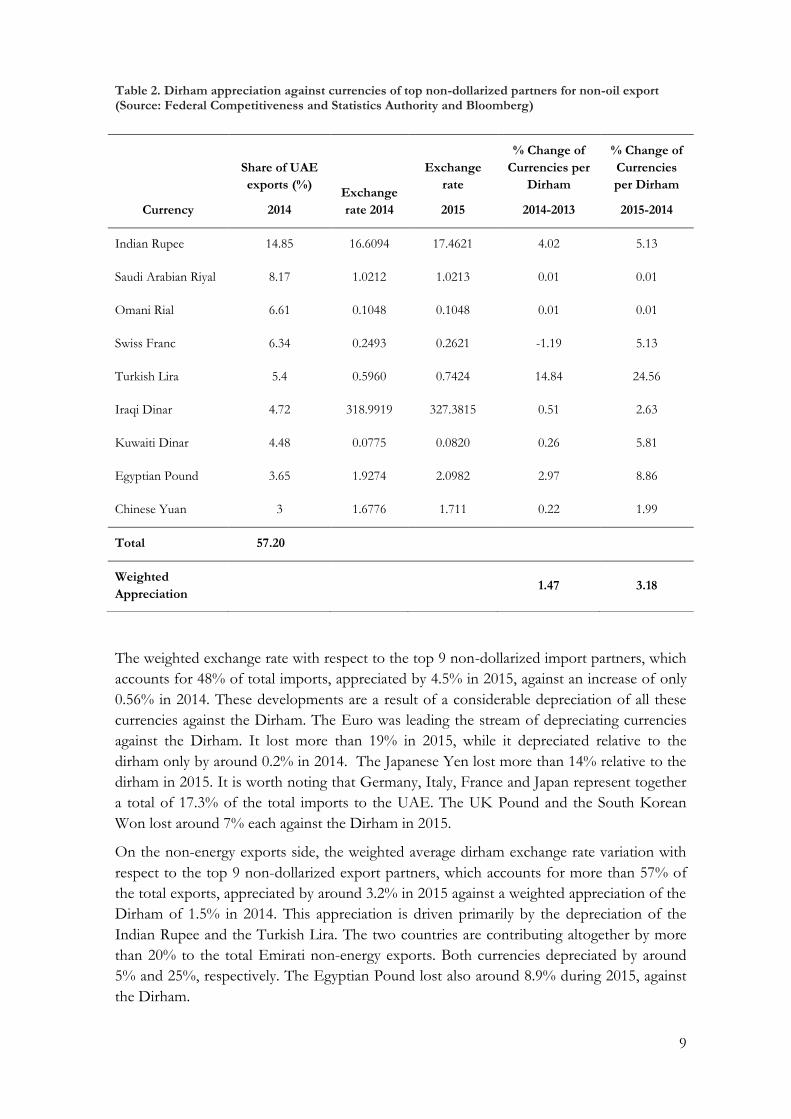
Table 2. Dirham appreciation against currencies of top non-dollarized partners for non-oil export (Source: Federal Competitiveness and Statistics Authority and Bloomberg)
The weighted exchange rate with respect to the top 9 non-dollarized import partners, which
accounts for 48% of total imports, appreciated by 4.5% in 2015, against an increase of only
0.56% in 2014. These developments are a result of a considerable depreciation of all these
currencies against the Dirham. The Euro was leading the stream of depreciating currencies
against the Dirham. It lost more than 19% in 2015, while it depreciated relative to the
dirham only by around 0.2% in 2014. The Japanese Yen lost more than 14% relative to the
dirham in 2015. It is worth noting that Germany, Italy, France and Japan represent together
a total of 17.3% of the total imports to the UAE. The UK Pound and the South Korean
Won lost around 7% each against the Dirham in 2015.
On the non-energy exports side, the weighted average dirham exchange rate variation with
respect to the top 9 non-dollarized export partners, which accounts for more than 57% of
the total exports, appreciated by around 3.2% in 2015 against a weighted appreciation of the
Dirham of 1.5% in 2014. This appreciation is driven primarily by the depreciation of the
Indian Rupee and the Turkish Lira. The two countries are contributing altogether by more
than 20% to the total Emirati non-energy exports. Both currencies depreciated by around
5% and 25%, respectively. The Egyptian Pound lost also around 8.9% during 2015, against
the Dirham.
Currency
Share of UAE
exports (%)
2014
Exchange
rate 2014
Exchange
rate
2015
% Change of
Currencies per
Dirham
2014-2013
% Change of
Currencies
per Dirham
2015-2014
Indian Rupee 14.85 16.6094 17.4621 4.02 5.13
Saudi Arabian Riyal 8.17 1.0212 1.0213 0.01 0.01
Omani Rial 6.61 0.1048 0.1048 0.01 0.01
Swiss Franc 6.34 0.2493 0.2621 -1.19 5.13
Turkish Lira 5.4 0.5960 0.7424 14.84 24.56
Iraqi Dinar 4.72 318.9919 327.3815 0.51 2.63
Kuwaiti Dinar 4.48 0.0775 0.0820 0.26 5.81
Egyptian Pound 3.65 1.9274 2.0982 2.97 8.86
Chinese Yuan 3 1.6776 1.711 0.22 1.99
Total 57.20
Weighted
Appreciation
1.47 3.18

10
Fiscal balance
Based on detailed revenues data available from the Ministry of Finance, the revenues
covered around 80% of the total expenditures in 2015 against a coverage rate of 92% in
2014. This is due mainly to the decrease of these revenue items by 25%, which remains
more proportional than the total expenditure decline (15%).
The revenues’ decline is generated by the cut in tax revenues by 37%, reflecting reduction in
taxes on oil companies in 2015. Social contributions decreased by 15% compared to 2014.
On the expenditures side, except for the compensation of employees and the consumption
of fixed capital, which increased by 24% and 17%, respectively, all expenditure items
decreased. Subsidies fell by around 84% because of the subsidy reform pressed by the
government in 2015, in addition to the decline in transfers to Government Related
Enterprises (GREs). The subsidy reform involved electricity and retail fuel subsidies. They
were implemented in early 2015 and in August 2015, respectively. Fuel prices were set in
accordance with global oil price benchmarks. Although these reforms put an inflationary
pressure on housing and transportation prices, they resulted in budget savings of around 3%
of total expenditures.
The expenditure decline in 2015 is part of the implementation of a gradual fiscal
consolidation, intending to strengthen the fiscal sustainability over the medium-term against
the backdrop of persistent decline in the oil price.
Figure 7. Fiscal Stance (Source: Ministry of Finance)
-200
-100
0
100
200
300
400
500
600
2012 20152013 2014
Revenues
Expenditure
Fiscal Balance

11
Assessment of Risk and Vulnerabilities
The Credit Cycle
Credit supply
In 2015 UAE credit cycle continued on a trend of a moderate growth that started after the
Global Financial Crisis (GFC). Total domestic credit which includes loans provided by UAE
banks (domestic credit) to the economy, bonds and lending from abroad increased at levels
similar to the nominal non-oil GDP3 growth. While loans of the banking sector (domestic
credit) to UAE based borrowers increased by 8.1% total domestic credit increased by 6.3%.
Figure 8. Change in total domestic credit and non-oil economy (Sources: National Bureau of Statistics, Bloomberg and FSU staff estimates)
Total estimated domestic credit supply was 2.2 tAED at the end of 2015, with two thirds of
the amount in the form of local banks lending. Outstanding bond and sukuk issues
amounted to 16% and estimated loans to banks abroad was approximately 20% of the total
debt.
Figure 9. Total domestic credit (in bAED) (Sources: Bloomberg and CBUAE estimates)
3 As oil GDP is primarily cash funded and unrelated to domestic credit, non-oil GDP is more relevant as a benchmark in assessing the trend of credit growth.
-20%
0%
20%
40%
60%
2006 2007 2008 2009 2010 2011 2012 2013 2014 2015
Total domestic credit UAE banks loans (domestic) Nominal non-oil GDP
48.2%
51.6%
41.7%
14.7% 6.9%
4.9% 3.9% 7.3%
7.1% 6.3%
-
500
1,000
1,500
2,000
2,500
2005 2006 2007 2008 2009 2010 2011 2012 2013 2014 2015
Loans of UAE banks Bonds Loans of foreign banks % Annual growth of total credit
12
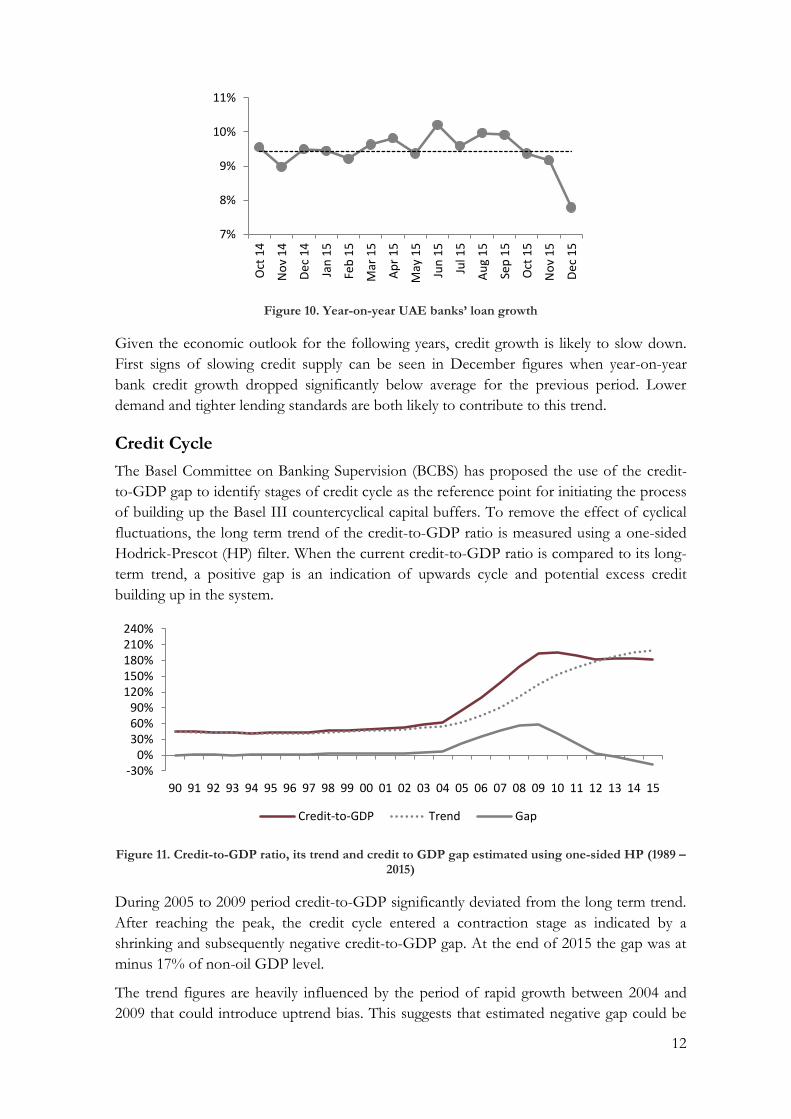
Figure 10. Year-on-year UAE banks’ loan growth
Given the economic outlook for the following years, credit growth is likely to slow down.
First signs of slowing credit supply can be seen in December figures when year-on-year
bank credit growth dropped significantly below average for the previous period. Lower
demand and tighter lending standards are both likely to contribute to this trend.
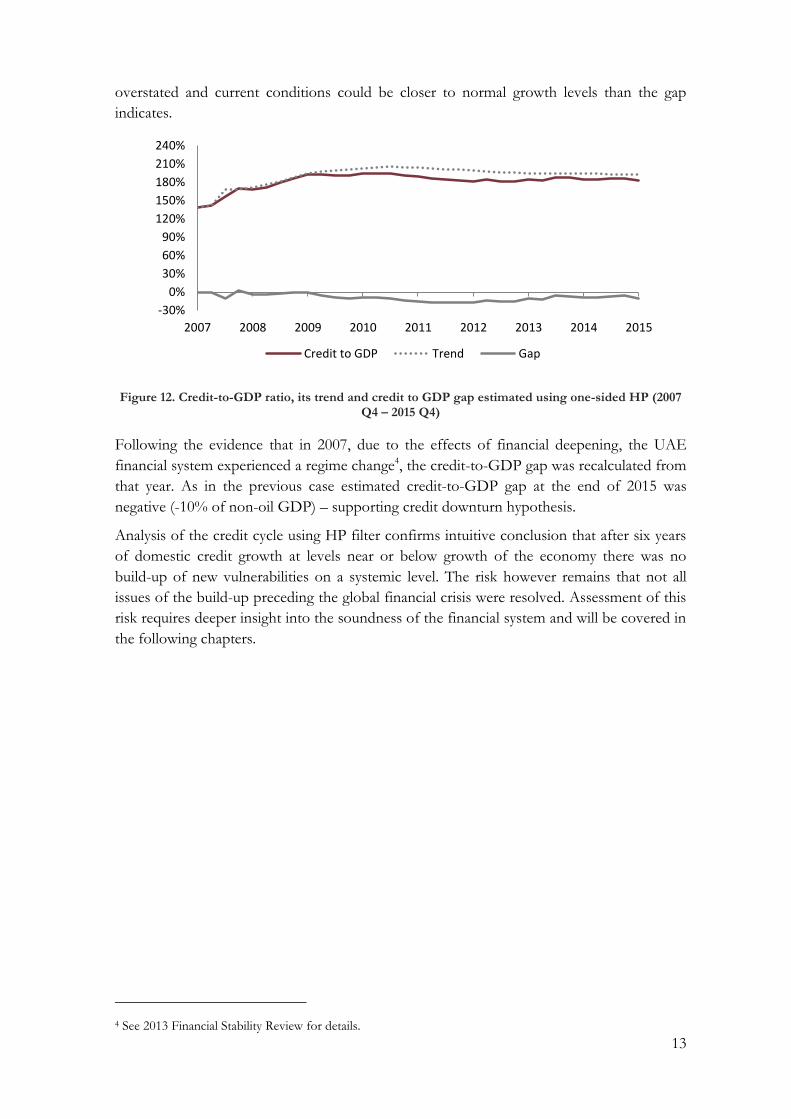
Credit Cycle
The Basel Committee on Banking Supervision (BCBS) has proposed the use of the credit-
to-GDP gap to identify stages of credit cycle as the reference point for initiating the process
of building up the Basel III countercyclical capital buffers. To remove the effect of cyclical
fluctuations, the long term trend of the credit-to-GDP ratio is measured using a one-sided
Hodrick-Prescot (HP) filter. When the current credit-to-GDP ratio is compared to its long-
term trend, a positive gap is an indication of upwards cycle and potential excess credit
building up in the system.
Figure 11. Credit-to-GDP ratio, its trend and credit to GDP gap estimated using one-sided HP (1989 – 2015)
During 2005 to 2009 period credit-to-GDP significantly deviated from the long term trend.
After reaching the peak, the credit cycle entered a contraction stage as indicated by a
shrinking and subsequently negative credit-to-GDP gap. At the end of 2015 the gap was at
minus 17% of non-oil GDP level.
The trend figures are heavily influenced by the period of rapid growth between 2004 and
2009 that could introduce uptrend bias. This suggests that estimated negative gap could be
7%
8%
9%
10%
11%
Oct
14
No
v 1
4
De
c 1
4
Jan
15
Feb
15
Mar
15
Ap
r 1
5
May
15
Jun
15
Jul 1
5
Au
g 1
5
Sep
15
Oct
15
No
v 1
5
De
c 1
5
-30%0%
30%60%90%
120%150%180%210%240%
90 91 92 93 94 95 96 97 98 99 00 01 02 03 04 05 06 07 08 09 10 11 12 13 14 15
Credit-to-GDP Trend Gap
13
overstated and current conditions could be closer to normal growth levels than the gap
indicates.
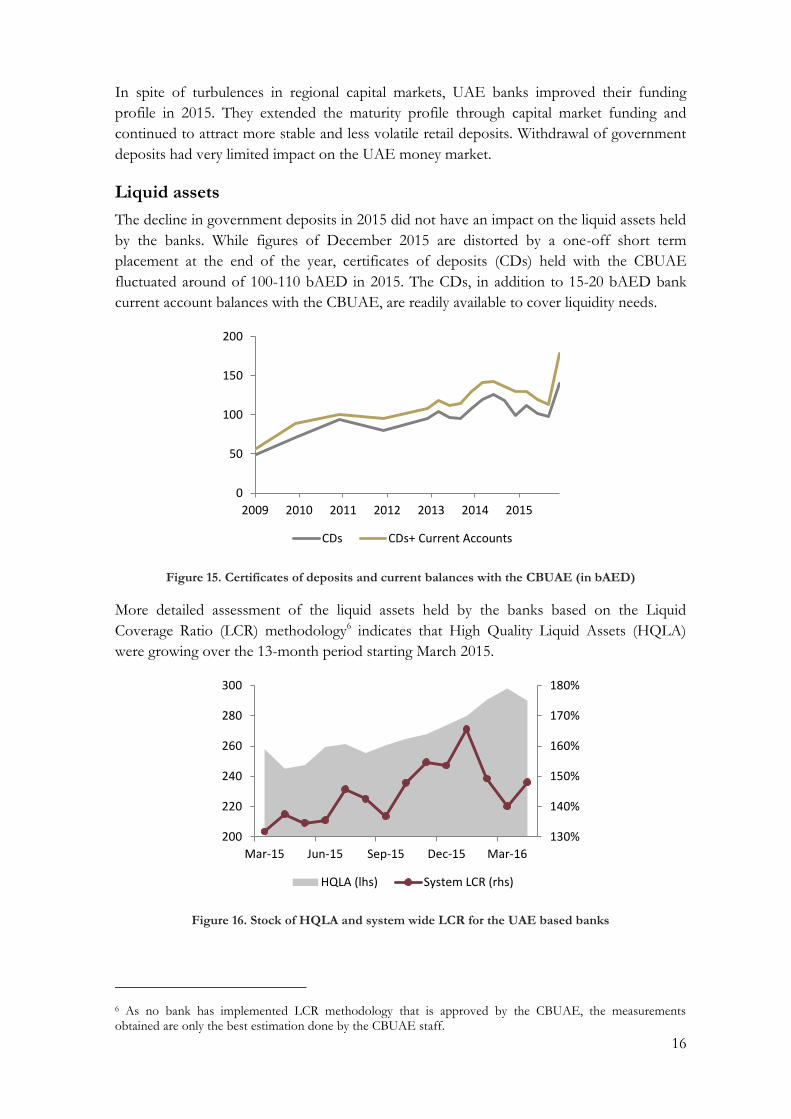
Figure 12. Credit-to-GDP ratio, its trend and credit to GDP gap estimated using one-sided HP (2007 Q4 – 2015 Q4)
Following the evidence that in 2007, due to the effects of financial deepening, the UAE
financial system experienced a regime change4, the credit-to-GDP gap was recalculated from
that year. As in the previous case estimated credit-to-GDP gap at the end of 2015 was
negative (-10% of non-oil GDP) – supporting credit downturn hypothesis.
Analysis of the credit cycle using HP filter confirms intuitive conclusion that after six years
of domestic credit growth at levels near or below growth of the economy there was no
build-up of new vulnerabilities on a systemic level. The risk however remains that not all
issues of the build-up preceding the global financial crisis were resolved. Assessment of this
risk requires deeper insight into the soundness of the financial system and will be covered in
the following chapters.
4 See 2013 Financial Stability Review for details.
-30%
0%
30%
60%
90%
120%
150%
180%
210%
240%
2007 2008 2009 2010 2011 2012 2013 2014 2015
Credit to GDP Trend Gap

14
Liquidity
Summary
Despite initial concerns, financial sector liquidity was not affected by the
decline in government deposits which took place in 2015. The deposits
withdrawn had been matched with placements abroad which were
simultaneously liquidated. This allowed banks’ lending growth to corporate
and household to remain at the same level as in 2014. Over the past 6 years
banks funding growth has largely exceeded lending, allowing for the
accumulation of a large funding buffer. The result of a liquidity stress test
based upon LCR methodology confirms that banks are holding enough
liquid assets to cover un-expected outflows.
While the concept of liquidity is commonly used and intuitively understood by many, there
is no widely agreed definition. The BCBS defines it as the ability to fund increases in assets
and meet obligations as they come due, without incurring unacceptable losses5. This
definition implies three distinct states of liquidity: (1) normal liquidity where bank is able to
perform all defined actions; (2) restrictive liquidity, where bank can meet all existing
obligations, but is restricted in extending new credit; and (3) stressed liquidity, when bank
cannot meet existing obligation without incurring unacceptable losses. While restrictive
liquidity does not threaten survival of financial institutions (incurred cost is in the form of
lost opportunities), it impairs capacity of the financial system to perform its functions and in
this way is not compatible with financial stability. Sustained stressed liquidity, the most
extreme liquidity state, can cause severe losses to financial institutions and even lead to
insolvency.
Liquidity risk can be defined as a risk that a bank will not be able to fund increases in
assets and meet obligations as they come due. Or, if defined in terms of liquidity states, the
risk of leaving state of normal liquidity. In probabilistic terms, liquidity risk refers to
distribution of probabilities of future liquidity states.
Primary responsibility for liquidity risk management falls to banks. The major role of central
banks is to ensure that banks have robust liquidity risk management frameworks that ensure
they can maintain sufficient liquidity. As there are no established reliable measures for
liquidity or liquidity risk, the following assessment will be concentrated on the process of
liquidity management in the banks, in particular, funding diversification and cushions
provided by liquid assets. It will also cover liquidity stress testing performed by the CBUAE,
as well as, facilities the CBUAE provides to help the banks meet their liquidity needs.
Funding diversification
Since 2009, banks’ funding base has been expanding much faster than lending. The
Compound Annual Growth Rate (CAGR) for funding has been strong at 7.3%, compared
with a 5.8% CAGR for lending. This difference in the growth rate has allowed the banking
system to accumulate a large funding buffer.
5 Basel Committee on Banking Supervision, “Principles for Sound Liquidity Risk Management and Supervision”, 2008

15
Despite the growth, the UAE banking system remained primarily deposits funded. In 2015,
deposits constituted 91% of the funding base. The remaining 9% were in the form of capital
market funding. This alternative source of funding, which grew steadily since 2006, is highly
attractive from the liquidity management perspective, as it provides medium term funding
with highly predictive outflows.
Figure 13. Funding profile of the UAE based banks.
Diversification was also increasing in deposit funding. More concentrated funding sources,
such as government and government related entities (GRE), fell below 12% in 2015. Due to
stable increase in retail and corporate deposits, the share of private sector continued to
increase. Interbank borrowings, while essential for short term liquidity management, are not
considered as a funding source. At the end of 2015, net foreign interbank position of the
UAE banks was near zero.
The test to the liquidity management of some banks came in 2015 when government
withdrew some of the foreign currency deposits (~2% of total funding base). The
withdrawal had little impact on the banking system as withdrawn deposits were matched by
liquid assets abroad.
Figure 14. Spread between EIBOR and LIBOR (pp).
A comparison of EIBOR and LIBOR shows that the interest rate differential, representative
of interbank liquidity situation, has been continuously shrinking since the GFC. There was a
slight increase in the one month maturities during the third quarter of 2015, possibly as a
concern of the potential impact of government deposits withdrawal, but by year end the
difference was lower than at the end of 2014.
13%
14%
12%
13%
12%
12%
37%
37%
39%
24%
24%
24%
8%
8%
9%
0% 20% 40% 60% 80% 100%
2013
2014
2015
Government
GRE
Corporate
Retail
NBFI
Capital Market Funding
-2
-1
0
1
2
3
4
5
2008 2009 2010 2011 2012 2013 2014 2015
Spread (1 month) Spread (3 month)
16
In spite of turbulences in regional capital markets, UAE banks improved their funding
profile in 2015. They extended the maturity profile through capital market funding and
continued to attract more stable and less volatile retail deposits. Withdrawal of government
deposits had very limited impact on the UAE money market.
Liquid assets
The decline in government deposits in 2015 did not have an impact on the liquid assets held
by the banks. While figures of December 2015 are distorted by a one-off short term
placement at the end of the year, certificates of deposits (CDs) held with the CBUAE
fluctuated around of 100-110 bAED in 2015. The CDs, in addition to 15-20 bAED bank
current account balances with the CBUAE, are readily available to cover liquidity needs.
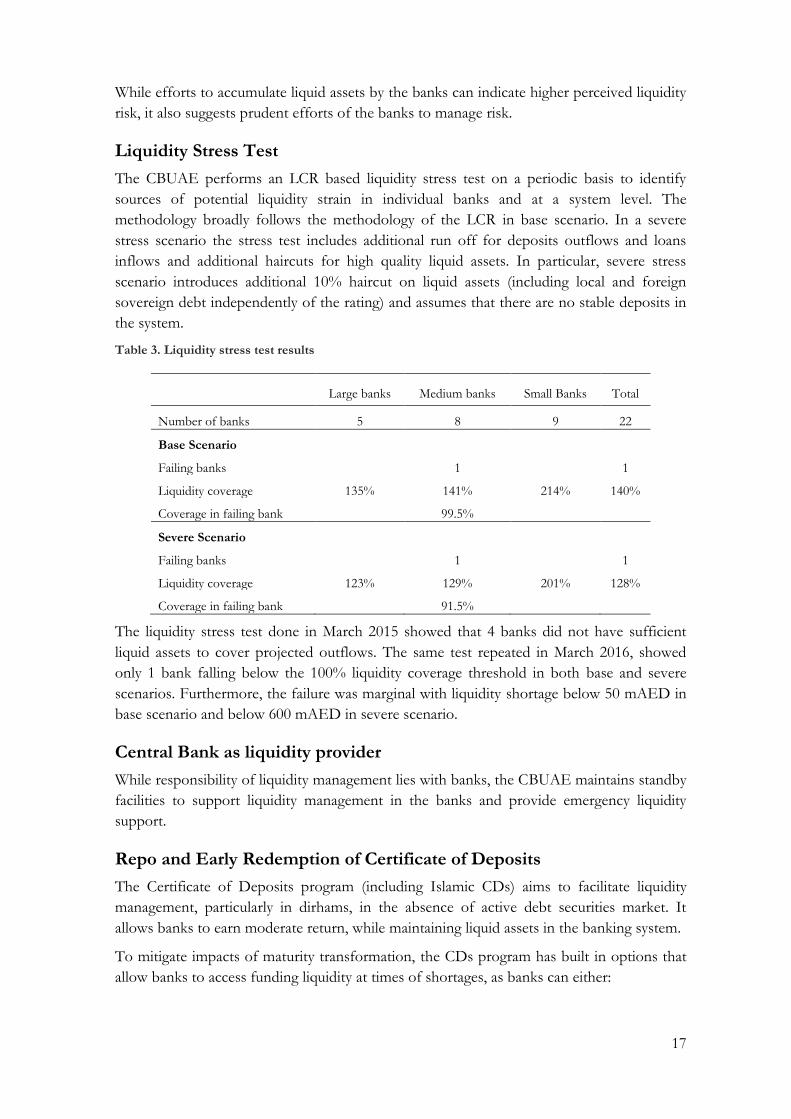
Figure 15. Certificates of deposits and current balances with the CBUAE (in bAED)
More detailed assessment of the liquid assets held by the banks based on the Liquid
Coverage Ratio (LCR) methodology6 indicates that High Quality Liquid Assets (HQLA)
were growing over the 13-month period starting March 2015.
Figure 16. Stock of HQLA and system wide LCR for the UAE based banks
6 As no bank has implemented LCR methodology that is approved by the CBUAE, the measurements obtained are only the best estimation done by the CBUAE staff.
0
50
100
150
200
2009 2010 2011 2012 2013 2014 2015
CDs CDs+ Current Accounts
130%
140%
150%
160%
170%
180%
200
220
240
260
280
300
Mar-15 Jun-15 Sep-15 Dec-15 Mar-16
HQLA (lhs) System LCR (rhs)
17
While efforts to accumulate liquid assets by the banks can indicate higher perceived liquidity
risk, it also suggests prudent efforts of the banks to manage risk.
Liquidity Stress Test
The CBUAE performs an LCR based liquidity stress test on a periodic basis to identify
sources of potential liquidity strain in individual banks and at a system level. The
methodology broadly follows the methodology of the LCR in base scenario. In a severe
stress scenario the stress test includes additional run off for deposits outflows and loans
inflows and additional haircuts for high quality liquid assets. In particular, severe stress
scenario introduces additional 10% haircut on liquid assets (including local and foreign
sovereign debt independently of the rating) and assumes that there are no stable deposits in
the system.
Table 3. Liquidity stress test results
Large banks Medium banks Small Banks Total
Number of banks 5 8 9 22
Base Scenario
Failing banks 1 1
Liquidity coverage 135% 141% 214% 140%
Coverage in failing bank 99.5%
Severe Scenario
Failing banks 1 1
Liquidity coverage 123% 129% 201% 128%
Coverage in failing bank 91.5%
The liquidity stress test done in March 2015 showed that 4 banks did not have sufficient
liquid assets to cover projected outflows. The same test repeated in March 2016, showed
only 1 bank falling below the 100% liquidity coverage threshold in both base and severe
scenarios. Furthermore, the failure was marginal with liquidity shortage below 50 mAED in
base scenario and below 600 mAED in severe scenario.
Central Bank as liquidity provider
While responsibility of liquidity management lies with banks, the CBUAE maintains standby
facilities to support liquidity management in the banks and provide emergency liquidity
support.
Repo and Early Redemption of Certificate of Deposits
The Certificate of Deposits program (including Islamic CDs) aims to facilitate liquidity
management, particularly in dirhams, in the absence of active debt securities market. It
allows banks to earn moderate return, while maintaining liquid assets in the banking system.
To mitigate impacts of maturity transformation, the CDs program has built in options that
allow banks to access funding liquidity at times of shortages, as banks can either:
18
Repo the CDs at prevalent CBUAE’s repo rate for periods varying from overnight
to 3 months; or
Redeem the CDs to CBUAE prior to its maturity date.
US Dollar/Dirham Swaps for Dirham liquidity
US Dollar/Dirham swap arrangements involve a simultaneous sale and forward purchase of
US Dollars against the purchase/forward sale of equivalent Dirham amount between a bank
and the CBUAE. On a daily basis, the CBUAE provides the pricing/forward rates for this
facility across the tenure ranging from one week to 12 months.
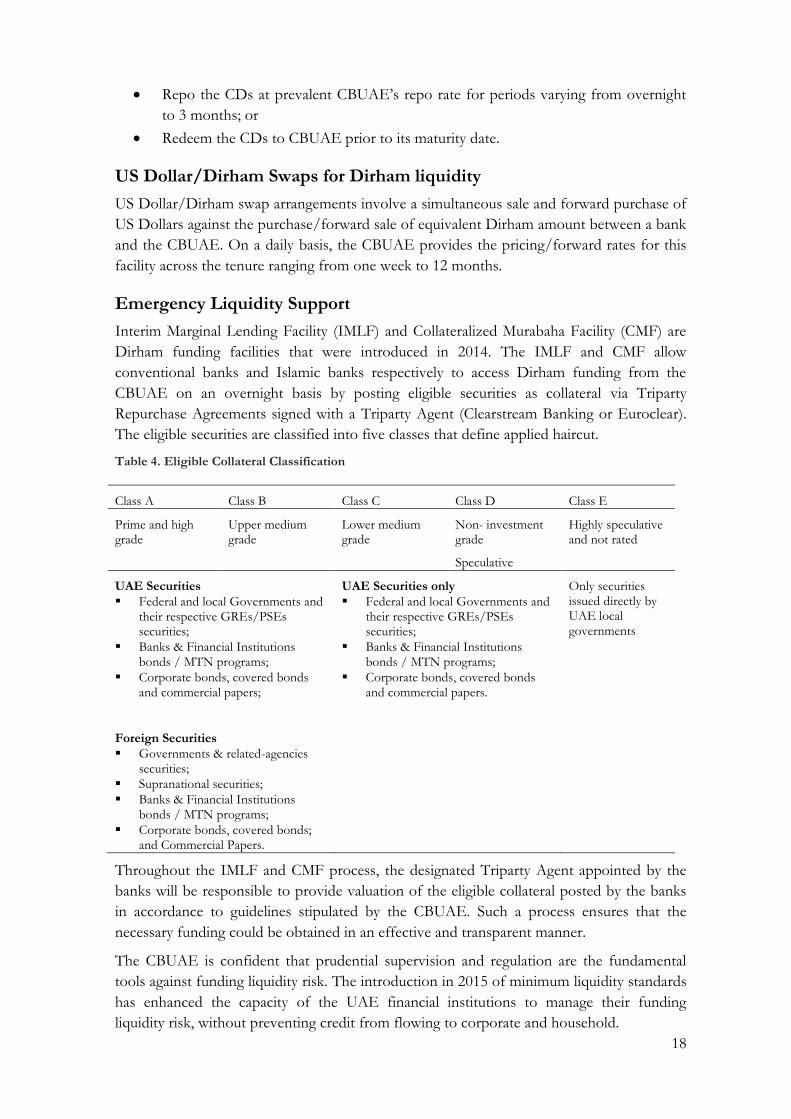
Emergency Liquidity Support
Interim Marginal Lending Facility (IMLF) and Collateralized Murabaha Facility (CMF) are
Dirham funding facilities that were introduced in 2014. The IMLF and CMF allow
conventional banks and Islamic banks respectively to access Dirham funding from the
CBUAE on an overnight basis by posting eligible securities as collateral via Triparty
Repurchase Agreements signed with a Triparty Agent (Clearstream Banking or Euroclear).
The eligible securities are classified into five classes that define applied haircut.
Table 4. Eligible Collateral Classification
Class A Class B Class C Class D Class E
Prime and high grade
Upper medium grade
Lower medium grade
Non- investment grade
Speculative
Highly speculative and not rated
UAE Securities
Federal and local Governments and their respective GREs/PSEs securities;
Banks & Financial Institutions bonds / MTN programs;
Corporate bonds, covered bonds and commercial papers;
Foreign Securities
Governments & related-agencies securities;
Supranational securities;
Banks & Financial Institutions bonds / MTN programs;
Corporate bonds, covered bonds; and Commercial Papers.
UAE Securities only
Federal and local Governments and their respective GREs/PSEs securities;
Banks & Financial Institutions bonds / MTN programs;
Corporate bonds, covered bonds and commercial papers.
Only securities issued directly by UAE local governments
Throughout the IMLF and CMF process, the designated Triparty Agent appointed by the
banks will be responsible to provide valuation of the eligible collateral posted by the banks
in accordance to guidelines stipulated by the CBUAE. Such a process ensures that the
necessary funding could be obtained in an effective and transparent manner.
The CBUAE is confident that prudential supervision and regulation are the fundamental
tools against funding liquidity risk. The introduction in 2015 of minimum liquidity standards
has enhanced the capacity of the UAE financial institutions to manage their funding
liquidity risk, without preventing credit from flowing to corporate and household.
19
Investment Portfolio
Summary
Banks’ holdings of debt securities have doubled over the past six years. Of
the 205 bAED externally rated securities, 168 bAED or 82% were invested in
investment grade debt securities. UAE issuers represent the largest category
with 43% of the total amount in banks’ investment portfolios. More than
80% of the debt securities held was USD denominated and 68% of the bond
portfolios were maturing within five years.
The introduction of Eligible Liquid Asset Ratio (ELAR) and further migration of some
banks to Basel III liquidity measures puts more responsibility on the industry in managing
their liquidity. In particular it seeks to reduce reliance on the central banks. Security
holdings, therefore, are increasingly important tool in banks’ liquidity management. The
following is a review of the debt security investment portfolios of the UAE banks.
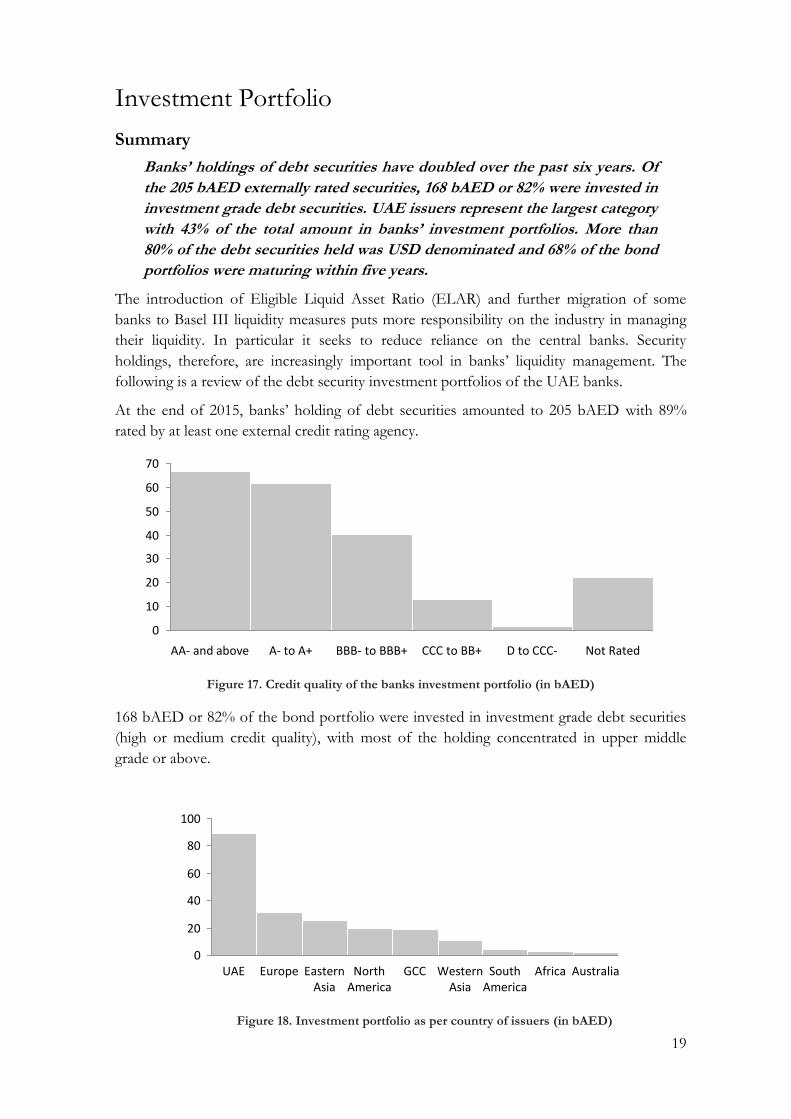
At the end of 2015, banks’ holding of debt securities amounted to 205 bAED with 89%
rated by at least one external credit rating agency.
Figure 17. Credit quality of the banks investment portfolio (in bAED)
168 bAED or 82% of the bond portfolio were invested in investment grade debt securities
(high or medium credit quality), with most of the holding concentrated in upper middle
grade or above.
Figure 18. Investment portfolio as per country of issuers (in bAED)
70
60
40
20
0
10
30
50
CCC to BB+BBB- to BBB+A- to A+AA- and above D to CCC- Not Rated
100
80
60
40
20
0South
AmericaWestern
AsiaGCCNorth
AmericaEastern
AsiaEuropeUAE AustraliaAfrica
20
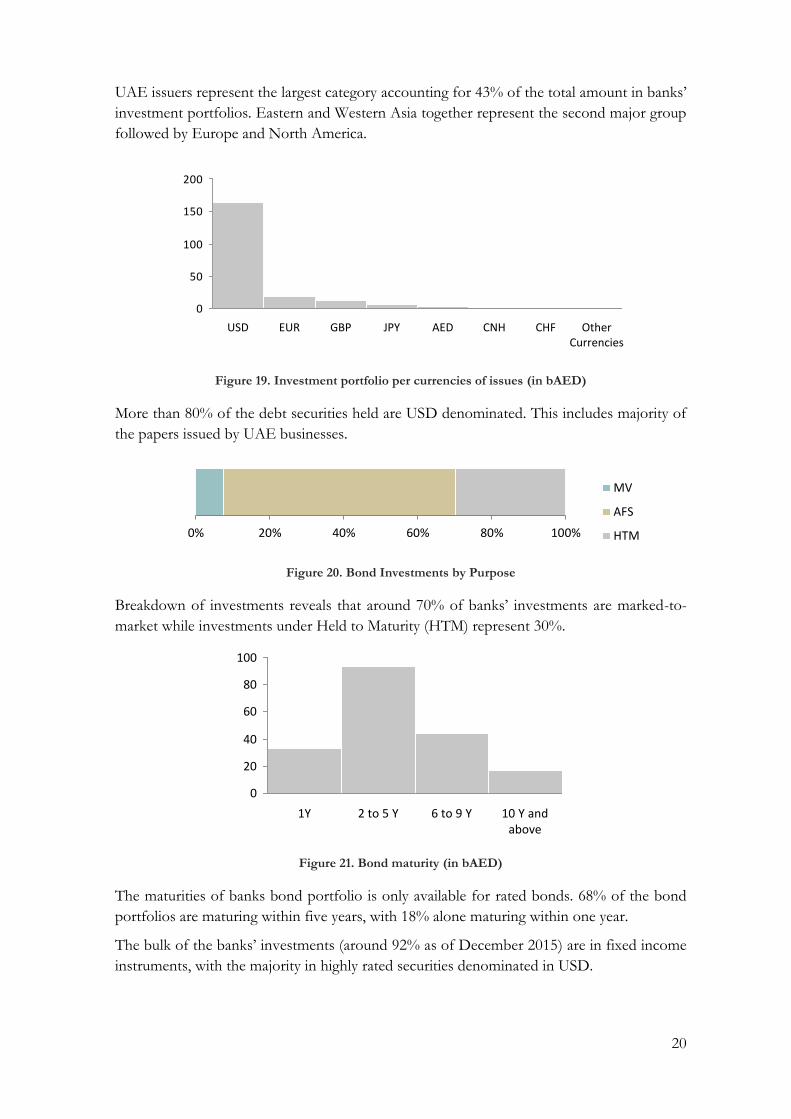
UAE issuers represent the largest category accounting for 43% of the total amount in banks’
investment portfolios. Eastern and Western Asia together represent the second major group
followed by Europe and North America.
Figure 19. Investment portfolio per currencies of issues (in bAED)
More than 80% of the debt securities held are USD denominated. This includes majority of
the papers issued by UAE businesses.
Figure 20. Bond Investments by Purpose
Breakdown of investments reveals that around 70% of banks’ investments are marked-to-
market while investments under Held to Maturity (HTM) represent 30%.
Figure 21. Bond maturity (in bAED)
The maturities of banks bond portfolio is only available for rated bonds. 68% of the bond
portfolios are maturing within five years, with 18% alone maturing within one year.
The bulk of the banks’ investments (around 92% as of December 2015) are in fixed income
instruments, with the majority in highly rated securities denominated in USD.
0
50
100
150
200
CNHAEDJPYGBPEURUSD Other Currencies
CHF
0% 20% 40% 60% 80% 100%
MV
AFS
HTM
40
20
0
60
80
100
10 Y and above
6 to 9 Y2 to 5 Y1Y
21
Banking Sector Overview
Summary
The UAE banking sector was well capitalised with an average capital
adequacy ratio of 18.3% (T1 16.6%). Return on Assets (ROA) and Return on
Equity (ROE) were at 1.5% and 11.4% respectively in 2015. Non-performing
loans declined by end-2015 to 6.2% and remained fully provisioned. System
liquidity remained at comfortable levels with the ratio of eligible liquid
assets to total liabilities at 16.6% 7as at the end of 2015.
Over the past decades, the UAE has emerged as a major regional financial centre. As part of
the country’s vision, the financial sector has come to play a significant role in economic
activity and job creation. The financial system remains dominated by the banking sector. As
of December 2015, the banking sector in the UAE was made up of 53 banks (22 local banks
including eight Islamic banks and 31 foreign bank branches).
Assets
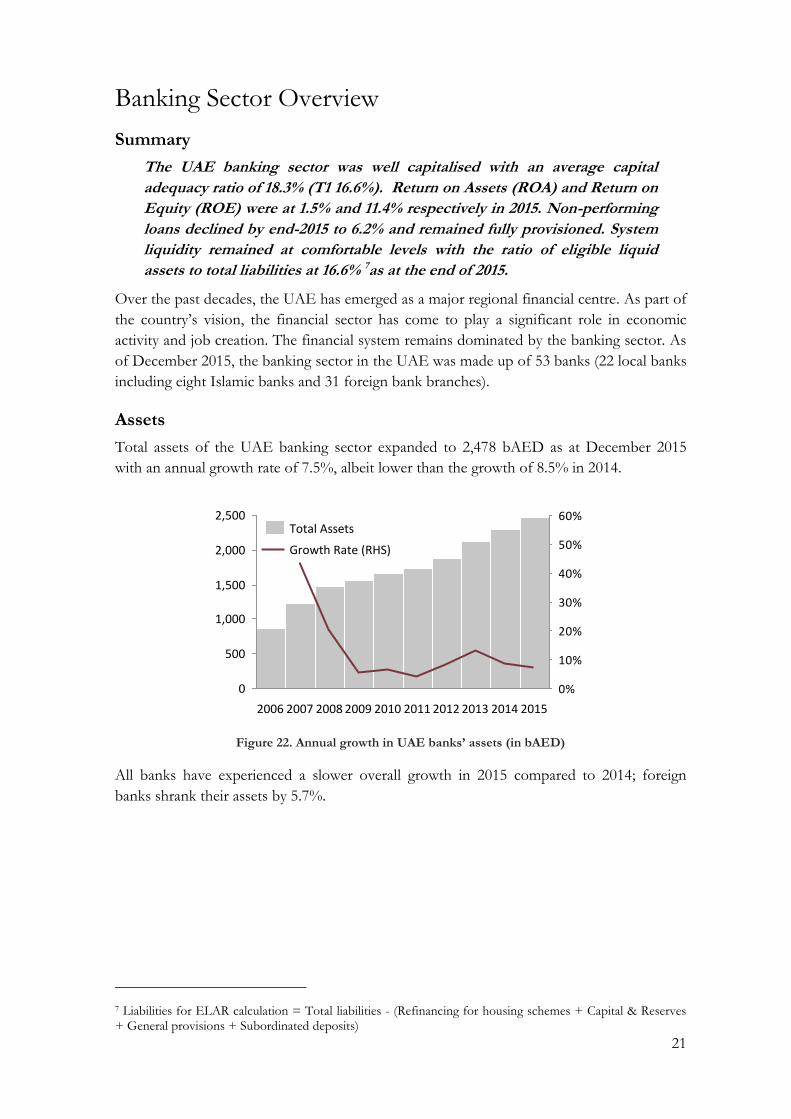
Total assets of the UAE banking sector expanded to 2,478 bAED as at December 2015
with an annual growth rate of 7.5%, albeit lower than the growth of 8.5% in 2014.
Figure 22. Annual growth in UAE banks’ assets (in bAED)
All banks have experienced a slower overall growth in 2015 compared to 2014; foreign
banks shrank their assets by 5.7%.
7 Liabilities for ELAR calculation = Total liabilities - (Refinancing for housing schemes + Capital & Reserves + General provisions + Subordinated deposits)
0%
10%
20%
30%
40%
50%
60%2,500
2,000
1,500
1,000
500
0
2015201420132012201120102009200820072006
Growth Rate (RHS)
Total Assets
22
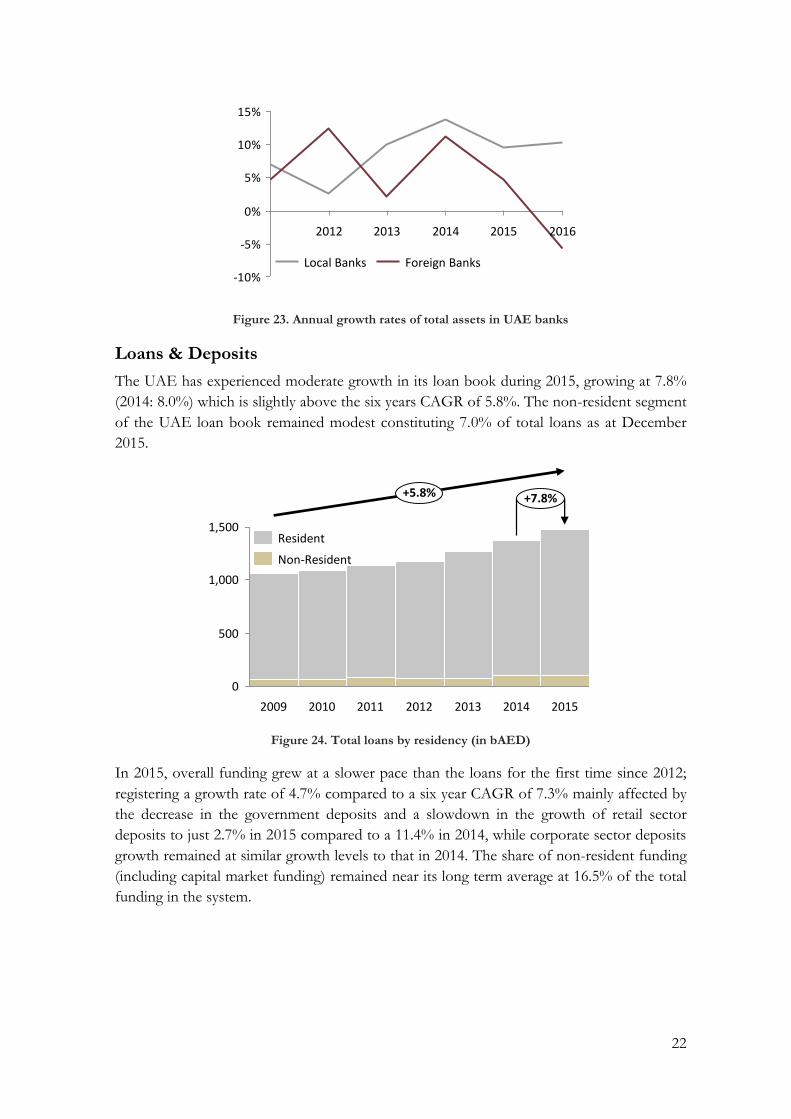
Figure 23. Annual growth rates of total assets in UAE banks
Loans & Deposits
The UAE has experienced moderate growth in its loan book during 2015, growing at 7.8%
(2014: 8.0%) which is slightly above the six years CAGR of 5.8%. The non-resident segment
of the UAE loan book remained modest constituting 7.0% of total loans as at December
2015.
Figure 24. Total loans by residency (in bAED)
In 2015, overall funding grew at a slower pace than the loans for the first time since 2012;
registering a growth rate of 4.7% compared to a six year CAGR of 7.3% mainly affected by
the decrease in the government deposits and a slowdown in the growth of retail sector
deposits to just 2.7% in 2015 compared to a 11.4% in 2014, while corporate sector deposits
growth remained at similar growth levels to that in 2014. The share of non-resident funding
(including capital market funding) remained near its long term average at 16.5% of the total
funding in the system.
-10%
-5%
0%
5%
10%
15%
20162015201420132012
Foreign BanksLocal Banks
0
1,500
1,000
500
201420132012201120102009
+7.8%
2015
+5.8%
Non-Resident
Resident

23
Figure 25. Total funding by residency (in bAED)
Overall, total loans to funding ratio increased modestly during 2015 to 90.6% (2014: 88.0
%). The loan-to-deposit ratio has also reversed its declining trend since 2008 to increase
during 2015, reaching 100%. (2014: 97%)
Figure 26. Deposits and loans (in bAED), loan to deposit and loan to funding ratio
The deposit structure has remained largely unchanged with a stronger growth in demand
and saving deposits, while time deposits slightly declined.
Figure 27. Deposits structure (in bAED)
2,000
1,500
1,000
500
0
+4.7%
2015201420132012201120102009
+7.3%
CMFNon-ResidentResident
0
300
600
900
1,200
1,500
85%
90%
95%
100%
105%
110%
115%
120%
20152014201320122011201020092008200720062005
Loans to Deposits (RHS)Total Deposits
Total Loans Loans to Funding (RHS)
622 659 695 652 701 692 730 726
301 330 364 428480 606
702 762
+4%
-1%
20152014201320122011201020092008
Demand & Savings Deposits
Time Deposits

24
Financial Soundness Indicators (FSIs)
Summary
FSIs are used at an individual institutional level for micro supervision and
on an aggregated basis to capture trends in the UAE financial system. They
constitute an important component in the CBUAE’s banking sector
surveillance framework. Used in combination with other indicators, they are
useful in assessing financial stability and detecting the build-up of systemic
risks.
Capital Adequacy
UAE local banks remain highly capitalised with a total capital adequacy ratio (CAR) of
18.3% and a Tier 1 ratio of 16.6% as of December 2015. The CAR ratios have slowly
declined from their peak reached in 2011. This decline can be attributed to all banks having
fully repaid Ministry of Finance Tier 2 capital instruments issued in 2009 as well as the credit
growth seen between 2013 and 2015. Current ratios significantly exceed Basel II capital
requirements.
Figure 28. Tier 1 and total capital adequacy ratios (calculated according to Basel I before 2011 and Basel II from 2011 onwards).8
Asset Quality
Non-Performing Loans (NPLs)
NPL is a key ratio in measuring asset quality, albeit lagging; it shows signs of deterioration in
the asset quality of banks. As at December 2015, the UAE banking system had an NPL ratio
of 6.2% representing total classified loans of 93 bAED. This was a decline from the 7.0% of
December 2014.
The dynamics of the NPL depend on multiple factors (write offs, write backs and new
defaults). New defaults have started to increase during the last quarter of 2015 driven by the
difficulties faced in the SME sector.
8 Local banks only
0%
5%
10%
15%
20%
25%
2016201520142013201220112010200920082005 2006 2007
Tier 1 to RWA ratio
Total Capital to RWA
25
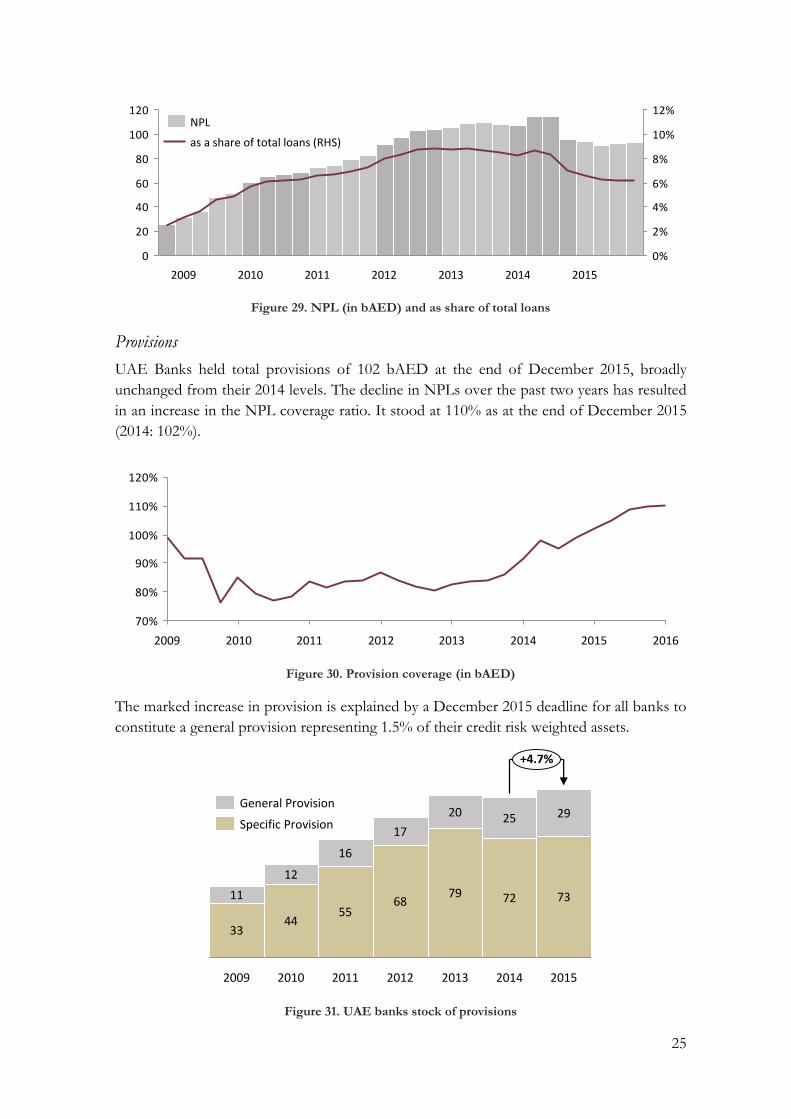
Figure 29. NPL (in bAED) and as share of total loans
Provisions
UAE Banks held total provisions of 102 bAED at the end of December 2015, broadly
unchanged from their 2014 levels. The decline in NPLs over the past two years has resulted
in an increase in the NPL coverage ratio. It stood at 110% as at the end of December 2015
(2014: 102%).
Figure 30. Provision coverage (in bAED)
The marked increase in provision is explained by a December 2015 deadline for all banks to
constitute a general provision representing 1.5% of their credit risk weighted assets.
Figure 31. UAE banks stock of provisions
0
20
40
60
80
100
120
0%
2%
4%
6%
8%
10%
12%
2015201420132012201120102009
as a share of total loans (RHS)
NPL
70%
80%
90%
100%
110%
120%
2009 2013 20162011 201420122010 2015
55
16
2010
44
12
2009
33
11
2015
73
29
2014
72
25
2013
79
20
2012
68
17
2011
+4.7%
Specific Provision
General Provision
26
Loan Rescheduling
The CBUAE defines rescheduled loans as loans whose maturity have been extended while
the terms (principal and interest) have remained unchanged. This process is usually
undertaken in order to accommodate borrowers’ temporary cash flow shortfalls and is
considered to be part of normal banking business.
Rescheduled loans are not classified as nonperforming. A provision is not required,
provided that the borrower has not become delinquent before the rescheduling has taken
place, and that the new terms do not offer temporary relief, concealing the need to
constitute a provision.
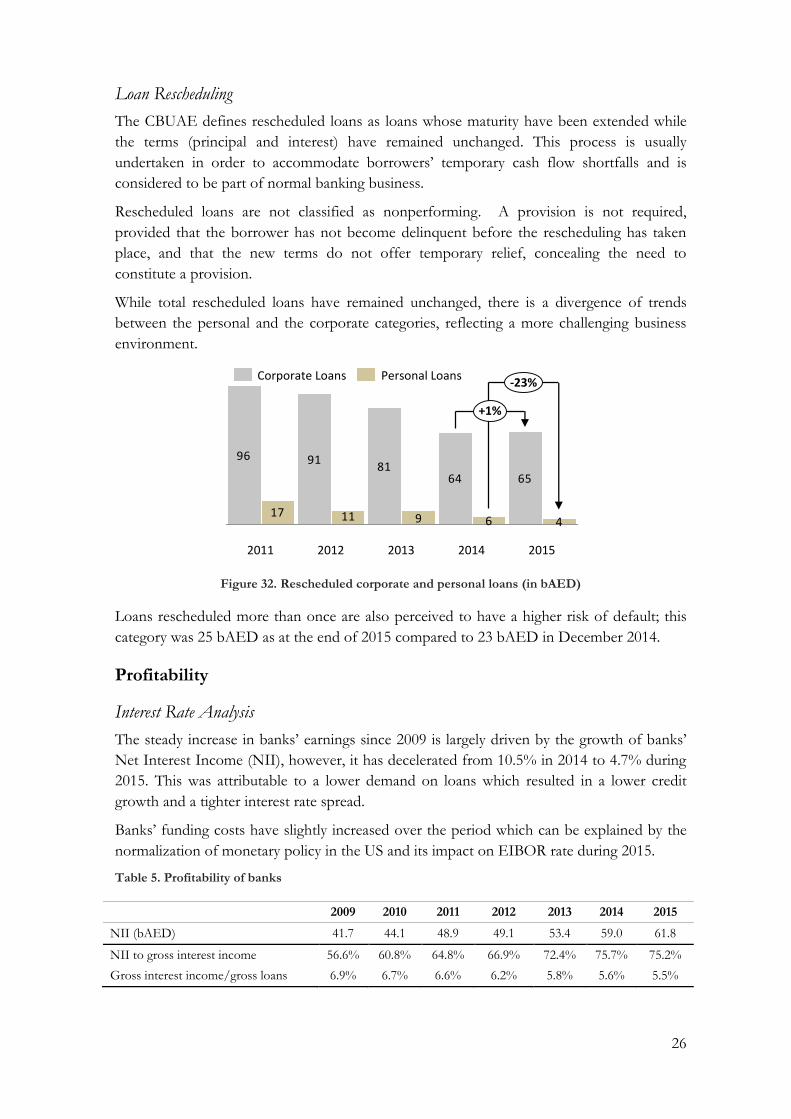
While total rescheduled loans have remained unchanged, there is a divergence of trends
between the personal and the corporate categories, reflecting a more challenging business
environment.
Figure 32. Rescheduled corporate and personal loans (in bAED)
Loans rescheduled more than once are also perceived to have a higher risk of default; this
category was 25 bAED as at the end of 2015 compared to 23 bAED in December 2014.
Profitability
Interest Rate Analysis
The steady increase in banks’ earnings since 2009 is largely driven by the growth of banks’
Net Interest Income (NII), however, it has decelerated from 10.5% in 2014 to 4.7% during
2015. This was attributable to a lower demand on loans which resulted in a lower credit
growth and a tighter interest rate spread.
Banks’ funding costs have slightly increased over the period which can be explained by the
normalization of monetary policy in the US and its impact on EIBOR rate during 2015.
Table 5. Profitability of banks
2009 2010 2011 2012 2013 2014 2015
NII (bAED) 41.7 44.1 48.9 49.1 53.4 59.0 61.8
NII to gross interest income 56.6% 60.8% 64.8% 66.9% 72.4% 75.7% 75.2%
Gross interest income/gross loans 6.9% 6.7% 6.6% 6.2% 5.8% 5.6% 5.5%
96 9181
64 65
91117
-23%
+1%
2015
4
2014
6
201320122011
Personal LoansCorporate Loans

27
The average interest rate earned on loans during 2015 decreased to 5.7% (2014: 5.8%), and
the average interest rate paid on deposits during 2015 reached 1.4% (2014: 1.3%), resulting
in the spread decreasing by 17 bps to 4.3%. The average interest rate earned (paid) are
implicit rates and calculated as the ratios between the 12-month cumulative flows of interest
actually received (paid) and the average size of corresponding loans (deposits) during the
same period.
Figure 33. Spread of implicit interest rate earned on loans and paid on deposits
Income Statement Analysis
The ratio of non-interest expenses to gross income is an indicator of banks’ operational
efficiency; it increased to 38.0% (2014: 36.4%) in 2015. The operating profit before
impairment remained unchanged at 55 bAED as at December 2015.
Figure 34. Operating profit before impairment (in bAED)
The level of net provision charge, as a percentage of 2015 net profits, increased to 46%
compared to 34% in the previous year. This is explained by the increasingly challenging
domestic and global economic environments.
3%
4%
5%
2010 2011 2012 2013 2014 2015 2016
40 4045 42
4755 55
+6%
2015201420132012201120102009

28
Figure 35. Net provision charges to net profit before tax
Increase in provisions is the main reason for the decline in profits of the banking sector.
During 2015, net profit of the banks dropped from 39 bAED to 37 bAED, reversing the
growth trend of 12% for the past five years.
Figure 36. Net banks’ profits
Profitability ratios & distribution
Revenues and expenses increased by a similar amount; net provisions have increased by an
additional 3 bAED during 2015.
104%
73% 64% 58%44% 34%
46%
201420132012201120102009 2015
1922
27 2632
39 37
2013 2014
+12%
2012201120102009 2015
29
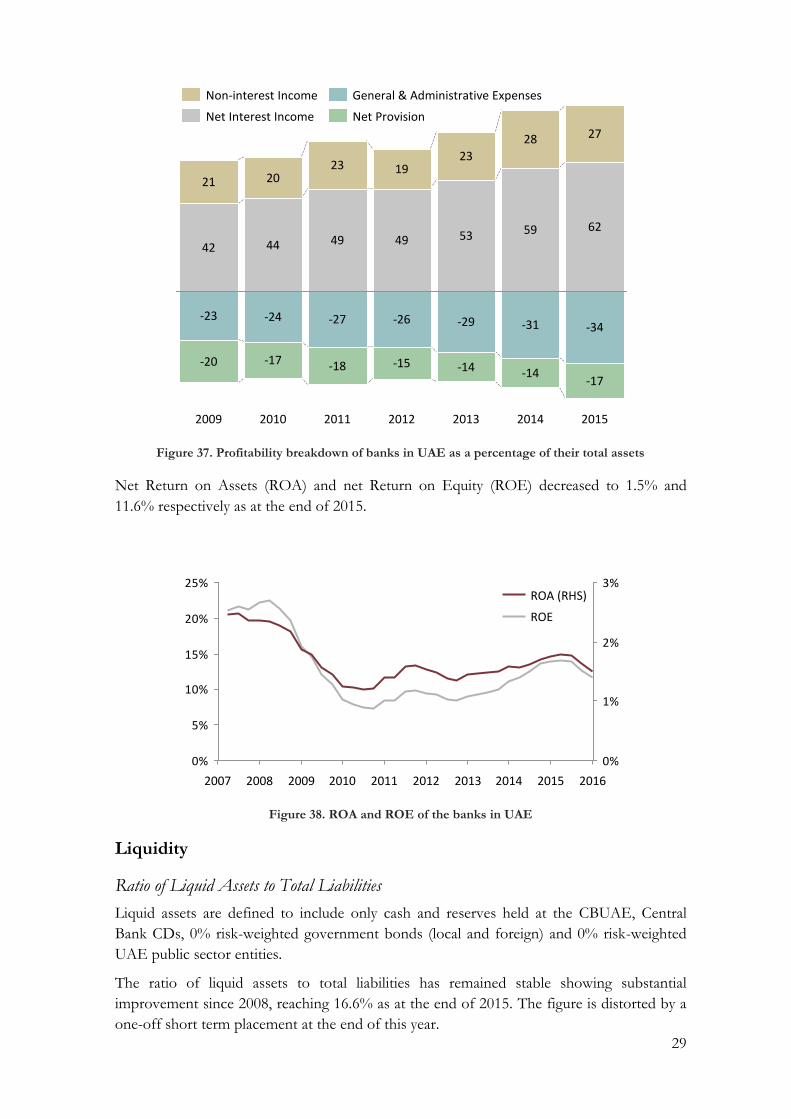
Figure 37. Profitability breakdown of banks in UAE as a percentage of their total assets
Net Return on Assets (ROA) and net Return on Equity (ROE) decreased to 1.5% and
11.6% respectively as at the end of 2015.
Figure 38. ROA and ROE of the banks in UAE
Liquidity
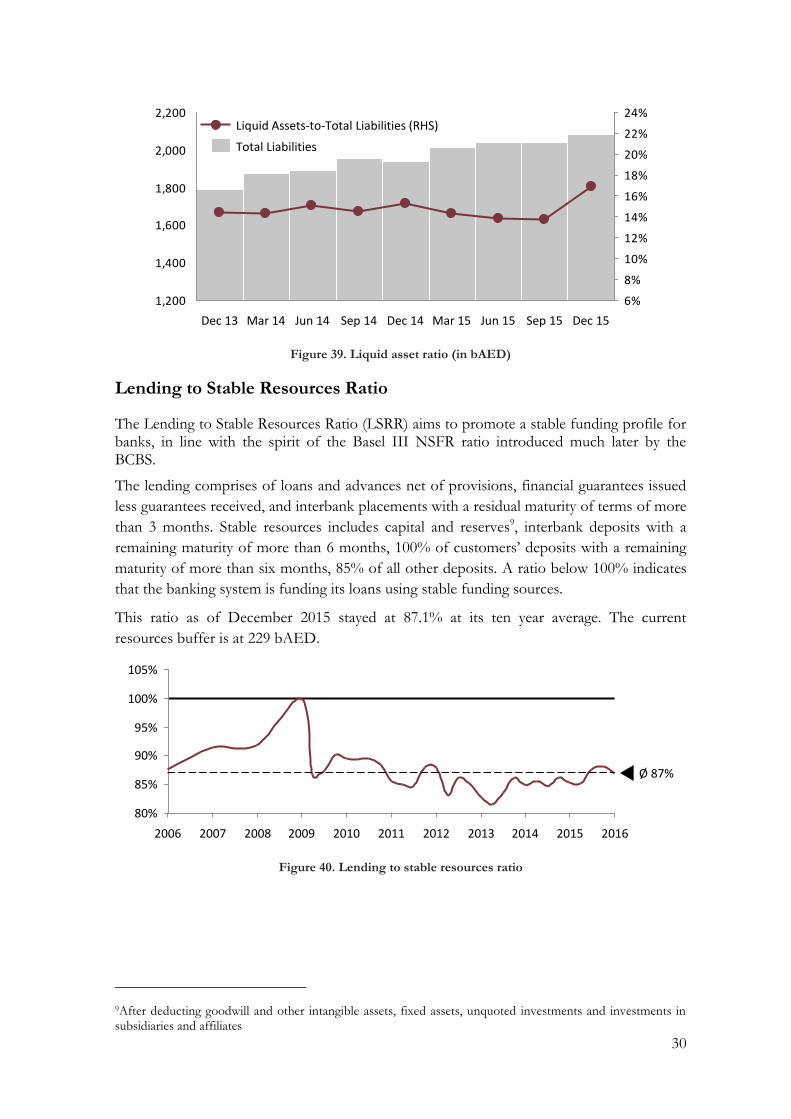
Ratio of Liquid Assets to Total Liabilities
Liquid assets are defined to include only cash and reserves held at the CBUAE, Central
Bank CDs, 0% risk-weighted government bonds (local and foreign) and 0% risk-weighted
UAE public sector entities.
The ratio of liquid assets to total liabilities has remained stable showing substantial
improvement since 2008, reaching 16.6% as at the end of 2015. The figure is distorted by a
one-off short term placement at the end of this year.
-27
49
23
-17
-24
2015
20
-20
-23
42
21
28
44
-14
-29
53
23
-15
201420132012201120102009
-14
59
27
19
62
-31
-17
-34-26
49
-18
General & Administrative Expenses
Net ProvisionNet Interest Income
Non-interest Income
0%
5%
10%
15%
20%
25%
0%
1%
2%
3%
20152012 201620112008 2010 201320092007 2014
ROA (RHS)
ROE
30
Figure 39. Liquid asset ratio (in bAED)
Lending to Stable Resources Ratio
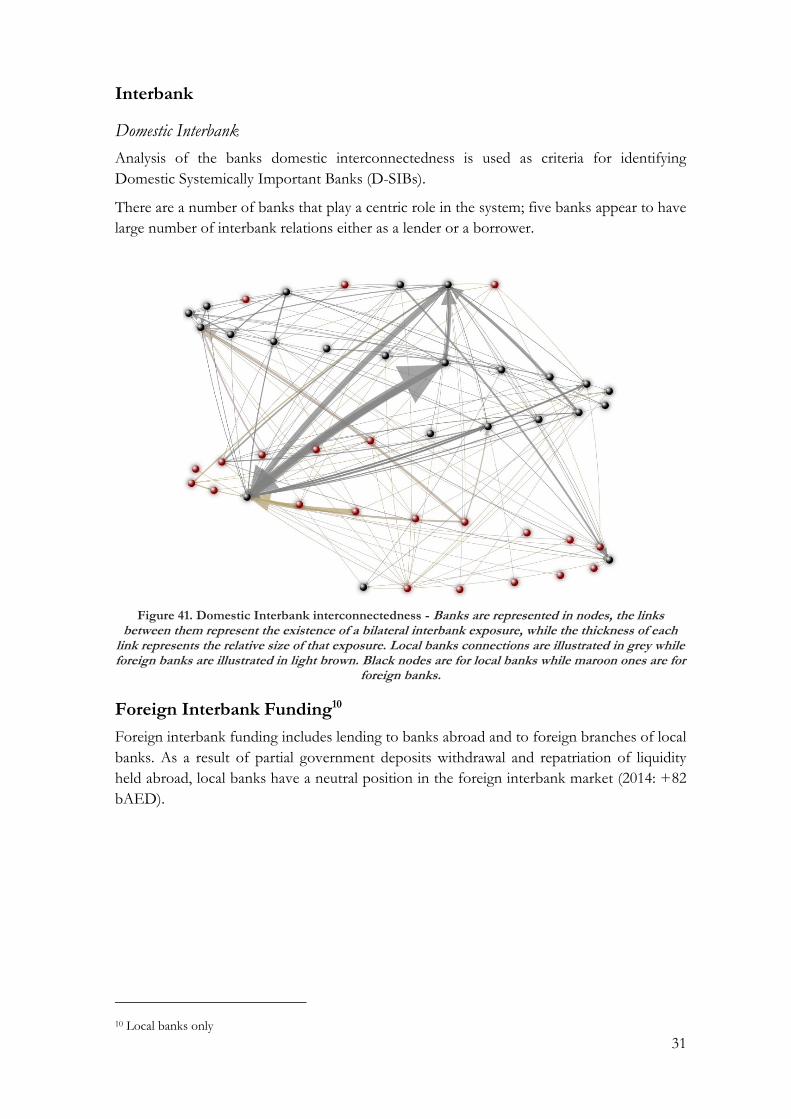
The Lending to Stable Resources Ratio (LSRR) aims to promote a stable funding profile for banks, in line with the spirit of the Basel III NSFR ratio introduced much later by the BCBS.
The lending comprises of loans and advances net of provisions, financial guarantees issued
less guarantees received, and interbank placements with a residual maturity of terms of more
than 3 months. Stable resources includes capital and reserves9, interbank deposits with a
remaining maturity of more than 6 months, 100% of customers’ deposits with a remaining
maturity of more than six months, 85% of all other deposits. A ratio below 100% indicates
that the banking system is funding its loans using stable funding sources.
This ratio as of December 2015 stayed at 87.1% at its ten year average. The current
resources buffer is at 229 bAED.
Figure 40. Lending to stable resources ratio
9After deducting goodwill and other intangible assets, fixed assets, unquoted investments and investments in subsidiaries and affiliates
1,200
1,400
1,600
1,800
2,000
2,200
6%
8%
10%
12%
14%
16%
18%
20%
22%
24%
Jun 15Mar 14 Mar 15 Sep 15Jun 14Dec 13 Dec 15Sep 14 Dec 14
Total Liabilities
Liquid Assets-to-Total Liabilities (RHS)
105%
100%
95%
90%
85%
80%
20162015201420132012201120102009200820072006
Ø 87%
31
Interbank
Domestic Interbank
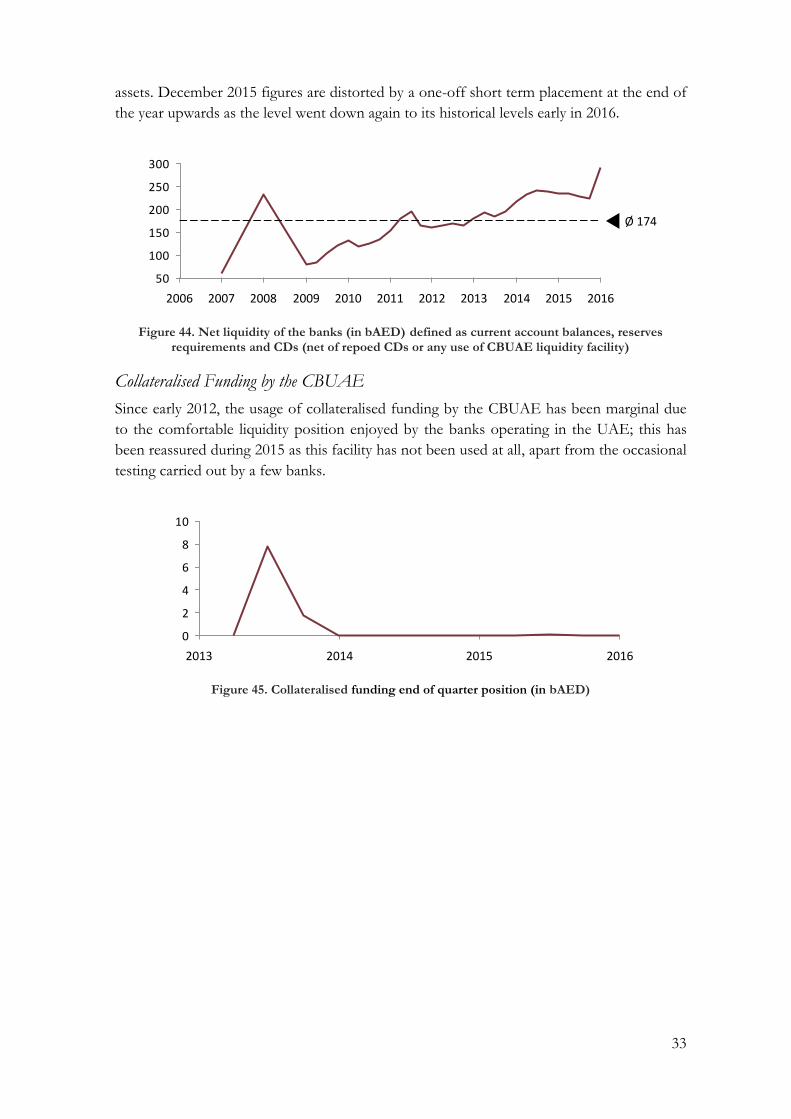
Analysis of the banks domestic interconnectedness is used as criteria for identifying
Domestic Systemically Important Banks (D-SIBs).
There are a number of banks that play a centric role in the system; five banks appear to have
large number of interbank relations either as a lender or a borrower.
Figure 41. Domestic Interbank interconnectedness - Banks are represented in nodes, the links between them represent the existence of a bilateral interbank exposure, while the thickness of each
link represents the relative size of that exposure. Local banks connections are illustrated in grey while foreign banks are illustrated in light brown. Black nodes are for local banks while maroon ones are for
foreign banks.
Foreign Interbank Funding10
Foreign interbank funding includes lending to banks abroad and to foreign branches of local
banks. As a result of partial government deposits withdrawal and repatriation of liquidity
held abroad, local banks have a neutral position in the foreign interbank market (2014: +82
bAED).
10 Local banks only

32
Figure 42. Net interbank lending by local banks (in bAED)
Capital Market Funding
In the absence of a developed dirham bond market and long term domestic institutional
investors, foreign capital markets are the predominant channel for national banks to raise
medium to long term funding. Historically low interest rates created a favourable
environment for long-term funding in 2015. As a percentage of total funding, capital market
funding reached 9.0% (2014: 8.1%).
Figure 43. Capital market funding (in bAED)
Net Liquidity at the CBUAE
The CBUAE monitors two indicators to assess the liquidity of the banking sector: net total
liquid assets placed by banks with the CBUAE and total collateralised funding provided by
the CBUAE.
Net Total Liquid Assets
The net total liquid assets placed by banks with the CBUAE revealed a rising trend in line
with comfortable liquidity levels in the market. At the end of December 2015, banks’ net
liquidity with the CBUAE stood at 295 bAED which represents 11.9% of the banks’ total
0
20
40
60
80
100
120
140
160
1%
2%
3%
4%
5%
6%
7%
8%
9%
10%
11%
12%
201520142010 2012 2013
+16%
20112009
As share of total funding (RHS)
Capital Market Funding
33
assets. December 2015 figures are distorted by a one-off short term placement at the end of
the year upwards as the level went down again to its historical levels early in 2016.
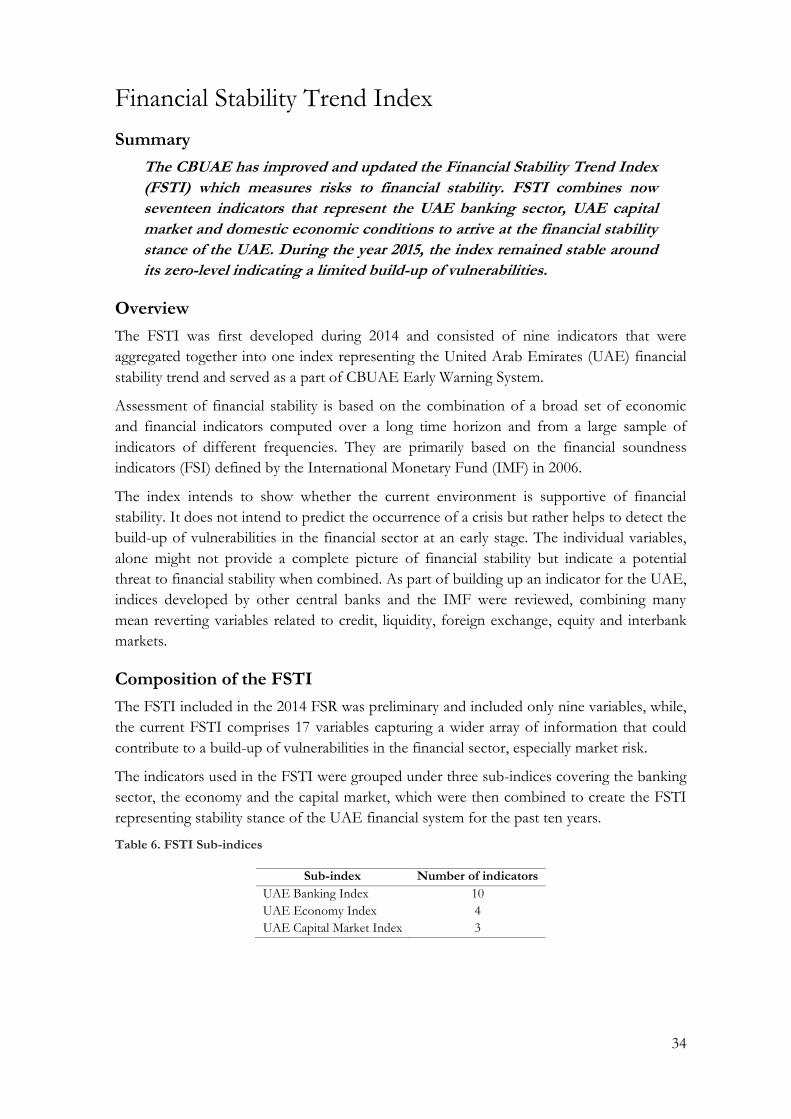
Figure 44. Net liquidity of the banks (in bAED) defined as current account balances, reserves requirements and CDs (net of repoed CDs or any use of CBUAE liquidity facility)
Collateralised Funding by the CBUAE
Since early 2012, the usage of collateralised funding by the CBUAE has been marginal due
to the comfortable liquidity position enjoyed by the banks operating in the UAE; this has
been reassured during 2015 as this facility has not been used at all, apart from the occasional
testing carried out by a few banks.
Figure 45. Collateralised funding end of quarter position (in bAED)
50
100
150
200
250
300
20162015201420132012201120102009200820072006
Ø 174
0
2
4
6
8
10
20142013 2015 2016
34
Financial Stability Trend Index
Summary
The CBUAE has improved and updated the Financial Stability Trend Index
(FSTI) which measures risks to financial stability. FSTI combines now
seventeen indicators that represent the UAE banking sector, UAE capital
market and domestic economic conditions to arrive at the financial stability
stance of the UAE. During the year 2015, the index remained stable around
its zero-level indicating a limited build-up of vulnerabilities.
Overview
The FSTI was first developed during 2014 and consisted of nine indicators that were
aggregated together into one index representing the United Arab Emirates (UAE) financial
stability trend and served as a part of CBUAE Early Warning System.
Assessment of financial stability is based on the combination of a broad set of economic
and financial indicators computed over a long time horizon and from a large sample of
indicators of different frequencies. They are primarily based on the financial soundness
indicators (FSI) defined by the International Monetary Fund (IMF) in 2006.
The index intends to show whether the current environment is supportive of financial
stability. It does not intend to predict the occurrence of a crisis but rather helps to detect the
build-up of vulnerabilities in the financial sector at an early stage. The individual variables,
alone might not provide a complete picture of financial stability but indicate a potential
threat to financial stability when combined. As part of building up an indicator for the UAE,
indices developed by other central banks and the IMF were reviewed, combining many
mean reverting variables related to credit, liquidity, foreign exchange, equity and interbank
markets.
Composition of the FSTI
The FSTI included in the 2014 FSR was preliminary and included only nine variables, while,
the current FSTI comprises 17 variables capturing a wider array of information that could
contribute to a build-up of vulnerabilities in the financial sector, especially market risk.
The indicators used in the FSTI were grouped under three sub-indices covering the banking
sector, the economy and the capital market, which were then combined to create the FSTI
representing stability stance of the UAE financial system for the past ten years.
Table 6. FSTI Sub-indices
Sub-index Number of indicators
UAE Banking Index 10
UAE Economy Index 4
UAE Capital Market Index 3
35
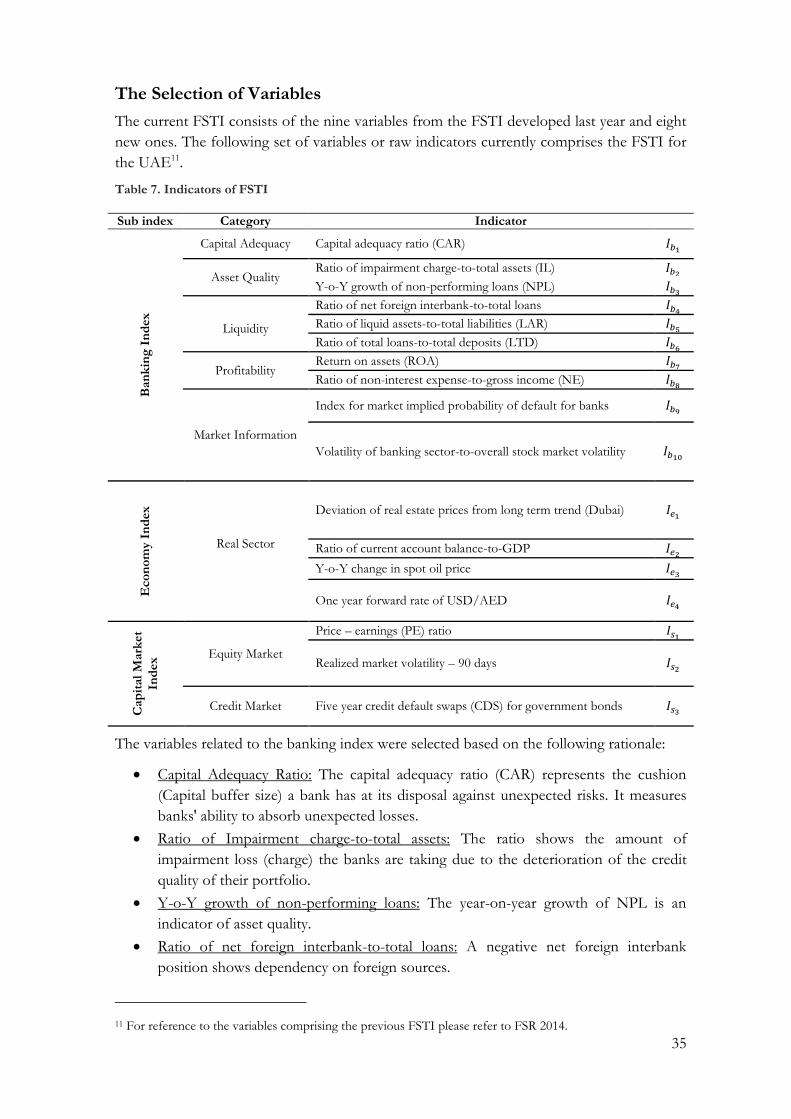
The Selection of Variables
The current FSTI consists of the nine variables from the FSTI developed last year and eight
new ones. The following set of variables or raw indicators currently comprises the FSTI for
the UAE11.
Table 7. Indicators of FSTI
Sub index Category Indicator
Ban
kin
g I
nd
ex
Capital Adequacy Capital adequacy ratio (CAR)
Asset Quality Ratio of impairment charge-to-total assets (IL)
Y-o-Y growth of non-performing loans (NPL)
Liquidity
Ratio of net foreign interbank-to-total loans
Ratio of liquid assets-to-total liabilities (LAR)
Ratio of total loans-to-total deposits (LTD)
Profitability Return on assets (ROA)
Ratio of non-interest expense-to-gross income (NE)
Market Information
Index for market implied probability of default for banks
Volatility of banking sector-to-overall stock market volatility
Eco
no
my I
nd
ex
Real Sector
Deviation of real estate prices from long term trend (Dubai)
Ratio of current account balance-to-GDP
Y-o-Y change in spot oil price
One year forward rate of USD/AED
Cap
ital
Mark
et
Ind
ex
Equity Market
Price – earnings (PE) ratio
Realized market volatility – 90 days
Credit Market Five year credit default swaps (CDS) for government bonds
The variables related to the banking index were selected based on the following rationale:
Capital Adequacy Ratio: The capital adequacy ratio (CAR) represents the cushion
(Capital buffer size) a bank has at its disposal against unexpected risks. It measures
banks' ability to absorb unexpected losses.
Ratio of Impairment charge-to-total assets: The ratio shows the amount of
impairment loss (charge) the banks are taking due to the deterioration of the credit
quality of their portfolio.
Y-o-Y growth of non-performing loans: The year-on-year growth of NPL is an
indicator of asset quality.
Ratio of net foreign interbank-to-total loans: A negative net foreign interbank
position shows dependency on foreign sources.
11 For reference to the variables comprising the previous FSTI please refer to FSR 2014.
36
Ratio of Liquid assets-to-total liabilities: The ratio of liquid assets to total liabilities
measures banks’ ability to withstand tight liquidity conditions.
Ratio of Total loans-to-total deposits: The loan to deposit ratio shows banks’
transformation of customer deposits.
Return on Assets: ROA is a bank profitability indicator.
Ratio of Non-interest expense-to-gross income: non-interest expense-to-gross
income measures the banks’ efficiency in using their resources.
Index for market implied probability of default for banks: The probability of default
(PD) is based on total liabilities weighted 13 UAE banks PDs. (Source: Bloomberg and
CBUAE staff).
Volatility of banking sector –to- overall stock market volatility: This ratio is calculated
as the volatility of a free-float weighted index combining both of the banking indices
of ADX and DFM divided by the volatility of free-float weighted indices of both
ADX and DFM.
The variables related to the economy index were selected based on the following rationale:
Deviation of real estate prices from long term trend (Dubai only): Persistent
deviation of real estate prices from long term trends negatively affect financial
stability.
Ratio of current account balance-to-GDP: Significant trade deficits affect the
financial situation of the country.
Y-o-Y change in spot oil price: Year-on-year change in spot oil price is an important
variable given the significant dependence on oil revenues.
1-year forward rate of USD/AED: The forward rate is a good reflection of the
pressure on the currency.
These variables related to the securities index were selected based on the following rationale:
Price – Earnings (PE) Ratio: PE Ratio is a general indicator of market sentiment. A
high PE ratio can potentially signal an overpriced local stock exchange market.
Realized Market Volatility: The 90-day realized volatility of the UAE MSCI Index.
Increased stock market volatility reflects increased risk in the market.
Credit default swaps (CDS) for the local government bonds: CDS is a good measure
of perceived credit risk.
37
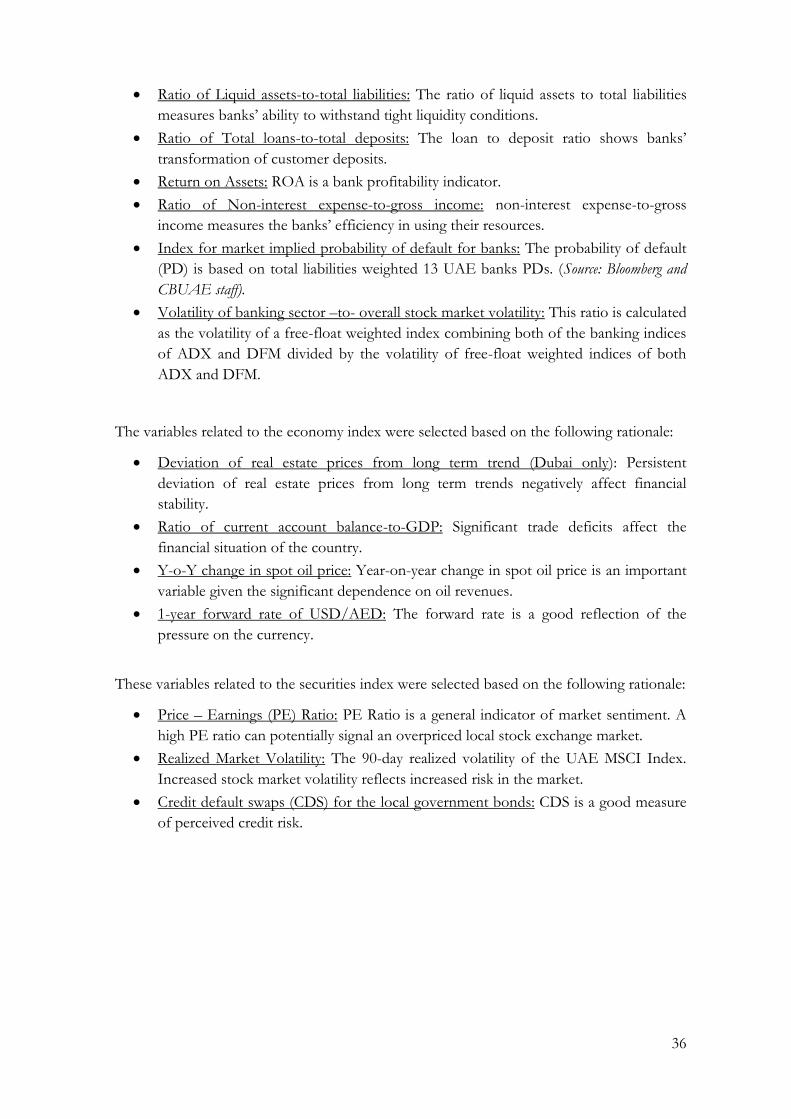
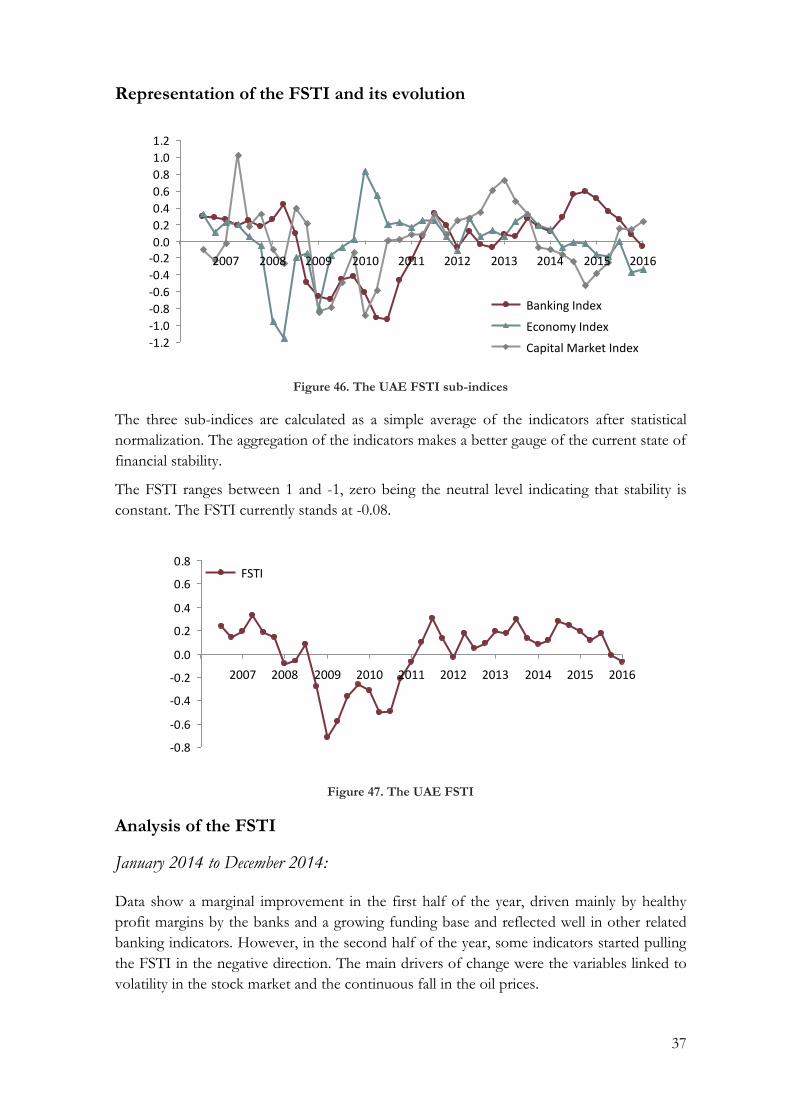
Representation of the FSTI and its evolution
Figure 46. The UAE FSTI sub-indices
The three sub-indices are calculated as a simple average of the indicators after statistical
normalization. The aggregation of the indicators makes a better gauge of the current state of
financial stability.
The FSTI ranges between 1 and -1, zero being the neutral level indicating that stability is
constant. The FSTI currently stands at -0.08.
Figure 47. The UAE FSTI
Analysis of the FSTI
January 2014 to December 2014:
Data show a marginal improvement in the first half of the year, driven mainly by healthy
profit margins by the banks and a growing funding base and reflected well in other related
banking indicators. However, in the second half of the year, some indicators started pulling
the FSTI in the negative direction. The main drivers of change were the variables linked to
volatility in the stock market and the continuous fall in the oil prices.
-1.2
-1.0
-0.8
-0.6
-0.4
-0.20.0
0.2
0.4
0.6
0.8
1.0
1.2
2016201520142013201220112010200920082007
Economy Index
Capital Market Index
Banking Index
-0.8
-0.6
-0.4
-0.2
0.0
0.2
0.4
0.6
0.8
20102008 20112009 2012 2013 20152007 20162014
FSTI

38
January 2015 to December 2015:
Data show a marginal deterioration in the banking index during the year 2015 due to a slight
increase in net foreign interbank ratio and the loan to deposit ratio combined with a
decrease in the banks’ profitability. Furthermore, continued decline in oil prices, which
affected the sentiment of investors and the overall growth potential of the economy as well
as a slowdown in the rate of NPL improvement, led the index slightly in negative territory.
39
Real Estate Markets
Summary
After a sharp rise in property prices in both Abu Dhabi and Dubai in 2013
and the first half of 2014, there was a mild market correction (11% in Dubai
and 1% in Abu Dhabi) in 2015. Participation of the banks in the sector
remains subdued.
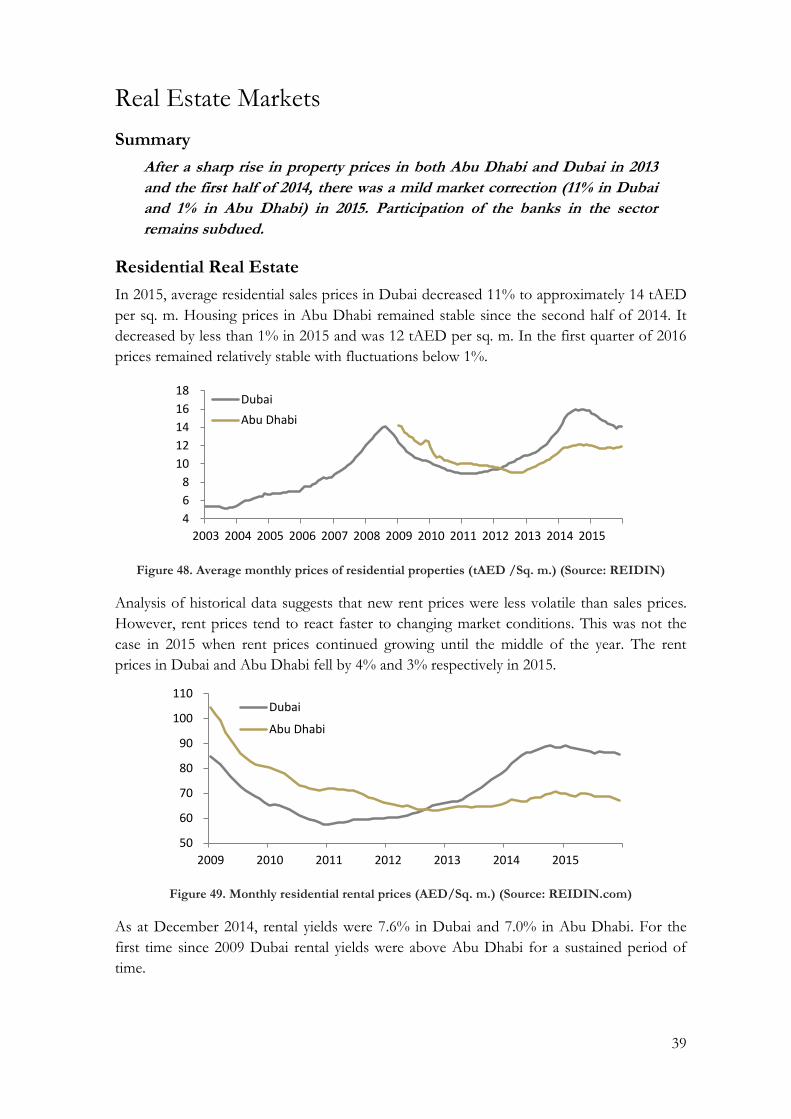
Residential Real Estate
In 2015, average residential sales prices in Dubai decreased 11% to approximately 14 tAED
per sq. m. Housing prices in Abu Dhabi remained stable since the second half of 2014. It
decreased by less than 1% in 2015 and was 12 tAED per sq. m. In the first quarter of 2016
prices remained relatively stable with fluctuations below 1%.
Figure 48. Average monthly prices of residential properties (tAED /Sq. m.) (Source: REIDIN)
Analysis of historical data suggests that new rent prices were less volatile than sales prices.
However, rent prices tend to react faster to changing market conditions. This was not the
case in 2015 when rent prices continued growing until the middle of the year. The rent
prices in Dubai and Abu Dhabi fell by 4% and 3% respectively in 2015.
Figure 49. Monthly residential rental prices (AED/Sq. m.) (Source: REIDIN.com)
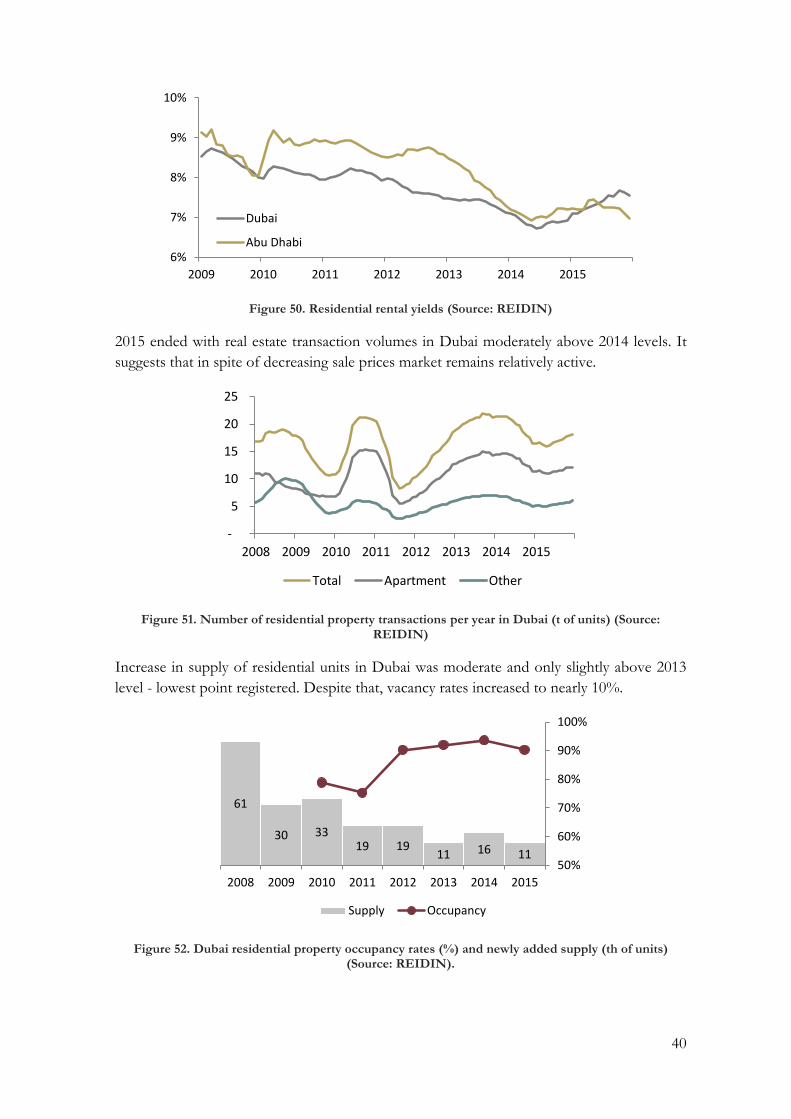
As at December 2014, rental yields were 7.6% in Dubai and 7.0% in Abu Dhabi. For the
first time since 2009 Dubai rental yields were above Abu Dhabi for a sustained period of
time.
4
6
8
10
12
14
16
18
2003 2004 2005 2006 2007 2008 2009 2010 2011 2012 2013 2014 2015
Dubai
Abu Dhabi
50
60
70
80
90
100
110
2009 2010 2011 2012 2013 2014 2015
Dubai
Abu Dhabi
40
Figure 50. Residential rental yields (Source: REIDIN)
2015 ended with real estate transaction volumes in Dubai moderately above 2014 levels. It
suggests that in spite of decreasing sale prices market remains relatively active.
Figure 51. Number of residential property transactions per year in Dubai (t of units) (Source: REIDIN)
Increase in supply of residential units in Dubai was moderate and only slightly above 2013
level - lowest point registered. Despite that, vacancy rates increased to nearly 10%.
Figure 52. Dubai residential property occupancy rates (%) and newly added supply (th of units) (Source: REIDIN).
6%
7%
8%
9%
10%
2009 2010 2011 2012 2013 2014 2015
Dubai
Abu Dhabi
-
5
10
15
20
25
2008 2009 2010 2011 2012 2013 2014 2015
Total Apartment Other
61
30 33 19 19
11 16 11 50%
60%
70%
80%
90%
100%
2008 2009 2010 2011 2012 2013 2014 2015
Supply Occupancy
41
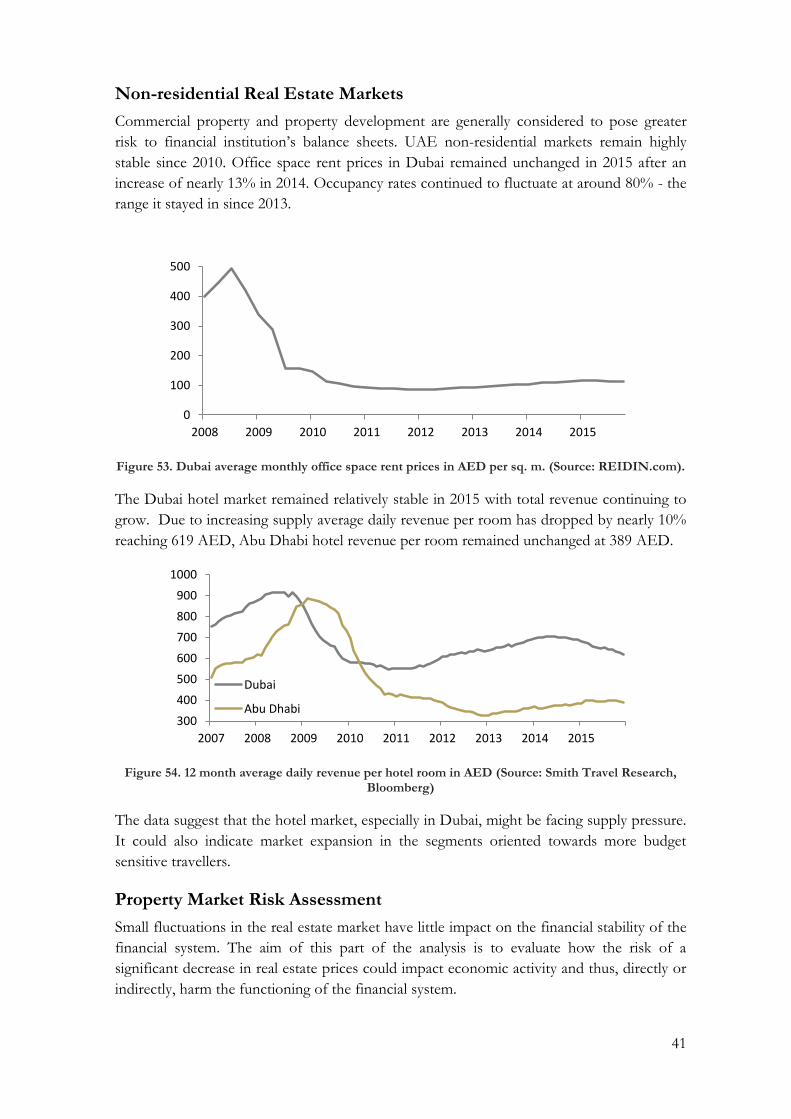
Non-residential Real Estate Markets
Commercial property and property development are generally considered to pose greater
risk to financial institution’s balance sheets. UAE non-residential markets remain highly
stable since 2010. Office space rent prices in Dubai remained unchanged in 2015 after an
increase of nearly 13% in 2014. Occupancy rates continued to fluctuate at around 80% - the
range it stayed in since 2013.
Figure 53. Dubai average monthly office space rent prices in AED per sq. m. (Source: REIDIN.com).
The Dubai hotel market remained relatively stable in 2015 with total revenue continuing to
grow. Due to increasing supply average daily revenue per room has dropped by nearly 10%
reaching 619 AED, Abu Dhabi hotel revenue per room remained unchanged at 389 AED.
Figure 54. 12 month average daily revenue per hotel room in AED (Source: Smith Travel Research, Bloomberg)
The data suggest that the hotel market, especially in Dubai, might be facing supply pressure.
It could also indicate market expansion in the segments oriented towards more budget
sensitive travellers.
Property Market Risk Assessment
Small fluctuations in the real estate market have little impact on the financial stability of the
financial system. The aim of this part of the analysis is to evaluate how the risk of a
significant decrease in real estate prices could impact economic activity and thus, directly or
indirectly, harm the functioning of the financial system.
0
100
200
300
400
500
2008 2009 2010 2011 2012 2013 2014 2015
300
400
500
600
700
800
900
1000
2007 2008 2009 2010 2011 2012 2013 2014 2015
Dubai
Abu Dhabi
42
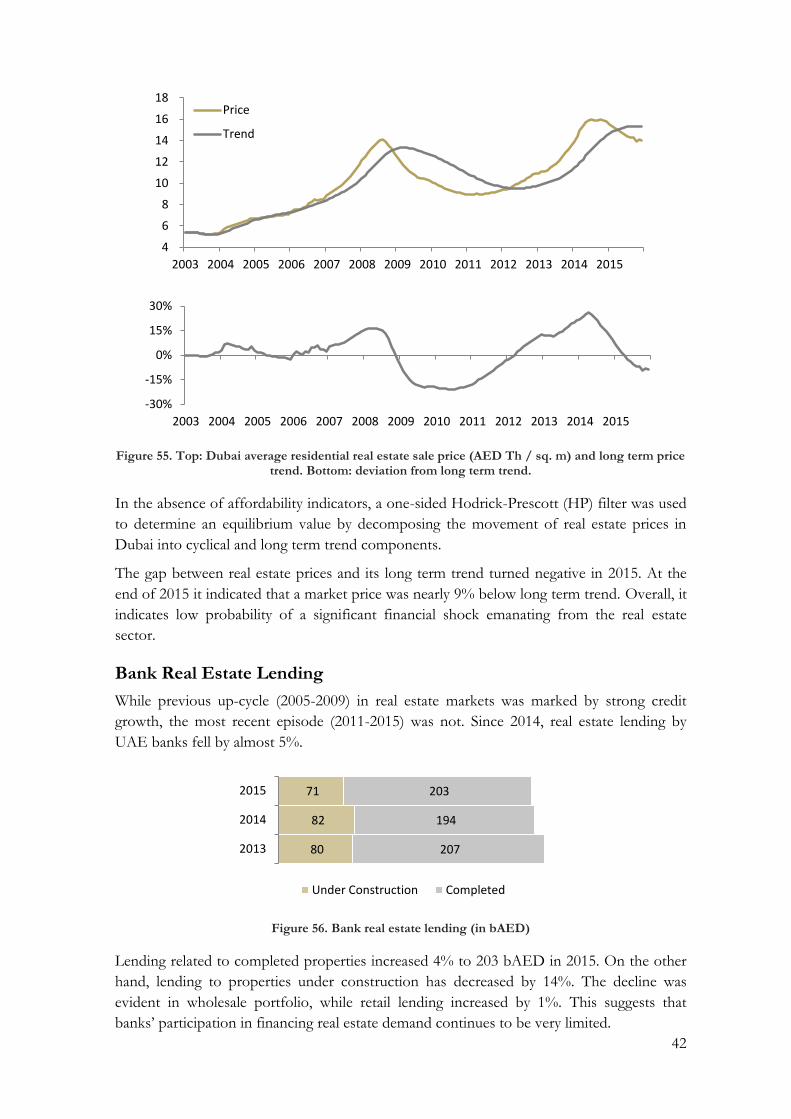
Figure 55. Top: Dubai average residential real estate sale price (AED Th / sq. m) and long term price trend. Bottom: deviation from long term trend.
In the absence of affordability indicators, a one-sided Hodrick-Prescott (HP) filter was used
to determine an equilibrium value by decomposing the movement of real estate prices in
Dubai into cyclical and long term trend components.
The gap between real estate prices and its long term trend turned negative in 2015. At the
end of 2015 it indicated that a market price was nearly 9% below long term trend. Overall, it
indicates low probability of a significant financial shock emanating from the real estate
sector.
Bank Real Estate Lending
While previous up-cycle (2005-2009) in real estate markets was marked by strong credit
growth, the most recent episode (2011-2015) was not. Since 2014, real estate lending by
UAE banks fell by almost 5%.
Figure 56. Bank real estate lending (in bAED)
Lending related to completed properties increased 4% to 203 bAED in 2015. On the other
hand, lending to properties under construction has decreased by 14%. The decline was
evident in wholesale portfolio, while retail lending increased by 1%. This suggests that
banks’ participation in financing real estate demand continues to be very limited.
4
6
8
10
12
14
16
18
2003 2004 2005 2006 2007 2008 2009 2010 2011 2012 2013 2014 2015
Price
Trend
-30%
-15%
0%
15%
30%
2003 2004 2005 2006 2007 2008 2009 2010 2011 2012 2013 2014 2015
80
82
71
207
194
203
2013
2014
2015
Under Construction Completed
43
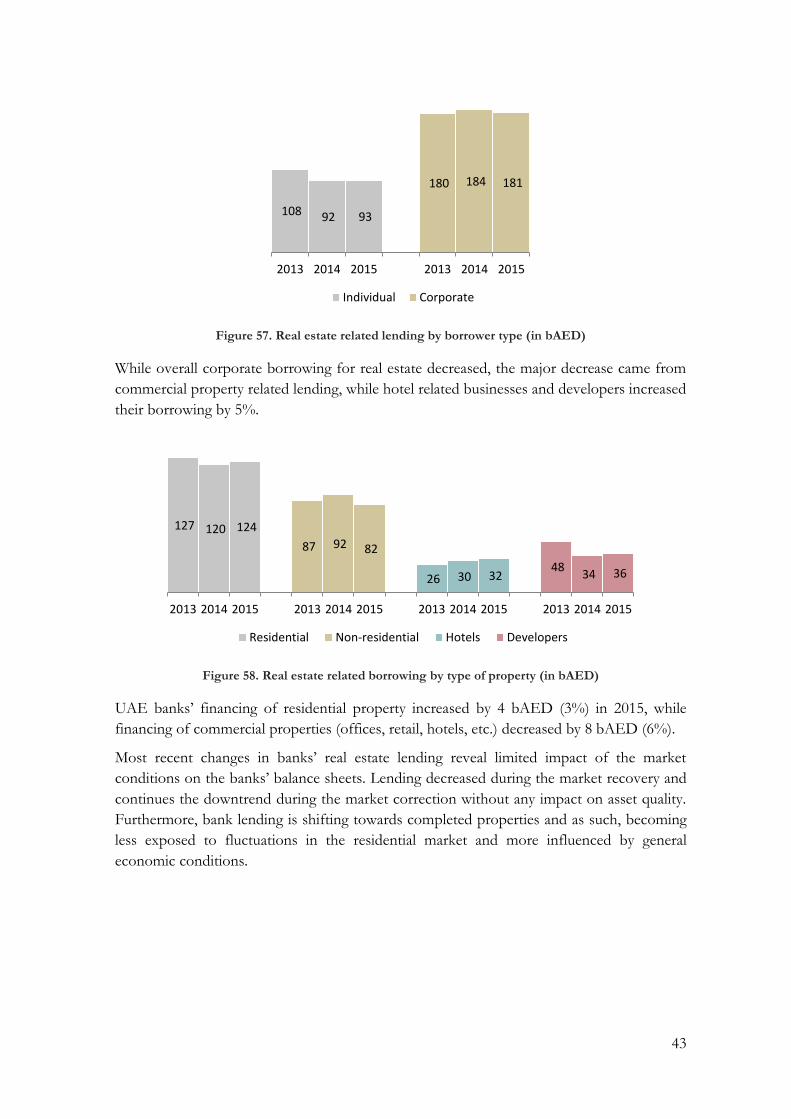
Figure 57. Real estate related lending by borrower type (in bAED)
While overall corporate borrowing for real estate decreased, the major decrease came from
commercial property related lending, while hotel related businesses and developers increased
their borrowing by 5%.
Figure 58. Real estate related borrowing by type of property (in bAED)
UAE banks’ financing of residential property increased by 4 bAED (3%) in 2015, while
financing of commercial properties (offices, retail, hotels, etc.) decreased by 8 bAED (6%).
Most recent changes in banks’ real estate lending reveal limited impact of the market
conditions on the banks’ balance sheets. Lending decreased during the market recovery and
continues the downtrend during the market correction without any impact on asset quality.
Furthermore, bank lending is shifting towards completed properties and as such, becoming
less exposed to fluctuations in the residential market and more influenced by general
economic conditions.
108 92 93
180 184 181
2013 2014 2015 2013 2014 2015
Individual Corporate
127 120 124
87 92 82
26 30 32 48
34 36
2013 2014 2015 2013 2014 2015 2013 2014 2015 2013 2014 2015
Residential Non-residential Hotels Developers

44
Shadow Banking
Summary
The relatively small size of UAE shadow banking industry does not
currently pose risks to financial stability. Credit intermediation activities of
finance and investment companies remained small, with loans continuing
to decline by 3.4% in 2015 (2014: -1.2%).
Overview
The Financial Stability Board (FSB) defined shadow banking as “credit intermediation
involving entities and activities outside the regular banking sector”. The definition does not
include other types of financial intermediation (foreign currency exchange and equity) and
places shadow banking outside bank specific regulation. The four key aspects of
intermediation are maturity transformation, liquidity transformation, leverage and credit risk
transfer. In 201512, the FSB expanded its analysis to better assess potential risks.
Table 8. Economic functions within FSB shadow banking framework. (Source: Financial Stability Board Report 2015)
Economic function Typical entity type
Management of collective investment vehicles with features that make them susceptible to runs
Fixed income funds, mixed funds, credit hedge funds, real estate funds
Loan provision that is dependent on short-term funding Finance companies, leasing companies, factoring companies, consumer credit companies
Intermediation of market activities that is dependent on short-term funding or on secured funding of client assets
Broker-dealers
Facilitation of credit creation Credit insurance companies, financial guarantors, monolines (bond insurers)
Securitisation-based credit intermediation and funding of financial entities
Securitisation vehicles
This report covers two economic functions stated by the FSB which are represented by
investment and finance companies. This part of shadow banking in the UAE is relatively
less complex and smaller than the banking system with asset size less than 3% of banking
system assets.
12 Framework published in FSB’s November 2015 Global Shadow Banking Monitoring Report

45
Figure 59. Left: Finance and investment companies’ assets (in bAED) Right: Banking system assets (in bAED)
The growing size of the industry, albeit small may create risks to financial stability.
Transmission channels through which risks may have potential spillovers is through credit
intermediation.
Finance companies
Finance companies in the UAE shadow banking system undertake maturity transformation
activities, mainly in loan origination. The assessment will continue by distinguishing two
fragments of the sector, two major players primarily involved in real estate lending and the
rest. The rest are then classified into non-bank and bank owned companies. Loan portfolio
of the major players declined by 21.4 % in 2015 compared to 20% in 2014, driving the
sector decline.
Excluding the major players, other finance companies’ loan portfolio composition was well
diversified and grew at 6.7% in 2015 (2014: 13.9%). Lending was well dispersed across
categories for bank owned finance companies’ while exposures for non-bank owned were
more concentrated in business financing.
Figure 60. Finance companies’ loan portfolio composition (excluding major players)
Funding structure of bank-owned finance companies remained largely in equities while non-
bank owned companies, have more reliance on deposits constituting 40% of funding
portfolio. Risks for non-bank owned finance companies may be eminent from the reliance
on short term deposits to finance long-term loans. Deposits maturity on average is 0-1 year,
while loans in particular mortgage and business are on average of more than 10 year tenures.
30
60
45
75
15
020142011 2012 20152013
Bank-owned finance
Non-bank owned finance
Investment
2,500
2,000
1,500
1,000
500
020152014201320122011
21%
16%
26%
15%
22%
42%
11%
18%
18%
7%Non-bank owned
Bank-owned
Others
Credit cards
Business loans
Personal loans
Vehicle loans
Real estate
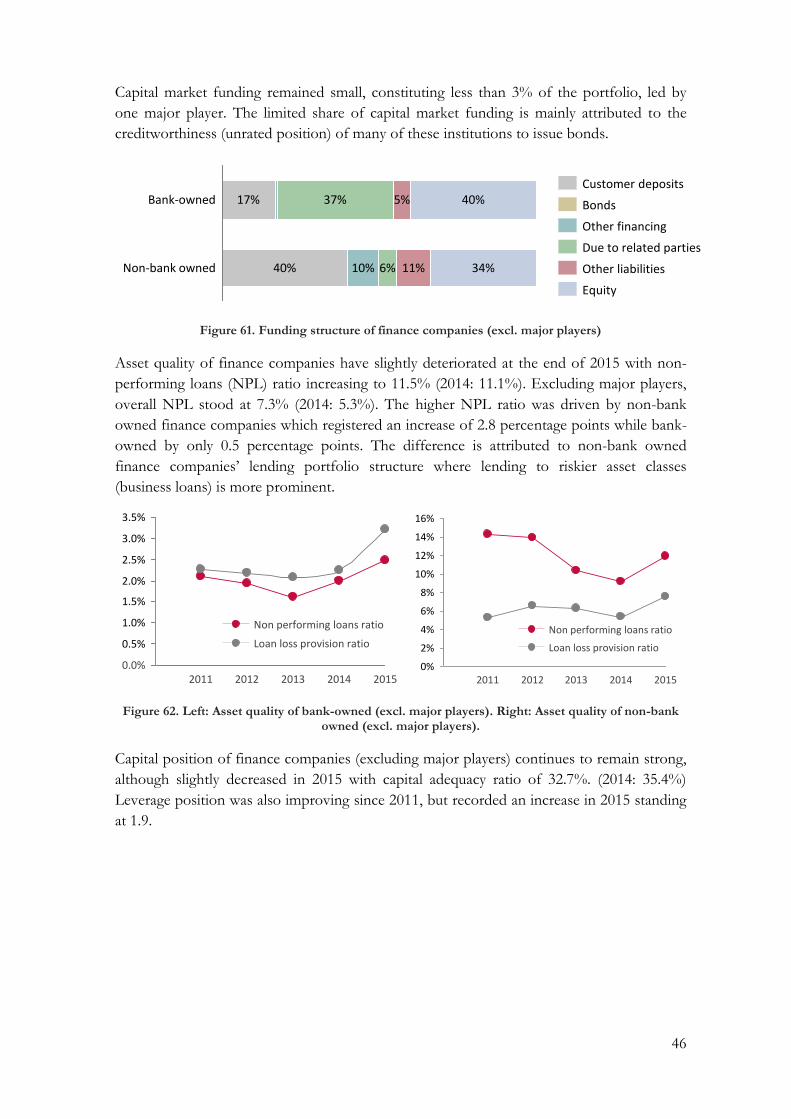
46
Capital market funding remained small, constituting less than 3% of the portfolio, led by
one major player. The limited share of capital market funding is mainly attributed to the
creditworthiness (unrated position) of many of these institutions to issue bonds.
Figure 61. Funding structure of finance companies (excl. major players)
Asset quality of finance companies have slightly deteriorated at the end of 2015 with non-
performing loans (NPL) ratio increasing to 11.5% (2014: 11.1%). Excluding major players,
overall NPL stood at 7.3% (2014: 5.3%). The higher NPL ratio was driven by non-bank
owned finance companies which registered an increase of 2.8 percentage points while bank-
owned by only 0.5 percentage points. The difference is attributed to non-bank owned
finance companies’ lending portfolio structure where lending to riskier asset classes
(business loans) is more prominent.
Figure 62. Left: Asset quality of bank-owned (excl. major players). Right: Asset quality of non-bank owned (excl. major players).
Capital position of finance companies (excluding major players) continues to remain strong,
although slightly decreased in 2015 with capital adequacy ratio of 32.7%. (2014: 35.4%)
Leverage position was also improving since 2011, but recorded an increase in 2015 standing
at 1.9.
10%Non-bank owned 40% 6% 11%
40%
34%
17% 37%Bank-owned 5%
Due to related parties
Other financing
Other liabilities
Bonds
Equity
Customer deposits
2.5%
3.0%
3.5%
1.5%
1.0%
0.5%
2.0%
0.0%20152014201320122011
Loan loss provision ratio
Non performing loans ratio
2%
0%
16%
14%
12%
10%
8%
6%
4%
20152014201320122011
Non performing loans ratio
Loan loss provision ratio

47
Figure 63. Capital and leverage position of finance companies (excl. major players)
Investment companies
Investment companies’ business model can be distinguished into two categories; operating
savings schemes and the other providing asset management, investment advice and similar
services. In the UAE, only one company runs a saving scheme where it operates as an outlet
for retail investors to invest in short-term instruments. The assessment in this section will
focus on investment companies offering asset management and advisory services.
Investment companies’ assets continued to expand in 2015 by 4.8% (2014: 2.4%), supported
by an increase in long-term investments. While investments grew, asset composition
remained stable with no significant shifts in asset categories, reflecting no adverse risk taking
behaviour by investment companies to seek higher investment yields.
Figure 64. Asset composition of investment companies
Profitability of investment companies deteriorated in 2015 with operating income decreasing
by 38%, mainly driven by more than 50% lower gains on investment and fee, reflecting
volatile financial markets and asset prices.
2011 2012 2013 2014 2015
0.0
0.5
1.0
1.5
2.0
2.5
35%
30%
25%
20%
15%
10%
5%
0%
40%
Leverage ratio (RHS)
Capital adequacy ratio
9%9% 12%
12% 10%
44%45%
39%40%
45%
15%
21%23% 14%
12%
26%14% 19% 21% 17%
201320122011 20152014
100%
Others
Due from related parties
Investments
Loans
Cash & deposits

48
Figure 65. Investment companies’ profitability components (in bAED)
Risk assessment
Interconnectedness to the banking system and domestic capital markets is low for the UAE
shadow banking industry. Impact of movement in deposits to the banking system is limited
as deposit placements by finance and investment companies remained low at less than 5%
of total deposits.
UAE investment companies have increased exposure to the domestic bond market while
shrinking its exposure in foreign equities. This suggests growing interconnectedness to
participants in the domestic capital markets but limited as more than 50% of investments
are in foreign bonds.
Figure 66. Investment companies’ domestic investment portfolio composition
1.5
1.0
0.5
0.0
-0.5
-1.020152014201320122011
Interest expense
Operating expenses
Other income
Gain on investments
Processing and other fees
Loans and interest income
20152014201320122011
46%
12%
33%
44% 50%
24%
14%
6%
20%
22%
52%
8%
13%28%
21%
38%
12%
31%
19%
6%
Foreign bonds
Domestic bonds
Foreign equities
Domestic equities
49
Recent Developments
Regulatory Developments
Introduction
In line with the CBUAE’s strategy, the Regulatory Development Division is continuing to
develop the regulatory framework for financial institutions licensed by the CBUAE Over
the next number of years, the UAE regulatory framework will continue to be progressively
enhanced in line with international standards and best practice.
The CBUAE is working closely with the banks and other licensed financial institutions in
shaping this new regulatory framework. All new regulations are being consulted on with the
industry. The CBUAE is also focusing on ensuring that the institutions are preparing for the
forthcoming changes to the regulatory system to enable smooth transition towards the new
requirements.
Developments in 2015
Liquidity
The CBUAE introduced a key new regulation in relation to liquidity in 2015. The
‘Regulation regarding Liquidity Requirements for Banks’ is integral to the prudential
management of banks in terms of liquidity portfolio governance, risk management and
practices and is a cornerstone in our new regulatory framework. This regulation and
accompanying guidance manual provides the framework that the CBUAE requires banks to
implement in order to effectively manage liquidity risk. It introduces the requirement for
banks to hold eligible liquid assets in case of funding shocks. Equally important, it provides
a glide path for those banks required to manage their liquidity in accordance with the Basel
III liquidity standards (Liquidity Coverage ratio and Net Stable Funding Ratio) to become
fully compliant by the effective Basel dates in 2018/2019.
Digital Payments
The CBUAE recognizes that Fintech development will play an important role in shaping the
future of the financial services industry in the UAE. In 2015, the CBUAE worked on the
development of a regulatory framework to assist in shaping the digital payments industry in
the UAE. A study of the digital payments landscape and infrastructure in the country and
researched digital payments operations and practices in other international jurisdictions was
undertaken. The objective is to create a national vision and an associated regulatory
framework that enables and supports the development of digital payments services in the
UAE, and that also ensures the safety of the payments systems fosters prudent and robust
service providers and has built in consumer protections.
In designing the new regulatory framework and drafting the new regulations, we consulted
extensively with all of the key stakeholders involved in digital payments and we have been
guided by best international practice in this area.

50
Risk Management
A significant amount of ground work was also undertaken in 2015 in drafting a set of new
risk management regulations aimed at bringing the CBUAE’s regulatory framework up to
date in this area. There are five regulations in the set, which cover; Risk Management;
Market Risk; Interest Rate Risk in the Banking Book; Operational Risk; and Country and
Transfer Risk. These new regulations are designed to amalgamate, replace and bring up to
date existing regulatory requirements for risk management.
Regulatory Priorities for 2016
In 2016 the CBUAE will continue the work towards implementation of the new regulations
developed in 2015. This coming year will see the issuance of these important new
regulations as well as continued progress on finalising drafting of certain other regulations
with the intention to consult on and issue these regulations in 2017.
Amongst the key priorities for 2016 are:
Capital
In accordance with Basel III capital requirements, the timeframe for full implementation of
the new capital regime is end of 2018. The regime includes new definitions of capital, new
capital buffer requirements and better quality of capital in terms of loss absorption. The
CBUAE has developed an implementation program to begin the engagement process with
banks towards implementing the new Basel III capital requirements for banks operating in
the UAE from 2016 onwards. This is now in progress.
Risk management
The five regulations related to risk management in banks and five supporting standards were
completed in 2015. These regulations were consulted on with the banking sector in the first
quarter 2016 and are currently being finalised. The CBUAE intends to issue these
regulations in the second half of 2016.
Digital Payments
The CBUAE has developed a new vision and blueprint for digital payments services in the
UAE. The new regulations are in final draft form. We are currently reviewing the responses
to the industry consultation and intend to finalize the new regulations in the second half of
2016.
Non-Bank Financial Institutions
The regulatory framework for non-bank financial institutions (NBFIs) is also currently
under review, with a view to enhance their organization, development, regulation and
supervisory oversight. This is now in an advanced stage of readiness and the intention is to
engage with the industry on this subject in the second half of 2016.

51
Other regulations
The CBUAE is also drafting other important regulations in 2016 with the intention of bring
these forward for consultation with the industry in 2017. These include regulations on
Outsourcing, Financial Reporting, Internal Controls, Compliance and Internal Audit.

52
Islamic Finance
Summary
The UAE has continued to develop its Shari’ah compliant financial sector in
2015 building on its pioneering role in establishing Islamic based financial
institutions. Islamic banks grew at 15% per annum in the past year and
reached total assets of 464 bAED; they constituted 18.7% of banking system
assets and 20.6% of banking system lending.
Islamic Finance in the UAE
Islamic financial services in the UAE continued to strengthen. The industry expanded with
additional participation of foreign banks offering Islamic services through Islamic windows.
Islamic banking services industry, at end 2015, covers participation of 47 Institutions
offering Islamic Financial Services (IIFS) with 8 fully-fledged Islamic banks. Total asset size
of full-fledged Islamic banks grew 15% in 2015 (2014: 11%) reflecting the expansion of the
UAE Islamic finance industry.
Table 9.Breakdown of IIFS in the UAE as at 31 December 2015
Type of Institution Number
Islamic Banks 8
Islamic Windows 26
Local Banks 13
Foreign Banks 13
Islamic Finance Company 12
Islamic Investment Company 1
Total 47
The CBUAE provides Sharia’ah compliant instruments aimed at facilitating Islamic Banks
access to high quality liquid assets.
For short-term liquidity management by Islamic banks and other Islamic financial
institutions the CBUAE created a Shari`ah compliant certificate of deposit (CDs), which has
been successful since inception in November 2010. As at 31 December 2015, outstanding
Shari`ah compliant CDs stood at 20.9 bAED.
For emergency funding, effective from 1 April 2015, the CBUAE extended the spectrum of
eligible collateral for the collateralised Murabaha facility to include Shari`ah-compliant
securities13 other than the Islamic CDs issued by the CBUAE. This service was enhanced to
ensure that Islamic banks also have access to emergency funding facilities through the
CBUAE’s Interim Marginal Lending Facility.
At the international level, the CBUAE is a member of both the Islamic Financial Services
Board and the International Islamic Liquidity Management Corporation. Such participation
will enhance (a) cross-sectorial and cross-border policy cooperation, (b) convergence on the
prudential framework, and (c) macro-prudential surveillance at the international level in the
area of Islamic finance.
13 Guidelines for Collateral Management Under the CBUAE’s Collateralized Murabaha Facility

53
Governing Law and Application of Shari`ah for the IIFS in the UAE
The UAE is governed by a civil law system. All relevant underlying commercial and banking
laws are, to a large extent, codified. There is no separate legislation within the UAE which
codifies Shari`ah law for commercial transactions or a Shari`ah court that hears disputes
arising out of Shari`ah financing transactions. Many aspects of Shari`ah rulings have been
incorporated into the civil law and it can be said that large portions of the UAE commercial
laws are underpinned by Shari`ah elements and are therefore compatible with Shari`ah
principles. The courts are also permitted to refer to the Shari`ah in the absence of clear
legislation and established customary business practices. This is reflected in the approach
taken by the Federal Law No. 5 of 1985 concerning Civil Transactions, which, together with
the Federal Law No. 18 of 1993 concerning the Commercial Transaction Law, sets out the
main provisions for civil and commercial transactions in the UAE.
There are also legal frameworks specific for the operation of the IIFS. The UAE Federal
Law No. 6 of 1985 specifies a broad Shari`ah governance framework at both the national
and institutional level. In addition, the CBUAE Board of Director’s Resolution No.
165/6/2004 sets out specific conducts of Islamic finance companies.
Higher Sharī’ah Authority (HSA)
In order to address the gap in the application of the Federal Law, the CBUAE developed a
charter that specifies the terms of reference and operational process for the Authority. The
CBUAE is appointed to oversee the running of the recently approved authority and work is
underway to further strengthen the establishment. Following are the key objectives of the
HSA:
Issue fatwa and ensure legitimacy of the products, services and activities of IIFS.
Introduce new or adapt existing international Sharī’ah standards and standard
documentation for best practice for the IIFS.
Advise CBUAE on Sharī’ah matters on prudential regulations relating to IIFS,
and on Sharī’ah-compliant instruments developed for conducting its monetary
management function.
Conduct and support Sharī’ah research in Islamic finance.
Liaise and cooperate with other international organisations currently setting
Sharī’ah standards for IIFS.
Performance of the Islamic banking industry
Full-fledged Islamic bank assets have been growing year-on-year at 15% (2014: 11%) to
reach 464 bAED as at end 2015. Assets of the Islamic banks constituted 18.7% (2014:
17.5%) of banking system asset and 20.6% (2014: 19.2%) of banking system lending.
Deposit mobilized rose by 16.6% (2014: 15.8%) to reach 332 bAED and accounted for
22.6% (2014: 20%) of the overall banking system deposits.
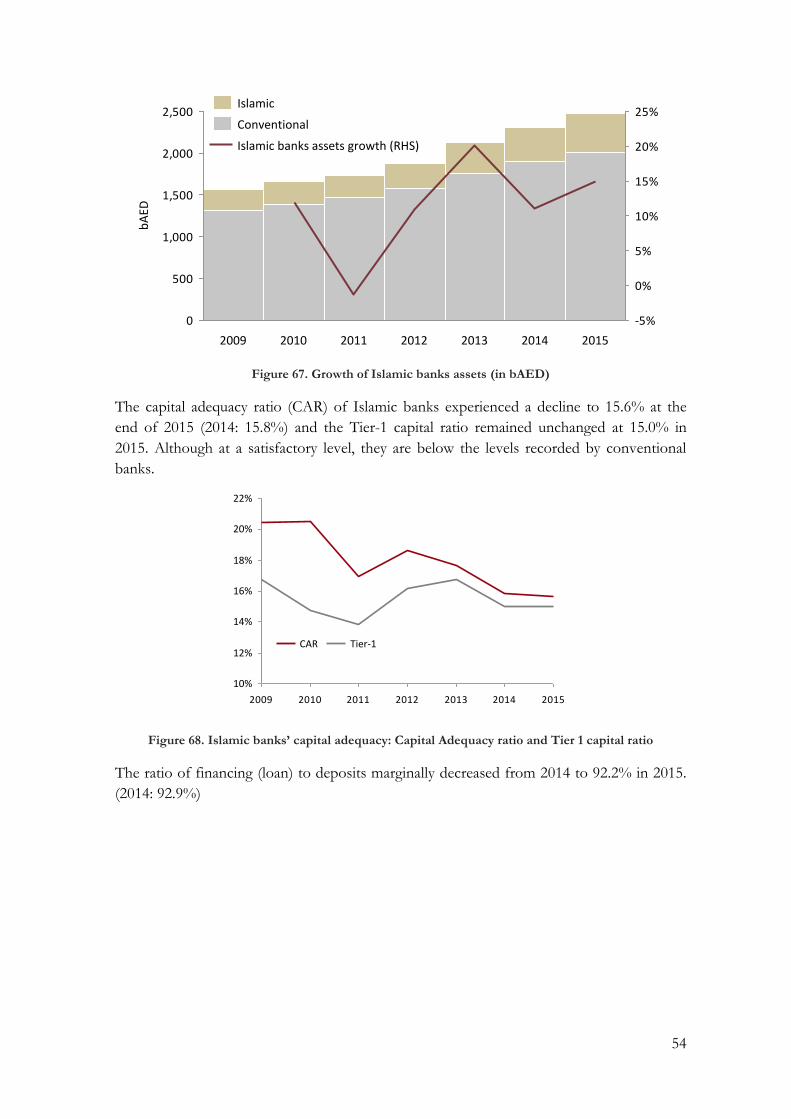
54
Figure 67. Growth of Islamic banks assets (in bAED)
The capital adequacy ratio (CAR) of Islamic banks experienced a decline to 15.6% at the
end of 2015 (2014: 15.8%) and the Tier-1 capital ratio remained unchanged at 15.0% in
2015. Although at a satisfactory level, they are below the levels recorded by conventional
banks.
Figure 68. Islamic banks’ capital adequacy: Capital Adequacy ratio and Tier 1 capital ratio
The ratio of financing (loan) to deposits marginally decreased from 2014 to 92.2% in 2015.
(2014: 92.9%)
0
500
1,000
1,500
2,000
2,500
-5%
0%
5%
10%
15%
20%
25%
bA
ED
2015201420132012201120102009
Islamic
Islamic banks assets growth (RHS)
Conventional
2009 2010 2011 2012 2013 2014 2015
22%
20%
18%
16%
14%
12%
10%
Tier-1CAR
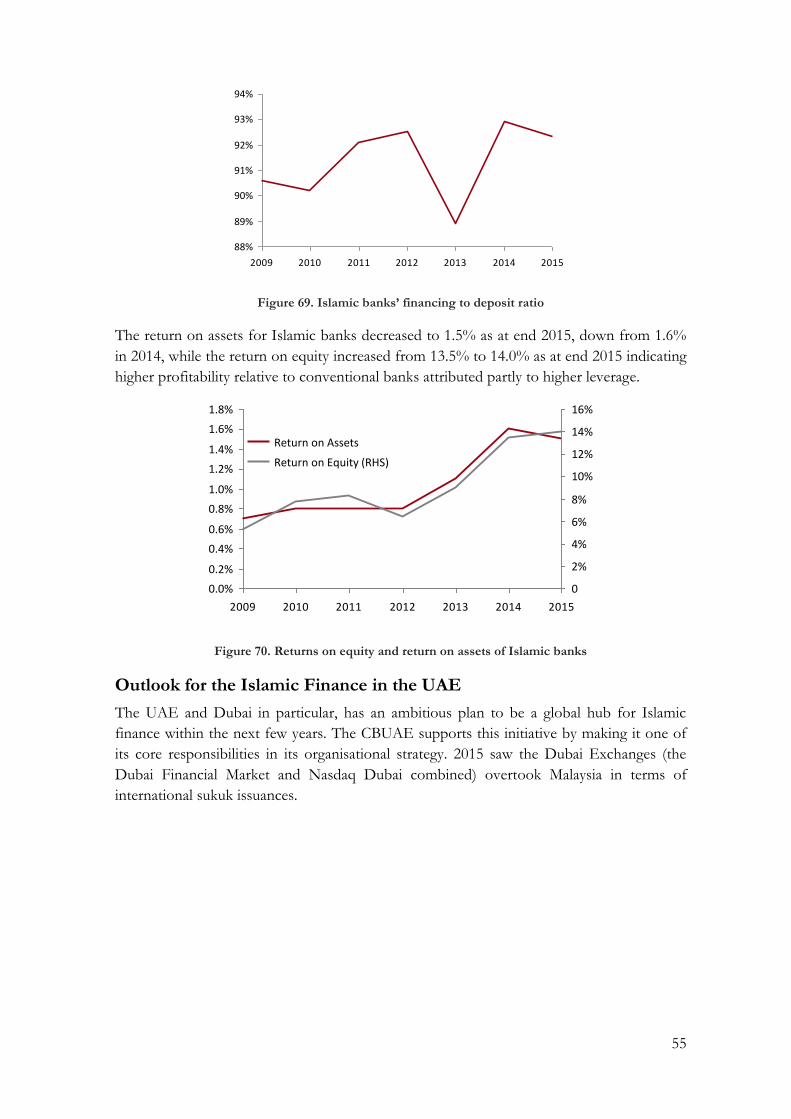
55
Figure 69. Islamic banks’ financing to deposit ratio
The return on assets for Islamic banks decreased to 1.5% as at end 2015, down from 1.6%
in 2014, while the return on equity increased from 13.5% to 14.0% as at end 2015 indicating
higher profitability relative to conventional banks attributed partly to higher leverage.
Figure 70. Returns on equity and return on assets of Islamic banks
Outlook for the Islamic Finance in the UAE
The UAE and Dubai in particular, has an ambitious plan to be a global hub for Islamic
finance within the next few years. The CBUAE supports this initiative by making it one of
its core responsibilities in its organisational strategy. 2015 saw the Dubai Exchanges (the
Dubai Financial Market and Nasdaq Dubai combined) overtook Malaysia in terms of
international sukuk issuances.
2009 2010 2011 2012 2013 2014 2015
94%
93%
92%
91%
90%
89%
88%
2009 2010 2011 2012 2013 2014 2015
1.2%
0.6%
8%
0.2%
0
6%
0.4%
0.8%
10%1.0%
0.0%
14%
12%
2%
4%
1.4%
1.6%
1.8% 16%
Return on Assets
Return on Equity (RHS)

56
Figure 71. Left: Global sukuk outstanding as at December 2015 (in mUSD). Right: International sukuk issuance outstanding as at December 2015 in (mUSD) (Source: IIFM Sukuk Report 2015)
Islamic finance faces challenges mainly relating to legal and financial infrastructure, Shari`ah
governance, prudential regulation and consumer awareness. The CBUAE continues to work
with the industry to address these challenges and promotes the development of Islamic
finance within the UAE as well as globally.
0
50,000
100,000
150,000
200,000
Saud
i Arab
ia
Malaysia
UA
E
Turkey
Pakistan
Qatar
Bah
rain
Ind
on
esia
0
15,000
30,000
45,000
60,000
Malaysia
UA
E
Saud
i Arab
ia
Bah
rain
Ho
ng K
on
g
Ind
on
esia
Turkey
Qatar

57
UAE Stock Markets
Regulatory Developments by The Securities and Commodities Authority
Performance of UAE Listed PJSCs 2015
The total number of public shareholding companies listed in Abu Dhabi Securities
Exchange (ADX) and Dubai Financial Market (DFM) is 125 companies (110 UAE
incorporated companies plus 15 foreign companies).
The total net profit “attributed to shareholders” achieved by the UAE listed companies is
62.8 bAED in 2015 compared to 62.8 bAED achieved in 2014. The net profit is supported
by profit generated from the banking sector since it has been increased by 8% from 35.1
bAED in 2014 to 37.9 bAED in 2015. The Revenues has increased by 1.5 bAED in 2015
compared to 2014 and by (0.6%).
Table 10. Net profit of UAE listed companies in ADX and DFM by sector (in mAED)
Sector 2014 2015 Change (value) Change (%)
Banks 35,076 37,863 782,2 ,%
Consumer Staples 131 118 (12) (3%)
Energy (2,553) (1,265) 1,288 decrease in Loss
50 % decrease in loss
Industry 865 1,077 717 74%
Insurance 800 (110) (911) (118%)
Investment and Financial Services
3,916 1,783 (2,163) (55%)
Real Estate 11,161 10,528 (933) (8%)
Services 1,181 1,158 722 73%
Telecommunication 10,710 10,201 (506) (5%)
Transportation 881 813 (39) (1%)
Total ESM 078,66 078206 (31) (6.60%)

58
The banking sector has contributed (60%) of total net profit achieved in 2015 followed by
real estate sector with has contributed (17%) of total net profit then telecommunication
sector (16%) and then investment and financial services sector (3%).
Figure 72. Market capitalization of sectors in ESM in 2015 (in bAED)
The banking sector in the UAE has contributed the majority towards total market
capitalization representing 45% or 311 bAED as at December 2015. Telecommunications
has contributed 24% or 163 bAED and finally the real estate sector, in third place,
contributes 17% at 121 bAED in 2015. Total market capitalization as at December 2015
was 693.8 bAED.
The following figure shows the net profit achieved by UAE listed companies in Emirates
Stock Market (ESM) and the market capitalization for those companies during 2011 to 2015.
Figure 73. Net Profit and Market Capitalization for UAE listed publicly joint companies in Emirates Stock Market (in bAED)
350
300
250
200
150
100
50
0
IndustryConsumer Staples
Investment and Financial
Services
Real EstateTelecommunicationBanks Others
0
10
20
30
40
50
60
70
300
350
400
450
500
550
600
650
700
750
2015201320122011 2014
Net Profit for UAE PJSCs
Market Capitalization (RHS)

59
Performance of the Emirates Securities Market 2015
Figure 74. Performance of the Emirates Securities Market (ESM), Abu Dhabi Exchange (ADX) and Dubai Financial Market (DFM)
The ESM index opened on 4th January 2015 at 4,580 points and closed in YE Dec 31st
2015 at 4,279 an over decrease in the performance of the index of 6.5%. The upside has
been significantly reduced as a result of 2015 dramatic global events such as the drop in oil
prices as well as the negative overall growth prospects of the entire region.
Figure 75. Total value traded on both DFM and ADX during 2015 (in bAED)
Dubai (DFM) and Abu Dhabi (ADX) stock exchanges volatility (annualized) 2015
Monthly volatilities on DFM stock market have declined from 81% in December 2014 to
27% in December 2015, whereas the monthly volatilities on ADX stock market have
declined from 49% in December 2014 to 17% in December 2015 as markets start to
overcome the effect of drop in oil prices to constant levels and the new developments in
global economic growth.
DFM stock market exhibits higher volatility than ADX. On average, monthly volatilities on
ADX stock market have followed the same path of DFM. The August 2015 peak in
volatility was 24% for the ADX instead of 37% for the DFM.
It is evident from the chart that trading is heaviest in Q1/Q2 periods with a significant
cooling down period towards the end of the year. Furthermore, traded values on the DFM
are greater than those on the ADX and contribute the majority of trading activity in the
UAE.
2,500
3,000
3,500
4,000
4,500
5,000
5,500
Jan 16Nov 15Sep 15Jul 15May 15Mar 15Jan 15 Oct 15Apr 15Feb 15 Dec 15Aug 15Jun 15
ESMDFMADX
4.0
3.5
3.0
2.5
2.0
1.5
1.0
0.5
0.0
Dec 15
Nov 15
Oct 15
Sep 15
Aug 15
Jul 15
Jun 15
May 15
Apr 15
Mar 15
Feb 15
Jan 15
ADX
DFM

60
Figure 76. Total value of trades on both ADX and DFM stock exchanges during 2015 (in bAED)
The total value of trades traded on both the ADX and DFM stock exchanges amounted to
209.4 bAED from the beginning of January up until Dec 31st 2015 compared to the 525
bAED during the same period in 2014. Heaviest trading took place during the month of
April and June 2015.
Figure 77. Total volume of trades on both ADX and DFM stock exchanges during 2015 (in bAED)
The total volume of shares traded from January 2015 up to December 31st 2015 was 125.6
bAED compared to 217 bAED volume of shares during the same period in 2014.
22 bAED total volume traded was recorded in April 2015 with the lowest volume traded
recorded in October 2015 at approximately 5 bAED.
Regulatory Developments by the SCA
New regulation issued by SCA in 2015:
1. Clearing Operations in Commodities Markets.
2. Registration of Auditors of Public Shareholding Companies and Mutual Funds.
3. The Controls and Procedures regarding the Company Buying back its Shares.
4. Dormant Accounts of the Brokerage Firms’ Clients.
5. The Accounting System Controls and the Formation of Debt Provision for Brokerage
Companies.
15
20
25
30
35
10
0
5
Oct 15Sep 15Aug 15Jul 15Jun 15May 15Apr 15Mar 15Feb 15Jan 15 Nov 15 Dec 15
Total Value
15
25
5
10
20
0
Dec 15Nov 15Oct 15Sep 15Aug 15Jul 15Jun 15May 15Apr 15Mar 15Feb 15Jan 15
Total Volume
61
6. The Controls and Procedures of Conciliation in Offenses Relating to Public
Shareholding Companies.
The regulations which have been amended in 2015:
1. The Regulations as to the Functioning of the Market.
2. The Regulations as to Trading, clearing, Settlement, Transfer of Ownership and
Custody of securities.
3. The regulation concerning Brokerage in Securities.
4. Lending and Borrowing of Securities.
5. The Fees due to the Authority from Dubai Gold and Commodities Exchange.
6. The Regulations as to Disclosure and Transparency.
7. Amendments of guidelines and procedures of implementing Article (168) from
Companies Law
New Regulations to be issue in 2016:
1. Investment Fund.
2. Initial Public Offerings.
3. Corporate Governance.
4. Merger and Acquisition.
SCA capital market news and developments in the UAE 2015
SCA issues controls for newly-incorporated public joint-stock companies
As part of its efforts to develop and improve public joint-stock companies' controls, the
Securities and Commodities Authority's (SCA) board of directors agreed to approve specific
controls for offering and listing the shares of newly-incorporated public joint-stock
companies thus boosting investor confidence, promoting investor protection and improving
the UAE securities markets.
SCA board takes actions to raise country's competitiveness
The board of directors of the Securities and Commodities Authority (SCA) approved
amendments to the Regulations concerning Disclosure and Transparency and those
concerning Trading, Clearing, Settlement, Transfer of Ownership, and Custody of
Securities, as well as other amendments to the regulatory controls and procedures as to the
application of Article (168) of the Commercial Companies Law.
Amendment of Governance Rules and Corporate Discipline Standards stresses the requirement to nominate women to Boards of Directors
The Chairman of the Securities and Commodities Authority (SCA), issued Ministerial
Resolution No. (225) of 2015 amending certain provisions of the Ministerial Resolution No.
(518) of 2009 concerning Governance Rules and Corporate Discipline Standards. The
Articles of Association shall determine the method of formation of the board of directors,
the number of board members and term of membership. It should be observed that the
candidates for membership of the Board of Directors must include at least one female
candidate. The company shall disclose the reasons for not having any female candidates for

62
the Board, and shall also disclose the percentage of female representation in the Board of
Directors in its Annual Report on Corporate Governance.
SCA signs MoU with DMCC
SCA signed an MOU with the Dubai Multi Commodities Center (DMCC) aimed at
fostering collaboration, attracting foreign investment and promoting investor protection to
better serve the UAE national economy.
SCA to offer Claritas Investment Certificate offered by the CFA Institute
Approval has been given to go ahead and teach the Claritas Investment Certificate offered
by the renowned CFA Institute in October 2015. This certificate will be part of SCA’s
internal program. The course duration is thirteen months and serves SCA staff across all
departments. The Claritas Program covers the essentials of finance, ethics, and investment
roles, providing a clear understanding of the global investment industry.
SCA Board has approved “Continuous Professional Development” (CPD) for SCA registered professionals
SCA’s Board of Directors has approved a CPD program for all SCA registered
professionals. Implementation of the program is expected to be announced in due course.
All industry professional registered with and licensed with SCA will be expected to comply
with this directive.
SCA Issues First Securities Lending and Borrowing Agent Approval
As part of its sustained efforts to develop local capital markets and meet the needs of
investors and all strategic partners, the Securities and Commodities Authority granted the
National Bank of Abu Dhabi (NBAD) approval to engage in securities lending and
borrowing activities.
Dormant Accounts of Brokerage Firms’ Clients
SCA Board of Directors approved that brokerage firms shall convert clients’ accounts to
Dormant Accounts after a three year lapse without of not making any transactions through
his account or without updating data requirements properly. The notification shall require
the client to update his data with the company, or to use the account within thirty (30) days
from the date of notification.
Accounting System Controls
SCA has approved that brokerage firms provide a special electronic accounting system for
the management of their own accounts and the accounts of their clients, provided that the
system satisfies certain technical requirements for the archiving and storage of sensitive
information.
SCA Meets Japanese Financial Services Agency, Tokyo
As part of the visit made by H.E. Eng. Sultan bin Saeed Al Mansoori, Minister of Economy,
to Japan to promote bilateral cooperation in economy, commerce, and investment, a SCA

63
delegation held thorough discussions and meetings with the Japanese counterpart to discuss
mechanisms and initiatives and review the necessary procedures to realize SCA's strategic
plan to promote the UAE markets from emerging to developed over the next five years.
SCA Announces Innovation Award for Capital Market Research
H.E. Sultan bin Saeed Al Mansoori, Minister of Economy and Board Chairman of the
Securities and Commodities Authority, announced the launch of the Innovation Award for
Capital Market Research and said that the award aims to promote innovative research in
securities and commodities. He added that the award, worth a total AED90,000 aims to gain
momentum and recognition by tapping new ideas and creative thinking that will work to the
benefit of the UAE’s regulatory and licensing processes, regulation-drafting processes,
supervisory functions, awareness campaigns, as well as other capital market operations.
64
The Insurance Sector
Insurance Authority continues the Regulatory Development in the Insurance Sector in UAE.
At the end of 2014 Board of Directors of the Insurance Authority, issued Decision No. (25)
Of 2014 Pertinent to Financial Regulations for Traditional Insurance Companies and
Decision No. (26) of 2014 Pertinent to Financial Regulations for Takaful Insurance
Companies, which regulate the financial, technical, investment, and accounting operations
of Traditional and Takaful insurers operating in the UAE.
These Financial Regulations which cover the financial, investment, technical and accounting
operations of UAE insurance companies were seen as a significant move ahead in
developing the regulatory principles and technical rules for the development of UAE
insurance market performance, and to protect the rights of policyholders and shareholders;
and they represent an advanced and key step toward regulating the operations of Traditional
and Takaful insurance companies operating in the UAE and boosting their performance as
per the best competitive standards worldwide.
The issuance of the Financial Regulations put the UAE at the forefront of the Middle East
with regard to adopting the latest solvency requirements similar to the European model.
The Financial Regulations require a significant upgrade of almost all internal systems and
procedures for insurance companies operating within the UAE and in recognition of this
there are alignment periods of from one to three years for various components of the
regulations. While companies must demonstrate progress with all areas of the regulations,
the portions of the regulations with a one-year alignment period are focused on accounting
records and policies which impact all financial reporting beginning with year-end 2015. The
two-year alignment period is focused on investment limits (other than Real Estate) and full
compliance with the technical provisions. The three-year alignment period is focused on the
new Solvency requirements, which includes determination of admissible assets, and
investment limits for Real Estate.
During 2015, the Insurance Authority held numerous workshops for the Industry, issued
new standardized financial reporting forms (eForms), and began more in depth inspections
of all insurance companies with the goal of helping companies comply with the new
regulations. During 2015, all companies needed to update their External Auditor
requirements, appoint an Actuary, establish an Internal Audit department, and appoint a
regulatory compliance officer, so that they were ready to publish financial statements for
year-end 2015 in compliance with the Accounting aspects of the new regulations.
Takaful insurance business
In view of the special nature of the Takaful insurance business, separate Regulations were
developed for Takaful insurance companies operating in the UAE that are compatible with
the Takaful insurance Regulations applicable in the UAE and in line with the Islamic Sharia.
The Regulations identified the policies that should be adopted in such companies in terms
of the Wakala model or Wakala & Mudaraba Model, in addition to provisions pertaining to

65
the distribution of surplus on participants in Takaful insurance business and the importance
of separating the assets of participants’ accounts and shareholders’ accounts in the company.
Such Regulations come in line with the Insurance Authority’s continuous efforts and
endeavor to regulate the UAE insurance sector and enhance the performance of the local
insurance market and all entities working therein based on robust legal, technical and
financial principles and upgrade the competitiveness of the insurance sector at the regional
and international levels as per the best practices prevailing worldwide.
New investment rules to protect the rights of policyholders and companies against risks.
Regulations on The Basis of Investing the Rights of the Policyholders aim at protecting the
rights of policyholders and shareholders of insurance companies alike, in addition to
protecting the companies themselves against future potential risks by the regulation and
control of the investment activities of the insurance companies.
Such principles are intended to establish controls for investment activities of the insurance
companies to ensure liquidity, profitability, safety, and diversity without engaging in
investments incompatible with the nature of the company’s activities and business, which
may undermine its financial position. They also aim to direct the insurance companies to
focus and give priority to developing and promoting their main operational activity, namely
the insurance business.
The Regulations adopted the frameworks applicable internationally, in particular ICP No.
(15) issued by the International Association of Insurance Supervisors (IAIS) concerning the
investment of policyholders’ rights, in terms of management of insurance companies’
investment and selection of suitable investment instruments by emphasizing diversity of
investments, minimizing focus on reducing risks while considering the limited scope of local
investments, and setting determinants on high-risk or inappropriate investments such as
unlisted shares, real estate investments and foreign investments.
The Regulations include provisions that boost the role of Boards of Directors of the
companies in supervising the investment performance and promoting the role of specialists
such as the actuary, and consequently, emphasizing the principles of corporate governance,
activating risk management, and adopting stress tests when developing, implementing and
evaluating the investment policy of the company.
These Regulations enforce the insurance companies to assess risks and evaluate their
solvency in key risk areas, including risks related to underwriting, investment, credit, liquidity
and operational risks, under the risk management framework system.
General Requirements for Investment The Regulations include the general requirements for the investment of policyholders’ rights
through compliance by the insurance companies with certain rules in their investment
operations, including the diversity and distribution of assets in a manner that enables the
company to efficiently respond to the changing economic conditions including the
developments taking place in the financial markets and real estate markets. The companies

66
should assess the extraordinary impact of the market conditions on their assets. They
should diversify their assets in a manner that mitigates such impacts.
The Regulations stipulate that investing in products or instruments issued by the same issuer
affiliated with the same group as the insurance company should not expose the company to
high-risk concentration; and thereby, the prescribed limits for related assets and related
parties should be observed. The company must create an investment committee that ensures
adequate separation of functions between implementation, registration, delegation,
settlement and related auditing activities.
Assets must be in an adequate amount, in a current currency and for an appropriate term to
ensure cash flows generated from such assets are enough to meet the expected cash out-
flows for the company’s liabilities when they are accrued.
General Rules for investment policy
The Regulations set the general rules for the investment policy. Most significantly, each
insurance company shall develop a special policy for investment and risk management that
complies with the risk tolerance level determined by the Board of Directors of the company
to ensure sound investment of the company’s funds. The investment and risk management
policy shall be approved and reviewed on an annual basis by the Board. Such policy shall
cover the general investment strategy and appropriate risk management
regulations, including the mechanism to control such regulations. The risk management
regulations shall cover the risks pertaining to investment operations that might impact the
fulfilment of insurance and capital adequacy obligations. The key risks include market,
credit, and liquidity risks. Appropriate procedures shall be taken to control and ensure
compliance with limits of assets and limits of corresponding parties. The assessment of the
credit solvency of related parties which the company is exposed to their significant
transactions shall be adequately reviewed.
The companies must set a policy and a framework for stress tests of all its investments to be
conducted once a year as per the company’s policies. Foreign insurance company branches
shall prove to the Insurance Authority in all cases that the frameworks and policy of
investment stress tests related to operations implemented within the UAE are in place at the
company’s head office level in a manner that shows operations within the UAE.
The company shall also adopt a separate investment strategy for insurance of persons
and funds accumulation operations on the one hand and property and liability insurance
operations on the other hand, especially in the cases where the company practices both
types of insurance.
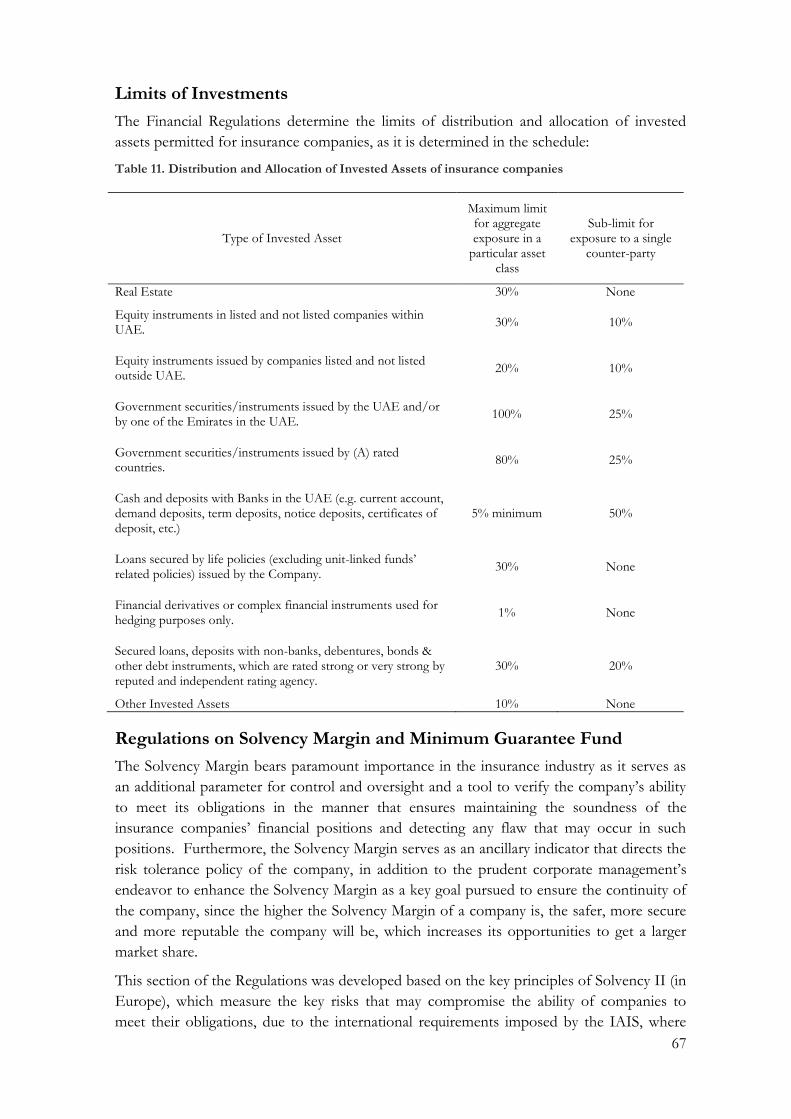
67
Limits of Investments
The Financial Regulations determine the limits of distribution and allocation of invested
assets permitted for insurance companies, as it is determined in the schedule:
Table 11. Distribution and Allocation of Invested Assets of insurance companies
Type of Invested Asset
Maximum limit for aggregate exposure in a
particular asset class
Sub-limit for exposure to a single
counter-party
Real Estate 30% None
Equity instruments in listed and not listed companies within UAE.
30% 10%
Equity instruments issued by companies listed and not listed outside UAE.
20% 10%
Government securities/instruments issued by the UAE and/or by one of the Emirates in the UAE.
100% 25%
Government securities/instruments issued by (A) rated countries.
80% 25%
Cash and deposits with Banks in the UAE (e.g. current account, demand deposits, term deposits, notice deposits, certificates of deposit, etc.)
5% minimum 50%
Loans secured by life policies (excluding unit-linked funds’ related policies) issued by the Company.
30% None
Financial derivatives or complex financial instruments used for hedging purposes only.
1% None
Secured loans, deposits with non-banks, debentures, bonds & other debt instruments, which are rated strong or very strong by reputed and independent rating agency.
30% 20%
Other Invested Assets 10% None
Regulations on Solvency Margin and Minimum Guarantee Fund
The Solvency Margin bears paramount importance in the insurance industry as it serves as
an additional parameter for control and oversight and a tool to verify the company’s ability
to meet its obligations in the manner that ensures maintaining the soundness of the
insurance companies’ financial positions and detecting any flaw that may occur in such
positions. Furthermore, the Solvency Margin serves as an ancillary indicator that directs the
risk tolerance policy of the company, in addition to the prudent corporate management’s
endeavor to enhance the Solvency Margin as a key goal pursued to ensure the continuity of
the company, since the higher the Solvency Margin of a company is, the safer, more secure
and more reputable the company will be, which increases its opportunities to get a larger
market share.
This section of the Regulations was developed based on the key principles of Solvency II (in
Europe), which measure the key risks that may compromise the ability of companies to
meet their obligations, due to the international requirements imposed by the IAIS, where

68
the UAE is an active member, in addition to the multiple and diversified risks that the
insurance companies are exposed to.
One of the most important objectives of issuing these Regulations is to provide an early
warning system to detect flaws in the companies’ financial conditions, which would increase
the potentials for addressing such financial flaws in the early stages, which in turn would
help fortify the control and monitoring regulations over the insurance companies.
Additionally, these Regulations aim at enhancing the ability of insurance companies to
accommodate potential financial shocks and crises, and thereby creating a reliable insurance
market and help the financial stability in this market.
The Regulations include provisions related to the Solvency Margin which include Minimum
Capital Requirements (a fixed lower limit under the Law), Solvency Capital Requirements (a
risk adjusted limit based on Solvency II), and Minimum Guarantee Fund (a risk adjusted
limit based on Risk-Based Capital requirements). These three limits work in combination to
gradually increase the Solvency Margin requirements for each company based on their
individual risk profile.
Principles of Solvency Margin Forms
The Solvency Margin Forms (included with the eForms) approved by the IA are based on
many principles, the most important of which is to calculate the Solvency Capital
Requirements based on the assumption that the company will continue operation on going
concern basis. Solvency Capital Requirements shall be calibrated to make sure that the
company observes all measurable potential risks, provided that this includes both current
business and new business that the company is expected to write within the next twelve (12)
months.
The Solvency Capital Requirements cover underwriting, market, liquidity (investment risks),
credit and operational risks. All companies must comply at all times with the Solvency
Margin to ensure maintaining Own Funds that meet the higher amount of the Minimum
Capital Requirement, Solvency Capital Requirement, and Minimum Guarantee Fund. A
Company must immediately report to IA in the event of non-compliance with maintaining
the Minimum Capital Requirement, Solvency Capital Requirement, and Minimum
Guarantee Fund.
A qualified actuary is accredited for every insurance company operating in the UAE
The Financial Regulations related to the basis of calculating technical provisions are issued
in line with the international trends in the insurance industry that the companies must
maintain adequate and appropriate technical provisions that reflect the nature of operations
of the insurance companies, and to avoid variance in the estimates of technical provisions
made by the companies and the corresponding underwriting obligations, whether in terms
of their value or time of occurrence. These include the technical provisions that must be
created by the insurance companies operating within the UAE and that should be
maintained within the UAE, in addition to determining the methods to calculate the
technical provisions so that they are consistent with the international best practices used in
the calculation of technical provisions.

69
These Regulations aim at regulating the technical principles of calculating technical
provisions and standardizing them for all companies in order to attain fair comparison, and
objective control and analysis of the positions of companies by the IA and in order to
provide fairer financial statements that reflect the financial positions of the companies.
Furthermore, binding the companies to have an assessment for their technical provisions by
an Actuary is the starting point towards directing the companies to work in accordance with
sound technical foundations and avoid price competition that leads to non-technical
products. Besides, having an Actuarial Report on the assessment of technical provisions
increases the fair presentation of financial statements that match the actual financial
positions of the companies.
Risks Facing the Insurance Industry
During this first alignment year, most companies have fully complied with both the letter
and spirit of the new Financial Regulations, but there is a risk that some of the weaker
companies may either need to discontinue operations or look to merge with or be acquired
by a stronger company. In general, both the Motor and Medical markets remain the two
largest segments in terms of premium volume, yet they are also the most competitive which
has led to underwriting losses for many companies which will threaten their continued
financial strength if left unchecked.
For year-end 2015, and perhaps again at year-end 2016, the Insurance Authority expects that
the requirements for technical provisions force companies to strengthen their balance
sheets. In the longer run, this will improve the financial strength and stability of the entire
market as it will help companies recognize all costs as they improve underwriting practices
and pricing policies.

70
Financial Market Infrastructure and Payments
Introduction
Financial Market Infrastructure is an essential component of a financial market as it
facilitates safe and smooth flow of funds and other financial assets in the economy.
The UAE payments ecosystem is well established and diversified. Major reforms were
undertaken by the CBUAE in order to make payment systems more efficient and useful to
the end users by promoting the use of electronic payments, reducing cash transactions and
at the same time managing the risks more efficiently. The CBUAE is working on Digital
Payments Regulatory Framework to support the Smart Government initiative.
The overall assessment conducted by the CBUAE of the major payment systems shows that
these systems are sound, and are not a source of any major risk to the stability of the
financial system in the country. Nevertheless, certain operational aspects of payment
systems need to be strengthened in order to increase the security and efficiency of the UAE
payment systems.
UAE Payment Systems landscape
During the past 10 years, the UAE authorities have diversified the payment systems and
increased the number of options available to the individual and corporate stakeholders. The
CBUAE has played a key role in this development, managing and operating various
payment systems, and coordinating payment systems innovation and development.
The CBUAE currently operates the following payment systems:
1. UAEFTS (UAE Funds Transfer System- the retail & large value payment system -
the only Real-time gross settlement (RTGS) system).
2. ICCS (Image Cheque Clearing System)
3. UAEDDS (UAE Direct Debit System)
4. WPS (Wages Protection System)
5. UAE Switch (ATM withdrawals with debit cards issued by different banks in the
country).
In 2015 the CBUAE has initiated a process to issue a comprehensive regulation on Digital
Payments. The regulation passed the process of consultations and will be issued before the
end of 2016.
At the regional level, the CBUAE continues its involvement in the regional payment
initiative i.e. GCC-RTGS project. This project aims to enable a real-time processing of cross
border payments among GCC countries using their domestic currencies.
The CBUAE continues to support the efforts to create the Arab Regional Payment
ecosystem. As part of the effort it participates actively in the Arab Regional Payment System
project that seeks to integrate the clearing and settlement of cross-border payments in the
Arab region by enabling the substitution of the existing correspondent banking system with
a new centralised system for clearing and settlement of intra-regional cross border payments.

71
The CBUAE has planned to introduce the following new initiatives for the year 2016:
A Payment Gateway Services will be launched by the CBUAE to provide an
infrastructure to bring together merchants and the residents of UAE with an
automated e-commerce payment method. It is an internet based payment tool
facilitates easy transfer of funds to the accounts of merchants and participant banks
by debiting the current and savings accounts of end customers. This system, once
introduced, will remove the time delay and cumbersome process of establishing
multiple mesh type of direct connections between different merchants and their
banks so as to realize the payments initiated by end customers.
A domestic Point of Sale through which the UAE Switch will be handling all POS
transactions initiated by the merchants within the UAE without a need for routing
domestically initiated transactions to international gateway such as Visa, MasterCard
etc.
Enhancement of contingency planning to encompass the management of operational
risk more broadly, and particularly, cyber risk. In 2016, the CBUAE has planned to
strengthen its Information Security management program in line with the directives
issued by the National Electronic Security Authority of UAE (NESA) with special
focus on mitigating risks due to potential online attacks on systems and
infrastructures.
Central Bank’s role as overseer of Market Infrastructures
In its capacity as the authority in charge of ensuring the stability of the financial system of
the country, the CBUAE is acting as the primary overseer of the payment, clearing and
settlement systems operating in the country with the objective of supervising the efficiency,
security, effectiveness and consistency of these systems.
The CBUAE has identified two systems i.e. UAEFTS and ICCS as systemically important
and started implementing various risk management measures in order to render them safe,
resilient and sound. A disruption in the normal functioning of the above two payment
systems might trigger a major interruption in payments between the major market
participants and jeopardise financial stability.
In 2015, the CBUAE conducted the assessment of the two systems based on the assessment
methodology introduced by the BIS. The assessment revealed certain gaps and areas of
improvement, and provided certain recommendations to mitigate the risks identified in the
areas such as Legal, Governance and Risk Management. The CBUAE is working with the
relevant departments in fixing the gaps.
In 2016 the CBUAE will conduct assessments of other payment systems: UAEDDS (UAE
Direct Debit System), and the WPS (Wages Protection System), in addition to a review of
the first assessment to ensure that the required changes, enhancements and reform have
been properly implemented.
72
Safety & Soundness of the UAE payment systems
Based on the outcome of the assessment performed by the CBUAE, the UAE payment
systems are sound and secure with no major vulnerabilities that could affect the stability of
the financial system of the UAE.
The following actions were taken:
The operating time window for the RTGS- UAEFTS was extended significantly with
which the retail customers can make funds transfer up to 4.30 PM on a working day
and the interbank funds transfer can be completed up to 5.30 PM.
All other net settlement systems including the ICCS system shall close before
UAEFTS settles.
The deadline for participants to avail intraday credit facility including overdraft in
their current accounts maintained with the CBUAE has also been extended up to
5.30 PM.
The CBUAE has implemented a comprehensive default management procedure for
ICCS to avoid any systemic disruptions in payments even in the case of a bank failing
to meets its commitments under ICCS. Such procedures for the RTGS system
(UAEFTS) will be introduced in the year 2016.
In order to discipline the participants who are in breach of the rulebook terms and
conditions of each payment system, the CBUAE has started levying a noncompliance
fee for each occasion of such violation.
Performance of Central Bank’s payment systems
UAE Funds Transfer System (UAEFTS)
UAEFTS is the 100% CBUAE owned RTGS system that was launched in August 2001 with
a facility to automate the transfer of funds between participants’ accounts held at the
CBUAE. Currently the transfers are restricted to UAE dirhams whereas the system has the
capability to carry out funds transfer in other international currencies. Straight through
processing (STP) was introduced in March 2012. With this facility, the customers of
member institutions can send and receive remittances in AED using different channels.
Currently access to the UAEFTS is restricted to the licensed banks, certain non-banking
institutions engaged in WPS remittances, money exchange houses licensed by the CBUAE
and UAE Government ministries and agencies.
At present, the UAEFTS system handles only the cash remittances initiated by the
participants and their customers whereas the cash leg settlement of securities traded at the
Dubai Financial Market (DFM) and Abu Dhabi Securities (ADX) are being handled by two
commercial banks.

73
Figure 78. The amount of intraday overdraft used by the participant banks
The amount of intraday overdraft used by the participant banks has declined significantly
over the past three years. In 2015 it has dropped to 542.5 bAED (2014: 602.5). Changing
the UAEFTS settlement time to 5.30 PM is one of the reasons for the fall in overdraft
availed by the participants as liquidity level of banks improved with extension of UAEFTS
closure time.
The system reached 100% availability in 2015. The total number of bank-to-bank transfers
was around 413 thousand with a turnover of 6.5 TnAED. The volume showed a marginal
increase of 0.7% over the previous year whereas the total value was 4.4% more than in
2014.
Figure 79. Value (in bAED) and number (RHS in millions) of transaction in FTS system
Image Cheque Clearing System (ICCS)
ICCS was introduced in July 2008. It provides a safe, secure, efficient and robust payment
mechanism in the United Arab Emirates. Banks will settle cheques issued on accounts held
by them based on electronic images of these cheques. ICCS reduces the dependence of the
payment infrastructure on the physical movement of paper, and therefore facilitates shorter
clearing and settlement cycles. It also facilitates quicker realization of funds on these items.
CBUAE also acts as the national central archive for all items delivered via the Image Cheque
Clearing System (ICCS). The ICCS Cheque Archive is available to all banks, providing
access to the images of cheques cleared via ICCS. Individual items within the archive will be
available to the Presenting Bank, the Issuing Bank and the Clearing House.
-
5
10
15
20
25
30
35
40
-
2,000
4,000
6,000
8,000
10,000
2013 2014 2015
Other
Bank to Bank
Customer to Customer
Total Number
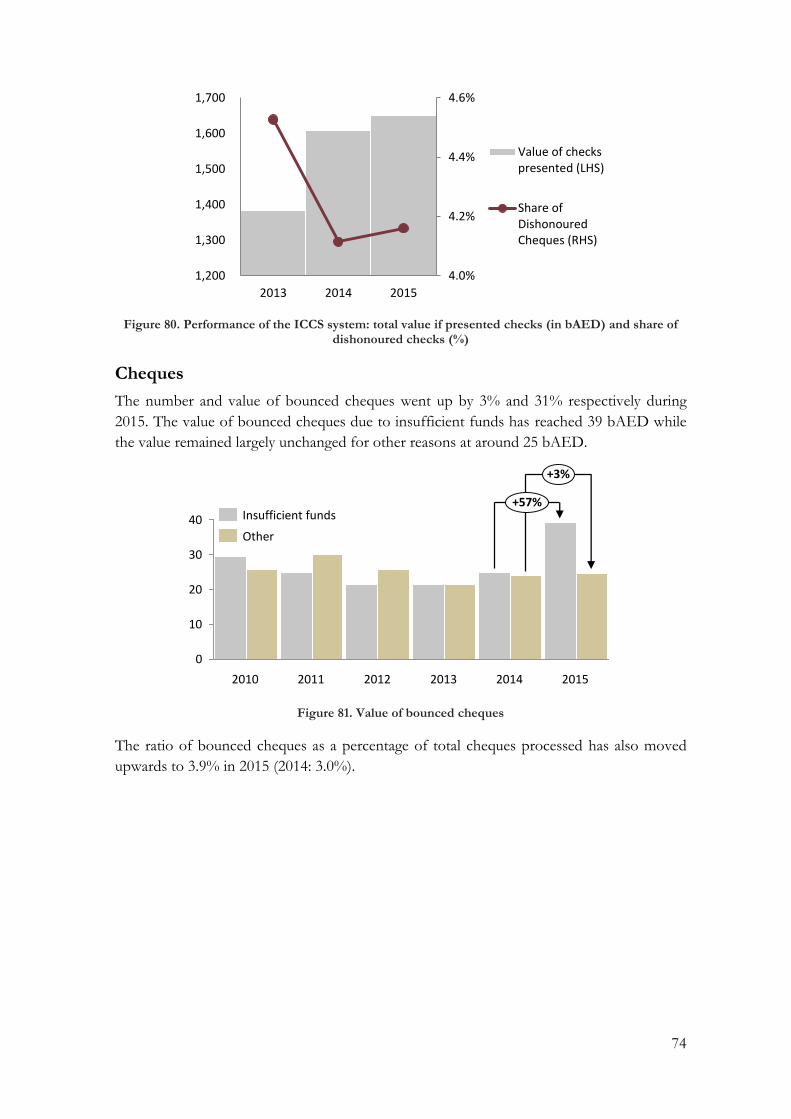
74
Figure 80. Performance of the ICCS system: total value if presented checks (in bAED) and share of dishonoured checks (%)
Cheques
The number and value of bounced cheques went up by 3% and 31% respectively during
2015. The value of bounced cheques due to insufficient funds has reached 39 bAED while
the value remained largely unchanged for other reasons at around 25 bAED.
Figure 81. Value of bounced cheques
The ratio of bounced cheques as a percentage of total cheques processed has also moved
upwards to 3.9% in 2015 (2014: 3.0%).
4.0%
4.2%
4.4%
4.6%
1,200
1,300
1,400
1,500
1,600
1,700
2013 2014 2015
Value of checkspresented (LHS)
Share ofDishonouredCheques (RHS)
20
30
10
0
40
2010 20152014201320122011
+3%
+57%Insufficient funds
Other

75
Figure 82. Percentage of bounced cheques to total cheques presented
UAE Direct Debit System (UAEDDS)
The system was introduced in the year 2013 as a safe and convenient method for regular
payments with fixed or variable amounts. The value of presented claims increased to 11
bAED in 2015 (2014: 2 bAED). Share of dishonoured claims has also increased and
exceeded 25% (2014: 18%).
Figure 83. Presented claims (in bAED) and share of dishonoured claims (RHS, %) in the DDS
Wages Protection System
The Wages Protection System (WPS) was implemented in cooperation with the Ministry of
Labour (MOL) to streamline the timely payment of wages to employees in October 2009.
Salary information flows from the employer to one or more of the contracted agents for
payment of the wages to their employees. Funds from the employers are secured by the
CBUAE prior to dispatching the wage information to the agents. As at the end of 2015, a
total of 108 entities participate in the system.
Figure 84. Value of transaction on WPS (in bAED)
2%
3%
4%
5%
6%
7%
8%
2015201420132012201120102009
Ø 4.8%
Number Value
0%
10%
20%
30%
-
5
10
15
2013 2014 2015
Presented Claims
Dishonoured Claims
147 171
195
2013 2014 2015

76
UAE Switch
Launched in 1996, the UAESWITCH scheme now comprises 43 member banks and over
4,500 ATMs. Through its connection to GCCNET, UAESWITCH allows cardholders to
obtain service at ATMs throughout the Gulf region.
The use of the network has grown over the years so that during 2015, monthly transaction
volumes are over 1.4 million balance enquiries and 7.4 million cash withdrawals (2014: 6.6
million) worth 11 bAED (2014: 10 bAED).
Figure 85. Cash withdrawals made by UAE card holders in the UAE (in bAED).
Payment Cards
In 2016, the CBUAE mandated that all cards issued in the UAE must comply with EMV
standards. Almost all the backend systems and POS terminals have become fully compliant
with EMV requirements. The number of EMV compliant cards issued has increased to 79%
in 2015 (2014: 57%).
Figure 86. Number of EMV and not EMV compliant cards issued (credit, debit and prepaid) in millions
Similarly, the value of Point of Sale transactions made through UAE merchants using
payment cards increased by 7.4%, while the number of PoS Terminals increased by 30
thousand terminals in 2015.
Figure 87. Value of PoS transactions (in bAED) and number of PoS terminals (th)
100 114 128
2013 2014 2015
0
4
8
12
16
2013 2014 2015
Not EMV
EMV
0
100
200
2013 2014 2015
Value
PoSTerminals
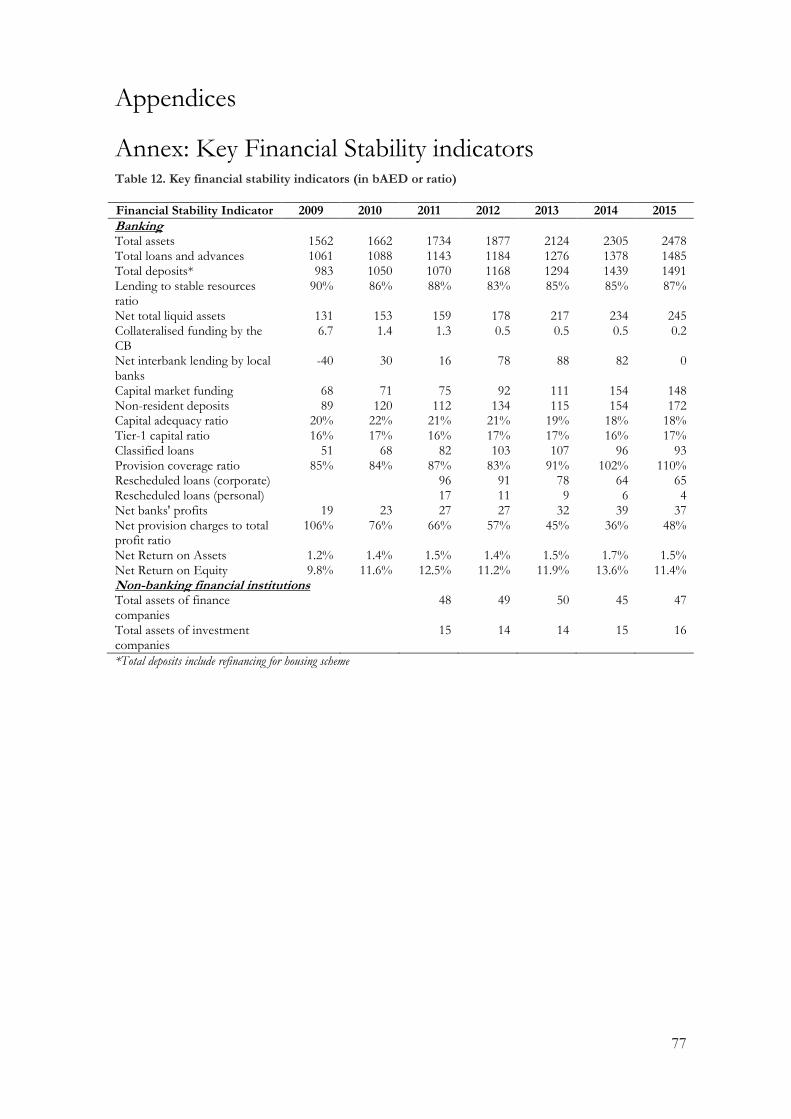
77
Appendices
Annex: Key Financial Stability indicators Table 12. Key financial stability indicators (in bAED or ratio)
Financial Stability Indicator 2009 2010 2011 2012 2013 2014 2015
Banking Total assets 1562 1662 1734 1877 2124 2305 2478 Total loans and advances 1061 1088 1143 1184 1276 1378 1485 Total deposits* 983 1050 1070 1168 1294 1439 1491 Lending to stable resources ratio
90% 86% 88% 83% 85% 85% 87%
Net total liquid assets 131 153 159 178 217 234 245 Collateralised funding by the CB
6.7 1.4 1.3 0.5 0.5 0.5 0.2
Net interbank lending by local banks
-40 30 16 78 88 82 0
Capital market funding 68 71 75 92 111 154 148 Non-resident deposits 89 120 112 134 115 154 172 Capital adequacy ratio 20% 22% 21% 21% 19% 18% 18% Tier-1 capital ratio 16% 17% 16% 17% 17% 16% 17% Classified loans 51 68 82 103 107 96 93 Provision coverage ratio 85% 84% 87% 83% 91% 102% 110% Rescheduled loans (corporate) 96 91 78 64 65 Rescheduled loans (personal) 17 11 9 6 4 Net banks' profits 19 23 27 27 32 39 37 Net provision charges to total profit ratio
106% 76% 66% 57% 45% 36% 48%
Net Return on Assets 1.2% 1.4% 1.5% 1.4% 1.5% 1.7% 1.5% Net Return on Equity 9.8% 11.6% 12.5% 11.2% 11.9% 13.6% 11.4% Non-banking financial institutions Total assets of finance companies
48 49 50 45 47
Total assets of investment companies
15 14 14 15 16
*Total deposits include refinancing for housing scheme

78
Annex: FSTI Methodology The FSTI is an average of the normalized quarterly variables selected at the end of each
quarter for the period covered, unless mentioned otherwise.
Definition of the transformed variables
is calculated as Bank’s Capital (Tier 1+2) / Risk Weighted Assets (RWA).
is calculated as the total Impairment loss (trailing 4-quarters period) / average total
assets (for past four quarters).
is calculated as the annual growth of end of quarter balance of NPLs.
is calculated as the Lending-borrowing (net lending) from banks abroad / Total
Loans.
is calculated as the liquid assets to total liabilities ratio of all banks.
is calculated as the ratio between loans-to-deposits of all banks.
is the trailing net profit after tax for all banks for the past four quarters / average
assets of all banks for the past four quarters.
is calculated as the non-interest expense for all banks/ total gross income for all
banks.
is calculated as the liability weighted average market default risk calculated by
Bloomberg for 13 local UAE banks.
is calculated as the free float weighted average 90 day volatility of DFIBANK &
ADBF Indices / free float weighted average 90 day volatility of DFMGI & ADSMI
Indices.
is built by using the function – ( )
, where represents the average price of Dubai real
estate at the period t and represents the value at t of the two-sided HP filter
applied on for the period Q2 2006 - Q4 2015.
is the ratio of current account balance to GDP.
is calculated as the end of quarter Brent Spot Price / end of quarter Brent Spot
Price of the previous year) – 1.
is calculated as the logarithm of mean absolute deviation of the value of one year
forward rates of USD/AED on a quarterly basis.
is the PE ratio of the composite MSCI UAE index.
is calculated as the 90 days market volatility for the composite MSCI UAE index.
is calculated as the average of 5 year CDS premium for all traded government
bonds of Dubai and Abu Dhabi Emirates.
Normalisation and calculation of the FSTI
All variables are statistically normalized as per the below formulae:

79
Where – the observed variable at the period t, – its sample mean and – its standard
deviation for the period June 2006 – December 2015.
The computational definition of FSTI is:
FSTI =∑
∑
∑
It is worth noting here that indicators that have a negative relationship to financial stability
were taken in their reciprocal value or in some cases simply multiplied by (-1).
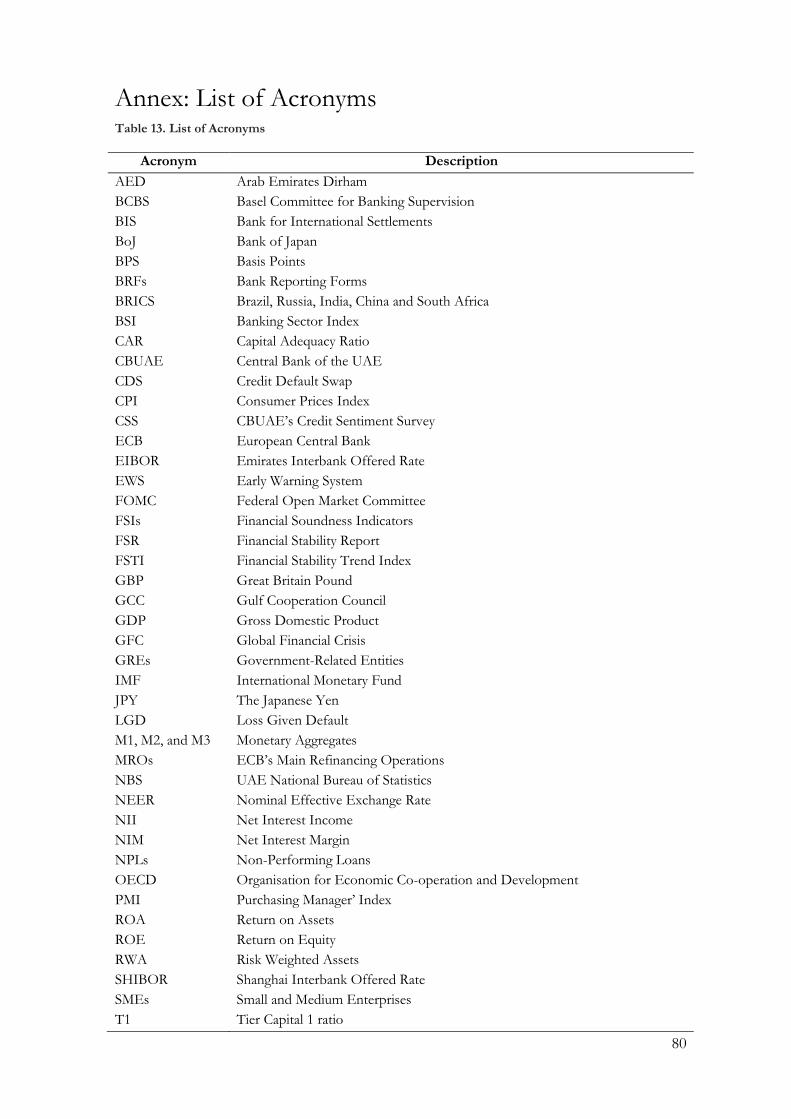
80
Annex: List of Acronyms Table 13. List of Acronyms
Acronym Description
AED Arab Emirates Dirham
BCBS Basel Committee for Banking Supervision
BIS Bank for International Settlements
BoJ Bank of Japan
BPS Basis Points
BRFs Bank Reporting Forms
BRICS Brazil, Russia, India, China and South Africa
BSI Banking Sector Index
CAR Capital Adequacy Ratio
CBUAE Central Bank of the UAE
CDS Credit Default Swap
CPI Consumer Prices Index
CSS CBUAE’s Credit Sentiment Survey
ECB European Central Bank
EIBOR Emirates Interbank Offered Rate
EWS Early Warning System
FOMC Federal Open Market Committee
FSIs Financial Soundness Indicators
FSR Financial Stability Report
FSTI Financial Stability Trend Index
GBP Great Britain Pound
GCC Gulf Cooperation Council
GDP Gross Domestic Product
GFC Global Financial Crisis
GREs Government-Related Entities
IMF International Monetary Fund
JPY The Japanese Yen
LGD Loss Given Default
M1, M2, and M3 Monetary Aggregates
MROs ECB’s Main Refinancing Operations
NBS UAE National Bureau of Statistics
NEER Nominal Effective Exchange Rate
NII Net Interest Income
NIM Net Interest Margin
NPLs Non-Performing Loans
OECD Organisation for Economic Co-operation and Development
PMI Purchasing Manager’ Index
ROA Return on Assets
ROE Return on Equity
RWA Risk Weighted Assets
SHIBOR Shanghai Interbank Offered Rate
SMEs Small and Medium Enterprises
T1 Tier Capital 1 ratio

81
UAE United Arab Emirates
UAEEI UAE Economic Index
UAESMI UAE Stock Markets Index
UK United Kingdom
US United States of America
USD The US Dollar


