56
Financial Stability Report November 2017
| Date post: | 07-Jun-2018 |
| Category: |
Documents |
| Upload: | truongtruc |
| View: | 213 times |
| Download: | 0 times |

Financial Stability ReportNovember 2017

iiRESERVE BANK OF NEW ZEALAND / FINANCIAL STABILITY REPORT, NOVEMBER 2017
Reserve Bank of New Zealand Financial Stability Report
Subscribe online: http://www.rbnz.govt.nz/email_updates.aspx
Report and supporting notes published at:
http://www.rbnz.govt.nz/financial-stability/financial-stability-report
A summary of New Zealand’s financial system is published at:
http://www.rbnz.govt.nz/financial-stability/overview-of-the-new-zealand-financial-system
This report is published pursuant to section 165A of the Reserve Bank of New Zealand Act 1989, which states that a financial stability report must:
(a) report on the soundness and efficiency of the financial system and other matters associated with the Bank’s statutory prudential purposes; and
(b) contain the information necessary to allow an assessment to be made of the activities undertaken by the Bank to achieve its statutory prudential purposes under this Act and any other enactment.
In addition, under the Memorandum of Understanding between the Minister of Finance and the Governor of the Reserve Bank of New Zealand, the Bank’s Financial Stability Report will report on matters relating to the soundness
and efficiency of the financial system including any build-up of systemic risk, and the reasons for, and impact of, any use by the Bank of macro-prudential policy instruments.
This Report uses data released up to 20 November 2017.
Copyright © 2017 Reserve Bank of New Zealand
ISSN 1176-7863 (print)
ISSN 1177-9160 (online)

1RESERVE BANK OF NEW ZEALAND / FINANCIAL STABILITY REPORT, NOVEMBER 2017
Financial Stability ReportNovember 2017
Contents1 Financial stability risk and policy assessment 2
2 Domestic risks to New Zealand’s financial system 8
Housing market vulnerabilities 8
Dairy sector indebtedness 12
Commercial property sector 15
3 International risks to New Zealand’s financial system 18
4 Soundness and efficiency of New Zealand’s financial system 26
5 Key regulatory developments 42
Boxes
A Impact of LVR restrictions on mortgage portfolio resilience 6
B Insights from the 2017 bank stress test 38
C FinTech developments and implications for RBNZ regulatory
responsibilities 40
Appendices
1 Reserve Bank enforcement actions 49
2 Presentations May - October 2017 49
3 Tables: Overview of New Zealand’s financial system 50
2RESERVE BANK OF NEW ZEALAND / FINANCIAL STABILITY REPORT, NOVEMBER 2017
Chapter 1Financial stability risk and policy assessment
New Zealand’s financial system remains sound. The banking system maintains adequate buffers over minimum capital requirements. Recent stress tests suggest that banks can withstand a severe economic downturn, although results are sensitive to a range of assumptions. Overall, the banking system appears to be operating efficiently in performing its financial intermediation role, despite a tightening in lending standards, which has contributed to a slowing in credit growth.
While New Zealand’s financial system remains exposed to a number of risks, these risks have reduced over the past six months. The key risks facing the financial system are: housing market vulnerabilities, dairy sector indebtedness and the banking system’s exposure to volatility in international funding markets.
Risk assessment
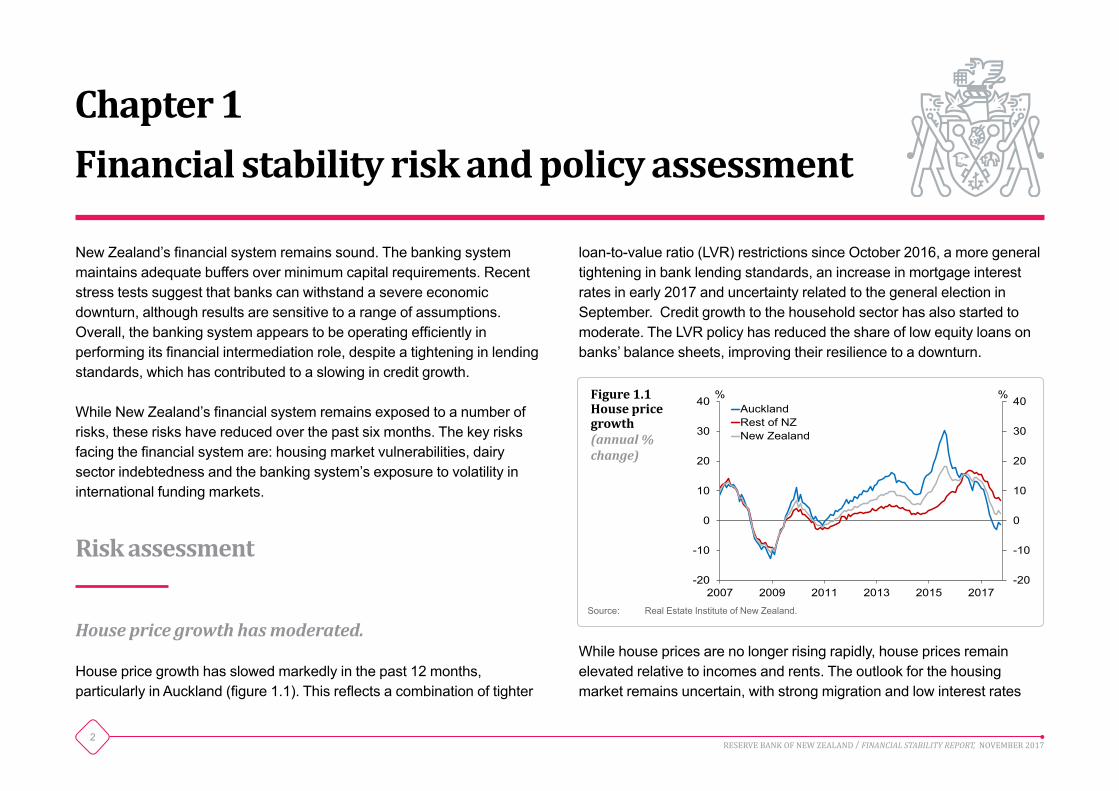
House price growth has moderated.
House price growth has slowed markedly in the past 12 months, particularly in Auckland (figure 1.1). This reflects a combination of tighter
loan-to-value ratio (LVR) restrictions since October 2016, a more general tightening in bank lending standards, an increase in mortgage interest rates in early 2017 and uncertainty related to the general election in September. Credit growth to the household sector has also started to moderate. The LVR policy has reduced the share of low equity loans on banks’ balance sheets, improving their resilience to a downturn.
While house prices are no longer rising rapidly, house prices remain elevated relative to incomes and rents. The outlook for the housing market remains uncertain, with strong migration and low interest rates
-20
-10
0
10
20
30
40
-20
-10
0
10
20
30
40
2007 2009 2011 2013 2015 2017
% % AucklandRest of NZNew Zealand
Figure 1.1House price growth(annual % change)
Source: Real Estate Institute of New Zealand.

3RESERVE BANK OF NEW ZEALAND / FINANCIAL STABILITY REPORT, NOVEMBER 2017
continuing to support housing demand. However, the Government has announced a number of policies that are likely to reduce housing demand and increase housing supply. On balance, housing market conditions are likely to remain subdued for some time, and this is likely to see the gradual reduction in housing market risks continue.
The dairy sector remains highly indebted.
Global dairy prices have declined in recent months, but remain well above their mid-2016 levels (figure 1.2). Most dairy farms are expected to be profitable in the 2017-18 season, and banks’ non-performing loans to the dairy sector have declined.
Banks have supported farms through the recent dairy price downturn, which has helped to limit loan defaults. However, this has led to an increase in debt in the sector, and some farms are highly indebted. It is appropriate for banks to continue working with the sector to use improved cash flow positions to reduce debt levels in the sector over time.
The banking system remains exposed to volatility in international funding markets.
The New Zealand banking system remains reliant on funding from international markets, and this exposes it to volatility in these markets. Over the past 12 months, banks have competed more aggressively for domestic deposit funding and have reduced credit growth, helping to reduce offshore funding requirements (figure 1.3).
There are a number of global risks that could flow through to New Zealand. Most notable among these are unintended consequences associated with an unwinding of unconventional monetary policies, a disruptive adjustment in China’s financial system following prolonged rapid credit growth, and high household debt in Australia.
0
50
100
150
200
250
300
0
50
100
150
200
250
300
2009 2011 2013 2015 2017
Index Index USD indexNZD index
Figure 1.2Dairy commodity prices(January 2009 = 100)
Source: GlobalDairyTrade, Thomson Reuters.
2014 2015 2016 201712
14
16
18
20
22
-4
0
4
8
12
16% $bn
Net offshore issuance (annual)Offshore market share of funding (RHS)
Figure 1.3Offshore market funding(three-month moving average)
Source: RBNZ Liquidity Survey.

4RESERVE BANK OF NEW ZEALAND / FINANCIAL STABILITY REPORT, NOVEMBER 2017
Policy assessment
The LVR policy has been in place since 2013 to address financial stability risks arising from rapid house price inflation and increasing household leverage. The policy has helped bolster banking system resilience by reducing the share of high-LVR loans. LVR restrictions were intended to be temporary and the Reserve Bank has previously stated that it expects to relax them once the financial stability risks from banks’ housing exposures have reduced. In reaching that judgement, several criteria need to be satisfied:
• Evidence that house price and credit growth have fallen to around the rate of household income growth.
• A low risk of housing market resurgence once LVR restrictions are eased.
• Confidence that an easing in policy will not undermine the resilience of the financial system.
As noted above, the housing market has slowed substantially since mid-2016. With a range of housing market policies announced by the Government, and banks maintaining tight lending standards, it is unlikely that an easing of the LVR policy would result in a material resurgence in the housing market. Credit growth to the household sector is easing, although still slightly exceeds household income growth. The LVR policy has substantially improved the resilience of bank balance sheets, and this resilience is expected to be retained (see box A). Overall, the financial stability risks associated with the housing market are moderating.
In light of these developments, the Reserve Bank is adjusting the LVR restrictions. From 1 January 2018, the LVR restrictions will require that:
• No more than 15 percent (currently 10 percent) of each bank’s new mortgage lending to owner occupiers can be at LVRs of more than 80 percent.
• No more than 5 percent of each bank’s new mortgage lending to residential property investors can be at LVRs of more than 65 percent (currently 60 percent).
The adjustment to the restrictions will enable banks to originate a higher proportion of owner-occupier loans at LVRs above 80 percent, whilst still providing restraint relative to the earlier high (40 percent) proportion of owner-occupier loans that were being originated at LVRs above the 80 percent threshold in 2013. In the case of investor loans, the Reserve Bank regards the increase in the maximum LVR from 60 percent to 65 percent as only a moderate relaxation of the borrowing constraint. The Reserve Bank estimates that around half of investor loans were being originated at LVRs above 70 percent immediately prior to the introduction of the LVR restrictions in 2013.
LVR restrictions will be adjusted gradually over time, provided that financial stability risks remain contained. Gradual adjustment to policy will reduce the risk of resurgence in the housing market and a deterioration in lending standards.

5RESERVE BANK OF NEW ZEALAND / FINANCIAL STABILITY REPORT, NOVEMBER 2017
Developments in financial sector regulation
The Reserve Bank is reviewing the capital adequacy framework for banks. Two consultation papers have been released on the scope of the review and the definition of capital, and a third paper on the measurement and aggregation of bank risk will be released shortly. The Reserve Bank has completed a review of the bank directors’ attestation regime, and has recently confirmed its decision to publish a dashboard to enhance reporting of quarterly bank disclosures. The Reserve Bank has also completed its consultation on the possible inclusion of serviceability restrictions such as debt-to-income limits in the macro-prudential toolkit, and expects this to be discussed as part of a wider review of macro-prudential policy in 2018.
Grant Spencer
Governor

6RESERVE BANK OF NEW ZEALAND / FINANCIAL STABILITY REPORT, NOVEMBER 2017
Box A
Impact of LVR restrictions on mortgage portfolio resilience
The loan-to-value ratio (LVR) policy was first introduced in October 2013, with progressively tighter restrictions for investors introduced in November 2015 and October 2016. The primary goal of the LVR policy is to improve the resilience of the financial system to a significant housing market correction, given the Reserve Bank’s view that risks in this sector have been elevated.
There are a number of ways in which the LVR policy has improved the resilience of the financial system. This box focusses on how, by improving equity buffers of borrowers, the LVR policy reduces the likelihood that mortgage borrowers will default and reduces the magnitude of losses that banks would sustain in the event of default.
Prior to the policy being introduced, the share of banks’ mortgage portfolios with LVRs above 80 percent had steadily increased to 21 percent, posing a risk to financial stability. This reflected that around a third of new loans being originated had LVRs above 80 percent.1 As a result of the LVR policy, the share of outstanding mortgages with LVRs above 80 percent steadily declined to under 8 percent in September 2017 (figure A1). Tighter LVR rules applied to property investor lending have seen the share of outstanding mortgages at LVRs between 70 and 80 percent decline since late 2015.
1 Counterfactual modelling suggests that the share of outstanding mortgages at LVRs above 80 percent would have increased slightly had the share of new loans at LVRs above 80 percent remained at a third.
0
5
10
15
20
25
30
35
0
5
10
15
20
25
30
35
Sep-13 Sep-14 Sep-15 Sep-16 Sep-17
% %
70-80%>80%
Figure A1 Share of outstanding mortgages by LVR
Source: RBNZ.
Note: Vertical lines denote the dates of LVR policy changes.
If there was a major housing market correction or economic downturn, then this reduction in the share of lending at high LVRs is likely to mean that fewer housing loans would default, and overall bank losses would be lower. One way of quantifying this is to use data from recent stress tests to estimate how the change in banks’ portfolios would affect default and loss rates for a given downturn scenario. Based on the 2017 stress test scenario (see box B), we estimate that banks would experience around 10 percent lower default rates and around 20 percent lower credit loss rates than they would have if LVR restrictions had not been applied (figure A2).

7RESERVE BANK OF NEW ZEALAND / FINANCIAL STABILITY REPORT, NOVEMBER 2017
Aside from this direct impact on banking system resilience, there are two other key channels through which the LVR policy is likely to have improved bank resilience. First, the LVR policy has reduced demand in the housing market, which has been a contributing factor in slowing house price growth. This has left the housing market less exposed to a sharp correction in prices. Second, the improvement in households’ equity buffers means that fewer households will need to sell their house or cut back on consumption to meet debt obligations during a downturn. This limits the risk of significant feedback effects that could cause further deterioration in the housing market and broader economy – ultimately lessening the risk of severe credit losses for banks.
It is difficult to quantify exactly how large these indirect effects are. However, results from the recent bank stress tests suggest that credit loss rates on mortgage portfolios are highly sensitive to the magnitude of house price declines. For example, banks estimate that credit losses
0
2
4
6
8
10
12
0
0.5
1.0
1.5
2.0
2.5
3.0
2013Q3 2017Q3 2013Q3 2017Q3
Loss rates Default rates
% % Figure A2Estimated loss rates and default rates (based on 2017 stress test scenario)
Source: RBNZ.
would rise by around a quarter if house prices declined by an additional 5 percent (from the scenario baseline of a 35 percent fall in house prices) – suggesting that these indirect effects of the LVR policy could potentially be large.
As noted in chapter 1, a prerequisite for easing LVR restrictions is that it would not undermine the resilience of the financial system. Our assessment is that the current restrictions are continuing to reduce the share of mortgages at high LVRs. The easing of the policy from 1 January will allow a slightly larger flow of high-LVR loans to be granted. Nevertheless, the share of bank portfolios with LVRs above 70 percent is still expected to trend down slightly, as the new policy settings will remain relatively restrictive compared to pre-LVR lending flows. In addition, if housing pressures continue to moderate, this will reduce the risk of a significant house price correction. As a result, the resilience of bank mortgage portfolios is not expected to diminish as a result of the announced policy easing.

8RESERVE BANK OF NEW ZEALAND / FINANCIAL STABILITY REPORT, NOVEMBER 2017
Housing market vulnerabilities
House price growth has slowed significantly over the past year.
National house price growth slowed to 2.6 percent in the year to October 2017 from 14.5 percent a year earlier, and sales volumes have declined by 17 percent over the year. The decline in house price inflation and transaction volumes has been especially noticeable in regions where housing market activity had previously been strong. In Auckland, house prices have declined by 1.4 percent over the past year and sales volumes have fallen by around 22 percent (figure 2.1). Lower house price inflation has contributed to a slowing in housing credit growth from an annual rate of 9 percent in January 2017 to 6.6 percent in September (figure 2.2). If sustained, slower house price growth should lead to a continued moderation in household credit growth and reduce the potential for a significant house price correction.
Conditions in the New Zealand economy and financial system remain supportive of financial stability. Near-term risks facing the financial system have eased. However, vulnerabilities remain, particularly in the household and dairy sectors.
House price growth has slowed notably over the past year, reflecting a combination of factors. Household credit growth has also moderated. This is partly due to a tightening in banks’ lending standards, which will support the quality of their new mortgage lending and the resilience of their housing portfolios. Nevertheless, house prices remain high relative to incomes and rents, and many households are highly indebted, leaving them vulnerable to an increase in interest rates or a decline in incomes.
Higher dairy prices have improved profitability in the dairy sector. As a result, the performance of banks’ dairy lending portfolios has improved and dairy credit growth has slowed. However, with farms having further increased leverage during the recent downturn, it will take a number of seasons of debt repayment before debt is reduced to more sustainable levels. In the meantime, the dairy sector remains vulnerable to another period of low dairy prices or an increase in interest rates.
Chapter 2Domestic risks to New Zealand’s financial system

9RESERVE BANK OF NEW ZEALAND / FINANCIAL STABILITY REPORT, NOVEMBER 2017
A range of factors has contributed to the slowdown in the housing market…
The tightening in the Reserve Bank’s loan-to-value ratio (LVR) policy in October 2016 appears to have had a more significant impact on housing market activity and house prices than previous LVR policy changes. This has contributed to a slowdown in the growth of investor housing lending to an annualised rate of around 3 percent over the first nine months of 2017. The investor share of new housing loans has also declined, from 45 percent in mid-2016 to 34 percent in September 2017.
An increase in mortgage rates in early 2017 is also likely to have contributed to lower demand for housing credit, and uncertainty about the outcome of the general election in September may have caused some potential buyers to delay purchases. Reduced demand from foreign buyers may have also tempered demand.
…including a tightening in banks’ lending standards.
Banks have tightened lending standards, reducing the borrowing capacity of households. Typically, banks are using higher interest rates when assessing the ability of borrowers to service a new mortgage and their existing debt, restricting the use of foreign income in serviceability assessments, placing stricter requirements on interest-only lending, and ensuring that living expenses assumed in a loan assessment are reasonable given the borrower’s income. These changes have improved the quality of banks’ new mortgage lending over the past year, with a smaller proportion of lending provided on interest-only terms, and to new borrowers with high LVRs and high debt-to-income ratios.
The overall impact of the tightening in banks’ lending standards is illustrated by the Reserve Bank’s recent hypothetical borrower exercise,
-30
-20
-10
0
10
20
30
40
50
-30
-20
-10
0
10
20
30
40
50
2010 2011 2012 2013 2014 2015 2016 2017
% % Auckland, prices Auckland, salesRest of NZ, prices Rest of NZ, sales
Figure 2.1House prices and sales in Auckland and the rest of New Zealand(annual % change)
Source: Real Estate Institute of New Zealand (REINZ).
Note: Vertical lines denote the dates of LVR policy changes.
0
2
4
6
8
10
12
14
16
0
2
4
6
8
10
12
14
16
2007 2009 2011 2013 2015 2017
% % Figure 2.2Annual housing credit growth
Source: RBNZ Bank Balance Sheet (BBS).

10RESERVE BANK OF NEW ZEALAND / FINANCIAL STABILITY REPORT, NOVEMBER 2017
which asked banks to calculate the maximum amount that they would lend to a range of hypothetical borrowers. This repeated an exercise that was conducted in 2014. The 2017 results suggest that maximum borrowing amounts have declined by around 5-10 percent since 2014 (figure 2.3). These results are consistent with recent Reserve Bank Credit Conditions Surveys, where more than three-quarters of banks reported that household credit conditions are tighter now than in the previous three years (figure 2.4).
Housing market conditions are likely to remain soft for some time.
While some factors continue to drive housing market pressures – high net migration, low mortgage rates and a housing supply shortfall – on balance, house price inflation is expected to remain modest in the near term.
Some banks expect to tighten standards further in the next six months. This should continue to temper housing credit growth and support the resilience of household balance sheets. Mortgage interest rates in New Zealand may also increase as monetary policy stimulus is gradually removed overseas (see chapter 3), and banks may look to continue to rebuild their net interest margins following a period of strong competition for deposits (see chapter 4). This would further weigh on housing credit demand.
0
0.2
0.4
0.6
0.8
1.0
1.2
0
0.2
0.4
0.6
0.8
1.0
1.2
Investor Owner occupier
$m $m 2014 2017Figure 2.3Maximum borrowing amount by buyer type(weighted average across the five largest banks)
Source: RBNZ.
Note: Both buyer types are couples with a combined gross salary income of $120,000 and declared monthly expenses of $1,333. The investors are assumed to have a potential rental income of $27,000.
0
20
40
60
80
100
0
20
40
60
80
100
Sep-12 Sep-13 Sep-14 Sep-15 Sep-16 Sep-17
% %
Significantly easier Somewhat easierAbout normal Somewhat tighterSignificantly tighter
Figure 2.4Retail credit conditions relative to the previous three years(% of respondents)
Source: RBNZ Credit Conditions Survey.
Note: Individual bank responses are weighted by market share.

11RESERVE BANK OF NEW ZEALAND / FINANCIAL STABILITY REPORT, NOVEMBER 2017
The housing policies of the Government could also have a moderating impact on the housing market. While the precise nature of the policies and the timing of their implementation are uncertain, they are likely to reduce housing demand and increase housing supply. The Government’s KiwiBuild programme will ramp up gradually, with 100,000 affordable homes planned to be built in the next decade. The Government has also announced its intention to restrict non-residents – other than New Zealanders and Australians – from purchasing existing houses, to extend the bright-line test for the assessment of capital gains tax from two to five years, and to not allow property investors to use tax losses on rental properties to offset tax on other income.
While some of these policies may take time to be implemented, they are likely to reduce house price inflation expectations and weaken demand for housing, particularly from investors seeking capital gains. Surveys show a recent decline in the expected rate of house price inflation over the next year and a fall in the share of respondents who expect house prices to rise in the next year.
Highly indebted households remain vulnerable to negative shocks.
The tightening of lending standards and slowing in housing credit growth have improved the resilience of the banking system to stress in the household sector. However, the growth and concentration of household debt leaves many households, and therefore banks, vulnerable to an increase in interest rates or a decline in household income.
Rapid increases in debt have often preceded past economic downturns and financial crises internationally, particularly when debt has been concentrated among borrowers who could not meet debt payments in more difficult financial conditions. In New Zealand, household debt has
risen from 146 percent of disposable income to 168 percent over the past five years (figure 2.5). This debt appears to have become more concentrated. The Reserve Bank estimates that the average debt-to-disposable income ratio of households with mortgages is currently around 325 percent, up from 280 percent in 2012. It is estimated that only 8 percent of households currently own investment properties but these households account for around 40 percent of housing debt. While only a small proportion of household lending is currently non-performing (see chapter 4), high debt levels imply that some borrowers are likely to have difficulty servicing their debts if interest rates rise or incomes decline.
Despite the sharp slowdown in house price inflation over the past year, the level of house prices remains particularly stretched relative to incomes and rents in Auckland and some surrounding cities (figure 2.6). If a disorderly house price correction were to occur, this could weaken household resilience by reducing households’ ability to absorb shocks by borrowing against the value of their house or selling their home. It could
0
50
100
150
200
250
300
350
0
50
100
150
200
250
300
350
2002 2005 2008 2011 2014 2017
% % All householdsHouseholds with mortgages
Figure 2.5Household debt (% of disposable income)
Sources: Stats NZ, RBNZ BBS, RBNZ Standard Statistical Return (SSR), RBNZ calculations.

12RESERVE BANK OF NEW ZEALAND / FINANCIAL STABILITY REPORT, NOVEMBER 2017
also amplify an economic downturn if households respond to the fall in wealth by reducing their consumption.
Dairy sector indebtedness
Higher dairy prices have supported profitability in the dairy sector over the past year…
Higher dairy prices have continued to support farm incomes after prices recovered in late 2016. Fonterra has confirmed a final payout of $6.12 per kilogram of milk solids (kgMS), excluding dividends, for the 2016-17 season. This is a marked improvement on its opening forecast of $4.25. Although dairy prices have eased recently, the price of whole milk powder is still around 35 percent higher than in mid-2016 and butter prices have almost doubled (figure 2.7). Combined, these two products account for 60 percent of the value of New Zealand’s dairy exports.
The recovery in dairy prices followed a reduction in global milk production in 2016. Strong global demand for dairy products has also helped to support prices, particularly for whole milk powder and butter. In contrast, prices for skim milk powder have remained low, partly due to the high volume of inventories in Europe. Although skim milk powder prices are low, high prices for butter and other dairy fat products have meant that European producers have not heavily substituted towards whole milk powder production. Global dairy production is now starting to increase again as farmgate milk prices have picked up and EU incentives to reduce production have ended. This has placed some downward pressure on prices in recent months.
…and non-performing loans have declined.
In late September, Fonterra forecast a further increase in the 2017-18 season payout to $6.75 per kgMS. However, lower prices at recent dairy auctions suggest downside risk to Fonterra’s forecast. Although some farms may still face cash flow losses, most are expected to be profitable in the 2017-18 season. As a result, the performance of banks’ dairy loan
20
40
60
80
100
120
140
160
20
40
60
80
100
120
140
160
2013 2014 2015 2016 2017
Index Index Skim milk powderWhole milk powderButter
Figure 2.7 Global dairy prices (January 2014 = 100, USD)
Source: GlobalDairyTrade.
0
10
20
30
40
50
0
2
4
6
8
10
12
2003 2005 2007 2009 2011 2013 2015 2017
Ratio Ratio Auckland, price to incomeRest of NZ, price to incomeAuckland, price to rent (RHS)Rest of NZ, price to rent (RHS)
Figure 2.6House prices in Auckland and rest of New Zealand(ratio to annual household income and rents)
Sources: REINZ, Ministry of Business, Innovation and Employment, RBNZ calculations.

13RESERVE BANK OF NEW ZEALAND / FINANCIAL STABILITY REPORT, NOVEMBER 2017
portfolios has improved. Banks are reporting fewer loans that need to be closely monitored and have started to reduce their provisions against losses on their dairy loans (figure 2.8). Non-performing loans (NPLs) have fallen by $100 million since May and the share of banks’ dairy loans that are non-performing is now 1.6 percent, down from 1.9 percent at the end of 2016.
The recent peak in NPLs is much lower than the peak that followed the sharp decline in dairy prices in 2008. Although farm incomes fell by more in 2015-16 than in 2008-09, several factors have helped to limit stress in the sector more recently. The 2008-09 downturn followed a number of years of rapid credit growth to the dairy sector to fund investment and a shift towards more intensive and costly production models. Between 2005 and 2008, debt in the dairy sector almost doubled. In contrast, the recent downturn came after a period in which debt had been increasing by less than incomes. Farm costs were also lower at the outset, and farms subsequently reduced costs further (figure 2.9).
A resilient market for dairy land has also helped. Farm prices and sales activity fell by less and have recovered more quickly than in the previous downturn, when the broader effects of the global financial crisis were being felt (figure 2.10). The smaller decline in farm prices in 2015-16 left farms in a better position to borrow against their farms to manage their cash flows. Banks provided working capital loans to farms that were expected to be viable in the long term, and foreclosures were modest.
0
10
20
30
40
50
0
1
2
3
4
5
2009 2011 2013 2015 2017
% % Collective provisionsSpecific provisionsNon-performing loansClosely monitored loans (RHS)
Figure 2.8 Dairy lending asset quality(% of dairy lending)
Sources: Private reporting, RBNZ BBS.
Note: The closely monitored series is an indicator of the share of loans in special monitoring arrangements or in other early warning categories. This series is available from December 2016.
0
2
4
6
8
10
12
0
2
4
6
8
10
12
2000 2004 2008 2012 2016
$ $ Other expensesInterest and rent expenseFarm working expensesMilk and other income
Figure 2.9 Farm income and expenses($ per kgMS)
Sources: DairyNZ, RBNZ estimates.
Note: Income and expenses are inflation adjusted and expressed in June 2017 prices. Data for the 2017-18 season are forecasts.

14RESERVE BANK OF NEW ZEALAND / FINANCIAL STABILITY REPORT, NOVEMBER 2017
High debt levels leave the dairy sector vulnerable to future shocks…
During the recent downturn, bank lending to the dairy sector increased by $5 billion or 15 percent, mainly for working capital purposes. Farms also borrowed almost $400 million through Fonterra Co-operative Support Loans. With leverage in the dairy sector already high, this growth in debt has left the sector more vulnerable to another period of low dairy prices or an increase in interest rates. Within banks’ agriculture portfolios, lending to the dairy sector poses the greatest risk to financial stability as it accounts for 10 percent of total bank lending. The next largest agriculture sector, sheep and beef, accounts for just 3 percent of total lending (figure 2.11).
The dairy sector is also more indebted relative to its income and assets than other agriculture sectors. Debt in the dairy sector is estimated to be more than three times income, compared to a debt-to-income ratio of around two for the sheep and beef sector. Lending to the dairy sector also tends to be at higher LVRs, meaning banks and farms would be at greater risk if farm prices fell. Relatively high prices for sheep and beef products in recent years have helped to maintain the resilience of this sector.
…but recent developments are encouraging.
There are signs that some dairy farms are starting to use higher incomes to reduce their level of indebtedness. Bank lending to the dairy sector grew by just 0.6 percent in the year to September 2017 (figure 2.12). In addition, the share of dairy lending on interest-only terms has decreased since late 2016, as banks and farms have increasingly focused on reducing debt. These developments are encouraging. Farms are likely
0
100
200
300
400
500
600
700
40
60
80
100
120
140
160
2007 2009 2011 2013 2015 2017
Number Index Price indexAnnual sales (RHS)
Figure 2.10 Dairy land prices and sales
Source: REINZ.
Note: The land price index is a three-month moving average and has a base of 100 in January 2007.
$249.3bn
$101.6bn
$11.3bn
$41.1bn
$13.7bn
$5.5bn
Housing and consumer Other businessOther DairySheep and beef Other agriculture
Figure 2.11 Composition of bank lending by sector(as at September 2017)
Sources: RBNZ Annual Agriculture Survey, RBNZ BBS.
Note: Total bank lending was $423 billion as at September 2017.

15RESERVE BANK OF NEW ZEALAND / FINANCIAL STABILITY REPORT, NOVEMBER 2017
lending. Historically, the commercial property sector has been a major source of credit losses both internationally and in New Zealand, and for this reason the Reserve Bank is monitoring developments in the sector. Risks appear to be relatively well contained for now, and a recent slowing in credit and price growth has led to a reduction in risk over the past six months.
Commercial property prices have increased strongly…
In recent years, New Zealand commercial property prices have increased at a faster rate than in many other countries. The strength of the New Zealand economy has increased owner-occupier and investor demand for commercial property, supporting capital growth. Despite price growth outpacing rental inflation, rental yields still appear attractive relative to other markets (figure 2.13). Nevertheless, investor appetite for commercial property assets in New Zealand may decline as the global outlook improves and interest rates begin to normalise.
to reduce debt if current levels of dairy prices are maintained, but some farms also need to catch up on deferred maintenance and capital expenditure which will slow the repayment of debt.
Banks are diversifying their agricultural lending into other sectors. Lending to non-dairy agriculture increased by 8 percent over the year to September, reflecting strong growth in lending to the sheep, beef and horticulture sectors. Diversification may improve the overall risk profile of banks’ agriculture lending portfolios.
Commercial property sector
Commercial property prices have increased strongly over the past three years. Credit growth to the sector has been relatively strong and commercial property lending now accounts for 8 percent of total bank
-10
-5
0
5
10
15
20
25
30
-10
-5
0
5
10
15
20
25
30
2005 2007 2009 2011 2013 2015 2017
% % DairyOther agriculture
Figure 2.12 Annual bank lending growth to the agriculture sector
Sources: RBNZ Annual Agriculture Survey, private reporting, RBNZ BBS.
Note: The dashed lines are annual data and the solid lines are monthly data.
Hong
Kon
gTo
kyo
Paris
Fran
kfur
tSi
ngap
ore
Lond
onSt
ockh
olm
New
York
Mad
ridM
ilan
San
Fran
cisco
Bost
onLo
s An
gele
sTo
ront
oSe
oul
Brus
sels
Was
hing
ton
DCSy
dney
Chica
goSh
angh
aiBe
ijing
New
Zeal
and
Duba
iM
exico
City
Sao
Paul
oM
umba
iM
osco
w
0
2
4
6
8
10
12
0
2
4
6
8
10
12 % % Figure 2.13 Global prime office commercial property yields(as at September quarter 2017)
Source: Jones Lang LaSalle (JLL).
16RESERVE BANK OF NEW ZEALAND / FINANCIAL STABILITY REPORT, NOVEMBER 2017
Favourable market conditions and prudent lending standards have supported the quality of banks’ commercial property lending. Banks continue to report low levels of NPLs, at just 0.6 percent of total commercial property lending. While recent market conditions have been supportive, indicators suggest the market is slowing.
…but growth has slowed recently.
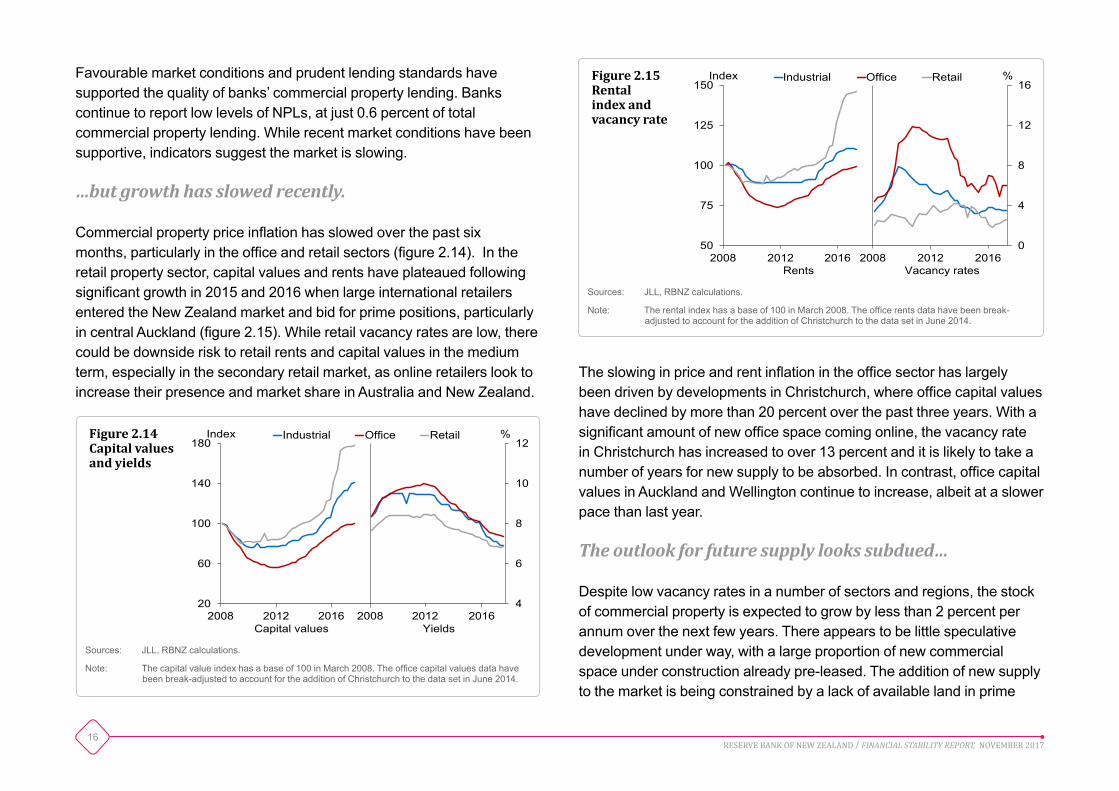
Commercial property price inflation has slowed over the past six months, particularly in the office and retail sectors (figure 2.14). In the retail property sector, capital values and rents have plateaued following significant growth in 2015 and 2016 when large international retailers entered the New Zealand market and bid for prime positions, particularly in central Auckland (figure 2.15). While retail vacancy rates are low, there could be downside risk to retail rents and capital values in the medium term, especially in the secondary retail market, as online retailers look to increase their presence and market share in Australia and New Zealand.
The slowing in price and rent inflation in the office sector has largely been driven by developments in Christchurch, where office capital values have declined by more than 20 percent over the past three years. With a significant amount of new office space coming online, the vacancy rate in Christchurch has increased to over 13 percent and it is likely to take a number of years for new supply to be absorbed. In contrast, office capital values in Auckland and Wellington continue to increase, albeit at a slower pace than last year.
The outlook for future supply looks subdued…
Despite low vacancy rates in a number of sectors and regions, the stock of commercial property is expected to grow by less than 2 percent per annum over the next few years. There appears to be little speculative development under way, with a large proportion of new commercial space under construction already pre-leased. The addition of new supply to the market is being constrained by a lack of available land in prime
4
6
8
10
12
20
60
100
140
180% Index Industrial Office Retail
2008 2012 2016 2008 2012 2016 Capital values Yields
Figure 2.14Capital values and yields
Sources: JLL, RBNZ calculations.
Note: The capital value index has a base of 100 in March 2008. The office capital values data have been break-adjusted to account for the addition of Christchurch to the data set in June 2014.
0
4
8
12
16
50
75
100
125
150
2008Q1
% Index Industrial Office Retail
2008 2012 2016 2008 2012 2016 Rents Vacancy rates
Figure 2.15Rental index and vacancy rate
Sources: JLL, RBNZ calculations.
Note: The rental index has a base of 100 in March 2008. The office rents data have been break-adjusted to account for the addition of Christchurch to the data set in June 2014.

17RESERVE BANK OF NEW ZEALAND / FINANCIAL STABILITY REPORT, NOVEMBER 2017
areas, capacity pressure in the construction industry, high construction cost inflation, and tight access to development finance.
…partly due to the limited availability of financing.
Some banks have reduced their willingness to lend to the commercial and residential property development sectors. Lending criteria have been tightened by increasing presale requirements, requiring higher borrower equity, and increasing scrutiny around the quality of construction companies and the timeline of projects. Typically, lending standards are tighter for new customers, with some banks preferring to deal with existing clients who have strong balance sheets. Overall, annual commercial property credit growth (including residential development) slowed to 7 percent in September, down from 12 percent in April (figure 2.16).
The major banks’ lending to the property development sector has declined slightly since the start of the year. According to the Reserve Bank’s Credit Conditions Survey, they expect to further tighten lending standards for commercial property in the next six months. This tightening in lending standards appears to be a prudent response to heightened risks in the property development sector. Some recently registered banks have become more active in providing development finance.
-10
-5
0
5
10
15
-10
-5
0
5
10
15
2010 2011 2012 2013 2014 2015 2016 2017
% % Figure 2.16Commercial property annual credit growth
Sources: Private reporting, RBNZ BBS.

18RESERVE BANK OF NEW ZEALAND / FINANCIAL STABILITY REPORT, NOVEMBER 2017
Chapter 3International risks to New Zealand’s financial system
As a small open economy with a persistent current account deficit, New Zealand is exposed to international developments and risks. New Zealand’s net external liability position has declined notably since 2009 and is currently at its lowest level as a share of GDP since the late 1980s, leaving the economy less vulnerable to external shocks. But given the country’s structural funding gap, New Zealand banks still source around a quarter of their funding from abroad. This exposes them to disruptions in international financial markets that can affect the availability and cost of funding.
Momentum in the global economy has continued to build over the past six months, reducing near-term risks to financial stability both domestically and abroad. However, current global macro-financial conditions continue to present a risk to financial stability. The combination of high asset valuations and elevated debt levels leave the global financial system vulnerable to negative shocks and an accompanying repricing of risk. Key international risks that could have implications for New Zealand include: unintended consequences associated with an unwinding of unconventional monetary policies; a disruptive adjustment in China’s financial system following a decade of rapid credit growth; and high household indebtedness in Australia.
International exposures
New Zealand is exposed to international developments...
As a small open economy, New Zealand is exposed to international developments and risks. Around a quarter of New Zealand’s production is exported, and the prices of these exports are determined by global supply and demand factors. As the recent dairy downturn illustrated, international developments can significantly impact the profitability of New Zealand exporters and pose risks to domestic financial stability (see chapter 2).
New Zealand is also exposed to the willingness of foreigners to lend to domestic residents and invest in New Zealand assets. New Zealand is a net borrower from overseas and the current account has been in deficit for the past 40 years. New Zealand’s net external liabilities currently account for just under 60 percent of GDP, and around 70 percent of this net position is intermediated by the banking sector (figure 3.1). While still high by international standards, New Zealand’s net external liability
19RESERVE BANK OF NEW ZEALAND / FINANCIAL STABILITY REPORT, NOVEMBER 2017
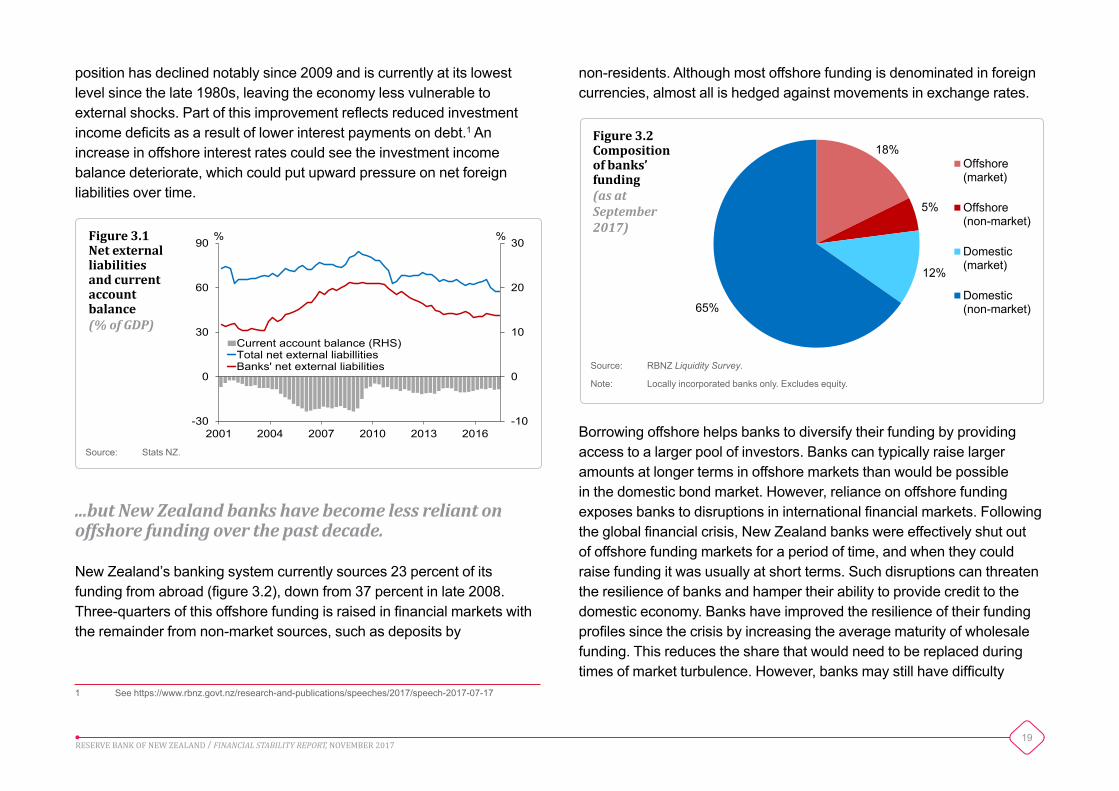
position has declined notably since 2009 and is currently at its lowest level since the late 1980s, leaving the economy less vulnerable to external shocks. Part of this improvement reflects reduced investment income deficits as a result of lower interest payments on debt.1 An increase in offshore interest rates could see the investment income balance deteriorate, which could put upward pressure on net foreign liabilities over time.
...but New Zealand banks have become less reliant on offshore funding over the past decade.
New Zealand’s banking system currently sources 23 percent of its funding from abroad (figure 3.2), down from 37 percent in late 2008. Three-quarters of this offshore funding is raised in financial markets with the remainder from non-market sources, such as deposits by
1 See https://www.rbnz.govt.nz/research-and-publications/speeches/2017/speech-2017-07-17
-10
0
10
20
30
-30
0
30
60
90
2001 2004 2007 2010 2013 2016
% %
Current account balance (RHS)Total net external liabillitiesBanks' net external liabilities
Figure 3.1 Net external liabilities and current account balance (% of GDP)
Source: Stats NZ.
18%
5%
12%
65%
Offshore(market)
Offshore(non-market)
Domestic(market)
Domestic(non-market)
Figure 3.2 Composition of banks’ funding (as at September 2017)
Source: RBNZ Liquidity Survey.
Note: Locally incorporated banks only. Excludes equity.
non-residents. Although most offshore funding is denominated in foreign currencies, almost all is hedged against movements in exchange rates.
Borrowing offshore helps banks to diversify their funding by providing access to a larger pool of investors. Banks can typically raise larger amounts at longer terms in offshore markets than would be possible in the domestic bond market. However, reliance on offshore funding exposes banks to disruptions in international financial markets. Following the global financial crisis, New Zealand banks were effectively shut out of offshore funding markets for a period of time, and when they could raise funding it was usually at short terms. Such disruptions can threaten the resilience of banks and hamper their ability to provide credit to the domestic economy. Banks have improved the resilience of their funding profiles since the crisis by increasing the average maturity of wholesale funding. This reduces the share that would need to be replaced during times of market turbulence. However, banks may still have difficulty

20RESERVE BANK OF NEW ZEALAND / FINANCIAL STABILITY REPORT, NOVEMBER 2017
-2
0
2
4
6
8
-2
0
2
4
6
8
2006 2008 2010 2012 2014 2016
% % New ZealandAustraliaUnited StatesUnited KingdomGermanyJapan
Figure 3.3 10-year government bond rates
Source: Bloomberg.
0
50
100
150
200
250
300
0
6
12
18
24
30
36
2011 2012 2013 2014 2015 2016 2017
bps Index
Uncertainty indicator (VIX)Offshore term funding costs (RHS)
Figure 3.4 Market uncertainty and offshore funding costs (three-month moving average)
Sources: Bloomberg, RBNZ Liquidity Survey.
Note: The offshore term funding costs series is a simple average of the landed cost of new issues at terms between four and seven years by the largest four banks, relative to NZD swap. The VIX index is an indicator of the market’s expectation of the 30-day volatility in the S&P 500 equity index.
rolling over funding if markets were disrupted – around 40 percent of banks’ existing market funding matures within the next year.
Global developments can also directly affect New Zealand interest rates and asset prices.
New Zealand’s open capital account also means that domestic long-term interest rates tend to move with global long-term interest rates (figure 3.3). As a result, international macroeconomic conditions have a bearing on borrowing costs in New Zealand.
costs can flow on to higher borrowing costs or reduced profitability of the banking system.
Many other factors expose the economy and financial system to international developments. Foreigners invest directly in New Zealand’s financial and real estate markets and a sudden withdrawal of foreign capital from those markets could impact the domestic economy.2 In addition, the insurance sector relies heavily on reinsurance from abroad, which exposes the sector to a repricing of reinsurance or a loss of access to reinsurance markets (see chapter 4).
2 For example, since 2014, more than a third of commercial property transactions over $5 million involved foreign buyers.
Changes in global risk appetite and investors’ perceptions of the strength of New Zealand’s banks also affect the financial system. The interest rates that banks pay on their funding tend to increase during times of higher uncertainty (figure 3.4). The outlook for the Australian economy is also important because New Zealand’s four largest banks receive higher credit ratings due to the implicit support provided by their Australian parent banks. Deterioration in the strength of the parent banks could increase the New Zealand subsidiaries’ funding costs. Increased funding
21RESERVE BANK OF NEW ZEALAND / FINANCIAL STABILITY REPORT, NOVEMBER 2017
-2
0
2
4
6
8
10
-2
0
2
4
6
8
10
2006 2008 2010 2012 2014 2016
% % New ZealandAustraliaUnited StatesUnited KingdomEuro areaJapan
Figure 3.5 Central bank policy rates
Source: Thomson Reuters.
International risks
Global economic growth continues to improve…
Given the multifaceted linkages between New Zealand and the international macro-financial environment, it is important to consider how risks are evolving in the global economy and financial system. Over the past six months, growth momentum in the global economy has continued to build, reducing near-term risks to financial stability both domestically and abroad. Alongside this, the outlook for global bank profitability has improved.
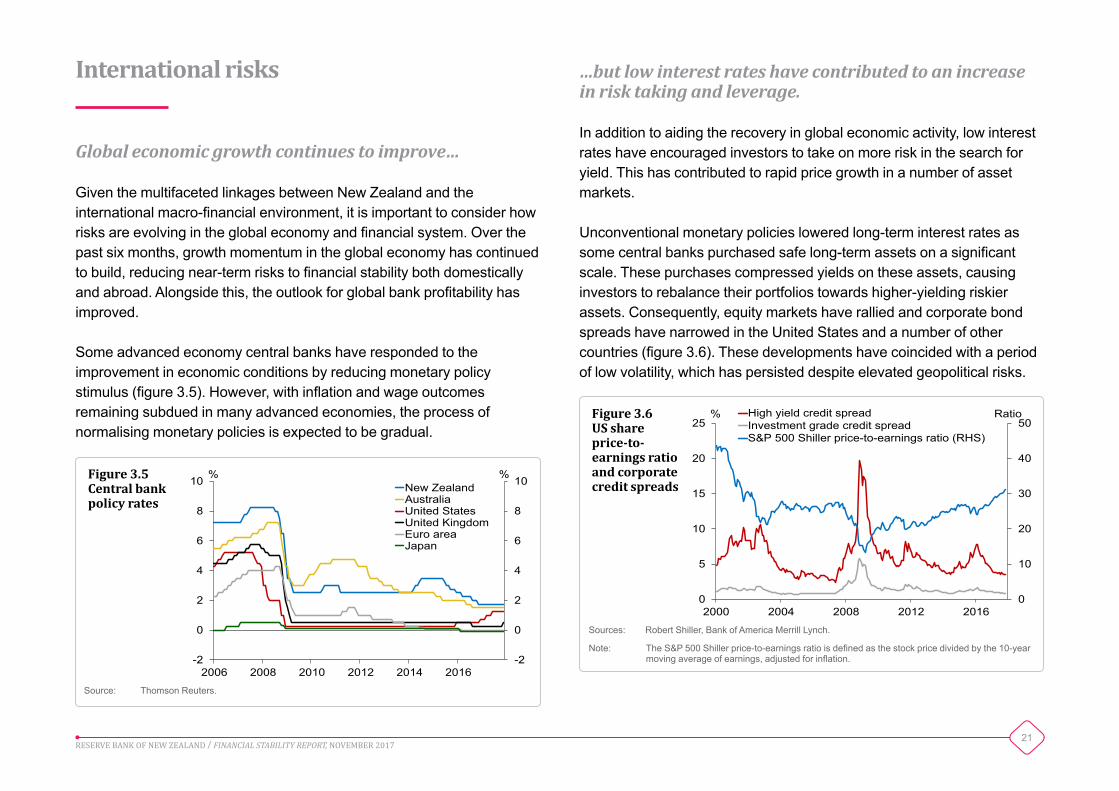
Some advanced economy central banks have responded to the improvement in economic conditions by reducing monetary policy stimulus (figure 3.5). However, with inflation and wage outcomes remaining subdued in many advanced economies, the process of normalising monetary policies is expected to be gradual.
…but low interest rates have contributed to an increase in risk taking and leverage.
In addition to aiding the recovery in global economic activity, low interest rates have encouraged investors to take on more risk in the search for yield. This has contributed to rapid price growth in a number of asset markets.
Unconventional monetary policies lowered long-term interest rates as some central banks purchased safe long-term assets on a significant scale. These purchases compressed yields on these assets, causing investors to rebalance their portfolios towards higher-yielding riskier assets. Consequently, equity markets have rallied and corporate bond spreads have narrowed in the United States and a number of other countries (figure 3.6). These developments have coincided with a period of low volatility, which has persisted despite elevated geopolitical risks.
0
10
20
30
40
50
0
5
10
15
20
25
2000 2004 2008 2012 2016
Ratio % High yield credit spreadInvestment grade credit spreadS&P 500 Shiller price-to-earnings ratio (RHS)
Figure 3.6US share price-to-earnings ratio and corporate credit spreads
Sources: Robert Shiller, Bank of America Merrill Lynch.
Note: The S&P 500 Shiller price-to-earnings ratio is defined as the stock price divided by the 10-year moving average of earnings, adjusted for inflation.
22RESERVE BANK OF NEW ZEALAND / FINANCIAL STABILITY REPORT, NOVEMBER 2017
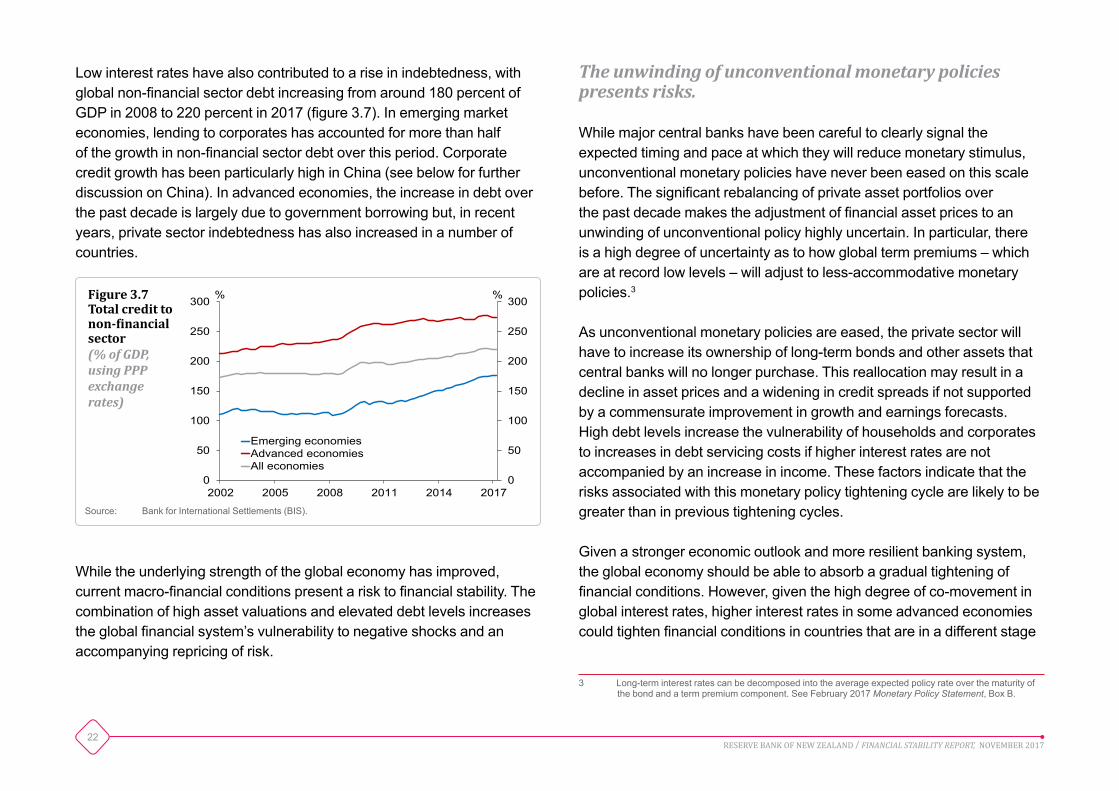
Low interest rates have also contributed to a rise in indebtedness, with global non-financial sector debt increasing from around 180 percent of GDP in 2008 to 220 percent in 2017 (figure 3.7). In emerging market economies, lending to corporates has accounted for more than half of the growth in non-financial sector debt over this period. Corporate credit growth has been particularly high in China (see below for further discussion on China). In advanced economies, the increase in debt over the past decade is largely due to government borrowing but, in recent years, private sector indebtedness has also increased in a number of countries.
0
50
100
150
200
250
300
0
50
100
150
200
250
300
2002 2005 2008 2011 2014 2017
% %
Emerging economiesAdvanced economiesAll economies
Figure 3.7Total credit to non-financial sector(% of GDP, using PPP exchange rates)
Source: Bank for International Settlements (BIS).
The unwinding of unconventional monetary policies presents risks.
While major central banks have been careful to clearly signal the expected timing and pace at which they will reduce monetary stimulus, unconventional monetary policies have never been eased on this scale before. The significant rebalancing of private asset portfolios over the past decade makes the adjustment of financial asset prices to an unwinding of unconventional policy highly uncertain. In particular, there is a high degree of uncertainty as to how global term premiums – which are at record low levels – will adjust to less-accommodative monetary policies.3
As unconventional monetary policies are eased, the private sector will have to increase its ownership of long-term bonds and other assets that central banks will no longer purchase. This reallocation may result in a decline in asset prices and a widening in credit spreads if not supported by a commensurate improvement in growth and earnings forecasts. High debt levels increase the vulnerability of households and corporates to increases in debt servicing costs if higher interest rates are not accompanied by an increase in income. These factors indicate that the risks associated with this monetary policy tightening cycle are likely to be greater than in previous tightening cycles.
Given a stronger economic outlook and more resilient banking system, the global economy should be able to absorb a gradual tightening of financial conditions. However, given the high degree of co-movement in global interest rates, higher interest rates in some advanced economies could tighten financial conditions in countries that are in a different stage
3 Long-term interest rates can be decomposed into the average expected policy rate over the maturity of the bond and a term premium component. See February 2017 Monetary Policy Statement, Box B.
While the underlying strength of the global economy has improved, current macro-financial conditions present a risk to financial stability. The combination of high asset valuations and elevated debt levels increases the global financial system’s vulnerability to negative shocks and an accompanying repricing of risk.

23RESERVE BANK OF NEW ZEALAND / FINANCIAL STABILITY REPORT, NOVEMBER 2017
0
50
100
150
200
250
0
50
100
150
200
250
1980 1985 1990 1995 2000 2005 2010 2015
% %
Japan
Thailand
Spain
China
Figure 3.8Private non-financial sector credit(% of GDP)
Source: BIS.
Note: The dotted lines represent the BIS’s estimated credit-to-GDP trend; the trend end-point for Japan, Thailand and Spain denotes the maximum gap.
of the business cycle or are more exposed to volatility in international capital flows.
New Zealand’s long-term market interest rates will likely move higher as monetary policy stimulus is removed in major advanced economies. An increase in global interest rates and term premiums could also reduce demand for New Zealand assets as portfolios are rebalanced.
Macro-financial risks remain elevated in China…
Macro-financial conditions in China also present a risk to the global economy. The level of debt in China has risen significantly over the past decade, with much of the increase concentrated in the corporate sector. The rapid rate at which China’s debt has accumulated raises the risk of a disruptive adjustment at some point. China’s private non-financial sector credit-to-GDP gap – the difference between the credit-to-GDP ratio and its long-run trend – is currently estimated at around 22 percent of GDP. This is comparable to the credit-to-GDP gaps in countries that subsequently experienced financial crises, such as Japan, Thailand, and Spain (figure 3.8).
…prompting regulators to take action…
Underpinning China’s rapid credit growth is a financial system that has become increasingly interconnected and opaque, due to complex links between banks and non-bank financial institutions (NBFIs, or ‘shadow banks’). This has increased credit, liquidity and contagion risks in the financial system. Regulators have taken steps in 2017 to address a number of these financial stability risks, and Chinese authorities have announced a new Financial Stability and Development Committee to strengthen oversight and coordination among financial regulators.
One of the key aims of the regulatory agenda has been to reduce the extent to which banks borrow in short-term wholesale markets and invest in financial products offered by NBFIs. The most notable impact of the regulatory tightening has been a slowing in the growth of banks’ claims on NBFIs (figure 3.9), and growth in some less visible forms of shadow credit has also reportedly slowed. However, there has been little impact on official measures of credit growth, with total social financing still growing at an annual pace of around 13 percent, implying a further rise in China’s credit-to-GDP ratio.

24RESERVE BANK OF NEW ZEALAND / FINANCIAL STABILITY REPORT, NOVEMBER 2017
Housing-related risks remain prominent in Australia…
For some time, Australian regulators have been concerned about the financial stability risks associated with rapid growth in house prices and household indebtedness in Australia. House price-to-income and household debt-to-income ratios have reached record high levels in 2017, and household debt is high by international standards (figure 3.10).
0
15
30
45
60
75
90
0
5
10
15
20
25
30
2009 2011 2013 2015 2017
% RMBtn Bank claims on NBFIsAnnual growth (RHS)
Figure 3.9Chinese banks’ claims on NBFIs
Source: Haver Analytics.
…but significant vulnerabilities remain.
While recent regulatory actions are a positive step towards addressing some financial stability risks in China, the financial system remains vulnerable to shocks due to the high and rising level of indebtedness. If a disruption were to occur in China’s financial system, New Zealand would be affected predominately through the impact on the Chinese real economy and resultant lower trade volumes and commodity prices, as well as through weaker confidence and higher volatility in global financial markets. China’s strong trade linkages to Australia would also have an indirect impact on the New Zealand economy. The transmission of the shock through direct financial linkages to New Zealand is likely to be small; for example, Chinese investment represents only 2 percent of total foreign investment in New Zealand.
0
20
40
60
80
100
120
140
0
20
40
60
80
100
120
140
1991 1995 1999 2003 2007 2011 2015
% % AustraliaCanadaNew ZealandUnited KingdomUnited StatesJapan
Figure 3.10Household credit(% of GDP)
Source: BIS.
Note: Includes credit to households and non-profit institutions serving households.
…resulting in credit rating downgrades to Australian and New Zealand banks.
In response to these housing-related risks, Moody’s downgraded a number of Australian banks in June 2017, judging risks to Australia’s financial system to have increased. Given the close link between the credit ratings of the Australian major banks and their New Zealand subsidiaries, this flowed directly through to a credit rating downgrade of the four largest New Zealand banks (see appendix 3). While the impact on the New Zealand banks’ funding costs from Moody’s recent

25RESERVE BANK OF NEW ZEALAND / FINANCIAL STABILITY REPORT, NOVEMBER 2017
…increasing the resilience of the Australian financial system.
In response to these regulatory actions, the profile of new housing lending has shifted away from interest-only and other riskier types of lending. While household debt remains high, housing credit growth has slowed a little recently, with a notable decline in investor credit growth in 2017. House price inflation has also recently slowed in Sydney, following a period of very strong growth in 2016 and early 2017.
The resilience of the Australian banking system continues to be supported by robust profitability, with the major Australian banks remaining highly profitable relative to their international peers. Australian banks’ capital ratios have risen in recent years and will increase further as APRA recently announced that it will require banks to have higher common equity Tier 1 ratios.
downgrade was small, the impact is likely to be larger if risks materialise in the Australian financial system.
Australian regulators have responded to these risks…
Australian regulators have taken a range of actions in recent years to build the resilience of the banking system to housing-related risks. The Australian Prudential Regulation Authority (APRA) has had a benchmark on investor lending growth in place since 2014, and a limit on new interest-only lending was introduced in March 2017. APRA has also progressively tightened its prudential guidelines for residential mortgage lending in Australia. This has been a key factor underpinning the tightening in housing lending standards by the major New Zealand banks over the past year.

26RESERVE BANK OF NEW ZEALAND / FINANCIAL STABILITY REPORT, NOVEMBER 2017
Chapter 4Soundness and efficiency of New Zealand’s financial systemNew Zealand’s financial system remains sound and appears to be operating efficiently. The banking system continues to hold adequate buffers of capital, liquid assets, and stable funding relative to regulatory requirements. Bank profitability remains robust, supported by strong asset performance. Credit growth has slowed, partly due to a tightening in lending standards. As a result, banks have been able to reduce their reliance on offshore funding and they have also increased the average maturity of that funding. A moderation in risk appetite by the major banks has seen smaller banks and non-bank lenders increase their market share.
The insurance sector has experienced a record level of claims from weather-related events in 2017. The sector has been able to meet these claims, although the cost has significantly reduced the profit margins of some general insurers and aggregate solvency margins have declined further. Claims processes have improved following the Canterbury earthquakes, with insurers making significant progress in settling claims from the Kaikoura earthquake.
There have been no significant outages in payment and settlement systems in the past six months.
Banking sector
Bank capital ratios remain above current regulatory requirements.
Most banks are required to operate with a minimum common equity Tier 1 (CET1) ratio of 4.5 percent of risk-weighted assets (RWAs), a minimum Tier 1 ratio of 6 percent, and a total capital ratio of 8 percent at all times.1 In addition, banks are expected to hold a CET1 buffer of 2.5 percent (the ‘capital conservation buffer’) to ensure they maintain additional high quality capital to absorb losses during a period of stress. All locally incorporated banks continue to maintain capital buffers in excess of these minimum requirements (figure 4.1). The Reserve Bank is currently undertaking a review of the capital requirements that apply to locally incorporated registered banks to ensure that there is a very high level of confidence in the solvency of the banking system (see chapter 5).
1 Westpac New Zealand Limited’s minimum capital requirements will increase by 2 percentage points from 31 December 2017 after it failed to comply with regulatory obligations relating to its status as an internal models bank. See https://www.rbnz.govt.nz/news/2017/11/westpac-capital-requirements-increased-after-breaching-regulatory-obligations

27RESERVE BANK OF NEW ZEALAND / FINANCIAL STABILITY REPORT, NOVEMBER 2017
Recent stress tests of the major banks suggest that they have sufficient capital to withstand a severe economic downturn. However, these results depend on a number of assumptions and there is a high degree of uncertainty around how severe but plausible events may impact the capitalisation of banks (see box B).
Over the past four years, growth in the banking system’s total capital ratio has largely been achieved through higher levels of additional Tier 1 (AT1) capital, rather than higher quality CET1 capital. Almost all of the increase in the major banks’ total capital ratios since 2013 has been due to an increase in AT1 issuance, whereas the increase in other banks’ capital ratios has been driven by higher levels of CET1 capital (figure 4.2). A key element of the Capital Review is to consider how regulatory capital should be defined to ensure that capital instruments can perform their function to absorb losses if they arise (see chapter 5).
0
2
4
6
8
10
12
14
16
0
2
4
6
8
10
12
14
16
2001 2004 2007 2010 2013 2016
% % Conservation buffer requirementMinimum Tier 1 requirementCET1 capital ratioTier 1 capital ratioTotal capital ratio
Figure 4.1Regulatory capital ratios of locally incorporated banks(% of RWAs)
Sources: RBNZ Capital Adequacy Survey, registered banks’ Disclosure Statements.
0
2
4
6
8
10
12
14
16
0
2
4
6
8
10
12
14
16
2013 2017 2013 2017
Major banks Other banks
% % Tier 2Additional Tier 1Common equity Tier 1
Figure 4.2Components of bank capital(% of RWAs, September years)
Sources: Registered banks’ Disclosure Statements, RBNZ Capital Adequacy Survey.
Note: The four major banks are ANZ New Zealand, ASB, Bank of New Zealand and Westpac New Zealand.
Profitability remains robust…
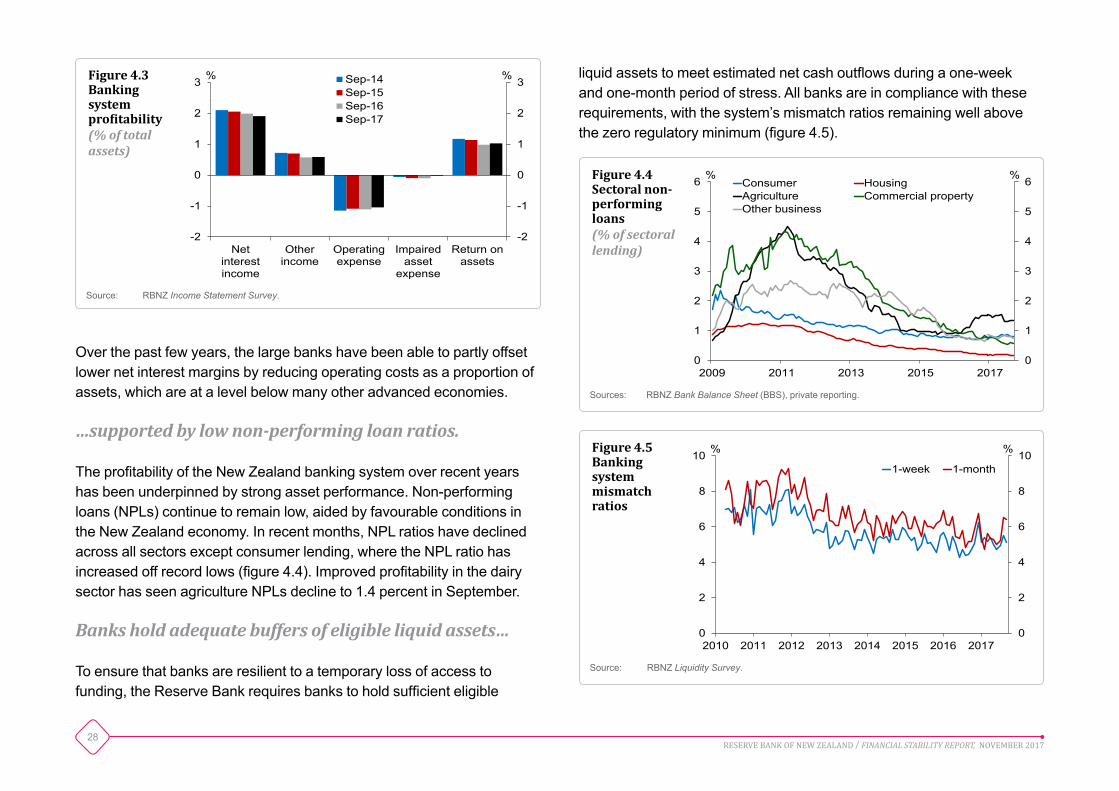
Robust underlying profitability allows banks to build high quality CET1 capital through retained earnings and provides an additional buffer against shocks to the banking system. The profitability of the New Zealand banking system remains high by international standards, with the sector achieving a return on assets of just above 1 percent in the year to September (figure 4.3).
Profitability has declined slightly in recent years, predominantly due to a narrowing in net interest margins. The average net interest margin of the five largest banks declined from around 2.3 percent in early 2015 to 2 percent at the end of 2016, partly due to higher deposit interest rates as banks competed for deposit funding. However, net interest margins have recovered slightly since early 2017.
28RESERVE BANK OF NEW ZEALAND / FINANCIAL STABILITY REPORT, NOVEMBER 2017
0
1
2
3
4
5
6
0
1
2
3
4
5
6
2009 2011 2013 2015 2017
% % Consumer HousingAgriculture Commercial propertyOther business
Figure 4.4Sectoral non-performing loans(% of sectoral lending)
Sources: RBNZ Bank Balance Sheet (BBS), private reporting.
Netinterestincome
Otherincome
Operatingexpense
Impairedasset
expense
Return onassets
-2
-1
0
1
2
3
-2
-1
0
1
2
3 % % Sep-14Sep-15Sep-16Sep-17
Figure 4.3Banking system profitability(% of total assets)
Source: RBNZ Income Statement Survey.
0
2
4
6
8
10
0
2
4
6
8
10
2010 2011 2012 2013 2014 2015 2016 2017
% %
1-week 1-month
Figure 4.5Banking system mismatch ratios
Source: RBNZ Liquidity Survey.
Over the past few years, the large banks have been able to partly offset lower net interest margins by reducing operating costs as a proportion of assets, which are at a level below many other advanced economies.
…supported by low non-performing loan ratios.
The profitability of the New Zealand banking system over recent years has been underpinned by strong asset performance. Non-performing loans (NPLs) continue to remain low, aided by favourable conditions in the New Zealand economy. In recent months, NPL ratios have declined across all sectors except consumer lending, where the NPL ratio has increased off record lows (figure 4.4). Improved profitability in the dairy sector has seen agriculture NPLs decline to 1.4 percent in September.
Banks hold adequate buffers of eligible liquid assets…
To ensure that banks are resilient to a temporary loss of access to funding, the Reserve Bank requires banks to hold sufficient eligible
liquid assets to meet estimated net cash outflows during a one-week and one-month period of stress. All banks are in compliance with these requirements, with the system’s mismatch ratios remaining well above the zero regulatory minimum (figure 4.5).
29RESERVE BANK OF NEW ZEALAND / FINANCIAL STABILITY REPORT, NOVEMBER 2017
50
60
70
80
90
100
50
60
70
80
90
100
2004 2006 2008 2010 2012 2014 2016
% % Minimum CFR requirementCFR
Figure 4.6Banking system core funding(% of gross loans and advances)
Sources: RBNZ Liquidity Survey, RBNZ Standard Statistical Return (SSR).
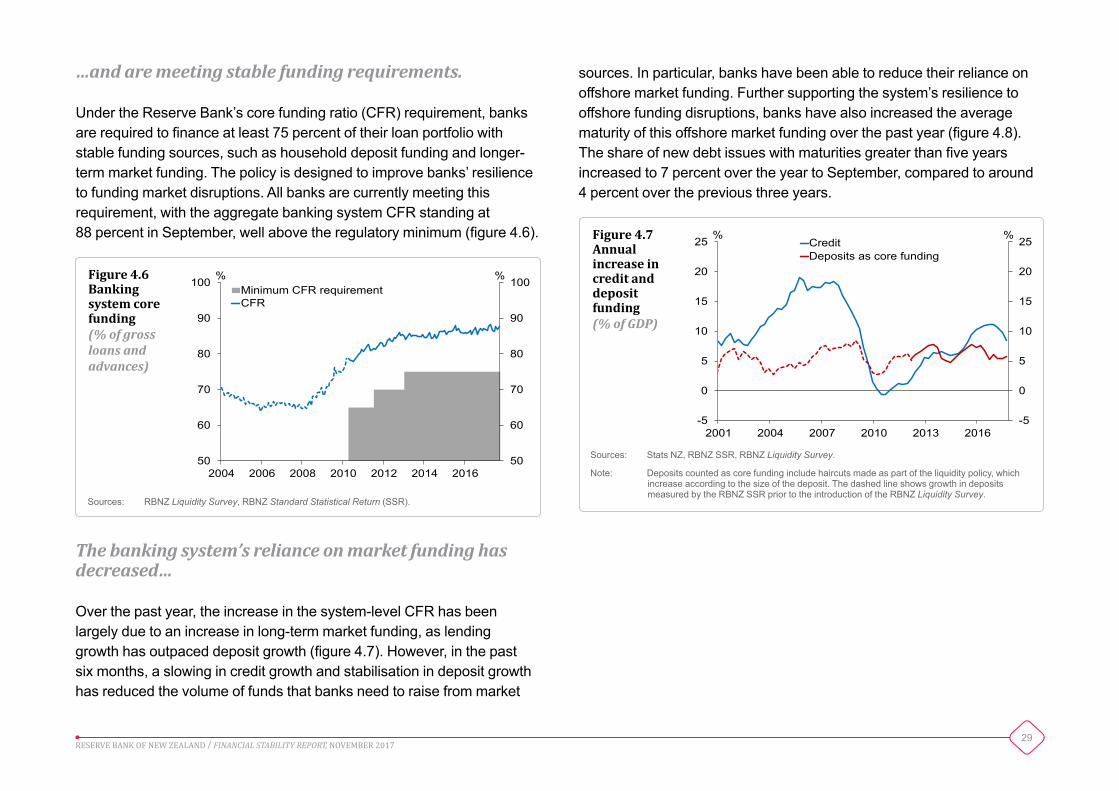
…and are meeting stable funding requirements.
Under the Reserve Bank’s core funding ratio (CFR) requirement, banks are required to finance at least 75 percent of their loan portfolio with stable funding sources, such as household deposit funding and longer-term market funding. The policy is designed to improve banks’ resilience to funding market disruptions. All banks are currently meeting this requirement, with the aggregate banking system CFR standing at 88 percent in September, well above the regulatory minimum (figure 4.6).
sources. In particular, banks have been able to reduce their reliance on offshore market funding. Further supporting the system’s resilience to offshore funding disruptions, banks have also increased the average maturity of this offshore market funding over the past year (figure 4.8). The share of new debt issues with maturities greater than five years increased to 7 percent over the year to September, compared to around 4 percent over the previous three years.
The banking system’s reliance on market funding has decreased…
Over the past year, the increase in the system-level CFR has been largely due to an increase in long-term market funding, as lending growth has outpaced deposit growth (figure 4.7). However, in the past six months, a slowing in credit growth and stabilisation in deposit growth has reduced the volume of funds that banks need to raise from market
-5
0
5
10
15
20
25
-5
0
5
10
15
20
25
2001 2004 2007 2010 2013 2016
% % CreditDeposits as core funding
Figure 4.7Annual increase in credit and deposit funding(% of GDP)
Sources: Stats NZ, RBNZ SSR, RBNZ Liquidity Survey.
Note: Deposits counted as core funding include haircuts made as part of the liquidity policy, which increase according to the size of the deposit. The dashed line shows growth in deposits measured by the RBNZ SSR prior to the introduction of the RBNZ Liquidity Survey.

30RESERVE BANK OF NEW ZEALAND / FINANCIAL STABILITY REPORT, NOVEMBER 2017
0
50
100
150
200
250
300
350
0
50
100
150
200
250
300
350
2011 2012 2013 2014 2015 2016 2017
bps bps RetailDomestic wholesaleOffshore wholesale
Figure 4.9Bank funding costs(spread to swap rates)
Sources: RBNZ Liquidity Survey, RBNZ SSR.
Note: Wholesale spreads are a simple average of the landed cost of new issues at terms of between four and seven years by the four major banks. The retail spreads are proxied using the spread between the average six-month deposit rate and the 180-day bank bill rate.
…and tightened lending standards.
The slowing in credit growth has been partly due to a broad-based tightening in lending standards over the past year (figure 4.10). The major banks remain particularly cautious about lending to the property development sector, given elevated housing market risks and capacity constraints in the construction sector. In the agriculture sector, lending standards have also tightened since the May Report and banks are placing greater emphasis on dairy farms repaying debt. Lending standards are expected to tighten further in the next six months, most notably in the agriculture and business sectors.
…as banks have encouraged deposit growth through higher retail deposit rates…
To address a widening gap between credit growth and deposit growth, banks have increased deposit rates. Since early 2016, spreads on six-month term deposits have increased by 65 basis points and they are now more comparable with domestic and offshore term wholesale funding spreads. At the same time, wholesale funding spreads in international and domestic funding markets have continued to trend down (figure 4.9). With offshore credit spreads at record lows, banks have been pre-funding in anticipation that funding spreads may increase in the future.
0
10
20
30
40
50
60
0
10
20
30
40
50
60
< 1 year 1-3 years 3-5 years > 5 years
% %
Sep-16 Sep-17
Figure 4.8Market funding by maturity(locally incorporated banks)
Source: RBNZ Liquidity Survey.

31RESERVE BANK OF NEW ZEALAND / FINANCIAL STABILITY REPORT, NOVEMBER 2017
-2
0
2
4
6
8
10
-2
0
2
4
6
8
10
2011 2012 2013 2014 2015 2016 2017
% % Five largest banksSmaller banksTotal
Figure 4.11Contribution to annual housing lending growth
Sources: RBNZ BBS, RBNZ SSR.
Note: ‘Smaller banks’ is comprised of New Zealand registered banks other than the five largest New Zealand registered banks.
Mar
-15
Sep-
15M
ar-1
6Se
p-16
Mar
-17
Sep-
17M
ar-1
8M
ar-1
5Se
p-15
Mar
-16
Sep-
16M
ar-1
7Se
p-17
Mar
-18
Mar
-15
Sep-
15M
ar-1
6Se
p-16
Mar
-17
Sep-
17M
ar-1
8
Retail Business Agriculture
-20
-15
-10
-5
0
5
10
15
20
25
-20
-15
-10
-5
0
5
10
15
20
25% %
Change since previous periodExpected change as indicated in previous period
Tightening of standards
Figure 4.10Changes in lending standards by sector(net % of banks)
Source: RBNZ Credit Conditions Survey.
Note: Net percent of banks is the percentage of banks reporting a tightening of lending standards minus the percentage reporting an easing. Individual bank responses are weighted by market share.
Small bank lending growth remains elevated.
While aggregate bank lending growth has slowed over the past year, this has predominantly been due to a slowing in lending growth by the five largest banks. In contrast, credit growth from the smaller banks remains elevated to some sectors of the economy. For example, housing credit by the smaller banks grew by almost 30 percent in the year to September, compared to around 5 percent for the five largest lenders. Over the past two years, the stock of smaller banks’ housing loans has increased by around 50 percent to $12.5 billion. While the five largest banks still dominate the mortgage lending market, smaller banks have contributed around 20 percent of the growth in housing lending over the past year (figure 4.11).
Residential development lending is another sector where there has been a significant difference in lending growth between the large and small banks. Reduced risk appetite and tighter lending standards have seen the stock of residential development credit from the five largest banks remain broadly flat since January, at around $2.7 billion. Over this period, smaller banks have grown their lending to this sector by around $250 million (or 80 percent), and now account for 18 percent of total bank lending to the residential development sector. This has largely been due to growth from foreign banks rather than from small domestic banks.
Strong lending growth by the smaller banks is likely to partly reflect these banks entering new lending markets, particularly as the major banks have tightened lending criteria to some sectors. The ability of some small banks to grow their market share in certain sectors suggests that barriers to expansion in the New Zealand banking system are not prohibitive.
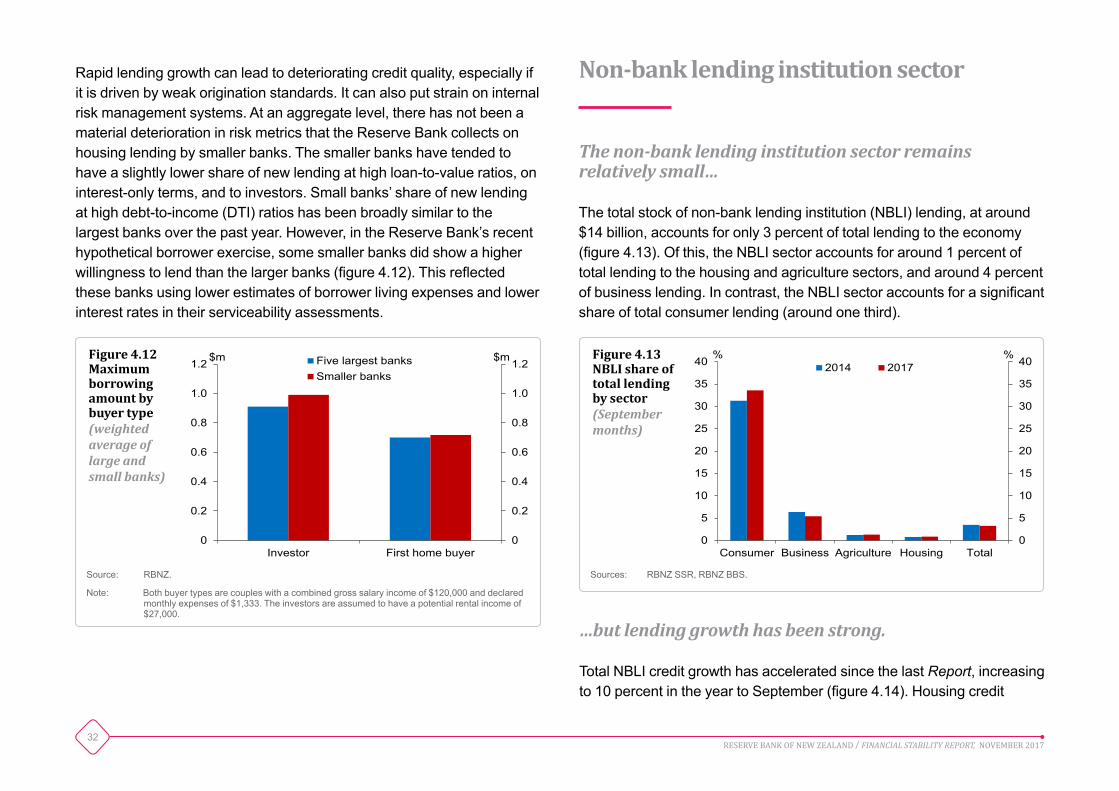
32RESERVE BANK OF NEW ZEALAND / FINANCIAL STABILITY REPORT, NOVEMBER 2017
0
0.2
0.4
0.6
0.8
1.0
1.2
0
0.2
0.4
0.6
0.8
1.0
1.2
Investor First home buyer
$m $m Five largest banksSmaller banks
Figure 4.12Maximum borrowing amount by buyer type (weighted average of large and small banks)
Source: RBNZ.
Note: Both buyer types are couples with a combined gross salary income of $120,000 and declared monthly expenses of $1,333. The investors are assumed to have a potential rental income of $27,000.
Non-bank lending institution sector
The non-bank lending institution sector remains relatively small…
The total stock of non-bank lending institution (NBLI) lending, at around $14 billion, accounts for only 3 percent of total lending to the economy (figure 4.13). Of this, the NBLI sector accounts for around 1 percent of total lending to the housing and agriculture sectors, and around 4 percent of business lending. In contrast, the NBLI sector accounts for a significant share of total consumer lending (around one third).
0
5
10
15
20
25
30
35
40
0
5
10
15
20
25
30
35
40
Consumer Business Agriculture Housing Total
% % 2014 2017
Figure 4.13NBLI share of total lending by sector(September months)
Sources: RBNZ SSR, RBNZ BBS.
…but lending growth has been strong.
Total NBLI credit growth has accelerated since the last Report, increasing to 10 percent in the year to September (figure 4.14). Housing credit
Rapid lending growth can lead to deteriorating credit quality, especially if it is driven by weak origination standards. It can also put strain on internal risk management systems. At an aggregate level, there has not been a material deterioration in risk metrics that the Reserve Bank collects on housing lending by smaller banks. The smaller banks have tended to have a slightly lower share of new lending at high loan-to-value ratios, on interest-only terms, and to investors. Small banks’ share of new lending at high debt-to-income (DTI) ratios has been broadly similar to the largest banks over the past year. However, in the Reserve Bank’s recent hypothetical borrower exercise, some smaller banks did show a higher willingness to lend than the larger banks (figure 4.12). This reflected these banks using lower estimates of borrower living expenses and lower interest rates in their serviceability assessments.

33RESERVE BANK OF NEW ZEALAND / FINANCIAL STABILITY REPORT, NOVEMBER 2017
-2
0
2
4
6
8
10
12
-2
0
2
4
6
8
10
12
2015 2016 2017
% % ConsumerHousingOtherTotal
Figure 4.14Contribution by sector to annual NBLI lending growth
Sources: RBNZ BBS, RBNZ SSR.
Insurance sector
The insurance sector is an integral component of the financial services industry in New Zealand. Under the Insurance (Prudential Supervision) Act, the Reserve Bank is required to promote the maintenance of a
growth has been particularly strong, increasing by almost 30 percent over the past year and contributing around 3 percentage points to total NBLI lending growth over this period. However, this growth masks variation among NBLIs. A small number of lenders have rapidly expanded their mortgage books, while others have reduced their housing lending.
NBLI consumer lending growth has steadily increased over the past two years. Dealership car finance has recently expanded rapidly, accounting for around 40 percent of growth in NBLI consumer lending over the past year.
sound and efficient insurance sector and to promote confidence in the sector.
New Zealand’s private insurance sector is relatively small by international standards (figure 4.15). This reflects a number of factors, including the comparatively large role of government in the provision of social insurance services in New Zealand, and the small extent to which insurance products are part of New Zealand’s retirement savings infrastructure.2
Domestic insurers’ profit margins have declined over the past year…
New Zealand’s insurance industry is comprised of three key sectors: general, health and life insurance. In the year to June 2017, the general
2 See https://www.rbnz.govt.nz/-/media/ReserveBank/Files/Publications/Bulletins/2014/2014sep77-3.pdf
0
2
4
6
8
10
12
0
2
4
6
8
10
12
UnitedStates
UnitedKingdom
OECD Australia Canada NewZealand
% % Figure 4.15 Private insurance premiums of selected OECD countries(% of GDP, 2015)
Sources: OECD, RBNZ.
Note: New Zealand data are as at June 2017, and exclude ACC and EQC.

34RESERVE BANK OF NEW ZEALAND / FINANCIAL STABILITY REPORT, NOVEMBER 2017
insurance sector accounted for 61 percent of total gross earned premiums, life insurance accounted for 24 percent, and health insurance accounted for 15 percent, based on data submitted by licensed insurers. For the sector as a whole, gross earned premiums increased by 9 percent over the year to June 2017 to $9.1 billion, whereas gross incurred claims increased by 52 percent to $8 billion. As a result, the industry’s gross loss ratio – defined as incurred claims divided by earned premium – increased sharply over the year from 63 percent to 88 percent. After taking into account reinsurance premiums and claims, the insurance sector’s net loss ratio increased by less, from 61 percent to 66 percent.3
…due to a high level of claims.
The reduction in profit margins over the past year largely reflects an increase in claims associated with the Kaikoura earthquake and a number of significant weather-related events in 2017. In addition, general insurers have also been experiencing higher claims within their motor insurance portfolios. This partly reflects higher costs associated with repairing modern vehicles. The commercial insurance market remains very competitive, particularly for commercial property, and insurers’ underwriting discipline is being tested as they try to balance sales objectives and underwriting quality.
Aggregate insurer solvency margins – a measure of the strength of insurers’ capital buffers held to cover losses from extreme events – have also declined further over the past six months. While minimum solvency margins are set by licence conditions, insurers are encouraged to consider potential risks when setting target capital buffers above
3 The Reserve Bank plans to commence publishing a selection of data from its Quarterly Insurer Survey in the next few months, which will include financial performance and balance sheet data for the aggregate insurance industry.
the minimum requirement. The claims cost impact of the Canterbury earthquakes has highlighted how catastrophes can put pressure on solvency margins long after the event. It also reinforced the importance of insurers protecting future solvency margins following an extreme event or a series of smaller events. As a risk-based supervisor, the Reserve Bank has been working with several larger insurers that have relatively small buffers, to improve their resilience.
The sector remains well supported by international reinsurers.
New Zealand continues to be well supported by international reinsurers. A series of extreme events, including hurricanes in the Caribbean and the United States and earthquakes in Mexico, has significantly impacted the profits of international reinsurers. At an aggregate level, recent events have the potential to impact reinsurance pricing and the scope of cover. For New Zealand, a more immediate issue for general insurers is likely to be the need to review levels of reinsurance in light of updates to catastrophe risk models following the Canterbury earthquakes. General insurers are required to hold catastrophe protection for a 1 in 1000 year event, and insurers will be reviewing their catastrophe cover to ensure they continue to meet this requirement.
Claims processes have improved following the Canterbury earthquakes.
Insurers have made significant progress in settling claims from the Kaikoura earthquake, with $900 million of claims paid as at 30 September 2017, out of an estimated total cost of at least $3 billion. Under a Memorandum of Understanding between insurers and the Earthquake Commission (EQC) for Kaikoura claims, insurers are managing claims from the outset rather than responding to referrals from

35RESERVE BANK OF NEW ZEALAND / FINANCIAL STABILITY REPORT, NOVEMBER 2017
EQC once claims go over the EQC limit. This arrangement appears to have significantly improved the efficiency of claims processing.
As communicated in previous Reports, remaining claims from the Canterbury earthquakes are generally the most complex and, in many cases, are in dispute or litigation. At end-September 2017, total claims of $33.9 billion had been paid (including EQC). The Reserve Bank’s estimate of ultimate claims costs, including EQC, remains unchanged at $36-40 billion.
The life insurance sector continues to face headwinds.
The low interest-rate environment and high levels of broker commission continue to present challenges to life insurers. Some Australian banks have been reviewing their strategies in relation to life insurance. One factor influencing this trend has been the requirement for Australian banks to increase the amount of capital they hold against their banking exposures. As such, some banks are selling their insurance businesses to release capital and, in the process, simplify their business by offering insurance as an intermediary service rather than as an underwriter. The Hong Kong-based AIA Group is set to become the largest life insurer in Australia and New Zealand through its proposed buyout of Commonwealth Bank of Australia’s insurance units, which includes Sovereign Assurance in New Zealand.
There remains strong interest from potential new entrants.
The number of licensed insurers in New Zealand has declined over recent years, reflecting consolidation in the industry. However, the Reserve Bank has received ongoing strong interest from potential new market entrants, suggesting that the New Zealand insurance market is
an attractive business proposition. This may reflect a growing population as well as new opportunities for technology-based innovation in the sector. New entrants are able to enter the New Zealand insurance market subject to meeting licensing requirements that include holding a prescribed level of minimum capital and having strong governance and risk management frameworks.
Financial market infrastructures
Payment systems have operated reliably.
The continuous availability of payment and settlement systems is vital to the smooth and efficient functioning of the financial system and the maintenance of public confidence in the system. In the past six months, no significant outages have occurred in the key payment systems.
The Exchange Settlement Account System (ESAS), operated by the Reserve Bank, settles all financial transactions in New Zealand that involve interbank payments and shares common technology with the NZClear securities settlement system. In the past six months, there have been some disruptions to normal operations of the ESAS/NZClear system, but they were limited to just a few minutes in July. The disruptions related to the installation of software upgrades that caused unexpected problems for a small number of participants. Overall, in the past 12 months the Reserve Bank has achieved its goal that the systems it operates are available for at least 99.9 percent of the time (figure 4.16).

36RESERVE BANK OF NEW ZEALAND / FINANCIAL STABILITY REPORT, NOVEMBER 2017
99.6
99.7
99.8
99.9
100
0
100
200
300
400
Mar-15 Sep-15 Mar-16 Sep-16 Mar-17 Sep-17
% Mins Connectivity and communicationsSystem performanceAvailability (RHS)
Figure 4.16ESAS/NZClear availability and outages
Source: RBNZ.
Note: Availability is for the 12 months to the end of the given quarter. ESAS and NZClear availability are reported together because of the close links between the two systems.
New ESAS and NZClear systems are under development.
The Reserve Bank is currently upgrading its ESAS and NZClear systems. This project encompasses a new Real Time Gross Settlement system for ESAS and a new central securities depository for NZClear. Over the past six months, a key focus has been to confirm the functionality that the new central securities depository will provide and to plan how business requirements will be met. This clarification and planning phase has taken longer than anticipated and it is now expected that the new systems will go live in April 2019. The Reserve Bank continues to work with industry participants to ensure they are aware of progress and understand what will be required of them.
While the new system is being developed, it is vital that the current ESAS system continues to be available and reliable. Maintenance of the existing system is being given high priority and it is still being upgraded as necessary.
Retail payments have been settled faster.
Retail payment systems have operated robustly over the past six months. These systems process payments made by bank customers including EFTPOS transactions, automatic payments and direct debits and credits. As reported in the previous Report, changes to payment system rules and bank settlement practices have resulted in faster settlement of debits and credits, with settlement occurring earlier in the day. This trend has continued (figure 4.17).
0
20
40
60
80
0
20
40
60
80
Sep-14 Sep-15 Sep-16 Sep-17
% % 9.00am - 2:59pm3:00pm - 9:59pm10:00pm -12.15am
Figure 4.17Retail payments(% of daily value settled)
Source: RBNZ.
System self-assessments have improved the public disclosure of FMI risk management.
Designated settlement systems are required to periodically undertake and publish self-assessments of their degree of observance of the Principles for FMIs (published by the Committee on Payments and Market Infrastructures and the International Organisation of Securities Commissions). The principles provide best-practice guidance for a range of key factors, including legal structure, operational issues and

37RESERVE BANK OF NEW ZEALAND / FINANCIAL STABILITY REPORT, NOVEMBER 2017
risk management. By publishing a self-assessment, financial market infrastructures (FMIs) provide interested parties with detailed information about how well the FMI’s operations conform to best practice, and what the FMI plans to do to improve any identified gaps.
The operators of the NZClear and NZCDC systems have both recently published updated assessments. Both FMIs consider that they fully observe all but one or two of the relevant principles. However, even when a principle is observed there may be scope for further improvement. The joint regulators of designated systems (the Reserve Bank and Financial Markets Authority) encourage operators to continue looking for ways to improve their disclosures and level of observance.
New Zealand participants have been increasing their use of international FMIs.
International FMIs are playing an increasingly important role in the New Zealand financial system. New Zealand banks have used the CLS system (operated by CLS Bank International, based in New York) to settle most of their foreign exchange transactions for more than 10 years.
More recently, focus has been on the activities of central counterparties given international moves to encourage or require the central clearing of over-the-counter derivatives transactions. Two central counterparties that play a significant role in the New Zealand financial system are ASX Clear (Futures) (based in Sydney and clears NZD futures traded on the ASX 24 market), and LCH Limited (based in London and clears NZD interest rate swaps).
For the most part, New Zealand financial institutions participate indirectly in these FMIs by using foreign banks as their agents. However, some banks have been reconsidering their reliance on such indirect arrangements, with one New Zealand bank recently becoming a direct clearing participant in LCH.
Because of the high level of dependence of the New Zealand financial system on overseas infrastructures, New Zealand regulators (RBNZ and FMA) intend to increase the degree of prudential oversight of these systems. This monitoring will require ongoing cooperation with regulators in other countries and will be facilitated by the new FMI oversight regime currently being developed (see chapter 5).
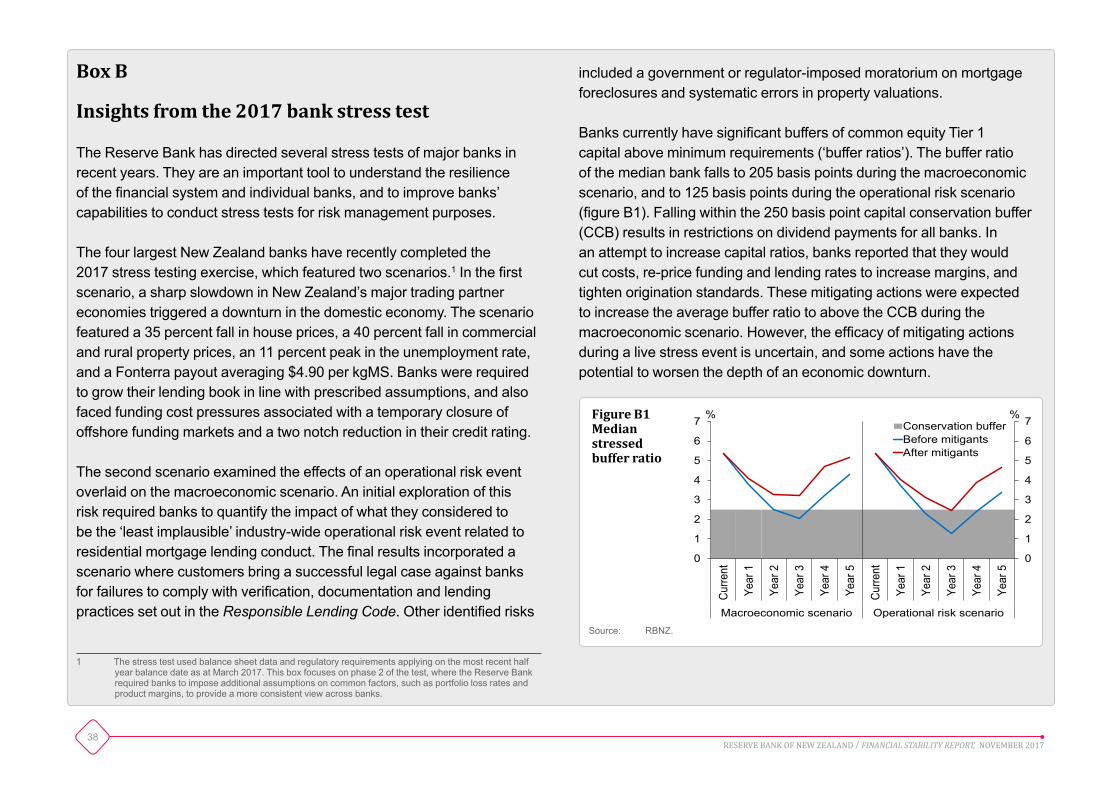
38RESERVE BANK OF NEW ZEALAND / FINANCIAL STABILITY REPORT, NOVEMBER 2017
0
1
2
3
4
5
6
7
0
1
2
3
4
5
6
7
Curre
nt
Year
1
Year
2
Year
3
Year
4
Year
5
Curre
nt
Year
1
Year
2
Year
3
Year
4
Year
5
Macroeconomic scenario Operational risk scenario
% % Conservation bufferBefore mitigantsAfter mitigants
Figure B1Median stressed buffer ratio
Source: RBNZ.
Box B
Insights from the 2017 bank stress test
The Reserve Bank has directed several stress tests of major banks in recent years. They are an important tool to understand the resilience of the financial system and individual banks, and to improve banks’ capabilities to conduct stress tests for risk management purposes.
The four largest New Zealand banks have recently completed the 2017 stress testing exercise, which featured two scenarios.1 In the first scenario, a sharp slowdown in New Zealand’s major trading partner economies triggered a downturn in the domestic economy. The scenario featured a 35 percent fall in house prices, a 40 percent fall in commercial and rural property prices, an 11 percent peak in the unemployment rate, and a Fonterra payout averaging $4.90 per kgMS. Banks were required to grow their lending book in line with prescribed assumptions, and also faced funding cost pressures associated with a temporary closure of offshore funding markets and a two notch reduction in their credit rating.
The second scenario examined the effects of an operational risk event overlaid on the macroeconomic scenario. An initial exploration of this risk required banks to quantify the impact of what they considered to be the ‘least implausible’ industry-wide operational risk event related to residential mortgage lending conduct. The final results incorporated a scenario where customers bring a successful legal case against banks for failures to comply with verification, documentation and lending practices set out in the Responsible Lending Code. Other identified risks
1 The stress test used balance sheet data and regulatory requirements applying on the most recent half year balance date as at March 2017. This box focuses on phase 2 of the test, where the Reserve Bank required banks to impose additional assumptions on common factors, such as portfolio loss rates and product margins, to provide a more consistent view across banks.
included a government or regulator-imposed moratorium on mortgage foreclosures and systematic errors in property valuations.
Banks currently have significant buffers of common equity Tier 1 capital above minimum requirements (‘buffer ratios’). The buffer ratio of the median bank falls to 205 basis points during the macroeconomic scenario, and to 125 basis points during the operational risk scenario (figure B1). Falling within the 250 basis point capital conservation buffer (CCB) results in restrictions on dividend payments for all banks. In an attempt to increase capital ratios, banks reported that they would cut costs, re-price funding and lending rates to increase margins, and tighten origination standards. These mitigating actions were expected to increase the average buffer ratio to above the CCB during the macroeconomic scenario. However, the efficacy of mitigating actions during a live stress event is uncertain, and some actions have the potential to worsen the depth of an economic downturn.

39RESERVE BANK OF NEW ZEALAND / FINANCIAL STABILITY REPORT, NOVEMBER 2017
Underlying profit: The banking system’s net interest margin declined by approximately 50 basis points per annum in the scenario. Banks only gradually passed on higher funding costs to customers, reflecting a desire to maintain long-term customer relationships and that some customers are on fixed rates. Underlying profits remained sufficient to provide a substantial buffer of earnings that accumulate to around 550 basis points of additional capital for the average bank.
Operational risk event: Banks were assumed to pay compensation on a proportion of new loans written since the Responsible Lending Code came into effect, and were also subject to a further one notch credit rating downgrade. These costs reduced the system CET1 ratio by approximately 70 basis points.
Like previous stress tests, this exercise suggests the major New Zealand banks can, as a group, absorb large losses in a downturn while remaining solvent. However, it is important to note that there is significant uncertainty around the impact of a severe downturn on the banking system. Stressed capital impacts are highly sensitive to assumed loss rates, and loss rates in some severe downturns in other advanced economies have significantly exceeded the losses in the 2017 test.
System-wide stress tests also cannot test individual banks against all possible risks that they could face and have capital to mitigate. For example, an individual bank could have substantially worse outcomes if they had higher funding costs during the downturn than their peers, leading to erosion in their net interest margin. For these reasons, the Reserve Bank does not use stress test results as a mechanical indicator of individual or industry capital adequacy. The Reserve Bank intends to publish further analysis of the lessons from its recent stress tests, including their implications for systemic resilience.
0 2 4 6 8 10 12
0 2 4 6 8 10 12
Year 3 CET1 ratio
Operational risk event
Underlying profit
Other
RWA growth
Credit losses
Starting CET1 ratio %
%
Figure B2Contributions to peak-to-trough decline in system CET1 ratio (before mitigating actions)
Source: RBNZ.
Note: Other includes non-credit losses arising from operational, market and counterparty risk incorporated in the macroeconomic scenario.
Figure B2 shows the contributions to the peak decline in the system capital ratio. The main drivers were:
Credit losses: Due to the deteriorating macroeconomic environment in the scenario, cumulative credit losses associated with defaulting loans were around 5.5 percent of gross loans. Losses were spread across most portfolios, with residential mortgages and farm lending together accounting for 50 percent of total losses. Credit losses reduced CET1 ratios by 600 basis points.
RWA growth: The key driver of RWA outcomes were (i) risk weights increasing in line with deterioration in the average credit quality of non-defaulted customers and (ii) the requirement that banks’ lending grows on average by 6 percent over the course of the scenario. RWA growth reduced CET1 ratios by approximately 160 basis points.
40RESERVE BANK OF NEW ZEALAND / FINANCIAL STABILITY REPORT, NOVEMBER 2017
Box C
FinTech developments and implications for RBNZ regulatory responsibilities
‘FinTech’ refers to technological innovations that may have a material impact on business models, processes and products in financial services. Such innovations have not been unusual historically, but the pace and scope of change has been particularly striking over recent years. Recent developments have begun to attract the attention of international bodies including the Financial Stability Board, the IMF and the Basel Committee on Banking Supervision, and many national regulators.1
The current FinTech wave has the potential to significantly change the structure of the financial sector and the nature of payments mechanisms over the medium term. The changes may result in new risks to the stability of the financial system, but may also improve efficiency.
The Reserve Bank has recently undertaken research to gain a better understanding of the implications of FinTech for the Reserve Bank’s regulatory responsibilities. The findings of this research are mainly qualitative rather than quantitative. This is because there are few good measures of the scale of FinTech activity, and data availability is limited in New Zealand. Some of the most important FinTech developments are:2
• distributed ledger technology including blockchain;
1 See, for example: ‘Financial Stability Implications from FinTech’, Financial Stability Board, June 2017; ‘Fintech and Financial Services: Initial Considerations’, IMF Staff Discussion Note, June 2017; and ‘Sound Practices: Implication of fintech developments for banks and bank supervisors’, Basel Committee Consultative Document, August 2017.
2 For further details on these specific technologies, see https://www.bis.org/bcbs/publ/d415.htm
• digital currency including crypto-currency;
• application programming interfaces (‘APIs’);
• ‘big data’ and artificial intelligence; and
• digital platforms for peer-to-peer (‘P2P’) activities.
FinTech may enable the unbundling of services provided by existing financial service providers, with more nimble start-ups or large non-financial new entrants potentially capturing market share. Unbundling could lead to some fragmentation of the financial system and weaker profitability for incumbents. This poses some risks to the Reserve Bank’s soundness objective, but in the long run a less concentrated financial system may also be more resilient and more efficient. The risks to existing firms are likely those associated with any period of rapid change, notably strategic and operational risk: the risk of poor strategic choices in dealing with new competitors or embarking on new business models, and the risk of poor implementation of major changes that may be needed. It is very difficult to predict if and when such risks may crystallise, but the Reserve Bank does not see FinTech leading to any material increase in prudential risk in the short term.
FinTech developments are likely to improve the financial system’s ability to innovate and meet customer needs, as well as provide financial services at lower cost. Existing firms can be expected to respond to the competitive challenges and enhance their existing services through new digital platforms. The Reserve Bank welcomes these potential efficiency benefits.
In a number of jurisdictions, government agencies and regulators are actively facilitating FinTech development. In some jurisdictions, a
41RESERVE BANK OF NEW ZEALAND / FINANCIAL STABILITY REPORT, NOVEMBER 2017
concessionary regulatory environment (a ‘sandbox’) is being provided, and some authorities are playing a support role (an ‘incubator’) for new entrants. Some are also enabling ‘open banking’, whereby changes in legal or other frameworks enable a bank customer to give third parties (such as banking app providers) access to data that the bank holds on the customer.
In New Zealand, initiatives to actively promote FinTech would most naturally fall to other bodies responsible for financial product regulation, competition and innovation. These include the Ministry of Business, Innovation and Employment (MBIE) and the Financial Markets Authority (FMA). MBIE has stated that it is currently monitoring how open banking evolves in other jurisdictions before deciding whether any comparable government intervention is warranted in New Zealand.3 The FMA has said that it wants to see innovation in financial services encouraged where it improves the scope or quality of these services.4 The FMA aims to be flexible and open in response to innovative new businesses, and so far has not seen a need to put in place a formal ‘sandbox’ regime to achieve that.
The Reserve Bank seeks to ensure that its prudential regimes do not hinder new digital innovations in financial services from flourishing in New Zealand, and more generally believes that New Zealand’s current financial market regulatory settings support innovation and industry-based solutions.
Looking ahead, the Reserve Bank will need to monitor how FinTech may change the dynamics in the financial sector, in order to identify how the risks faced by regulated firms are evolving. Over time, such
3 See http://www.mbie.govt.nz/info-services/business/competition-policy/retail-payment-systems 4 See https://fma.govt.nz/about-us/corporate-publications/annual-corporate-plan/
developments may require a change in the Reserve Bank’s supervisory approach and a change in the types of entities or activities that are captured within the perimeter of prudential regulation. At the same time, the Reserve Bank is coordinating with other agencies to ensure that New Zealand provides an environment that does not hinder digital innovation, provided that the innovators operate safely and observe relevant regulations.

42RESERVE BANK OF NEW ZEALAND / FINANCIAL STABILITY REPORT, NOVEMBER 2017
The Reserve Bank continues to make progress on a broad range of regulatory policy initiatives. To date, two consultation papers have been released on the review of the capital adequacy framework for banks and more papers are forthcoming. A thematic review of the bank directors’ attestation regime has been undertaken. The Reserve Bank has also confirmed its decision to proceed with the dashboard approach to quarterly disclosures for banks and implementation work has begun. In November, the Reserve Bank published its response to the public consultation on the potential additions of serviceability restrictions in the macro-prudential toolkit.
Progress has been made on a number of other initiatives including: the publication of the revised outsourcing policy, the review of the Insurance (Prudential Supervision) Act, consultation on issues around foreign margin requirements for over-the-counter derivatives, and the proposed oversight framework for financial market infrastructures.
The Capital Review
In March 2017, the Reserve Bank announced that it was undertaking a review of the capital regime applying to locally incorporated registered banks (the ‘Capital Review’). The overall aim of the review is to ensure that New Zealand’s capital framework provides a very high level of confidence in the solvency of the banking system while minimising complexity and compliance costs. Two consultation papers have been released since the announcement, and more papers are forthcoming.
The first consultation paper was released in May. That paper outlined the proposed scope of the Capital Review, and explained the factors that had led to the decision to review bank capital requirements, including: the performance of the capital framework over the past several years; global trends in bank regulation and developments that are leading to higher capital levels in some jurisdictions; lessons from recent bank failures in Europe; trends in the measurement and aggregation of bank risk; and developments in the composition of bank capital.
A second consultation paper was released in July and submissions closed in early September. The second paper addressed the question of
Chapter 5Key regulatory developments

43RESERVE BANK OF NEW ZEALAND / FINANCIAL STABILITY REPORT, NOVEMBER 2017
what should qualify as bank capital. The current capital regime permits banks, when measuring regulatory capital, to include preference shares and debt that contractually converts to new common equity when triggered (‘contingent debt’), in addition to existing shareholder common equity. The paper expressed some reservations about capital with contingent features.
The paper outlined several options for reform of the definition of capital. The Reserve Bank expressed a preference to omit contingent debt from Tier 1 capital and to recognise non-contingent subordinated debt as Tier 2 capital. Public submissions have raised a number of issues for further consideration.
The measurement and aggregation of bank asset risk is another important component of bank capital regulation, and a consultation paper on that topic is expected to be released later this year. The adequacy of capital is assessed relative to a bank’s exposure to loss. Banks’ asset exposures are adjusted for risk and banks may use ‘standardised’ or ‘internal models’ approaches to do so. The internal models approach, which can only be used with the Reserve Bank’s consent, allows the risk-adjustment to take account of a richer set of information where the risk modelling is assessed as sufficiently robust and reliable.
The international experience is that the internal models approach consistently produces lower capital requirements than the standardised approach, and the same is true in New Zealand. In principle, lower capital may be justified if there is genuinely better risk discrimination with the internal models approach. However, it can be difficult to ascertain the degree to which that is the case in practice. The forthcoming consultation paper will address these issues, including whether the internal models approach should be restricted to avoid too large a gap in capital
outcomes between banks using the standardised model and those using internal models.
In addition to consulting on the definition of capital and the aggregation of bank risk, the Reserve Bank will consult on the calibration of capital requirements (i.e. the minimum level of required capital) in the last stage of the capital review.
Review of the bank directors’ attestation regime
The Reserve Bank conducted a review of the bank directors’ attestation regime in 2017 to assess its effectiveness, improve understanding of banks’ approaches to governance, and gain further insights into some of the concerns that the IMF raised in its May 2017 report on the New Zealand Financial Sector Assessment Programme (FSAP).
The Reserve Bank’s approach to regulation and supervision of banks rests on three forms of discipline: (i) the role of directors in managing their bank’s risks (self-discipline); (ii) ensuring that market participants have the appropriate information, incentives and mechanisms to influence bank behaviour in a way that contributes to a sound and efficient banking sector (market discipline); and (iii) where material market failures exist, the Reserve Bank relies on formal rules and requirements to incentivise financial institutions to act in ways that align with the public interest (regulatory discipline).
44RESERVE BANK OF NEW ZEALAND / FINANCIAL STABILITY REPORT, NOVEMBER 2017
The directors’ attestation regime is a key mechanism to promote self-discipline and market discipline. Currently, directors are required to attest in their disclosure statements that after due enquiry:
• the disclosure statement contains all the required information and is accurate;
• all of the bank’s conditions of registration have been complied with;
• credit exposures to connected persons were not contrary to the interests of the bank; and
• the bank had systems in place to adequately monitor and control the material risks of the banking group, and that those systems were being properly applied.
In the 2017 FSAP report, the IMF highlighted that although the first three statements above are supported by detailed policies, the Reserve Bank has issued limited guidance regarding what constitutes adequate risk management arrangements.
The Reserve Bank engaged external consultants to assist with the attestation review. The review is now finished and was conducted in four parts:
1. a survey of directors of the 15 locally incorporated banks;
2. a desk-based documentation review for 11 selected banks;
3. interviews with directors, senior managers and auditors of the 11 selected banks; and
4. workshops attended by directors and senior managers of 15 locally incorporated banks, which served as a forum to discuss the review’s initial findings.
The consultants assessed the directors’ attestation regime to be ‘largely effective’ at present in achieving its purpose. However, the review identified individual bank weaknesses and highlighted the reliance on there being high quality directors on bank boards and the importance of an open and honest bank culture. The review also noted the limited nature and extent of verification undertaken by the Reserve Bank.
The Reserve Bank recently provided written feedback to banks on the review and will continue to assess the options to enhance the effectiveness of the directors’ attestation regime. The Reserve Bank will elaborate on the findings of the review and outline its proposed response in 2018.
Dashboard approach to quarterly disclosures
In September, the Reserve Bank confirmed that it would introduce the ‘dashboard’ to enhance reporting of quarterly disclosures for locally incorporated banks.1 The dashboard was formally consulted on at the end of 2016. It aims to enhance bank disclosures by making them available in a timelier manner and in a format that facilitates accessibility
1 See https://www.rbnz.govt.nz/-/media/ReserveBank/Files/Publications/Policy-development/Banks/Dashboard-approach-to-quarterly-disclosure/Dashboard%20%20Background%20note%20for%20August%202017%20Final%20Version.pdf?la=en

45RESERVE BANK OF NEW ZEALAND / FINANCIAL STABILITY REPORT, NOVEMBER 2017
and comparison across banks. Enhanced disclosure is expected to improve the market discipline and self-discipline pillars of the Reserve Bank’s three-pillar approach to prudential supervision.
The dashboard will be updated quarterly and hosted on the Reserve Bank’s website. The quarterly dashboard disclosures will replace the need for locally incorporated banks to prepare disclosure statements for the first and third quarters of the financial year.
Industry workshops were held in May and August 2017 to further discuss key design issues raised by banks during the formal consultation. Industry participation in these workshops was helpful in refining and finalising the dashboard approach. The main refinements included the timing of publication, measures to ensure data quality, and the metrics to be included in the dashboard. The content of the dashboard will be kept under review. Some relevant additional items that are not currently available with sufficient data quality or comparability may be added in due course, after consulting stakeholders. The Reserve Bank considers that the finalised dashboard will deliver meaningful improvements to banks’ public disclosures, and create efficiencies by using the new, higher-quality data sourced from private reporting to feed into public disclosures. Publication of the dashboard is targeted for late May 2018, using data from the March quarter 2018.
Update on other regulatory projects
Financial Market Infrastructures (FMI) Bill
Financial market infrastructures (FMIs) include payment systems, settlement systems, central counterparties, and central securities depositories. FMIs are essential for efficient functioning of the financial system, but can also be a source of systemic risk. Earlier this year, the Government agreed to adopt a new legislative regime for the regulation of FMIs. The new regime will focus on the regulation of ‘designated’ FMIs (i.e. those that are identified as systemically important or that have opted into the regulatory regime). The Reserve Bank and Financial Markets Authority will have various regulatory powers with respect to designated FMIs. These include the ability to set regulatory standards for designated FMIs, powers to oversee their rules, investigative and enforcement powers, and crisis management powers. The focus on designated FMIs is designed to ensure that regulatory interventions under the framework are proportionate to the risks posed by different FMIs, and to minimise compliance costs and barriers to entry. Legislation establishing the new framework is currently being drafted.
Update on the IMF’s 2016 Financial Sector Assessment Programme
In May 2017, the IMF released the findings and recommendations from its 2016 review of New Zealand’s financial system, known as the FSAP. There were well over 100 recommendations, most of which were relevant for the Reserve Bank given its broad range of financial system responsibilities. In July, the Reserve Bank published a Bulletin article that explained the FSAP and its findings and recommendations in

46RESERVE BANK OF NEW ZEALAND / FINANCIAL STABILITY REPORT, NOVEMBER 2017
more detail.2 The Reserve Bank is considering all the relevant findings and recommendations, and the extent to which implementation would further support the Reserve Bank’s statutory purpose of promoting and maintaining a sound and efficient financial system.
The Reserve Bank continues to believe that its three-pillar framework, and an emphasis on self-discipline and market discipline, has served New Zealand well. That said, there are a number of recommendations that, if adopted, may support financial system outcomes and the statutory purpose of the Reserve Bank. Examples include greater independent verification or validation of information provided by regulated institutions, and a greater use of thematic reviews. The findings of the FSAP have endorsed the proposed legislative regime for regulating FMIs and influenced the review of the bank directors’ attestation regime.
IPSA review
Public consultation on the Issues Paper: Review of Insurance (Prudential Supervision) Act 2010 closed on 30 June 2017. Forty-two submissions were received from a range of stakeholders, including the larger insurance companies and law firms. Stakeholders generally noted that the IPSA framework has improved the soundness of the insurance sector, and suggested there is little need for fundamental change in the legislation. Comments and suggestions on where the framework could be enhanced or compliance costs reduced were made in all areas discussed in the Issues Paper. The Reserve Bank has published a brief feedback statement that sets out the preliminary plan for phase 2 of the review and noted how some new issues raised by stakeholders will be considered. The preliminary plan, which depends on resource availability and other priorities, extends over the next 18 months and will initially
2 See https://www.rbnz.govt.nz/-/media/ReserveBank/Files/Publications/Bulletins/2017/2017jul80-06.pdf
focus on: the entities and business lines subject to IPSA; treatment of overseas insurers; disclosure and financial strength rating provisions; and a framework for the appropriate use of regulatory mechanisms.
Outsourcing policy
In September, the Reserve Bank released its revised outsourcing policy that applies to locally incorporated registered banks whose New Zealand liabilities, net of amounts owed to related parties, exceeds $10 billion. The policy review followed a stocktake of banks’ compliance with the 2006 outsourcing policy that found inconsistencies in the application of the policy. The lack of consistent compliance with the policy could compromise system stability in stress situations and complicate attempts to manage the failure of a registered bank.
The revised outsourcing policy sets requirements that banks need to meet when outsourcing particular functions and services, especially if the service provider is a related party of the bank. The Reserve Bank undertook extensive consultation with the banking industry and other interested parties throughout the policy development process, including public consultations in 2015 and 2016. Consultation was also undertaken on the exposure draft of the revised policy. The final policy was significantly shaped and amended by the feedback provided by the banks and other stakeholders.
New conditions of registration for banks, incorporating the revised outsourcing policy, took effect from 1 October 2017 and allow for a five year transition path to full compliance.
47RESERVE BANK OF NEW ZEALAND / FINANCIAL STABILITY REPORT, NOVEMBER 2017
Debt-to-income limit consultation
Between June and August, the Reserve Bank consulted publicly on the prospect of adding a mortgage serviceability restriction, such as a limit on high debt-to-income (DTI) lending, to the Memorandum of Understanding (‘MoU’) on macro-prudential policy between the Minister of Finance and the Governor of the Reserve Bank.3 The MoU defines the objectives and instruments of the Reserve Bank’s macro-prudential policy framework. The consultation paper outlined the reasons why the Reserve Bank considers a serviceability restriction to be a useful complement to the existing tools in the MoU. Serviceability restrictions could reduce potential risks to financial stability arising from high household mortgage debt.
A summary of and response to submissions on the consultation was published in November.4 The feedback to the consultation will be used by the Reserve Bank and the Treasury in discussing potential amendment to the MoU with the Minister of Finance. This will now take place in the context of phase two of the Reserve Bank Act review.
Foreign margin requirements for over-the-counter derivatives
Reforms are being implemented across the G20 to improve transparency and mitigate risk in over-the-counter derivatives markets. These reforms require market participants to exchange margin on their bilateral exposures to protect against current and future counterparty credit risk. Although the Reserve Bank does not plan to mandate exchanges of
3 See: https://www.rbnz.govt.nz/financial-stability/macro-prudential-policy/mou-between-minister-of-finance-and-governor-of-rbnz
4 See: https://www.rbnz.govt.nz/regulation-and-supervision/banks/consultations-and-policy-initiatives/active-policy-development/serviceability-restrictions-as-a-potential-macroprudential-tool-in-new-zealand
margin at this stage, large New Zealand entities that trade in international markets must comply with the requirements and expectations of their foreign counterparties, for whom margin exchange is becoming standard practice.
The Reserve Bank and the Ministry of Business, Innovation and Employment (MBIE) are considering the implications of foreign margin requirements on New Zealand businesses. A consultation was recently undertaken to assess the need and scope for domestic legislative reforms to support compliance with offshore margin requirements and secure New Zealand’s access to key financial counterparties, products and markets. Respondents broadly supported the consultation’s proposals to exempt certain types of derivatives margin from parts of New Zealand’s insolvency and preference regimes. Several respondents called for exemptions to be broadened and sought more comprehensive legislative reforms in the longer term. The Reserve Bank and MBIE are currently considering responses and working to finalise policy proposals.
Review of mortgage bond collateral standards
The Reserve Bank is reviewing the standards for mortgage bonds to be eligible collateral in Reserve Bank liquidity management operations. The review is focused on improvements to the quality, liquidity and scalability of these bonds. Making mortgage bond instruments simpler, more transparent and comparable could also improve market depth and thus reduce the need for counterparties to transact with the Reserve Bank. The Reserve Bank launched a project in early 2017 to assess the options for improvements and has recently published a consultation paper.5 As
5 See https://www.rbnz.govt.nz/markets-and-payments/domestic-markets/review-of-mortgage-bond-collateral-standards
48RESERVE BANK OF NEW ZEALAND / FINANCIAL STABILITY REPORT, NOVEMBER 2017
part of the consultation process the Reserve Bank proposes to introduce a safer and more liquid mortgage bond standard.
Trans-Tasman crisis simulation exercise
In early September, the agencies comprising the Trans-Tasman Council on Banking Supervision conducted a crisis exercise that involved the simulated distress of a fictitious large bank operating in both New Zealand and Australia.6 The exercise tested aspects of the cross-border framework for crisis management that have been developed by the Council in recent years to promote effective cooperation and collaboration between Australian and New Zealand authorities. Lessons from the exercise will be considered by the Council to further develop cross-border crisis management and resolution arrangements.
Review of insurer disclosures
The Reserve Bank’s prudential supervision regime places strong emphasis on disclosure of information to ensure adequate market discipline. In June, the Reserve Bank published a report on the findings from a review of a sample of insurers’ disclosures of solvency and financial strength ratings. The review found an overall disappointing level of compliance, although insurers’ response to feedback has been generally positive. The Reserve Bank will be undertaking further assessment of compliance with disclosure obligations to ensure that standards improve and compliance obligations are met.
6 New Zealand members of the Council are the Financial Markets Authority, the Reserve Bank, and the New Zealand Treasury. Australian members are the Australian Prudential Regulation Authority, the Australian Securities and Investments Commission, Australian Treasury, and the Reserve Bank of Australia.

49RESERVE BANK OF NEW ZEALAND / FINANCIAL STABILITY REPORT, NOVEMBER 2017
Appendix 1 Reserve Bank enforcement actions
The Reserve Bank has responsibility for enforcing the regulatory obligations of sectors, including banking, insurance, payments and settlements, non-bank deposit-taking, anti-money laundering and countering the financing of terrorism. The Reserve Bank monitors entities’ compliance with the obligations it oversees. In responding to identified non-compliance by an entity, the Reserve Bank may consider it appropriate to take enforcement action. During the past 12 months, the Reserve Bank has undertaken the following public enforcement actions:
December 2016 – a formal warning was issued to Aotearoa Credit Union (‘ACU’) under section 80 of the Anti-Money Laundering and Countering Financing of Terrorism Act 2009 (‘the Act’), and an enforceable undertaking was accepted from ACU under section 81 of the Act, to review its AML/CFT Programme and amend the identified deficiencies.
Appendix 2 Presentations May-October 2017
The Reserve Bank presented on financial stability and related topics to the following sectors and regions: Financial services (6) Auckland, Wellington
Sectors (5) Auckland, Hamilton, Christchurch, Invercargill
Advisers (10) Auckland, Palmerston North, Wellington, Singapore
Business groups (5) Auckland, Tauranga, Rotorua, Wellington, Queenstown
Universities (3) Dunedin, Wellington
Appendices

50RESERVE BANK OF NEW ZEALAND / FINANCIAL STABILITY REPORT, NOVEMBER 2017
Registered bank’s name Market share1
Total assets ($bn)
Credit ratings3 Ultimate parent Country of parent
S&P Fitch Moody’s Australia and New Zealand Banking Group Limited (B)2
0.9 4.7 AA- AA- Aa3 Australia and New Zealand Banking Group Limited
Australia
ANZ Bank New Zealand Limited 31.0 159.4 AA- AA- A1 Australia and New Zealand Banking Group Limited
Australia
Commonwealth Bank of Australia (B) 0.8 4.2 AA- AA- Aa3 Commonwealth Bank of Australia AustraliaASB Bank Limited 17.2 88.6 AA- AA- A1 Commonwealth Bank of Australia AustraliaBank of Baroda (New Zealand) Limited 0.0 0.1 - BBB- - Bank of Baroda IndiaBank of China (New Zealand) Limited 0.1 0.6 A - A1 Bank of China ChinaBank of India (New Zealand) Limited 0.0 0.1 BB+ - - Bank of India IndiaBank of New Zealand 18.5 95.3 AA- AA- A1 National Australia Bank AustraliaChina Construction Bank (New Zealand) Limited
0.2 1.2 A - A1 China Construction Bank China
Citibank N A (B) 0.5 2.4 A+ A+ A1 Citigroup Inc. USAHeartland Bank Limited 0.8 4.0 - BBB - Heartland New Zealand Limited New
ZealandIndustrial and Commercial Bank of China (New Zealand) Limited
0.2 1.1 A - A1 Industrial and Commercial Bank of China
China
JPMorgan Chase Bank NA (B) 0.2 1.1 A+ AA- Aa3 JPMorgan Chase & Co USAKiwibank Limited 4.0 20.6 A AA A1 Kiwi Group Holdings Limited New
Zealand
Kookmin Bank (B) 0.1 0.4 A+ - A1 Kookmin Bank South Korea
(continued)
Table 1Registered banks’ market share, credit rating, parent and country of parent
Appendix 3

51RESERVE BANK OF NEW ZEALAND / FINANCIAL STABILITY REPORT, NOVEMBER 2017
Coöperatieve Rabobank U.A. (B) 0.6 3.3 A+ AA- Aa2 Coöperatieve Rabobank U.A. NetherlandsRabobank New Zealand Limited 2.2 11.3 A - - Coöperatieve Rabobank U.A. Netherlands
Southland Building Society 0.8 4.1 - BBB - Southland Building Society New Zealand
The Bank of Tokyo-Mitsubishi UFJ Limited (B) 0.7 3.5 A+ A A1 Mitsubishi UFJ Financial Group
Inc. Japan
The Co-operative Bank Limited 0.5 2.4 - BBB - The Co-operative Bank Limited New Zealand
The Hongkong and Shanghai Banking Corporation Limited (B) 1.0 5.2 AA- AA- Aa2 HSBC Holdings PLC UK
TSB Bank Limited 1.4 7.0 - A- - TSB Community Trust New Zealand
Westpac Banking Corporation (B) 1.4 7.1 AA- AA- Aa3 Westpac Banking Corporation AustraliaWestpac New Zealand Limited 16.9 87.1 AA- AA- A1 Westpac Banking Corporation Australia
1 Each registered bank’s assets as a proportion of the total assets of the banking system, as at 30 June 2017. Weights do not sum to 100 due to rounding.
2 Banks marked (B) operate in New Zealand as branches of overseas incorporated banks. All other banks are incorporated in New Zealand.
3 Credit ratings are as at 2 October 2017.
Source: Registered banks’ Disclosure Statements.
Registered bank’s name Market share1
Total assets ($bn)
Credit ratings3 Ultimate parent Country of parent
S&P Fitch Moody’s

52RESERVE BANK OF NEW ZEALAND / FINANCIAL STABILITY REPORT, NOVEMBER 2017
Financial system liabilities$bn 2007 2008 2009 2010 2011 2012 2013 2014 2015 2016 *2017
BanksHouseholds 75 86 88 93 101 110 120 131 145 156 161Other residents 93 115 105 104 106 107 106 110 121 128 129Non-residents 57 71 65 64 66 66 65 68 74 79 78Other liabilities and equity 107 132 121 120 122 123 122 126 139 147 147Total 332 403 380 382 395 407 414 435 479 510 515
Other non-bank lending institutionsHouseholds 12 9 9 7 5 3 3 3 3 3 3Other residents 8 7 6 7 7 6 5 6 6 6 7Other liabilities and equity 12 11 9 7 5 5 5 5 5 5 5Total 31 27 24 21 17 14 14 14 14 14 15
Funds under managementHousehold assets 74 61 66 69 69 78 87 96 107 118 123Other sector assets 1 3 6 6 8 8 9 14 16 17 20Total 75 64 72 76 77 86 97 109 122 134 143
Total financial system liabilities 438 494 475 478 489 506 524 558 616 659 673
Table 2New Zealand financial system assets and liabilities (as at 31 December)

53RESERVE BANK OF NEW ZEALAND / FINANCIAL STABILITY REPORT, NOVEMBER 2017
Financial system assets$bn 2007 2008 2009 2010 2011 2012 2013 2014 2015 2016 *2017
BanksHouseholds 153 163 169 173 177 184 195 205 220 240 247Other residents 137 184 161 160 168 170 167 177 199 208 208General government 14 19 17 17 18 18 18 19 21 22 22Other non-residents 21 28 25 25 26 26 26 27 31 32 28Other assets 6 8 7 7 8 8 8 8 9 9 10Total 332 403 380 382 395 407 414 435 479 510 515
Other non-bank lending institutionsHouseholds 14 12 10 9 7 6 6 6 6 6 7Other residents 13 12 11 9 7 6 6 6 7 6 6Other assets 4 4 3 3 3 2 2 2 2 2 2Total 31 27 24 21 17 14 14 14 14 14 15
Funds under managementDomestic assets 43 39 41 42 44 49 53 56 63 68 72Overseas assets 32 25 31 34 33 37 44 53 60 67 71Total 75 64 72 76 77 86 97 109 122 134 143
Total financial system assets 438 494 475 478 489 506 524 558 616 659 673
* As at end-June.
Source: RBNZ Bank Balance Sheet, RBNZ Household Assets and Liabilities Survey, RBNZ Managed Funds Survey, RBNZ Standard Statistical Return.
Notes: General insurance companies are not included. Household assets include non-resident assets. A number of series have been revised as a result of the introduction of the new Bank Balance Sheet in early 2017. Totals and sub-totals may not add due to rounding.


