119
Financial Stability Report Issue No. 22 Reserve Bank of India January 2021

Financial Stability ReportIssue No. 22
Reserve Bank of India January 2021

© Reserve Bank of India All rights reserved. Reproduction is permitted provided an acknowledgment of the source is made.
The publication can also be accessed through Internet at https://www.rbi.org.in
Feedback of this report may be mailed to [email protected]
Published by Financial Stability Unit, Reserve Bank of India, Mumbai 400 001 and designed and printed at ACME Packs & Prints (I) Pvt. Ltd., A Wing, Gala No.73, Virwani Industrial Estate, Goregaon - East, Mumbai - 400 063.

Foreword The COVID-19 pandemic has changed the world, with a devastating impact on human and economic conditions. Governments, central banks and other public agencies across countries have responded unprecedentedly to mitigate its impact. A multi-speed recovery is struggling to gain traction, infusing hope, reinforced by positive news on vaccine development. Nonetheless, a second wave of infections and new mutations of the virus have spread heightened uncertainty, threatening to stall the fragile recovery.
India’s banking system faced the pandemic with relatively sound capital and liquidity buffers built assiduously in the aftermath of the global financial crisis and buttressed by regulatory and prudential measures. Notwithstanding these efforts, the pandemic threatens to result in balance sheet impairments and capital shortfalls, especially as regulatory reliefs are rolled back. In addition, banks will be called to meet the funding requirements of the economy as it traces a revival from the pandemic. Consequently, maintaining the health of the banking sector remains a policy priority and preservation of the stability of the financial system is an overarching goal.
Congenial liquidity and financing conditions have shored up the financial parameters of banks, but it is recognised that the available accounting numbers obscure a true recognition of stress. It is in this context that banks must exploit the congenial financial conditions and the conducive policy environment to plan for capital augmentation and alterations in business models that address emerging challenges for future expansion, while strengthening the capacity to absorb shocks and supporting the revival of the economy.
In spite of rising public commitments for mitigating the impact of the pandemic, fiscal authorities are also witnessing revenue shortfalls. The resultant expansion in the market borrowing programme of the Government has imposed additional pressures on banks. The borrowing programme has been managed smoothly so far, with the lowest borrowing costs in 16 years and elongation of maturity. The corporate sector has also raised substantial funds from financial markets amidst easy financing conditions, which have been mainly used for deleveraging and building up precautionary buffers. As growth impulses take root, the private sector capex cycle should revive as existing capacities get utilised and new capacities are added. This will require the financial system to intermediate expanded growth requirements of Indian business. Meanwhile, the disconnect between certain segments of financial markets and the real economy has been accentuating in recent times, both globally and in India. Stretched valuations of financial assets pose risks to financial stability. Banks and financial intermediaries need to be cognisant of these risks and spillovers in an interconnected financial system.
Information technology platforms and digital payment systems have provided considerable support for business continuity and smooth functioning during the pandemic. More investment is required by all stakeholders for building robust IT platforms and technologies for operational purposes as well as for fortifying public confidence in digital banking, especially when the financial landscape is rapidly embracing new technologies. In fact, digital technologies have been identified as a bright spot in India’s economic prospects.
We have been scarred by the COVID-19 pandemic and the task ahead is to restore economic growth and livelihood. Financial stability is a precondition for supporting this mission. This issue of Financial Stability Report should act as a springboard for further policy action. As we take up these challenges, we have to remain unwaveringly focussed on taking India to a new destiny.
Shaktikanta Das Governor
January 11, 2021


Financial Stability Report January 2021
ContentsPage No.
Foreword
List of Select Abbreviations i-iii
Overview 1
Chapter I : Macro-Financial Risks 3 Introduction 3 Global Backdrop 3 Macroeconomic Developments and Outlook 3 Capital Flows and Exchange Rate Volatility 9 COVID-19 and Bank Capital 9 Commodity Market Spillovers 11 Domestic Macro-Financial Developments 12 Recent Macroeconomic Developments 13 Corporate Sector 17 Banking System – Liquidity Profile 19 Banking System – Wholesale Credit 20 Consumer Credit 23 Bank Credit to MSME Sector 24 Banking Stability Indicator 25 Developments in Non-bank Financial Intermediation 25 Housing Market 29 Systemic Risk Survey 29
Chapter II : Financial Institutions: Soundness and Resilience 31 Introduction 31 Scheduled Commercial Banks 31 Asset Quality and Capital Adequacy 33 Sectoral Asset Quality 35 Credit Quality of Large Borrowers 36 Resilience – Macro Stress Tests 37 Sensitivity Analysis 41 Bottom-up Stress Tests – Derivatives Portfolio 47 Scheduled Urban Cooperative Banks 48 Stress Tests – Credit risk 48 Stress Tests – Liquidity Risk 48 Non-banking Financial Companies 49 Stress Tests 49 Interconnectedness 49 Network of the Financial System 49 Contagion Analysis 57

Page No.
Contents
Chapter III : Regulatory Initiatives in the Financial Sector 60 Introduction 60 Global Developments 60 Capital 60 Liquidity 61 Expected Credit Loss (ECL) provisioning 61 Operational Risk in Banks 61 COVID-19 and the Insurance Sector 62 Other International Regulatory Developments in the Banking Sector 62 Holistic Review of the Market Turmoil in March 2020 62 Global Monitoring Report on Non-bank Financial Intermediation 63 Climate Change Risk 63 Risks from Outsourcing and Third-party Relationships 63 Development of Capital Markets in Emerging Markets 63 Domestic Developments 64 Initiatives from Regulators/Authorities 64 Credit Related Measures 64 Support for the NBFC sector 65 Insurance Sector 65 Customer Protection 65 Resolution and Recovery 66 Other Regulatory Developments 66 Bilateral Netting of Contracts 66 Launch of RTGS 24x7 66 Remittances through Indian Payment Systems 66 Digital Transactions – Streamlining Quick Response (QR) Code Infrastructure 67 Oversight Framework for Financial Market Infrastructures (FMIs) and Retail Payment Systems (RPS) 67 LIBOR Transition in the Indian Context 67 Cyber Security 68 Risk Mitigation Measures 68 Deposit Insurance 69 Corporate Insolvency Resolution Process 69 Mutual Funds 71 Capital Mobilisation - Equity and Corporate Bonds 72 Credit Ratings 72 Commodity Derivatives Market 73 Insurance 75 Pension Funds 76 International Financial Services Centres Authority 77
Annex 1: Systemic Risk Survey 78
Annex 2: Methodologies 84
Annex 3: Important Regulatory Measures 97

Financial Stability Report January 2021
Page No.
LIST OF BOXES
1.1 Reviving and Restructuring the Corporate Sector 8
2.1 Stress testing in Pandemic Times: Some Country Experiences 38
LIST OF CHARTS
1.1 GDP Growth in Major Economies 4
1.2 Growth Projections for Key Economies 4
1.3 Policy Response to COVID-19 4
1.4 Balance sheets of the US Federal Reserve (Fed) and European Central Bank (proportion to their respective GDPs)
5
1.5 Financial Stress Index 5
1.6 North American Investment Grade (IG) CDS 5
1.7 North American High Yield (HY) CDS 6
1.8 Movement in Key Interest Rates in the US and Eurozone 6
1.9 Growth in Money Market Mutual Fund Assets in the US and Eurozone 6
1.10 US: LIBOR- OIS Spread (3-month tenor) 7
1.11 US: OIS-T-Bill Spread (3-month tenor) 7
1.12 12-month Forward Earnings Per Share (EPS) Estimates – Major Global Equity Indices 7
1.13 Price Earnings Multiples of Major Global Indices 8
1.14 EMs’ Daily Flows (28-day moving average) 9
1.15 Net Issuance of EM Bonds Abroad 9
1.16 Emerging Market Bond Returns (Annualised) 9
1.17 Exchange Rates in AEs and EMs 10
1.18 US and European Contingent Convertible Additional Tier-1 (AT-1) Index 10
1.19 Cross-Country Aggregate Loans 10
1.20 Movements in Aggregate Loan Loss Reserves 10
1.21 Aggregate CET-1 Ratios 11
1.22 Brent Crude Oil Spot and Futures 11
1.23 Movement in Commodity Indices 11
1.24 Food Price Index 12
1.25 Net Borrowings (Centre and State Governments) and 10-year Benchmark G-sec Yield 13
1.26 India’s Merchandise Trade Growth 14
1.27 Policy Rate and Spread over Market Repo 14
1.28 Spreads of Term – Risk-free Rate and Unsecured Rate over Operating Overnight Rate 14
1.29 Slope (short-term) of the Sovereign Yield Curve: 3-month to 3-year 15
1.30 Slope (3y-7y) of OIS and G-Sec Curves 15
1.31 Foreign Portfolio Investment Flows 15
1.32 Trend in Foreign and Domestic Investments in Equity Cash Segment 16

Page No.
Contents
1.33 Exchange Rate Movements and Realised Volatility 16
1.34 1-year and 3-year MIFOR - OIS Spread 17
1.35 Ratio of Interest to PBIDTA and OA for Non-financial Companies (Ownership-wise) 17
1.36 Ratio of Interest to PBIDTA and OA for Non-PSU Non-financial Companies (Size-wise) 18
1.37 Ratio of Interest to PBIDTA and OA for Non-PSU Non-financial Companies (Rating-wise) 18
1.38 Balance sheet Growth and Banking Sector Exposure - Listed Non-PSU Non-Financial Companies
18
1.39 Long-term Ratings and Number of Obligors 19
1.40 Credit by SCBs – Annual Growth (y-o-y) by Type 20
1.41 Market Capitalisation of CPSEs and Credit Offtake 21
1.42 Exposure Distribution of Non-PSU Non-Financial Obligors 21
1.43 SMA Distribution of Wholesale Non-PSU Non-financial Obligors Portfolio between August and November, 2020
22
1.44 Approval Rates by Lender Category 23
1.45 Inquiry Volumes by Risk Tier 24
1.46 Banking Stability Map 25
1.47 Movements in Rebased Net Asset Values of three Schemes 25
1.48 Average Assets under Management of Debt Schemes and Average Daily Outstanding System Liquidity
26
1.49 Returns on Liquid fund Index 26
1.50 Investment in G-Sec/T-Bills/ CBLO and spread products movement 26
1.51 Issuances of Commercial Paper and Non-Convertible Debentures - Non-PSU Obligors 27
1.52 Outstanding Commercial Papers and Non-Convertible Debentures - Non-PSU Obligors 27
1.53 CP Issuances – Non-PSU Non-financial Obligors – Rating-wise 27
1.54 NCD Issuances – Non-PSU Non-financial Obligors – Rating-wise 28
1.55 Short-term Money Market Rates 28
1.56 House Launches and Sales 29
1.57 Unsold Inventory and Inventory Overhang 29
1.58 Price Growth Trends in Key Housing Markets 29
2.1 Select Performance Indicators 32
2.2 Select Asset Quality Indicators 34
2.3 Sectoral Asset Quality Indicators 35
2.4 Select Asset Quality Indicators of Large Borrowers 36
2.5 Macroeconomic Scenario Assumptions for H2:FY20-21 and H1:FY21-22 38
2.6 Projection of SCBs’ GNPA Ratios 40
2.7 CRAR Projections 40
2.8 Projection of CET 1 Capital Ratio 41

Financial Stability Report January 2021
2.9 Credit Risk - Shocks and Outcomes 42
2.10 Credit Concentration Risk: Individual Borrowers – Exposure 43
2.11 Credit Concentration Risk: Group Borrowers – Exposure 43
2.12 Credit Concentration Risk: Individual Borrowers – Stressed Advances 44
2.13 Trading Book Portfolio: Bank Group-wise 45
2.14 Yield Curves and Shift in Yields Across Tenors 45
2.15 HTM Portfolio – Disaggregated by Type 46
2.16 Equity Price Risk 47
2.17 Liquidity Risk – Shocks and Outcomes 47
2.18 Mark-to market (MTM) of Total Derivatives Portfolio – Select banks, September 2020 48
2.19 Impact of Shocks on Derivatives Portfolio of Select Banks 48
2.20 Credit Risk in NBFCs – System Level 50
2.21 Bilateral Exposures between Entities in the Financial System 50
2.22 Network Plot of the Financial System, September 2020 51
2.23 Net Receivables (+ve) / Payables (-ve) by Institution 51
2.24 Inter-bank Market 52
2.25 Different Bank Groups in the Inter-bank Market, September 2020 52
2.26 Composition of Fund based Inter-bank Market 52
2.27 Network Structure of the Indian Banking System (SCBs+ SUCBs) – September 2020 53
2.28 Connectivity Statistics of the Banking System (SCBs) 54
2.29 Gross Receivables of AMC-MFs from the Financial System 54
2.30 Gross Receivables of Insurance Companies from the Financial System 55
2.31 Gross Payables of AIFIs to the Financial System 55
2.32 Gross Payables of NBFCs to the Financial System 56
2.33 Gross Payables of HFCs to the Financial System 56
2.34 Contagion Impact of Macroeconomic Shocks (Solvency Contagion) 59
3.1 Trends in Resource Mobilisation by Mutual Funds and AUM 71
3.2 Capital Mobilisation in the Primary Market 72
3.3 Capital Mobilisation through Equity and Debt Issues 72
3.4 Debt Issues of Listed Companies in terms of Rating Action 73
3.5 Distribution of Rating Downgrades- Sector wise 73
3.6 Movement of Global Commodity Price Indices 73
3.7 Domestic and International Commodity Futures Indices 74
3.8 Select Sectoral Indices 74
3.9 Commodity Derivatives Turnover at Exchanges (Futures and Options) 74
3.10 New Life Insurance Business Premiums - Growth (m-o-m) 75
Page No.

Contents
LIST OF TABLES
1.1 Growth Projections for 2020 and 2021 4
1.2 Fiscal Deficit as per cent of GDP – Key Regions 7
1.3 Fiscal Deficit as per cent of GDP of Low Income Regions 12
1.4 LCR Profiles across Bank Groups 19
1.5 Growth in Wholesale Credit 20
1.6 Disaggregated Wholesale Credit Growth based on Ownership 20
1.7 Disaggregated Wholesale Credit Growth in Non-PSU obligors 21
1.8 SMA Transition Matrix for Wholesale Portfolio of a Constant Sample of Non-PSU Non-financial Obligors between August and September 2020
22
1.9 SMA Transition Matrix for Wholesale Portfolio of a Constant Sample of Non-PSU Non-financial Obligors between August and November 2020
22
1.10 Sectoral Credit Growth 23
1.11 Growth in Inquiry volume 23
1.12 Growth in Consumer Credit (y-o-y, per cent) 24
1.13 Volume of Inquiries for MSME Credit (y-o-y, per cent) 24
1.14 Activity in MSME sector (y-o-y, per cent) 24
1.15 Trends in Resource Mobilisation by Mutual Funds 25
1.16 Issuances and Near-term Maturities of CPs and NCDs of Non-PSU Non-financial Obligors 28
2.1 Sector-wise New Loans by SCBs 32
2.2 Decline in System Level CRAR 44
2.3 Tenor-wise PV01 Distribution of AFS Portfolio 45
2.4 OOI - Profit/(loss) on Securities Trading 45
2.5 Tenor-wise PV01 Distribution of HFT portfolio 46
2.6 Interest Rate Risk – Bank-groups - Shocks and Impacts 46
2.7 Contagion losses due to Bank failure – September 2020 57
2.8 Contagion Losses due to NBFC Failure – September 2020 58
2.9 Contagion Losses due to HFC Failure – September 2020 58
3.1 LIBOR Linked Exposures of Various Financial Contracts in India 67
3.2 Insured Deposits of Cooperative Banks 69
3.3 Corporate Insolvency Resolution Process 69
3.4 Sectoral Distribution of CIRPs as on September 30, 2020 70
3.5 Outcome of CIRPs initiated Stakeholder-wise, as on September 30, 202 70
3.6 CIRPs Ending with Orders for Liquidation till September 30, 2020 71
3.7 SIPs in 2020-21 71
3.8 Segment-wise Turnover in Commodity Derivatives (Futures and Options) 75
3.9 Growth in Health Insurance sector 76
3.10 Business in COVID specific Insurance Products 76
3.11 Subscribers and AUM: NPS and APY 77
Page No.

Financial Stability Report January 2021
List of Select Abbreviations
AEs Advanced Economies
AFS Available For Sale
APY Atal Pension Yojana
ARRs Alternative Reference Rates
AUM Assets Under Management
BCBS Basel Committee on Banking Supervision
BIS Bank for International Settlement
BoE Bank of England
BOJ Bank of Japan
BSI Banking Stability Indicator
CC Cash Credit
CCIL Clearing Corporation of India Ltd
CD Corporate Debtor
CDD Customer Due Diligence
CDS Credit Default Swaps
CET Common Equity Tier
CIRP Corporate Insolvency Resolution Process
CLM Co-Lending Model
CM Clearing Member
CoCo Contingent Convertible
COVID-19 Corona Virus Disease 2019
CP Commercial Paper
CPSEs Central Public Sector Enterprises
CRAR Capital to Risk-weighted Assets Ratio
CSF Consolidated Sinking Fund
CVA Credit Valuation Adjustment
DCCBs District Cooperative Central Banks
DIIs Domestic Institutional Investors
DPD Days Past Due
D-SIIs Domestic Systemically Important Insurers
EBA European Banking Authority
EBPT Earnings before provisions and taxes
ECB European Central Bank
ECBs External Commercial Borrowings
ECL Expected Credit Loss
ECLGS Emergency Credit Line Guarantee Scheme
EMDEs Emerging Markets and Developing Economies
EMs Emerging Markets
EPS Earnings Per Share
EU European Union
EURIBOR Euro Interbank Offer Rate
EWS Early Warning Signal
FAIS Forensic Accounting and Investigation Standards
FATF Financial Action Task Force
FBs Foreign Banks
FFPI FAO Food Price Index
FI Financial Institutions
FMI Financial Market Infrastructures
FPC Financial Policy Committee
FPI Foreign Portfolio Investment
FSB Financial Stability Board
FSDC Financial Stability and Development Council
FSDC-SC Financial Stability and Development Council - Sub Committee
FSR Financial Stability Report
GDP Gross Domestic Product
i

GFC Global Financial Crisis
GNPA Gross Non Performing Assets
G-Secs Government Securities
GVA Gross Value Added
HFCs Housing Finance Companies
HFT Held for Trading
HQLA High Quality Liquid Assets
HTM Held to Maturity
IAIS International Association of Insurance Supervisors
IASB International Accounting Standards Board
IBA Indian Banks Association
IBC Insolvency and Bankruptcy Code
ICAI Institute of Chartered Accountants of India
ICR Interest Coverage Ratio
IEA International Energy Agency
IFSCA International Financial Services Centres Authority
IMF International Monetary Fund
InvITs Infrastructure Investment Trusts
IOSCO International Organization of Securities Commissions
IPDIs Innovative Perpetual Debt Instruments
IPEs Insolvency Professional Entities
IRDAI Insurance Regulatory and Development Authority of India
LAF Liquidity Adjustment Facility
LCR Liquidity Coverage Ratio
LIBOR London Interbank Offer Rate
LT Long Term
LTV Loan to Value
MCLR Marginal Cost of fund based Lending Rate
MFs Mutual Funds
MIFOR Mumbai Interbank Forward Offer Rate
ML Money Laundering
MMMFs Money Market Mutual Funds
MPR Monetary Policy Report
MSF Marginal Standing Facility
MSME Micro, Small and Medium Enterprises
MTM Mark To Market
NAV Net Asset Values
NBFCs Non Banking Financial Companies
NBFI Non Banking Financial Intermediation
NCCDs Non Centrally Cleared OTC Derivatives
NCD Non Convertible Debenture
NCFE National Centre for Financial Education
NEFT National Electronic Fund Transfer
NII Net Interest Income
NIM Net Interest Margin
NNPA Net Non Performing Assets
NPCI National Payments Corporation of India
NPS National Pension System
OD Overdraft
OFR-FSI Office of Financial Research’s Financial Stress Index
OMO Open Market Operations
OOI Other Operating Income
OTR Order to Trade Ratio
PCG Partial Credit Guarantee
ii
Abbreviations

Financial Stability Report January 2021
iii
PCR Provision Coverage Ratio
PDIs Perpetual Debt Instruments
PEPP Pandemic Emergency Purchase Programme
PFMIs Principles for Financial Market Infrastructures
PM Performance Metrics
PNCPS Perpetual Non-Cumulative Preference Shares
PoA Point of Arrival
PSB Public Sector Bank
PSMOR Principles for the Sound Management of Operational Risk
PSU Public Sector Undertaking
PVB Private Sector Bank
QR Quick Response
RBNZ Reserve Bank of New Zealand
REIT Real Estate Investment Trusts
RoA Return on Assets
RoE Return on Equity
RPS Retail Payment Systems
RRBs Regional Rural Banks
RTGS Real Time Gross Settlement
SA Standardised Approaches
SCB Scheduled Commercial Bank
SD Standard Deviation
SDLs State Development Loans
SEBI Securities and Exchange Board of India
SFTs Securities Financing Transactions
SICR Significant Increase in Credit Risk
SIP Systematic Investment Plans
SLCC State Level Coordination Committee
SMS Short Message Service
SOP Standard Operating Procedure
SPV Special Purpose Vehicle
SRS Systemic Risk Survey
ST Short Term
StCB State Cooperative Bank
SUCBs Scheduled Urban Cooperative Banks
T-Bill Treasury Bill
TF Terrorist Financing
TLTRO Targeted Long-term Repo Operations
TM Trading Member
UCBs Urban Cooperative Banks
UNCTAD United Nations Conference on Trade and Development
UPI Unified Payments Interface
US-Fed US Federal Reserve Board
VCIP Video Based Customer Identification Process
VRR Voluntary Retention Route
WTO World Trade Organisation


1
Financial Stability Report January 2021
Overview
The Financial Stability Report (FSR) is published
biannually and includes contributions from all the
financial sector regulators. Accordingly, it reflects
the collective assessment of the Sub–Committee
of the Financial Stability and Development Council
(FSDC-SC) on risks to financial stability.
Macro-Financial Risks
This FSR, the second of the biannual publications
for the year 2020-211, is being released at a time
when the global economy is still suffering from the
pain inflicted by the COVID-19 pandemic, though a
fragile and hesitant journey to normalcy is struggling
to gain traction across countries, buffeted by second
waves of the virus including fear of more virulent
strains. Policy actions, which in the initial phase
of the pandemic, were geared towards restoring
normal functioning and mitigating stress, are now
getting increasingly oriented towards supporting the
recovery and preserving the solvency of businesses
and households. Capital flows to emerging
economies have seen a sharp rebound with India
emerging as a preferred habitat. Even as the positive
news on vaccine development has underpinned
optimism on the outlook, hopes have been marred
by the adverse developments referred to earlier,
which are particularly threatening macroeconomic
and financial prospects across Europe, the US and
some other countries.
Domestic Economy and Markets
On the domestic front, while policy measures have
ensured the smooth functioning of markets and
financial institutions, managing market volatility
amidst rising spillovers has become challenging.
Movements in certain segments of the financial
markets are not in sync with the developments
in the real sector. Aggregate banking sector credit
remained subdued, pointing to vestiges of risk
aversion even as aggregate demand in the economy
is mending and reviving. In particular, credit flows
to the manufacturing sector have been lukewarm
at a time when output of the sector is emerging
out of a prolonged contraction. The focus of the
policy efforts is shifting from provision of liquidity
and guarantees to supporting growth – including
consumption and investment. Although a recovery
in economic activity from the lows of March
and April 2020 is underway, it is far from being
entrenched and output remains below pre-pandemic
levels. Congenial financial conditions have been put
in place to support the recovery. The overarching
objective is to mitigate the impact of COVID-19 and
strengthen the return to sustainable and inclusive
growth with macroeconomic and financial stability.
Financial Institutions: Soundness and Resilience
Bank credit growth (Y-o-Y), which had declined to 5.7
per cent in 2019-20, remains sluggish; on the other
hand, deposit growth has remained robust in the
double digits, reflecting precautionary saving in the
face of high uncertainty.
Return on assets (RoA) and return on equity (RoE)
for SCBs have improved across all bank groups
and capital to risk-weighted assets ratios (CRARs)
improved by 110 bps over March 2020 levels to 15.8
per cent in September 2020. Gross non-performing
assets (GNPA) and net NPA (NNPA) ratios, which
were edging down from September 2019 levels, fell
further to 7.5 per cent and 2.1 per cent, respectively,
by September 2020. The overall provision coverage
ratio (PCR) improved substantially to 72.4 per
cent from 66.2 per cent over this period. These
1 The previous issue of FSR was released on July 24, 2020.

Overview
2
improvements were aided significantly by regulatory
dispensations extended in response to the COVID-19
pandemic.
Macro-stress tests2 for credit risk show that SCBs’
GNPA ratio may increase from 7.5 per cent in
September 2020 to 13.5 per cent by September 2021
under the baseline scenario. If the macroeconomic
environment deteriorates, the ratio may escalate to
14.8 per cent under the severe stress scenario. These
projections are indicative of the possible economic
impairment latent in banks’ portfolios. Stress tests
also indicate that SCBs have sufficient capital at the
aggregate level even in the severe stress scenario
but, at the individual bank level, several banks
may fall below the regulatory minimum if stress
aggravates to the severe scenario. The need of the
hour is for banks to assess their respective stress
situations and follow it up with measures to raise
capital proactively.
At the aggregate level, the CRAR of scheduled urban
co-operative banks (SUCBs) deteriorated from 9.70
per cent to 9.24 per cent between March 2020 and
September 2020. NBFCs’ credit grew at a tepid pace
of 4.4 per cent on an annual (Y-o-Y) basis as compared
with the growth of 22 per cent a year ago.
Network analysis indicates that the total outstanding
bilateral exposures among constituents of the
financial system grew marginally after witnessing a
sharp fall as at end-June 2020. SCBs continued to have
the largest bilateral exposure in the Indian financial
system in September 2020. As regards inter-sectoral
exposures, asset management companies/mutual
funds (AMC-MFs), followed by insurance companies,
remained the most dominant fund providers in
the system, while NBFCs were the biggest receiver
of funds, followed by housing finance companies
(HFCs).
The continuing shrinking of the inter-bank market
as well as better capital position of banks led to
decline in risk levels due to contagion effects.
Regulatory Initiatives and Other Developments in the Financial Sector
The Reserve Bank, other financial sector regulators
and the government have undertaken extraordinary
measures to mitigate the impact of the pandemic.
Several innovative measures were rolled out to
ease balance sheet stress for borrowers and lending
institutions. Alongside these pandemic induced
actions, the pace of ongoing efforts to address
systemic gaps and to develop and strengthen various
parts of the financial system, did not slow down.
Assessment of Systemic Risk
In the latest systemic risk survey (SRS), respondents
rated institutional risks, which comprise asset quality
deterioration, additional capital requirements, level
of credit growth and cyber risk, among others, as
‘high’. All other major risk groups, viz., global risks,
macroeconomic risks and financial market risks
were perceived as being ‘medium’ in magnitude.
This represents a clear shift from the April/May 2020
survey results in which all the above groups were
rated as ‘high’ risk.
2 FSR for mid-year presents stress test projections for next March and end-year FSR gives the projections for next September.
3
Financial Stability Report January 2021
Chapter I
Macrofinancial Risks
Economic activity has begun making a hesitant and uneven recovery from the unprecedented steep decline in the wake of the COVID-19 pandemic. Active intervention by central banks and fiscal authorities has been able to stabilise financial markets but there are risks of spillovers, with macrofinancial implications from the disconnect between certain segments of financial markets and real sector activity. In a period of continued uncertainty, this has implications for the banking sector as its balance sheet is linked with corporate and household sector vulnerabilities.
Introduction
1.1 As global economic activity makes a hesitant
and uneven recovery from the unprecedented
COVID-19 pandemic on the back of extraordinary
policy responses by monetary, fiscal and regulatory
authorities, the focus is shifting to developing
policies and strategies to nurse deleteriously
affected sectors back to health and normalcy. The
trade-off that will inevitably confront authorities
and get sharper going forward is between cliff
effects of terminating exceptional measures and risk
a deterioration of the repair and healing that has
been achieved so far, and ramp effects that involve
more graduated withdrawal of policy support but
also the moral hazard of making various economic
agents more reliant on policy stimuli and for longer,
eventually locking in authorities into forbearance
and liquidity traps.
1.2 By all counts, policy authorities have been able
to restrain the immediate risks from the destructive
macrofinancial feedback loops of the pandemic,
but incipiently pre-pandemic vulnerabilities have
intensified and pose headwinds to a fuller recovery.
Also, as stated earlier, support measures may have
unintended consequences as reflected, for instance,
in the soaring equity valuations disconnected from
economic performance. These deviations from
fundamentals, if they persist, pose risks to financial
stability, especially if recovery is delayed.
1.3 Against this backdrop, this chapter begins with
an overview of global and domestic macroeconomic
and financial market developments. Section I.1
adresses global macrofinancial developments
and the outlook. Section I.2 deals with domestic
macrofinancial developments, emerging fiscal and
corporate sector risks, and the evolving dynamics
of bank and non-bank financial intermediation. The
chapter concludes by drawing on the responses to
the Reserve Bank’s half-yearly systemic risk survey.
I.1 Global Backdrop
I.1.1 Macrofinancial Developments and Outlook
1.4 Global economic activity remained besieged
by the COVID-19 pandemic, more recently by
the second wave that has forced re-clamping of
lockdowns across Europe and a resurgence of
infections in the US. This is casting a shadow on
the strong rebound of economic activity in Q3:2020.
The International Monetary Fund (IMF) placed
global growth in 2020 at (-)4.4 per cent, followed
by a recovery in 2021 to 5.2 per cent which is,
nonetheless, insufficient to lift output above the
2019 level in most advanced and emerging market
and developing economies (EMDEs), excluding China

4
Chapter I Macrofinancial Risks
(Table 1.1 and Chart 1.1). Optimism about global
growth in 2021 (Chart 1.2), on the back of vaccine
roll-out, is now tempered by the realisation that
production and distribution constraints will allow
only a gradual move towards mass vaccination.
1.5 The response of public authorities to the
pandemic has varied across advanced economies
(AEs) and emerging market and developing
economies (EMDEs) (Chart 1.3). Since July 2020,
policy measures have shifted to fine-tuning and
extending strategies to nurse severely affected
sectors back to health. Given the substantial risk
of a looming solvency crisis eroding the strength
of the business sector, authorities have turned to
providing fiscal support to rebuild businesses. The
European Union (EU), through its long-term budget
and other initiatives, has designed a fiscal package
of Euro 1.8 trillion, the largest stimulus package
ever to be funded through the budget. In Japan,
fiscal authorities have introduced a fresh stimulus
package of about Yen 73.6 trillion, of which about
Yen 40 trillion is dedicated to fiscal spending on
loans, investments and other measures. The US
has approved a US$ 2.3 trillion coronavirus relief
and government spending package in the wake of
a second resurgence of the pandemic and slowing
employment numbers in November 2020.
Chart 1.1: GDP Growth in Major Economies
Source: Bloomberg.
Table 1.1: Growth Projections for 2020 and 2021
(in per cent)
Release period Advanced Economies
EMDEs World
2020 2021 2020 2021 2020 2021
January 2020 1.6 1.6 4.4 4.6 3.3 3.4
April 2020 -6.1 4.5 -1.0 6.6 -3.0 5.8
June 2020 -8.0 4.8 -3.0 5.9 -4.9 5.4
October 2020 -5.8 3.9 -3.3 6.0 -4.4 5.2
Source: World Economic Outlook, IMF.
Chart 1.2 : Growth Projections for Key Economies
Note: * - Projected.Source: World Economic Outlook (WEO)-October 2020 update, IMF.
Chart 1.3 : Policy Response to COVID-19
Note: 1. Updated till January 3, 2021. 2. Higher scores implying government response being more restrictive.Source: University of Oxford’s Coronavirus Government Response Tracker.

5
Financial Stability Report January 2021
1.6 Given the unprecedented nature of the
crisis, central bank interventions spanned interest
rate reductions, funding liquidity and market
liquidity expansion, asset purchases, credit easing,
macroprudential policies and swap lines. They have
persisted with and in some jurisdictions intensified
these measures since July 2020. Illustratively, in a
series of measures, the European Central Bank (ECB)
has ramped up its corpus for purchase of sovereign
bonds (including principal repaid), extended the
horizon of such purchases and recalibrated the
conditions of targeted longer-term refinancing
operations. As a result, policy rates have touched
historic lows and have even descended to negative
territory and balance sheets have expanded to levels
hitherto unobserved (Chart 1.4).
1.7 These actions have eased financial conditions
across the globe back to pre-COVID levels. The Office
of Financial Research’s Financial Stress Index1 (OFR
FSI) moved further into negative territory since
July 2020, indicating below average stress levels
(Chart 1.5). Easing financial conditions have also
directly impacted insurance on corporate credit,
with high-grade and high-yield credit default swaps
(CDS) in the US back at their pre-COVID levels and
the 3-year over 5-year CDS spread changing course
after the COVID-19 induced inversion (Charts 1.6
& 1.7). European CDSs were similar, approaching
1 The OFR FSI published by Office of Financial Research, an independent bureau within the United States Department of the Treasury, incorporates five categories of indicators: credit, equity valuation, funding, safe assets and volatility. The FSI shows stress contributions by three regions: United States, other advanced economies, and emerging markets.
Chart 1.4 : Balance sheets of the US Federal Reserve (Fed) and European Central Bank (proportion to their respective GDPs)
Source: Bloomberg.
Chart 1.5 : Financial Stress Index1
Source: Bloomberg.
Chart 1.6 : North American Investment Grade (IG) CDS
Source: Bloomberg.

6
Chapter I Macrofinancial Risks
pre-COVID levels. While easier financial conditions
do support growth prospects in the short run, the
longer-term impact in terms of encouraging leverage
and inflating asset prices may give rise to financial
stability concerns.
1.8 The massive infusion of central bank liquidity
in the wake of the pandemic has led to a sharp
decline in term rates (Chart 1.8), which has brought
down borrowing costs substantially, but has also
compressed net interest rate margins of banks,
driving down their profitability2. Even as deposit
yields have fallen, assets under Money Market
Mutual Funds (MMMFs) have grown, indicative
of a search for yield (Chart 1.9). Such risk taking
among institutional investors, specifically in illiquid
investments to earn targeted returns, may lead to
build-up of financial vulnerabilities, with adverse
implications for financial stability.
Chart 1.7 : North American High Yield (HY) CDS
Source: Bloomberg.
Chart 1.9 : Growth in Money Market Mutual Fund Assets in the US and Eurozone
Source: Federal Reserve Bank of St. Louis Economic Research & European Central Bank Statistical Data Warehouse.
2 Bank for International Settlements (2020): “Box A: Banks through Covid-19”, BIS Quarterly Review, September 2020.
Chart 1.8 : Movement in Key Interest Rates in the US and Eurozone
Source: Bloomberg.

7
Financial Stability Report January 2021
1.9 Other fault lines have also emerged in the
wake of the COVID-19 pandemic-induced economic
disruptions. For one, the pandemic has severely
affected government revenue receipts which, in
turn, has inflated sovereign borrowing to fund sharp
increases in fiscal deficits across all geographies,
especially in the advanced economies (Table 1.2).
This has aggravated global debt vulnerabilities.
1.10 Second, it has exposed vulnerabilities in
treasury markets. Following the onset of the
pandemic, the 3-month overnight indexed swap
(OIS)-US Treasury Bill (T-Bill) spread turned negative
persistently, pointing to unprecedented illiquidity
in US money markets which, in turn, had a cascading
influence on global risk appetite, affecting borrowing
rates and flows (Charts 1.10 & 1.11). The unsecured
rate’s spread over the OIS rate, also widened sharply.
While these spreads have reverted to positive territory
more recently, the developments brought into sharp
relief the implications for emerging markets (EMs),
should the frailties of the US treasury market give
rise to US dollar shortages in non-US markets.
1.11 Third, COVID-19 has accentuated the credit
risk of firms and households, which is impacting
short term corporate earnings. Yet, strong growth
expectations remain firmly embedded in equity
prices (Charts 1.12 & 1.13). Developments that lead
to re-evaluation of corporate earnings prospects will
have significant implications for global flows, going
forward.
Table 1.2: Fiscal Deficit as per cent of GDP – Key Regions
2019 2020*
Advanced economies -3.01 -14.39
Emerging and Middle-Income Asia -6.00 -11.40
Emerging and Middle-Income Europe -0.65 -7.18
Emerging and Middle-Income Latin America -4.00 -11.09
Emerging Market and Middle-Income Economies -4.83 -10.72
Note: * - Projected.Source: IMF Fiscal Monitor;
Chart 1.12 : 12-month Forward Earnings Per Share (EPS) Estimates – Major Global Equity Indices
Source: Bloomberg.
Chart 1.10 : US: LIBOR-OIS Spread (3-month tenor)
Source: Bloomberg.
Chart 1.11 : US: OIS-T-Bill Spread (3-month tenor)
Source: Bloomberg.

8
Chapter I Macrofinancial Risks
Chart 1.13 : Price Earnings Multiples of Major Global Indices
Source: Bloomberg.
1.12 The policy endeavour is moving from
mitigating stress to repair and recovery. Accordingly,
a policy shift is underway from broad-based liquidity
support to more targeted measures to support
households and firms and to maintain the health of
the financial system (Box 1.1).
Box 1.1: Reviving and Restructuring the Corporate Sector
Policymakers around the world took quick and bold measures through injection of liquidity, reduction in cost of funds, regulatory forbearance, consumption supporting stimulus packages and other measures to contain the immediate adverse effects of the COVID-19 pandemic.
The pandemic has ushered in several structural changes in consumption patterns and business operations, the impact of which is still unfolding. For some businesses, solvency concerns have become acute. Accordingly, authorities need to be in readiness to alter their responses with new tools and processes to further support the corporate sector.
In this context, the Group of Thirty (G30)3, has set out key universal principles on reviving and restructuring the corporate sector post-COVID in its mid-December 2020 report. They include (a) the productive use of scarce resources; (b) encouraging necessary or desirable business transformations; (c) harnessing private sector expertise; and (d) appropriately timing the interventions. It primarily focusses on using targeted credit programs, encouraging infusion of equity/equity-like investments into viable companies and enabling restructuring of balance sheets rapidly and inexpensively through suitable bankruptcy and workout procedures.
Insurance for corporates generally revolves around protection against business interruption, but virtually always excludes coverage of losses from a pandemic as quantification and pricing of unpredictable risks
is difficult. The report examines government-backed business interruption insurance, either directly or via reinsurance, where fiscal capacity acts as a limiting factor.
In jurisdictions with strong private financial institutions and deep capital markets, prioritising financial restructuring through mobilising various mechanisms may be feasible. In some emerging economies with relatively weaker institutional frameworks, however, the focus is likely to be on extending sovereign borrowing capacity for government-backed support. Emerging economies also face constraints in the form of large employment-intensive unorganised sectors affected by the pandemic and the embedded risks of adverse selection in designing the support schemes. Also, any restructuring of corporate credit obligations would possibly require conversion of some credit claims to equity, where selection of projects eligible for such conversion is critical. Hence, while the “optimal response” may vary by jurisdiction, the report stresses the urgency to act before the underlying strength of the business sector is completely eroded.
References
Group of Thirty (2020): Reviving and Restructuring the Corporate Sector Post-Covid: Designing Public Policy Interventions. Working Group on Corporate Sector Revitalisation. Special Report (December 15).
International Monetary Fund (2020). Global Financial Stability Report. October.
3 The G30 is an independent global body of economic and financial leaders from the public and private sectors and the academia.

9
Financial Stability Report January 2021
I.1.2 Capital Flows and Exchange Rate Volatility
1.13 After the unprecedented outflows in the
earlier part of the year following the outbreak of
the pandemic, a hesitant recovery in capital flows
to emerging markets (EMs) began in June 2020
and picked up strongly following positive news on
COVID-19 vaccines (Chart 1.14). The response of
foreign investors to primary issuances from EMs
has been ebullient (Chart 1.15). Anticipating the
COVID-19 vaccine induced economic boost, US
yields of intermediate tenors (2– and 5-year) have
started edging higher4. This could have implications
for future portfolio flows to EMs.
1.14 EM local currency bond portfolio returns in
US$ terms have been lower than local currency as
well as hedged returns since early 2020 as emerging
market currencies have softened against the US$
(Chart 1.16). This has led to sluggishness in EM local
currency bond flows even as global bond markets
have been pricing in a prolonged economic slowdown
and benign inflationary conditions in Europe and
US. In this scenario, any significant reassessment of
either growth or inflation prospects, particularly for
the US, can be potentially destabilising for EM local
currency bond flows and exchange rates.
I.1.3 COVID-19 and Bank Capital
1.15 The world faced the COVID-19 crisis with
much better capitalised banks than was the case
during the global financial crisis of 2008; the latter
actually provided an impetus for stronger capital
buffers. The COVID-19 crisis has significantly altered
capital costs of banks and has posed challenges for
both banks and prudential authorities. Bank stock
Chart 1.14 : EMs’ Daily Flows (28-day moving average)
Note : Till December 28,2020.Source : International Institute of Finance (IIF).
4 Observations based on US yield curve as on December 3, 2020.
Chart 1.15 : Net Issuance of EM Bonds Abroad
Source: IIF, Bloomberg.
Chart 1.16 : Emerging Market Bond Returns (Annualised)
Note: Information has been obtained from sources believed to be reliable, but J.P. Morgan does not warrant its completeness or accuracy. The index is used with permission. The index may not be copied, used or distributed without J.P.Morgan’s prior written approval. Courtesy J.P. Morgan Chase & Co., Copyright 2020.Source: JP Morgan.

10
Chapter I Macrofinancial Risks
prices plummeted as the crisis unfolded (BIS, 20205) and their subsequent recovery was subdued as they generally remained well below other global stock prices and also below their own pre-crisis levels. Similarly, price-to-book ratios fell, plateauing at around unity, on average, for banks outside Europe. Less profitable banks in Europe and Japan had ratios below unity pre-crisis and they deteriorated even further thereafter. Although US and European banks’ Contingent Convertible (CoCo) bonds have recovered sharply from COVID-19 induced lows (Chart 1.18), funding costs for such instruments are still recovering and are high relative to their pre-COVID levels (BIS, op.cit).
1.16 While globally regulators have encouraged banks in their jurisdictions to dip into their buffers to support the local economy, this has not yielded desired results uniformly. An analysis of key balance sheet parameters of banks across regulatory jurisdictions through the pandemic throws up interesting contrasts. While the growth in bank loans in Asia remained robust (largely driven by a sharp recovery in China), US banks have been aggressive in loan loss provisioning and UK and European banks lead in common equity tier-1 (CET-1) capital
augmentation (Charts 1.19 to 1.21).
Chart 1.17 : Exchange Rates in AEs and EMs
Source: Bloomberg.
5 BIS (2020): “Markets rise despite subdued economic recovery”, BIS Quarterly Review, September.
Chart 1.20 : Movement in Aggregate Loan Loss Reserves
Source: Bloomberg..
Chart 1.18 : US and European Contingent Convertible Additional Tier-1 (AT-1) Index
Source: Bloomberg.
Source: Bloomberg.
Chart 1.19 : Cross-Country Aggregate Loans

11
Financial Stability Report January 2021
I.1.4 Commodity Market Spillovers
1.17 There was considerable excitement in
the energy markets at the news of an effective
vaccine candidate against COVID-19. Oil prices
initially surged and the Brent front month futures
price bounced back to over US$ 45/barrel (bbl)
(Chart 1.22), a level not seen since the beginning
of September. However, the International Energy
Agency (IEA), in its November monthly report, did
not anticipate a significant impact of the vaccine
in the first half of 2021. The surging caseloads,
particularly in Europe and the US and the consequent
recent announcements of lockdowns and other
containment measures in many countries, have led
to lower estimates for global oil demand. The IEA
estimates global oil demand to average 91.3 million
barrels /day (mb/d) in 2020, which is 8.8 per cent
lower than in 2019. In 2021, demand is expected to
recover to 97.1 mb/d which would still be about 3
per cent below the pre-COVID level in 2019.
1.18 The recent news on vaccine development
has kindled hopes of a recovery of demand outside
of China in 2021 which will support metal prices,
although the likely pull back in demand both in
Europe and the US due to the second pandemic
induced lockdown constitutes a near term risk to
that outlook. The expectation that, going forward,
a moderation in China’s demand will be offset by
improvements in the rest of the world, is supporting
base metal prices, which have registered a sharp
recovery in Q3:2020 from pandemic induced lows
(Chart 1.23).
1.19 Volatility in commodity prices has a large
impact on commodity exporting countries 91 per
cent of which are categorised as low income. A
significant commodity price downswing spanning
mineral, energy and agricultural products over
2013-17 has severely stretched the fiscal balance
Chart 1.21 : Aggregate CET-1 Ratios
Source: Bloomberg.
Chart 1.22 : Brent Crude Oil Spot and Futures
Source: Bloomberg.
Chart 1.23 : Movement in Commodity Indices
Source: Bloomberg.

12
Chapter I Macrofinancial Risks
of such countries (UNCTAD 2019) (Table 1.3). As
a result, their fiscal support in response to the
pandemic has been minimal. A continued slump
in commodity prices is likely to have severe
implications for fiscal sustainability of the low-
income countries, which are also among the most
indebted.
1.20 Global food commodity prices, as tracked
by the FAO Food Price Index6 (FFPI), rose sharply
in November 2020, continuing the reversal since
May 2020 (Chart 1.24). All sub-indices of the FFPI
registered gains in November, with the vegetable
oil sub-index rising the most, followed by those of
sugar, cereals, dairy and meat.
I.2 Domestic Macrofinancial Developments
1.21 The large disruption in economic activity
in the wake of the pandemic has resulted in fiscal
strains, corporate sector stresses and weakening of
demand conditions. Rapid and bold responses of the
Reserve Bank, other financial sector regulators and
the Government have contained risks to financial
stability for now. Inward capital flows have been
supported by surplus global liquidity in search
of yields. The full impact of the pandemic on the
domestic economy is still unfolding and the outlook
would depend on the pace of the recovery, especially
for more vulnerable cohorts of small and medium
enterprises.
Chart 1.24 : Food Price Index
Source: Food and Agricultural Organisation.
Table 1.3: Fiscal Deficit as per cent of GDP of Low Income Regions
2015 2016 2017 2018 2019 2020* 2021*
Low-Income Developing Asia -4.22 -3.26 -2.72 -3.89 -4.11 -6.32 -5.67
Low-Income Developing Latin America -1.33 -0.72 -0.64 -1.15 -0.51 -3.93 -3.10
Low-Income Developing Sub-Saharan Africa
-3.76 -4.28 -4.51 -3.98 -4.09 -6.26 -4.86
Source: IMF Fiscal Monitor; * = Projected
6 The FAO Food Price Index (FFPI) is a measure of the monthly change in international prices of a basket of five food commodity groups, viz., vegetables, sugar, cereals, dairy and meat. It consists of the average of five commodity group price indices weighted by the average export shares of each of the groups over 2014-2016.
1.22 In the wake of a sequential 8-quarter
slowdown in domestic activity, the outbreak of
COVID-19 turned out to be a once-in-a-century black
swan event that took the Indian economy down
into one of the deepest contractions among peer
economies in April-June 2020. As per the advance
estimates, GDP is expected to shrink by 7.7 per cent
in 2020-21. Since then, however, an uneven, multi-
speed recovery is gradually taking hold. As a result,
contractions in several sectors are easing, and green
shoots are visible in some others. Surges of capital
flows are being experienced, with the return of risk
appetite and a renewed search for yield. Financial
markets and asset prices have been lifted by this
resurgence of foreign portfolio investment to India.
Alongside a growing optimism on the brightening of

13
Financial Stability Report January 2021
India’s prospects, consumer and business confidence
is turning upbeat with the progressive unlocking and
normalisation of supply disruptions. Nevertheless, global developments, elevated domestic inflation pressures and the incipient festering of financial stress under the camouflage of moratorium, asset recognition standstill and the one-time restructuring, slant the balance of risks to the downside.
I.2.1 Recent Macroeconomic Developments
1.23 Government finances are likely to deteriorate in 2020-21, with revenues badly hit by COVID-19 related disruptions even as expenditure pressure remains high on account of the fiscal stimulus.
1.24 The pandemic-led economic contraction has resulted in revenue shortfall for the Government. During April-November, total receipts of the union government contracted by 17.9 per cent in relation to the previous year. However, revenue collections seem to have turned the corner, as indicated by monthly GST revenues (centre + states) which recorded positive y-o-y growth of 10.2 per cent, 1.4 per cent and 11.6 per cent in the months of October,November and December, respectively. Despite the sizeable fiscal stimulus, total expenditure recorded a modest growth of 4.7 per cent during April-November 2020-21, with revenue expenditure growing at 3.7 per cent and capital expenditure by 12.8 per cent, as part of the additional expenditure requirement has been met by re-allocation of funds from other heads of expenditure.
1.25 For states, lower own revenue receipts, coupled with the additional burden of lower federal transfers, may accentuate downside risks to the outlook in 2020-21. During April-October, total receipts of state governments contracted by 13.7 per cent, which induced a contraction in total expenditure by 4.1 per cent over previous year. The revenue expenditure of states has also not witnessed any sharp upturn during April-October 2020-21 as compared with previous years, despite the fact that
Chart 1.25 : Net Borrowings (Centre and State Governments) and 10-year Benchmark G-sec Yield
states have been at the forefront in the fight against the pandemic. This is primarily attributable to re-
prioritisation of expenditure through means such as
Dearness Allowance (DA) freeze, deferment of part or
full salary, and rationalisation of travel and vehicle
expenses (RBI, 2020). Growth in capital expenditure
of state governments in October 2020, however,
witnessed a positive growth after eight months of
consecutive contraction.
1.26 The large gap between receipts and
expenditure has been met primarily through
additional market borrowings, as reflected in the
revised borrowing calendar announced by the Centre
and higher market borrowing limits given to states
(Chart 1.25). Pressures from the spillover of increased
government borrowings to the bond markets have so
far been contained by the liquidity support measures
of the Reserve Bank, besides increase in the limits
of ways and means advances, as also relaxation of
rules governing withdrawals from the Consolidated
Sinking Fund (CSF) to ease the redemption pressure
on states.
1.27 With the weakening of domestic demand in
H1:2020-21, the current account surplus increased
to 3.1 per cent of GDP (0.1 per cent in Q4:2019-20).
India’s merchandise exports contracted by 21.2

14
Chapter I Macrofinancial Risks
per cent in H1:2020-21 due to demand and supply
disruptions caused by the COVID-19 pandemic.
Imports shrank even more sharply – by 39.7 per
cent. Subsequently, exports have shown some signs
of revival as the rate of contraction moderated to
4.8 per cent in Q3:2020-21, with non-oil exports
expanding by 2.6 per cent during the quarter. With
the gradual unlocking of the economy, the decline
in imports has also moderated to 5.6 per cent during
Q3: 2020-21 (Chart 1.26). Based on provisional data,
there was a sharp rebound in imports by 7.6 per
cent in December 2020. The turnaround in imports
was broad-based as 20 out of 30 major commodities
registered an expansion led by gold, electronic goods,
chemicals, pearls and precious stones, machinery
and vegetable oils. There has been a narrowing of
the trade deficit to US$ 24.1 billion in H1 from US$
88.9 billion a year ago; during Q3:2020-21, the trade
deficit at US$ 34.3 billion was lower than US$ 37.1
billion in the same quarter last year. India’s trade
outlook may improve in line with the gradual pick
up in global trade activity as projected by the World
Trade Organisation (WTO), though downside risks
remain.
1.28 The Reserve Bank’s balance sheet expanded
considerably in its efforts to deal with the economic
consequences of the pandemic. The unprecedented
infusion of liquidity has affected the near-end term
curve. Since March 2019, the overnight secured
funding rate for market transactions, which
was 10-15 bps lower than the LAF reverse repo
rate, has fallen sharply from late October 2020
(Chart 1.27). The unsecured overnight call rate,
which was generally in the reverse repo-MSF
corridor has also fallen below the reverse repo rate
from around the same time. Consequently, the
risk-free money market term structure, specifically
at the short end of the curve, has consistently
touched negative spreads over the reverse repo rate
(Chart 1.28). The state of the term curve largely
reflects the surplus liquidity conditions.
Chart 1.28 : Spreads of Term – Risk-free Rate and Unsecured Rate over Operating Overnight Rate
Source: Bloomberg.
Chart 1.26 : India’s Merchandise Trade Growth
Source: Directorate General of Commercial Intelligence & Statistics (DGCI&S).
Chart 1.27 : Policy Rate and Spread over Market Repo
Source: CEIC.

15
Financial Stability Report January 2021
1.29 Since January 2019, the overnight market repo
rate (weighted average) has softened from 6.37 per
cent to 3.03 per cent while the 3-month T-bill-3-year
G-Sec spread has widened from 43 bps to 133 bps,
implying that the softening of 3-month T-bill rates
has been the main driver of the steeper yield curve
up to the 3-year tenor (Chart 1.29).
1.30 A comparison of the slopes of the overnight
indexed swap (OIS) curve relative to the G-Sec curve
over the 3-year and 7-year tenors reveals considerable
churn in the underlying G-Sec curve, although it has
generally been steeper relative to the OIS curve in
the wake of the pandemic (Chart 1.30). Most of the
advanced economies also witnessed significant rise
in spreads in the wake of the pandemic.
1.31 With the onset of the COVID-19 pandemic,
global financial conditions had tightened sharply
in March 2020, precipitating a selloff by portfolio
investors which was unprecedented both in scale
and pace. Foreign portfolio investment (FPI) flows
have, however, rebounded since June 2020 propelled
by risk-on sentiments, weakening of the US dollar
and increased global monetary and fiscal stimulus
(Chart 1.31). Net FPI inflows were at an all-time
Chart 1.29 : Slope (short-term) of the Sovereign Yield Curve: 3-month to 3-year
Source: Bloomberg.
Chart 1.30 : Slope (3y-7y) of OIS and G-Sec Curves
Source: Bloomberg.
a. Annual b. Monthly
Chart 1.31: Foreign Portfolio Investment Flows
Source: National Securities Depository Limited (NSDL)

16
Chapter I Macrofinancial Risks
monthly high of US$ 9.8 billion in November
2020. During April-December 2020, net FPI inflow
in equities was US$ 30.0 billion as compared with
inflow of US$ 6.0 billion a year ago – in the debt
segment (general route), there were outflows of
US$ 2.7 billion as compared with inflows of US$
2.9 billion a year ago while under the voluntary
retention route (VRR), there were net inflows of US$
2.3 billion during the same period.
1.32 During March to December 2020, domestic
institutional investors (DIIs), particularly the mutual
funds and the insurance sector, counter-balanced
the actions of FPIs in the equity cash segment
(Chart 1.32a and b).
1.33 The Indian rupee has appreciated since end-
June 2020 due to weakening of the US dollar and
robust capital inflows. The appreciation of the rupee,
however, was modest as compared with emerging
market (EM) peers (Chart 1.33 a). It has traded
with an appreciating bias against the US dollar and
underlying realised volatility has moderated since
mid-October 2020 (Chart 1.33 b).
Chart 1.32: Trend in Foreign and Domestic Investments in Equity Cash Segment
Source: SEBI.
a. FPI vs DII Investments
b. Segregation of DIIs
a: Movements of Currencies against US dollar (end-December 2020 over end-June 2020)
b. Movements in INR and 1-month Historical Realised Volatility
Chart 1.33 : Exchange Rate Movements and Realised Volatility
Source: FBIL, IMF, Central Banks of Taiwan and Indonesia.

17
Financial Stability Report January 2021
1.34 The MIFOR-OIS spread of 1 and 3-year tenors
has, however, widened comparable to pre-COVID
levels, in the positive territory (Chart 1.34). While
comparing an interbank funding curve derived out
of foreign exchange premia and USD LIBOR (MIFOR)
with the evolution of the risk-free policy rate (OIS)
may appear incongruous, it conveys implications for
funding (basis swaps), especially as OIS linked rates
are more susceptible to domestic inflation linked
volatility. In addition, a higher MIFOR level renders
hedging of short USD exposures expensive.
I.2.2 Corporate Sector
1.35 The private corporate business sector had
been experiencing a deterioration in performance
even before the pandemic. This became accentuated
with the outbreak of COVID-19. The brunt of the
pandemic’s impact was concentrated in Q1:2020-21.
Signs of recovery became visible in Q2:2020-21. The
contraction in sales at (-) 4.3 per cent was a significant
improvement from the precipitous decline of 41.1
per cent in the preceding quarter for listed private
manufacturing companies. Enabled by cost cutting as
reflected in a larger reduction in expenses relative to
sales, the manufacturing sector posted improvements
in operating profits and in debt servicing, the latter
being reflected in the improvement in their interest
coverage ratio (ICR). Sales growth of the IT sector, on
the other hand, remained resilient through H1:2020-
21. Although profit margins improved across sectors,
manufacturing companies reduced leverage7 during
H1:2020-21 vis-à-vis the previous half-year and built
up precautionary cash positions, as reflected in the
unaudited balance sheets of 1,249 listed private
manufacturing companies. Further, their investment
in fixed assets remained subdued.
1.36 An analysis of a sample of 2,788 listed non-
financial entities {54 public sector undertakings
Chart 1.34 : 1-year and 3-year MIFOR-OIS Spread
Source: Bloomberg.
7 Measured by debt to equity ratio and the debt to asset ratio.8 Profit before Interest, depreciation, tax, amortization and other adjustments
(PSUs) and 2,734 non-PSU companies} from March
2015 to September 2020 shows significant worsening
of the ratio of interest to PBIDTA & OA 8 in the wake of
the pandemic followed by noticeable improvement
in Q2:2020:21 (Chart 1.35). A disaggregated analysis
of listed non-PSU non-financial companies, based
Chart 1.35 : Ratio of Interest to PBIDTA and OA for Non-financial Companies (Ownership-wise)
Source: Capitaline and RBI Staff Calculations.

18
Chapter I Macrofinancial Risks
on the size of total debt (as per latest balance
sheet data), however, indicates interest to PBIDTA
& OA ratios still above pre-COVID levels for the
large borrowers (Chart 1.36). Rating wise analysis
of a constant sample of 1,195 listed non-PSU non-
financial companies shows a more severe impact
as also sharper recovery for lower rating grades
(Chart 1.37).
1.37 An analysis of a smaller common set of 1,700
listed non-PSU non-financial companies reflects
the increasing role of non-banks in funding their
balance sheet expansion during the period 2017-
2020. The on-balance sheet debt as also total assets
of the companies have grown, even as banking sector
exposure to this cohort has declined significantly
(Chart 1.38). As demand for bank credit by the non-
financial corporate sector has moderated, scheduled
commercial banks’ (SCBs) asset portfolio has grown
on the back of demand for retail loans. Going forward,
resurgence in economic activity may lead to higher
loan demand from the non-financial corporations
for their operational and investment needs.
Chart 1.36 : Ratio of Interest to PBIDTA and OA for Non-PSU Non-financial Companies (Size-wise)
Source: Capitaline and RBI Staff Calculations.
Chart 1.37 : Ratio of Interest to PBIDTA and OA for Non-PSU Non-financial Companies (Rating-wise)
Note: Companies shown as AAA were rated AAA throughout March 2017 to March 2020. Source: Capitaline, Prime Database and RBI Staff Calculations.
Chart 1.38 : Balance sheet Growth and Banking Sector Exposure - Listed Non-PSU Non-financial Companies
Source: Capitaline, CRILC and RBI Staff Calculations.

19
Financial Stability Report January 2021
1.38 The long-term rating momentum (quarterly
upgrades versus downgrades), which has been
consistently declining since Q3:2018-19, showed
a reversal in Q2:2020-21 even though the rating
downgrades continue to outnumber upgrades
(Chart 1.39). The ratings migration, however, also
reflects the temporary discretion given by the SEBI
to credit rating agencies in recognition of default
/ treatment of rescheduling, in the wake of the
pandemic9.
I.2.3 Banking System – Liquidity Profile
1.39 In view of the comfortable liquidity situation
in the system, it is useful to evaluate the adequacy
of unencumbered high-quality liquid assets (HQLA)
for meeting short term liquidity under a significantly
severe liquidity stress scenario. This is reflected
in the movement of the liquidity coverage ratio
(LCR) across bank groups, while recognising that
the negative carry engendered by deployment of
available deposits in HQLA can potentially strain the
future profitability of banks (Table 1.4).
9 SEBI (2020): Circular no. SEBI/HO/MIRSD/CRADT/CIR/P/2020/53 dated March 30 2020 on “Relaxation from compliance with certain provisions of the circulars issued under SEBI (Credit Rating Agencies) Regulations, 1999 due to the COVID-19 pandemic and moratorium permitted by RBI“
Chart 1.39 : Long-term Ratings and Number of Obligors
Note: *: Till December 29, 2020.Source: Prime Database.
Table 1.4: LCR Profiles across Bank Groups (Per cent)
Bank Group Name Liquidity Coverage Ratio (LCR)
31-Mar-20 30-Jun-20 30-Sep-20
Public Sector Banks 148.64 162.34 181.83
Private Sector Banks
Aggregate 130.65 144.42 148.35
Old Private Sector Banks
218.1 231.89 261.05
New Private Sector Banks
123.18 136.64 139.15
Foreign Bank Group 175.17 179.32 201.32
Source: RBI Supervisory Returns.

20
Chapter I Macrofinancial Risks
I.2.4 Banking System – Wholesale Credit
1.40 The profile of wholesale credit in H1:2020-
21 and in Q3:2020-21 (upto November) reflects
a subdued credit situation across bank groups,
pointing to risk aversion and muted demand
weighing on the outlook (Table 1.5). With the
onset of COVID-19, retail credit growth (y-o-y) has
suffered, while wholesale credit growth has held up
though at low levels (Chart 1.40). With stress tests
pointing to a deterioration in asset quality of banks,
early identification of impairment and aggressive
capitalisation is imperative for supporting credit
growth across various sectors alongside pre-emptive
strategies for dealing with potential NPAs.
1.41 For the purpose of wholesale credit analysis
in paras 1.41-1.44, funded amount outstanding
of companies (which account for about 88 per
cent of the total funded amount outstanding to
wholesale obligors) has been considered as opposed
to other organisational forms such as cooperatives,
partnerships, trusts and societies. Credit growth
in respect of public sector undertakings (PSUs)
was comparatively resilient during the pandemic,
although the aggregate PSU credit exposure declined
between March-September, 2020. The market
capitalisation of central public sector enterprises
(CPSEs) has, however, fallen in an otherwise bullish
equity market, implying muted market expectations
about value creation through the PSU channel (Table
1.6 and Chart 1.41).
Table 1.5: Growth in Wholesale Credit (q-o-q unless specified otherwise, per cent)
Sep-19 Dec-19 Mar-20 Jun-20 Sep-20 Nov-20*
PSBs -0.53 -1.08 7.26 -1.51 -2.54 -2.40
PVBs 3.38 0.92 1.27 -0.68 0.94 -1.28
All SCBs 0.67 -0.53 5.85 -0.97 -1.67 -1.36
Note:*Growth over September 2020.
Source: CRILC and RBI staff calculations.
Chart 1.40 : Credit by SCBs – Annual Growth (y-o-y) by Type
Source: Supervisory returns of RBI.
Table 1.6: Disaggregated Wholesale Credit Growth based on Ownership (q-o-q, unless mentioned otherwise) (per cent)
Non-PSU PSU
Dec-19 Mar-20 Jun-20 Sep-20 Nov-20 * Dec-19 Mar-20 Jun-20 Sep-20 Nov-20 *
PSBs -2.5 1.0 -1.7 -2.4 -1.5 1.6 21.5 -2.4 -3.7 -1.7PVBs -0.7 -0.9 -3.0 -1.5 -3.7 14.0 29.4 16.2 13.5 2.6PSBs+PVBs -1.8 0.2 -2.2 -2.0 -2.4 2.9 22.3 -0.3 -1.4 -1.0
Note: *Growth over September 2020. Source: CRILC and RBI staff calculations.

21
Financial Stability Report January 2021
Table 1.7: Disaggregated Wholesale Credit Growth in Non-PSU obligors (q-o-q)(per cent)
PVBs PSBs
Dec-19 Mar-20 Jun-20 Sep-20 Nov-20 * Dec-19 Mar-20 Jun-20 Sep-20 Nov-20 *
AA and above -0.43 5.21 -2.55 -5.86 -7.48 0.19 7.68 -5.22 -6.70 0.05Other Investment Grade 0.16 -5.00 -4.26 -1.66 -4.03 1.42 -0.03 3.07 -1.15 -6.47Below Investment Grade -2.13 2.34 -1.49 3.83 -0.30 -7.42 -5.00 -0.74 2.90 0.02Unrated/NA -1.22 -4.80 -2.88 0.88 -1.18 -3.51 -0.11 -2.45 -3.40 -0.10
Note: *Growth over September 2020. Source: CRILC, Prime Database and RBI staff calculations.
1.42 An analysis of wholesale credit flows, based
on rating grades of non-PSU obligors, reveals sharp
deleveraging (q-o-q) at rating grades ‘AA and above’
during 2020-21, across both PSBs and PVBs. This
reflects a reversal from the position in March 2020
when a rush to access credit was observed in the
early phase of the pandemic breakout (Table 1.7).
1.43 A size-wise disaggregation of wholesale credit
growth points to deleveraging by large wholesale
borrowers even as relatively smaller borrowers (loans
size: `5 - `100 crore) continued to record sustained
credit appetite (Chart 1.42).
1.44 An examination of the transition of a
constant sample of non-PSU non-financial wholesale
performing exposures to SMA status10 between
Chart 1.41 : Market Capitalisation of CPSEs and Credit Offtake
Source: Capitaline.
Chart 1.42 : Exposure Distribution of Non-PSU Non-financial Obligors
Note: Data as on November 2020 is provisional and not audited.Source: CRILC and RBI Staff calculation.
10 For the purpose of this SMA classification, for a borrower with exposure across multiple banks, the worst reported SMA status is considered as the applicable SMA position as on a given date.

22
Chapter I Macrofinancial Risks
August and November 2020 reveals accumulation
of outstanding in SMA-0/1/2 categories, although
the aggregate outstanding has remained flat
(Table-1.8-1.9). A similar accumulation of exposure
is seen when gross outstanding at every SMA cohort
is compared between August and November 2020
(Chart 1.43). Admittedly, the asset classification
standstill inhibits the true underlying economic
categorisation of assets, although the incipient tilt
is towards worsening as indicated by the growth in
balances in the next worse categories for each cohort.
1.45 An analysis of sectoral credit growth11,
specifically to those that are critical in terms of gross
value added (GVA), shows resilient flows to sectors
11 Based on summary monthly data from select 33 scheduled commercial banks, accounting for about 90 per cent of the total non-food credit deployed by all scheduled commercial banks
Chart 1.43 : SMA Distribution of Wholesale Non-PSU Non-financial Obligors Portfolio between August and November, 2020
Note: Data as on August 2020, October 2020 and November 2020 is provisional and not audited.Source: CRILC and RBI Staff calculation.
Table 1.8: SMA Transition Matrix for Wholesale Portfolio of a Constant Sample of Non-PSU Non-financial Obligors between August and September 2020 (in per cent)
Outstanding as on August 31, 2020
(` crore)
Growth in exposure over
August 2020
September 30, 2020
Proportion of assets in various cohorts
0 dpd SMA-0 SMA-1 SMA-2 NPA
Standard (0 dpd) 20,58,349.02 1.02 87.3 10.1 2.3 0.2 0.1
SMA-0 85,385.41 -0.34 45.4 38.9 14.7 1.0 0.0
SMA-1 54,707.60 -0.36 24.5 34.3 23.1 18.1 0.0
SMA-2 40,862.33 0.60 21.9 14.7 3.6 57.7 2.1
Total 22,39,304.36 0.93 83.1 11.8 3.3 1.7 0.1
Note: Data as on November 2020 is provisional and not audited.Source: CRILC and RBI staff calculations.
Table 1.9: SMA Transition Matrix for Wholesale Portfolio of a Constant Sample of Non-PSU Non-financial Obligors between August and November 2020 (in per cent)
Status as on August 31, 2020 Growth in exposure over
September 2020
November 30, 2020
Proportion of assets in various cohorts
0 dpd SMA-0 SMA-1 SMA-2 NPA
Standard (0 dpd) -2.55 85.7 6.5 2.9 4.8 0.1
SMA-0 0.76 59.2 22.9 6.3 11.5 0.2
SMA-1 -1.37 24.9 21.1 10.0 43.9 0.1
SMA-2 0.46 17.0 6.0 5.9 65.0 6.2
Total -2.34 81.9 7.5 3.3 7.2 0.2
Note: Data as on August 2020 and November 2020 is provisional and not audited.Source: CRILC and RBI staff calculations.

23
Financial Stability Report January 2021
such as construction, trade and hospitality, while
bank credit remained muted to the manufacturing
sector (Table 1.10).
I.2.5 Consumer Credit12
1.46 Consumer credit has shown significant
growth in recent years, especially for PVBs. In these
banks, a surge in the consumer credit portfolio has
contributed to increasing their share in the credit
market. The overall demand for consumer credit as
reflected in inquiry volumes13, however, remains
depressed since the onset of the pandemic. PSBs’
activity in the sector has increased considerably
(Table 1.11). The approval rates were low during
Q1:2020-21 but they have improved subsequently,
especially for PSBs (Chart 1.44). Inquiry volumes by
risk tier also show a distinct improvement in favour
Table 1.10: Sectoral Credit Growth
Economic Sector * Share in Gross Value Added
(GVA) (per cent)
Credit growth (y-o-y) (per cent)
Mar-20 Jun-20 Aug-20 Sep-20 Oct-20
Agriculture, forestry and fishing 15.8 4.2 2.4 4.9 5.9 7.4
Mining and quarrying 3.2 5.2 4.3 1.2 0 4.3
Manufacturing 19.1 0.9 0.8 -0.8 -1.0 -2.0
Electricity, gas, water supply & other utility services 2.3 -1.6 0.9 -1.8 -0.9 -1.3
Construction 8.5 4.8 5.6 8.1 4.5 5.1
Trade, repair, hotels and restaurants 13.4 5.5 6.9 12.9 12.1 13.9
Transport, storage, communication & services related to broadcasting 6.9 1.9 6.8 5.8 3.5 -0.8
Financial Services # 6.4 25.9 25.7 17.1 12.5 9.2
Real estate, ownership of dwelling & professional services 16.8 13.8 11.4 9.7 7.4 7.3
Other Services 7.7 -8.1 1.6 -2.0 7.0 10.5
Note: 1. * Covering the sectors in national accounts other than ‘public administration and defence’. 2. # Represents bank credit to the non-bank financial sector.Source: National Accounts Statistics, MoSPI and RBI Supervisory Returns.
Table 1.11: Growth in Inquiry volume (y-o-y, per cent)
Dec-19 Mar-20 Jun-20 Sep-20 Dec-20
Overall 36 -4 -34 -21 -14
PSBs 20 -8 37 20 5
PVBs 26 -21 -45 -13 -10
NBFCs/HFCs 47 6 -42 -37 -25
Source: TransUnion CIBIL
12 Consumer credit includes home loans, loans against property, auto loans, two-wheeler loans, commercial vehicle loans, construction equipment loans, personal loans, credit cards, business loans, consumer durable loans, education loans and gold loans.13 A credit inquiry is created when any borrower applies for a loan and permits the lender to pull their credit record. Inquiries are among the first credit market measures to change in credit record data in response to changes in economic activity.
Chart 1.44 : Approval Rates by Lender Category
Source: TransUnion CIBIL.

24
Chapter I Macrofinancial Risks
of better rated consumers (Chart 1.45). Nevertheless,
the growth in overall loan balances has moderated
considerably after March 2020 (Table-1.12). The 90
days past due (90+ DPD) position has remained
stable but may not reflect the real vulnerability of the
portfolio, in view of the regulatory reliefs granted
following the pandemic.
I.2.6 Bank Credit to MSME Sector
1.47 In sharp contrast to consumer credit, the
MSME14 sector reflected robust growth in inquiry
volumes except during Q1:2020-21 but the growth
(y-o-y) in balances remained sluggish (Tables 1.13
and 1.14), with pullback in terms of balances
outstanding seen in cases of PSBs and NBFCs.
Further, over 90 days past due balances indicate
much higher overdue levels than in the retail sector,
even with the camouflages of regulatory reliefs.
Table 1.12: Growth in Consumer Credit(y-o-y, per cent)
Sep-19 Dec-19 Mar-20 Jun-20 Sep-20
Growth in Balances 16.5 17.3 13.5 7.1 5.1
Growth in Origination Volumes
46.9 48.5 -5.4 -28.0 -9.9
Balance level 90+ DPD % 3.2 3.3 3.2 3.4 3.5
Note: It is a composite consumer credit number aggregated across PSBs.PVBs,NBFCs/HFCs and Fin-Tech.Source: TransUnion CIBIL.
Table 1.13: Volume of Inquiries for MSME Credit(y-o-y, per cent)
Nov-19 Feb-20 May-20 Aug-20 Nov-20
Overall 26.4 21.6 -43.1 12.3 2.8
PSB 49.8 26.3 -1.6 24.7 -2.0
PVB 36.3 18.2 -55.8 0.5 14.0
NBFC & FinTech 47.8 31.0 -85.4 18.0 -20.2
Note: MSME exposure aggregated across PSBs, PVBs, NBFCs/HFCs and FinTech.Source: TransUnion CIBIL.
Table 1.14: Activity in MSME sector(y-o-y, per cent)
Sep-19 Dec-19 Mar-20 Jun-20 Sep-20
Growth in Balances 5.6 4.3 0.7 0.4 -2.3
Balance level 90+ DPD % 11.8 11.8 11.7 12.5 12.0
Source: TransUnion CIBIL.
Chart 1.45 : Inquiry Volumes by Risk Tier
Note: The segregation of risk-tiers based on CIBIL scores is as follows - Super Prime: 791-900, Prime Plus: 771-790, Prime: 731-770, Near Prime: 681-730 and Sub-prime: 300-680.Source: TransUnion CIBIL.
14 Commercial loans classified into various segments basis credit exposure aggregated at entity level. Micro less than `1 Crore, SME `1-`25 Crores,

25
Financial Stability Report January 2021
I.2.7 Banking Stability Indicator
1.48 By September 2020, the banking stability
indicator (BSI)15 showed improvement in all its five
dimensions (viz., asset quality; profitability; liquidity;
efficiency; and soundness) that are considered
for assessing the changes in underlying financial
conditions and risks relative to their position in
March 2020 (Chart 1.46). This improvement reflects
the regulatory reliefs and standstills in asset
classification mentioned earlier and hence may not
reflect the true underlying configuration of risks in
various dimensions.
I.2.8 Developments in Non-banking Financial Intermediation
1.49 During the period April – November 2020,
mutual fund schemes witnessed net inflows of
`2.73 lakh crore and assets under management
(AUM) grew at 17.73 per cent in the same period.
As alluded to in the July 2020 Financial Stability
Report (FSR), due to lack of liquidity in debt
markets, mutual funds (MFs) as key financial
intermediaries in the non-banking space have faced
heightened redemption pressures during
Q1:2020-21 (Table 1.15). The Reserve Bank’s
special liquidity window for MFs provided a large
measure of relief and eased liquidity stress for the
sector. Thereafter, strong rallies in equity markets
coupled with favourable liquidity conditions have
renewed optimism in the investor outlook for MFs.
The normalised debt fund net asset values (NAVs)
of various categories, which showed a sharp dip
in March-April, 2020 in the wake of redemption
pressure from debt funds have also normalised
reflecting restoration of orderly market conditions
(Chart 1.47).
Chart 1.46 : Banking Stability Map
Note: Away from the centre signifies increase in risk.Source: RBI Supervisory Returns and Staff Calculations.
Chart 1.47 : Movements in Rebased Net Asset Values of three Schemes
Source: AMFI.
Table 1.15: Trends in Resource Mobilisation by Mutual Funds (` crore)
Q1:2020-21 Q2:2020-21 Oct-20 Nov-20
Gross Mobilisation 26,47,640 19,33,575 6,43,237 5,66,379
Redemption 25,23,561 19,10,407 5,44,661 5,39,185
Net Inflow/ Outflow 1,24,079 23,168 98,576 27,194
Assets at the end of Period
25,48,848 26,85,982 28,22,941 30,00,904
Source: SEBI.
15 For a detailed methodology and basic indicators used under different BSI dimensions please refer to Annex 2.

26
Chapter I Macrofinancial Risks
Chart 1.48 : Average Assets under Management of Debt Schemes and Average Daily Outstanding System Liquidity16
Source: Bloomberg; Association of Mutual Funds of India (AMFI) and Reserve Bank of India.
1.50 The average assets under management
(AUM) of Money Market Mutual Funds (MMMFs)
have expanded in line with system-level liquidity
(Chart 1.48). Excess returns of MMMFs have started
to normalise after turning negative in the previous
quarter (Chart 1.49) reflecting increased proportion
of liquid assets in their investment corpus. The share
of liquid assets in debt mutual funds’ portfolios has
surged since March 2020 and constitutes 39 per
cent of the aggregate AUM by end-November 2020,
reflecting precautionary allocations (Chart 1.50).
1.51 Liquidity support from Reserve Bank has
ensured orderly functioning of both the commercial
paper (CP) and non-convertible debenture (NCD)
markets, with large issuances relative to a year ago
and a substantial narrowing of spreads across rating
16 This includes absorption / injection of daily liquidity, standing liquidity facility availed from RBI and Cash balance held in Central bank in excess / deficit of CRR requirements
Chart 1.49 : Returns on Liquid fund Index
Note: Return differential between the CRISIL liquid fund index and the 3-month constant maturity T-Bill portfolio.Source: Bloomberg.
Chart 1.50 : Investment in G-Sec/T-Bills/ CBLO and spread products movement
Source: Securities and Exchange Board of India (SEBI) and Clearing Corporation of India Ltd (CCIL).

27
Financial Stability Report January 2021
categories. As a result, CP outstanding for non-PSU
obligors has increased sizably (Charts 1.51 and 1.52).
1.52 Ratings dispersion of CPs versus NCDs shows
a more varied rating profiles. The relative share of
NCD issuances by the ‘AAA’ rated cohort has sharply
declined in H2:2020-21 (till November) (Charts 1.53
and 1.54). Near-term maturities in respect of CPs and
NCDs show a wide dispersion across rating grades,
a. CPs b. NCDs
Chart 1.51 : Issuances of Commercial Paper and Non-Convertible Debentures - Non-PSU Obligors
Note: Includes NCD issuances with tenor and put/call option of above 365 days only.Source: Prime Database.
a. CPs b. NCDs
Chart 1.52 : Outstanding Commercial Papers and Non-Convertible Debentures - Non-PSU Obligors
Note: Data on NCDs Includes private debt placements from April 2013 onwards with tenor and put/call option of above 365 days.Source: Prime Database.
Chart 1.53 : CP Issuances – Non-PSU Non-financial Obligors – Rating-wise
Source: Prime Database.

28
Chapter I Macrofinancial Risks
Table 1.16: Issuances and Near-term Maturities of CPs and NCDs of Non-PSU Non-financial Obligors(` crore)
Issuances Maturing
Sep-20 Oct-20 Nov-20 Dec-20 Jan-21 Feb-21 Mar-21 Apr-21 May-21 Jun-21
AAA 16,450.0 10,300.0 24,155.0 23,769.1 12,858.0 10,008.0 10,081.6 1,004.4 1,000.0 6,531.7
AA 24,545.1 26,756.0 13,385.0 20,059.7 8,214.4 8,018.0 8,642.3 10,350.0 1,739.1 7,260.0
Others 2,689.0 2,493.3 2,767.3 8,111.6 1,486.5 5,477.0 3,403.4 7,460.7 3,900.0 4,711.2
Unrated/NA 7,678.0 2,525.0 111.0 4,589.8 1,288.6 1,032.3 7,557.6 1,926.4 681.0 1,741.0
Total 51,362.1 42,074.3 40,418.3 56,530.2 23,847.5 24,535.3 29,684.9 20,741.5 7,320.1 20,243.9
Note: 1) Data on NCDs Includes private debt placements from April 2013 onwards with tenor and put/call option of above 365 days. 2) Rating for maturity profile reflects outstanding ratings as on November 2020.Source: Prime Database.
although maturities in respect of higher ratings
dominate (Table 1.16).
1.53 A sharp decline in money market rates
specifically since April 2020, has opened up a
significant wedge between the marginal cost of fund-
based lending rate (MCLR) benchmark of banks17
and money market rates of corresponding tenor
(Chart 1.55). Expensive bank finance may lead to
more credit worthy borrowers with access to money
markets shifting away from bank based working
capital finance. Such disintermediation of better-
quality borrowers from banking channels have
implications for banking sector interest income and
credit risk.
17 MCLR of a large PSB.
Chart 1.54 : NCD Issuances – Non-PSU Non-financial Obligors – Rating-wise
Note: Includes NCD issuances with tenor and put/call option of above 365 days only.Source: Prime Database.
Chart 1.55 : Short-term Money Market Rates
Source: Reuters, Financial Benchmarks India Ltd (FBIL).

29
Financial Stability Report January 2021
I.2.9 Housing Market
1.54 With the phased unlocking of the economy
and various measures to aid revival, the Indian real
estate market appears to be emerging from COVID-
19-induced disruptions. The housing market is
gradually rebalancing and recovering from the trough
into which it had plunged in Q1: 2020-21. New units
launched and residential units sold across the top
eight cities reflected clear recoveries in Q2:2020-21
and in Q3 so far, relative to the previous quarter
(Chart 1.56).
1.55 The uptick in sales in Q2:2020-21 resulted in
a decline in unsold inventory, though the inventory
overhang (i.e., average number of months required
to sell unsold houses) increased sharply in the wake
of the pandemic (Chart 1.57). Under-construction
units constituted about 70 per cent of the sales in
Q2:20-21 and 81 per cent of the unsold inventory.
Sluggish sales have restrained developers from
increasing prices in major cities (Chart 1.58).
I.2.10 Systemic Risk Survey18
1.56 In the latest systemic risk survey (SRS) of October/November 2020, respondents rated select institutional risks as ‘high’ whereas global risks,
Chart 1.57 : Unsold Inventory and Inventory Overhang
Source: Prop Tiger Datalabs.
Chart 1.56 : House Launches and Sales
Source: Prop Tiger Datalabs.
Chart 1.58 : Price Growth Trends in Key Housing Markets
Source: Prop Tiger Datalabs.
18 Details are given in Annex 1.

30
Chapter I Macrofinancial Risks
macroeconomic risks and financial market risks were perceived as ‘medium’. This represented a clear shift from the previous round of the survey held during April/May 2020 in which all these groups were rated as ‘high’ risk. Also, unlike in the previous round of the survey, in which risks to economic growth (global and domestic) and to the fiscal deficit were assessed as ‘very high’, none of the risks were categorised ‘very high’ by the participants in the current round. The ‘high’ risk components among the risk groups other than the institutional risks include global growth, domestic growth, domestic inflation, fiscal deficit, corporate sector vulnerabilities, pace of infrastructure development and equity price volatility.
1.57 Nearly one third of the respondents opined that the prospects of the Indian banking sector are going to ‘deteriorate marginally’ in the next one year as earnings of the banking industry may be negatively impacted due to slow recovery post lockdown, lower net interest margins, elevated asset quality concerns and a possible increase in provisioning requirements. On the other hand, about one fourth of the respondents felt that the prospects are going to improve marginally.
1.58 The overall responses indicate a positive turn to the outlook relative to the last round of the survey.
Summary and Outlook
1.59 Since the publication of the Financial Stability Report (FSR) of July 2020, there is a much better assessment of the spread and depth of COVID-19 risks and their broader impact on global and domestic economic conditions. Although there has been rapid recovery in economic activity from the lows of March and April, major non-financial indicators remain below pre-pandemic levels.
1.60 The adverse impact on government revenue and the resultant increase in sovereign borrowing in a period when fiscal authorities are also required to
provide stimulus to economic growth, is increasing
sovereign debt to levels that have intensified
concerns relating to sustainability with crowding out
fears in respect of the private sector in terms of both
volume of financing and costs thereof.
1.61 The growing disconnect between certain
segments of financial markets and real sector
activity, pointed out in the last FSR, has got further
accentuated during the interregnum, with abundant
liquidity spurring a reach for returns. Within the
financial market spectrum too, the divergence in
expectations in the equity market and in the debt
market has grown, both globally and in India.
1.62 Domestically, corporate funding has been
cushioned by policy measures and the loan
moratorium announced in the face of the pandemic,
but stresses would be visible with a lag. This has
implications for the banking sector as corporate
and banking sector vulnerabilities are interlinked.
While the post-global financial crisis (GFC)
prudential measures have ensured stronger capital
buffers in the banking sector, which have stood
banks in good stead in the face of the pandemic,
the imminent crystallisation of financial stress may
test their resilience, especially for individual banks
which, in turn, can have systemic implications.
Banks need to prepare for these adversities by
augmenting their capital bases to support their own
business plans and the broader economic recovery
process in the post-COVID period. Moreover, while
easy financial conditions are intended to support
growth prospects they can have unintended
consequences in terms of encouraging leverage,
inflating asset prices and fuelling threats to financial
stability. The pandemic has altered behaviour and
business models fundamentally. Policy authorities
are striving to stay ahead by designing suitable
responses.

31
Financial Stability Report January 2021
Chapter II
Financial Institutions: Soundness and Resilience
Introduction
2.1 The functioning of financial markets in
the recent months has been characterised by the
economic impact of the COVID-19 pandemic, with
financial institutions largely cushioned by abundant
liquidity in the banking system, lowering of the
cost of funds, and regulatory forbearance in asset
classification of specified loans. Resultantly, despite
subdued credit offtake, banks reported better
than anticipated results. The fuller impact of the
deterioration in the macroeconomic environment
on banks’ asset quality, capital adequacy and
profitability may unfold gradually.
2.2 Nevertheless, a shock of such large
dimensions is likely to place pressure on the balance
sheets of banks going forward. The pre-pandemic
vulnerabilities of some relatively weaker institutions
may get accentuated. The pandemic is a common
risk for a significant share of credit exposures in
an interconnected financial market. An assessment
of financial stability aspects through performance
parameters and level of interconnectedness of Indian
financial institutions, supplemented by macro stress
Policy induced easy liquidity and financing conditions in response to the COVID-19 pandemic enabled improvement in lending rates, profitability and capital adequacy of banks with some moderation in balance sheet stress; however, bank credit has remained subdued. Macro stress tests indicate a deterioration in SCBs’ asset quality and capital buffers as regulatory forbearances get wound down. Contagion risks have receded with the shrinking of the inter-bank market. In the non-bank space, dominant positions occupied by mutual funds and insurance companies as fund providers continued, with Non-banking Financial Companies (NBFCs) and Housing Finance Companies (HFCs) turning out to be the largest borrowers.
tests, including bottom-up stress tests is useful to disband this complex aggregation.
2.3 Against this backdrop, this chapter sets out to evaluate the soundness and resilience of banks, NBFCs and scheduled primary (urban) cooperative banks (SUCBs) by examining their recent performance as reflected in audited balance sheets and offsite returns. The results of stress tests carried out on each category of financial intermediaries are presented in Sections II.1, II.2 and II.3. The chapter concludes with Section II.4 in which a detailed analysis of the network structure and connectivity of the Indian financial system is presented along with the results of contagion analysis under adverse scenarios.
II.1 Scheduled Commercial Banks (SCBs)1 2
2.4 Credit growth (y-o-y) of SCBs, which had
declined to 5.7 per cent by March 2020, slid further
to 5.0 per cent by September 2020. For public sector
banks (PSBs), credit growth picked up from 3.0 per
cent in March 2020 to 4.6 per cent in September
2020, while for private sector banks (PVBs) it eased
to 7.1 per cent from 10.4 per cent in March 2020.
1 Analyses are mainly based on RBI’s supervisory returns which cover only domestic operations of SCBs, except in the case of data on large borrowers, which are based on banks’ global operations. For CRAR projections, a sample of 46 SCBs (including public sector banks (PSBs), private sector banks (PVBs) and foreign banks (FBs)) accounting for around 98 per cent of the assets of the total banking sector (non-RRB) have been considered.2 The analyses done in the chapter are based on the data available as of December 04, 2020, which are provisional. SCBs include public sector banks, private sector banks and foreign banks. IDBI has been considered as a PVB for the analyses in this section consistent with the declaration of IDBI as private sector bank for regulatory purpose from January 21, 2019 and accordingly all data from March 2019 onwards have been recast to reflect this revision.

32
Chapter II Financial Institutions: Soundness and Resilience
Foreign banks reported a decline of (-)5.4 per cent
as against 7.2 per cent growth in March 2020 (Chart
2.1a). Loans disbursed through new accounts
declined by almost one-fourth in Q1:2020-21 on an
annual basis but subsequently, there has been some
recovery. In Q2:2020-21 growth in new loans was
witnessed primarily in the agriculture sector and in
the personal loans segment (Table 2.1).
2.5 By contrast, deposit growth of SCBs remained
robust at 10.3 per cent (y-o-y), driven by precautionary
savings. PSBs recorded a growth of 9.6 per cent,
among the highest in the last five years (Chart 2.1 a).
2.6 On the earnings front, SCBs’ net interest
income (NII) grew at a much higher clip of 16.2 per
cent in September 2020 (13.0 per cent in March 2020).
Net interest margin (NIM) edged up across all banking
groups in September 2020 (Chart 2.1 c). However,
growth in other operating income (OOI) plummeted
to 1.2 per cent from 29.2 per cent in March 2020.
a. Credit and Deposit Growth (y-o-y; per cent)
Chart 2.1: Select Performance Indicators (Contd.)
b. Components of SCBs Profit Growth (y-o-y; per cent) c. Net Interest Margin
Table 2.1:Sector-wise New Loans by SCBs* (y-o-y, per cent)
Sector Share in March
2020 (%)
Q4:2019-20 Growth
Q1:2020-21 Growth
Q2:2020-21 Growth
Agriculture 9.1 -2.0 -22.3 18.0
Industry 35.4 19.3 -20.2 -15.4
Services 38.2 14.3 -12.3 -9.8
Personal Loans 14.1 11.3 -59.1 4.2
Others 3.2 -32.0 -41.8 -22.1
All Loans 100.0 11.4 -24.6 -7.4
Note : * excluding regional rural banks (RRBs).Source: Basic Statistical Returns -1, RBI.
Earnings before provisions and taxes (EBPT) grew by
17.6 per cent (Chart 2.1 b). Return on assets (RoA)
and return on equity (RoE) improved substantially
across all bank groups, with the recovery in RoE of
PSBs being particularly noteworthy after languishing
at sub-zero and near zero levels for the past four years
(Chart 2.1 d and Chart 2.1 e). Falling interest rates
led to cost of funds declining across bank groups,
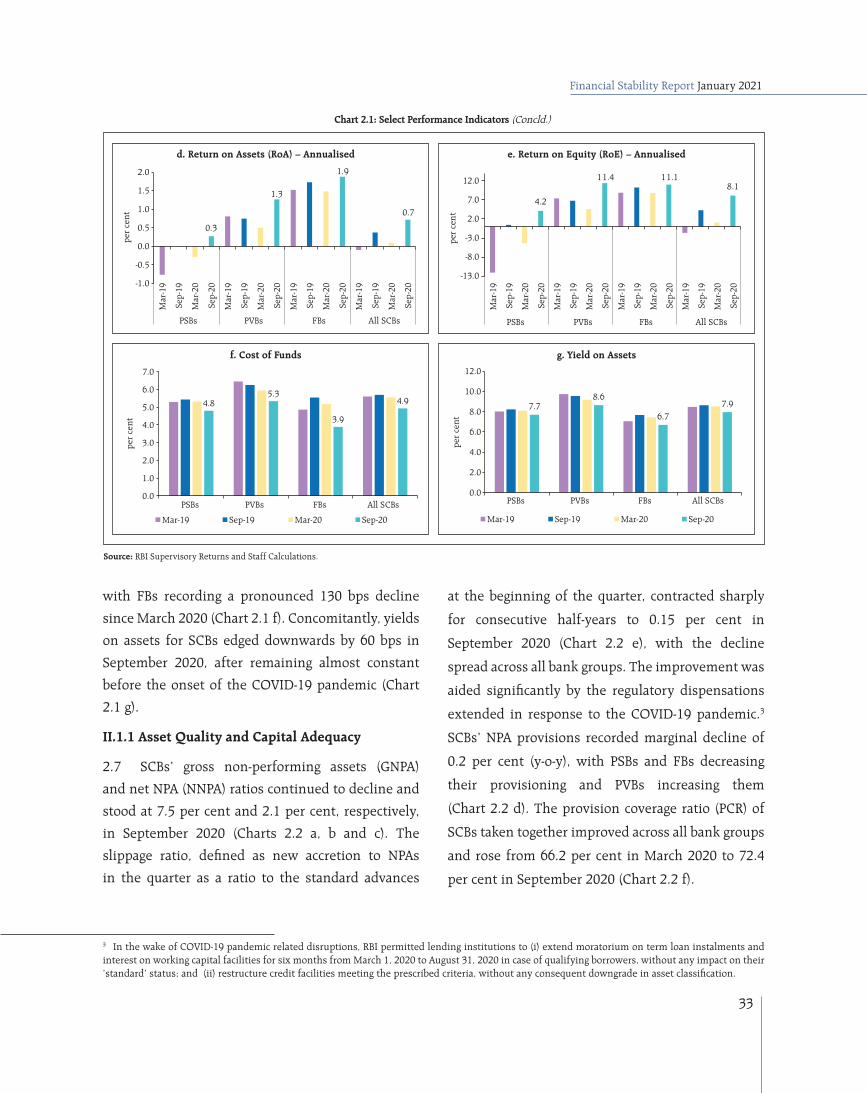
33
Financial Stability Report January 2021
Chart 2.1: Select Performance Indicators (Concld.)
d. Return on Assets (RoA) – Annualised
f. Cost of Funds
e. Return on Equity (RoE) – Annualised
g. Yield on Assets
Source: RBI Supervisory Returns and Staff Calculations.
with FBs recording a pronounced 130 bps decline
since March 2020 (Chart 2.1 f). Concomitantly, yields
on assets for SCBs edged downwards by 60 bps in
September 2020, after remaining almost constant
before the onset of the COVID-19 pandemic (Chart
2.1 g).
II.1.1 Asset Quality and Capital Adequacy
2.7 SCBs’ gross non-performing assets (GNPA)
and net NPA (NNPA) ratios continued to decline and
stood at 7.5 per cent and 2.1 per cent, respectively,
in September 2020 (Charts 2.2 a, b and c). The
slippage ratio, defined as new accretion to NPAs
in the quarter as a ratio to the standard advances
at the beginning of the quarter, contracted sharply
for consecutive half-years to 0.15 per cent in
September 2020 (Chart 2.2 e), with the decline
spread across all bank groups. The improvement was
aided significantly by the regulatory dispensations
extended in response to the COVID-19 pandemic.3
SCBs’ NPA provisions recorded marginal decline of
0.2 per cent (y-o-y), with PSBs and FBs decreasing
their provisioning and PVBs increasing them
(Chart 2.2 d). The provision coverage ratio (PCR) of
SCBs taken together improved across all bank groups
and rose from 66.2 per cent in March 2020 to 72.4
per cent in September 2020 (Chart 2.2 f).
3 In the wake of COVID-19 pandemic related disruptions, RBI permitted lending institutions to (i) extend moratorium on term loan instalments and interest on working capital facilities for six months from March 1, 2020 to August 31, 2020 in case of qualifying borrowers, without any impact on their ‘standard’ status; and (ii) restructure credit facilities meeting the prescribed criteria, without any consequent downgrade in asset classification.

34
Chapter II Financial Institutions: Soundness and Resilience
5 The CRAR pertains to all SCBs. 6 Tier I leverage ratio is the ratio of Tier I capital to total assets.
a. SCBs’ GNPA Ratio
e. SCBs’ Quarterly Slippage Ratio
b. SCBs’ NNPA Ratio
f. Provision Coverage Ratio4
Chart 2.2: Select Asset Quality Indicators (Contd.)
c. Growth in SCBs’ GNPAs (y-o-y; per cent) d. Growth in SCBs’ NPA Provisions (y-o-y; per cent)
2.8 The capital to risk-weighted assets ratio (CRAR)
of SCBs improved considerably by 110 bps to 15.8
per cent in September 2020 over March 2020 (14.7
per cent). While PSBs recorded an increase of 60 bps,
the improvement was more substantial for PVBs and
FBs by 170 bps and 100 bps, respectively (Chart 2.2
g). In case of SCBs, Tier I leverage ratio also increased
by 30 bps between March 2020 and September
2020, PVBs and FBs being the main contributors,
having improved their ratio by 80 bps and 120 bps
respectively, while the PSBs’ ratio remained flat
(Chart 2.2 h). However,the actual capital cushion
available with banks could be overstated in view of
the regulatory forbearance.
4 Provision coverage ratio (without write-off adjustment) = Provisions held for NPA * 100 / GNPAs.

35
Financial Stability Report January 2021
5 The CRAR pertains to all SCBs. 6 Tier I leverage ratio is the ratio of Tier I capital to total assets.
II.1.2 Sectoral Asset Quality
2.9 Among the broad sectors, asset quality
improved noticeably in the case of industry,
agriculture and services in September 2020 over
March 2020, with a decline in GNPA and stressed
advances ratios. In the case of retail advances,
however, the GNPA ratio declined only marginally
and stressed advances remained flat (Chart 2.3 a). A
broad-based decline in GNPA ratio was visible across
all major sub-sectors within industry (Chart 2.3 b).
g. Capital to Risk Weighted Asset Ratio5 h. Tier I Leverage Ratio6
Chart 2.2: Select Asset Quality Indicators (Concld.)
Source: RBI Supervisory Returns and Staff Calculations.
Chart 2.3: Sectoral Asset Quality Indicators
a. Sector-wise GNPA Ratio and Stressed Advances Ratio
b. GNPA Ratio of Major Sub-Sectors within Industry
Note: Numbers given in parentheses with the legend are the sub-sectors’ share in total credit to industry. Source: RBI Supervisory Returns and Staff Calculations.
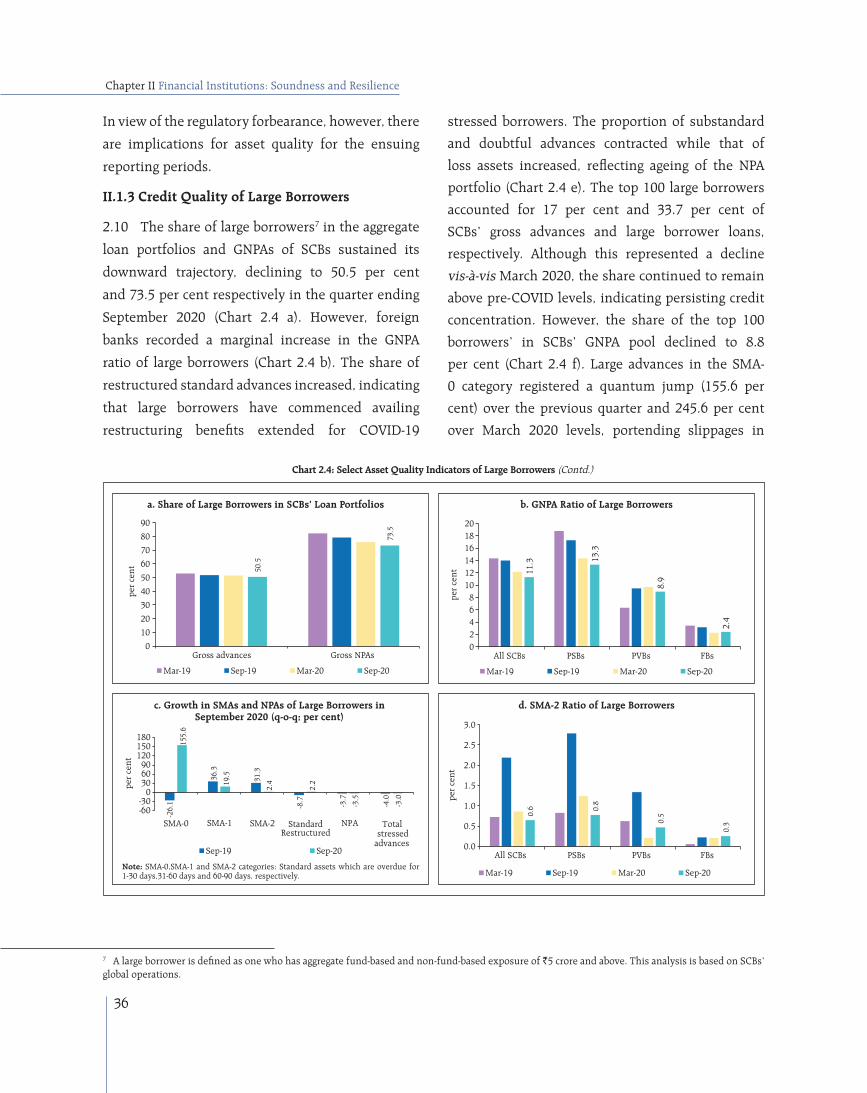
36
Chapter II Financial Institutions: Soundness and Resilience
In view of the regulatory forbearance, however, there
are implications for asset quality for the ensuing
reporting periods.
II.1.3 Credit Quality of Large Borrowers
2.10 The share of large borrowers7 in the aggregate
loan portfolios and GNPAs of SCBs sustained its
downward trajectory, declining to 50.5 per cent
and 73.5 per cent respectively in the quarter ending
September 2020 (Chart 2.4 a). However, foreign
banks recorded a marginal increase in the GNPA
ratio of large borrowers (Chart 2.4 b). The share of
restructured standard advances increased, indicating
that large borrowers have commenced availing
restructuring benefits extended for COVID-19
stressed borrowers. The proportion of substandard
and doubtful advances contracted while that of
loss assets increased, reflecting ageing of the NPA
portfolio (Chart 2.4 e). The top 100 large borrowers
accounted for 17 per cent and 33.7 per cent of
SCBs’ gross advances and large borrower loans,
respectively. Although this represented a decline
vis-à-vis March 2020, the share continued to remain
above pre-COVID levels, indicating persisting credit
concentration. However, the share of the top 100
borrowers’ in SCBs’ GNPA pool declined to 8.8
per cent (Chart 2.4 f). Large advances in the SMA-
0 category registered a quantum jump (155.6 per
cent) over the previous quarter and 245.6 per cent
over March 2020 levels, portending slippages in
7 A large borrower is defined as one who has aggregate fund-based and non-fund-based exposure of `5 crore and above. This analysis is based on SCBs’ global operations.
Note: SMA-0,SMA-1 and SMA-2 categories: Standard assets which are overdue for 1-30 days,31-60 days and 60-90 days, respectively.
Chart 2.4: Select Asset Quality Indicators of Large Borrowers (Contd.)
a. Share of Large Borrowers in SCBs’ Loan Portfolios
c. Growth in SMAs and NPAs of Large Borrowers in September 2020 (q-o-q; per cent)
b. GNPA Ratio of Large Borrowers
d. SMA-2 Ratio of Large Borrowers

37
Financial Stability Report January 2021
the ensuing quarters (Chart 2.4 c). SMA-2 ratios of
large borrowers increased for PVBs and FBs, while
declining for PSBs (Chart 2.4 d).
II.1.4 Resilience – Macro Stress Tests
2.11 Macro-stress tests were performed to
assess the resilience of SCBs’ balance sheets
to unforeseen shocks emanating from the
macroeconomic environment. Drawing on the
results of the exercise, capital and impairment
ratios are projected over a one-year horizon under
a baseline and two adverse – medium and severe
– scenarios. In the last Financial Stability Report, a
one-time additional scenario of ‘very severe stress’
was introduced in view of the high uncertainty
around the evolution of the COVID-19 pandemic,
its economic costs and delay in the data gathering
process. With better appraisal of the pandemic’s
impact on economic conditions, it is assessed that
the worst is behind us, though the recovery path
remains uncertain. Accordingly, stress tests have
reverted to the regular 3-scenario analysis in this
issue. The baseline is derived from the steady state
forecasted values of key macroeconomic variables8
and indicates the central path. By design, the
adverse scenarios used in the macro stress tests
are stringent conservative assessments under
hypothetical adverse economic conditions. It
is emphasised that model outcomes do not
amount to forecasts. The medium and severe
adverse scenarios have been obtained by applying
0.25 to one standard deviation (SD) shocks;
and 1.25 to two SD shocks, respectively, to each
e. Composition of Funded Amount Outstanding for Large Borrowers
f. Share of Top 100 Borrowers in Funded Amount Outstanding of SCBs and Large Borrowers (LBs)
Chart 2.4: Select Asset Quality Indicators of Large Borrowers (Concld.)
8 GDP growth, combined fiscal deficit-to-GDP ratio, CPI inflation, weighted average lending rate, exports-to-GDP ratio and current account balance-to- GDP ratio.
Source: RBI Supervisory Returns and Staff Calculations

38
Chapter II Financial Institutions: Soundness and Resilience
of the macroeconomic variables, increasing the
shocks by 25 basis points in each projection quarter
(Chart 2.5).
2.12 Generally, stress tests are carried out on the
basis of SCBs’ balance sheet positions, including
slippage of loans into NPA, profitability, capital and
other relevant data reported by banks. In view of the
regulatory forbearances such as the moratorium, the
standstill on asset classification and restructuring
allowed in the context of the COVID-19 pandemic,
the data on fresh loan impairments reported by banks
may not be reflective of the true underlying state of
banks’ portfolios. This, in turn, can underestimate
the impact of stress tests, given that the slippage
ratios of the latest quarter for which data is available
are the basic building blocks of the macro-stress
testing framework. To tide over this limitation, it is
necessary to arrive at reliable estimates of slippage
ratios for the last three quarters, while controlling
for the impact of regulatory forbearances.
2.13 A two-stage estimation procedure is adopted.
First, for SCBs, data for December 2019 can be
considered as the latest available data unaffected
by the regulatory reliefs and are hence used as the
starting point for the stress testing simulations to
which realised values of the key macroeconomic
variables are applied to obtain estimates of slippage
ratios and GNPA ratios for the quarters ending March
2020, June 2020 and September 2020. In the second
stage, the ratios estimated for September 2020 are
taken as the base for projecting GNPA and capital
ratios for September 2021. Contemporaneous cross-
country experience in stress testing is captured in
Box 2.1.
Box 2.1: Stress testing in Pandemic Times: Some Country Experiences
Stress tests gauge the adequacy of capital and liquidity buffers with financial institutions to withstand severe but plausible macroeconomic and financial conditions. In the face of a black swan event such as the COVID-19 pandemic, it is necessary to tweak regular stress testing frameworks to accommodate the features of
the pandemic.
In this regard the experience of other central banks is instructive. In its stress test in March 2020, the Reserve Bank of New Zealand (RBNZ) adopted two severe but plausible scenarios for the profitability and capital of the nine largest banks in the country. A pessimistic
(Contd...)
Chart 2.5: Macroeconomic Scenario Assumptions for H2:FY20-21 and H1:FY21-22

39
Financial Stability Report January 2021
baseline scenario was characterised by a one-in-50 to one-in-75-year event, with the unemployment rate rising to 13.4 per cent (4.1 per cent in December 2019) and property prices falling by 37 per cent (4.6 per cent y-o-y growth in December 2019). In the very severe scenario, a one-in-200-year event was simulated in which a fall in house prices by 50 per cent akin to Ireland’s experience during the global financial crisis (GFC), and unemployment rate of 17.7 per cent were assumed.
The US Federal Reserve Board (US-Fed) performed an additional round of stress tests in December 2020, apart from the stress tests conducted in June 2020. The first round assumed three scenarios: (i) a rapid V-shaped recovery; (ii) a slower U-shaped recovery; and (iii) a W-shaped, double-dip recession and recovery. A large fiscal stimulus was absent in the three scenarios. The unemployment rate was assumed to peak between 15.6 per cent and 19.5 per cent, which was much more stringent than any of the US-Fed’s pre-pandemic stress test scenarios and also higher than during the Great Recession. The December 2020 round of stress tests also featured severe global downturns with substantial stress in financial markets. They also included a global market shock component to be applied to banks with large trading operations, incorporating a default of the largest counterparty. These scenarios were significantly more severe than the current baseline projections for the path of the U.S. economy.
The European Central Bank (ECB) performed a stress test during April-July 2020 to assess the impact of COVID-19 on 86 Euro area banks, featuring three scenarios: (i) a baseline scenario defined before the pandemic outbreak; (ii) a COVID-19 central scenario, reflecting the ECB’s projections which are the most likely to materialise; and (iii) a COVID-19 severe scenario, which assumed a deep recession and a slower economic recovery. The stress
test methodology of the European Banking Authority (EBA) was used as a starting point after tailoring it to the needs of the vulnerability analysis. The methodology as well as the central and severe scenarios incorporated the impact of the unprecedented monetary, supervisory and fiscal COVID-19 relief measures.
Bank of England (BoE) cancelled the 2020 annual stress test to help lenders focus on meeting the credit provisions of UK households and businesses. Instead, the Financial Policy Committee (FPC) of the BoE carried out a desktop stress test of the major UK banks and building societies in May 2020 using the scenarios outlined in BoE’s May 2020 Monetary Policy Report (MPR). In order to further examine the sufficiency of usable buffers to absorb losses, the bank also conducted a ‘reverse stress test’ in August 2020 to assess how severe an economic shock would need to be in order to deplete regulatory capital buffers by as much as in the 2019 stress test.
References
Bank of England (2020): “Interim Financial Stability Report”, May.
Bank of England (2020): “Financial Stability Report”, December.
Board of Governors of US Federal Reserve (2020): “Assessment of Bank Capital during the Recent Coronavirus Event”, June.
Board of Governors of US Federal Reserve (2020): “December 2020 Stress Test Results”, December.
European Central Bank (2020): “COVID-19 Vulnerability Analysis Results overview”, July.
Knowles, J., Nicholls, K., & Bloor, C. (2020): “Outcomes from a COVID-19 stress test of New Zealand banks”, Reserve Bank of New Zealand Bulletin, 83(3), 1-12.

40
Chapter II Financial Institutions: Soundness and Resilience
2.14 The stress tests indicate that the GNPA
ratio of all SCBs may increase from 7.5 per cent
in September 2020 to 13.5 per cent by September
2021 under the baseline scenario (Chart 2.6). If the macroeconomic environment worsens into a severe stress scenario, the ratio may escalate to 14.8 per cent. Among the bank groups, PSBs’ GNPA ratio of 9.7 per cent in September 2020 may increase to 16.2 per cent by September 2021 under the baseline scenario; the GNPA ratio of PVBs and FBs may increase from 4.6 per cent and 2.5 per cent to 7.9 per cent and 5.4 per cent, respectively, over the same period. In the severe stress scenario, the GNPA ratios of PSBs, PVBs and FBs may rise to 17.6 per cent, 8.8 per cent and 6.5 per cent, respectively, by September 2021.
2.15 These GNPA projections are indicative of the possible economic impairment latent in banks’ portfolios, with implications for capital planning. A caveat is in order, though: considering the uncertainty regarding the unfolding economic outlook, and the extent to which regulatory dispensation under restructuring is utilised, the projected ratios are susceptible to change in a non-linear fashion.
Chart 2.6: Projection of SCBs’ GNPA Ratios
Note: The system level GNPAs are projected using three complementary econometric models- multivariate regression, vector autoregression (VAR) and quantile regression; and averaging the resulting GNPA ratios. For bank-group level projections, average of multivariate regression and VAR results are used.
Source: RBI Supervisory Returns and Staff Calculations.
a. System* Level CRAR b. Bank-wise Distribution of CRAR: Sep 2021
Chart 2.7: CRAR Projections
* For a system of 46 select scheduled commercial banks.Note: The capital projection is made under a conservative assumption of minimum profit transfer to capital reserves at 25 per cent for profit making SCBs. It does not take into account any capital infusion by the stakeholders.Source: RBI Supervisory Returns and Staff Calculations.
2.16 The system level CRAR is projected to drop from 15.6 per cent in September 2020 to 14.0 per cent in September 2021 under the baseline scenario and to 12.5 per cent under the severe stress scenario (Chart 2.7 a). The stress test results indicate that four banks may fail to meet the minimum capital level by September 2021 under the baseline scenario, without factoring in any capital infusion by stakeholders. In the severe stress scenario, the number of banks

41
Financial Stability Report January 2021
failing to meet the minimum capital level may rise to nine (Chart 2.7 b).
2.17 The common equity Tier I (CET 1) capital ratio of SCBs may decline from 12.4 per cent in September 2020 to 10.8 per cent under the baseline scenario and to 9.7 per cent under the severe stress scenario in September 2021 (Chart 2.8 a). Furthermore, under these conditions, two banks may fail to meet the minimum regulatory CET 1 capital ratio of 5.5 per cent by September 2021 under the baseline scenario; this number may rise to five in the severe stress scenario (Chart 2.8 b).
2.18 At the aggregate level, SCBs have sufficient capital cushions, even in the severe stress scenario facilitated by capital raising from the market and, in case of PSBs, infusion by the Government. At the individual level, however, the capital buffers of several banks may deplete below the regulatory minimum. Hence going forward, mitigating actions
such as phase-wise capital infusions or other strategic actions would become relevant for these banks from a micro-prudential perspective.
II.1.5 Sensitivity Analysis9
2.19 As part of a top-down10 sensitivity analysis, the vulnerabilities of SCBs were assessed under various scenarios11 by administering a number of single-factor shocks12 to data for September 2020 to simulate credit, interest rate, equity price and liquidity risks.
a. Credit Risk
2.20 A severe shock of 2 SD13 to the system level GNPA (i.e., the GNPA ratio of 46 select SCBs moves up from 7.6 per cent to 13.6 per cent under the impact of the shock) would result in the system-level CRAR declining from 15.6 per cent to 11.6 per cent. The Tier-1 capital ratio declines from 13.3 per cent to 9.3 per cent. The system level capital impairment could
b. Bank-wise Distribution of CET1: Sep 2021a. System* Level CET1
Chart 2.8: Projection of CET 1 Capital Ratio
* For a system of 46 select scheduled commercial banks.Note: The capital projection is made under a conservative assumption of minimum profit transfer to capital reserves at 25 per cent for profit making SCBs. It does not take into account any capital infusion by stakeholders.Source: RBI Supervisory Returns and Staff Calculations.
9 Under macro stress tests, the shocks are in terms of adverse macroeconomic conditions, while in sensitivity analyses, shocks are applied to single factors like GNPAs, interest rate, equity prices, deposits, and the like, one at a time. Also, macro stress tests for GNPA ratios are applied at the system- and major bank-group levels, whereas the sensitivity analyses are conducted at system and individual bank levels.10 Top down stress tests are based on specific scenarios and on aggregate bank-wise data. 11 Single factor sensitivity analysis stress tests are conducted for a sample of 46 SCBs accounting for 98 per cent of the total assets of the banking sector. The shocks designed under various hypothetical scenarios are extreme but plausible.12 For details of the stress tests, please see Annex 2.13 The SD of the GNPA ratio is estimated by using quarterly data since March 2011. One SD shock approximates a 39 per cent increase in the level of GNPAs.

42
Chapter II Financial Institutions: Soundness and Resilience
thus be about 27.8 per cent (Chart 2.9 a). The results of reverse stress tests show that it requires a shock of 4.1 SD to bring down the system-level CRAR to 9 per cent.
2.21 Bank-level stress test results show that if a 2 SD shock is applied to the GNPA ratio, 14 banks with a share of 41.1 per cent in SCBs’ total assets may fail to maintain the required CRAR (Chart 2.9 b). The CRAR would fall below 7 per cent for as many as 11 banks (Chart 2.9 c). When 1 SD and 2 SD shocks are applied, 2 and 11 banks, respectively, would record a decline of over six percentage points in the CRAR. Comparatively, PVBs and FBs would experience
lower erosion in CRAR than PSBs under a 2 SD shock scenario (Chart 2.9 d).
b. Credit Concentration Risk
2.22 Stress tests on banks’ credit concentration - considering top individual borrowers according to their standard exposures - showed that in the extreme scenario of the top three individual borrowers of respective banks failing to repay14,
the CRAR of one bank will fall below 9 per cent
(Chart 2.10 a) and 34 banks would experience a
decline of more than one percentage point in their
CRAR (Chart 2.10 b).
a. System Level b. Bank Level
Chart 2.9: Credit Risk - Shocks and Outcomes
Shock 1: 1 SD shock on GNPA ratioShock 2: 2 SD shock on GNPA ratioNote: System of 46 select SCBs.Source: RBI Supervisory Returns and staff calculations.
c. Distribution of CRAR of Banks d. Range of Shifts in CRAR
14 In the case of default, the borrower in the standard category is considered to move to the sub-standard category.

43
Financial Stability Report January 2021
2.23 Under the scenarios of top three group
borrowers of banks under consideration failing to
repay15, the CRAR of one bank would fall below 9 per
cent (Chart 2.11 a) and 38 banks would experience a
decline of more than one percentage point in their
CRAR (Chart 2.11 b).
2.24 Stress tests on banks’ credit concentration with
respect to their top individual stressed borrowers
showed that in the extreme scenario of the top three
individual borrowers of respective banks failing to
repay16, the CRARs of two banks would fall below
nine per cent and the majority of the banks would
experience a reduction of only 10 to 20 bps in their
15 In the case of default, the group borrower in the standard category is considered to move to the sub-standard category.16 In case of failure, the borrower in sub-standard or restructured category is considered to move to the loss category.
a. Distribution of CRAR of Banks b. Range of Shifts in CRAR
Chart 2.10: Credit Concentration Risk: Individual Borrowers – Exposure
Note: For a system of select 46 SCBsShock 1: Topmost individual borrower fails to meet its payment commitmentsShock 2: Top 2 individual borrowers fail to meet their payment commitmentsShock 3: Top 3 individual borrowers fail to meet their payment commitmentsSource: RBI Supervisory Returns and staff calculations.
Note: For a system of select 46 SCBsShock 1: The top 1 group borrower fails to meet its payment commitments Shock 2: The top 2 group borrowers fail to meet their payment commitmentsShock 3: The top 3 group borrowers fail to meet their payment commitments Source: RBI Supervisory Returns and staff calculations.
a. Distribution of CRAR of Banks b. Range of Shifts in CRAR (in bps)
Chart 2.11: Credit Concentration Risk: Group Borrowers – Exposure

44
Chapter II Financial Institutions: Soundness and Resilience
CRAR on account of low level of stressed assets as of
September 2020 (Chart 2.12).
c. Sectoral Credit Risk
2.25 Sensitivity analysis of bank-wise
vulnerabilities due to exposure to sub-sectors within
industry (shocks based on sub-sector wise historical
SDs of the GNPA ratio) reveals varying magnitudes
of increases in the GNPAs of banks in different sub-
sectors. A 2 SD shock to the basic metals and metal
products and infrastructure-energy segment, would
reduce the system level CRAR by 19 bps and 18 bps,
respectively (Table 2.2).
Note: For a system of select 46 SCBsShock 1: The top 1 group borrower fails to meet its payment commitments Shock 2: The top 2 group borrowers fail to meet their payment commitmentsShock 3: The top 3 group borrowers fail to meet their payment commitments Source: RBI Supervisory Returns and staff calculations.
Table 2.2: Decline in System Level CRAR (basis points, in descending order for top 10 most sensitive sectors)
Sector 1 SD 2 SD
Basic Metal and Metal Products (98%) 10 19
Infrastructure - Energy (62%) 9 18
Infrastructure - Transport (29%) 3 6
All Engineering (38%) 3 5
Textiles (33%) 2 4
Construction (29%) 2 3
Food Processing (26%) 1 3
Vehicles, Vehicle Parts and Transport Equipments (79%)
2 3
Infrastructure - Communication (56%) 1 2
Cement and Cement Products (61%) 1 1
Note: For a system of select 46 banks. Note: Numbers in parentheses represent the growth in GNPAs of that sub-sector due to 1 SD shock to the sub-sector’s GNPA ratio.Source: RBI Supervisory Returns and Staff Calculations.
a. Distribution of CRAR of Banks b. Range of Shifts in CRAR (in DTS)
Chart 2.12: Credit Concentration Risk: Individual Borrowers – Stressed Advances

45
Financial Stability Report January 2021
d. Interest Rate Risk
2.26 The market value of the investment portfolio
subject to fair value for these sample SCBs stood
at `20.9 lakh crore as on end-September 2020,
the highest quarterly balance since March 2017
(Chart 2.13). About 95 per cent of the investments
subjected to fair valuation were classified as available
for sale (AFS).
2.27 The sensitivity (PV0117) of the AFS portfolio
increased vis-a-vis the June 2020 position at
an aggregate level, with FBs registering a 61.7
per cent increase in PV01 in the quarter. Some
positioning in the greater than 10-year segment in
FBs were, however, bonds held as cover for hedging
derivatives and as such they may not be active
contributors to PV01 risk. In terms of PV01 curve
positioning, the tenor-wise distribution in PSBs
indicates a steepening bias, with a slight increase in
PV01 of 1-5 year maturity bucket and paring in the
greater than 10-year segment, while the PVBs’ view
appeared unchanged. FBs were seen to be having
significant exposure in the long end of the curve
(Table 2.3).
2.28 Robust profit booking across all bank groups
was observed in the quarter ended September
2020, although on a lower scale compared to the
June 2020 quarter, possibly due to the rising yield
curve movements across tenors (Table 2.4 and
Chart 2.14). With a significant concentration of
interest rate positions in the sub five-year tenor
across bank groups, and volatility being highest
in the shorter tenor buckets, there is a need to be
cautious about the prospects of contribution of the
trading book to profits, going forward.
Table 2.3: Tenor-wise PV01 Distribution of AFS Portfolio (in per cent)
Sector Total (in ` crore)
< 1 year 1 year- 5 year
5 year- 10 year
> 10 years
PSBs 254.7 (270.7) 7.0 (7.3) 37.8 (32.4) 41.3 (42.3) 13.9 (18.0)
PVBs 72.1 (72.3) 18.7 (15.3) 52.7 (51.3) 26.2 (28.8) 2.3 (4.6)
FBs 90.9 (56.2) 4.7 (5.6) 41.4 (45.3) 12.2 (15.7) 41.7 (33.4)
Note: Values in the brackets indicate June 2020 figures.Source: Individual bank submissions and staff calculations.
17 PV01 is a measure of sensitivity of the absolute value of the portfolio to a one basis point change in the interest rate.
Chart 2.13: Trading Book Portfolio: Bank Group-wise
Source: Individual bank submissions and staff calculations
Table 2.4: OOI - Profit/(loss) on Securities Trading (in ` crore)
Mar-20 Jun-20 Sep-20
Public Sector Banks 8,271.07 10,081.93 6,843.91
Private Sector Banks 4,185.46 9,882.76 4,520.88
Foreign Bank Group 228.34 1,730.87 620.66
Source: RBI Supervisory Returns.
Chart 2.14: Yield Curves and Shift in Yields Across Tenors
Source: Fixed Income Money Markets and Derivatives Association of India (FIMMDA).

46
Chapter II Financial Institutions: Soundness and Resilience
2.29 PVBs and FBs had significant interest rate
exposure in their held for trading (HFT) portfolios
relative to their AFS books, although PVBs had
reduced their PV01 exposure significantly. The tenor-
wise PV01 distribution for PVBs shows a pronounced
shift to exposures in the 1-5 year tenor from the less than 1-year tenor, while FBs have increased PV01 sensitivity at both ends of the curve (Table 2.5).
2.30 Any hardening of interest rates would depress investment gains under the AFS and HFT categories (direct impact). A parallel upward shift of 2.5 percentage points in the yield curve will lower the system level capital and CRAR by 7.0 per cent and 93 basis points, respectively (Table 2.6).
2.31 An analysis of held-to-maturity (HTM) positions as of September 2020 across bank groups reveals that unrealised gains of PSBs are almost evenly spread across SDLs and G-Secs while those of PVBs are concentrated in G-Secs (Chart 2.15). The recent decision to conduct Open Market Operations (OMOs) in SDLs will provide an additional window for PSBs to crystallise their SDL gains.
2.32 The Reserve Bank vide its notification dated October 12, 2020 has allowed banks to hold SLR securities acquired between September 1, 2020 and March 31, 2021 under the HTM category up to an overall limit of 22 per cent of NDTL, untill March 31, 2022. As of September 30, 2020, PSBs’ holding of SLR-eligible securities in the HTM category amounted to 19.2 per cent of their NDTL, while for PVBs and FBs it stood at 19 per cent and 0.5 per cent, respectively.
Table 2.5: Tenor-wise PV01 Distribution of HFT Portfolio (in per cent)
Total (in ` crore)
< 1 year 1 year- 5 year
5 year- 10 year
> 10 years
PSBs 1.7 (2.0) 1.5 (0.5) 9.2 (3.2) 73.8 (31.6) 15.7 (64.8)
PVBs 11.7 (55.6) 10.2 (74.5) 59.9 (16.3) 17.3 (7.1) 12.6 (2.0)
FBs 15.7 (11.5) 5.4 (0.5) 30.4 (40.3) 51.3 (48.0) 12.9 (11.3)
Note: Values in the brackets indicate June 2020 figures. Source: Individual bank submissions and staff calculations.
Table 2.6: Interest Rate Risk – Bank-groups - Shocks and Impacts (under shock of 250 basis points parallel
upward shift of the INR yield curve)
Public Sector Banks
Private Sector Banks
Foreign Banks
All SCBs
AFS HFT AFS HFT AFS HFT AFS HFT
Modified Duration
2.2 2.5 1.5 2.3 2.7 2.9 2.1 2.6
Reduction in CRAR (bps)
103 46 239 93
Source: Individual bank submissions and staff calculations.
Chart 2.15: HTM Portfolio – Disaggregated by Type
Source: Individual bank submissions and staff calculations
18 HQLAs were computed as cash reserves in excess of required CRR, excess SLR investments, SLR investments at 3 per cent of NDTL (under MSF) (following the Circular DOR.No.Ret.BC.77/12.02.001/2019-20 dated June 26, 2020) and additional SLR investments at 15 per cent of NDTL (following the Circular DOR.BP.BC.No.65/21.04.098/2019-20 dated April 17, 2020).19 Un-insured deposits are about 49.1 per cent of total deposits, based on `5 lakh deposit insurance limit (Source: DICGC Annual Report, 2019-20). 20 Stress tests on derivatives portfolios were conducted for a sample of 20 banks, constituting the major active authorised dealers and interest rate swap counterparties.

47
Financial Stability Report January 2021
e. Equity Price Risk
2.33 An analysis of the impact of a fall in equity prices on bank capital and profits indicates that the system-level CRAR would decline by 54 basis points in an extreme scenario of a 55 per cent drop in equity prices (Chart 2.16). The impact for the overall system is limited due to banks’ low capital market exposures arising from regulatory limits.
f. Liquidity Risk
2.34 The liquidity risk analysis aims to capture the
impact of a run on deposits and an increase in demand
for unutilised portions of sanctioned / committed /
guaranteed credit lines. Banks, in general, may be in
a position to withstand liquidity shocks with their
high-quality liquid assets (HQLAs)18.
2.35 Under the assumed scenarios, there would be
increased withdrawals of un-insured deposits19 and
a simultaneous increase in usage of the unutilised
portions of sanctioned working capital limits as well
as utilisation of credit commitments and guarantees
extended by banks to their customers. Using their
HQLAs required for meeting day-to-day liquidity
requirements, 45 out of the 46 banks in the sample
will remain resilient in a scenario of sudden and
unexpected withdrawals of around 15 per cent of
deposits, along with the utilisation of 75 per cent of
their committed credit lines (Chart 2.17).
II.1.6 Bottom-up Stress Tests: Derivatives Portfolio
2.36 A series of bottom-up stress tests (sensitivity
analyses) on derivative portfolios were conducted for
select banks20 with the reference date as September
30, 2020. The banks in the sample reported the
results of four separate shocks on interest and
foreign exchange rates. The shocks on interest rates
18 HQLAs were computed as cash reserves in excess of required CRR, excess SLR investments, SLR investments at 3 per cent of NDTL (under MSF) (following the Circular DOR.No.Ret.BC.77/12.02.001/2019-20 dated June 26, 2020) and additional SLR investments at 15 per cent of NDTL (following the Circular DOR.BP.BC.No.65/21.04.098/2019-20 dated April 17, 2020).19 Un-insured deposits are about 49.1 per cent of total deposits, based on `5 lakh deposit insurance limit (Source: DICGC Annual Report, 2019-20). 20 Stress tests on derivatives portfolios were conducted for a sample of 20 banks, constituting the major active authorised dealers and interest rate swap counterparties.
Chart 2.17: Liquidity Risk – Shocks and Outcomes
Note: 1. A bank was considered to have ‘failed’ in the test when it was unable to meet the requirements under stress scenarios with the help of its liquid assets – the stock of liquid assets turned negative under stress conditions.
2. Liquidity shocks consisted a demand for 75 per cent of the committed credit lines (comprising unutilised portions of sanctioned working capital limits as well as credit commitments towards their customers) and also a withdrawal of a portion of un-insured deposits as given below:
Shock Shock 1 Shock 2 Shock 3
Per cent withdrawal of un-insured deposits 10 12 15
Source: RBI Supervisory Returns and staff calculations.
Num
ber/
per
cen
t
Chart 2.16: Equity Price Risk
Note: For a system of select 46 SCBsShock 1: Equity prices drop by 25 per cent Shock 2: Equity prices drop by 35 per centShock 3: Equity prices drop by 55 per cent Source: RBI Supervisory Returns and staff calculations.

48
Chapter II Financial Institutions: Soundness and Resilience
ranged from 100 to 250 basis points, while 20 per cent appreciation/depreciation shocks were assumed for foreign exchange rates. The stress tests were carried out for individual shocks on a stand-alone basis.
2.37 The results reveal that while some FBs showed significant negative net mark-to-market (MTM) impacts as a proportion to CET 1 capital, the impact was largely muted in case of PSBs and PVBs (Chart 2.18). However, since risks can only be transferred and not eliminated, they could be residing in corporate balance sheets. Going forward, an assessment of the hedging profile of corporates as given in the disclosures would help understand the true extent of risks.
2.38 The stress test results showed that the average net impact of interest rate shocks and exchange rate shocks are in the range of 2.5 per cent of the total capital funds (Chart 2.19). In the interest rate segment, derivatives’ exposure remains short i.e., they gain from an interest rate rise, which is similar to their positioning in March 2020. As regards exposures to forex derivatives, the pay-off profile is consistent with a small short USD positioning.
II.2 Scheduled Primary (Urban) Cooperative Banks
2.39 The performance of scheduled primary (urban) cooperative banks (SUCBs) deteriorated between March 2020 and September 2020. At the system level, their GNPA ratio deteriorated from 9.89 per cent in March 2020 to 10.36 per cent in September 2020 while their provision coverage ratio21 improved from 61.88 per cent to 65.13 per cent over this period. The CRAR at the system level22, stood at 9.24 per cent in September 202023, down from 9.70 per cent reported in March 2020. SUCBs’ liquidity ratio24 increased from 33.95 per cent to 34.35 per cent during the period.
21 Provision coverage ratio=provisions held for NPA*100/GNPAs22 Comprising 53 SUCBs23 Data are provisional and based on OSS Returns;24 Liquidity ratio = 100*(cash + dues from banks + dues from other institutions + SLR investment) / Total Assets
Chart 2.19: Impact of Shocks on Derivatives Portfolio of Select Banks (change in net MTM on application of a shock)
(per cent to capital funds)
Note: Change in net MTM due to an applied shock with respect to the baseline.Source: Sample banks (Bottom-up stress tests on derivative portfolio).
Chart 2.18: Mark-to market (MTM) of Total Derivatives Portfolio – Select banks, September 2020
Note: PSB: Public sector bank, PVB: Private sector bank, FB: Foreign bank.Source: Sample banks (Bottom-up stress tests on derivatives portfolio).

49
Financial Stability Report January 2021
II.2.1 Stress Test – Credit Risk
2.40 The impact of credit risk shocks on CRARs of SUCBs was simulated under four different scenarios25. Four SUCBs had CRARs below the regulatory minimum requirement of 9 per cent even before the shock. The results show that (i) under a 1 SD shock to sub-standard assets, the system level CRAR would decline to 9.08 per cent and one SUCB would fail to achieve the minimum CRAR requirement (in addition to four SUCBs which had CRAR below 9 per cent even before the shock); (ii) under a 2 SD shock to sub-standard assets, CRAR would decline to 8.90 per cent and two more SUCBs (seven in all) would fail to achieve the minimum CRAR requirement; (iii) under a 1 SD shock to loss advances, system level CRAR declines to 8.52 per cent and four more SUCBs (in addition to four which already had CRAR below 9 per cent) would fail to maintain the minimum CRAR requirement; and (iv) under a 2 SD shock to loss advances, the system level CRAR declines to 7.51 per cent and two more SUCBs (ten in all) would fail to maintain the minimum CRAR requirement.
II.2.2 Stress Test - Liquidity Risks
2.41 Stress tests on liquidity carried out under two scenarios viz., increase in cash outflows in the 1 to
28 days’ time bucket by i) 50 per cent, and ii) 100 per cent, with cash inflows remaining unchanged, indicated that 18 and 30 SUCBs, respectively, would face liquidity stress26.
II.3 Non-banking Financial Companies
2.42 Non-banking financial companies (NBFCs) saw a decline in growth in 2019-20, largely due
25 The four scenarios are: i) a 1 SD shock to GNPA (classified as sub-standard advances), ii) a 2 SD shock to GNPA (classified as sub-standard advances), iii) a 1 SD shock to GNPA (classified as loss advances), and iv) a 2 SD shock to GNPA (classified as loss advances). SD was estimated by using 10 years data (Annex 2).26 As per the RBI’s guidelines, a mismatch [negative gap i.e., cash inflows less cash outflows] should not exceed 20 per cent of outflows in the time bucket of 1 to 28 days. SUCBs which are above a 20 per cent mismatch after the shock function under very thin liquidity margins.27 The sample included 10 deposit taking and 190 Non-Deposit taking Systemically Important NBFCs. Total asset size of the sample was `29.68 lakh crore, which comprises around 81 per cent of total asset size of the sector. Detailed methodology of the stress tests is discussed in Annex 2.
to isolated credit events in a few large NBFCs, challenges in accessing funds and the overall economic slowdown, with the pandemic’s impact adding to the stress in the later period. During 2019-20, credit extended by NBFCs grew by 4.4 per cent as compared with 22 per cent in 2018-19. Gross NPAs of NBFCs increased from 5.3 per cent of total advances as on March 2019 to 6.3 per cent as on March 2020. Asset quality is expected to deteriorate further due to disruption of business operations caused by the pandemic, especially in the industry sector, one of the major recipients of NBFC credit.
II.3.1 Stress Test - Credit Risk
2.43 System level stress tests for the NBFC sector’s credit risk were conducted for a sample of 200 NBFCs27 with asset size of more than `1000 crore as on March 2020.
2.44 System level stress tests for the NBFC sector’s aggregate credit risk were carried out under the three scenarios of baseline, medium and high risk. The baseline scenario presents the capital adequacy position of the NBFC sector as on March 2020 and medium and high risk scenarios present the capital adequacy position of the sector under 1 SD and 2 SD increases in GNPA. Under a high risk shock of 2 SD increase in the system level GNPA (GNPA of the sector increases from 6.8 per cent to 8.4 per cent), it is observed that the capital adequacy of NBFCs remained above 15 per cent, i.e., at 24.5 per cent, 24.1 per cent and 23.7 per cent, respectively, for

50
Chapter II Financial Institutions: Soundness and Resilience
baseline, medium and high risk scenarios of credit risk (Chart 2.20).
2.45 Stress tests at the individual NBFC level indicated that under the baseline, medium and high risk scenarios, CRAR of 3.3 per cent, 9.7 per cent and 10.3 per cent of NBFCs would fall below the minimum regulatory requirements.
II.4 Interconnectedness
II.4.1 Network of the Financial System28 29
2.46 A financial system can be visualised as a network with financial institutions as nodes and bilateral exposures as links joining these nodes. While these links enable efficiency gains and risk diversification, they can become conduits of risk transmission in case of a crisis. Understanding the nuances in propagation of risk through networks is useful for devising appropriate policy responses for safeguarding financial and macroeconomic stability.
2.47 The total outstanding bilateral exposures30 among the entities in the financial system increased
28 The network model used in the analysis has been developed by Professor Sheri Markose (University of Essex) and Dr. Simone Giansante (Bath University) in collaboration with the Financial Stability Unit, Reserve Bank of India.29 Analysis presented here and in the subsequent part is based on data of 190 entities from the following eight sectors: SCBs,SUCBs, AMC-MFs, NBFCs, HFCs, insurance companies, pension funds and AIFIs. These 190 entities covered include 70 SCBs; 20 SUCBs; 22 AMC-MFs (which cover more than 90 per cent of the AUMs of the mutual fund sector); 32 NBFCs (both deposit taking and non-deposit taking systemically important companies, which represent about 60 per cent of total NBFC assets); 21 insurance companies (that cover more than 90 per cent of assets of the sector); 14 HFCs (which represent more than 90 per cent of total HFC asset); 7 PFs and 4 AIFIs (NABARD, EXIM, NHB and SIDBI).30 Includes exposures between entities of the same sector.
a. Bilateral Exposures b.Share of different Groups
Chart 2.21: Bilateral Exposures between Entities in the Financial System
Source: RBI Supervisory Returns and staff calculations.
marginally after witnessing a sharp fall in June 2020, largely on account of reduced borrowing of PVBs from the financial system (Chart 2.21 a).
2.48 SCBs continued to have the largest bilateral exposures in the Indian financial system in September 2020, though their share declined in the first half of 2020-21. SCBs’ lending to and borrowing
Chart 2.20: Credit Risk in NBFCs – System Level
Source: RBI Supervisory Returns and staff calculations.

51
Financial Stability Report January 2021
Source: RBI Supervisory Returns and staff calculations
Chart 2.23: Net Receivables (+ve) / Payables (-ve) by Institution
Chart 2.22: Network Plot of the Financial System, September 2020
Note: Receivables and payables do not include transactions among entities of the same group. Red circles are net payable institutions and the blue ones are net receivable institutions.Source: RBI Supervisory Returns and Staff Calculations.
from other entities (including other SCBs) stood at 42.2 per cent of total lending and borrowings in the system (Chart 2.21 b). Among bank groups, PSBs had a net receivable position vis-à-vis the entire financial sector, which increased during the last one year. On the other hand, PVBs had a net payable position, which declined y-o-y. FBs were evenly balanced (Charts 2.22 and 2.23).
2.49 After a sizable decline during 2019-20 when their AUM reduced, the share of AMC-MFs remained stable in H1:2020-21. During the same period, the shares of NBFCs, HFCs, insurance companies and pension funds increased to 15.3 per cent, 9.7 per cent, 9.6 per cent, and 1.8 per cent, respectively (Chart 2.21 b). The share of AIFIs, on the other hand, reduced to 9.0 per cent.
2.50 In terms of inter-sectoral31 exposures, AMC-MFs were the biggest fund providers in the system, followed by insurance companies, while NBFCs were the biggest receiver of funds, followed by HFCs. Among the entities which received funds from the financial system, PVBs recorded nearly 40 per cent decline (y-o-y), while payables of NBFCs and HFCs increased by 10.7 per cent and 1.8 per cent, respectively (Chart 2.23).
2.51 AMC-MFs recorded a significant decline in their receivables from the financial system during the last one year, while the same increased for PSBs and insurance companies, who were the other major fund providers (Chart 2.23).
a. Inter-bank Market
2.52 The inter-bank market continued to shrink, in keeping with the trend over recent years. The share of fund-based32 inter-bank exposures in the
31 Inter-sectoral exposures do not include transactions among entities of the same sector in the financial system.32 Fund-based exposures include both short-term exposures and long-term exposures. Data on short-term exposures are collected across seven categories – repo (non-centrally cleared); call money; commercial paper; certificates of deposits; short-term loans; short-term deposit and other short-term exposures. Data on Long-term exposures are collected across five categories – Equity; Long-term Debt; Long-term loans; Long-term deposits and Other long-term liabilities.
Non-Fund based exposures include- outstanding bank guarantees,outstanding Letters of Credit, and positive mark-to-market positions in the derivatives market (except those exposures for which settlement is guaranteed by the CCIL).

52
Chapter II Financial Institutions: Soundness and Resilience
total assets of the banking system declined during the first half of 2020-21, in keeping with past trends, due to excess liquidity in the banking system (Chart 2.24). Non-fund-based inter-bank exposures declined marginally.
2.53 PSBs remained the dominant players in the inter-bank market, although their share continued to decline and stood below 50 per cent during H1:2020-21 while that of PVBs and FBs grew (Chart 2.25).
2.54 The inter-bank market was dominated by short term (ST) exposures to the extent of about 71 per cent, with ST deposits accounting for the highest share, followed by ST loans. In case of long term (LT) fund based inter-bank exposure, 58.2 per cent
comprised of LT loans (Chart 2.26).
Chart 2.24: Inter-bank Market
Source: RBI Supervisory Returns and staff calculations.
Chart 2.25: Different Bank Groups in the Inter-bank Market, September 2020
Source: RBI Supervisory Returns and staff calculations.
a. ST Fund Based b. LT Fund Based
Chart 2.26: Composition of Fund based Inter-bank Market
Source: RBI Supervisory Returns and staff calculations.

53
Financial Stability Report January 2021
b. Inter-bank Market: Network Structure and Connectivity
2.55 The inter-bank market typically has a core-
periphery network structure33 34. At end-September
2020, there were five banks in the inner-most core
and eight banks in the mid-core circle. This is in line
with the pattern seen during the last six years, with
the number of banks in the inner-most core ranging
between two and five and comprising the biggest
PSBs or PVBs. Most foreign banks and almost all old
private banks continue to figure in the outermost
periphery, making them the least connected banks
in the system. The remaining PSBs and PVBs, along
33 The diagrammatic representation of the network of the banking system is that of a tiered structure, in which different banks have different degrees or levels of connectivity with others in the network. The most connected banks are in the inner most core (at the centre of the network diagram). Banks are then placed in the mid core, outer core and the periphery (concentric circles around the centre in the diagram), based on their level of relative connectivity. The colour coding of the links in the tiered network diagram represents borrowings from different tiers in the network (for example, the green links represent borrowings from the banks in the inner core). Each ball represents a bank and they are weighted according to their net positions vis-à-vis all other banks in the system. The lines linking each bank are weighted on the basis of outstanding exposures.34 70 SCBs and 20 SUCBs were considered for this analysis.35 The Connectivity ratio measures the actual number links between the nodes relative to all possible links in a complete network. For methodology, please see Annex 2.
Chart 2.27: Network Structure of the Indian Banking System (SCBs+ SUCBs) – September 2020
Source: RBI Supervisory Returns and Staff Calculations.
with a few major FBs, made up the mid and outer
core. The merger of some PSBs with effect from
April 2020 has impacted the mid-core and outer core
(Chart 2.27).
2.56 A noteworthy point is that the most connected
(and consequently in the inner-most core) entities
could be either net lenders or net borrowers but their
net receivables/payables could be smaller in absolute
terms to those entities which are not as connected.
2.57 The degree of interconnectedness in the
banking system (SCBs), as measured by the
connectivity ratio35, has edged up in September

54
Chapter II Financial Institutions: Soundness and Resilience
2020 after gradual decline over the last few years.
The cluster coefficient36, which depicts local
interconnectedness (i.e., tendency to cluster),
has declined marginally over the last five years
(Chart 2.28).
c. Exposure of AMC-MFs
2.58 AMC-MFs remained the largest net providers
of funds to the financial system. Their gross
receivables were `7.74 lakh crore (29 per cent of
their average AUM) whereas their gross payables
were `0.67 lakh crore as at end-September 2020.
2.59 The top recipients of their funding were
SCBs, followed by NBFCs, HFCs and AIFIs. Their
receivables from SCBs declined in 2019-20 and
also in H1:2020-21. In absolute terms, while SCBs
have seen a decline in their payables to AMC-MFs
in H1:2020-21, they increased for NBFCs and HFCs
albeit in varying degrees. In contrast, AIFIs’ reliance
on AMC-MFs, which has been increasing in earlier
years, witnessed moderation during H1:2020-21
(Chart 2.29 a).
2.60 Instrument-wise, AMC-MFs’ receivables saw
a sharp increase in the share of equity funding
during H1:2020-21. In the case of debt funding,
AMC-MFs have shown a marked preference for long
term debt over short term debt, which is reflected
in the movement of their relative shares. While
equity exposures to financial system participants by
mutual funds do not amount to contractual claims,
simultaneous holdings in debt and equity exposures
of financial system participants by balanced mutual
funds allow transmission of risk from equity market
sell-off to the debt markets and vice versa. Given the
interconnected nature, such sell-offs can potentially
transmit asset market shocks across the financial
system (Chart 2.29 b).
36 Cluster Coefficient: Clustering in networks measures how interconnected each node is. Specifically, there should be an increased probability that two of a node’s neighbours (banks’ counterparties in case of the financial network) are also neighbours themselves. A high cluster coefficient for the network corresponds with high local interconnectedness prevailing in the system. For methodology, please see Annex 2.
Chart 2.28: Connectivity Statistics of the Banking System (SCBs)
Source: RBI Supervisory Returns and staff calculations.
Chart 2.29: Gross Receivables of AMC-MFs from the Financial System
a. Share of top 4 Borrower Groups
b. Share of top 4 Instruments
Source: RBI Supervisory Returns and staff calculations.

55
Financial Stability Report January 2021
d. Exposure of Insurance Companies
2.61 Insurance companies are the second largest
net providers of funds to the financial system (gross
receivables were `6.21 lakh crore and gross payables
were `0.29 lakh crore in September 2020).
2.62 SCBs were the top recipients of their funds,
followed by NBFCs and HFCs. LT debt and equity
accounted for almost all the receivables of insurance
companies, which had limited exposure to short-
term instruments. LT debt of these companies mostly
comprised of subscription to debt instruments
issued by NBFCs and HFCs (Chart 2.30 a and b).
e. Exposure to AIFIs
2.63 AIFIs were net borrowers of funds from the
financial system and their gross payables increased
to `3.36 lakh crore in H1:2020-21, whereas the
gross receivables contracted to `2.83 lakh crore as
at end-September 2020. The top fund providers to
AIFIs were SCBs (primarily PVBs), followed by AMC-
MFs and Insurance companies (Chart 2.31 a). These
funds were provided mostly by the way of LT debt,
LT deposits and CDs (Chart 2.31 b). The share of LT
deposits declined for two successive quarters after
its peak in March 2020.
a. Share of top 3 Borrower Groups b. Share of top 2 Instruments
Chart 2.30: Gross Receivables of Insurance Companies from the Financial System
Source: RBI Supervisory Returns and staff calculations.
a. Share of top 3 Lender Groups b. Share of top 3 Instruments
Chart 2.31: Gross Payables of AIFIs to the Financial System
Source: RBI Supervisory Returns and staff calculations.

56
Chapter II Financial Institutions: Soundness and Resilience
f. Exposure to NBFCs
2.64 NBFCs were the largest net borrowers of funds
from the financial system, with gross payables of
`9.37 lakh crore and gross receivables of `0.93 lakh
crore as at end-September 2020. They obtained more
than half of their funding from SCBs, followed by
AMC-MFs and insurance companies (Chart 2.32 a).
During H1:2020-21, the choice of instruments in the
NBFC funding mix reflects an increasing preference
for LT debt from SCBs which, inter alia, reflects
the support through Targeted Long-term Repo
Operations (TLTRO) (Chart 2.32 b).
g. Exposure to HFCs
2.65 HFCs were the second largest borrowers of
funds from the financial system, with gross payables
of around `6.20 lakh crore and gross receivables of
`0.53 lakh crore as at end-September 2020. HFCs’
borrowing profile was largely similar to that of
NBFCs, except that AIFIs played a significant role
in providing funds to HFCs. The share of AMC-MFs
in funding HFCs declined marginally in H1:2020-
21 after the sharp decline in 2019-20. In contrast,
the share of SCBs moderated after growing in the
previous year (Chart 2.33 a).
a. Share of top 3 Lender Groups b. Share of top 3 Instruments
Chart 2.32: Gross Payables of NBFCs to the Financial System
Source: RBI Supervisory Returns and staff calculations.
a. Share of top 4 Lender Groups b. Share of top 3 Instruments
Chart 2.33: Gross Payables of HFCs to the Financial System
Source: RBI Supervisory Returns and staff calculations.

57
Financial Stability Report January 2021
2.66 As is the case of NBFCs, LT debt and LT loans
were the top two instruments through which HFCs
raised funds from the financial system, with an
increasing share of LT debt (by PVBs). Resource
mobilisation through CPs (subscribed to by AMC-
MFs and, to a lesser extent, by SCBs), which had
been on a consistent decline post the IL&FS episode,
picked up marginally in the first half of 2020-21
(Chart 2.33 b).
II.4.2 Contagion Analysis37
2.67 Contagion analysis uses network technology
to estimate the systemic importance of different
banks. The failure of a bank which is systemically
important leads to greater solvency and liquidity
losses for the banking system which, in turn,
depend on the initial capital and liquidity position
of banks along with the number, nature (whether
it is a lender or a borrower) and magnitude of the
interconnections that the failing bank has with the
rest of the banking system.
a. Joint Solvency38-Liquidity39 Contagion Losses for SCBs due to Bank Failure
2.68 The impact of discrete shocks on the banking
system in this analysis is seen in terms of the number
of bank failures that take place and the amount of
solvency and liquidity losses that are incurred.
2.69 A contagion analysis of the banking network
based on the end-September 2020 position indicates
that if the bank with the maximum capacity to
cause contagion losses fails, it will cause a solvency
loss of 2.5 per cent of total Tier 1 capital of SCBs
and liquidity loss of 0.5 per cent of total HQLA of
the banking system. In comparing these estimates
with a similar exercise undertaken six months ago
when solvency and liquidity losses were estimated
at 4.3 per cent and 0.3 per cent, respectively, no
comfort can be drawn, given that the extent of
vulnerability, as the impact of COVID-19 on banks’
balance sheet is yet to be reflected in full measure
(Table 2.7).
b. Solvency Contagion Losses for SCBs due to NBFC/ HFC Failure
2.70 NBFCs and HFCs are the largest borrowers of
funds from the financial system. A substantial part
of funding comes from banks. Therefore, failure of
any NBFC40 or HFC will act as a solvency shock to
their lenders, which can further spread by contagion.
37 For methodology, please see Annex 2.38 In solvency contagion analysis, gross loss to the banking system owing to a domino effect of one or more borrower banks failing is ascertained. Failure criterion for contagion analysis has been taken as Tier 1 capital falling below 7 per cent.39 In liquidity contagion analysis, a bank is considered to have failed when its liquid assets are not enough to tide over a liquidity stress caused by the failure of large net lender. Liquid assets are measured as: 18 per cent of NDTL + excess SLR + excess CRR.40 Only Private NBFCs are considered.
Table 2.7: Contagion Losses due to Bank Failure – September 2020
Trigger Code
% of Tier 1 capital of
the Banking System
% of HQLA Number of Bank
defaulting due to
solvency
Number of Bank
defaulting due to
liquidity
Bank 1 2.50 0.50 2 0
Bank 2 2.46 0.02 0 0
Bank 3 2.39 0.11 0 0
Bank 4 2.07 1.72 0 0
Bank 5 1.73 1.07 0 2
Note: Top five ‘Trigger banks’ have been selected on the basis of solvency losses caused to the banking system.Source: RBI Supervisory Returns and staff calculations.

58
Chapter II Financial Institutions: Soundness and Resilience
2.71 An analysis of the possible solvency contagion
losses to the banking system caused by idiosyncratic
failure of a NBFC indicates that, as at end-September
2020, the failure of the NBFC with the maximum
capacity to cause solvency losses to the banking
system can knock off 2.26 per cent of the latter’s
total Tier 1 capital but it would not lead to failure
of any bank. Failure of the HFC with the maximum
capacity to cause solvency losses to the banking
system will knock off 5.92 per cent of the latter’s
total Tier 1 capital but no bank would fail in such an event (Tables 2.8 and 2.9).
2.72 The losses on account of idiosyncratic failure may have been understated due to non-reflection of the impact of COVID-19 on banks’ balance sheets.
c. Solvency Contagion Impact41 after Macroeconomic Shocks to SCBs
2.73 The contagion impact of the failure of an institution is likely to be magnified if macroeconomic shocks result in distress in the banking system in a generalised downturn in the economy. Such shocks may affect solvency of some SCBs which, in turn, would act as a trigger for further solvency losses. In the previous iteration, the shock was applied to the entity that could cause the maximum solvency contagion losses, whereas the initial impact of macroeconomic shocks on individual bank’s capital is factored in from the macro-stress tests, in which a baseline and two (medium and severe) adverse scenarios have been considered for September 202142.
2.74 Initial capital loss due to macroeconomic shocks stood at 8.36 per cent, 12.39 per cent, and 17.25 per cent of Tier 1 capital for baseline, medium
and severe stress scenarios, respectively. The number of banks that fail to maintain Tier I adequacy ratio of 7 per cent in the face of shocks ranged between three in the baseline and five in the medium stress scenario to eight in severe stress scenario. These banks had low Tier 1 capital in September 2020 (either already below 7 per cent or marginally higher).
2.75 Additional solvency losses to the banking system due to contagion (over and above the initial loss of capital due to the macro shocks), in terms
41 Failure Criterion for both PSBs and PVBs has been taken as Tier 1 CRAR falling below 7 per cent.42 The contagion analysis used the results of the macro-stress tests and made the following assumptions:
a) The projected losses under a macro scenario (calculated as reduction in projected Tier 1 CRAR, in percentage terms, in September 2021 with respect to the actual value in September 2020) were applied to the September 2020 capital position assuming proportionally similar balance sheet structures for both September 2020 and September 2021.
b) Bilateral exposures between financial entities are assumed to be similar for September 2020 and September 2021.
Table 2.8: Contagion Losses due to NBFC Failure – September 2020
Trigger Code Solvency Losses as % of Tier -1 Capital of the
Banking System
Number of Defaulting banks due to Solvency
NBFC 1 2.26 0
NBFC 2 2.21 0
NBFC 3 1.86 0
NBFC 4 1.30 1
NBFC 5 1.24 0
Note: Top five ‘Trigger NBFCs’ have been selected on the basis of solvency losses caused to the banking system. Source: RBI Supervisory Returns and staff calculations.
Table 2.9: Contagion Losses due to HFC Failure – September 2020
Trigger Code Solvency Losses as % of Tier -1 Capital of the
Banking System
Number of Banks Defaulting due to
solvency
HFC 1 5.92 0
HFC 2 3.70 0
HFC 3 1.97 1
HFC 4 1.92 1
HFC 5 1.34 0
Note: Top five ‘Trigger HFCs’ have been selected on the basis of solvency losses caused to the banking system. Source: RBI Supervisory Returns and staff calculations.

59
Financial Stability Report January 2021
of Tier 1 capital of the banking system amounted to 0.35 per cent for the baseline, 0.60 per cent for medium stress and 3.36 per cent for severe stress scenario. Under such conditions, one additional bank may fail due to contagion in the baseline and severe stress scenario (Chart 2.34).
2.76 The shrinking size of the inter-bank market and improved capital adequacy has limited contagion risk in the banking system under various scenarios. Nevertheless, as COVID-19 induced stress plays out going forward, capital adequacy across bank groups could come under pressure and contagion losses due to macro shocks under adverse scenarios could get exacerbated, unless the capital position of banks is shored up substantively.
Summary and Outlook
2.77 In sum, the growing convergence of the Indian banking system with post-GFC regulatory and prudential standards, created capital and liquidity buffers which provided resilience in the current pandemic. Going forward, these cushions in banks’ balance sheets will have to contend with the rollback of regulatory forbearances announced in the wake of the pandemic. Capital and asset quality ratios of SCBs will be tested as the true economic value of portfolios of banks and other financial
a. Solvency Losses b. Defaulting Banks
Chart 2.34: Contagion Impact of Macroeconomic Shocks (Solvency Contagion)
Note: The projected capital in September 2021 makes a conservative assumption of minimum profit transfer to capital reserves at 25 per cent and does not take into account any capital infusion by stakeholders. Source: RBI Supervisory Returns and staff calculations.
intermediaries is impacted by the disruption caused by the pandemic.
2.78 Macro-stress tests for credit risk show that GNPA ratio of SCBs may worsen under various stress scenarios and capital ratios may be eroded, highlighting the need for proactive provisioning and building up adequate capital to withstand the imminent asset quality deterioration. The direction to banks not to make any dividend payment on equity shares from the profits pertaining to the financial year ended March 31, 2020 is intended to strengthen balance sheets so that they can step forward to support lending to the real economy as recovery gains traction.
2.79 In the non-bank space, the dominant positions occupied by mutual funds and insurance companies needs to be assessed against the fact that non-banking financial companies and housing finance companies remain the largest borrowers, with systemic implications. Meanwhile, shrinking of the inter-bank market has reduced the risk of bank failure due to contagion effects. On its part, the Reserve Bank has stepped up close and continuous monitoring of all regulated entities and markets with the goal of maintaining and preserving financial stability at all times.

60
Chapter III Regulatory Initiatives in the Financial Sector
Chapter III
Regulatory Initiatives in the Financial Sector
Introduction
3.1 The COVID-19 pandemic continues to impose
tremendous human and economic costs. Public
institutions and authorities have maintained
unprecedented measures to manage the fallout
of the pandemic. Despite positive news on the
development of its vaccine offsetting to some extent
the gloom overshadowing global economic prospects
on account of the second wave, high uncertainty
prevails on the outlook for the global economic and
financial system and its constituents.
3.2 The rest of this chapter begins by addressing
recent regulatory and other measures taken globally
in Section III.1. Measures taken by India’s financial
sector regulators in their domains are described in
Sections III.2 to III.4. The final section concludes
with some perspectives on the outlook.
III.1 Global Developments
3.3 Strong policy interventions by central banks
to reduce interest rates, provide ample liquidity and
ensure credit to the commercial sector have so far
contained financial market volatility and reduced
the likelihood of adverse macro-financial feedback
loops in response to the pandemic. In aggregate, the
U.S. Federal Reserve, Bank of England (BoE) , Bank of
Japan (BoJ) and the European Central Bank (ECB) have
grown their balance sheets by US$ 5.6 trillion this
year alone (till end-November) through quantitative
easing. They have been emboldened by inflation
Extraordinary measures taken by central banks and other regulators to mitigate the impact of the pandemic have anchored financial stability and cushioned the deleterious effects of COVID-19 on economic activity. International standard setting bodies have also responded pro-actively to this evolving landscape. On the domestic front, financial sector regulators have maintained accommodative policies while being alert to the risks to financial stability. The Financial Stability and Development Council (FSDC) and its Sub-Committee remained alert to emerging challenges and coordinated initiatives by various regulators to strengthen financial sector resilience and stability.
indicators continuing to be subdued, although there
are some concerns that the overhang of liquidity has
the potential for overpricing of financial assets. The
ECB has recently decided to enhance the pandemic
emergency purchase programme (PEPP) by 500
billion to a total of 1,850 billion, extend the horizon
for net purchases under the PEPP to at least the
end of March 2022 and to extend the reinvestment
of principal payments from maturing securities
purchased under the PEPP until at least the end of
2023.
3.4 The liquidity phase of the crisis is now
giving way to the solvency phase as the impact of
economic disruptions on the banking sector unfolds,
especially in those sectors where the pandemic’s
impact has been the most destructive. This is visible
from banks stepping up precautionary provisioning
for loan losses even as surveys indicate tightening
of lending standards in various parts of the world.
In this context, the steps taken by major standard
setting authorities in respect of regulatory treatment
of direct relevance to banks’ balance sheets, viz.,
Capital, Liquidity and Expected Credit Loss (ECL)
provisioning, are outlined below.
III.1.1 Capital
3.5 The Basel Committee on Banking Supervision
(BCBS) announced that banks could use their capital
buffers during the crisis to absorb financial shocks
and to support the real economy by lending to

61
Financial Stability Report January 2021
creditworthy households and businesses. It also
encouraged supervisors to allow banks sufficient
time to restore buffers, taking account of economic
and market conditions as well as bank-specific
circumstances. The Financial Stability Board (FSB)
has supported the BCBSs’ policy stance and approach.
III.1.2 Liquidity
3.6 The BCBS signaled that it was acceptable for
banks to draw down their buffers of High-quality
Liquid Asset (HQLA) securities to meet unforeseen
liquidity demands, adding that supervisors may
provide sufficient lead time before the buffers are
restored. Some of the major regimes have introduced
sunset clauses towards utilisation of such buffers.
Illustratively, the ECB committed to allow banks to
operate below the Liquidity Coverage Ratio (LCR) until
at least end-2021 without automatically triggering
supervisory actions. The US Federal Reserve (Fed)
announced temporary measures extended upto
March 31, 2021 to help increase the availability
of intraday credit by suspending uncollateralised
intra-day credit limits and permitting a streamlined
procedure for secondary credit institutions to
request collateralised intraday credit.
III.1.3 Expected Credit Loss (ECL) provisioning
3.7 The International Accounting Standards
Board (IASB) issued a clarificatory statement1 on
application of International Financial Reporting
Standards - 9 (IFRS-9) for accounting of expected
credit losses in order to manage the economic
uncertainty resulting from the pandemic. While
IFRS-9 requires that lifetime ECLs be recognised
when there is a significant increase in credit risk
(SICR) on a financial instrument, the IASB cited the
example of not automatically treating the extension
of payment holidays to all borrowers in particular
classes of financial instruments as cases involving
SICR, emphasising that entities should not apply
their existing ECL methodology mechanically.
The IASB also opined that in the current stressed
environment, IFRS-9 and the associated disclosures
can provide much needed transparency to users of
financial statements.
III.1.4 Operational Risk in Banks
3.8 The pandemic has purveyed heightened
uncertainty and amplified operational risks in
banks affecting personnel, processes, information
systems and business continuity. Recognising the
need for heightened operational resilience, the BCBS
published a consultative document2 on proposed
principles for operational resilience and revision
to its ‘Principles for the Sound Management of
Operational Risk’ (PSMOR) which focuses on aspects
such as business continuity planning, cyber security,
and third-party risk management.
3.9 The Financial Action Task Force (FATF) issued
a paper3 discussing money laundering (ML) and/or
terrorist financing (TF) risks arising from COVID-19.
It posits that increased use of online services may
result in on-boarding customers without sufficient
customer due diligence (CDD) screening, thereby
facilitating undetected movement of virtual assets
and concealing of illicit funds. Such risks are
incipiently magnified as financial institutions remain
preoccupied with maintaining business continuity,
allowing lags in identification and reporting
suspicious transactions. To manage these potential
vulnerabilities, the paper recommends that AML/
combating the financing of terrorism (CFT) policy
responses should include (i) a domestic assessment
1 International Accounting Standards Board (2020): IFRS 9 and COVID-19, March.2 BIS (2020). Principles for Operational Resilience (consultative document). August.3 Financial Action Task Force (2020): “COVID-19-related Money Laundering and Terrorist Financing “, May.

62
Chapter III Regulatory Initiatives in the Financial Sector
of the impact of COVID-19 on AML/CFT risks and
systems; (ii) strengthening communication with the
private sector; (iii) encouraging the full use of a risk-
based approach to due diligence; (iv) encouraging
use of responsible digital identities while conducting
transactions; and (v) pragmatic, risk-based AML/CFT
supervision.
III.1.5 COVID-19 and the Insurance Sector
3.10 The International Association of Insurance
Supervisors (IAIS) published a statement highlighting
the impact of COVID-19 on the global insurance
sector, emphasising the importance of effective
policyholder protection and fair customer treatment
during the crisis. It also cautioned against insurers
being required to cover COVID-19 related losses
retrospectively, drawing attention to the adverse
impact this could have on solvency, capability to
meet other types of claims, and on financial stability
at large. The statement also noted that the crisis has
served to highlight the limits on the protection that
the insurance sector by itself can be expected to
provide.
III.1.6 Other International Regulatory
Developments in the Banking Sector
3.11 In July 2020, BCBS published the final revised
standard4 for Credit Valuation Adjustment (CVA)
risk viz., the risk faced by banks of incurring mark-
to-market losses because of the deterioration in
the creditworthiness of their counterparties in
derivatives or securities financing transactions. The
revision will result in reduced risk weights for CVA
in both Standardised Approaches (SA) and Basic
Approaches to CVA in respect of certain classes of
counterparties. The revised market risk framework
also introduced new ‘index buckets’ under which
banks could, under certain conditions, calculate
capital requirements by using credit and equity
indices directly instead of looking through to the
underlying constituents. The Committee has also
agreed to adjust the scope of portfolios subject to
CVA risk capital requirements by excluding some
securities financing transactions (SFTs). The targeted
revision has also revised overall calibration of the
CVA risk framework, leading to a reduced value of
the aggregate multiplier for banks using the SA-CVA
approach.
3.12 The FSB and the BCBS published a report5
on the findings of surveys on LIBOR transition
undertaken by them. The report highlights the
need for sustained efforts by both financial and
non-financial institutions across jurisdictions to
prepare for and facilitate the transition, noting that
financial institutions in LIBOR jurisdictions have
shown better progress in transitioning than those
in non-LIBOR jurisdictions. The report recommends
a three-pronged effort by authorities to support
the transition involving (i) engaging with trade
associations and periodically taking stock of LIBOR
exposure of financial institutions; (ii) establishing a
formal transition strategy and enhancing supervisory
action in case of banks exhibiting tardiness in
preparation; and (iii) promoting industry-wide
coordination and exchange of information on best
practices and challenges.
III.1.7 Holistic Review of the Market Turmoil in
March 2020
3.13 The FSB published its review6 of the
unprecedented financial market turmoil in March
2020, which highlighted the fundamental repricing
of risk and the heightened demand for safe assets
as well as large and persistent imbalances in the
4 BIS (2020): Targeted revisions to the credit valuation adjustment risk framework. July.5 Financial Stability Board (2020): Supervisory issues associated with benchmark transition, July.6 Financial Stability Board (2020): Holistic Review of the March Market Turmoil,November.

63
Financial Stability Report January 2021
demand for and supply of liquidity needed to
support intermediation. The review identified
three main areas of focus going forward: (i) work
to examine and address specific risk factors and
markets that contributed to amplification shock;
(ii) enhancing understanding of systemic risks in
the non-banking financial intermediation (NBFI)
space and the financial system as a whole, including
interactions between banks and non-banks and
cross-border spill-overs; and (iii) assessing policies
to address systemic risks in the NBFI space.
III.1.8 Global Monitoring Report on Non-bank Financial Intermediation
3.14 The Financial Stability Board (FSB), in its
recent report7 on non-bank financial intermediation
(NBFI), noted that the NBFI sector comprising
mainly pension funds, insurance corporations and
other financial intermediaries (OFIs)8 grew at a
faster pace than the banking sector and accounted
for 49.5 per cent of the global financial system in
2019. The expansion of collective investment
vehicles (CIVs), which are inherently susceptible to
runs, drove much of the growth. In EMEs, both the
pace of growth of the NBFI sector itself and credit
expansion by non-bank entities dependent on short-
term funding, were faster as compared to AEs.
III.1.9 Climate Change Risk
3.15 The FSB in its recent report9 on climate-related
risk has noted that the value of financial assets/
liabilities could be affected either by continuation in
climate change (physical risks), or by an adjustment
towards a low-carbon economy (transition risks).
The manifestation of physical risks could lead to a
sharp fall in asset prices and increase in uncertainty.
A disorderly transition to a low carbon economy
could also have a destabilising effect on the financial
system. Climate-related risks may also give rise to
abrupt increases in risk premia across a wide range of
assets amplifying credit, liquidity and counterparty
risks. Such changes could lead to a self-reinforcing
reduction in bank lending and insurance provision.
The report also observes that the efficacy of actions
taken by financial firms to mitigate climate-related
risks may be hampered by lack of data with which to
assess clients’ exposures to climate-related risks or
the magnitude of climate-related effects.
III.1.10 Risks from Outsourcing and Third-party Relationships
3.16 The FSB published a discussion paper10
identifying the regulatory and supervisory issues
relating to outsourcing and third-party relationships.
One of the key concerns highlighted is the possibility
of systemic risk arising from concentration in
the provision of some outsourced and third-party
services to financial institutions (FIs) wherein an
outage or failure at a single third party could create
a single point of failure with potential adverse
consequences for financial stability.
III.1.11 Development of Capital Markets in Emerging Markets
3.17 The International Organization of Securities
Commissions (IOSCO) published its final report11
examining the challenges and opportunities
that emerging market (EMs) jurisdictions face in
developing their capital markets. Some challenges
identified by the IOSCO include weak institutional
and legal frameworks, low levels of economic
development, and high levels of financial and social
7 Financial Stability Board (2020): Global Monitoring Report on Non-Bank Financial Intermediation, December.8 OFIs (other financial intermediaries), a subset of NBFI sector include investment funds, captive financial institutions and money lenders, central counterparties, broker-dealers, finance companies, trust companies and structured finance vehicles.9 Financial Stability Board (2020): The Implications of Climate Change for Financial Stability, November. 10 Financial Stability Board (2020): Regulatory and Supervisory Issues Relating to Outsourcing and Third-Party Relationships, November.11 IOSCO (2020): Development of Emerging Capital Markets: Opportunities, Challenges and Solutions, October.

64
Chapter III Regulatory Initiatives in the Financial Sector
risk. In addition, abusive related-party transactions,
disclosure failures, corruption scandals, and
undue political interference act as disincentives
for investors. While recognising that there is
no one-size-fits-all approach to capital markets
development, the report sets out the following
five key recommendations: (i) preparing a holistic
strategy for development of capital markets; (ii)
ensuring that capital markets are fair and efficient
for capital raising by increasing institutional investor
participation, providing diversified investment
options, and ensuring market confidence; (iii)
ensuring adequate resources, power and capacity to
securities regulators; (iv) establishing strong national
and international cooperation; and (v) developing
and implementing an efficient workplan for investor
education and guidance.
III.2 Domestic Developments
3.18 The Financial Stability and Development
Council (FSDC) and its Sub Committee (FSDC-
SC) continued to monitor evolving conditions in
the financial system through formal and informal
interactions. In its 23rd meeting on December 15,
2020 chaired by the Finance Minister, the Council
reviewed major global and domestic macroeconomic
developments and financial stability issues with
special reference to vulnerability related issues
and noted that the policy measures taken by the
Government of India and the financial sector
regulatory authorities have ensured a faster
economic recovery in India relative to initial
expectations, as reflected in the reduced contraction
of GDP in Q2 of 2020-21. The economy has gained
momentum and the path to recovery will be faster
than what was predicted earlier. Discussions were
held on further measures which may be required to
be taken to ensure consistent support to the financial
sector, while continuing to maintain financial
stability. Challenges involved in smooth transition
of London Interbank Offered Rate (LIBOR) based
contracts to alternative benchmarks were discussed.
It noted that a multipronged strategy involving
relevant stakeholder institutions and departments
is required in this regard.
3.19 At its 25th meeting held on August 31, 2020, the
FSDC-SC reviewed global and domestic developments
and the state of financial markets that impinge on
financial stability. It discussed issues relating to
inter-regulatory coordination and the working of its
inter-regulatory technical groups. It also reviewed
the initiatives and activities of National Centre for
Financial Education (NCFE) and the functioning
of State Level Coordination Committees (SLCCs)
in various states/UTs. Regulators reaffirmed their
commitment to continue coordinating on various
initiatives and measures to strengthen the financial
sector in these extraordinarily challenging times.
III.3 Initiatives from Regulators/Authorities
3.20 The Reserve Bank and other financial sector
regulators have kept up their multidimensional
efforts to maintain financial stability and to
mitigate the impact of COVID-19. These measures
are essentially directed at continuing and
complementing the earlier liquidity and regulatory
support to ease constraints posed by the pandemic
for maintaining market integrity and resilience.
III.3.1 Credit Related Measures
3.21 The Reserve Bank announced a resolution
framework to mitigate the impact of the pandemic-
induced stress on borrowers and to facilitate revival
of real sector activity in August 2020. It provides a
window under the prudential framework to enable
lenders to implement a resolution plan in respect
of eligible corporate exposures without change in
ownership, while classifying them as ‘standard’ but
subject to specified conditions and also includes
personal loans. Subsequently, broadly accepting
the recommendations of the Expert Committee
(Chairman: Shri K V Kamath) the Reserve Bank

65
Financial Stability Report January 2021
notified the financial parameters and the sector-
specific thresholds to be considered while finalising
resolution plans for exposures other than personal
loans under the resolution framework.
3.22 Continuing its support to the micro, small
and medium enterprises (MSME) sector, the Reserve
Bank extended the existing restructuring framework
for MSMEs upto March 31, 2021 covering borrowers
whose aggregate exposure, including non-fund
exposures, does not exceed `25 crore and which are
classified as ‘standard’ as on March 1,2020, without
a downgrade in the asset classification, subject to
certain conditions.
3.23 The Government of India as part of its ‘Atma
Nirbhar Bharat Abhiyan’ (self-reliance) package
extended the Emergency Credit Line Guarantee
Scheme (ECLGS 1.0) upto March 31, 2021 and raised
the loan size eligibility ceiling. The Government also
launched a second version of the Scheme (ECLGS
2.0) offering credit guarantee for loans by banks and
NBFCs to identified stressed sectors. The Reserve
Bank permitted lending institutions to assign zero
risk weight to the credit facilities extended under
the scheme to the extent of guarantee coverage.
III.3.2 Support for the NBFC sector
3.24 NBFCs were adversely impacted by COVID-
related stress due to their underlying business
models. On the supply side, the sources of funds
dried up, more so for the small and mid-sized
NBFCs, on account of reduced risk appetite of banks
for low rated and unrated exposures. The situation
was worsened by the unprecedented redemption
pressure overshadowing the mutual fund industry,
resulting in a spike in spreads. On the demand side,
it became difficult for NBFCs to find creditworthy
projects and borrowers to lend to as a result of the
pandemic induced stress.
3.25 A key measure taken by the Reserve Bank and Government of India during H1:2020-21 to ameliorate the liquidity constraints faced by NBFCs, was to set up a Special Purpose Vehicle (SPV) to purchase short-term papers from eligible NBFCs/HFCs, which could then utilise the proceeds to extinguish their existing liabilities. The special securities issued by the SPV were guaranteed by the Government of India and would be purchased by the Reserve Bank. Additionally, the scope of the Government scheme on partial credit guarantee (PCG) was expanded to cover the borrowings of lower-rated NBFCs, HFCs and MFIs.
III.3.3 Insurance Sector
3.26 In view of the multifarious risks arising in the wake of the COVID-19 pandemic, the Insurance Regulatory and Development Authority of India (IRDAI) constituted a Working Group to explore the possibility of addressing these risks through the mechanism of a “Pandemic Risk Pool”. The Group has proposed a Government backstop of about `75,000 crore in the initial stages, investment of pool premium collected in Government securities or specifically designed Government bonds and mandatory participation for the sectors which are covered.
III.3.4 Customer Protection
3.27 In the context of the pandemic, the use of digital modes for conducting transactions gathered substantial traction. Pari passu, the risks of new users falling prey to various forms of online frauds also increased. In this regard, the Reserve Bank intensified its multi-lingual awareness campaigns on safe digital banking, instructions on limited liability of customers in fraudulent electronic transactions and the Ombudsman scheme, over different media platforms. The Reserve Bank also issued instructions12 requiring authorised payment
12 RBI (2020): “Increasing Instances of Payment Frauds – Enhancing Public Awareness Campaigns Through Multiple Channels”, Circular No. RBI/2019-20/256 DPSS.CO.OD.No.1934/06.08.005/2019-20, June.

66
Chapter III Regulatory Initiatives in the Financial Sector
system operators and participants (banks as well
as non-banks) to undertake targeted multi-lingual
campaigns to educate their users on safe and secure
use of digital payments.
III.3.5 Resolution and Recovery
3.28 Recent developments have necessitated
calibration of the insolvency framework to prevent
otherwise viable enterprises from being forced into
insolvency proceedings on account of the financial
stress induced by the pandemic. Towards this end,
the Government of India, by notification, has raised
the threshold amount of default required to initiate
an insolvency proceeding from `1 lakh to `1 crore
and has also inserted Section 10A in the IBC for
suspension of initiation of the corporate insolvency
resolution process (CIRP) of a corporate debtor for
any default arising on or after March 25, 2020 for a
period of six months, which was further extended
by six months in two tranches of three months each
i.e., up to March 24, 2021.
III.4 Other Regulatory Developments
3.29 In addition to taking targeted measures to
address COVID-related dislocations, financial sector
regulators kept up their efforts to strengthen the
resilience of regulated entities, support robustness
of market infrastructure and promote the ease of
operations for market participants (Annex 3). Some
of these initiatives are highlighted below.
III.4.1 Bilateral Netting of Contracts
3.30 In a major step towards promoting financial
sector stability and development, the Bilateral
Netting of Qualified Financial Contracts Act, 2020
came into effect from October 01, 2020. It recognises
bilateral netting for all qualified financial contracts
entered into between qualified financial market
participants, and also ensures the enforceability
of collateral associated with the contract. In its
absence, when one of the counterparties to a set
of financial contracts went into bankruptcy, there
was uncertainty on enforceability of collateral and
the other counterparty would have to continue to
make the payment as per the financial contracts,
though there would be uncertainty on receiving the
payment from the counterparty who has gone into
bankruptcy. The new legislation carries substantial
benefits for the financial sector in terms of conserving
capital for banks, encouraging market participants to
use derivatives including credit default swaps (CDS)
for risk hedging and risk mitigation. It will also help
in deepening of the bond market by facilitating
corporate bonds issuance by low rated issuers. It will
also enable market participants to exchange margins
for non-centrally cleared OTC derivatives (NCCDs)
on a net basis.
Payment and Settlement Systems
III.4.2 Launch of RTGS 24x7
3.31 The Reserve Bank’s Payment Systems Vision
2021 aspires to ensure efficient and uninterrupted
availability of safe, secure, accessible and affordable
payment systems. In pursuance of this vision, and
to expand flexibility for businesses for effecting
payments, the Reserve Bank made the Real Time
Gross Settlement (RTGS) system available round the
clock on all days of the year from December 14, 2020.
India has become one of the few countries in the
world to achieve this milestone. The RTGS 24x7x365
was implemented on the back of operationalising
round the clock National Electronic Fund Transfer
(NEFT) system a year ago. The RTGS presently
handles around 6 lakh transactions daily for a value
of around `4 lakh crore across 237 participant banks
with the average ticket size of ̀ 57.96 lakh (November
2020).
III.4.3 Remittances through Indian Payment
Systems
3.32 The payment and settlement systems vision of
the Reserve Bank envisages the scope for enhancing
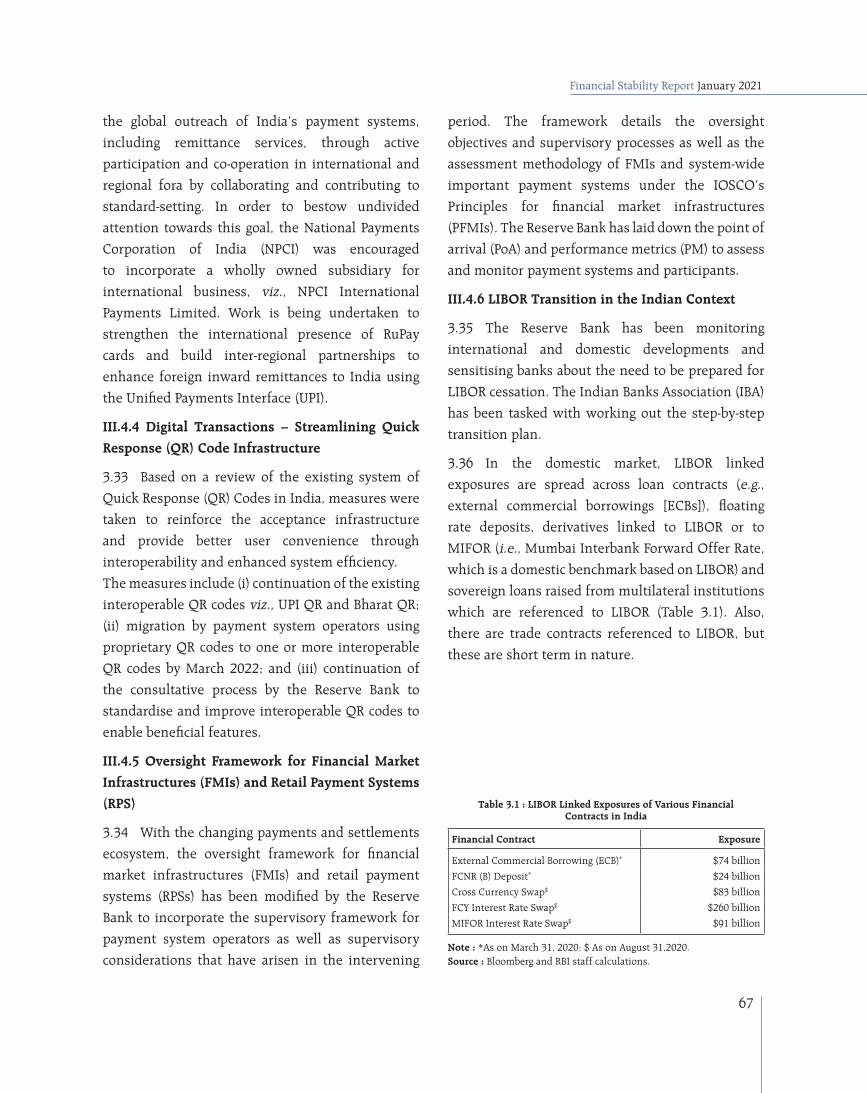
67
Financial Stability Report January 2021
the global outreach of India’s payment systems,
including remittance services, through active
participation and co-operation in international and
regional fora by collaborating and contributing to
standard-setting. In order to bestow undivided
attention towards this goal, the National Payments
Corporation of India (NPCI) was encouraged
to incorporate a wholly owned subsidiary for
international business, viz., NPCI International
Payments Limited. Work is being undertaken to
strengthen the international presence of RuPay
cards and build inter-regional partnerships to
enhance foreign inward remittances to India using
the Unified Payments Interface (UPI).
III.4.4 Digital Transactions – Streamlining Quick Response (QR) Code Infrastructure
3.33 Based on a review of the existing system of
Quick Response (QR) Codes in India, measures were
taken to reinforce the acceptance infrastructure
and provide better user convenience through
interoperability and enhanced system efficiency.
The measures include (i) continuation of the existing
interoperable QR codes viz., UPI QR and Bharat QR;
(ii) migration by payment system operators using
proprietary QR codes to one or more interoperable
QR codes by March 2022; and (iii) continuation of
the consultative process by the Reserve Bank to
standardise and improve interoperable QR codes to
enable beneficial features.
III.4.5 Oversight Framework for Financial Market Infrastructures (FMIs) and Retail Payment Systems (RPS)
3.34 With the changing payments and settlements
ecosystem, the oversight framework for financial
market infrastructures (FMIs) and retail payment
systems (RPSs) has been modified by the Reserve
Bank to incorporate the supervisory framework for
payment system operators as well as supervisory
considerations that have arisen in the intervening
period. The framework details the oversight
objectives and supervisory processes as well as the
assessment methodology of FMIs and system-wide
important payment systems under the IOSCO’s
Principles for financial market infrastructures
(PFMIs). The Reserve Bank has laid down the point of
arrival (PoA) and performance metrics (PM) to assess
and monitor payment systems and participants.
III.4.6 LIBOR Transition in the Indian Context
3.35 The Reserve Bank has been monitoring
international and domestic developments and
sensitising banks about the need to be prepared for
LIBOR cessation. The Indian Banks Association (IBA)
has been tasked with working out the step-by-step
transition plan.
3.36 In the domestic market, LIBOR linked
exposures are spread across loan contracts (e.g., external commercial borrowings [ECBs]), floating
rate deposits, derivatives linked to LIBOR or to
MIFOR (i.e., Mumbai Interbank Forward Offer Rate,
which is a domestic benchmark based on LIBOR) and
sovereign loans raised from multilateral institutions
which are referenced to LIBOR (Table 3.1). Also,
there are trade contracts referenced to LIBOR, but
these are short term in nature.
Table 3.1 : LIBOR Linked Exposures of Various Financial Contracts in India
Financial Contract Exposure
External Commercial Borrowing (ECB)* $74 billion
FCNR (B) Deposit* $24 billion
Cross Currency Swap$ $83 billion
FCY Interest Rate Swap$ $260 billion
MIFOR Interest Rate Swap$ $91 billion
Note : *As on March 31, 2020; $ As on August 31,2020.Source : Bloomberg and RBI staff calculations.

68
Chapter III Regulatory Initiatives in the Financial Sector
3.37 The key steps to be taken to ensure a
smooth transition in the Indian context include: (i)
development of alternate methodologies to replace
MIFOR; (ii) development of fallback clauses that
are customised to the Indian market but based
on practices adopted globally; (iii) promoting
stakeholder awareness to deal with issues around
the contract renegotiation; and (iv) notifying a cut-
off date closer to the LIBOR cessation date beyond
which institutions should cease to enter into new
contracts that make reference to LIBOR. This is also
dependent on the evolution of the global adoption
of financial contracts that reference alternative
reference rates (ARRs).
III.4.7 Cyber Security
3.38 The Indian Computer Emergency Response
Team (CERT-In) has undertaken several measures
to strengthen cyber resilience of financial entities
in the country. These include: (i) cyber security
exercises/ drills; (ii) operating Cyber Swachhta
Kendra (Botnet Cleaning and Malware Analysis
Centre); (iii) disseminating cyber threat intelligence
in real time; (iv) sharing tailored advisories with the
CISO community in the financial sector; (v) releasing
the report of the Secure Digital Payments working
group for Asia Pacific CERT members to address
security threats and evolve best practices to secure
digital payments; (vi) developing a toolkit (as a
member of the Financial Stability Board) on Cyber
Incident Response and Recovery for enhancing cyber
resilience; and (vii) establishment of Financial Sector
Computer Security Incident Response Team (CSIRT-
Fin) under the umbrella of CERT-In since mid-May
2020.
3.39 The Reserve Bank has been placing emphasis
on digital banking, which has a massive customer
base now. There is a need for all financial entities
to invest adequately in secure, robust, scalable and
fault-tolerant IT infrastructure so that they remain
competitive, expansion plan is well supported and
public confidence is maintained. Inability to manage
the operational risk/s, particularly, controlling
the incidence of frauds, both cyber-related and
otherwise, is another visible area of concern in the
arena of fraud risk management. The Reserve Bank
takes appropriate supervisory action on case-to-case
basis depending on concerns / deficiencies.
3.40 With an aim to strengthen the cyber resilience
of the primary (urban) co-operative banks (UCBs)
against the evolving IT and cyber threat environment,
the Reserve Bank released the ‘Technology Vision for
Cyber Security: 2020-2023’ for UCBs, based on inputs
from various stakeholders. It envisages a five-pillared
strategic approach covering (i) governance oversight;
(ii) Utile technology investment; (iii) appropriate
regulation and supervision; (iv) robust collaboration;
and (v) developing necessary IT and cyber security
skills sets. It aspires to (a) involve more oversight by
banks’ Board over cyber security; (b) enable UCBs to
better secure their IT assets; (c) implement an offsite
supervisory mechanism framework for UCBs on
cyber security related controls; (d) develop a forum
where UCBs can share best practices and discuss
practical issues and challenges; and (e) implement
a framework for providing awareness/ training for
effective management of the associated risks by
UCBs.
III.4.8 Risk Mitigation Measures
3.41 In the context of the use of multiple operating
accounts by large borrowers, the Reserve Bank issued
revised instructions aimed at improving credit
discipline on opening current accounts for customers
who have availed cash credit (CC) / overdraft (OD)
facilities from the banking system. The formats of
the Long Form Audit Report to be used by Statutory
Auditors were reviewed and revised. All authorised
payment systems operators and participants
were advised to undertake targeted multi-lingual
campaigns by way of short message services (SMSs)

69
Financial Stability Report January 2021
and advertisements in print and visual media, to
educate their users on safe and secure use of digital
payments. In addition, instructions on reporting of
frauds to law enforcement agencies, early warning
signal (EWS) mechanisms, red-flagged accounts
and commissioning of forensic audit are being
reviewed. The Institute of Chartered Accountants of
India (ICAI) is in the process of developing forensic
accounting and investigation standards (FAIS)
aimed at standardising the work undertaken by its
members in this area.
III.4.9 Deposit Insurance
3.42 With the limit of deposit insurance in India
raised to ̀ 5 lakh, insured deposits stood at ̀ 68,71,500
crore in March 2020 constituting 50.9 per cent of
total assessable deposits at `1,34,88,900 crore. Fully
protected accounts constituted 98.3 per cent of the
total number of accounts. Of the total premium of
`13,234 crore collected from member banks during
2019-20, commercial banks contributed 93 per cent
and co-operative banks accounted for the remaining
seven per cent. The premium received during H1:
2020-21 was ̀ 8,540 crore. The Deposit Insurance and
Credit Guarantee Corporation (DICGC) sanctioned
aggregate claims of `80.7 crore in respect of 10 co-
operative banks during 2019-20.
Table 3.3 : Corporate Insolvency Resolution Process(Number)
Quarter CIRPs at the beginning of the Period
Admitted Closure by CIRPs at the end of the
PeriodAppeal/ Review/ Settled
Withdrawal under Section 12A
Approval of Resolution Plan
Commencement of Liquidation
2016-17 0 37 1 0 0 0 362017-18 36 705 90 0 20 90 5412018-19 541 1152 141 95 80 306 1071Q1:2019-20 1071 301 45 31 26 96 1174Q2:2019-20 1174 588 46 43 33 155 1485Q3:2019-20 1485 623 71 43 40 150 1804Q4:2019-20 1804 441 62 46 36 135 1966Q1:2020-21 1966 81 7 21 20 25 1974Q2:2020-21 1974 80 10 12 22 68 1942Total NA 4008 473 291 277 1025 1942
These CIRPs are in respect of 3936 corporate debtors.This excludes one corporate debtor, which has moved directly from BIFR to resolution.Source: Compilation from website of the NCLT and filing by Insolvency Professionals.
Table 3.2 : Insured Deposits of Cooperative Banks(` crore)
Quarter ended STCBs/DCCBs Under
Direction
UCBs Under
Direction
Weak UCBs
except (3)
Total (2+3+4)
(1) (2) (3) (4) (5)
June 2020 4,945 11,697 5,151 21,793
September 2020 4,945 11,688 5,151 21,784
Source: DICGC.
3.43 In case of observations of serious irregularities
observed during inspections, the Reserve Bank
issues directions to co-operative banks to protect
the interests of depositors and in public interest.
As at end-September 2020, insured deposits of
banks under direction and weak banks constituted
about 0.3 per cent of the total insured deposits of
commercial and co-operative banks, and 18.2 per
cent of the deposit insurance fund (Table 3.2).
III.4.10 Corporate Insolvency Resolution Process (CIRP)
3.44 As at the end of Q2:2020, the number of CIRPs
admitted since the inception of the Insolvency
and Bankruptcy Code (IBC) stood at 4008, with the
manufacturing sector accounting for the largest
share (Table 3.3 and 3.4).There was a sharp decline
in the number of CIRPs during Q1 and Q2:2020 as
compared to previous quarters, owing to temporary

70
Chapter III Regulatory Initiatives in the Financial Sector
Table 3.4 : Sectoral Distribution of CIRPs as on September 30, 2020
Sector No. of CIRPs
Admitted Closure by Ongoing
Appeal/Review/Settled
Withdrawal under Section
12 A
Approval of Resolution
Plan
Commencement of Liquidation
Total
Manufacturing 1639 163 118 140 449 870 769Food, Beverages & Tobacco Products 208 17 10 15 58 100 108Chemicals & Chemical Products 164 16 15 19 38 88 76Electrical Machinery & Apparatus 118 14 4 5 45 68 50Fabricated Metal Products 92 8 11 4 28 51 41Machinery & Equipment 183 25 20 10 45 100 83Textiles, Leather & Apparel Products 279 27 18 19 98 162 117Wood, Rubber, Plastic & Paper Products 195 17 18 20 38 93 102Basic Metals 286 26 11 35 73 145 141Others 114 13 11 13 26 63 51Real Estate, Renting & Business Activities 793 123 75 34 166 398 395Real Estate Activities 188 36 16 5 18 75 113Computer and related activities 115 15 12 1 29 57 58Research and Development 5 1 1 1 0 3 2Other Business Activities 485 71 46 27 119 263 222
Construction 428 70 36 26 76 208 220Wholesale & Retail Trade 398 39 22 16 127 204 194Hotels & Restaurants 93 15 9 10 20 54 39Electricity & Others 124 11 3 10 22 46 78Transport, Storage &Communications 119 15 7 9 40 71 48Others 414 37 21 32 125 215 199Total 4008 473 291 277 1025 2066 1942
Note: The distribution is based on the CIN of corporate debtors and as per National Industrial Classification (NIC 2004).Source: Insolvency and Bankruptcy Board of India (IBBI).
suspension of the process, in the wake of the
pandemic situation.
3.45 Of the CIRPs initiated, 277 ended in
resolutions up to end-September 2020. Realisation
by creditors under resolution plans in comparison to
liquidation value stood at 185.2 per cent, while the
realisation was 43.6 per cent in comparison to their
claims (Table 3.5). Significantly, out of the above
277 resolutions, 91 corporate debtors were under
Board for Industrial and Financial Reconstruction
Table 3.5 : Outcome of CIRPs initiated Stakeholder-wise, as on September 30, 2020
Outcome Description Financial Creditor Operational Creditor Corporate Debtor Total
Status of CIRPs Closure by Appeal/Review/Settled 124 343 6 473
Closure by Withdrawal u/s 12A 88 198 5 291
Closure by Approval of Resolution Plan 157 80 40 277
Closure by Commencement of Liquidation 444 438 143 1025
Ongoing 917 958 67 1942
Total 1730 2017 261 4008
CIRPs yielding Resolution Plans
Realisation by FCs (% of Liquidation Value) 192.09 112.40 142.77 185.15
Realisation by FCs as % of their Claims 46.84 21.80 25.30 43.56
Average time taken for Closure of CIRP 444 406 443 433
CIRPs yielding Liquidations
Liquidation Value as % of Claims 6.35 9.19 9.89 7.20
Average time taken for Closure of CIRP 336 304 306 318
Source: IBBI.

71
Financial Stability Report January 2021
(BIFR) processes or defunct. The CIRPs which yielded resolution plans by the end of September 2020 took an average of 384 days (after excluding the time excluded by the Adjudicating Authority) for conclusion of the process.
3.46 Out of the CIRPs closed, nearly half yielded orders for liquidation. In 73.5 per cent of these cases (751 out of 1022 for which data is available), the corporate debtors were earlier with BIFR and / or defunct (Table 3.6) and the economic value in most cases had already eroded before they were admitted into CIRP. These corporate debtors had assets, on average, valued at less than five per cent of the outstanding debt amount.
III.4.11 Mutual Funds
3.47 During the first half of 2020-21, net inflow of `1.5 lakh crore into mutual fund schemes was much higher than that of `0.6 lakh crore during the same period in the previous year. Income/debt-oriented schemes attracted the major share of the inflows (`1.2 lakh crore) whereas growth/equity-oriented schemes accounted for a relatively meagre amount
Table 3.6 : CIRPs Ending with Orders for Liquidation till September 30, 2020
State of Corporate Debt-or at the Commencement of CIRP
No. of CIRPs initiated by
Financial creditor
Operational Creditor
Corporate Debtor
Total
Either in BIFR or Non-functional or both
304 337 110 751
Resolution Value > Liquidation Value
67 35 26 128
Resolution Value ≤ Liquidation Value*
374 404 116 894
*: Includes cases where no resolution plans were received and cases where liquidation value is zero or not estimated.Note: 1. There were 57 CIRPs, where corporate debtors were in BIFR or
non-functional but had resolution value higher than liquidation value.
2. Data of 3 CIRPs is awaited.Source: IBBI.
Table 3.7: SIPs in 2020-21 (April 01, 2020 to September 30, 2020)
Existing at the beginning of the period
(excluding STP)
Registered during the
period
Matured during the period
Terminated prematurely
during the period
Closing no. of SIPs at end of
period
SIP AUM at the beginning of the
period
SIP AUM at the end of the period
(Number in lakhs) (in ` crore)
315 72 15 35 337 2,38,821 3,75,968
Source: SEBI.
Source: Securities and Exchange Board of India (SEBI).
Chart 3.1: Trends in Resource Mobilisation by Mutual Funds and AUM
(`2,496 crore). All other schemes together recorded inflows of `0.3 lakh crore.
3.48 The mutual fund industry’s assets under management (AUM) increased by 10.9 per cent (y-o-y) at the end of November 2020 (Chart 3.1).
3.49 Systematic investment plans (SIPs) continued to remain a favoured choice for investors. During April–September 2020, the number of folios of SIPs
increased by 22 lakh (Table 3.7).

72
Chapter III Regulatory Initiatives in the Financial Sector
III.4.12 Capital Mobilisation - Equity and Corporate Bonds
3.50 Despite the pandemic, fund mobilisation from
the primary market during the first half of 2020-21
was 14.1 per cent higher than in the corresponding
period in 2019-20. This was owing to an increase of
24.9 per cent in funds raised through debt placements
(through public issue and private placement). Fund
mobilisation through equity declined by 6.6 per cent
during the period (Chart 3.2).
3.51 During the first half of 2020-21, funds raised
through QIPs went up by 152 per cent over the
same period in the previous year, while those raised
through preferential allotment fell by 78.3 per
cent. Funds mobilised through public issues almost
doubled during this period. In case of debt, private
placement of debt increased by 27.7 per cent during
H1 of 2020-21 compared to the same period in the
previous year (Chart 3.3).
III.4.13 Credit Ratings
3.52 On an aggregate basis, there was an increase in
the share of downgraded/ suspended companies in
total outstanding ratings during the quarter ending
June 2020, as compared with the prior two quarters.
Chart 3.2: Capital Mobilisation in the Primary Market
(` lakh crore)
Source: SEBI.
a. Equity Issues b. Debt Issues
Chart 3.3 : Capital Mobilisation through Equity and Debt Issues (` lakh crore)
Source: SEBI.

73
Financial Stability Report January 2021
This share went down significantly, however, during
the quarter ending September 2020 (Chart 3.4).
3.53 The rating downgrades during H1:2020-21
spanned various sectors; however, the proportion
of downgrades relating to the NBFC and HFC sector
as well as banks and financial services went down
significantly during the September 2020 quarter as
compared to the preceding quarter (Chart 3.5).
III.4.14 Commodity Derivatives Market
3.54 The impact of the COVID-19 pandemic on
global commodity prices has been mixed, with the
energy sector bearing the brunt and metals and
agriculture prices falling less steeply in comparison
(Chart 3.6). Precious metal prices continued to rise
during the pandemic on safe haven demand. Of late,
commodity prices have reverted from their lows in
March/April 2020, boosted by a rebound in economic
activity. The metal price surge has been led by the
industrial upturn and surge in consumption by
China.
Domestic Commodity Derivatives Market
3.55 Favourable monsoons enabled a robust kharif
crop and raised expectations of softening food
prices as the lockdown related supply disruptions
eased. Reflecting this, the benchmark commodity
derivative indices, MCX iCOMDEX composite and
Nkrishi index gained 27.2 per cent and 15.3 per cent,
Chart 3.4: Debt Issues of Listed Companies in terms of Rating Action
Source: Individual CRAs.
Chart 3.5: Distribution of Rating Downgrades- Sector wise
Source: Individual CRAs.
Chart 3.6: Movement of Global Commodity Price Indices
Source: World Bank.

74
Chapter III Regulatory Initiatives in the Financial Sector
respectively, during the financial year so far (up to
December 31, 2020) (Chart 3.7).
3.56 The recovery in the indices was more
pronounced post July 2020 and the iCOMDEX
Bullion index climbed by 23.7 per cent during the
current financial year, as the safe haven demand for
precious metals, especially gold, led to a historic rally
in prices. The iComdex Crude oil index recovered
from its record low in April 2020 rising by 10.1 per
cent. The iComdex base metal index showed the
most robust movement, with an increase of 42.9 per
cent during 2020-21 so far (up to December 31, 2020)
(Chart 3.8).
Trading Activity in the Commodity Derivatives Market
3.57 Despite an across-the-board decline of turnover
in all segments except bullion, which increased by 93
per cent, the aggregate turnover in the commodity
derivatives market, showed a marginal uptick of 3.2
per cent during 2020-21 (up to November 2020) as
compared with the corresponding period last year
(Chart 3.9 and Table 3.8). While the turnover of
futures contracts declined by 2.8 per cent, that of
the options segment increased by 227.6 per cent,
driven by introduction of commodity options at BSE
and NSE since June 2020. In contrast to the uptrend
witnessed in turnover, the total traded contracts at
NCDEX and MCX declined (y-o-y) by 31.2 per cent
and 34.5 per cent, respectively, during the current
year so far (up to November 2020). Traded volumes
(in tonnes) in the metal and energy segments at
MCX and the agri segment at NCDEX fell by almost
50 per cent.
Chart 3.7: Domestic and International Commodity Futures Indices
Source: MCX, NCDEX and Bloomberg.
Chart 3.8 : Select Sectoral Indices
Source: MCX.
Chart 3.9 : Commodity Derivatives
Turnover at Exchanges (Futures and Options)(` crore)
Source: BSE, ICEX, MCX, NCDEX and NSE.

75
Financial Stability Report January 2021
3.58 Notwithstanding the overall challenging
milieu, new products such as options in goods
contracts in the agri segment and trading of index
futures products like Agridex futures, Bulldex
futures and Metaldex futures were introduced.
The Index futures segment at MCX recorded a total
turnover of `19,529 crore and that at NCDEX was
`295 crore during this period.
III.4.15 Insurance
3.59 The impact of COVID-19 on new business
premiums pertaining to life insurance was
discernible in the negative double-digit growth rates
registered beginning March 2020 and continuing
up to June 2020 (Chart 3.10). This contraction
was, however, completely offset in the subsequent
months. New business premiums increased by 3 per
cent on an y-o-y basis as at the end of October 2020.
During the period, customers showed an increased
preference for non-linked Insurance products that
offer explicitly guaranteed benefits as compared
with unit-linked insurance products.
3.60 The impact of COVID-19 on the premium
collection figures of non-life insurers was mixed.
“Pull” products like fire and health insurance
performed well, but regulatorily mandated insurance
products dependent on economic factors (e.g., marine, motor and crop insurance) did not fare well.
Marine insurance contracted due to the fall in cargo
movement. Crop insurance declined as some states
opted out of the Pradhan Mantri Fasal Bima Yojana.
While new motor insurance premium collections
improved on account of higher vehicle sales post-
Chart 3.10 : New Life InsuranceBusiness Premiums – Growth (m-o-m)
Source: IRDAI.
Table 3.8: Segment-wise Turnover in Commodity Derivatives (Futures and Options) (` crore)
Period/Turnover Agri Bullion Energy Metals Gems and Stones Total Turnover
2020-21 (April-November) 2,33,199 36,51,498 10,32,070 11,34,603 554 60,51,924
2019-20 (April-November) 4,05,549 18,85,570 24,23,082 11,33,187 16,728 58,64,116
y-o-y change (per cent) -42.5 93.7 -57.4 0.1 -96.7 3.2
Share in Total Turnover (per cent; Nov,20 ) 4 60 17 19 0 100
Source: BSE, ICEX, MCX, NCDEX and NSE.

76
Chapter III Regulatory Initiatives in the Financial Sector
lockdown, premium collections from vehicle owners
impacted by the work-from-home model were lower.
3.61 Regulatory initiatives taken by the Insurance
Regulatory and Development Authority of India
(IRDAI) had a positive impact on the growth
of premiums in the health insurance business
(Table 3.9).
3.62 Insurance premiums collected under various
COVID-19 specific policies stood at around `865
crore for an insured sum of `13 lakh crore up to end-
September 2020. Senior citizens (above 60 years in
age) accounted for about seven per cent of the lives
covered under ‘Corona Kavach’ policy and four per
cent of lives covered under ‘Corona Rakshak’ and
other COVID-19 specific products (Table 3.10).
3.63 From April to November 2020, the life
insurance industry has received 12753 claims
(where death was due to COVID-19 and related
complications) worth `990 crore. In terms of value
they constitute 0.3 per cent of total premium
income in the same period. 11,464 death claims
amounting to `687 crore have been settled and
1259 claims amounting to `303 crore are under
process. This has no significant impact on the
financials of the life insurers, so far. The claim paid
ratio on the basis of number of claims is 92.76 per
cent with respect to individual claims and 95.44
per cent in Group for the period April-September
2020 in comparison to 90.09 per cent and 96.47 per
cent for the corresponding period last year. Thus,
there is no significant impact of COVID-19 overall
on death claim settlement.
III.4.16 Pension Funds
3.64 Enrolment as well as Assets under
Management (AUM) of the National Pension System
(NPS) and Atal Pension Yojana (APY) increased
Table 3.9: Growth in Health Insurance sector*
Type of Business Q1:2020-21 Q1:2019-20 % Change H1:2020-21 H1:2019-20 % Change
Government Business 631 961 -34.4 1,843 2,567 -28.2
Group Business 7,776 7,180 8.3 14,929 12,908 15.7
Individual Business 4,990 4,025 24.0 11,927 8,879 34.3
Total 13,397 12,166 10.1 28,699 24,354 17.8
Note *: Excluding Personnel Accident and Travel Insurance
Source: General Insurance Council.
Table 3.10 : Business in COVID specific Insurance Products
(April 1, 2020 to September 30, 2020)
Type of business / Units No. of Policies Lives covered Total Sum Insured Gross Premium
Number ` Crore
Corona Kavach 19,58,677 32,86,692 1,12,253 469.66
Corona Rakshak 3,80,270 4,42,812 7,481 57.03
Other COVID Specific products 36,954 73,39,399 11,70,851 338.12
Total 23,75,901 1,10,68,903 12,90,585 864.81
Source: IRDAI.

77
Financial Stability Report January 2021
on a y-o-y basis (Table 3.11). In the effort towards
financial inclusion of the unorganised sector and
the low-income groups, 391 banks were registered
under APY with the aim of expanding the coverage
of citizens under the pension net.
III.4.17 International Financial Services Centres Authority (IFSCA)
3.65 The International Financial Services Centres
Authority13 (IFSCA) was set up in April 2020 to
develop a strong global connect and focus on the
needs of the Indian economy as well as to serve
as an international financial platform for the
entire region and the global economy as a whole.
Specifically, the Authority is aiming to develop
GIFT-IFSC as a destination for fund-raising by
both Indian and foreign issuers, fintech start-ups
and innovations, sustainable and green financing,
bullion trading, aircraft leasing and financing, global
in-house centres, fund management, international
banking and reinsurance. It introduced frameworks
for Regulatory Sandbox, Real Estate Investment
Trusts (REITs) and Infrastructure Investment Trusts
(InvITs) in IFSC and listing of depository receipts in
IFSC, among others.
Summary and Outlook
3.66 Overall, the authorities’ initial response to
the COVID-19 pandemic was massive given the
enormity of the problem. Prompt measures across
13 IFSCA was established in April 2020 as a unified regulator for development and regulation of financial institutions, financial services and financial products in the International Financial Services Centres (IFSCs). The country’s first IFSC operates at the Gujarat International Finance Tec (GIFT) City, Gandhinagar.
Table 3.11 : Subscribers and AUM: NPS and APY
Sector Subscribers (in lakhs) AUM (` crore)
September 2019
September 2020
September 2019
September 2020
Central Government 20.26 21.30 1,24,703 1,60,606
State Government 45.51 48.97 1,86,849 2,50,260
Corporate 8.77 10.46 36,340 50,730
All Citizen Model 10.24 13.58 11,127 16,224
NPS Lite 43.40 43.17 3,631 4,068
APY 178.21 236.85 8,743 13,042
Total 306.39 374.32 3,71,393 4,94,930
Source: PFRDA.
monetary, liquidity, fiscal and financial regulatory
domains kept the financial system well-lubricated
and smoothly functioning. These early measures
contained volatility and imbued confidence to the
financial markets. In the medium run, the pandemic
support packages have to be unwound in a calibrated
manner with minimal disruption to restore the
prudential norms to pre-pandemic levels.
3.67 Unrelated to the pandemic, the focus
continues on other developmental and risk
mitigation measures, including cyber security and
the payments system, which would consolidate past
gains and ensure the robust functioning of financial
markets, underpinning financial stability enduringly.

78
Annex 1
Annex 1
Systemic Risk Survey
A systemic risk survey (SRS), the nineteenth in the series1, was conducted during October-November
2020, to capture the perceptions of experts, including market participants, on the major risks faced by the
Indian financial system. The survey results, based on 31 respondents, are encapsulated below.
Outlook on Major Risk Categories
2. In the broad category of risks to the financial system, respondents rated select institutional risks (viz.,
asset quality deterioration; additional capital requirements; level of credit growth; and cyber risk) as ‘high’
(Figure 1 and 2). Global risks, macroeconomic risks and financial market risks were perceived as ‘medium’
in magnitude but certain components therein (viz., global and domestic growth; domestic inflation; fiscal
deficit; corporate vulnerabilities; infrastructure development; and equity price volatility) remain high
(Figure 2).
3. This represents a clear shift from the SRS for April 20202, which was conducted during the early months
of the pandemic and risks for all the major groups were rated as ‘high’. Also, unlike in the previous survey
round in which risks to economic growth (global and domestic) and fiscal deficit were assessed ‘very high’,
none of the risks were categorised ‘very high’ by the respondents this time around.
Figure 1: Major risk groups identified in Systemic risk survey (October 2020)
Major Risk Groups Oct-20 Apr-20 Change in Risk Perception
A. Global Risks Decline
B. Macro-economic Risks Decline
C. Financial Market Risks Decline
D. Institutional Risks Decline
E. General Risks Decline
Source: RBI's Systemic risk survey (April 2020 & October 2020).
1 Responses for April 2020 round of SRS were received during April-May 2020 and those for October 2020 round were received during October-November 2020.2 Please see: https://www.rbi.org.in/Scripts/PublicationReportDetails.aspx?UrlPage=&ID=1150 for the results of the previous survey round.
Note:Risk Category
Very high High Medium Low Very low

79
Financial Stability Report January 2021
Note:Risk Category
Very high High Medium Low Very low
* The risk perception, as it emanates from the systemic risk survey conducted at different points in time (on a half yearly basis in April and October), may shift (increase/decrease) from one risk category to the other, which is reflected by the change in colour. However, within the same risk category (that is, boxes with the same colour), the risk perception may also increase/decrease or remain the same, the shift being indicated accordingly.
Figure 2: Various risks identified in Systemic risk survey (October 2020)*
Risk items Oct-20 Apr-20 Change in Risk Perception
A. G
loba
l Ris
ks
Global growth Decline
Sovereign risk / contagion Decline
Funding risk (External borrowings) Decline
Commodity price risk Decline
Other global risks Decline
B. M
acro
-eco
nom
ic R
isks
Domestic growth Decline
Domestic inflation Increase
Current account deficit Decline
Capital inflows/ outflows (Reversal of FIIs, Slowdown in FDI) Decline
Sovereign rating downgrade Decline
Fiscal deficit Decline
Corporate sector risk Decline
Pace of infrastructure development Decline
Real estate prices Decline
Household savings Decline
Political uncertainty/ governance /policy implementation Decline
Other macroeconomic risks Increase
C. F
inan
cial
M
arke
t Ris
ks
Foreign exchange rate risk Decline
Equity price volatility Decline
Interest rate risk Decline
Liquidity risk Decline
Other financial market risks Decline
D. I
nsti
tuti
onal
Ris
ks
Regulatory risk Decline
Asset quality deterioration Decline
Additional capital requirements of banks Decline
Access to funding by banks Decline
Level of credit growth Decline
Cyber risk Increase
Operational risk Decline
Other institutional risks No change
E. G
ener
al
Risk
s
Terrorism Increase
Climate related risks Increase
Social unrest (Increasing inequality) Decline
Other general risks Increase
Source: RBI's Systemic risk survey (April 2020 & October 2020).

80
Annex 1
Outlook on Financial System
4. Over a third of the respondents expected
marginal deterioration in the prospects of the
Indian banking sector over the next one year on
account of the negative impact on earnings, lower
net interest margins, elevated asset quality
concerns and a possible increase in provisioning
requirements. On the other hand, about 24 per
cent of the respondents felt that prospects are
going to improve marginally (Chart 1). Even as the
respondents expecting deterioration exceeded
those expressing optimism over the next one year,
the overall responses indicate a better outlook as
compared with the previous round of the survey. Source: RBI's Systemic risk survey (April 2020 and October 2020).
Chart 1: Prospects of Indian banking sector in the next one year
5. The majority of the respondents expect a ‘medium’ probability of occurrence of a high impact event in the financial system, in India as well as globally, in the medium term (one to three years). In the short-term (up to one year), the possibility of occurrence of a high impact event was assessed as low for India and ‘medium’ globally. These assessments contrasted with the previous round of the survey in which a high/very-high probability was assigned to the occurrence of a high impact event in the Indian/global financial system in the short-term.
6. Respondents also expressed higher confidence about financial stability than in the previous round of the survey. The share of respondents who were ‘fairly confident’ about the stability of the global and the Indian financial system stood at 71 per cent and 61.3 per cent, respectively (Chart 2).
Chart 2: Perception on occurrence of high impact events and confidence in the financial systemsRespondents (per cent)
Probability of high impact event in the global financial system
a. In the short term b. In the medium term
0
20
40
60
80
100
Very high
High
MediumLow
Very low
Oct-19 Apr-20 Oct-20
0
20
40
60
80
100
Very high
High
MediumLow
Very low
Oct-19 Apr-20 Oct-20

81
Financial Stability Report January 2021
Source: RBI's Systemic risk surveys (October 2019, April 2020 and October 2020).
Probability of high impact event in the domestic financial system
c. In the short term d. In the medium term
Confidence in the financial systems
e. Stability of the global financial system f. Stability of the Indian financial system
0
20
40
60
80
100
Very high
High
MediumLow
Very low
Oct-19 Apr-20 Oct-20
0
20
40
60
80
100
Very high
High
MediumLow
Very low
Oct-19 Apr-20 Oct-20
0
20
40
60
80
100
confidence
Veryconfident
Fairlyconfident
Notvery
confident
Noconfidence
Oct-19 Apr-20 Oct-20
0
20
40
60
80
100
Oct-19 Apr-20 Oct-20
confidence
Veryconfident
Fairlyconfident
Notvery
confident
Noconfidence
7. The majority of the respondents felt that credit demand would increase marginally over the next three months with better economic prospects. Average credit quality is expected to deteriorate marginally over this period (Chart 3) as the impact of the moratorium and lockdown is yet to play out completely in the books of banks. Poor repaying capacity of borrowers in many sectors, coupled with a decline in collection efficiency due to localised lockdowns, may also translate into a lower quality book.
COVID-19 Pandemic and Recovery
8. The survey respondents felt that tourism and hospitality, construction and real estate, aviation,
automobiles and retail were the major sectors adversely affected by the COVID-19 pandemic (Table 1).
Compared to the last survey round, more respondents expected recovery prospects for tourism and
hospitality, aviation and automobile sectors. The slow pace of overall economic recovery and lingering
uncertainty about the duration of the pandemic is, however, likely to moderate the revival prospects for the

82
Annex 1
travel, tourism and hospitality sectors. Demand
and pricing pressures are expected to continue for
the real estate sector (particularly for residential
and retail sub-segments) over the next six months.
For other sectors, gradual reduction in pandemic
related restrictions may lead to marginal
improvements.
Chart 3: Outlook on credit demand and its quality (October 2020)
a. Demand for credit: Likely to change in next three months b. Average credit quality: Likely to change in next three months
Source: RBI's Systemic risk survey (October 2020).
Table 1: Sectors adversely affected by COVID-19 and their future prospects
(per cent of respondents)
Sector
Prospects of recovery in the next 6 months
Good Moderate No change Bleak
Tourism and Hospitality 29 16.1 54.8
Construction and Real Estate 5 30 35 30
Aviation 5.3 36.8 10.5 47.4
Automobiles 71.4 14.3 14.3
Retail 66.7 16.7 16.7
Source: RBI's Systemic risk survey (October 2020).
Table 2: Major Impediments to a Robust Economic Recovery post COVID-19
Concern Rank
Lack of robust private sector investment 1
Declining consumer confidence/spending 2
Supply chain disruptions 3
Financial impact on operations and/or liquidity and capital 4
Workforce reduction/Employee stress 5
Lack of information for decision making 6
Impact on tax and trade issues 7
Lower productivity 8
Source: RBI's Systemic risk survey (October 2020).
9. Participants were asked to rank the major
impediments to a robust economic recovery post
COVID-19 in India (Table 2). Lack of robust private
sector investment emerged as the topmost concern,
followed by declining consumer spending/
confidence.

83
Financial Stability Report January 2021
10. Over 60 per cent of the respondents predicted
that the post COVID-19 economic recovery is likely
to be U-shaped, i.e., immediate fall followed by a
longer period to recovery (Chart 4), which was
similar to the findings of the last survey. Another
16 per cent of the respondents expected a quick
V-shaped recovery, which was not expected by any
respondent in the previous survey round.
Risks to Domestic Financial Stability
11. The survey participants cited the following major factors as posing risks to domestic financial stability,
going forward:
• Inflationary pressures coupled with poor GDP growth could limit the policy space for rate cuts
and keep yields under pressure.
• The continuing adverse impact on MSMEs due to lack of cash flows, low demand, lack of man
power and lack of capital could lead to prolonged stress in the sector and large-scale permanent
closure of units with associated implications for employment.
• Real estate prices and cash flows in commercial real estate could undergo a major structural
correction due to transformation in the model of conducting work, resulting in further pressure
on real estate developers and lending to the sector.
• Ongoing stress in specific segments of the service economy, viz., hotels, entertainment, travel,
tourism and taxi services could lead to credit stress on corporate and retail assets in the financial
system.
• For NBFCs, growth prospects in the immediate future could be affected by the dampened outlook
for housing and vehicle finance, funding challenges especially for lower rated NBFCs in a
confidence-sensitive scenario and tightening underwriting standards on expectation of increasing
delinquencies.
• India is among the top three nations identified by investors as likely to suffer from significant
debt distress. A global risk aversion towards EM assets could lead to massive capital outflows and
create pressure on the rupee as well as on bond yields. In this context, uncertainty on the roadmap
for tapering unconventional measures taken by the regulators could impact investor confidence.
Source: RBI's Systemic risk survey (October 2020)
Chart 4: Possible shape of economic recovery (October 2020)
0 10 20 30 40 50 60 70
V Shapedi.e quick recovery
U shaped:long period for recovery
W shaped:recovery and then second decline
L shaped:an extended recession
per cent of respondents

84
Annex 2
Annex 2
Methodologies
2.1 Scheduled Commercial Banks
Banking stability map and indicator
The banking stability map and indicator present an overall assessment of changes in underlying conditions and risk factors that have a bearing on the stability of the banking sector during a period. The five composite indices used in the banking stability map and indicator represent the five dimensions of soundness, asset- quality, profitability, liquidity and efficiency. The ratios used for constructing each composite index are given in Table 1.
Table 1: Ratios used for constructing the banking stability map and indicator
Dimension Ratios
Soundness CRAR # Tier-I Capital to Tier-II Capital #
Leverage Ratio as Total Assets to Capital and Reserves
Asset- Quality
Net NPAs to Total Advances
Gross NPAs to Total Advances
Sub-Standard Advances to Gross NPAs #
Restructured Standard Advances to Standard Advances
Profitability Return on Assets # Net Interest Margin # Growth in Profit #
Liquidity Liquid Assets to Total Assets #
Customer Deposits to Total Assets #
Non-Bank Advances to Customer-Deposits
Deposits maturing within 1-year to Total Deposits
Efficiency Cost to Income Business (Credit + Deposits) to Staff Expenses # Staff Expenses to Total Expenses
Note: # Negatively related to risk.
Each composite index, representing a dimension of bank functioning, takes values between zero and 1. Each index is a relative measure during the sample period used for its construction, where a higher value means the risk in that dimension is high. Therefore, an increase in the value of the index in any particular dimension indicates an increase in risk in that dimension for that period as compared to other periods. Each index is normalised for the sample period using the following formula:
Where, Xt is the value of the ratio at time t. A composite index of each dimension is calculated as a weighted average of normalised ratios used for that dimension where the weights are based on the marks assigned for assessment for the CAMELS rating. The banking stability indicator is constructed as a simple average of these five composite indices.
Macro stress testing
Macro stress test for credit risk ascertains the resilience of banks against macroeconomic shocks. It assesses the impact of macroeconomic shocks on GNPA ratio of banks (at system level and at major bank-group level) and finally on their capital adequacy (bank-by-bank and system level for a sample of 46 banks).

85
Financial Stability Report January 2021
Impact of GNPA ratio
Here, the slippage ratio (SR)1 is modelled as a function of macroeconomic variables, using various econometric
models that relate the select banking system aggregates to macroeconomic variables. While bank group-wise
slippage ratios are modelled using (i) multivariate regression and (ii) vector autoregression (VAR), the system
level slippage ratio is modelled using (i) multivariate regression; (ii) VAR and (iii) quantile regression. The
banking system aggregates include current and lagged values of slippage ratio, while macroeconomic
variables include gross domestic product, weighted average lending rate (WALR), CPI (combined) inflation,
exports-to-GDP ratio, annualized current account balance-to-GDP ratio and annualized combined gross fiscal
deficit-to-GDP ratio.
While multivariate regression allows evaluating the impact of select macroeconomic variables on the
banking system’s GNPA, the VAR model takes into account the feedback effect also. In these methods, the
conditional mean of slippage ratio is estimated wherein it is assumed that the impact of macro-variables on
credit quality will remain the same, irrespective of the level of the credit quality, which may not always be
true. In order to relax this assumption, quantile regression was adopted, wherein conditional quantile is
estimated instead of the conditional mean to deal with tail risks and to account for the non-linear impact
of macroeconomic shocks.
The following econometric models are used to estimate the impact of macroeconomic shocks on the slippage
ratio:
System level models
The system level GNPAs are projected using three different but complementary econometric models:
multivariate regression, VAR and quantile regression. The final projection is derived by averaging the
projections based on these three models.
• Multivariate regression
The following multivariate regression model is used for projecting the slippage ratio of SCBs
as a whole:
SRt = α1 + β1 SRt-1 – β2 ΔNGDPt-2 + β3 RWALRt-2 – β4 ( CABGDP )t-3 + β5 ( GFD
GDP )t-1 + β6 Dummy
where, α1, β1, β2, β3, β4, β5 and β6> 0
• VAR model
In notational form, mean-adjusted VAR of order p can be written as:
; t=0,1,2,3,….
where, is a (K×1) vector of variables at time t, the Ai (i=1,2,…p) are fixed (K×K)
coefficient matrices and is a K-dimensional white noise or innovation process.
1 Slippages are fresh accretion to NPAs during a period. Slippage Ratio = Fresh NPAs/Standard Advances at the beginning of the period.

86
Annex 2
The VAR model is estimated using slippage ratio, real WALR, nominal GDP growth, annualized current
account balance-to-GDP ratio and annualized combined gross fiscal deficit-to-GDP ratio. The appropriate
order of VAR selected based on minimum information criteria as well as other diagnostics is two. The
impact of various macroeconomic shocks is determined using the impulse response function of the selected
VAR.
• Quantile regression
The following quantile regression model is used to estimate the conditional quantile of slippage ratio
at 0.8:
SRt = α1 + β1 SRt-1 – β2 ΔNGDPt-2 + β3 RWALRt-2 – β4 ( CABGDP )t–3 + β5 ( GFD
GDP )t–1 + β6 Dummy
Bank group level models
The bank group-wise slippage ratios are projected using two different but complementary econometric
models: multivariate regression and VAR. The final projection is derived by averaging the projections
based on these two models.
• Multivariate regression
The following multivariate regressions are used to model the slippage ratio of various bank groups:
Public Sector Banks (PSBs):
SRt = α1 + β1 SRt-1+ β2 RWALRt-2 – β3 ΔNGDPt-2 + β4 ( GFDGDP )t–3 – β5 ( CAB
GDP )t–3 + β6 Dummy
Private Sector Banks (PVBs):
SRt = α1 + β1 SRt-1 + β2 RWALRt-3 – β3 ΔNGDPt-1 – β4 ( EXPGDP )t–1 + β5 Dummy
Foreign Banks (FBs):
SRt = α1 + β1 SRt-1 + β2Δ2CPIt-4 + β3Δ( GFDGDP )t–3 – β4Δ( EXP
GDP )t–1 + β5 Dummy
• VAR model
In order to model the slippage ratio of various bank groups, different VAR models are estimated based
on the following macro variables:
PSBs: NGDP, RWALR, CAB- to -GDP ratio and GFD- to- GDP ratio of order 1.
PVBs: NGDP, RWALR and exports- to- GDP ratio of order 1.
FBs: GDP, CPI, exports- to- GDP ratio and GFD-to-GDP ratio of order 1.
Estimation of GNPAs from slippages
Once, slippage ratio is projected using the above-mentioned models, GNPA is projected using the identity
given below:
GNPAt+1=GNPAt + Slippage(t,t+1) – Recovery(t,t+1) – Write-off(t,t+1) – Upgradation(t,t+1)

87
Financial Stability Report January 2021
Derivation of GNPAs from slippage ratios, which are projected using the above mentioned credit risk econometric models, are based on the following assumptions: credit growth of 5.8 per cent, 6.3 per cent, 6.7 per cent and 7.6 per cent respectively; recovery rates of 3.3 per cent, 2.6 per cent, 2.5 per cent and 2.5 per cent, respectively; write-off rates of 6.0 per cent, 7.3 per cent, 5.2 per cent and 4.3 per cent respectively; upgradation rates of 1.2 per cent, 1.2 per cent, 1.4 per cent and 1.1 per cent respectively during quarters ending December 2020, March 2021, June 2021 and September 2021.
Impact on capital adequacy
The impact of macro shocks on capital adequacy of banks is captured through the following steps;
i. The impact on future capital accumulation is captured through projection of profit under the assumed macro scenarios, assuming that only 25 per cent of profit after tax (PAT) (which is minimum regulatory requirements) goes into capital of banks.
ii. The requirement of additional capital in future are projected by estimating risk-weighted assets (RWAs) using internal rating based (IRB) formula.
Formulae used are:
where, PAT is projected using satellite models, elucidated in the subsequent section. RWAs (others), which is total RWAs minus RWAs of credit risk, is projected based on average growth rate observed in the past one year. RWAs (credit risk) is estimated using the IRB formula given below:
IRB Formula: Bank-wise RWA for credit risk is estimated using the following IRB formula;
where, EADi is exposure at default of the bank in the sector i (i=1,2….n).
Ki is minimum capital requirement for the sector i which is calculated using the following formula:
where, LGDi is loss given default of the sector i, PDi is probability of default of the sector i, N(..) is cumulative distribution function of standard normal distribution, G(..) is inverse of cumulative distribution function of standard normal distribution, Mi is average maturity of loans of the sector (which is taken 2.5 for all the sector in this case), b(PDi) is smoothed maturity adjustment and Ri is correlation of the sector i with the general state of the economy. Calculation of both, b(PD) and R depend upon PD.

88
Annex 2
This IRB formula requires three major inputs, namely, sectoral PD, EAD and LGD. Here, sectoral PDs are proxied by annual slippage of the respective sectors using banking data. PD for a particular sector is taken as same (i.e. systemic shocks) for each of the 46 selected banks, whereas, EAD for a bank for a particular sector is total outstanding loan (net of NPAs) of the bank in that particular sector. Further, assumption on LGD was taken as follows; under the baseline scenario, LGD = 60 per cent (broadly as per the RBI guidelines on ‘Capital Adequacy - The IRB Approach to Calculate Capital Requirement for Credit Risk’), which increases to 65 per cent under medium macroeconomic risk scenario and 70 per cent under severe macroeconomic risk.
Selected sectors: The following 17 sectors/sub-sectors (and others) are selected for the stress test.
Table 2: List of selected sectors/sub-sectors
Sr. No. Sector/Sub-sector Sr. No. Sector/Sub-sector
1 Engineering 10 Basic Metal and Metal Products
2 Auto 11 Mining
3 Cement 12 Paper
4 Chemicals 13 Petroleum
5 Construction 14 Agriculture
6 Textiles 15 Retail-Housing
7 Food Processing 16 Retail-Others
8 Gems and Jewellery 17 Services
9 Infrastructure 18 Others
The stochastic relationship of sectoral annual slippage ratio (i.e. sectoral PDs) with macro variables is estimated using multivariate regression for each sector. Using these estimated regressions, sectoral PDs of each sector are projected for four quarters ahead under assumed baseline as well as two adverse scenarios, namely, medium stress and severe stress. The sectoral regression models are presented in the next section.
The bank-wise profit after tax (PAT) is projected using the following steps:
• Components of PAT (i.e. Net Interest Income(NII), Other Operating Income(OOI), Operating Expenses(OE) and Provisions & Write off) of each bank-group is projected under baseline and adverse scenarios, using the method explained in the subsequent section.
• Share of components of PAT of each bank (except income tax) in their respective bank-group iscalculated.
• EachcomponentofPAT(exceptincometax)ofeachbankisprojectedfromtheprojectedvalueofthecomponent of PAT of respective bank-group and applying that bank’s share in the particular component of PAT.
• Finally,bank-wisePATwasprojectedbyappropriatelyaddingorsubtractingtheircomponentsestimatedin the previous step and using income tax rate at 35 per cent.

89
Financial Stability Report January 2021
Using these formulae, assumptions and inputs, impact of assumed macro scenarios on the capital adequacy of each bank is estimated and future change in capital adequacy under baseline from the latest observed data and change in the capital adequacy of banks from baseline to adverse macro shocks are calculated. Finally, these changes are appropriately applied on the latest observed capital adequacy (under Standardised Approach) of the bank.
Projection of Sectoral PDs
1. Engineering
ΔPDt =α+β1ΔPDt-1 + β2 ΔWALRt-2–β3 ( EXPGDP )t–2-β4 ΔGVA(Industry)t-3+β5Dummy
2. Auto
PDt =α+β1 PDt-1 -β2 ΔGDPt-1 +β3WALRt-1–β4 ( EXPGDP )t–2+β5 ΔCPIt-2+β6Dummy
3. Cement
PDt =α+β1 PDt-1 -β2 ΔGDPt-2 +β3 ΔWALRt-1–β4 ( EXPGDP )t–2+β5Dummy
4. Chemicals and Chemical Products
PDt=α+β1 PDt–1+β2ΔWALRt–1–β3ΔGDPt–1+β4Dummyt
5. Construction
PDt=α+β1 PDt–1+β2ΔWALRt–1–β3 ( EXPGDP )t–1–β4ΔGDPt–1+β5Dummyt
6. Textiles
PDt=α+β1 PDt–1–β2ΔGDPt–1+β3ΔWALRt–1–β4 ( EXPGDP )t–2+β5ΔCPIt–3+β6Dummy
7. Food Processing
PDt=α+β1 PDt–1+β2ΔWALRt–3–β3 ( EXPGDP )t–1–β4ΔGDPt–2+β5Dummyt
8. Gems and Jewellery
PDt=α+β1 PDt–1+β2ΔWALRt–1–β3 ( EXPGDP )t–3–β4ΔGDPt–2+β5Dummyt
9. Infrastructure
PDt=α+β1 PDt–1–β2ΔGDPt–2+β3WALRt–1+β4ΔCPIt–1+β5Dummyt
10. Basic Metal and Metal Products
PDt=α+β1 PDt–1–β2ΔGDPt–3+β3WALRt–1–β4 ( EXPGDP )t–1+β5Dummyt
11. Mining and Quarrying
PDt=α+β1 PDt–1–β2ΔGDPt–2+β3ΔCPIt–1–β4 ( EXPGDP )t–2+β5Dummyt
12. Paper and Paper Products
PDt=α+β1 PDt–1+β2ΔWALRt–4–β3 ( EXPGDP )t–2–β4ΔGDPt–1+β5Dummyt

90
Annex 2
13. Petroleum and Petroleum Products
PDt =α+β1 PDt–1 + β2 ΔWALRt–2 – β3 (EXPGDP )t–2–β4 ΔGDPt–2+β5Dummyt
14. Agriculture
PDt =α+β1 PDt–1 + β2 ΔWALRt–1 – β3 (EXPGDP )t–2–β4 ΔGDPt–1+β5Dummyt
15. Services
ΔPDt =α+β1ΔPDt–1 + β2 ΔWALRt–1 – β3 (EXPGDP )t–2–β4 ΔGDPt–2+β5ΔCPIt–1
16. Retail Housing
ΔPDt =α+β1ΔPDt–1 + β2 ΔWALRt–2 – β3 ΔGDPt–1
17. Other Retail
PDt =α+β1 PDt–1 + β2 ΔWALRt–2 – β3 (EXPGDP )t–1+β4Dummyt
18. Others
PDt =α+β1 PDt–1 + β2 ΔWALRt–2 – β3 ΔGDPt–1+β4Dummyt
Projection of bank-group wise PAT
The various components of PAT of major bank-groups (namely, PSBs, PVBs and FBs), such as, NII, OOI, OE and Provisions & Writeoff are projected using different time series econometric models (as given below). Finally, PAT is estimated using the following identity:
where, NII is net interest income, OOI is other operating income and OE is operating expenses.
Net Interest Income (NII): NII is the difference between interest income and interest expense and is projected using the following regression model:
LNII is log of NII. LNGDP_SA is seasonally adjusted log of nominal GDP. Adv_Gr is the y-o-y growth rate of loans and advances. Spread is the difference between average interest rate earned by interest earning assets and average interest paid on interest bearing liabilities.
Other Operating Income (OOI): Log of OOI (LOOI) of SCBs is projected using the following regression model:
Operating Expense (OE): OE of SCBs is projected using an Autoregressive Moving Average (ARMA) model.
Provisions (including write-off): The required provisioning is projected using the following regression:
P_Advt=α1+β1P_Advt–1 – β2ΔGDPt–2+ β3 GNPAt–1–β4Dummy
P_Adv is provisions to total advances ratio. ΔGDP is the y-o-y growth rate of real GDP. GNPA is gross non-performing assets to total advances ratio.

91
Financial Stability Report January 2021
Income Tax: The applicable income tax is taken as 35 per cent of profit before tax, which is based on the
past trend of ratio of income tax to profit before tax.
Single factor sensitivity analysis – Stress testing
As a part of quarterly surveillance, stress tests are conducted covering credit risk, interest rate risk, liquidity
risk etc. and the resilience of commercial banks in response to these shocks is studied. The analysis is done
on individual SCBs as well as on the system level.
Credit risk (includes concentration risk)
To ascertain the resilience of banks, the credit portfolio was given a shock by increasing GNPA ratio for the
entire portfolio. For testing the credit concentration risk, default of the top individual borrower(s) and the
largest group borrower(s) was assumed. The analysis was carried out both at the aggregate level as well as
at the individual bank level. The assumed increase in GNPAs was distributed across sub-standard, doubtful
and loss categories in the same proportion as prevailing in the existing stock of NPAs. However, for credit
concentration risk (exposure based) the additional GNPAs under the assumed shocks were considered to
fall into sub-standard category only and for credit concentration risk (based on stressed advances), stressed
advances were considered to fall into loss category. The provisioning requirements were taken as 25 per
cent, 75 per cent and 100 per cent for sub-standard, doubtful and loss advances respectively. These norms
were applied on additional GNPAs calculated under a stress scenario. As a result of the assumed increase in
GNPAs, loss of income on the additional GNPAs for one quarter was also included in total losses, in addition
to the incremental provisioning requirements. The estimated provisioning requirements so derived were
deducted from banks’ capital and stressed capital adequacy ratios were computed.
Sectoral Risk
To ascertain the Sectoral credit risk of individual banks, the credit portfolios of particular sector was given
a shock by increasing GNPA ratio for the sector. The analysis was carried out both at the aggregate level as
well as at the individual bank level. Sector specific shocks based on standard deviation(SD) of GNPA ratios
of a sector are used to study the impact on individual banks. The additional GNPAs under the assumed
shocks were considered to fall into sub-standard category only. As a result of the assumed increase in
GNPAs, loss of income on the additional GNPAs for one quarter was also included in total losses, in addition
to the incremental provisioning requirements. The estimated provisioning requirements so derived were
deducted from banks’ capital and stressed capital adequacy ratios were computed.
Interest rate risk
Under assumed shocks of the shifting of the INR yield curve, there could be losses on account of the fall in
value of the portfolio or decline in income. These estimated losses were reduced from the banks’ capital to
arrive at stressed CRAR.
For interest rate risk in the trading portfolio (HFT + AFS), a duration analysis approach was considered for
computing the valuation impact (portfolio losses). The portfolio losses on these investments were calculated
for each time bucket based on the applied shocks. The resultant losses/gains were used to derive the
impacted CRAR.

92
Annex 2
Equity price risk
Under the equity price risk, impact of a shock of a fall in the equity price index, by certain percentage
points, on profit and bank capital were examined. The fall in value of the portfolio or income losses due to
change in equity prices are accounted for the total loss of the banks because of the assumed shock. The
estimated total losses so derived were reduced from the banks’ capital.
Liquidity risk
The aim of the liquidity stress tests is to assess the ability of a bank to withstand unexpected liquidity drain
without taking recourse to any outside liquidity support. Various scenarios depict different proportions
(depending on the type of deposits) of unexpected deposit withdrawals on account of sudden loss of
depositors’ confidence along with a demand for unutilised portion of sanctioned/committed/guaranteed
credit lines (taking into account the undrawn working capital sanctioned limit, undrawn committed lines
of credit and letters of credit and guarantees). The stress tests were carried out to assess banks’ ability to
fulfil the additional and sudden demand for credit with the help of their liquid assets alone.
Assumptions used in the liquidity stress tests are given below:
• It isassumedthatbankswillmeetstressedwithdrawalofdepositsoradditionaldemandforcredit
through sale of liquid assets only.
• Thesaleofinvestmentsisdonewithahaircutof10percentontheirmarketvalue.
• Thestresstestisdoneundera‘static’mode.
Bottom-up stress testing: Derivatives portfolios of select banks
The stress testing exercise focused on the derivatives portfolios of a representative sample set of top 20
banks in terms of notional value of the derivatives portfolios. Each bank in the sample was asked to assess
the impact of stress conditions on their respective derivatives portfolios.
In case of domestic banks, the derivatives portfolio of both domestic and overseas operations was included.
In case of foreign banks, only the domestic (Indian) position was considered for the exercise. For derivatives
trade where hedge effectiveness was established it was exempted from the stress tests, while all other
trades were included.
The stress scenarios incorporated four sensitivity tests consisting of the spot USD/INR rate and domestic
interest rates as parameters.
Table 3: Shocks for stress testing of derivatives portfolio
Domestic interest rates
Shock 1
Overnight +2.5 percentage points
Up to 1yr +1.5 percentage points
Above 1yr +1.0 percentage points

93
Financial Stability Report January 2021
Domestic interest rates
Shock 2
Overnight -2.5 percentage points
Up to 1yr -1.5 percentage points
Above 1yr -1.0 percentage points
Exchange rates
Shock 3 USD/INR +20 per cent
Exchange rates
Shock 4 USD/INR -20 per cent
2.2 Scheduled Primary (urban) Co-operative Banks
Single factor sensitivity analysis – Stress testing
Credit risk
Stress tests on credit risk were conducted on SUCBs. The tests were based on a single factor sensitivity analysis. The impact on CRAR was studied under following four different scenarios, using the historical standard deviations (SD).
• ScenarioI:1SDshockonGNPA(classifiedintosub-standardadvances).
• ScenarioII:2SDshockonGNPA(classifiedintosub-standardadvances).
• ScenarioIII:1SDshockonGNPA(classifiedintolossadvances).
• ScenarioIV:2SDshockonGNPA(classifiedintolossadvances).
Liquidity risk
A liquidity stress test based on a cash flow basis in the 1-28 days time bucket was also conducted, where mismatch [negative gap (cash inflow less cash outflow)] exceeding 20 per cent of outflow was considered stressful.
• Scenario I: Cash outflows in the 1-28 days time-bucket goes up by 50 per cent (no change in cashinflows).
• ScenarioII:Cashoutflowsinthe1-28daystime-bucketgoesupby100percent(nochangeincashinflows).
2.3 Non-banking Financial Companies
Single factor sensitivity analysis – Stress testing
Credit risk
Credit portfolio of NBFCs at individual level and system level was applied a shock by increasing the GNPA
ratio by 1SD and 2SD under medium and high-risk scenarios. Baseline scenario was presented based on

94
Annex 2
capital adequacy position of NBFCs reported as on March 2020. Credit exposure and RWA were assumed to
grow at 75 per cent of CAGR over past three years. Additional NPAs were added to sub-standard advances
and existing GNPA was distributed based on ageing impact as per the extant regulations on provisioning
requirements. Provisioning requirements were applied at 10% for substandard advances, at the existing
proportion as on March 2020 for doubtful advances and at 100% for loss advances as per the regulatory
requirements. Additional provision requirements and income loss due to increase in GNPA were deducted
from the EBPT for FY2019-20 to calculate new profit before tax (PBT). Tax rate of 22 per cent was applied to
calculate profit after tax and complete PAT was accrued to existing capital with no dividend payment
assumption. Based on new capital and RWA, new Capital to Risk weighted Assets Ratio for individual NBFCs
and entire sector were calculated for the assumed scenarios.
2.4 Interconnectedness – Network analysis
Matrix algebra is at the core of the network analysis, which uses the bilateral exposures between entities in
the financial sector. Each institution’s lendings to and borrowings from all other institutions in the system
are plotted in a square matrix and are then mapped in a network graph. The network model uses various
statistical measures to gauge the level of interconnectedness in the system. Some of the important measures
are given below:
Connectivity Ratio: This statistic measures the extent of links between the nodes relative to all possible
links in a complete graph. For a directed graph, denoting total number of out degrees to equal K = and
N as the total number of nodes, connectivity ratio is given as .
Cluster coefficient: Clustering in networks measures how interconnected each node is. Specifically, there
should be an increased probability that two of a node’s neighbours (banks’ counterparties in case of a
financial network) are neighbours to each other also. A high clustering coefficient for the network corresponds
with high local interconnectedness prevailing in the system. For each bank with ki neighbours the total
number of all possible directed links between them is given by ki (ki-1). Let Ei denote the actual number of
links between agent i’s ki neighbours, viz. those of i’s ki neighbours who are also neighbours. The clustering
coefficient Ci for bank i is given by the identity:
Ci =
The clustering coefficient (C) of the network as a whole is the average of all Ci’s:
C =
Tiered network structures: Typically, financial networks tend to exhibit a tiered structure. A tiered structure is one where different institutions have different degrees or levels of connectivity with others in the network. In the present analysis, the most connected banks are in the innermost core. Banks are then placed in the mid-core, outer core and the periphery (the respective concentric circles around the centre in

95
Financial Stability Report January 2021
the diagrams), based on their level of relative connectivity. The range of connectivity of the banks is defined as a ratio of each bank’s in-degree and out-degree divided by that of the most connected bank. Banks that are ranked in the top 10 percentile of this ratio constitute the inner core. This is followed by a mid-core of banks ranked between 90 and 70 percentile and a 3rd tier of banks ranked between the 40 and 70 percentile. Banks with a connectivity ratio of less than 40 per cent are categorised as the periphery.
Colour code of the network chart: The blue balls and the red balls represent net lender and net borrower banks respectively in the network chart. The colour coding of the links in the tiered network diagram represents the borrowing from different tiers in the network (for example, the green links represent borrowings from the banks in the inner core).
Solvency contagion analysis
The contagion analysis is in nature of stress test where the gross loss to the banking system owing to a domino effect of one or more banks failing is ascertained. We follow the round by round or sequential algorithm for simulating contagion that is now well known from Furfine (2003). Starting with a trigger bank i that fails at time 0, we denote the set of banks that go into distress at each round or iteration by Dq, q= 1,2, …For this analysis, a bank is considered to be in distress when its Tier-I CRAR goes below 7 per cent. The net receivables have been considered as loss for the receiving bank.
Liquidity contagion analysis
While the solvency contagion analysis assesses potential loss to the system owing to failure of a net borrower, liquidity contagion estimates potential loss to the system due to the failure of a net lender. The analysis is conducted on gross exposures between banks. The exposures include fund based and derivatives ones. The basic assumption for the analysis is that a bank will initially dip into its liquidity reserves or buffers to tide over a liquidity stress caused by the failure of a large net lender. The items considered under liquidity reserves are: (a) excess CRR balance; (b) excess SLR balance; and (c) 18 per cent of NDTL. If a bank is able to meet the stress with liquidity buffers alone, then there is no further contagion.
However, if the liquidity buffers alone are not sufficient, then a bank will call in all loans that are ‘callable’, resulting in a contagion. For the analysis only short-term assets like money lent in the call market and other very short-term loans are taken as callable. Following this, a bank may survive or may be liquidated. In this case there might be instances where a bank may survive by calling in loans, but in turn might propagate a further contagion causing other banks to come under duress. The second assumption used is that when a bank is liquidated, the funds lent by the bank are called in on a gross basis, whereas when a bank calls in a short-term loan without being liquidated, the loan is called in on a net basis (on the assumption that the counterparty is likely to first reduce its short-term lending against the same counterparty).
Joint solvency-liquidity contagion analysis
A bank typically has both positive net lending positions against some banks while against some other banks it might have a negative net lending position. In the event of failure of such a bank, both solvency and liquidity contagion will happen concurrently. This mechanism is explained by the following flowchart:

96
Annex 2
Flowchart of Joint Liquidity-Solvency contagion due to a bank coming under distress
The trigger bank is assumed to have failed for some endogenous reason, i.e., it becomes insolvent and thus impacts all its creditor banks. At the same time it starts to liquidate its assets to meet as much of its obligations as possible. This process of liquidation generates a liquidity contagion as the trigger bank starts to call back its loans.
The lender/creditor banks that are well capitalised will survive the shock and will generate no further contagion. On the other hand, those lender banks whose capital falls below the threshold will trigger a fresh contagion. Similarly, the borrowers whose liquidity buffers are sufficient will be able to tide over the stress without causing further contagion. But some banks may be able to address the liquidity stress only by calling in short term assets. This process of calling in short term assets will again propagate a contagion.
The contagion from both the solvency and liquidity side will stop/stabilise when the loss/shocks are fully absorbed by the system with no further failures.

97
Financial Stability Report January 2021
Annex 3
Important Regulatory Measures
1) The Reserve Bank of India
Date Regulatory Measure Rationale
June 24, 2020 Loans sourced by banks and NBFCs over Digital Lending Platforms: The key instructions issued to banks and NBFCs are:
(i) To disclose names of digital lending platforms engaged as agents on the website of banks/ NBFCs.
(ii) To direct digital lending platforms to disclose the name of the bank / NBFC on whose behalf they are interacting with the customer.
(iii) To issue loan sanctioning letter on the letter head of the bank/ NBFC concerned.
(iv) Furnishing copy of the loan agreement and all quoted enclosures at the time of sanction.
(v) Ensuring effective oversight and awareness about grievance redressal mechanism.
To create transparency in digital lending and safeguarding customer interest.
August 06, 2020 Increase in Loan to Value (LTV) ratio for gold loans: LTV for loans against pledge of gold ornaments and jewellery for non-agricultural purposes has been enhanced from 75 per cent to 90 per cent up to March 31, 2021.
To mitigate the economic impact of the COVID-19 pandemic on households, entrepreneurs and small businesses.
August 06, 2020 and December 14, 2020
Review of instructions for opening of Current accounts: The revised instructions provide that no bank shall open current accounts for customers who have availed credit facilities in the form of cash credit (CC)/ overdraft (OD) from the banking system and all transactions shall be routed through the CC/OD account only. In case of customers who have not availed CC/OD facility from any bank, banks may open current accounts under certain conditions. Additional caveats have been placed for opening and operating the current account.
The instructions were modified in December 2020 to exclude specific accounts which are stipulated under various statutes and regulatory instructions, from the restrictions placed in terms of the above-mentioned circular.
To improve credit discipline.

98
Annex 3
Date Regulatory Measure Rationale
August 06, 2020 Resolution Framework for COVID-19-related Stress: The instructions permit lenders to implement a resolution plan in respect of eligible exposures while classifying such exposures as standard, subject to specified conditions.
To facilitate revival of real sector activity and mitigate the impact of COVID-19 on the ultimate borrowers.
August 13, 2020 Revised regulatory framework for Core Investment Companies - Based on the recommendations of the Working Group to Review the Regulatory and Supervisory Framework for CICs and inputs received from stakeholders, the guidelines for CICs were revised.
To address complexity and multiple leveraging in the group; to strengthen risk management and corporate governance practices and induce transparency through disclosures.
September 01, 2020
SLR holdings in HTM category: Banks have been permitted to hold under Held to Maturity (HTM) category, SLR securities acquired on or after September 1, 2020 up to an overall limit of 22 per cent of NDTL, up to March 31, 2021.
The dispensation was extended upto March 31, 2022 and further, it was also decided that enhanced HTM limit shall be restored to 19.5 per cent in a phased manner vide a circular issued on October 12, 2020.
To engender orderly market conditions and ensure congenial financing costs.
To give more certainty to the markets about the status of these investments.
September 07, 2020
Resolution Framework for COVID-19 related Stress – Financial Parameters: The financial ratios and sector-specific thresholds to be considered by lending institutions while finalising the resolution plans in respect of eligible borrowers were specified.
To facilitate resolution of exposures other than personal loans, affected by COVID-19 related stress, based on objective parameters.
October 07, 2020 Interest Subvention Scheme for MSMEs – Co-operative banks: Co-operative Banks have been included as Eligible Lending Institutions from 3rd March 2020. The scheme provides an interest relief of 2% per annum to eligible MSMEs with coverage limited to all term loans/working capital to the extent of Rs 1 crore. The validity of the Scheme has been extended to March 31, 2021
To boost lending to the MSME sector.
October 12, 2020 Regulatory Retail Portfolio – Revised Limit for Risk Weight: The threshold limit of `5 crore for aggregated retail exposure to a counterparty was increased to `7.5 crore.
To reduce the cost of credit for the segment consisting of individuals and small businesses (i.e. with turnover of upto `50 crore), and also to harmonise with the Basel guidelines.

99
Financial Stability Report January 2021
Date Regulatory Measure Rationale
October 16, 2020 Individual Housing Loan – Rationalisation of Risk Weights: The risk weights in respect of housing loans were rationalised, irrespective of the amount of the loan, for all new housing loans sanctioned, from the date of the circular and up to March 31, 2022.
To rationalise risk weights as a countercyclical measure.
October 22, 2020 Review of regulatory framework for Housing Finance Companies (HFCs): The revised regulatory framework for HFCs was notified.
While introducing the concept of principal business for HFCs and also defining housing finance, the revised guidelines aim at harmonizing the regulations of HFCs with that of NBFCs in a non-disruptive manner.
November 05, 2020
Review of the Co-origination Model: The scheme was recast as a “Co-Lending Model” (CLM), wherein banks are permitted to co-lend with all registered NBFCs (including HFCs) based on a prior agreement, and the co-lending banks will take their share of the individual loans on a back-to-back basis in their books. However, NBFCs shall be required to retain a minimum of 20 per cent share of the individual loans on their books.
To improve the flow of credit to the unserved and underserved sector of the economy and make available funds to the ultimate beneficiary at an affordable cost, considering the lower cost of funds from banks and greater reach of the NBFCs.
December 4, 2020
Declaration of dividends by banks: Banks were advised not to make any dividend payment on equity shares from the profits pertaining to the financial year ended March 31, 2020
To conserve capital to support the economy and absorb losses.
December 4, 2020
Regional Rural Banks- Access to Call/Notice/Term Money Market: RRBs were permitted to participate in the call/notice and term money markets both as borrowers and lenders
To facilitate more efficient liquidity management by the RRBs.
December 4, 2020
Regional Rural Banks- Access to RBI’s Liquidity Facilities: Liquidity Adjustment Facility (LAF) and Marginal Standing Facility (MSF) were extended to Scheduled RRBs.
To provide an additional avenue for liquidity management to Regional Rural Banks (RRBs).
December 14, 2020
24x7 Availability of Real Time Gross Settlement (RTGS) System: RTGS was made available for customer and inter-bank transactions round the clock, with effect from December 14, 2020.
To support global integration of Indian financial markets, facilitate India’s efforts to develop international financial centers and to provide wider payment flexibility to domestic corporates and institutions.

100
Annex 3
2) The Securities and Exchange Board of India
Date Regulatory Measure Rationale
June 05, 2020 Framework for Regulatory Sandbox: SEBI
regulated entities were granted certain facilities
and flexibilities to experiment with Fintech
solutions in a live environment and on limited
set of real customers for a limited time frame.
For promoting innovation while protecting
customers interests.
June 12, 2020 Investment by the sponsor or asset management company in the scheme: Sponsor or AMC are
required to invest not less than one percent of
the amount which would be raised in the new
fund offer or fifty lakh rupees, whichever is less,
and such investment shall not be redeemed
unless the scheme is wound up
To ensure that sponsors or AMC of mutual
funds have skin in the game.
June 23, 2020 Operational framework for transactions in defaulted debt securities post maturity date/
redemption date.
To permit lifting existing restrictions on
trading of defaulted debt securities.
June 24, 2020 Guidelines for Order-to-trade ratio (OTR) for
Algorithmic Trading were reviewed and modified
To rationalise algorithmic trading.
July 1, 2020 Standard Operating Procedure (SOP) was
prescribed for SEs / CCs / Depositories in cases where Trading Member(TM)/Clearing Member (CM) is likely to default in repayment of funds
or securities to clients.
To protect the interest of non-defaulting
clients of a TM and /or non-defaulting
clients/ TM(s) of the CM, in the likely
event of default by TM / CM.
July 20, 2020 Framework to Enable Verification of Upfront Collection of Margins from Clients in Cash and Derivatives segments: Operational guidelines
were issued for stock exchanges and clearing
corporations to adopt a framework to enable
verification of upfront collection of margins from
clients in cash and derivatives segments.
To align and streamline the risk
management framework of both cash and
derivatives segments.
July 21, 2020 Review of Stress Testing Methodology for Positions with Early Pay-in: The norms related
to core Settlement Guarantee Fund and
standardised stress testing for credit for
commodity derivatives were reviewed.
To address the concern regarding high
stress loss figures on positions with early
pay-in.

101
Financial Stability Report January 2021
Date Regulatory Measure Rationale
September 01, 2020
Review of debt and money market securities transactions disclosure: Daily disclosure of the details of debt and money market securities transacted (including inter scheme transfers) in mutual fund schemes with a time lag of 15 days, were prescribed
To further enhance transparency in disclosure of portfolio of debt schemes.
September 21, 2020
Alternate Risk Management Framework Applicable in case of Near Zero and Negative Prices for commodity prices was introduced
To enable risk management framework to handle extreme volatility in commodity prices.
October 5, 2020 Product Labelling in Mutual Fund schemes –Risk-o-meter: Detailed guidelines were issued for evaluation of risk levels of a scheme, which shall be depicted by a risk-o-meter, to be evaluated on monthly basis starting January 2021.
To enhance disclosure to investors enabling them to take informed decisions.
October 6, 2020 Additional framework for issuance, listing and trading of Perpetual Non-Cumulative Preference Shares (PNCPS) and Innovative Perpetual Debt Instruments (IPDIs)/ Perpetual Debt Instruments (PDIs) was prescribed.
The nature and contingency impact of these instruments and the fact that full import of the discretion is available to an issuer, may not be understood in the truest form by retail individual investors. In this regard, additional framework related to issuance, listing and trading of PNCPS and IPDIs which are proposed to be listed, has been prescribed.
October 13, 2020 Standardised procedure to be followed by Debenture Trustee(s) in case of ‘Default’ by Issuers of listed debt securities was notified.
For enforcement of security and/or entering into an Inter-Creditor Agreement.
November 03, 2020
Creation of Security in issuance of listed debt securities and ‘due diligence’ by debenture trustee(s)
To ensure adequacy of assets for purpose of security creation.
November 05, 2020/ September 11. 2020
Asset Allocation of Multi Cap Funds and Introduction of “Flexi Cap Fund” as a new category under Equity Schemes: Multi Cap schemes of mutual funds are required to invest a minimum of 25 per cent each in large, mid and small cap stocks, with the balance 25 per cent giving flexibility to the fund manager. Further, MFs can convert an existing scheme to Flexi Cap Fund or launch a new scheme under Flexi Cap Fund.
To diversify underlying investments across caps and at the same time provide more flexibility to mutual funds.

102
Annex 3
Date Regulatory Measure Rationale
November 06,
2020
Norms regarding holding of liquid assets in open ended debt schemes and stress testing of open ended debt schemes: MFs are required at
least 10% of their net assets in liquid assets (i.e. in cash, G-sec, T-bills and repo on Govt. Securities)
in all open ended debt schemes (except overnight
fund, liquid fund, Gilt Fund and Gilt fund with
10 year constant duration) and monthly stress
testing is prescribed for all open ended debt
schemes (except overnight funds).
To augment the liquidity risk management
framework of open ended debt schemes.
November 12,
2020
Monitoring and Disclosures by Debenture
Trustee(s).
To enable investors to ascertain the duties
discharged by Debenture Trustee(s) and to
enhance the accountability on part of
Debenture Trustee(s).
December 21,
2020
Core Settlement Guarantee Fund, Default
Waterfall and Stress Test for Limited Purpose
Clearing Corporation (LPCC).
To ensure availability of adequate funds to
meet out all the contingencies.
3) Insurance Regulatory and Development Authority of India
Date Regulatory Measure Rationale
June 26, 2020 Guidelines to all General and Health Insurers to
offer Individual COVID Standard Health Policy
were issued.
For offering customers a standardised
insurance product covering COVID-19
expenses.
September 25,
2020
IRDAI has developed a methodology for
identification and supervision of Domestic Systemically Important Insurers (D-SIIs), and
identified Life Insurance Corporation of India,
General Insurance Corporation of India and The
New India Assurance Co. Ltd as D-SIIs for the
year 2020-21.
To identify D-SIIs and to subject such
insurers to enhanced monitoring
mechanism.

103
Financial Stability Report January 2021
4) Pension Fund Regulatory and Development Authority
Date Regulatory Measure Rationale
Digital Solutions PFRDA has allowed comprehensive and
digitally enabled solutions to meet
subscribers’ varied needs from on-boarding
to exit, to increase the outreach of NPS.
June 08, 2020 Aadhaar based offline paperless KYC verification
process for NPS On-boarding.
June 15, 2020 OTP based authentication for paperless on-
boarding.
September 03,
2020
e- Nomination facility for NPS subscribers.
October 29, 2020 Video Based Customer Identification Process
(VCIP) for NPS.
August 24, 2020 Ombudsman for resolving grievances under NPS and APY: PFRDA appointed an Ombudsman
for resolution of complaints or grievances under
the ambit of PFRDA (Redressal of Subscribers
Grievances) Regulations, 2015.
To facilitate expeditious and inexpensive
redressal of pension fund subscriber’s
grievances.
September 25,
2020
Introduction of RFQ platform for Corporate Bond transactions- Request for Quote (RFQ) to
replicate the OTC market for purchase/sale of
securities under NPS schemes and other pension
schemes administered by PFRDA.
To bring about greater transparency,
centralization and pooling of investor
interest and, therefore, a more efficient
and liquid secondary market.
5) The Insolvency and Bankruptcy Board of India
Date Regulatory Measure Rationale
June 30, 2020 IP Regulations were amended to allow the
Insolvency Professional Entities (IPEs) to provide
support services to any IP
To further professionalise insolvency
services and enable IPs’ access to regulated
support services.
August 05, 2020 Liquidation Process Regulations were amended clarifying the fees payable to the liquidator on
the amount realised but not distributed and on
the amount distributed but not realised.
To provide clarity on fees payable to
liquidator.
August 05, 2020 Voluntary Liquidation Process Regulations were amended to provide that a corporate
person may replace the liquidator by appointing
another insolvency professional as liquidator
To facilitate appointment of another
resolution professional as the liquidator to
conduct the voluntary liquidation process.

104
Annex 3
Date Regulatory Measure Rationale
August 07, 2020 CIRP Regulations were amended to facilitate
ease of coordination and communication
between the authorised representative and the
creditors in the class he represents and
streamline the process of voting on compliant
resolution plans.
To facilitate insolvency proceedings.
September 24,
2020
Application to Adjudicating Authority Rules
were amended to provide that a financial creditor
when initiating CIRP against a corporate debtor
(CD), shall serve a copy of the application to the
registered office of the CD and to the Board
before filing with the Adjudicating Authority.
To facilitate timely communication of
initiation of CIRP to the CD against whom
application has been filed and to facilitate
effective data management and
dissemination by IBBI.
6) International Financial Services Centres Authority (IFSCA)
Date Regulatory Measure Rationale
October 19, 2020 Regulatory Sandbox: A framework for
“Regulatory Sandbox” was introduced
To enable entities operating in the capital
market, banking, insurance and financial
services to avail themselves of certain
facilities and flexibilities to experiment
with innovative fintech solutions in a live
environment with a limited set of real
customers for a limited time frame.
October 21, 2020 Real Estate Investment Trusts (REITs) and Infrastructure Investment Trusts (InvITs): These entities were permitted to list on the stock
exchanges in GIFT IFSC.
To prescribe the regulatory framework for
listing of REITs and InvITs incorporated in
any FATF compliant jurisdictions on the
stock exchanges in GIFT IFSC.
October 28, 2020 Depository Receipts: The regulatory framework
for listing of Depository Receipts was laid down
To provide the framework for listing Global
Depository receipts in IFSC.
November 13,
2020
IFSCA (Global In-house Centres) Regulations, 2020: The IFSCA (Global In-house Centres)
Regulations, 2020 were notified.
To provide the regulatory framework for
global in-house centres in IFSC, creating an
opportunity for global financial institutions
to conduct their global back-end activities
in GIFT-IFSC.
November 20,
2020
IFSCA (Banking) regulations, 2020: The IFSCA
(Banking) Regulations, 2020 were notified.
To provide principle-based regulations,
balancing the objectives of risk mitigation
and financial innovation.

105
Financial Stability Report January 2021
Date Regulatory Measure Rationale
December 11,
2020
The International Financial Services Centres Authority (Bullion Exchange) Regulations, 2020: The regulatory framework for the bullion
exchange, clearing corporations, depositories
and vaults was laid down. Spot trading in bullion
was introduced.
To provide the regulatory framework for
bullion spot market in IFSC.


