27
Financial Statement Analysis Prepared By: Anuj Bhatia, Professor, Shah Tuition Classes Ph.9898251471
| Date post: | 21-Apr-2017 |
| Category: |
Economy & Finance |
| Upload: | anuj-bhatia |
| View: | 69,884 times |
| Download: | 0 times |

Financial Statement Analysis
Prepared By:Anuj Bhatia,Professor,Shah Tuition ClassesPh.9898251471

Business Survival:There are two key factors for business survival:• Profitability • Solvency
• Profitability is important if the business is to generate revenue (income) in excess of the expenses incurred in operating that business.
• The solvency of a business is important because it looks at the ability of the business in meeting its financial obligations.
Financial Statement Analysis• Financial Statement Analysis will help business
owners and other interested people to analyse the data in financial statements to provide them with better information about such key factors for decision making and ultimate business survival.

• Financial Statement Analysis is the collective name for the tools and techniques that are intended to provide relevant information to the decision makers. The purpose of the FSA is to assess the financial health and performance of the company.
• FSA consist of the comparisons for the same company over the period of time and comparisions of different companies either in the same industry or in different industries.
© Mary Low

Financial Statement AnalysisPurpose:• To use financial statements to evaluate an
organisation’s– Financial performance– Financial position– Prediction of future performance
• To have a means of comparative analysis across time in terms of:– Intracompany basis (within the company itself)– Intercompany basis (between companies)– Industry Averages (against that particular industry’s averages)
• To apply analytical tools and techniques to financial statements to obtain useful information to aid decision making.

Financial Statement AnalysisFinancial statement analysis involves analysing the information provided in the financial statements to:
– Provide information about the organisation’s:• Past performance• Present condition• Future performance
– Assess the organisation’s:• Earnings in terms of power, persistence, quality
and growth• Solvency

Financial Statements…• 1. The Income Statement• 2. The Balance Sheet• 3. The Statement of Retained Earnings• 4. The Statement of Changes in Financial
Position Changes in Working Capital Position Changes in Cash Position Changes in Overall Financial Position
© Mary Low

Effective Financial Statement Analysis
• To perform an effective financial statement analysis, you need to be aware of the organisation’s:– business strategy– objectives– annual report and other documents like articles about
the organisation in newspapers and business reviews. These are called individual organisational factors.
Effective Financial Statement AnalysisRequires that you:• Understand the nature of the industry in which
the organisation works. This is an industry factor.
• Understand that the overall state of the economy may also have an impact on the performance of the organisation.
→ Financial statement analysis is more than just “crunching numbers”; it involves obtaining a broader picture of the organisation in order to evaluate appropriately how that organisation is performing
Standards of Comparision…• 1. Rule-of-thumb Indicators
Financial analyst and Bankers use rule-of thumb or benchmark financial ratios.
• 2. Past performance of the Company• 3.Industry Standards…
© Mary Low

Sources of Information..1. Company Reports
– Directors Report– Financial Statement– Schedules and notes to the Financial Statements– Auditors Report
© Mary Low
2. Stock Exchanges3.Business Periodicals4.Information Services
• CRISIL• ICRA• CMIE
Tools of Financial Statement Analysis:
The commonly used tools for financial statement analysis are:• Financial Ratio Analysis• Comparative financial statements analysis:
– Horizontal analysis/Trend analysis– Vertical analysis/Common size analysis/ Component
Percentages
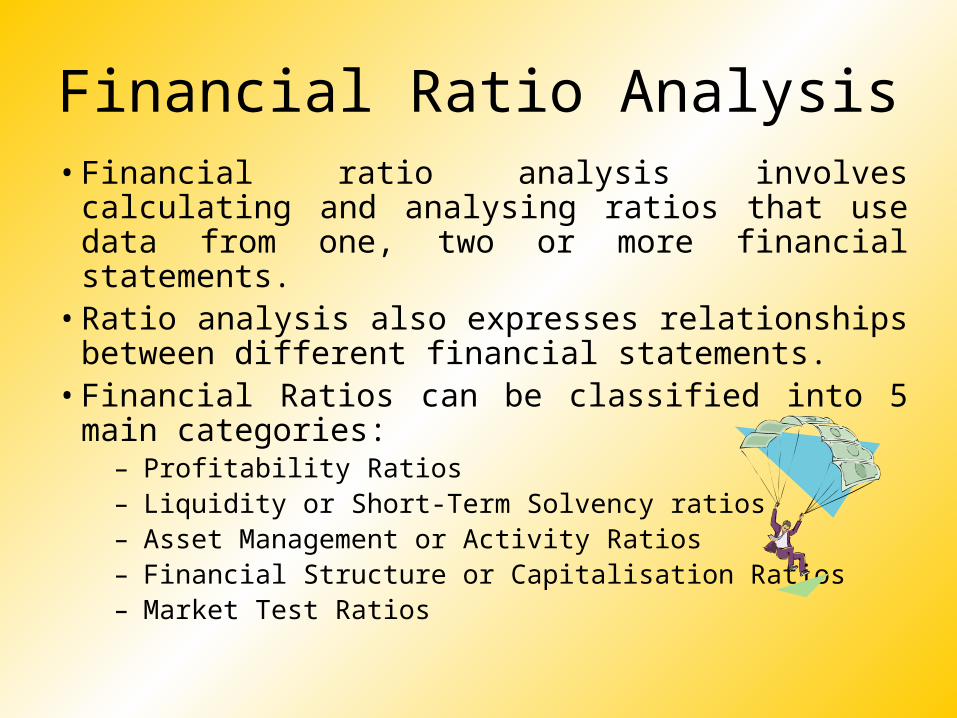
Financial Ratio Analysis• Financial ratio analysis involves calculating and analysing
ratios that use data from one, two or more financial statements.
• Ratio analysis also expresses relationships between different financial statements.
• Financial Ratios can be classified into 5 main categories:– Profitability Ratios– Liquidity or Short-Term Solvency ratios– Asset Management or Activity Ratios– Financial Structure or Capitalisation Ratios– Market Test Ratios
Profitability Ratios
3 elements of the profitability analysis:• Analysing on sales and trading margin
– focus on gross profit• Analysing on the control of expenses
– focus on net profit• Assessing the return on assets and return
on equity

Profitability Ratios• Gross Profit % = Gross Profit * 100
Net Sales• Net Profit % = Net Profit after tax * 100
Net SalesOr in some cases, firms use the net profit before tax figure. Firms have no control over tax expense as they would have over other expenses. Net Profit % = Net Profit before tax *100
Net Sales
• Return on Assets = Net Profit * 100 Average Total Assets
• Return on Equity = Net Profit *100Average Total Equity

Liquidity or Short-Term Solvency ratios
Short-term funds management• Working capital management is important as it signals the firm’s ability
to meet short term debt obligations.
For example: Current ratio
• The ideal benchmark for the current ratio is $2:$1 where there are two dollars of current assets (CA) to cover $1 of current liabilities (CL). The acceptable benchmark is $1: $1 but a ratio below $1CA:$1CL represents liquidity riskiness as there is insufficient current assets to cover $1 of current liabilities.

Liquidity or Short-Term Solvency ratios• Working Capital = Current assets – Current Liabilities
• Current Ratio = Current Assets Current Liabilities
• Quick Ratio = Current Assets – Inventory – Prepayments Current Liabilities – Bank
Overdraft

© Mary L
Asset Management or Activity Ratios
• Efficiency of asset usage– How well assets are used to generate revenues
(income) will impact on the overall profitability of the business.
For example: Asset Turnover
• This ratio represents the efficiency of asset usage to generate sales revenue

© Mary Low
Asset Management or Activity Ratios
• Asset Turnover = Net SalesAverage Total Assets
• Inventory Turnover = Cost of Goods SoldAverage Ending Inventory
• Average Collection Period = Average accounts Receivable Average daily net credit sales*
* Average daily net credit sales = net credit sales / 365
© Mary Low
Financial Structure or Capitalisation Ratios
Long term funds management• Measures the riskiness of business in terms of debt
gearing.
For example: Debt/Equity• This ratio measures the relationship between debt and
equity. A ratio of 1 indicates that debt and equity funding are equal (i.e. there is $1 of debt to $1 of equity) whereas a ratio of 1.5 indicates that there is higher debt gearing in the business (i.e. there is $1.5 of debt to $1 of equity). This higher debt gearing is usually interpreted as bringing in more financial risk for the business particularly if the business has profitability or cash flow problems.
© Mary Low
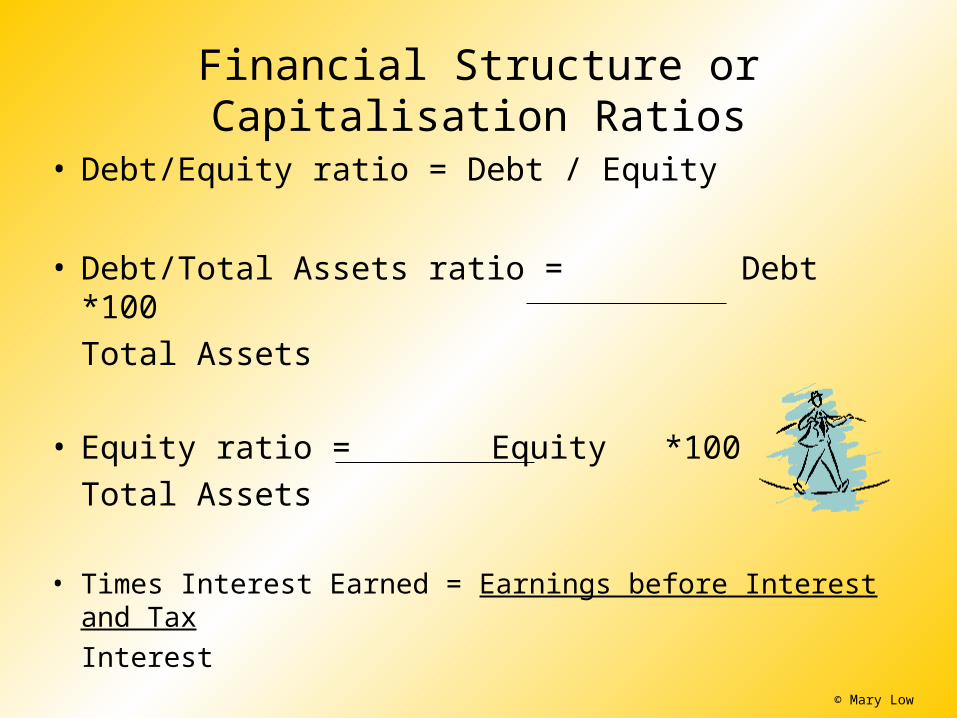
Financial Structure or Capitalisation Ratios
• Debt/Equity ratio = Debt / Equity
• Debt/Total Assets ratio = Debt *100Total Assets
• Equity ratio = Equity *100Total Assets
• Times Interest Earned = Earnings before Interest and TaxInterest
© Mary Low
Market Test Ratios
• Based on the share market's perception of the company.
For example: Price/Earnings ratio
• The higher the ratio, the higher the perceived quality of the earnings by the share market.
© Mary Low
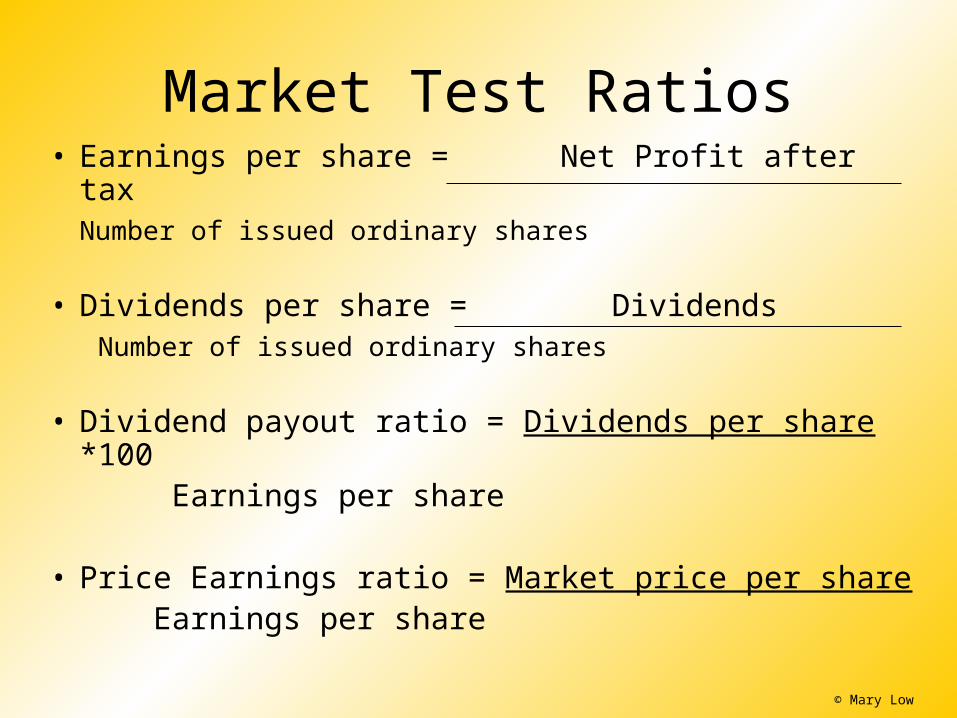
Market Test Ratios• Earnings per share = Net Profit after tax
Number of issued ordinary shares
• Dividends per share = Dividends Number of issued ordinary shares
• Dividend payout ratio = Dividends per share *100 Earnings per share
• Price Earnings ratio = Market price per share Earnings per share
© Mary Low
Horizontal analysis/Trend analysis
• Trend percentage• Line-by-line item analysis• Items are expressed as a percentage of a
base year• This is a time series analysis• For example, a line item could look at
increase in sales turnover over a period of 5 years to identify what the growth in sales is over this period.
© Mary Low
Vertical analysis/Common size analysis/ Component Percentages
• All items are expressed as a percentage of a common base item within a financial statement
• e.g. Financial Performance – sales is the base• e.g. Financial Position – total assets is the base• Important analysis for comparative purposes
– Over time and– For different sized enterprises

© Mary Low
Limitations of Financial Statement Analysis
• We must be careful with financial statement analysis.– Strong financial statement analysis does not
necessarily mean that the organisation has a strong financial future.
– Financial statement analysis might look good but there may be other factors that can cause an organisation to collapse.
Limitations of FSA…..1. Financial Analysis is only a Means2. Ignores the Price Level Changes3. Financial Statements are essentially Intrim
Reports4. Accounting Concepts and Conventions5. Influence of Personal Judgments6. Disclose only Monetary Facts
© Mary Low


