29
Financial Statement Analysis and Valuation Of Apex Foods Ltd
| Date post: | 06-Aug-2015 |
| Category: |
Education |
| Upload: | monir-hossain |
| View: | 37 times |
| Download: | 0 times |

Financial Statement Analysis and Valuation Of
Apex Foods Ltd

Prepared for…Dr. Mahmood Osman ImamProfessorDepartment of FinanceUniversity Of Dhaka

Apex Foods Ltd.Apex Foods Ltd. is the subsidiary of Apex Group Co. Ltd.
established in 1994.Apex foods ltd. is a public limited company.It’s authorized capital is 150,000,000 tk.Issued, Subscribed & Paid up Capital: 57,024,000 tk.The company mainly produce , Spicy Garlic Shrimp,
Shrimp Appetizer, Jumbo Shrimp Parmesan, Butterfly Shrimp and Pasta, Chili Garlic Roasted Shrimp etc

Dividend Policy
Apex Foods Ltd. Provide cash dividend every year.
They don’t give stock dividend for the last five years.Valuation.xlsx

Industry Analysis
The five competitive forces used to analyze the industry. These are
1. Threat of new entrants: Low – MediumThe food industry is highly regulated and administrated.
2. Threat of existing Competitor: High Low level of differentiation Switching cost for the consumers is low.

Industry Analysis
3. Threats of substitute products: Low Consumers simply do not have any other options for
shrimp food substitutes.4.Bargaining Power of Buyers: Moderate Majority of shrimp foods manufacturers have their own
wholesaling operations. The firms are able to successfully hedge themselves by
having greater control of downstream buyers.

Industry Analysis
5. Bargaining Power of suppliers: LOW As there are many supplier in food industry so the
bargaining power of supplier is low in this industry.

Ratio Analysis(Liquidity Ratios)
Valuation Apex.xlsx
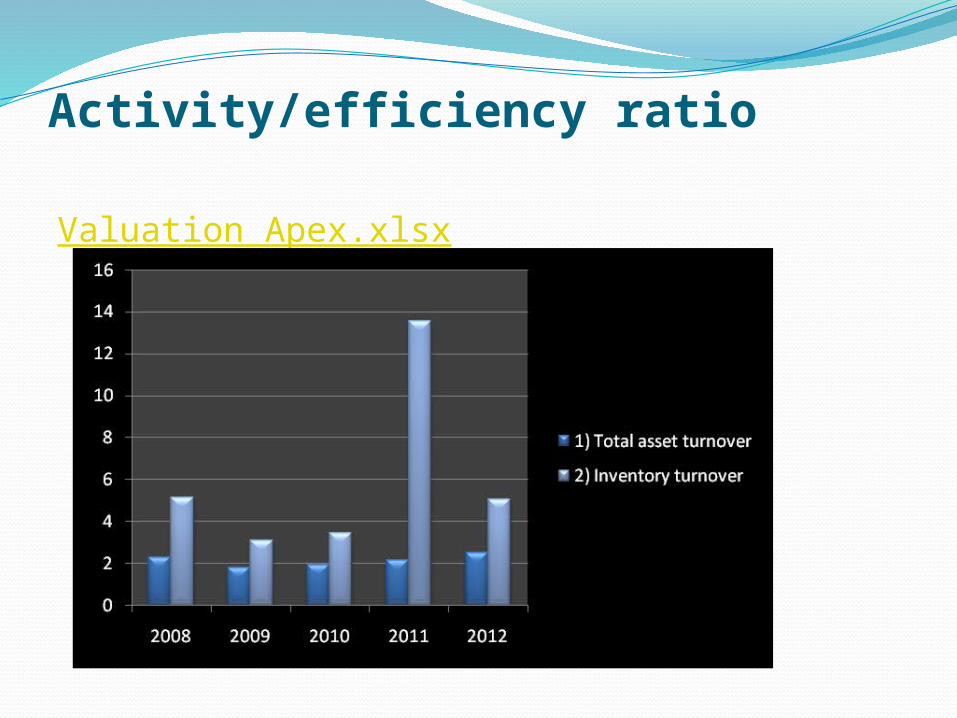
Activity/efficiency ratio
Valuation Apex.xlsx

Activity/efficiency ratioValuation Apex.xlsx

Leverage/solvency Ratio
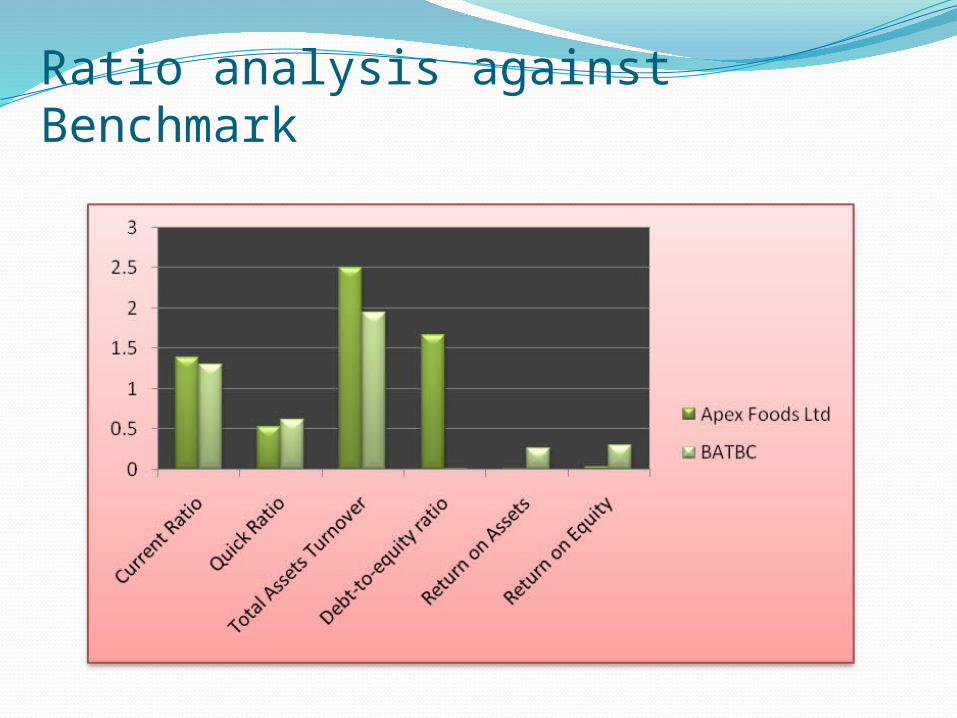
Ratio analysis against Benchmark
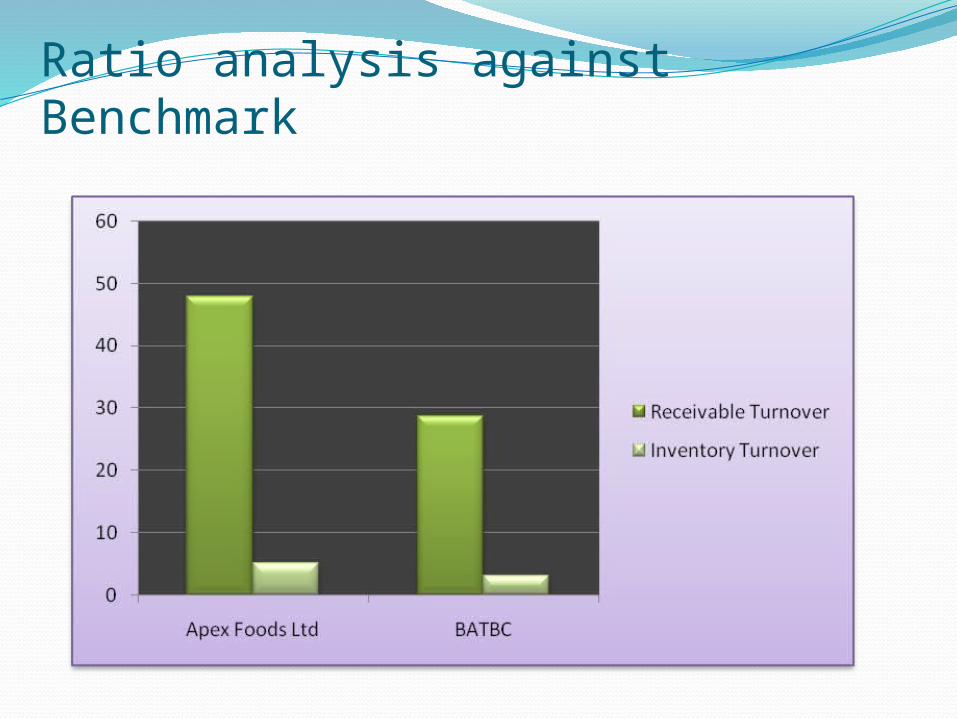
Ratio analysis against Benchmark

Ratio analysis against PeerValuation Apex.xlsx

Ratio analysis against Peer

Relative Valuation
Price with respect price earning multiple 59.85165546
Price with respect to sales 1395.080686
Price with respect to cash flow 601.24
Price with respect to Book value Valuation Apex.xlsx 314.07

Dupont Analysis
From the year 2008 to 2012, the following CV’s have been found-
O. Profit Margin
Total Asset Turnover
Interest Burden After tax Retention rate
Financial Leverage
CV 4155.01 490.62 230.81 -168.98 350.39
The higher the co-efficient of variation of a factor, the higher will be the sensitivity of ROE. So, from this data it is apparent that the ROE of Apex Food Limited is most sensitive to its operating profit margin.Valuation Apex.xlsx

Leverage Analysis

Leverage Analysis

Potential red flags of Apex Food Ltd1. Unusual increase in account receivable in relation to turnover Valuation Apex.xlsx

Potential red flags of Apex Food Ltd2. Unusual increase in inventory in relation to sales increase.Valuation Apex.xlsx

Potential red flags of Apex Food Ltd
Reported income 23,672,984 -8,930,907 8,559,275 10,794,736 15,434,217
Cash flow from operating activities 136611144 -72479592 46284431 -228925474 152091482
Gap between RI & OCF -112,938,160 63,548,685 -37,725,156 239,720,210-
136,657,265
3. An increasing gap between a firm’s reported income and its cash flow from operating activities.Valuation Apex.xlsx

Earnings Quality EvaluationComparative Earnings Quality Analysis
APEX BATBC
Accruals Ratio Cash Flow Basis 0.081911315 0.137791166
Accruals Ratio Balance Sheet Basis 0.113058645 0.333666151
Earnings quality is typically defined in terms of persistence and sustainability. Valuation Apex.xlsxFrom the table it is observed that Apex Foods Ltd has comparatively better performance in maintaining the earnings or alternatively it has more earnings manipulation than its Benchmark.
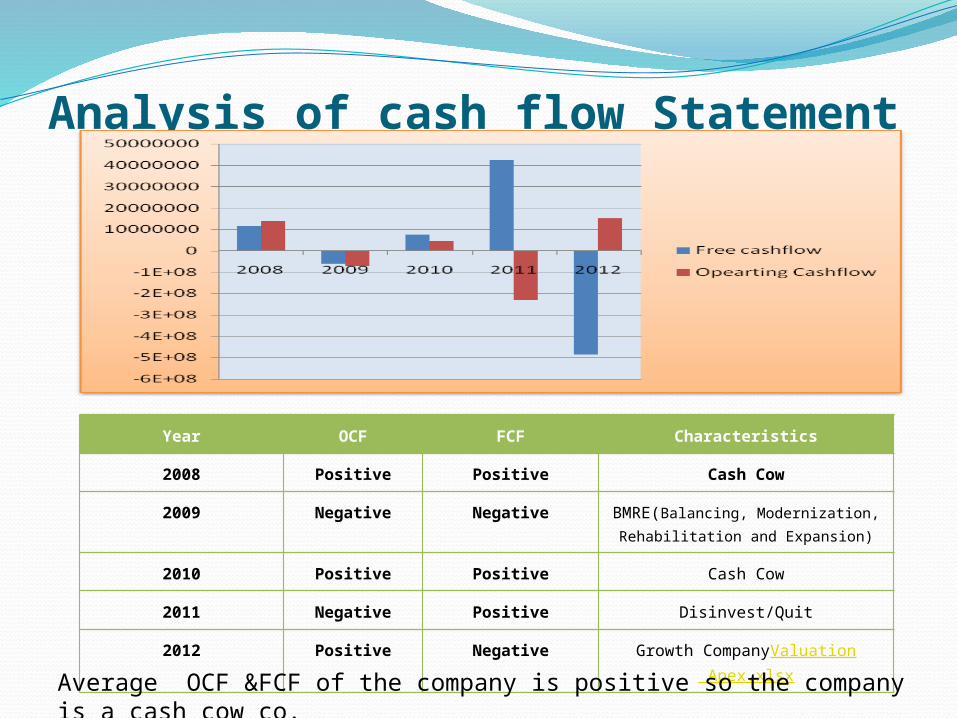
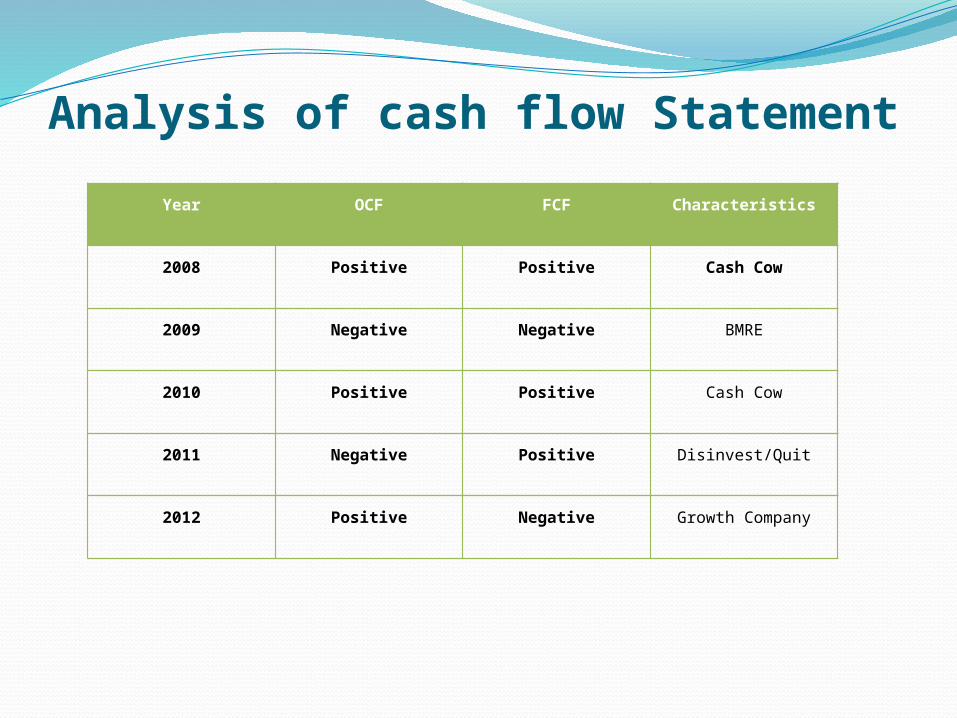
Analysis of cash flow Statement
Year OCF FCF Characteristics
2008 Positive Positive Cash Cow
2009 Negative Negative BMRE(Balancing, Modernization, Rehabilitation and Expansion)
2010 Positive Positive Cash Cow
2011 Negative Positive Disinvest/Quit
2012 Positive Negative Growth CompanyValuation Apex.xlsx
Average OCF &FCF of the company is positive so the company is a cash cow co.
Analysis of cash flow Statement
Year OCF FCF Characteristics
2008 Positive Positive Cash Cow
2009 Negative Negative BMRE
2010 Positive Positive Cash Cow
2011 Negative Positive Disinvest/Quit
2012 Positive Negative Growth Company

Actual & Sustainable Growth Rate

Estimation of value addition2012
NOPAT 224,285,567
Invested Capital 1,474,151,687
Cost of capital 0.098776412
Economic Value Added 78674152.38
The positive value of EVA tells us that generating BDT 224285566.5 in after-tax net operating profits.

Recommendations1. The company should reduce its debt from its capital
structure.2. Apex foods need pay more attention in inventory
management.

Any Queries?


