- 1 - Financial Statement Analysis in Mergers and Acquisitions Howard E. Johnson, MBA, CA, CMA, CBV, CPA, CFA Campbell Valuation Partners Limited Overview Financial statement analysis is fundamental to a corporate acquirer’s assessment of an acquisition or merger candidate. As part of its due diligence investigation, a corporate acquirer typically analyzes the current and prospective financial statements of a target company. This analysis is used in estimating the ‘value’ of the shares or net assets of the target company, and in determining the price and terms of a transaction the acquirer is prepared to offer and accept. This paper will address the practical applications of financial statement analysis typically performed by corporate acquirers in open market valuation and pricing exercises. This paper is not intended to be an all-inclusive discussion, and some of the items discussed may not be applicable in a given situation. Every open market transaction is unique, and judgment is required to determine the appropriate nature and level of financial statement analysis that should be undertaken in each case. Determining value and price The principal determinants of the value of the shares (or underlying net assets) of a target company in an open market transaction are:
Transcript
- 1 -
Financial Statement Analysis in Mergers and Acquisitions
Howard E. Johnson, MBA, CA, CMA, CBV, CPA, CFA
Campbell Valuation Partners Limited
Overview
Financial statement analysis is fundamental to a corporate acquirer’s assessment of an
acquisition or merger candidate. As part of its due diligence investigation, a corporate
acquirer typically analyzes the current and prospective financial statements of a target
company. This analysis is used in estimating the ‘value’ of the shares or net assets of the
target company, and in determining the price and terms of a transaction the acquirer is
prepared to offer and accept.
This paper will address the practical applications of financial statement analysis typically
performed by corporate acquirers in open market valuation and pricing exercises. This
paper is not intended to be an all-inclusive discussion, and some of the items discussed
may not be applicable in a given situation. Every open market transaction is unique, and
judgment is required to determine the appropriate nature and level of financial statement
analysis that should be undertaken in each case.
Determining value and price
The principal determinants of the value of the shares (or underlying net assets) of a target
company in an open market transaction are:
- 2 -
• the quantum and timing of prospective (after-tax) discretionary cash flows that will be
generated. This typically includes discretionary cash flows to be generated by the
target company from its operations on a ‘stand-alone’ basis as well as discretionary
cash flows that a buyer anticipates will arise in the form of post-acquisition synergies;
• the acquirer’s required rate of return given its perceived level of risk of achieving said
discretionary cash flows and its perception of the target company’s ‘strategic
importance’;
• redundant (or non-operating) assets that are acquired as part of the transaction; and
• the amount of interest-bearing debt that is assumed by the acquirer.
As a simple example, assume that the acquisition of Company X is expected to generate
$10 million of prospective discretionary cash flow per annum (including anticipated post-
acquisition synergies), and that the prospective acquirer considers a 12% capitalization
rate to be appropriate based on its cost of capital, and its assessment of Company X’s
operations, the industry in which it operates, and the risk of generating said discretionary
cash flows. Further assume that Company X will sell redundant assets with a net
realizable value of $2 million and that the acquirer will assume $25 million of Company
X’s interest bearing debt obligations. It follows that the value (normally defined as fair
market value) of the shares of Company X generally would be estimated as:
- 3 -
Prospective annual discretionary cash flow $10 million
Divided by: capitalization rate 12%
Equals: capitalized cash flow $83 million
Add: redundant assets $2 million
Equals: enterprise value $85 million
Deduct: interest bearing debt ($25 million)
Equals: fair market value of the shares of Company X $60 million
The actual price (and related transaction terms) that a corporate acquirer might be
prepared to pay for the shares (or underlying net assets) of Company X may be higher or
lower than its estimate of fair market value. This is due to such things as the negotiating
positions of the parties involved, the number of acquirers interested in Company X at a
point in time, and numerous other factors that may only come to light during the course
of negotiations.
An analysis of the historical and forecast financial statements (where available) of a
target company is used when assessing each of the determinants of its equity value. In
addition, the terms of an open market transaction normally stipulate that adjustments to
the agreed price may be required pending the results of the buyer’s final due diligence
investigation.
- 4 -
Prospective Discretionary Cash Flow
Businesses typically are valued based on their ability to prospectively generate
discretionary cash flow. Discretionary cash flow is defined as cash flow from operations
(often termed earnings before interest, taxes, depreciation, and amortization, or
‘EBITDA’), less income taxes, capital expenditure requirements (net of the related
income tax shield), and incremental working capital requirements. Discretionary cash
flow represents the amount of money available to the providers of capital of a business
(debt holders and shareholders) that can be withdrawn without impairing the existing
operations of the business, or its ability to generate its forecast operating results. An
estimate of prospective discretionary cash flow to be generated by a business normally
involves an assessment of the historical operating results of the target company and any
financial projections that have been prepared. In addition, an assessment of the
prospective discretionary cash flows to be generated normally includes those of the target
company itself, and those that the acquirer anticipates will be realized in the form of post-
acquisition synergies.
Historical operating results
In most cases, recent historical operating results (normally the past five years, with
greater emphasis on the most recent years) are considered when estimating prospective
operating results. The amount of weight afforded to historical operating results depends
on whether and to what extent they are believed to represent what the target company
prospectively is capable of generating on a stand-alone basis. For example, where the
- 5 -
target company has undergone significant changes in recent years (e.g. in terms of its
product lines, capacity, management philosophy, the dynamics of the industry in which it
operates, and so on), historical operating results may not be indicative of future
expectations, and any analysis thereof should be discounted accordingly.
In addition to providing an indication of the level and variability of historical profitability
and cash flow, an analysis of the historical financial statements of an acquisition target
normally involves the calculation of various financial ratios that can generally be
categorized as:
• profitability ratios (e.g. gross margin and operating profit margin) that indicate the
proportion of revenues retained by the company at different levels, and the
company’s sensitivity to fluctuations in revenues;
• efficiency ratios (e.g. days in receivables and inventory turnover) which assist a buyer
in assessing incremental working capital requirements that will be needed to support
prospective revenues, and in evaluating management efficiency;
• liquidity ratios (e.g. the current ratio and quick ratio), which measure the short term
financial strength of the business, and whether the buyer will be required to make a
capital injection to support the operations of the target company;
• financial leverage ratios (e.g. long term debt to equity and times interest earned)
which measure target company’s ability to accommodate interest bearing debt. This
may in turn affect the acquirer’s cost of capital, and its required rate of return; and
- 6 -
• operating ratios (e.g. sales per employee and average selling price per unit sold),
which help a buyer in assessing the resource and capacity requirements of a target
company.
Ratios and trends therein can provide a buyer with insight into the reasons for a target
company’s historical performance. However, ratio analysis must be tempered by
consideration of changes in accounting policies, management practices, and so on, which
might distort such analysis. In addition, when analyzing the historical financial
statements of the target company, it is important to consider the state of the economy and
the industry at the time those results were achieved.
When reviewing historical operating results, buyers should closely scrutinize a target
company’s recent historical financial statements for ‘window dressing’. Prior to selling a
business, many owners and managers will take steps to reflect the best possible financial
results, knowing that those results often are a key element in negotiations with
prospective acquirers. Therefore, owners and managers sometimes reduce spending in
discretionary accounts such as advertising, research and development, and so on, to
increase short-term profitability. However, these actions may have serious long term
consequences to the vendor’s business.
The analysis of historical financial statements also involves the identification of unusual
or non-recurring items. This is because, by definition, historical unusual and non-
- 7 -
recurring items are not indicative of prospective operating results. Vendors normally are
quick to point out unusual and non-recurring items that negatively impacted historical
operating results. However, a buyer should consider whether these things truly are non-
recurring. For example, while a costly strike may be unusual, it may recur in the future,
and therefore should be considered either through a reduction of prospective
discretionary cash flows, or in the level of risk of achieving those cash flows. Simply
because an item is classified as ‘unusual’ or ‘extraordinary’ in the financial statements
does not necessarily mean that it will not recur. Conversely, non-recurring and unusual
items that favourably affected historical operating results often are buried as part of
revenues or expenses from ongoing operations. Examples include non-recurring property
tax refunds, a significant one-time sale, and the recovery of assets that had previously
been written down. The detection of these things requires careful analysis of the historical
financial statements, including ratios, trends, and so on.
The analysis of historical financial statements should not be limited to annual results.
Quarterly and monthly results also should be considered as these can provide insight as to
seasonality and interim performance. Where practical, the analysis of historical financial
statements should be accompanied by an analysis of supporting schedules, such as the
trial balance and other working papers that may be available. Many items are classified
for accounting purposes in such a way as to distort the analysis of these results. In
addition, the classification of revenues and expenses for financial statement presentation
purposes may change over time, again distorting ratios and apparent trends.
- 8 -
While much of the analysis of historical operating results will focus on the income
statement and the balance sheet, the statement of cash flows and notes to the financial
statements also are important. Historical cash flow statements provide an indication as to
the capital investment necessary to sustain and grow the operations of the business.
The notes accompanying the financial statements reveal such things as significant
commitments that the target company has made that will impact prospective discretionary
cash flows.
Forecast operating results
When preparing a business for sale, the owners, managers or advisors to a prospective
seller may prepare forecast operating results. Where forecasts are prepared, they
normally are for a period of 3 to 7 years. Where meaningful forecasts are available, a
buyer typically will estimate the value of the target company’s equity using a ‘discounted
cash flow’ methodology. As a practical matter, the discounted cash flow methodology
typically is the preferred methodology of corporate acquirers. While an explanation of
the mechanics of the discounted cash flow methodology are beyond the scope of this
paper, it is an extension of the ‘capitalization of discretionary cash flow’ valuation
methodology presented earlier.
- 9 -
Often in their valuation and pricing analysis, buyers will rely on the seller’s financial
statements without conducting sufficient analysis to determine whether or not those
projections are reasonable. Common areas of forecast deficiencies include:
• internal inconsistencies. Sellers often will forecast revenues to grow at a much higher
rate than expenses, arguing that many expenses are fixed in nature. While this may
be true to some extent, many fixed costs are ‘step costs’, and are only fixed over a
certain range of operating activity;
• excessive optimism compared to historic operating results. Forecasts often explicitly
or implicitly assume certain levels of efficiency will be achieved in the future that had
not been achieved in the past. Comparing prospective financial ratios with historical
ratios can provide an indication of where optimism in the forecast may exist;
• inadequate forecast period. Where a business is cyclical, the forecast should be of
sufficient length to demonstrate performance over an entire business cycle;
• insufficient capital expenditure requirements. In order to achieve an increase in
revenues, most businesses need to increase their capital expenditures. Prospective
capital expenditures should be analyzed to determine the extent that they represent
‘maintenance capital’ as opposed to ‘growth capital’; and
• failure to adequately consider incremental working capital requirements. Buyers and
sellers sometimes neglect to consider that to achieve revenue growth, a company
usually needs to increase its accounts receivable, inventories, and other current assets.
While a portion of the increase may be financed through higher accounts payable and
other ‘trade’ liabilities, most businesses require a net increase in working capital to
- 10 -
grow. To the extent that cash is invested in working capital, it cannot be withdrawn
or invested elsewhere in the business. Therefore incremental working capital
requirements should be deducted in determining prospective discretionary cash flows.
It is not sufficient just to examine the forecasts themselves, but to understand the
underlying assumptions and supporting calculations thereto. In addition, forecasts should
be considered in the context of expectations for the industry and the economy in general.
Where possible, it is helpful to compare year-to-date actual results with budgets and
forecasts that were previously prepared to assess the ability of those preparing the
forecast to make reasonable predictions.
In addition, when assessing forecast operating results that were prepared by the staff or
advisors of a vendor, the buyer should be aware of assumed synergies that have been
incorporated therein. Often when preparing forecasts in contemplation of a sale, a vendor
will liberally anticipate synergies that it believes a ‘typical buyer’ will be able to achieve
by combining the vendors’ operations with its own. Synergies may include headcount
reductions, savings in operating costs, and in some cases, increases in revenues. As
discussed in the following section, while synergies are an important component of open
market transactions, they are unique to every prospective purchaser. Where a prospective
buyer fails to identify and segregate synergies that have been incorporated into a vendor’s
forecasted operating results, it risks overstating or double counting those anticipated
benefits.
- 11 -
Post-acquisition synergies
In most open market transactions involving corporate acquirers, the acquirer anticipates
that it will realize some synergies or strategic advantages by combining the acquired
company with its existing operations. In open market transactions, anticipated synergies
generally should be assessed separately from the estimated discretionary cash flows that a
target company is expected to generate on a stand-alone basis. In most cases, anticipated
synergies that can readily be quantified (such as headcount reductions) are assigned a
probability factor based on the likelihood that they will be realized. The probabilized
synergies are then added to the anticipated discretionary cash flows of the company on a
stand-alone basis to derive the buyer’s expectation of discretionary cash flows to be
generated following the transaction.
Synergies are unique to each acquirer. In most cases, an acquirer has a reasonably good
idea about the synergies that are expected to arise following a transaction based on its
knowledge of its own operations and those of the target company. Financial statement
analysis can assist corporate acquirers in assessing the plausibility of its synergy
assumptions, and in identifying synergies that may not be readily evident.
Assessing the reasonableness of anticipated synergies generally is done through an
evaluation of forecast data. Where the operations of the target company and the acquirer
are similar, their respective financial ratios sometimes can be compared to determine
- 12 -
whether the target company’s operations can be rationalized to the extent anticipated. In
some cases, it may be possible to find meaningful industry data to assist in the analysis.
The identification of ‘hidden’ synergies generally involves an analysis of the target
company’s historical financial statements, and a comparison of relevant operating ratios
to those of the acquirer (where the two are comparable). For example, where the acquirer
has lower working capital requirements than the target, it may indicate that savings are
possible through more stringent accounts receivable collection policies or more efficient
inventory management. However, buyers must be cautioned against assuming that just
because their own operations appear to be more efficient than those of the target company
does not necessarily mean that synergies are available. Alternatively, if such synergies
are possible, they may be difficult to realize, and hence should be discounted accordingly.
Risk Assessment
The second major component in business valuation and pricing is the determination of an
appropriate rate of return (expressed either as a discount rate or a capitalization rate) to
apply against the prospective discretionary cash flows anticipated from an acquisition.
The determination of an appropriate rate of return is a complex and subjective task that
should take into account the acquirer’ cost of capital, the nature of the target company’s
operations, the industry in which it competes, and prevailing economic conditions. Most
corporate acquirers have target ‘hurdle’ rates of return that are used when assessing the
value and price of acquisition candidates. These hurdle rates sometimes are adjusted
- 13 -
(decreased or increased) to reflect such things as the buyer’s perceived risk and its
perceived ‘strategic importance’ of the acquisition. In the end, the rate of return chosen
by a corporate acquirer should reflect the risk that prospective discretionary cash flows
will fall short of forecast. Accordingly, all things equal, the more optimistic the
prospective financial results, the greater the level of risk in achieving those results, and
the higher the required rate of return.
Historical operating results
Where a target company’s historical financial statements are believed to provide some
indication as to future expectations, an analysis of those financial statements is an
important part of risk assessment and rate of return determination. This normally
involves an analysis of:
• historic profit and cash flow levels and volatility therein. Where historical operating
results have been erratic, this normally suggests lower predictability, and hence
higher risk. It also is helpful to assess whether historical operating results
demonstrate an upward or downward trend, and whether a profit and cash flow cycle
exists;
• the target company’s performance under different economic and industry conditions.
Relative performance provides an indication as to a company’s susceptibility to
changing economic and industry conditions, and management’s historical ability to
react to such changes;
- 14 -
• the cost structure of the target company, specifically the degree to which its
operating costs are fixed as opposed to variable. Companies with high levels of fixed
costs have a higher degree of operating leverage. As a result, their profitability
typically is more sensitive to changes in revenues. Higher variability normally
implies greater risk; and
• historical returns, such as return on net assets employed and return on invested equity.
These ratios provide an indication as to resources required to generate economic
returns to providers of capital.
The notes to recent historical financial statements also are important to consider in
assessing risk. The notes disclose such things commitments, contingencies, and so on,
that may increase or decrease risk. For example, a company that hedges its foreign
exchange exposure with forward contracts may be less risky than one that does not.
Alternatively, a company facing a legal claim against it that cannot be readily quantified
would disclose such a contingency in the notes to its financial statements.
Balance sheet analysis
A useful analysis to conduct in evaluating an acquisition target is to segregate its most
recent balance sheet between net operating assets, redundant assets, and financing. This
allows the acquirer to compare its estimate of enterprise value (before redundant assets)
against the net operating assets of the business, and to specifically recognize the interest
bearing obligations that it is assuming, and any redundant assets that may be available.
Where practical, it also is useful to restate assets and liabilities at their value in use (or
- 15 -
market value) as opposed to their book values. This gives the buyer some indication as to
replacement cost of the underlying assets. A discussion of how market values and values
in use are determined is beyond the scope of this paper. While replacement cost typically
is not a principal economic driver in mergers and acquisitions, higher replacement costs
often result in a lower level of risk, and lower required rate of return. This may be
supported on several premises, including:
• higher tangible asset values often allow a company to obtain greater debt financing.
Since the cost of debt is less than the cost of equity, this reduces the discount and
capitalization rate, which normally is expressed as a blend of debt and equity;
• higher capital asset requirements may prove to be a barrier to entry, thereby reducing
prospective competition; and
• in the event that the acquired business fails, higher proceeds of liquidation may be
achieved, thereby reducing the level of downside risk.
The difference between the ‘enterprise value’ of the target company (i.e. the total value of
the business, without regard to how it is financed) and net tangible assets represents the
amount of value attributable to intangible assets, including goodwill. As a general rule, a
lower rate of return is required on the underlying net tangible assets of a business as
contrasted with intangible assets such as goodwill. Therefore, where the amount
attributable to goodwill appears to be excessive or insufficient, this may suggest that the
buyer should increase or decrease (as appropriate) its rate of return requirements
accordingly.
- 16 -
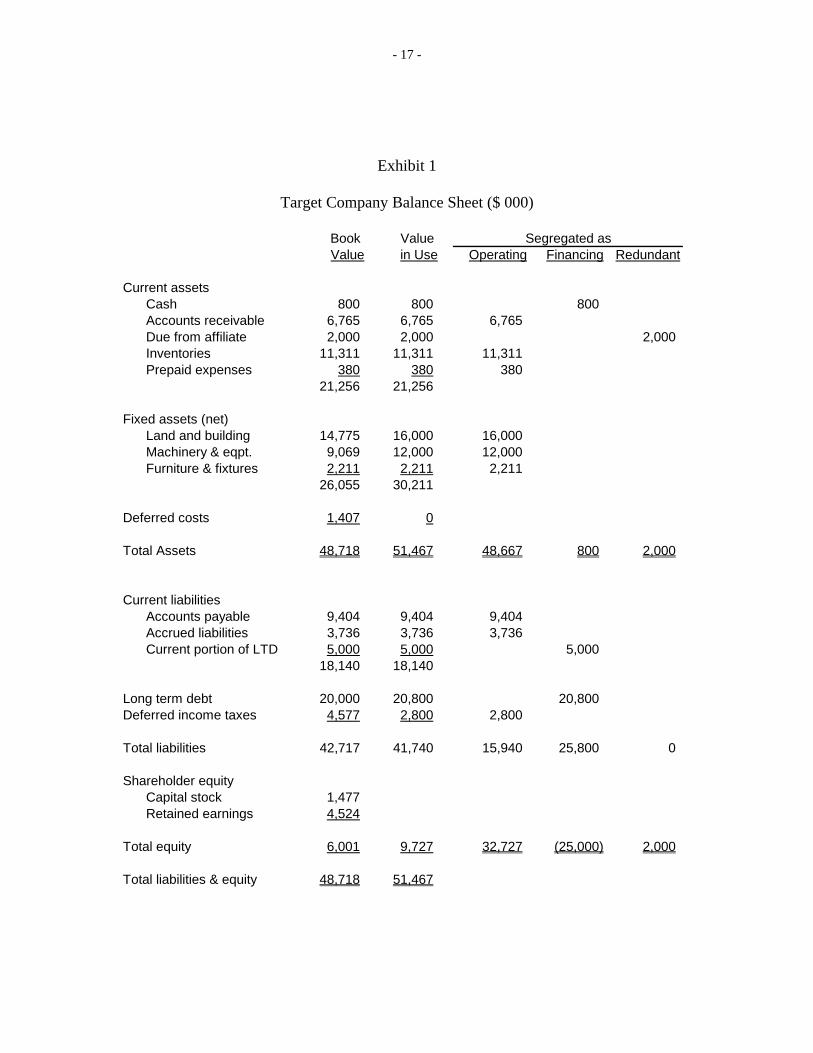
Following the example presented earlier in this paper, assume that prospective
discretionary cash flows from an acquisition are expected to be $10 million per annum,
and that a 12% capitalization rate is considered appropriate. This derives capitalized cash
flows (or ‘enterprise value’ before consideration of redundant assets) of $83 million.
Further assume that the target company has a recent balance sheet as presented in Exhibit
1. A restatement of the balance sheet to market values, and a segregation of those values
into the categories of operating, redundant, and financing, may reveal that the buyer
would be paying approximately $33 million in tangible net assets and therefore,
approximately $50 million of goodwill.
If we assume that the buyer requires a return of 9% on tangible net assets acquired, then
the implicit rate of return on the goodwill component would be 14%, determined as:
Annual discretionary cash flow $10 million
Less: return on net tangible assets ($33 MM @ 9%) $3 million
Discretionary cash flow attributable to goodwill $7 million
Implied return on goodwill ($7 MM / $50MM) 14%
If the buyer believes that the implied rate of return on the goodwill component is
insufficient, given the nature of the target company, the industry in which it competes,
the ‘strategic importance’ of the acquisition, and so on, it should adjust its overall
capitalization rate of 12% upward as appropriate.
- 17 -
Exhibit 1
Target Company Balance Sheet ($ 000)
Book Value Value in Use Operating Financing Redundant