16
Financial Statement Basics Brian (Yoohyun) Kim Product Marketing manager at CDNetworks April, 2015
| Date post: | 06-Aug-2015 |
| Category: |
Marketing |
| Upload: | brian-yoohyun-kim |
| View: | 270 times |
| Download: | 0 times |

Financial Statement Basics
Brian (Yoohyun) KimProduct Marketing manager at CDNetworksApril, 2015

Contents • Basic Financial Statements
• Profit and Loss analysis
• Price Strategy

Basic Financial Statements
Finance and Account
Pur-pose of ac-count
Profit and Loss
Bal-ance Sheet
Break even

Key Terms
Profit = Total Revenue – Total Cost
• Total Revenue = Price * Quantity (Billing traffic) Sales Revenue = Price X Quantity Sold
Note1) Total Revenue – also known as sales revenue or ‘Sales’ = Price X Quantity Sold2) Price – may be a variety of different prices for different products in the portfolio3) Quantity – could be global sales (total amount to be sold)
Key Terms
Break Even
Purpose of Account
Profit and Loss
Balance Sheet
• Total Cost (COR) = Direct Costs + Indirect Cost Average cost = Total Cost / Output Quantity (Usage traffic)
Note1) Direct (Variable) Cost – vary directly with the amount produced, e.g., bandwidth cost, colocation cost, depreciation cost2) Indirect (Fixed) Cost – are not influenced by the amount produced but can change in the long run, e.g. some types of labor cost for
system/network set-up and operation, e.g. IDC establishment cost (in case of LLNW)
*COR means Cost of Revenue, AKA, COGS (Cost Of Goods Sold)

Break Even Point
Occurs where Total Costs = Total Revenue
• Revenue stream depends on price charged Low Price – need to sell more to break-even High Price – lower level of sales required before breaking even
Loss
Profit
Key Terms
Break Even
Purpose of Account
Profit and Loss
Balance Sheet
Purpose of Account
Purpose of Accounts
• Provides information for stakeholders – Shareholders, customers, suppliers, etc.
• Provides the opportunity for the business to monitor its own activities
• Provides transparency to enable the firm to attract investment
Key Terms
Break Even
Purpose of Account
Profit and Loss
Balance Sheet

Profit and Loss - Flow
• Shows the flow of sales and costs over a period
• Shows the level of profit or loss made
• Shows what has been done with the profit or loss
Income Statement (PnL)
Key Terms
Break Even
Purpose of Account
Profit and Loss
Balance Sheet

Balance Sheet - Snapshot
• A snapshot of the firm’s position at a point in time
• Shows what a company owns (assets) and what it owes (liabilities)
• Shows what assets a company has (use of funds) and where the money came from (source of funds)
Balance Sheet (B/S)
Key Terms
Break Even
Purpose of Account
Profit and Loss
Balance Sheet

Elements of the Profit and Loss statement
Let’s just think of what a company does …
Very roughly, from a financial point of view, there are only two things: Money IN and Money OUT. Or, in more proper terms, we have ‘Income’ and ‘Expenses’
• Income: Money In Sales (a retail or manufacturing)
Services (a doctor or consulting)
Interest (an investment firm)
Commissions (FX dealer or broker)
• Expenses: Money Out Cost of Sales
Wages
Interest (on loans)
Rent (for office and store space)
$ OUT$ IN

Gross Profit
Key analytical tool in analyzing firm’s operating performance (if this is negative, watch out!)
The Gross Profit is basically the difference between the income from sales revenue minus the actual cost associated with generating that income.
Gross Profit = Sales Revenue – Cost of Sales
Be careful though! Gross Profit (as is the case with quite a few accounting terms) can be defined in many ways.
% of Gross Profit = Gross Profit/Revenue X 100%Example1) % of Gross Profit = $55,000 / $100,000 * 100% = 55%

Operating Profit – Operating Income
Measures overall performance of company’s operations
Operating expenses = Selling expenses + General and Administrative expenses
% of Operating Profit = Operating Profit/Revenue X 100%
Operating Income = Gross Profit – Operating Expenses
• Selling expenses Advertising expenses
Salesmen’s salaries
• G&A expenses Office and officer salaries
Depreciation expense
Insurance/lease expense
Research and Development

An Example in Excel

Marketing mix – 4Ps
The marketing mix is the combination of variables that a business uses to carry out its marketing strategy and meet customer needs.
The marketing mix is often called the 4Ps:
Price
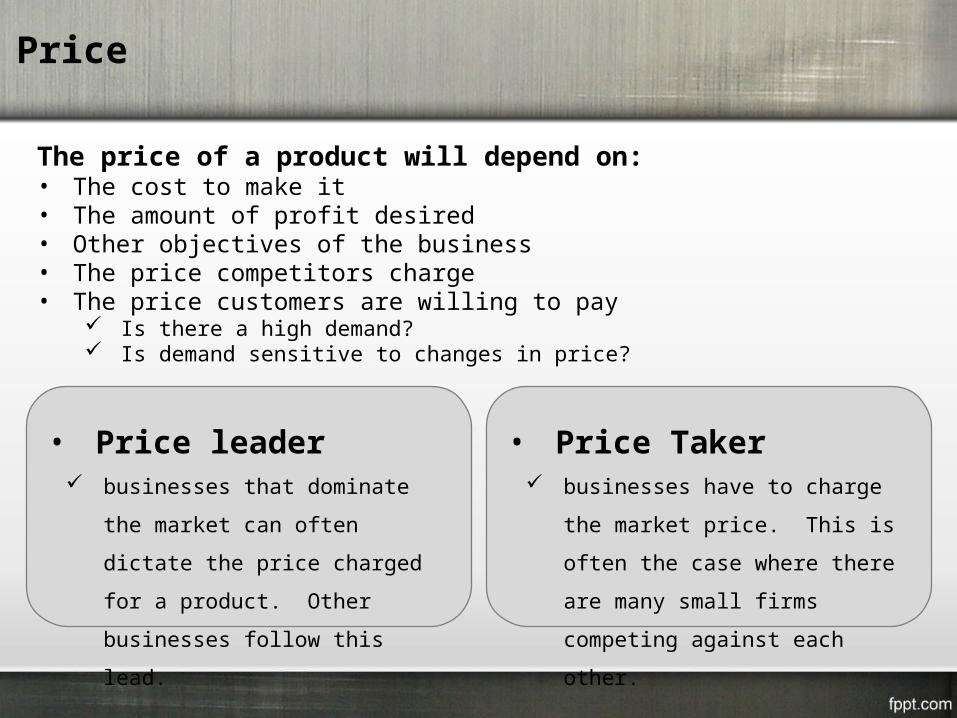
The price of a product will depend on:• The cost to make it• The amount of profit desired• Other objectives of the business• The price competitors charge• The price customers are willing to pay
Is there a high demand? Is demand sensitive to changes in price?
• Price leader businesses that dominate the market
can often dictate the price charged for a
product. Other businesses follow this
lead.
• Price Taker businesses have to charge the market
price. This is often the case where
there are many small firms competing
against each other.

Pricing strategies & tactics
It depends on various variables in real world! Below is just an example from the textbook!
Skimming Launching with a high price when there is little competition, then reducing the price later. Often used with technology.
Penetration Low price charged initially to penetrate the market and build brand loyalty; price is then increased e.g. introductory offers on magazines.
Competitive A similar price is charged to that of competitors’ products.
Loss leader Products may be sold at a price lower than the cost to produce it. Often used by supermarkets to encourage people into the store where it is hoped they will buy other products.
Psychological A price is set which customers perceive as lower than it is e.g. £39.99 instead of £40.

Thank you
Brian (Yoohyun) KimProduct Marketing Manager| CDNetworks
[email protected] http://yoohyunkim.blogspot.com


