23
1 FINANCIAL STATEMENT DISCUSSION AND ANALYSIS For the Year Ended March 31, 2016

1
FINANCIAL STATEMENT DISCUSSION AND ANALYSIS
For the Year Ended March 31, 2016

2

3
Contents INTRODUCTION ................................................................................................................................................ 4
HIGHLIGHTS ..................................................................................................................................................... 6
Consolidated Statement of Financial Position ............................................................................................. 6
Consolidated Statement of Operations and Departmental Net Financial Position .................................... 6
Consolidated Statement of Cash Flow ......................................................................................................... 7
Parliamentary Authorities ........................................................................................................................... 7
DISCUSSION AND ANALYSIS ............................................................................................................................. 9
Uncertainties ............................................................................................................................................... 9
VARIANCE AND TREND ANALYSIS .................................................................................................................. 12
Financial Assets .......................................................................................................................................... 12
Liabilities .................................................................................................................................................... 13
Non-Financial Assets .................................................................................................................................. 16
Expenses .................................................................................................................................................... 19
Revenues ................................................................................................................................................... 22

4
INTRODUCTION The following Financial Statement Discussion and Analysis (FSD&A) should be read in conjunction with the audited consolidated financial statements and accompanying notes for the National Research Council of Canada (NRC) for the fiscal year ended March 31, 2016. The responsibility for the preparation of the FSD&A rests with the management of NRC. It has been prepared in accordance with the Public Sector Statement of Recommended Practice SORP-1. The purpose of the FSD&A is to highlight information and provide explanations which enhance the users’ understanding of NRC’s financial position, results of operations, changes in its net financial assets and its cash flows, while demonstrating NRC’s accountability for its resources. Additional information on NRC’s performance is available in the NRC Departmental Performance Report (DPR), and information on its plans and priorities is available in the NRC Report on Plans and Priorities (RPP). All financial information presented herein is denominated in Canadian dollars, unless otherwise indicated.
Special note regarding forward-looking statements The words “estimate”, “will”, “intend”, “should”, and similar expressions are intended to identify forward-looking statements. These statements reflect assumptions and expectations of NRC, based on its experience and perceptions of trends and current conditions. Although NRC believes the expectations reflected in such forward-looking statements are reasonable, they may prove to be inaccurate, and consequently NRC’s actual results could differ materially from expectations. In particular, the risk factors described in the “Risks and Uncertainties” section of this report could cause actual results or events to differ materially from those contemplated in forward-looking statements. Overview The National Research Council (NRC) was established by the National Research Council Act. The mission of the NRC is to work with clients and partners to provide innovation support, strategic research, scientific and technical services to develop and deploy solutions to meet Canada's current and future industrial and societal needs. NRC’s budget is allocated through authorities approved by Parliament, and some of NRC’s operations are funded through revenue generated from external parties. NRC has separate voted authorities for operating expenditures, capital expenditures and grants and contributions. In addition, NRC has statutory authority for the spending of revenues (pursuant to paragraph 5(1) (e) of the National Research Council Act), contributions to employee benefit plans, proceeds from the disposal of surplus Crown assets, collection agency fees and loss on foreign exchange. Authorities provided to NRC do not parallel financial reporting according to Canadian public sector accounting standards, since authorities are primarily based on cash accounting principles. Consequently, items recognized in the Consolidated Statement of Operations and Departmental Net Financial Position and the Consolidated Statement of Financial Position are not necessarily the same as those provided through authorities from Parliament. Note 3 of the consolidated financial statements provides reconciliation between the two bases of reporting.

5
Reporting Entity The consolidated financial statements include a portion of the accounts of the Canada-France-Hawaii Telescope Corporation (CFHT) and TMT International Observatory LLC (TIO) created for the execution of the Thirty Metre Telescope Project. The NRC has determined that its relationship with both CFHT and with TIO constitutes a government partnership for accounting purposes and the results are proportionately consolidated in the financial statements. Further details are described in Note 2b) of NRC’s consolidated financial statements.

6
HIGHLIGHTS
Consolidated Statement of Financial Position NRC’s financial position, as shown by the Departmental net financial position line in the Consolidated Statement of Financial Position, increased to $628.3 million as at March 31, 2016, from $600.2 million in 2015. NRC’s total liabilities as of March 31, 2016 were $275 million, a decrease of $16 million from 2015. Net financial assets totalled $348.4 million, a decrease of $11 million from 2015. NRC had departmental net financial assets of $73.2 million, an increase of $4.6 million from the previous year. Departmental net financial assets represent NRC’s total net financial assets less its total liabilities. It is a measure of future income required to pay for past transactions and events. Detailed explanation and analysis of liability and asset balances can be found in the Variance and Trend Analysis section.
Consolidated Statement of Operations and Departmental Net Financial Position NRC’s 2015-16 net cost from continuing operations, before government funding and transfers, was $792.6 million compared to $819.1 million in 2014-15. Total revenue of $185.6 million represents an increase from the $146.7 million earned in 2015-16 while expenses increased by $12.3 million to $978.2 million. Grants and contribution expense increased by $29 million to $292.8 million in 2015-16 from $263.8 million in 2014-15. Operating expenses decreased by $8 million from $270 million in 2014-15 to $262 million in 2015-16, while personnel expenses decreased by $9 million from $432 million in 2014-15 to $423 million. NRC’s $28.1 million net revenue of operations after government funding and transfers ($25.7 million in 2014-15) resulted in the Departmental net financial position to increase from $600.2 million to $628.3 million. The following illustrates NRC’s total expenses by major category over the past two fiscal years:
For further detail and analysis of revenues and expenses, refer to the section Variance and Trend Analysis below.

7
Consolidated Statement of Cash Flow The net cash provided by the Government of Canada in 2015-16 was $805 million ($762.6 million in 2014-15). Cash used in operating activities increased by $10.2 million and cash used in capital investing activities increased by $26.5 million.
Parliamentary Authorities Parliamentary authorities are primarily based on cash accounting principles. They are shown in Note 3 of the NRC consolidated financial statements. The following illustrates NRC’s voted parliamentary authorities over the past three fiscal years, including the Main Estimates, the Supplementary Estimates, Transfers, Adjustments and Warrants. The “Use of Funds by Source” figures also include the statutory expenditures.
a) Total Voted Parliamentary Authorities: NRC is provided with Parliamentary Authorities in three Votes: Vote 1 – Operating expenditures, Vote 5 – Capital expenditures, and Vote 10 – Grants and contributions.
b) Total Authorities Used: The total authorities used during the year (and shown in Note 3 of NRC’s Consolidated Financial Statements). These include voted authorities and statutory authorities.
c) Total Funds Spent: All authorities, as well as NRC spending of funds from Other Government Departments. In 2015-16, total voted parliamentary authorities decreased by $2.8 million. This decrease is composed of a $27.2 million increase in capital expenditure funding, and a $37.7 million increase in grants and contributions authorities, offset by a $67.7 million decrease in operating expenditure funding.

8
NRC’s actual use of funds applied to voted parliamentary authorities totalled $740 million. In addition, NRC had $150.9 million of revenue funded expenditures and spent $54.2 million under other statutory authorities (mainly contributions to employee benefit plans).
9
DISCUSSION AND ANALYSIS Uncertainties NRC funds the majority of its salary, operating and capital expenditures from parliamentary authorities. The non-salary portion of this funding is fixed with no indexing for price increases and inflation. NRC owns and manages 180 specialized buildings and facilities across Canada that comprise approximately 555,000 square meters of space. It also has equipment and informatics base (excluding CFHT and TIO assets) of $585.7 million in cost, with $132 million in net book value ($578.8 million in cost, with $134.7 million in net book value in 2014-15). The underlying IT infrastructure, although on NRC premises, is owned by Shared Services Canada and is therefore not accounted for by NRC. NRC’s capacity to fund the upgrade or replacement of these assets from its parliamentary authorities is limited. However, through its 5 year investment plan, NRC is investing funds to maintain its buildings and laboratories at current conditions. Sunsetting Funding: For certain new initiatives, it is the practice of the government to provide funding on a sunsetting basis. Rather than providing a permanent increase to parliamentary authorities, the government may allocate funding for specified purposes for a limited period of time with a renewal option. Renewal is conditional on various factors including performance, achieving desired objectives, linkages to priorities, and availability of funds. Although NRC funding is not necessarily provided on an ongoing basis, new government-approved initiatives often entail ongoing commitments from NRC such as maintenance of new facilities and new staff salaries. There may be stakeholders that support these new initiatives, and in some cases invest in them, with expectations that the initiative will exist beyond the original funding window. These challenges add complexity to planning, budgeting and operations. Currently, NRC has numerous initiatives and projects funded on a sunsetting basis, examples of which include the following: Budget 2016 IRAP: The budget allotted $50M for Industrial Research Assistance Program (IRAP) in 2016-17 to
increase the number of companies served by the Program’s highly qualified Industrial Technology Advisors nationwide.
Federal Infrastructure: $18.5M in 2016-17 for the Federal Infrastructure Initiative (serving 7 different initiatives
Budget 2015 Thirty Meter Telescope: Economic Action Plan 2015 proposes to provide resources totalling $243.5
million over 10 years, starting in 2014-15, to enable Canadian access to and participation in the construction of the Thirty Meter Telescope. NRC will administer $218 million of the resources, starting in 2015-16, of which $22.6 million will be taken from its existing reference levels.

10
TRIUMF: NRC has an existing annual reference level of $34 million in funding for TRIUMF, Canada’s
National Laboratory for Particle and Nuclear Physics. Since 1976, NRC has provided over $1.2 billion in funding to TRIUMF of which a total of $45 million was provided during 2014-15. Economic Action Plan 2015 proposed to provide an additional $45 million over five years, starting in 2015-16. The funding would supplement the $222 million announced in Economic Action Plan 2014 and will increase the overall funding for TRIUMF to $267 million over five years, of which $171 million is sunsetting. In 2015-16, an amount of $50.8 million was provided to TRIUMF.
Refocused National Research Council: Economic Action Plan 2015 proposes to provide NRC with $119.2 million over two years (starting in 2015-16) to support NRC’s continued industry-partnered research and development activities. This funding began as Economic Action Plan 2013 funding of $120.8 million over two years expires.
Budget 2014
Canada Accelerator and Incubator Program (CAIP): CAIP funding, introduced in Economic Action Plan
2013, used to help outstanding and high-potential incubator and accelerator organizations expand their services to entrepreneurs added $58.5 million in funding over five years to NRC’s reference levels. Economic Action Plan 2014 provided an additional $40 million over four years starting in fiscal year 2015-16 to increase the impact of CAIP in helping entrepreneurs realize the business potential of their ideas
Youth Employment Strategy: Economic Action Plan 2014 provided NRC with $30 million over two years starting in fiscal year 2014-15 to support full-time internships in small and medium-sized enterprises undertaking technical research and development projects. This funding has supplemented NRC’s existing annual funding level of $5 million.
Budget 2013 Supporting the Commercialization of Research by Small and Medium-Sized Enterprises: Economic
Action Plan 2013 announced $20 million over three years to help small and medium-sized enterprises (SMEs) access research and business development services at universities, colleges and other non-profit research institutions through the Business Innovation Access Program (BIAP). NRC-IRAP received $10 million in 2014-2015, and received $9.8 million in 2015-2016, the final year of funding.
Other Genomics R&D Initiatives: The Genomics R&D Initiatives (GRDI) is a federal program that coordinates
genomics R&D in 6 federal departments and agencies. GRDI supports public policy objectives and key national interest in human health, agriculture and food safety, environment and natural resources management. NRC received funding of $8.4 million in 2014-15, and will receive $8.4 million each year for the next 4 years for total funding of $42.1 million.
Foreign Currency: In its normal course of operation, NRC makes some of its purchases in foreign currencies which expose it to foreign exchange risk. NRC purchased C$61.2 million worth of goods and services in foreign currencies in 2014-15 (C$47.8 million in 2014-15); $55.5 million (91%) of the foreign currency purchases were in US

11
dollars ($43.9 million or 92% in 2014-15). During 2015-16, it cost NRC an average of $1.33 Canadian dollars to purchase $1 US ($1.15 in 2014-15). In addition, NRC had C$39.1 million worth of foreign currency receipts in 2015-16 of which $37.2 million (95%) was received in US currency compared to $24.7 million received in foreign currency in 2014-15 of which $23.7 million (96%) was in US currency. Revenue: NRC activities generate revenues which can be reinvested in its operations. In 2015-16, 22.9% of NRC’s salary, operating and capital expenditures were funded by revenue from external sources (20% in 2014-15). NRC is focused on increasing its business with external clients; the additional revenue from these activities will strengthen its future financial sustainability. However, significant unexpected downturns affecting industries or government partners of NRC could impact its ability to fund some type of operations.

12
VARIANCE AND TREND ANALYSIS The following analysis describes the main items appearing on the consolidated financial statements and provides analysis of significant variances and financial trends.
Financial Assets Due from the Consolidated Revenue Fund (CRF): This account represents the amount of cash that NRC is entitled to withdraw from the federal government treasury. This includes cash to discharge liabilities for which NRC has already received parliamentary authorities as well as revenue received but not spent. NRC’s due from the CRF was $282.5 million as at March 31, 2016 and $315.9 million as at March 31, 2015. This $33.4 million net decrease is primarily due to a $11 million decrease in accounts payable to external parties, a $3 million increase total expenses in the cash component of salaries payable, a decrease of $10.4 million in accounts payable and increase of $17 million in accounts receivable from/to other government departments and agencies offset by a $2 million increase in revenues and available for use in future years.
Accounts Receivable: Accounts receivable and advances, as detailed in Note 4 of the financial statements, totalled $51.2 million as at March 31, 2016, a $14.5 million increase from March 31, 2015. This includes accounts receivable with external parties worth $30 million ($32.9 million as at March 31, 2015). The corresponding allowance for doubtful accounts was $570 thousand as at March 31, 2016 (unchanged from March 31, 2014), a favourable amount considering the total value of NRC’s external revenues. Another $21.3 million ($4.4 million as at March 31, 2015) of the accounts receivable balance relates to other government departments and agencies, and the significant increase in 2015-16 is related to GST Receivable from CRA of $17 million. Aged Accounts Receivable: The graph below presents the aged accounts receivable from external parties, other government departments, and employee advances. In 2015-16, 96% (94% in 2014-15) of accounts receivable were aged 90 days or below indicating that receivables are collected in a timely manner.
Cash and Investments: In addition to the Equity Investments held by NRC, this line item includes the consolidated balance of cash and investments held by CFHT and held by TIO as detailed in Note 5 of the consolidated financial statements. CFHT Investments include time certificates of deposit and U.S. government securities; TIO
13
Cash & Cash Equivalents include cash on deposit, temporary investments, and highly liquid financial instruments with original maturities of three months or less. As part of its mandate to promote industrial innovation in Canada, NRC provides financial assistance to firms through access to equipment, intellectual property and incubation space in its laboratories and Industrial Partnership Facilities. NRC has on occasion taken an equity position in a company in return for assistance provided or in exchange for outstanding debts to NRC. NRC divests of equity investments by taking into account the interests and market liquidity of the company involved.
The full value of equity investments recorded in the Consolidated Statement of Financial Position reflects NRC’s investment in publicly traded companies as its shares in privately held corporations are deemed to have no market value. There were no changes in NRC’s equity investments which totals $3 in 2015-16.
The following table provides an overview of NRC’s 2015-16 equity holdings:
NRC does not intend to hold publicly held securities for the long term.
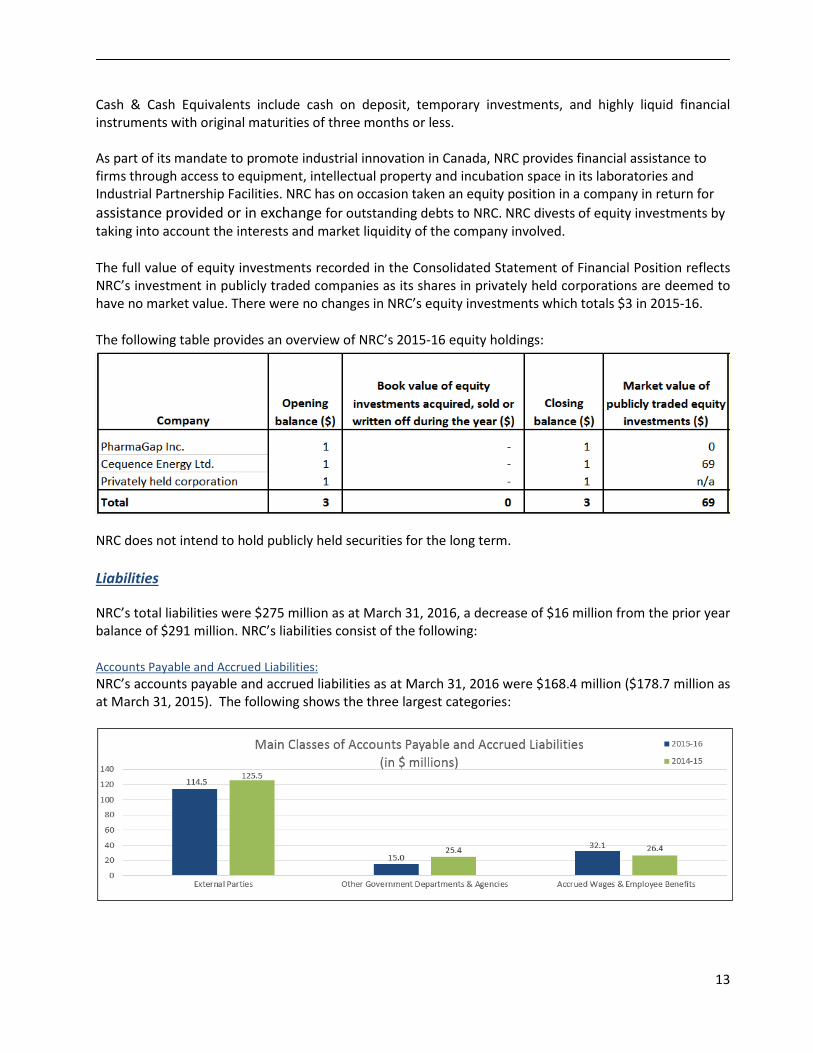
Liabilities NRC’s total liabilities were $275 million as at March 31, 2016, a decrease of $16 million from the prior year balance of $291 million. NRC’s liabilities consist of the following: Accounts Payable and Accrued Liabilities: NRC’s accounts payable and accrued liabilities as at March 31, 2016 were $168.4 million ($178.7 million as at March 31, 2015). The following shows the three largest categories:

14
There was an $11 million decrease in accounts payable to external parties, an increase of $10.4 million to OGDs, and a $5.7 million increase in accrued wages and EBP. Also included within Accounts Payable and Accrued Liabilities (totalling $6.8 million in 2015-16, an increase of $5.5 million from 2014-15 due to increased contractor holdbacks and TIO) are contractor holdbacks, remediation liabilities, sales tax payable, CFHT accounts payable, and TIO accounts payable as detailed in note 6 of the consolidated financial statements. Vacation Pay and Compensatory Leave: Vacation pay and compensatory leave liabilities have decreased in each of the past five fiscal years to represent $27.9 million at March 31, 2016, which is a $1 million decrease from 2014-15 ($28.9M). In comparison to previous years, the decrease is a result of additional restrictions imposed on carry-over criteria in recent collective bargaining agreements and management oversight activities taken to manage outstanding vacation liabilities.
Lease Inducements: Lease inducements totalled $35.3 million as at March 31, 2016. This balance relates to tangible capital assets provided to NRC under three lease agreements with monetary consideration below fair market value. These leases of facilities were established at nominal cost with the University of Western Ontario, the University of Alberta, and the University of Prince Edward Island, to accommodate NRC research facilities. These lease inducement liabilities have corresponding tangible capital assets and were originally recorded at the fair market value of the capital lease. Over the lease period, NRC recognizes equal amounts of amortization and lease inducement revenue. As a result, there is no impact to NRC’s net cost of operations or its net financial position. The balance decrease of $2.5 million in the current year is accounted for as revenue recognized during the period. Deferred Revenue: Deferred revenue represents funds received for which NRC has an obligation to other parties for the provision of goods, services or the use of assets in the future. The March 31, 2016 balance of $9 million ($9.1 million in 2015) is explained in Note 7 of the consolidated financial statements. The significant components include:

15
• $7.2 million of deferred revenue from research services and technical services projects. These are the two largest categories of revenue at NRC. When funds are received prior to work commencing or when the amount of funds received exceeds the value of the work performed as of March 31, 2016, deferred revenue is recorded. Revenue is then recognized as services are provided.
• $1.4 million of deferred revenue left from the $1.8 million received to construct a facility for the
Hitachi Electron Microscopy Product Centre (HEMIC) as part of a collaboration agreement. This amount was deferred and the revenue is recognized over the life of the collaboration.
Employee Future Benefits: Employee future benefits represent the liability for severance benefits payable to employees upon termination of employment with the public service. This allowance is established at year end by applying an actuarial rate to total annual salary cost of NRC’s indeterminate employees. This rate is determined by Treasury Board based on the liability for the government as a whole. A change to the employment conditions for employees within the AD, AS, CS, IS, LS, OP, PG, RO, RCO category has resulted in the cessation of the accumulation of their severance benefits beginning in 2014-15. Some of these employees have elected to have the balance of their accumulated benefits either partially or fully paid out, reducing NRC’s total liability. A total of $4.5 million was paid out in 2015-16 ($28.6 million in 2014-15). The liability decreased by $1.9 million from $36.4 million in 2014-15 to $34.5 million in 2015-16. Note 8b) of the consolidated financial statements provides additional details.
16
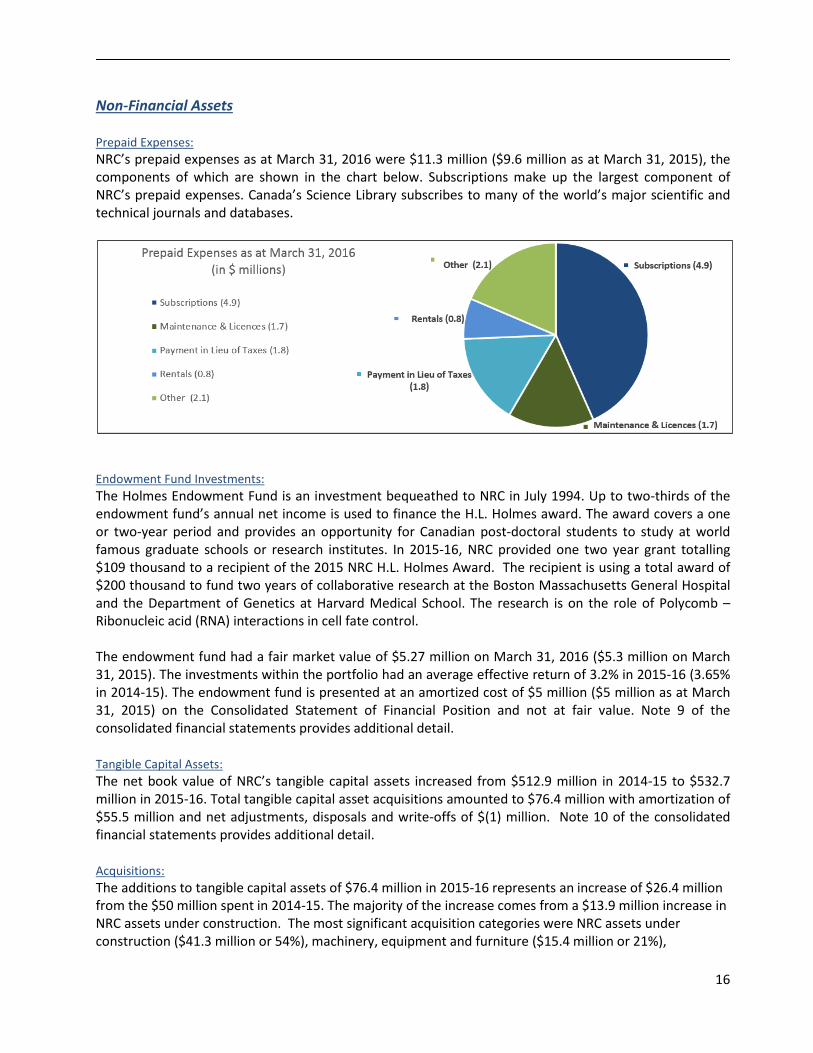
Non-Financial Assets Prepaid Expenses: NRC’s prepaid expenses as at March 31, 2016 were $11.3 million ($9.6 million as at March 31, 2015), the components of which are shown in the chart below. Subscriptions make up the largest component of NRC’s prepaid expenses. Canada’s Science Library subscribes to many of the world’s major scientific and technical journals and databases.
Endowment Fund Investments: The Holmes Endowment Fund is an investment bequeathed to NRC in July 1994. Up to two-thirds of the endowment fund’s annual net income is used to finance the H.L. Holmes award. The award covers a one or two-year period and provides an opportunity for Canadian post-doctoral students to study at world famous graduate schools or research institutes. In 2015-16, NRC provided one two year grant totalling $109 thousand to a recipient of the 2015 NRC H.L. Holmes Award. The recipient is using a total award of $200 thousand to fund two years of collaborative research at the Boston Massachusetts General Hospital and the Department of Genetics at Harvard Medical School. The research is on the role of Polycomb – Ribonucleic acid (RNA) interactions in cell fate control. The endowment fund had a fair market value of $5.27 million on March 31, 2016 ($5.3 million on March 31, 2015). The investments within the portfolio had an average effective return of 3.2% in 2015-16 (3.65% in 2014-15). The endowment fund is presented at an amortized cost of $5 million ($5 million as at March 31, 2015) on the Consolidated Statement of Financial Position and not at fair value. Note 9 of the consolidated financial statements provides additional detail. Tangible Capital Assets: The net book value of NRC’s tangible capital assets increased from $512.9 million in 2014-15 to $532.7 million in 2015-16. Total tangible capital asset acquisitions amounted to $76.4 million with amortization of $55.5 million and net adjustments, disposals and write-offs of $(1) million. Note 10 of the consolidated financial statements provides additional detail. Acquisitions: The additions to tangible capital assets of $76.4 million in 2015-16 represents an increase of $26.4 million from the $50 million spent in 2014-15. The majority of the increase comes from a $13.9 million increase in NRC assets under construction. The most significant acquisition categories were NRC assets under construction ($41.3 million or 54%), machinery, equipment and furniture ($15.4 million or 21%),

17
investments in building and facilities ($9.5 million or 13%), and TIO assets under construction ($7.6 million or 10%). The major categories are shown in the chart below.
The following represents significant tangible capital assets expenditures over $750,000 in 2015-16:
NRC’s Aerospace Portfolio invested $1.1 million to purpose design a Cabin Comfort and Environment Research (CCER) Facility to respond to industry needs of the NRC’s existing clients in the fields of lighting, ventilation, noise and vibration control, entertainment systems and seat technologies. This investment will be completed in FY2016-17 and is expected to generate 3.7 million of new revenues in 5 years through the Working and Travelling on Aircraft (WTA) Program.
NRC’s Industrial Biomaterials Flagship Program comprised of NRC’s Aerospace, Construction and Automotive Portfolios invested $1.8 million to acquire world-class equipment required to deliver on planned outputs of the Industrial Biomaterials Flagship Program. This new equipment will enable Flagship projects and deliver value to Flagship industrial clients and revenues to Flagship projects.
NRC’s Ocean, Coastal and River Engineering Portfolio invested $1.6 million for the renewal of a large test basin area, the implementation of a new segmented wave generator, and the erection of a segregation wall to separate the basin area from the main office areas of the facility. This facility is used to test and assess scaled models of marine and coastal infrastructure under simulated sea and wave conditions in order to optimize and validate designs prior to construction
NRC’s Ocean, Coastal and River Engineering Portfolio invested $1.6 million to refurbish the refrigeration system in the NRC’s Ice Tank Facility located in St-John’s Newfoundland and Labrador, the current system was 30 years old and in danger of failing which could lead to hazardous leaks. The Marine Vehicles and Arctic Technologies programs are dependent upon this project which is expected to complete in FY2016-17.
NRC’s Information and Communication Technologies’ Portfolio invested $0.9 million towards the procurement of the sheet-fed multi-station printing system to enable the rapid photocopying capability and small-scale production for printed electronic circuits for the benefit of the printable electronics’ clients and consortium members. The final acceptance of this investment will be completed in 2016-17 and is expected to significantly increase the NRC’s Printable Electronics Flagship Program’s revenues.
NRC’s Measurement Science & Standard’s portfolio invested $2.0 million to replace aging mass spectrometers used in the production of Certified Reference Materials (CRM). This investment in state of the art instrumentation will ensure the existing revenue stream of $0.5 million a year for the
18
Metrology for Industry and Society program as well as enable development of novel measurement concepts and CRMs which in turn will result in new services and increased revenue.
$1.4 million of electrical work to re-distribute power from an existing NRC-owned transformer as well as the transfer of feeders from existing Hydro One Networks Inc. (HONI) owned transformers to new HONI transformers. A different strategy was employed in the design of phase one, thereby eliminating the need to replace the motor on the 5MW compressor. A dual-winding transformer was included, providing a new power source for the motor at the existing 6.9kv platform. Phase III of this investment will be included in the scope of phase II following this change redesign and the project is expected to be completed in FY2017-18. The total project cost has also been reduced by $2.7 million. This investment is required due to the fact that equipment has exceeded its life expectancy.
$15.6 million of building recapitalization work was completed in 2015-16 including: electrical system upgrades ($2.1 million), roofing ($2.8 million), mechanical system upgrades ($4.3 million), site work ($1.7 million), interior architectural work ($2.0 million), elevator upgrades ($0.9 million), and exterior building upgrades ($1.8 million). $22.0 million of this $77.6 million project is funded by the Treasury Board Federal Infrastructure Project.
NRC invested $1.0 million in the refurbishment of the 100 Sussex Drive building. The project consists of extensive repairs to the existing façade, replacement of exterior windows and upgrades to interior finishes while preserving the federal heritage status of the building. $5.1 million of this $5.2 million project is funded by the Treasury Board Federal Infrastructure Project.
$3.0 million invested in the Building Energy Retrofit project, which falls under the category of the energy management program called the Federal Building Initiative (FBI) managed by the Natural Resources Canada. $10.2 million of this $10.4 million project is funded by the Treasury Board Federal Infrastructure Project. Phase I is to implement an energy retrofit for buildings M4, M54 and M55 that will reduce utility costs while at the same time address some of the required upgrades to the building infrastructure, such as the heating, air conditioning, lighting, plumbing and control systems. Phase II will implement energy retrofit measures in additional buildings across Canada on a task authorized requests approach.
$1.6 million invested in the Accommodations plan for common services project to improve space efficiency in areas of M20 & M55 and as an initial step to future disposal of buildings. Project is fully funded by the Treasury Board Federal Infrastructure Project. Phase I is to implement an energy retrofit for buildings M4, M54 and M55 that will reduce utility costs while at the same time address some of the required upgrades to the building infrastructure, such as the heating, air conditioning, lighting, plumbing and control systems. Phase II will implement energy retrofit measures in additional buildings across Canada on a task authorized requests approach.

19
Expenses Expenses are shown in the Consolidated Statement of Operations and Departmental Net Financial Position by Program Alignment Architecture (PAA) categories. They are also detailed by type of expense in Note 17 of the consolidated financial statements. NRC’s expenses increased from $965.9 million in 2014-15 to $978.2 million in 2015-16. The two largest categories of expenses are Salaries and Employee Benefits (43.2% of total expenses in 2015-16, 44.7% of total expenses in 2014-15), and Grants and Contributions (29.9% of total expenses in 2015-16 27.3% of total expenses in 2014-15). The following illustrates expenses by type:
Total expenses of $978.2 million were $37.6 million higher than the amount forecast in NRC’s Future Oriented Financial Statements reported in the 2015-16 Report on Plans and Priorities (RPP), and shown as Planned Results on the Consolidated Statement of Operations and Departmental Net Financial Position. A contributing factor to this increase is an additional $29 million in Grants and Contributions, and the addition of TIO expenses of $4.6 million in 2015-16 ($0 in 2014-15). The major categories are explained below: Salaries and Employee Benefits: Salaries and employee benefits include such costs as gross salaries and wages, overtime pay, retroactive salary adjustments, employee entitlements and allowances, severance pay, pension, and health and dental plan costs. Total NRC salaries and employee benefits have decreased by $9 million, from $432 million in 2014-15 to $423 million in 2015-16. The decrease is primarily due to a $13.8 million decrease in severance benefits expense from 2014-15 million due to a change in the actuarial assumptions used to calculate the liability such as an updated population and decrease in discount rate. This is slightly offset by the general economic increase in salary rates increased the salaries and employee benefits expense.
20
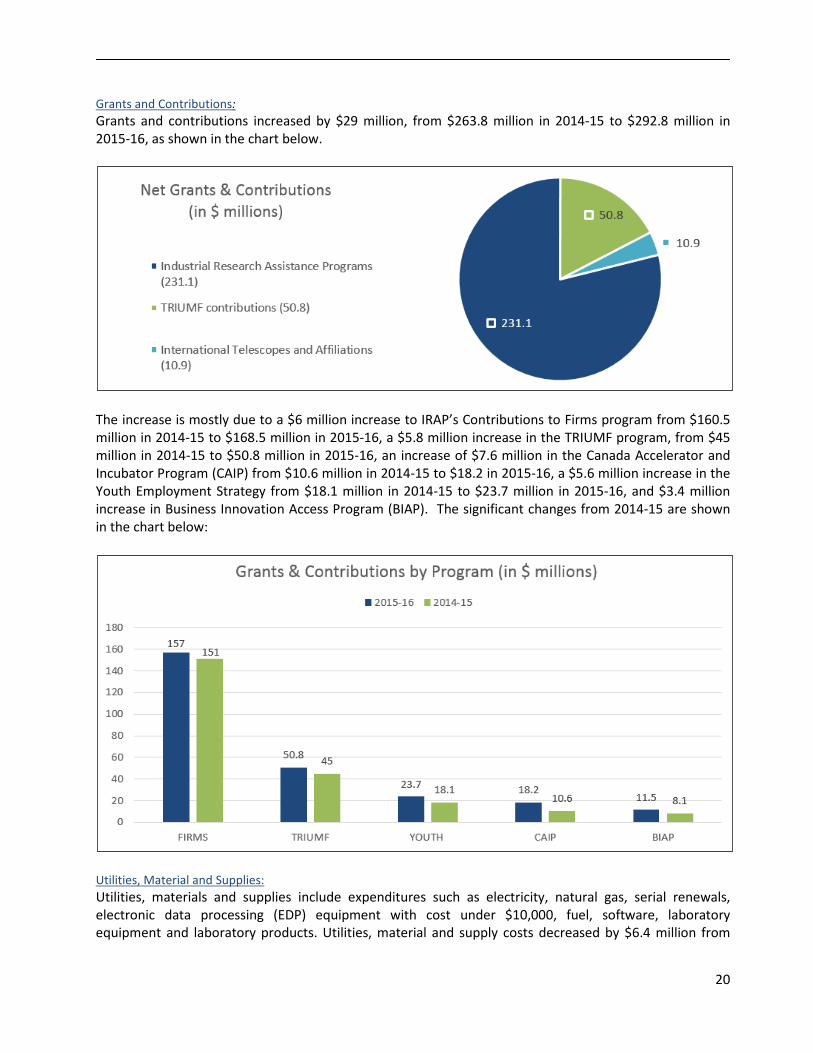
Grants and Contributions: Grants and contributions increased by $29 million, from $263.8 million in 2014-15 to $292.8 million in 2015-16, as shown in the chart below.
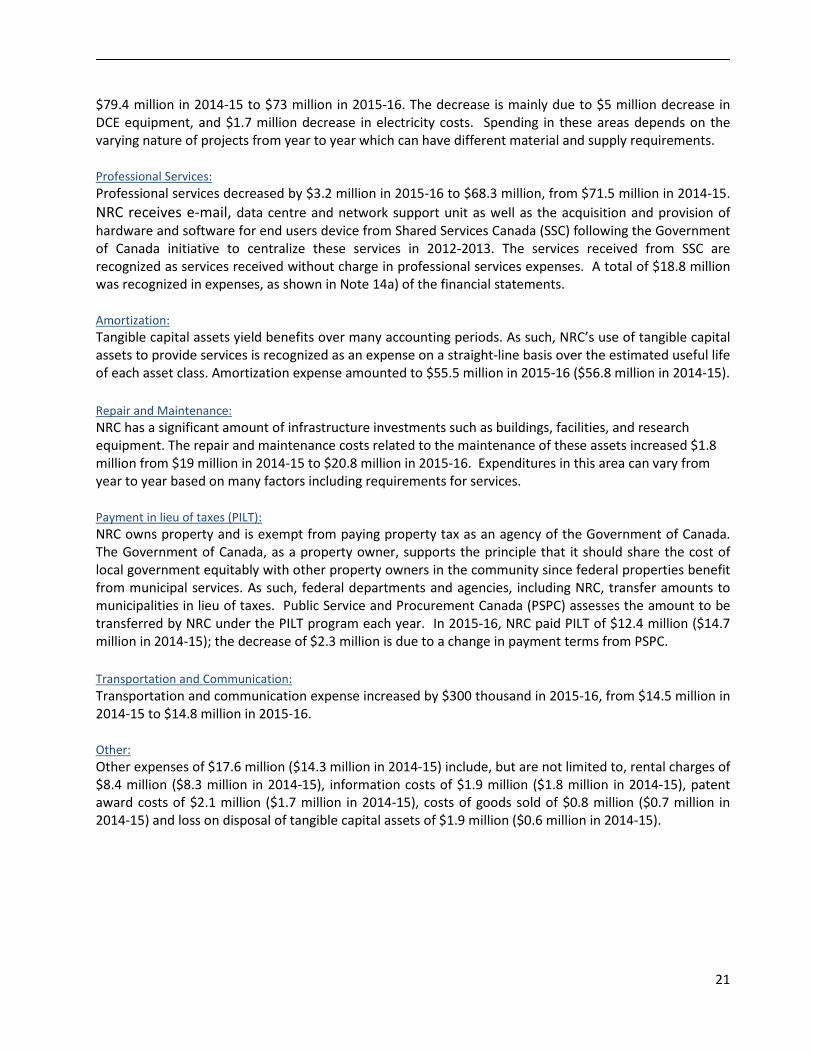
The increase is mostly due to a $6 million increase to IRAP’s Contributions to Firms program from $160.5 million in 2014-15 to $168.5 million in 2015-16, a $5.8 million increase in the TRIUMF program, from $45 million in 2014-15 to $50.8 million in 2015-16, an increase of $7.6 million in the Canada Accelerator and Incubator Program (CAIP) from $10.6 million in 2014-15 to $18.2 in 2015-16, a $5.6 million increase in the Youth Employment Strategy from $18.1 million in 2014-15 to $23.7 million in 2015-16, and $3.4 million increase in Business Innovation Access Program (BIAP). The significant changes from 2014-15 are shown in the chart below:
Utilities, Material and Supplies: Utilities, materials and supplies include expenditures such as electricity, natural gas, serial renewals, electronic data processing (EDP) equipment with cost under $10,000, fuel, software, laboratory equipment and laboratory products. Utilities, material and supply costs decreased by $6.4 million from
21
$79.4 million in 2014-15 to $73 million in 2015-16. The decrease is mainly due to $5 million decrease in DCE equipment, and $1.7 million decrease in electricity costs. Spending in these areas depends on the varying nature of projects from year to year which can have different material and supply requirements. Professional Services: Professional services decreased by $3.2 million in 2015-16 to $68.3 million, from $71.5 million in 2014-15. NRC receives e-mail, data centre and network support unit as well as the acquisition and provision of hardware and software for end users device from Shared Services Canada (SSC) following the Government of Canada initiative to centralize these services in 2012-2013. The services received from SSC are recognized as services received without charge in professional services expenses. A total of $18.8 million was recognized in expenses, as shown in Note 14a) of the financial statements. Amortization: Tangible capital assets yield benefits over many accounting periods. As such, NRC’s use of tangible capital assets to provide services is recognized as an expense on a straight-line basis over the estimated useful life of each asset class. Amortization expense amounted to $55.5 million in 2015-16 ($56.8 million in 2014-15). Repair and Maintenance: NRC has a significant amount of infrastructure investments such as buildings, facilities, and research equipment. The repair and maintenance costs related to the maintenance of these assets increased $1.8 million from $19 million in 2014-15 to $20.8 million in 2015-16. Expenditures in this area can vary from year to year based on many factors including requirements for services. Payment in lieu of taxes (PILT): NRC owns property and is exempt from paying property tax as an agency of the Government of Canada. The Government of Canada, as a property owner, supports the principle that it should share the cost of local government equitably with other property owners in the community since federal properties benefit from municipal services. As such, federal departments and agencies, including NRC, transfer amounts to municipalities in lieu of taxes. Public Service and Procurement Canada (PSPC) assesses the amount to be transferred by NRC under the PILT program each year. In 2015-16, NRC paid PILT of $12.4 million ($14.7 million in 2014-15); the decrease of $2.3 million is due to a change in payment terms from PSPC. Transportation and Communication: Transportation and communication expense increased by $300 thousand in 2015-16, from $14.5 million in 2014-15 to $14.8 million in 2015-16. Other: Other expenses of $17.6 million ($14.3 million in 2014-15) include, but are not limited to, rental charges of $8.4 million ($8.3 million in 2014-15), information costs of $1.9 million ($1.8 million in 2014-15), patent award costs of $2.1 million ($1.7 million in 2014-15), costs of goods sold of $0.8 million ($0.7 million in 2014-15) and loss on disposal of tangible capital assets of $1.9 million ($0.6 million in 2014-15).

22
Revenues NRC’s total revenues increased $38.9 million from $146.7 million in 2014-15 to $185.6 million in 2015-16. The following chart provides a breakdown of the major revenue components:
Revenues of $185.6 million were $7.9 million higher than the amount forecast in NRC’s Future Oriented Financial Statements reported in the 2015-16 RPP. Technical Services: In 2015-16, $88.6 million or 48% ($75 million or 50% in 2014-15) of NRC revenues were generated from technical services. These are standard services delivered using existing NRC technology and expertise with projects that have a low level of technical risks and do not generate new intellectual property. Research Services: In 2015-16, $52.1 million or 28% ($46.2 million or 31% in 2014-15) of NRC revenues were generated from research services, which are non-standard services delivered with incremental intellectual contribution and some level of technical/scientific risks. This includes Collaborative Research Services, where clients can provide intellectual contribution to the project and share the total cost of the project. Intellectual Property Royalties and Fees: In 2015-16, $9.1 million or 5% ($7.5 million or 5% in 2014-15) of NRC revenues were generated from Intellectual Property Royalties and Fees. Royalty revenue is earned from companies that license the rights to use NRC technologies. Royalties are typically based on a percentage of the licensee’s sales. Rentals: Facilitating access to NRC researchers and facilities is an important part of technology transfer at NRC. To this end, NRC provides laboratory space to companies on a commercial basis often as part of a

23
collaboration or technology transfer agreement. Revenue from lease and use of property amounted to $6.5 million in 2015-16, compared to $5.6 million in 2014-15. Sales of Goods and Information Products: As part of its goal to disseminate scientific and technical information of importance to industry, NRC has publications and certified reference materials that it sells to clients. Total sales of goods and information products totalled $6.6 million in 2015-16, as compared to $4.2 million in 2014-15. The largest component of revenue derived from the sale of goods and information products are sales of codes, most significantly National Building Codes by NRC’s Construction Portfolio. Other: Other revenues of $22.7 million ($8.2 million in 2014-15) include, but are not limited to, lease inducement revenue of $2.5 million ($2.5 million in 2014-15) and grants and contributions revenue of $16.6 million ($2.4 million in 2014-15). This increase of Grants and Contributions is due to TIO revenues in 2016 of $14 million. Revenue earned on behalf of government: Treasury Board Accounting Standards require revenues earned on behalf of government be backed out of the Consolidated Statement of Operations and Departmental Net Financial Position. NRC earned $100 thousand of interest revenues on outstanding receivables in 2015-16, as compared to $75 thousand in 2014-15.


