50
Financial Statements 2005

FinancialStatements
2005

To the Shareholders ofFirstCaribbean International Bank Limited
We have audited the accompanying consolidated balance sheet of FirstCaribbean International BankLimited (“the Company”) as of October 31, 2005 and the related consolidated statements of income,changes in shareholders’ equity and cash flows for the year then ended. These consolidated financialstatements are the responsibility of the Company’s management. Our responsibility is to express anopinion on these financial statements based on our audit.
We conducted our audit in accordance with International Standards on Auditing. Those standardsrequire that we plan and perform the audit to obtain reasonable assurance about whether the financialstatements are free of material misstatement. An audit includes examining, on a test basis, evidencesupporting the amounts and disclosures in the financial statements. An audit also includes assessing theaccounting principles used and significant estimates made by management, as well as evaluating theoverall financial statement presentation. We believe that our audit provides a reasonable basis for ouropinion.
In our opinion, the consolidated financial statements present fairly, in all material respects, the financialposition of the Company as of October 31, 2005 and the results of its operations and its cash flows forthe year then ended in accordance with International Financial Reporting Standards.
Chartered Accountants
December 16, 2005
AUDITORS’ REPORT

51
Consolidated Balance Sheet
As of October 31, 2005(expressed in thousands of United States dollars)
Notes 2005 2004$ $
AssetsCash and balances with central banks 3 409,696 330,867Loans and advances to banks 4 2,490,343 2,673,327Derivative financial instruments 12 11,290 —Trading securities 5 668,899 276,519Other assets 6 188,813 69,943Taxation recoverable 12,198 6,663Investment securities 7 646,594 827,476Loans and advances to customers 8 4,630,998 3,958,080Property, plant and equipment 9 148,956 153,441Deferred tax assets 22 7,004 6,029Retirement benefit assets 10 47,607 45,100Intangible assets 11 305,535 301,275
Total assets 9,567,933 8,648,720
LiabilitiesDerivative financial instruments 12 4,350 3,702Customer deposits 13 7,729,395 7,359,646Other borrowed funds 14 42,348 —Other liabilities 15 421,487 30,120Taxation payable 8,649 5,665Deferred tax liabilities 22 4,094 2,901Debt securities in issue 16 199,532 —Retirement benefit obligations 10 24,077 21,150
Total liabilities 8,433,932 7,423,184
Minority interest 17 21,334 18,433
Shareholders’ equityShare capital and reserves 18 736,601 1,011,724Retained earnings 376,066 195,379
1,112,667 1,207,103
Total shareholders’ equity and liabilities 9,567,933 8,648,720
Approved by the Board of Directors on December 16, 2005
Michael Mansoor John Riviere Charles PinkChairman Chief Financial Officer Chief Executive Officer

For the year ended October 31, 2005(expressed in thousands of United States dollars)
52
Notes Share Retainedcapital Reserves earnings Total
$ $ $ $
Balance at October 31, 2003 1,323,269 (374,229) 162,418 1,111,458
Net income for the year — — 88,542 88,542Dividends — — (41,188) (41,188)Repurchase of non-voting
Class A shares (25,920) — — (25,920)Transfer to reserves 18 — 14,393 (14,393) —Foreign currency translation
differences 18 — (974) — (974)Net change in available-for-sale
investment securities 18 — 78,887 — 78,887Net change in cash flow hedges 18 — (3,702) — (3,702)
Balance at October 31, 2004 1,297,349 (285,625) 195,379 1,207,103
Net income for the year — — 257,935 257,935Dividends — — (56,003) (56,003)Redemption of preference shares 18 (180,000) — — (180,000)Transfer to reserves 18 — 21,245 (21,245) —Foreign currency translation
differences 18 — (2,066) — (2,066)Net change in available-for-sale
investment securities 18 — (113,654) — (113,654)Net change in cash flow hedges 18 — (648) — (648)
Balance at October 31, 2005 1,117,349 (380,748) 376,066 1,112,667
Consolidated Statement ofChanges in Shareholders’ Equity

For the year ended October 31, 2005(expressed in thousands of United States dollars)
53
Notes 2005 2004$ $
Interest income 479,415 400,167Interest expense 168,664 126,816
Net interest income 19 310,751 273,351Operating income 20 235,817 112,039
546,568 385,390
Operating expenses 21 262,172 261,706Loan loss expenses 8 7,308 14,889
269,480 276,595
Income before taxation and minority interest 277,088 108,795
Taxation 22 13,973 16,926
Income before minority interest 263,115 91,869
Minority interest 17 5,180 3,327
Net income for the year 257,935 88,542
Earnings per share in cents 23
— basic 16.9 5.8— diluted 16.9 5.2
Consolidated Statement ofIncome

For the year ended October 31, 2005(expressed in thousands of United States dollars)
54
2005 2004$ $
Cash flows from operating activitiesIncome before taxation and minority interest 277,088 108,795Provision for credit losses 7,308 14,889Depreciation 18,325 15,048Net gains on sale of property, plant and equipment (7,161) (3,491)Net gains on sale and redemption of investment securities (118,636) (720)Interest income earned on investment securities (61,827) (46,213)Interest expense incurred on borrowed funds and debt securities 10,996 —Dividend income (3) —Cash flows from operating profits before changes in
operating assets and liabilities 126,090 88,308
Changes in operating assets and liabilities:— net decrease in loans and advances to banks 561,427 116,171— net increase in trading securities (392,380) (103,549)— net increase in loans and advances to customers (660,974) (388,517)— net increase in other assets (132,380) (4,633)— net increase in customer deposits 355,580 81,542— net increase/(decrease) in other liabilities 399,488 (124,950)Corporate taxes paid (16,525) (8,254)
Net cash from/(used in) operating activities 240,326 (343,882)
Cash flows from investing activitiesPurchases of property, plant and equipment (31,979) (40,107)Proceeds from sale of property, plant and equipment 25,464 12,307Decrease in investment securities, net of purchases 228,471 42,649Interest income received on investment securities 61,770 37,133Dividend income 3 —Acquisition of subsidiary, net of cash acquired (4,977) —
Net cash from investing activities 278,752 51,982
Cash flows from financing activitiesProceeds from borrowed funds and debt securities, net of repayments 193,689 —Interest paid on borrowed funds and debt securities (7,639) —Dividends paid (54,790) (43,117)Repayments on related party loans (11,000) (11,000)Repurchase of non-voting Class A shares — (25,920)Redemption of preference shares (180,000) —
Net cash used in financing activities (59,740) (80,037)
Net increase/(decrease) in cash and cash equivalents for the year 459,338 (371,937)Cash and cash equivalents acquired as a result of an acquisition 4,701 —Effect of exchange rate changes on cash and cash equivalents (2,066) (974)Cash and cash equivalents, beginning of year 1,540,694 1,913,605
Cash and cash equivalents, end of year (note 3) 2,002,667 1,540,694
Consolidated Statement ofCash Flows

Notes to Consolidated Financial Statements
October 31, 2005(expressed in thousands of United States dollars)
55
1. General information
FirstCaribbean International Bank Limited and its subsidiaries (“the Group”) are registered under therelevant financial and corporate legislations of 16 countries in the Caribbean to carry on banking andother related activities. The major shareholders of the Company are jointly Canadian Imperial Bank ofCommerce (“CIBC”), a Company incorporated in Canada, and Barclays Bank PLC, a Companyincorporated in England. The Group's parent company is FirstCaribbean International Bank Limited(“the Bank”) which is a company incorporated and domiciled in Barbados at Warrens, St. Michael. AtOctober 31, 2005 the Group had 3,370 employees (2004 – 3,391).
The Bank has a primary listing on the Barbados stock exchange, with further listings on the Trinidad,Jamaica and Eastern Caribbean stock exchanges.
2. Summary of significant accounting policies
2.1 Basis of presentation
These consolidated financial statements are prepared in accordance with International FinancialReporting Standards (IFRS) under the historical cost convention as modified by the revaluationof available-for-sale investment securities, financial assets and financial liabilities held for tradingand all derivative contracts.
The preparation of financial statements in conformity with IFRS requires management to makeestimates and assumptions that affect amounts reported in the financial statements andaccompanying notes. Actual results could differ from these estimates.
2.2 Consolidation
Subsidiary undertakings, which are those companies in which the Group directly or indirectlyhas an interest of more than one half of the voting rights or otherwise has power to exercisecontrol over the operations, have been fully consolidated. The principal subsidiary undertakingsare disclosed in note 35. Subsidiaries are consolidated from the date on which the effectivecontrol is transferred to the Group. They are de-consolidated from the date that control ceases.
All inter-company transactions, balances and unrealised surpluses and deficits on transactionsand balances have been eliminated. Where necessary, the accounting policies used bysubsidiaries have been changed to ensure consistency with the policies adopted by the Group.
The purchase method of accounting is used to account for the acquisition of subsidiaries by theGroup. The cost of an acquisition is measured as the fair value of the assets given, equityinstruments issued and liabilities incurred or assumed at the date of the exchange, plus costsdirectly attributable to the acquisition. Identifiable assets acquired and liabilities and contingentliabilities assumed in a business combination are measured initially at their fair values at thedate of acquisition, irrespective of the extent of any minority interest. The excess of the cost ofacquisition over the fair value of the Group’s share of the identifiable net assets acquired isrecorded as goodwill. If the cost of the acquisition is less than the fair value of the net assets ofthe subsidiary acquired, the difference is recognised directly in the income statement (Note 2 (2.12)).

Notes to Consolidated Financial Statements
October 31, 2005(expressed in thousands of United States dollars)
56
2. Summary of significant accounting policies (continued)
2.3 Segment reporting
A business segment is a group of assets and operations engaged in providing products andservices that are subject to risks and returns that are different from those of other businesssegments. A geographical segment is engaged in providing products or services within aparticular economic environment that are subject to risks and returns that are different fromthose of segments operating in other economic environments. Segments with a majority ofrevenue earned from external customers, and whose revenue, results or assets are 10% or moreof all the segments, are reported separately.
2.4 Foreign currency translation
Functional and presentation currency
Items included in the financial statements of each of the Group’s entities are measured usingthe currency of the primary economic environment in which the entity operates (“thefunctional currency”). The functional currency of the Parent Company is Barbados dollars,however, these consolidated financial statements are presented in United States dollars (“thepresentation currency”) as this is the single largest currency of use throughout the Group andis universally accepted and recognised in all the territories in which the Group operates.
Transactions and balances
Monetary assets and liabilities denominated in foreign currencies are translated into thefunctional currency at rates prevailing at the date of the financial statements and non-monetaryassets and liabilities are translated at historic rates. Revenue and expenses denominated inforeign currencies are translated into the Parent Company’s functional currency and thenconverted to the Group presentation currency using prevailing average monthly exchangerates. Realised and unrealised gains and losses on foreign currency positions are reported inincome of the current year. Translation differences on non-monetary items, such as equitiesclassified as available-for-sale financial assets, are included in the translation reserve in equity.
Group companies
The results and financial position of all the group entities that have a functional currencydifferent from the presentation currency are translated into the presentation currency asfollows:
i) Assets and liabilities for each balance sheet presented are translated at the closing rate atthe date of that balance sheet.
ii) Income and expenses for each income statement are translated at average exchange rates(unless this average is not a reasonable approximation of the cumulative effect of the ratesprevailing on the transaction dates, in which case income and expenses are translated atthe dates of the transactions); and
iii) All resulting exchange differences are recognised as a separate component of equity.
On consolidation, exchange differences arising from the translation of the net investment inforeign entities, and of borrowings and other currency instruments designated as hedges ofsuch investments, are taken to shareholders’ equity. When a foreign operation is sold, suchexchange differences are recognised in the income statement as part of the gain or loss on sale.

Notes to Consolidated Financial Statements
October 31, 2005(expressed in thousands of United States dollars)
57
2. Summary of significant accounting policies (continued)
2.5 Derivative financial instruments and hedge accounting
Derivatives are initially recognised in the balance sheet at cost and subsequently re-measuredat their fair value. Fair values are obtained from discounted cash flow models, using quotedmarket interest rates. All derivatives are carried as assets when fair value is positive and asliabilities when fair value is negative.
The method of recognising the resulting fair value gain or loss depends on whether thederivative is designated as a hedging instrument, and if so, the nature of the item beinghedged. The Group designates certain derivatives as either: (1) hedges of the fair value ofrecognised assets or liabilities (fair value hedge); or (2) hedges of highly probable cash flowsattributable to a recognised asset or liability (cash flow hedge). Hedge accounting is used forderivatives designated in this way provided certain criteria are met.
The Group’s criteria for a derivative instrument to be accounted for as a hedge include:i) formal documentation of the hedging instrument, hedged item, hedging objective,
strategy and relationship, at the inception of the transaction;ii) the hedge is documented showing that it is expected to be highly effective in offsetting
the risk in the hedged item throughout the reporting period; andiii) the hedge is highly effective on an ongoing basis.
(1) Fair value hedgeChanges in the fair value of the effective portions of derivatives that are designated andqualify as fair value hedges and that prove to be highly effective in relation to hedged riskare recorded in the income statement, along with the corresponding change in fair valueof the hedged asset or liability that is attributable to that specific hedged risk.
If the hedge no longer meets the criteria for hedge accounting, an adjustment to thecarrying amount of a hedged interest-bearing financial instrument is amortised to net profitor loss over the period to maturity. The adjustment to the carrying amount of a hedgedequity security remains in retained earnings until the disposal of the equity security.
(2) Cash flow hedgeThe effective portion of changes in the fair value of derivatives that are designated andqualify as cash flow hedges are recognised in equity. The gain or loss relating to theineffective portion is recognised immediately in the income statement.
Amounts accumulated in equity are recycled to the income statement in the periods in whichthe hedged item will affect profit or loss (for example, when the forecast sale that is hedgedtakes place).
When a hedging instrument expires or is sold, or when a hedge no longer meets the criteriafor hedge accounting, any cumulative gain or loss existing in equity at that time remains inequity and is recognised when the forecast transaction is ultimately recognised in the incomestatement. When a forecast transaction is no longer expected to occur, the cumulative gain orloss that was reported in equity is immediately transferred to the income statement.

Notes to Consolidated Financial Statements
October 31, 2005(expressed in thousands of United States dollars)
58
2. Summary of significant accounting policies (continued)
2.6 Interest income and expense
Interest income and expense are recognised in the income statement for all interest-bearinginstruments on an accrual basis using the effective interest yield method based on the actualpurchase price or estimated recoverable amount. Interest income includes coupons earned onfixed income investment and trading securities and accrued discount and premium on treasurybills and other discounted instruments.
Once a financial asset or a group of similar financial assets has been written down as a result ofan impairment loss, interest income is recognised using the rate of interest used to discountthe future cash flows for the purpose of measuring impairment loss.
2.7 Fee and commission income
Fees and commissions are generally recognised on an accrual basis when the service has beenprovided. Loan origination fees for loans, which have a high probability of being drawn down,are deferred (together with related direct costs) and recognised as an adjustment to theeffective interest yield on the loan. Commissions and fees arising from negotiating, orparticipating in the negotiation of a transaction for a third party, such as the acquisition ofloans, shares or other securities or the purchase or sale of businesses, are recognised oncompletion of the underlying transaction. Portfolio and other management advisory andservice fees are recognised based on the applicable service contracts, usually on a time-apportionate basis. Asset management fees related to investment funds are recognised ratablyover the period the service is provided. The same principle is applied for wealth management,financial planning and custody services that are continuously provided over an extendedperiod of time.
2.8 Financial assets
The group classifies its financial assets into the following four categories:
i) Trading securitiesii) Loans and receivablesiii) Held-to-maturity investmentsiv) Available-for-sale investments
Management determines the classification of its investments at initial recognition.
i) Trading securitiesA financial asset is classified in this category if acquired principally for the purpose of sellingin the short term. Derivatives are also categorised as held for trading unless they aredesignated as hedges.
ii) Loans and receivablesLoans and receivables are non-derivative financial assets with fixed or determinablepayments that are not quoted in an active market. They arise when the Group providesmoney, goods or services directly to a debtor with no intention of trading the receivable.

Notes to ConsolidatedFinancial Statements
October 31, 2005(expressed in thousands of United States dollars)
59
2. Summary of significant accounting policies (continued)
2.8 Financial assets (continued)
iii) Held-to-maturity investmentsHeld-to-maturity investments are non-derivative financial assets with fixed or determinablepayments and fixed maturities that the Group’s management has the positive intentionand ability to hold to maturity. Were the Group to sell other than an insignificant amountof held-to-maturity assets, the entire category would be tainted and reclassified as availablefor sale.
iv) Available-for-sale investmentsAvailable-for-sale investments are those intended to be held for an indefinite period oftime, which may be sold in response to needs for liquidity or changes in interest rates,exchange rates or equity prices.
All purchases and sales of financial assets held to maturity, available for sale and trading thatrequire delivery within the time frame established by regulation or market convention (“regularway” purchases and sales) are recognised at trade date, which is the date that the Groupcommits to purchase or sell the asset. Otherwise such transactions are treated as derivativesuntil settlement occurs. Loans and receivables are recognised when cash is advanced toborrowers.
Financial assets are initially recognised at fair value plus transaction costs. Financial assets arederecognised when the rights to receive the cash flows from the financial assets have expiredor where the Group has transferred substantially all risks and rewards of ownership.
Available-for-sale and trading financial assets are subsequently re-measured at fair value basedon quoted bid prices or amounts derived from cash flow models. Loans and receivables andheld-to-maturity investments are carried at amortised cost using the effective interest yieldmethod, less any provision for impairment. Third party expenses associated with loans andreceivables, such as legal fees, incurred in securing a loan are expensed as incurred. Unrealisedgains and losses arising from changes in the fair value of securities classified as available-for-saleare recognised in equity. When the securities are disposed of or impaired, the relatedaccumulated fair value adjustments are included in the income statement as gains and lossesfrom investment securities. Interest earned whilst holding trading securities is reported asinterest income.
The fair value of quoted investments in active markets are based on current bid prices.Unquoted equity instruments for which fair values cannot be measured reliably are recognisedat cost less impairment.
Interest earned whilst holding investment securities is reported as interest income. Dividendsare recorded on the accrual basis and included in income. Interest calculated using the effectiveinterest yield method is recognised in the income statement.
2.9 Offsetting financial instruments
Financial assets and liabilities are offset and the net amount reported in the balance sheet whenthere is a legally enforceable right to offset the recognised amounts and there is an intentionto settle on a net basis, or realise the asset and settle the liability simultaneously.

Notes to ConsolidatedFinancial Statements
October 31, 2005(expressed in thousands of United States dollars)
60
2. Summary of significant accounting policies (continued)
2.10 Sale and repurchase agreements
Securities sold subject to linked repurchase agreements (“repos”) are retained in the financialstatements as investment securities and the counter party liability is included in amounts dueto other banks under other liabilities. Securities purchased under agreements to resell arerecorded as loans and advances to other banks or customers as appropriate. The differencebetween sale and repurchase price is treated as interest and accrued over the life of repurchaseagreements using the effective interest yield method.
2.11 Impairment of financial assets
The Group assesses at each balance sheet date whether there is objective evidence that afinancial asset or group of financial assets is impaired. A financial asset or a group of financialassets is impaired and impairment losses are incurred if, and only if, there is objective evidenceof impairment as a result of one or more events that occurred after the initial recognition of theasset (a “loss event”) and that loss event (or events) has an impact on the future cash flows ofthe financial asset or group of financial assets that can be reliably estimated. Objective evidencethat a financial asset or group of financial assets is impaired includes observable data thatcomes to the attention of the Group about the following loss events:
i) significant financial difficulty of the issuer or obligor;ii) a breach of contract, such as a default or delinquency in interest or principal payments;iii) the Group granting to a borrower, for economic or legal reasons relating to the borrower’s
financial difficulty, a concession that the lender would not otherwise consider;iv) it becoming probable that the borrower will enter bankruptcy or other financial
reorganisation;v) the disappearance of an active market for that financial asset because of financial
difficulties; or vi) observable data indicating that there is a measurable decrease in the estimated future cash
flows from a group of financial assets since the initial recognition of those assets, althoughthe decrease cannot yet be identified with the individual financial assets in the group,including:– adverse changes in the payment status of borrowers in the group; or – national or local economic conditions that correlate with default on the assets in thegroup.
If there is objective evidence that an impairment loss on loans and receivables or held-to-maturity investments carried at amortised cost has been incurred, the amount of the loss ismeasured as the difference between the carrying amount and the recoverable amount, beingthe estimated present value of expected cash flows, including amounts recoverable fromguarantees and collateral, discounted based on the current effective interest rate.
When a loan is uncollectible, it is written off against the related provision for impairment;subsequent recoveries are credited to the provision for credit losses in the income statement.If the amount of the impairment subsequently decreases due to an event occurring after thewrite-down, the release of the provision is credited to the provision for credit losses in theincome statement.

Notes to Consolidated Financial Statements
October 31, 2005(expressed in thousands of United States dollars)
61
2. Summary of significant accounting policies (continued)
2.11 Impairment of financial assets (continued)
In circumstances where Central Bank guidelines and regulatory rules require provisions inexcess of those calculated under IFRS, the difference is disclosed as an appropriation of retainedearnings and is included in a non-distributable general banking reserve.
2.12 Intangible assets
i) GoodwillGoodwill represents the excess of the cost of an acquisition over the fair value of the netidentifiable assets of the acquired subsidiary undertaking at the date of acquisition and isreported in the balance sheet as an intangible asset. Goodwill is tested annually forimpairment and carried at cost less accumulated impairment losses. Goodwill is allocatedto the lowest levels for which there are separately identifiable cash flows (cash-generatingunits) for the purpose of impairment testing. An impairment loss is recognised for theamount by which the asset’s carrying value exceeds its recoverable amount. Therecoverable amount is the higher of an asset’s fair value less costs to sell and value in use.
ii) Computer software development costsCosts associated with developing and maintaining computer software programmes arerecognised as an expense as incurred. Costs that are directly associated with theproduction of identifiable and unique software products controlled by the Group, and thatwill probably generate economic benefits exceeding costs beyond one year, are recognisedas intangible assets. Direct costs include software development, employee costs and anappropriate portion of relevant overheads.
Computer software development costs recognised as assets are amortised using thestraight-line method over their useful lives (not exceeding five years).
2.13 Property, plant and equipment
Land and buildings comprise mainly branches and offices. All property, plant and equipmentis stated at historical cost less accumulated depreciation. Historical cost includes expenditurethat is directly attributable to the acquisition of the items.
Subsequent costs are included in the asset’s carrying amount or are recognised as a separateasset, as appropriate, only when it is probable that future economic benefits associated withthe item will flow to the Group and the cost of the item can be measured reliably. All otherrepairs and maintenance are charged to the income statement during the financial period inwhich they are incurred.
Land is not depreciated. Depreciation on other assets is computed on the straight-line methodat rates considered adequate to write-off the cost of depreciable assets, less salvage, over theiruseful lives.
The annual rates used are:
– Buildings 21/2%– Leasehold improvements 10% or over the life of the lease– Equipment, furniture and vehicles 20 – 50%

Notes to Consolidated Financial Statements
October 31, 2005(expressed in thousands of United States dollars)
62
2. Summary of significant accounting policies (continued)
2.13 Property, plant and equipment (continued)
Assets that are subject to amortisation are reviewed for impairment whenever events orchanges in circumstances indicate that the carrying amount may not be recoverable. Wherethe carrying amount of an asset is greater than its estimated recoverable amount, it is writtendown immediately to its recoverable amount. The asset’s recoverable amount is the higher ofthe asset’s fair value less costs to sell and the value in use.
Gains and losses on disposal of property, plant and equipment are determined by reference toits carrying amount and are taken into account in determining net income.
2.14 Leases
When assets are held subject to a finance lease, the present value of the lease payments isrecognised as a receivable. The difference between the gross receivable and the present valueof the receivable is recognised as unearned finance income. Lease income is recognised overthe term of the lease using the net investment method, which reflects a constant periodic rateof return.
2.15 Cash and cash equivalents
For the purpose of the cash flow statement, cash and cash equivalents comprise balances withless than 90 days maturity from the date of acquisition including cash balances, non-restricteddeposits with Central Banks which excludes mandatory reserve deposits, treasury bills andother money market placements.
2.16 Provisions
Provisions are recognised when the Group has a present legal or constructive obligation as aresult of past events, it is more than likely that an outflow of resources embodying economicbenefits will be required to settle the obligation, and a reliable estimate of the amount of theobligation can be made.
2.17 Retirement benefit obligations
i) Pension obligations The Group operates a number of pension plans, the assets of which are generally held inseparate trustee-administered funds. The pension plans are generally funded by paymentsfrom the relevant Group companies, taking account of the recommendations ofindependent qualified actuaries. The Group has both a defined benefit plan and a definedcontribution plan. A defined benefit plan is a pension plan that defines an amount ofpension benefit to be provided, usually as a function of one or more factors such as age,years of service or compensation. A defined contribution plan is a pension plan underwhich the Group pays fixed contributions into a separate entity (a fund) and will have nolegal or constructive obligations to pay further contributions if the fund does not holdsufficient assets to pay all employee benefits relating to employee service in the current andprior periods.

Notes to ConsolidatedFinancial Statements
October 31, 2005(expressed in thousands of United States dollars)
63
2. Summary of significant accounting policies (continued)
2.17 Retirement benefit obligations (continued)
i) Pension obligations (continued)The asset recognised in the balance sheet in respect of defined benefit pension plans is thefair value of plan assets minus the present value of the defined benefit obligation at thebalance sheet date, together with adjustments for unrecognised actuarial gains/losses andpast service cost. The defined benefit obligation is calculated annually by independentactuaries using the projected unit credit method. The present value of the defined benefitobligation is determined by the estimated future cash outflows using interest rates ofgovernment securities which have terms to maturity approximating the terms of therelated liability. Most of the pension plans are final salary plans and the charge for suchpension plans, representing the net periodic pension cost less employee contributions isincluded in staff costs.
Actuarial gains and losses arising from experience adjustments and changes in actuarialassumptions are charged or credited to income over the expected average service lives ofthe related employees. Past service costs are recognised immediately in income, unless thechanges to the pension plan are conditional on the employees remaining in service for aspecified period of time (the vesting period). In this case, past service costs are amortisedon a straight-line basis over the vesting period.
For defined contribution plans, the company has contributions to publicly or privatelyadministered pension insurance plans on a mandatory, contractual or voluntary basis.Once the contributions have been paid, the Group has no further payment obligations.The regular contributions constitute net periodic costs for the year in which they are dueand as such are included in staff costs. The Group’s contributions to defined contributionpension plans are charged to the income statement in the year to which they relate.
ii) Other post retirement obligations Some Group companies provide post-retirement healthcare benefits to their retirees. Theentitlement to these benefits is usually based on the employee remaining in service up toretirement age and the completion of a minimum service period. The expected costs ofthese benefits are accrued over the period of employment, using a methodology similar tothat for defined benefit pension plans. Actuarial gains and losses arising from experienceadjustments and changes in actuarial assumptions are charged or credited to income overthe expected average service lives of the related employees. These obligations are valuedannually by independent qualified actuaries.

Notes to Consolidated Financial Statements
October 31, 2005(expressed in thousands of United States dollars)
64
2. Summary of significant accounting policies (continued)
2.18 Deferred tax
Deferred tax is provided in full, using the liability method, on temporary differences arisingbetween the tax bases of assets and liabilities and their carrying amounts in the financialstatements.
The principal temporary differences arise from depreciation on property, plant and equipment,provisions for pensions and tax losses carried forward; and, in relation to acquisitions, on thedifference between the fair values of the net assets acquired and their tax base. Currentlyenacted tax rates are used to determine deferred taxes.
Tax payable on profits, based on the applicable tax law in each jurisdiction, is recognised as anexpense in the period in which profits arise. Deferred tax assets relating to the carry-forward ofunused tax losses are recognised to the extent that it is probable that future taxable profit willbe available against which the tax losses can be utilised.
Deferred tax related to fair value re-measurement of available-for-sale investments, which arecharged or credited directly to equity, is also credited or charged directly to equity and issubsequently recognised in the income statement together with the deferred gain or loss.
2.19 Borrowings
Borrowings are recognised initially at “cost”, being their issue proceeds (fair value ofconsideration received) net of transaction costs incurred. Borrowings are subsequently statedat amortised cost and any difference between net proceeds and the redemption value isrecognised in the income statement over the period of the borrowings using the effectiveinterest yield method.
2.20 Share capital
i) Share issue costsShares issued for cash are accounted for at the issue price less any transaction costsassociated with the issue. Shares issued as consideration for the purchase of assets, or abusiness, are recorded at the market price on the date of the issue.
ii) Dividends on ordinary sharesDividends on ordinary shares are recognised in equity in the period in which they aredeclared. Dividends for the year that are declared after the balance sheet date are notreflected in these financial statements, except as disclosed in Note 26.
2.21 Fiduciary activities
The Group commonly acts as trustees and in other fiduciary capacities that result in the holdingor placing of assets on behalf of individuals, trusts, retirement benefit plans and otherinstitutions. These assets and income arising thereon are excluded from these financialstatements, as they are not assets of the Group.
2.22 Comparatives
Where necessary, comparative figures have been adjusted to comply with changes inpresentation in the current year.

Notes to ConsolidatedFinancial Statements
October 31, 2005(expressed in thousands of United States dollars)
65
3. Cash and balances with central banks2005 2004
$ $
Cash 144,076 91,864Deposits with central banks — interest bearing 127,514 131,926Deposits with central banks — non-interest bearing 138,106 107,077
Cash and balances with central banks 409,696 330,867
Less: Mandatory reserve deposits with central banks (189,561) (157,253)
Included in cash and cash equivalents as per below 220,135 173,614
Mandatory reserve deposits with central Banks represent the Group’s regulatory requirement tomaintain a percentage of deposit liabilities as cash or deposits with Central Banks. These funds are notavailable to finance the Group’s day-to-day operations and as such, are excluded from cash resourcesto arrive at cash and cash equivalents.
Cash and cash equivalents2005 2004
$ $
Cash and balances with central banks as per above 220,135 173,614Loans and advances to banks (note 4) 1,782,532 1,367,080
2,002,667 1,540,694
4. Loans and advances to banks2005 2004
$ $
Included in cash and cash equivalents (note 3) 1,782,532 1,367,080Greater than 90 days maturity from date of acquisition 707,811 1,306,247
2,490,343 2,673,327
Included in loans and advances to banks are deposit placements with CIBC and Barclays Bank PLCentities of $2,023,632 (2004 — $2,220,575). The effective yield on these amounts during the yearwas 2.5% (2004 — 1.8%) per annum.

Notes to ConsolidatedFinancial Statements
October 31, 2005(expressed in thousands of United States dollars)
66
5. Trading securities2005 2004
$ $
Government bonds 1,964 62,089Corporate bonds 142,431 106,090Asset-backed securities 520,219 103,601Other debt securities 906 1,515
665,520 273,295
Add: Accrued interest receivable 3,379 3,224
668,899 276,519
The effective yield on trading securities during the year was 5.6% (2004 — 3.4%) per annum
6. Other assets2005 2004
$ $
Due from brokers for unsettled trades 91,130 —Amounts due from related parties 2,514 4,303Prepayments and deferred items 6,398 11,412Other accounts receivable 88,771 54,228
188,813 69,943
The amounts due from related parties are due from CIBC and Barclays Bank PLC entities and areinterest-free with no fixed terms of repayment.

Notes to ConsolidatedFinancial Statements
October 31, 2005(expressed in thousands of United States dollars)
67
7. Investment securities2005 2004
$ $Originated debt
Issued or guaranteed by Governments— Treasury bills 158,349 193,592— Debt securities 378,171 358,093
Total originated debt 536,520 551,685
Securities available for sale
Equity securities— quoted — 194,737— unquoted 1,080 1,139Debt securities 36,155 30,053
Total securities available for sale 37,235 225,929
Securities held to maturity
Issued or guaranteed by Governments— Treasury bills 12,071 5,140— Debt securities 51,631 35,642
Total securities held-to-maturity 63,702 40,782
637,457 818,396
Add: Accrued interest receivable 9,137 9,080
646,594 827,476
The effective yield during the year on debt securities and treasury bills was 4.6% (2004 — 5.2%). TheGroup has a regulatory reserve requirement to maintain a percentage of deposit liabilities in cash orin the form of Government securities. At October 31, 2005 the reserve requirement amounted to$334,047 (2004 — $256,358) of which $189,561 (2004 — $157,253) is included within cash andbalances with central banks (note 3).
Held-to-maturity debt securities in the amount of $15,140 are held as security for investmentcertificates issued by the Group (note 14).
The movement in investment securities excluding accrued interest receivable may be summarised asfollows:
Securities SecuritiesOrginated available- held-to-
debt for-sale maturity Total$ $ $ $
Balance, beginning of year 551,685 225,929 40,782 818,396Additions 648,045 25,310 106,630 779,985Disposals (sale and redemption) (673,071) (208,995) (83,710) (965,776)Gains from changes in fair value — 4,852 — 4,852
Balance, end of year 526,659 47,096 63,702 637,457

Notes to ConsolidatedFinancial Statements
October 31, 2005(expressed in thousands of United States dollars)
68
8. Loans and advances to customers2005 2004
$ $
Mortgages 1,763,911 1,547,273Personal loans 675,295 617,495Business loans 2,267,495 1,894,162
4,706,701 4,058,930Add: Accrued interest receivable 27,861 24,194Less: Provisions for impairment (103,564) (125,044)
4,630,998 3,958,080
Performing loans include an amount of $3,348 held as security for investment certificates issued bythe Group (note 14).
Movement in provisions for impairment is as follows:2005 2004
$ $
Balance, beginning of year 125,044 112,895Doubtful debts expense 11,840 8,850Movement in inherent risk provisions (6,636) 4,319Recoveries of bad and doubtful debts 2,104 1,720Bad debts written off (28,788) (2,740)
Balance, end of year 103,564 125,044
The average interest yield during the year on loans and advances was 8.6% (2004 — 7.9%). Impairedloans amounted to $245,043 as at October 31, 2005 (2004 — $260,171) and interest earned onimpaired loans amounted to $1,874 (2004 — $3,827) included in interest income.
Loans and advances to customers include finance lease receivables:
2005 2004$ $
No later than 1 year 4,725 1,803Later than 1 year and no later than 5 years 9,699 2,705Later than 5 years 1,151 116
Gross investment in finance leases 15,575 4,624
Unearned future finance income on finance leases (2,544) (432)
Net investment in finance leases 13,031 4,192

Notes to Consolidated Financial Statements
October 31, 2005(expressed in thousands of United States dollars)
69
9. Property, plant and equipmentEquipment,
Land and furniture Leasehold Totalbuildings and vehicles improvements 2005
$ $ $ $CostBalance, beginning of year 96,981 106,469 35,092 238,542Purchases 5,364 20,714 6,065 32,143Disposals (14,189) (6,682) (989) (21,860)Transfers 2,956 14,177 (17,133) —Assets written off (16) — (71) (87)
Balance, end of year 91,096 134,678 22,964 248,738
Accumulated depreciationBalance, beginning of year 18,264 52,787 14,050 85,101Depreciation 2,426 14,556 1,343 18,325Disposals (1,834) (1,487) (236) (3,557)Transfers 305 4,893 (5,198) —Assets written off (16) — (71) (87)
Balance, end of year 19,145 70,749 9,888 99,782
Net book value, end of year 71,951 63,929 13,076 148,956
Equipment,Land and furniture Leasehold Totalbuildings and vehicles improvements 2004
$ $ $ $CostBalance, beginning of year 93,170 78,897 38,043 210,110Purchases 9,617 30,285 205 40,107Disposals (5,806) (2,592) (3,151) (11,549)Assets written off — (121) (5) (126)
Balance, end of year 96,981 106,469 35,092 238,542
Accumulated depreciationBalance, beginning of year 17,357 41,857 13,698 72,912Depreciation 2,775 11,334 939 15,048Disposals (1,868) (283) (582) (2,733)Assets written off — (121) (5) (126)
Balance, end of year 18,264 52,787 14,050 85,101
Net book value, end of year 78,717 53,682 21,042 153,441
Additions to equipment, furniture and vehicles include $12,522 (2004 — $22,735) relating tosystems development costs and work in progress, on which no depreciation has been charged asthese systems and works are not yet complete and in operation.

Notes to ConsolidatedFinancial Statements
October 31, 2005(expressed in thousands of United States dollars)
70
10. Retirement benefit obligations
The Group has insured group health plans and a number of pension schemes. The pension schemesare a mixture of defined benefit and defined contribution plans. Most of the defined benefit pensionplans are non-contributory and allow for additional voluntary contributions. The insured health plansallow for retirees to continue to receive health benefits during retirement. The plans are valued byindependent actuaries every three years using the projected unit credit method.
The amounts recognised on the balance sheet are determined as follows:
Defined benefit Post retirementpension plans medical benefits
2005 2004 2005 2004$ $ $ $
Fair value of plan assets 230,550 192,000 — —Present value of funded obligations (148,730) (151,150) (15,200) (25,432)
81,820 40,850 (15,200) (25,432)Unrecognised actuarial (losses)/gains (34,650) 4,240 (8,440) 4,292
Net asset/(liability) 47,170 45,090 (23,640) (21,140)
The amounts recognised on the balance sheet are as follows:
Defined benefit Post retirementpension plans medical benefits
2005 2004 2005 2004$ $ $ $
Retirement benefit assets 47,607 45,100 — —Retirement benefit obligations (437) (10) (23,640) (21,140)
Net asset/(liability) 47,170 45,090 (23,640) (21,140)
The pension plan assets include the Company’s ordinary shares with a fair value of $1,363 (2004 — $900).

Notes to ConsolidatedFinancial Statements
October 31, 2005(expressed in thousands of United States dollars)
71
10. Retirement benefit obligations (continued)
The amounts recognised in the income statement are as follows:
Defined benefit Post retirementpension plans medical benefits
2005 2004 2005 2004$ $ $ $
Current service costs 7,850 9,290 1,000 1,407Interest cost 10,960 11,550 1,500 1,602Expected return on plan assets (20,310) (19,350) — —Net actuarial (gain)/loss recognised
during the year (800) — 180 —
Total amount included in staff costs (2,300) 1,490 2,680 3,009
Actual return on plan assets 15,800 (5,659) — —
The movements in the net asset/(liability) recognised on the balance sheet are as follows:
Defined benefit Post retirementpension plans medical benefits
2005 2004 2005 2004$ $ $ $
Balance, beginning of year 45,090 44,007 (21,140) (18,600)Charge for the year 2,300 (1,490) (2,680) (3,009)Contributions paid — 2,720 — —Employer premiums for existing retirees — — 130 469Foreign exchange translation (loss)/gain (220) (147) 50 —
Balance, end of year 47,170 45,090 (23,640) (21,140)
The principle actuarial assumptions used at the balance sheet date were as follows:
Defined benefitpension plans
2005 2004
Discount rate 7.0 – 12.0% 7.0 – 12.5%Expected return on plan assets 8.5 – 13.5% 8.5 – 13.0%Future salary increases 5.0 – 10.0% 5.5 – 10.0%Future pension increases 0.0 – 4.0% 0.0 – 4.5%
Post retirementmedical benefits
2005 2004
Discount rate 7.0 – 12.0% 7.0 – 12.5%Premium escalation rate 5.0 – 10.0% 6.0 – 11.5%Existing retiree age 60 – 65 68 – 69

Notes to ConsoldatedFinancial Statements
October 31, 2005(expressed in thousands of United States dollars)
72
10. Retirement benefit obligations (continued)
a) FirstCaribbean International Bank (Jamaica) Limited Retirement Plan
The last actuarial valuation was conducted as at October 31, 2003 and revealed a fund surplusof $5,800.
b) FirstCaribbean International Bank Limited Retirement Plan
The last actuarial valuation was conducted as at November 1, 2004 and revealed a fund surplusof $28,549.
c) FirstCaribbean International Bank (Bahamas) Limited Retirement Plan
The last actuarial valuation was conducted as at November 1, 2004 and revealed a fund surplusof $20,900.
11. Intangible assets2005 2004
$ $Goodwill
Net book amount, beginning of year 301,275 301,275Acquisition of a subsidiary (note 33) 4,260 —
Net book amount, end of year 305,535 301,275
12. Derivative financial instruments
Fair ValuesContract /
notional amount Assets Liabilities
October 31, 2005
(1) Derivatives held for trading
— Interest rate swaps 181,700 6,757 —
` (2) Derivatives held for hedging
(a) Derivatives designated as fair value hedges— Interest rate swaps 251,418 4,533 —
(b) Derivatives designated as cash flow hedges— Interest rate swaps 500,000 — (4,350)
11,290 (4,350)

Notes to Consolidated Financial Statements
October 31, 2005(expressed in thousands of United States dollars)
73
12. Derivative financial instruments (continued)Fair Values
Contract /notional amount Assets Liabilities
October 31, 2004
Derivatives held for hedging
Derivatives designated as cash flow hedges— Interest rate swaps 500,000 — (3,702)
— (3,702)
13. Customer depositsPayable Payable Payable
on after at a 2005 2004demand notice fixed date Total Total
$ $ $ $ $
Individuals 439,350 1,219,698 1,430,490 3,089,538 3,214,730Business and Governments 2,107,174 201,244 2,142,648 4,451,066 4,057,895Banks 29,287 — 130,191 159,478 65,011
2,575,811 1,420,942 3,703,329 7,700,082 7,337,636
Add: Interest payable 4,007 901 24,405 29,313 22,010
2,579,818 1,421,843 3,727,734 7,729,395 7,359,646
Included in deposits with banks are deposits from CIBC and Barclays Bank PLC entities of $27,556 (2004 — $15,848).
The effective rate of interest on deposits during the year was 2.1% (2004 — 1.3 %) per annum.
14. Other borrowed funds2005 2004
$ $
Secured borrowings 18,488 —Unsecured borrowings 21,762 —
40,250 —
Add: Interest payable 2,098 —
42,348 —
Investment certificates issued by the Group amounting to $18,488 are secured by debt securitiesreferred to in Note 7 and certain loans referred to in Note 8. The effective rate of interest on theseborrowings during the year was 10%.

Notes to ConsolidatedFinancial Statements
October 31, 2005(expressed in thousands of United States dollars)
74
15. Other liabilities2005 2004
$ $
Accounts payable and accruals 106,923 989Due to brokers for unsettled trades 161,915 —Trading securities sold short 91,875 —Bank overdrafts 39,738 —Restructuring provision (note 24) 718 6,131Dividends payable 3,491 —Amounts due to related parties 16,827 23,000
421,487 30,120
The amounts due to related parties refer to balances due to CIBC and Barclays Bank PLC entities.These balances include $17,000 (2004 — $17,000), which carries interest at 1 year Libor plus 0.75%,repayable in 2005 and $Nil (2004 — $11,000), which carries interest at 3 month Libor plus 0.75%,repayable in 2006. The remaining amount, which is due from related parties of $Nil (2004 — due torelated parties of $5,000), is interest free with no fixed terms of repayment.
16. Debt securities in issue
2005 2004$ $
USD$200 million guaranteed subordinated floating rate notes due 2015 (net of transaction costs) 198,273 —
Add: Interest payable 1,259 —
199,532 —
In 2005, the Group issued floating-rate notes with a face value of $200,000. The notes aredenominated in United States dollars. The interest rate on the notes is reset every 3 months at theUSD 3 month Libor interest rate plus 0.70% during the first 5 years. The average effective interest rateduring 2005 was 4.02%. The notes are payable at the option of the Bank in 2010. The notes areguaranteed on a subordinated basis by the Parent and two fellow subsidiary companies. The notesare listed on the Luxembourg exchange.
17. Minority interest2005 2004
$ $
Balance, beginning of year 18,433 17,035Share of net income from subsidiaries 5,180 3,327Dividends declared (2,279) (1,929)
Balance, end of year 21,334 18,433

Notes to ConsolidatedFinancial Statements
October 31, 2005(expressed in thousands of United States dollars)
75
18. Share capital and reserves2005 2004
$ $Share capitalCommon shares 1,117,349 1,117,349Preference shares — 180,000
Total share capital 1,117,349 1,297,349
ReservesGeneral banking reserve 24,467 27,514Statutory reserve 66,473 45,228Revaluation reserve – available-for-sale investment securities 5,286 115,893Hedging reserve – cash flow hedges (4,350) (3,702)Translation reserve (8,996) (6,930)Reverse acquisition reserve (463,628) (463,628)
Total reserves (380,748) (285,625)
Total share capital and reserves 736,601 1,011,724
The movements in share capital were as follows:Number of
shares $
Common shares voting, beginning and end of year 1,525,176,762 1,117,349
Preferred shares, beginning of year 180,000,000 180,000Shares repurchased and cancelled (180,000,000) (180,000)
Preferred shares, end of year — —
October 31, 2005 1,117,349
October 31, 2004 1,297,349
a) Common Shares
The Company is entitled to issue an unlimited number of Common Shares. CommonShareholders are entitled to attend and vote at all meetings of shareholders. CommonShareholders have one vote for each share owned.
b) Preference Shares
The Company repurchased and cancelled all of its Preference Shares in March, 2005 at a cost ofone dollar ($1.00) per share.
Notes to ConsolidatedFinancial Statements
October 31, 2005(expressed in thousands of United States dollars)
76
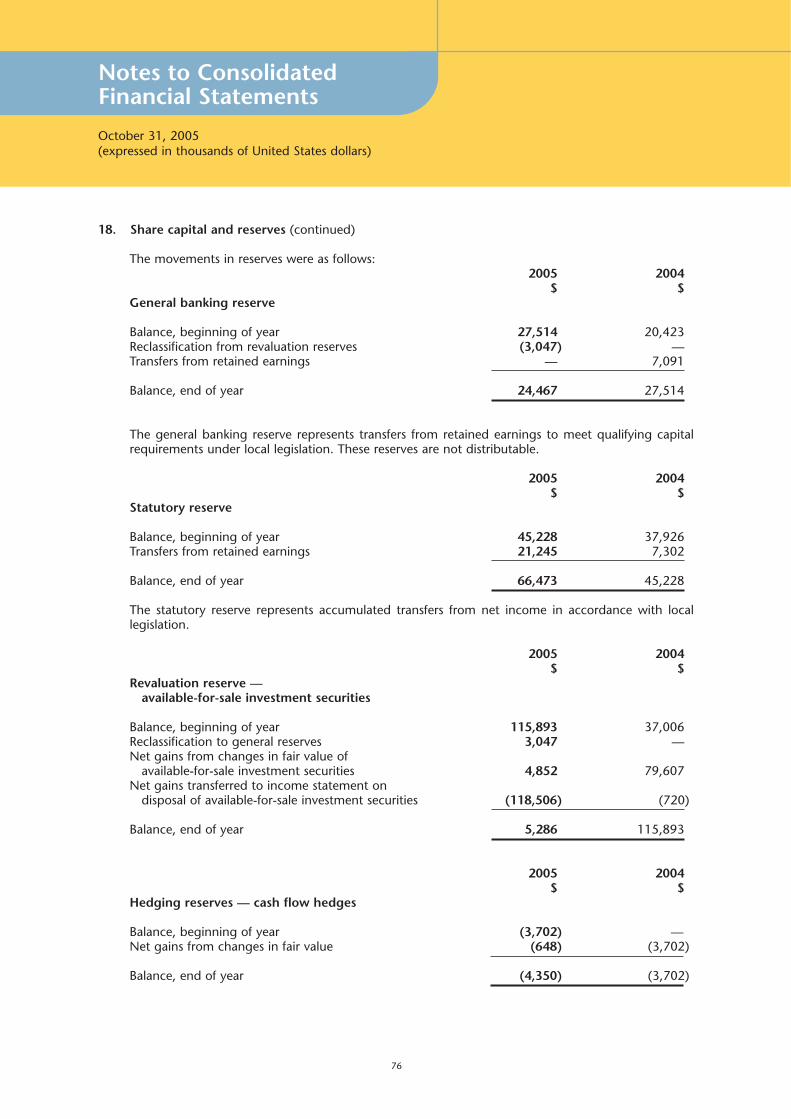
18. Share capital and reserves (continued)
The movements in reserves were as follows:2005 2004
$ $General banking reserve
Balance, beginning of year 27,514 20,423Reclassification from revaluation reserves (3,047) —Transfers from retained earnings — 7,091
Balance, end of year 24,467 27,514
The general banking reserve represents transfers from retained earnings to meet qualifying capitalrequirements under local legislation. These reserves are not distributable.
2005 2004$ $
Statutory reserve
Balance, beginning of year 45,228 37,926Transfers from retained earnings 21,245 7,302
Balance, end of year 66,473 45,228
The statutory reserve represents accumulated transfers from net income in accordance with locallegislation.
2005 2004$ $
Revaluation reserve — available-for-sale investment securities
Balance, beginning of year 115,893 37,006Reclassification to general reserves 3,047 —Net gains from changes in fair value of
available-for-sale investment securities 4,852 79,607Net gains transferred to income statement on
disposal of available-for-sale investment securities (118,506) (720)
Balance, end of year 5,286 115,893
2005 2004$ $
Hedging reserves — cash flow hedges
Balance, beginning of year (3,702) —Net gains from changes in fair value (648) (3,702)
Balance, end of year (4,350) (3,702)

Notes to Consolidated Financial Statements
October 31, 2005(expressed in thousands of United States dollars)
77
18. Share capital and reserves (continued)2005 2004
$ $Translation reserve
Balance, beginning of year (6,930) (5,956)Currency translation difference arising during the year (2,066) (974)
Balance, end of year (8,996) (6,930)
2005 2004$ $
Reverse acquisition reserve
Reverse acquisition reserve, beginning and end of year (463,628) (463,628)
In accordance with IFRS, the equity of the Company at October 11, 2002 (the date of thecombination) comprised the equity of Barclays ($135,290) together with the fair value of theconsideration given to acquire CIBC West Indies ($848,149). However, legally the share capital andstatutory reserves of the Company comprised the issued share capital and statutory reserves of CIBCWest Indies plus the shares issued to effect the combination, recorded at fair value. The reverseacquisition reserve is therefore the difference between the legally required share capital and statutoryreserves together with the retained earnings of Barclays, and the equity of the Company presented inaccordance with IFRS.
19. Net interest income2005 2004
$ $Interest incomeCash and short term funds 71,372 58,305Investment securities 61,827 46,213Loans and advances 341,232 295,479Reverse repos and other 4,984 170
479,415 400,167Interest expenseBanks and customers 157,668 126,816Debt securities in issue 5,519 —Other borrowed funds 5,477 —
168,664 126,816
310,751 273,351
Interest income on cash and short term funds includes income earned from CIBC and Barclays BankPLC entities on deposit placements (note 4).

Notes to ConsolidatedFinancial Statements
October 31, 2005(expressed in thousands of United States dollars)
78
20. Operating income2005 2004
$ $
Gross fee and commission income 56,783 50,016Dividend income — available-for-sale securities 3 —Net trading income — foreign exchange transaction
gains less losses 45,536 42,187— translation gains less losses (647) —— interest rate instruments (6,084) —
Gains less losses from investment securities 118,636 720Other operating income 21,590 19,116
235,817 112,039
Analysis of gross fee and commission income:2005 2004
$ $
Credit related fees and commissions 18,004 17,031Corporate finance fees 14 13Portfolio and other management fees 472 —Asset management and related fees 59 —Other fees 38,234 32,972
56,783 50,016
21. Operating expenses
2005 2004$ $
Staff costs 139,956 133,224Property, plant and equipment expenses 32,074 36,085Profit on sale of property, plant and equipment (7,161) (3,491)Depreciation (note 9) 18,325 15,048Restructuring (credit)/charge (note 24) (3,078) 16Other operating expenses 82,056 80,824
262,172 261,706

Notes to ConsolidatedFinancial Statements
October 31, 2005(expressed in thousands of United States dollars)
79
21. Operating expenses (continued)
Analysis of staff costs:2005 2004
$ $
Wages and salaries 126,829 120,508Pension costs:— defined contribution plans 1,278 732— defined benefit plans (2,300) 1,490Other post retirement benefits 2,680 3,009Other staff related costs 11,469 7,485
139,956 133,224
22. Taxation2005 2004
$ $Taxation charge for the year:
Current tax 14,033 14,774Deferred tax (60) 2,152
13,973 16,926
Tax on the Group’s income before tax differs from the theoretical amount that would arise using theBarbados statutory tax rate as follows:
2005 2004$ $
Income before taxation 277,088 108,795
Tax calculated at the statutory tax rate of 30% (2004 — 33%) 83,126 35,903
Effect of different tax rates in other countries (28,546) (29,689)Effect of change in tax rate (60) 1,426Effect of deferred tax asset/liability at future tax rate 529 –Effect of income not subject to tax (56,450) (8,651)Effect of income subject to tax at 12.5% (2,154) (1,392)Effect of income subject to tax at 15% (1,791) (1,100)Effect of withholding taxes 92 76Effect of allowances (34) (80)Prior year tax reassessments (20) 190Reversal of restructuring provisions 696 –Under provision of prior year corporation tax liability 2,042 202Over provision of prior year deferred tax liability (176) (849)Over provision of current year tax liability 257 –Over provision of current year deferred tax liability 27 –Movement in deferred tax asset not recognised 14,768 17,238Effect of expenses not deductible for tax purposes 1,667 3,652
13,973 16,926

Notes to Consolidated Financial Statements
October 31, 2005(expressed in thousands of United States dollars)
80
22. Taxation (continued)
Movement in deferred tax account for the year:2005 2004
$ $
Deferred tax position, beginning of year 3,128 5,280From subsidiaries acquired (278) —Deferred tax credit/(charge) for the year 60 (2,152)
Deferred tax position, end of year 2,910 3,128
Represented by:Deferred tax assets 7,004 6,029Deferred tax liabilities (4,094) (2,901)
2,910 3,128
Deferred tax assets and liabilities are attributable to the following items:
2005 2004$ $
Deferred tax assetAccelerated tax depreciation (400) (207)Pension and other post retirement benefit assets (1,395) 428Loan loss provisions 352 381Other provisions 114 563Tax losses carried forward 8,333 4,864
7,004 6,029
Deferred tax liabilitiesAccelerated tax depreciation (1,046) (984)Pension and other post retirement benefit assets (3,487) (2,566)Loan loss provisions 457 359Other provisions (42) 290Tax losses carried forward 24 –
(4,094) (2,901)
The deferred tax comprises of tax losses of $33,332 (2004 — $19,457), which will expire between2008 and 2014.
The Group has tax losses of $157,118 (2004 — $125,587) for which no deferred tax assets have beenrecognised due to uncertainty of their recoverability. These losses will expire between 2006 and 2014.

Notes to Consolidated Financial Statements
October 31, 2005(expressed in thousands of United States dollars)
81
23. Earnings per share
Basic earnings per share is calculated by dividing the net profit attributable to shareholders by theweighted average number of Common and Non-Voting Class A shares in issue during the year.
2005 2004$ $
Net income attributable to shareholders 257,935 88,542
Weighted average number of Common and Non-Voting Class A shares in issue (thousands) 1,525,176 1,527,189
Basic earnings per share (expressed in cents per share) 16.9 5.8
For the diluted earnings per share, the weighted average number of Common and Non-Voting Class A Shares in issue during the year is adjusted to assume conversion of all dilutive potential shares.The Preference Shares were the only dilutive potential shares as at October 31, 2004 and wereassumed to have been converted into Common Shares.
2005 2004$ $
Net income attributable to shareholders 257,935 88,542
Weighted average number of Common andNon-Voting Class A shares in issue (thousands) 1,525,176 1,527,189
Adjustments for:Assumed conversion of Preference Shares (thousands) — 171,000
Weighted average number of Common and Non-Voting Class A shares for diluted earnings per share (thousands) 1,525,176 1,698,189
Diluted earnings per share (expressed in cents per share) 16.9 5.2

Notes to ConsolidatedFinancial Statements
October 31, 2005(expressed in thousands of United States dollars)
82
24. Restructuring provision2005 2004
$ $
Balance, beginning of year 6,131 20,954(Credited)/ charged to income statement during the year
(note 21) (3,078) 16Utilised during the year (2,335) (14,839)
Balance, end of year 718 6,131
25. Share based payments
Stock option planThe predecessor organisation, CIBC West Indies, had a stock option plan. Under the rules of the Plan,options to purchase Common Shares in the Company may be granted to employees that entitle theemployee to purchase one Common Share of the Company at the market price (strike price) of theshares on the date of granting the options. The options vest over a four-year period and the maximumperiod within which an option may be exercised is ten years. In February 1999, 1,050,000 optionswere granted to current employees at a strike price of one dollar and seventy two cents ($1.72) pershare. To date no options have been exercised. No further options have been granted from this plan.
Long-term incentive planThe Group operates a long term incentive plan whereby under the rules of the plan, Common Sharesin the Company may be granted to employees on a discretionary basis. The shares vest over a threeyear period.
26. Dividends
As at October 31, 2005 the Directors recommended a final common share dividend, which is notreflected in these financial statements, of two point two five cents ($0.0225) per common share(2004 — $0.0125), bringing the total dividend payout for 2005 to four point two five cents ($0.0425)per common share (2004 — $0.0250).
It was resolved to declare a final dividend on preference shares on March 11, 2005 for the periodOctober 31, 2004 to March 14, 2005, the redemption date, for which an accrual of $3,491 isincluded within other liabilities as dividends payable. In 2004, the Company paid an interim dividendof $3,780 on preference shares calculated at six month Libor plus 2.65% per annum and a finaldividend of $3,780 was declared for the period May 1 to October 31, 2004, which was not reflectedin the financial statements as at October 31, 2004.
27. Related party transactions and balances
Interest and other income includes $63,645 (2004 — $43,708) and interest expense $1,183 (2004 —$2,535) earned from deposit placements and charged on deposit liabilities and swaparrangements by CIBC and Barclays Bank PLC entities. In the normal course of business, the Groupreceives banking and support services from related parties, for which $366 (2004 — $533) wascharged during the year.
Under agreement with Barclays Bank PLC, the Company receives an annual payment from BarclaysBank PLC of $10,000 (2004 — $10,000) effective January 1, 2002, as an incentive for the Company toretain its deposit placements with Barclays Capital. This payment is included in operating income forthe period. Other transactions and balances with related parties are disclosed separately in theindividual notes.

Notes to ConsolidatedFinancial Statements
October 31, 2005(expressed in thousands of United States dollars)
83
28. Contingent liabilities and commitments
The bank conducts business involving guarantees, performance bonds and indemnities, which are notreflected in the balance sheet.
2005 2004$ $
Letters of credit 84,945 52,632Loan commitments 790,469 689,641Guarantees and indemnities 116,056 91,462
991,470 833,735
The Group is the subject of legal actions arising in the normal course of business. Managementconsiders that the liability, if any, of these actions would not be material.
29. Future rental commitments under operating leases
As at October 31, 2005 the Group held leases on buildings for extended periods. The future rentalcommitments under these leases were as follows:
2005 2004$ $
Not later than 1 year 7,445 6,572Later than 1 year and less than 5 years 20,885 20,249Later than 5 years 4,321 5,892
32,651 32,713
30. Fiduciary activities
The Group provides custody and trustee discretionary investment management services to thirdparties. Those assets that are held in a fiduciary capacity are not included in these financial statements.At the balance sheet date, the Group had investment assets under administration on behalf of thirdparties amounting to $564,325 (2004 — $523,279).

Notes to ConsolidatedFinancial Statements
October 31, 2005(expressed in thousands of United States dollars)
84
31. Business segments
The Group operates four main lines of business organised along customer segments, but also includestreasury operations as a reportable segment.
Retail banking is organised along five product lines: Premier Banking (dedicated relationshipmanagement), Home Finance (mortgages), Consumer Finance, Credit Cards and Asset Management& Insurance.
Corporate Banking comprises three distinct customer sub-segments: Corporate Business, CommercialBusiness and Business Banking. Corporate Banking offers deposit and investment products, borrowingand cash management products, merchant card services and trade finance.
International Banking is organised into four segments: International Personal, International Premier,International Mortgages and International Corporate. The Personal Banking segment specialises incurrency accounts, deposit accounts, U.S. dollar credit cards and international mutual funds. ThePremier Banking segment offers each client a personal relationship manager in addition to all of theproducts and services offered by the Personal Banking segment. The International Mortgage groupprovides funding in U.S. dollars, Euros or Sterling to non-residents of the Caribbean seeking topurchase second homes in the Caribbean for personal use or as an investment. The InternationalCorporate Banking segment specialises in providing banking services to businesses and professionalintermediaries who use international financial centres.
The Capital Markets segment provides issuers and investors with access to larger pools of capital andgreater investment opportunities. It acts for and on behalf of large business and sovereign clients whoseek both equity and debt capital instruments and facilitates the expansion of the existing secondarymarket capabilities in the region.
The Treasury Group manages the interest rate, foreign exchange and liquidity risk of the Group. Inaddition, the Treasury Group conducts foreign exchange transactions on behalf of bank clients, wherepossible, and hedges fixed rate loans and investments with interest rate swaps.
Transactions between the business segments are on normal commercial terms and conditions.
Funds are ordinarily allocated between segments, resulting in funding costs transfers disclosed inoperating income. Interest charged for these funds is based on the Group’s cost of capital. There areno other material items of income or expense between the segments.
Segment assets and liabilities comprise operating assets and liabilities, being the majority of thebalance sheet, but exclude items such as taxation and borrowings.
Internal charges and transfer pricing adjustments have been reflected in the performance of eachbusiness.
Due to unavailability of data, there are no 2004 comparatives for the business segment reporting.

Notes to Consolidated Financial Statements
October 31, 2005(expressed in thousands of United States dollars)
85
31. Business segments (continued)
Retail Corporate Int’l Capital Banking Banking Banking Markets Treasury Other Eliminations Group
$ $ $ $ $ $ $ $October 31, 2005
External revenues 242,926 198,174 19,390 4,816 238,815 11,111 — 715,232Revenues
from other segments 67,156 6,810 103,039 63 (147,339) 6,234 (35,963) —
Total revenues 310,082 204,984 122,429 4,879 91,476 17,345 (35,963) 715,232
Segment result 19,975 43,124 47,919 1,382 85,062 79,626 — 277,088Unallocated
costs (5,180)
Operating profit 271,908Taxation (13,973)
Net incomefor the year 257,935
Segment assets 2,327,264 2,844,385 1,733,810 16,001 2,956,952 (293,258) (341,958) 9,243,196Unallocated
assets 324,737
Total assets 9,567,933
Segment liabilities 2,990,012 2,189,220 3,236,445 905 276,844 54,226 (326,463) 8,421,189
Unallocated liabilities 12,743
Total liabilities 8,433,932
Other segment items
Capital expenditure 13,426 281 676 24 — 17,736 — 32,143
Capital expenditure comprises additions to property, plant and equipment (note 9) and goodwill (note 11) including additions resulting from acquisitions through business combinations.
Geographical segments are set out in Note 32 (c).

Notes to Consolidated Financial Statements
October 31, 2005(expressed in thousands of United States dollars)
86
32. Financial risk management
A. Strategy in using financial instruments
By its nature the Group’s activities are principally related to the use of financial instruments. TheGroup accepts deposits from customers at both fixed and floating rates and for various periodsand seeks to earn above average interest margins by investing these funds in high quality assets.The Group seeks to increase these margins by consolidating short-term funds and lending forlonger periods at higher rates whilst maintaining sufficient liquidity to meet all claims that mightfall due.
The Group also seeks to raise its interest margins by obtaining above average margins, net ofprovisions, through lending to commercial and retail borrowers with a range of credit standing.Such exposures involve not just on-balance sheet loans and advances but the Group also entersinto guarantees and other commitments such as letters of credit and performance and otherbonds.
B. Credit risk
The Group takes on exposure to credit risk which is the risk that a counter party will be unableto pay amounts in full when due. The Group structures the levels of credit risk it undertakes byplacing limits on the amount of risk accepted in relation to one borrower, or groups of borrowers,and to geographical and industry segments. Such risks are monitored on a revolving basis andsubject to an annual or more frequent review.
The exposure to any one borrower including banks and brokers is further restricted by sub-limitscovering on and off-balance sheet exposures and daily delivery risk limits in relation to tradingitems such as forward foreign exchange contracts. Actual exposures against limits are monitoreddaily.
Exposure to credit risk is managed through regular analysis of the ability of borrowers andpotential borrowers to meet interest and capital repayment obligations and by changing theselending limits where appropriate. Exposure to credit risk is also managed in part by obtainingcollateral and corporate and personal guarantees, but a significant portion is personal lendingwhere no such facilities can be obtained.
Loans and advances to banks include $2,023,632 (2004 — $2,220,575) placed with CIBC andBarclays Bank PLC entities.
Derivatives
The Group maintains strict control limits on net open derivative positions, that is, the differencebetween purchase and sale contracts, by both amount and term. At any one time the amountsubject to credit risk is limited to the current fair value of instruments that are favorable to theGroup (i.e. assets), which in relation to derivatives is only a small fraction of the contract ornotional values used to express the volume of instruments outstanding. This credit risk exposureis managed as part of the overall lending limits with customers, together with potentialexposures from market movements. Collateral or other security is not usually obtained for creditrisk exposures on these instruments, except where the Group requires margin deposits fromcounterparties.

Notes to ConsolidatedFinancial Statements
October 31, 2005(expressed in thousands of United States dollars)
87
32. Financial risk management (continued)
B. Credit risk (continued)
Master netting arrangements
The Group further restricts its exposure to credit losses by entering into master nettingarrangements with counterparties with which it undertakes a significant volume of transactions.Master netting arrangements do not generally result in an offset of balance sheet assets andliabilities as transactions are usually settled on a gross basis. However, the credit risk associatedwith favorable contracts is reduced by a master netting arrangement to the extent that if anevent of default occurs, all amounts with the counterparty are terminated and settled on a netbasis. The Group’s overall exposure to credit risk on derivative instruments subject to masternetting arrangements can change substantially within a short period since it is affected by eachtransaction subject to the arrangement.
Credit related commitments
The primary purpose of these instruments is to ensure that funds are available to a customer asrequired. Guarantees and standby letters of credit, which represent irrevocable assurances thatthe Group will make payments in the event that a customer cannot meet its obligations to thirdparties, carry the same credit risk as loans. Documentary and commercial letters of credit, whichare written undertakings by the Group on behalf of a customer authorising a third party to drawdrafts on the Group up to a stipulated amount under specific terms and conditions, arecollateralised by the underlying shipments of goods to which they relate and therefore carry lessrisk than a direct borrowing.
Commitments to extend credit represent unused portions of authorisations to extend credit inthe form of loans, guarantees or letters of credit. With respect to credit risk on commitments toextend credit, the Group is potentially exposed to loss in an amount equal to the total unusedcommitments. However, the likely amount of loss is less than the total unused commitmentssince most commitments to extend credit are contingent upon customers maintaining specificcredit standards. The Group monitors the term of maturity of credit commitments becauselonger-term commitments generally have a greater degree of credit risk than shorter-termcommitments.
C. Geographical concentration of assets, liabilities and off-balance sheet items
The following note incorporates IAS 32 credit risk disclosures, IAS 30 geographical concentrationsof assets, liabilities and off-balance sheet items disclosures and a public enterprise’s IAS 14secondary segment disclosures.

Notes to ConsolidatedFinancial Statements
FOctober 31, 2005(expressed in thousands of United States dollars)
88
32. Financial risk management (continued)
C. Geographical concentration of assets, liabilities and off-balance sheet items (continued)
Total Total Credit Capitalassets liabilities commitments Revenues expenditure
$ $ $ $ $October 31, 2005
Barbados 1,396,559 1,405,106 133,360 214,815 8,878Bahamas 3,062,151 2,525,132 371,124 203,511 8,423Cayman 2,702,388 2,256,047 232,326 93,281 3,508Eastern Caribbean 923,375 791,858 59,639 78,223 6,290Turks & Caicos Islands 447,991 405,290 37,537 23,706 745British Virgin Islands 340,594 526,279 24,433 20,922 641Jamaica 377,280 322,763 87,471 50,714 781Other 317,595 201,457 45,580 30,060 2,877
9,567,933 8,433,932 991,470 715,232 32,143
October 31, 2004
Barbados 1,538,369 1,319,596 191,456 101,926 9,018Bahamas 2,895,225 2,403,224 202,577 177,727 10,963Cayman 1,965,343 1,662,065 166,668 65,663 1,312Eastern Caribbean 913,831 810,248 106,154 73,481 8,982British Virgin Islands 504,232 494,759 48,780 16,061 1,065Turks & Caicos Islands 367,655 337,667 69,794 13,141 2,443Jamaica 326,978 285,511 20,744 47,736 3,501Other 137,087 110,114 27,562 16,471 2,823
8,648,720 7,423,184 833,735 512,206 40,107
Although the Group is managed based on the five business segments, they operate in seven maingeographical areas. The Group’s exposure to credit risk is concentrated in these areas.
Barbados is the home country of the parent bank, which is also the main operating company. Theareas of operation include all primary business segments.
Capital expenditure is shown by geographical area in which the property, plant and equipment arelocated.

Notes to ConsolidatedFinancial Statements
October 31, 2005(expressed in thousands of United States dollars)
89
32. Financial risk management (continued)
C. Geographical concentration of assets, liabilities and off-balance sheet items (continued)
Geographic sector risk concentrations within the customer loan portfolio were as follows:
2005 2005 2004 2004$ % $ %
Barbados 639,007 14 561,740 14Bahamas 1,819,464 39 1,540,373 39Cayman 818,780 18 705,731 18Eastern Caribbean 631,014 14 577,325 15Jamaica 217,903 5 139,929 4British Virgin Islands 157,712 3 174,073 4Turks & Caicos Islands 152,928 3 138,808 3Other 194,190 4 120,101 3
4,630,998 100 3,958,080 100
D. Currency risk
The Group takes on exposure to effects of fluctuations in the prevailing foreign currencyexchange rates on its financial position and cash flows. The Board of Directors sets limits on thelevel of exposure by currency and in total for both overnight and intra-day positions, which aremonitored daily. The table below summarises the Group’s exposure to foreign currency exchangerate risk at October 31.

Notes to ConsolidatedFinancial Statements
October 31, 2005(expressed in thousands of United States dollars)
90
32. Financial risk management (continued)
D. Currency risk (continued)
Concentrations of assets, liabilities and credit commitments:
EC BDS CAY BAH US JA Other Total$ $ $ $ $ $ $ $
October 31, 2005
AssetsCash and balances with central banks 67,389 86,954 3,607 98,346 48,686 40,351 64,363 409,696
Loans and advances to banks (28,512) 4,952 — 1,254 1,984,690 (144) 528,103 2,490,343
Derivative financial instruments — — — — 11,290 — — 11,290
Trading securities — — — — 668,899 — — 668,899Other assets 98,637 19,780 (3,430) 12,183 80,143 354 (18,854) 188,813Taxation recoverable 4,930 6,932 — — 10 326 — 12,198Investment securities 34,946 235,601 — 133,627 153,691 21,694 67,035 646,594Loans and advances to customers 577,736 563,977 361,326 1,270,367 1,619,244 143,308 95,040 4,630,998
Property, plant and equipment 25,441 50,466 18,041 24,770 18,079 5,954 6,205 148,956
Deferred tax assets 425 6,566 — — — 13 — 7,004Retirement benefit assets 7,077 12,307 — 11,788 4,489 10,149 1,797 47,607
Intangible assets — 305,535 — — — — — 305,535
Total assets 788,069 1,293,070 379,544 1,552,335 4,589,221 222,005 743,689 9,567,933
LiabilitiesDerivative financial instruments — — — — 4,350 — — 4,350
Customer deposits 660,730 1,060,795 221,350 1,284,982 3,693,736 168,495 639,307 7,729,395Other borrowed funds — — — — 12,574 — 29,774 42,348
Other liabilities (4,501) 74,979 5,297 (7,090) 357,020 5,552 (9,770) 421,487Taxation payable 2,738 2,236 — — 556 292 2,827 8,649Deferred tax liabilities 969 171 — — 115 2,838 1 4,094Debt securities in issue — — — — 199,532 — — 199,532
Retirement benefit obligations 2,131 4,915 — 10,310 4,050 2,222 449 24,077
Total liabilities 662,067 1,143,096 226,647 1,288,202 4,271,933 179,399 662,588 8,433,932
Net on balance sheet position 126,002 149,974 152,897 264,133 317,288 42,606 81,101 1,134,001
Credit commitments 21,739 101,852 5,234 218,758 569,060 37,147 37,680 991,470

Notes to ConsolidatedFinancial Statements
October 31, 2005(expressed in thousands of United States dollars)
91
32. Financial risk management (continued)
D. Currency risk (continued)
Concentrations of assets, liabilities and credit commitments: (continued)
EC BDS CAY BAH US JA Other Total$ $ $ $ $ $ $ $
October 31, 2004
Total assets 769,080 1,246,582 346,625 1,501,456 3,738,610 201,546 844,821 8,648,720Total liabilities 674,813 1,076,518 250,609 1,255,640 3,435,835 171,968 557,801 7,423,184
Net on balance sheet position 94,267 170,064 96,016 245,816 302,775 29,578 287,020 1,225,536
Credit commitments 105,166 173,338 36,539 113,083 342,366 25,965 37,278 833,735
E. Cash flow and fair value interest rate risk
Cash flow interest rate risk is the risk that the future cash flows of a financial instrument willfluctuate because of changes in market interest rates. Fair value interest rate risk is the risk thatthe value of a financial instrument will fluctuate because of changes in market interest rates. TheGroup takes on exposure to the effects of fluctuations in the prevailing levels of market interestrates on both its fair value and cash flow risks. Interest margins may increase as a result of suchchanges but may reduce or create losses in the event that unexpected movements arise. Limitsare set on the level of mismatch of interest rate repricing that may be undertaken, which aremonitored on an ongoing basis.
Expected repricing and maturity dates do not differ significantly from the contract dates, exceptfor the maturity of deposits up to 1 month, which represent balances on current accountsconsidered by the Group as a relatively stable core source of funding of its operations.
F. Liquidity risk
The Group is exposed to daily calls on its available cash resources from overnight deposits,current accounts, maturing deposits, loan draw downs, guarantees and from margin and othercalls on cash settled derivatives. The Group does not maintain cash resources to meet all of theseneeds as experience shows that a minimum level of reinvestment of maturing funds can bepredicted with a high level of certainty. The Board sets limits on the minimum proportion ofmaturing funds available to meet such calls and on the minimum level of interbank and otherborrowing facilities that should be in place to cover withdrawals at unexpected levels of demand.

Notes to ConsolidatedFinancial Statements
October 31, 2005(expressed in thousands of United States dollars)
92
32. Financial risk management (continued)
F. Liquidity risk (continued)
The table below analyses assets, liabilities and credit commitments of the Group into relevant maturitygroupings based on the remaining period at balance sheet date to the contractual maturity date.
0-3 months 3-12 months 1-5 years Over 5 years Total$ $ $ $ $
October 31, 2005
AssetsCash and balances
with central banks 409,696 — — — 409,696Loans and advances
to banks 1,782,532 507,311 200,500 — 2,490,343Derivative financial
instruments 11,290 — — — 11,290Trading securities 668,899 — — — 668,899Other assets 41,893 6,751 137,554 2,615 188,813Taxation recoverable 5,492 6,706 — — 12,198Investment securities 127,531 96,895 153,021 269,147 646,594Loans and advances
to customers 792,635 498,593 1,310,654 2,029,116 4,630,998Property, plant and
equipment — — 6,092 142,864 148,956Deferred tax assets — — 6,806 198 7,004Retirement benefit assets — — — 47,607 47,607Intangible assets — — — 305,535 305,535
Total assets 3,839,968 1,116,256 1,814,627 2,797,082 9,567,933
LiabilitiesDerivative financial
instruments 4,350 — — — 4,350Customer deposits 6,438,231 802,922 165,856 322,386 7,729,395Other borrowed funds 2,098 20,093 20,157 — 42,348Other liabilities 204,069 49,896 — 167,522 421,487Taxation payable 5,211 3,438 — — 8,649Deferred tax liabilities 160 354 30 3,550 4,094Debt securities in issue — — — 199,532 199,532Retirement benefit
obligations — — — 24,077 24,077
Total liabilities 6,654,119 876,703 186,043 717,067 8,433,932
Net on balance sheet position (2,814,151) 239,553 1,628,584 2,080,015 1,134,001
Credit commitments 486,034 479,822 2,425 23,189 991,470

Notes to ConsolidatedFinancial Statements
October 31, 2005(expressed in thousands of United States dollars)
93
32. Financial risk management (continued)
F. Liquidity risk (continued)
0-3 months 3-12 months 1-5 years Over 5 years Total$ $ $ $ $
October 31, 2004
Total assets 3,345,913 1,363,338 1,409,964 2,529,505 8,648,720Total liabilities 5,774,464 812,652 79,004 757,064 7,423,184
Net on balance sheet position (2,428,551) 550,686 1,330,960 1,772,441 1,225,536
Credit commitments 481,669 321,335 21,890 8,841 833,735
The matching and controlled mismatching of the maturities and interest rates of assets and liabilitiesis fundamental to the management of the Group. It is unusual for banks ever to be completelymatched since business transacted is often of uncertain term and different types. An unmatchedposition potentially enhances profitability, but also increases the risk of losses.
The maturities of assets and liabilities and the ability to replace, at an acceptable cost, interest-bearingliabilities as they mature, are important factors in assessing the liquidity of the Group and its exposureto changes in interest rates and exchange rates.
Liquidity requirements to support calls under guarantees and standby letters of credit are considerablyless than the amount of the commitment because the Group does not generally expect the third partyto draw funds under the agreement. The total outstanding contractual amount of commitments toextend credit does not necessarily represent future cash requirements, since many of thesecommitments will expire or terminate without being funded.
G. Fair values of financial assets and liabilities
The following table summarises the carrying amounts and fair values of those financial assets andliabilities not presented on the Group's balance sheet at fair value as at October 31, 2005. Bid pricesare used to estimate fair value of assets, whereas offer prices are applied for liabilities.
Carrying Fairvalue value
$ $Financial assetsLoans and advances to customers 4,630,998 4,619,216Investment securities 646,594 637,802
Financial liabilitiesCustomer deposits and other borrowed funds 7,771,743 7,770,565

Notes to Consolidated Financial Statements
October 31, 2005(expressed in thousands of United States dollars)
94
32. Financial risk management (continued)
G. Fair values of financial assets and liabilities (continued)
Loans and advances to banks
Loans and advances to banks include inter-bank placements and items in the course of collection.The fair value of floating rate placements and overnight deposits is their carrying amount. Theestimated fair value of fixed interest bearing deposits is based on discounted cash flows usingprevailing money market interest rates for debts with similar credit risk and remaining maturity.Their carrying values approximate their fair values.
Loans and advances to customers and originated debt
The estimated fair value of loans and advances and originated debt investment securitiesrepresents the discounted amount of estimated future cash flows expected to be received.Expected cash flows are discounted at current market rates to determine fair value. The balancesare net of specific and other provisions for impairment.
Investment securities — held to maturity
Investment securities include only interest bearing assets held to maturity, as available-for-salesecurities are measured at fair value. Fair value for held-to-maturity assets is based on marketprices or broker/dealer price quotations. Where this information is not available, fair value hasbeen estimated using quoted market prices for securities with similar credit, maturity and yieldcharacteristics. Where fair values still cannot be measured reliably, these securities are carried atcost less impairment.
Customer deposits and other borrowed funds
The estimated fair value of deposits with no stated maturity, which includes non-interest bearingdeposits, is the amount repayable on demand.
The estimated fair value of fixed interest bearing deposits and other borrowings without quotedmarket price is based on discounted cash flows using interest rates for new debts with similarremaining maturity.
Debt securities in issue
The fair value is based on quoted market prices where available, and where not available is based on a current yield curve appropriate for the remaining term to maturity.

Notes to Consolidated Financial Statements
October 31, 2005(expressed in thousands of United States dollars)
95
33. Acquisitions
On December 31, 2004, the Group acquired 100% of the share capital of a small merchant bank inTrinidad called The Mercantile Banking & Financial Corporation Limited. The acquired bank contributedoperating profit of $2,151 to the Group for the period January 1, 2005 to October 31, 2005.
The details of the fair value of the assets and liabilities acquired and goodwill arising are as follows:
$
Cash and cash equivalents 4,701Loans and advances to customers 19,252Investment securities 42,550Other assets 1,264Fixed assets 164Customer deposits and other borrowed funds (59,004)Other liabilities (3,509)Goodwill (note 11) 4,260
Total purchase consideration paid (discharged by cash) 9,678
Cost of acquisition 9,678Less: Cash and cash equivalents in subsidiary acquired (4,701)
Cash outflow on acquisition 4,977
34. Post balance sheet event
On November 23, 2005, the Company through its Cayman subsidiary entered into an agreement,subject to certain conditions precedent, with ABN AMRO Asset Management Holding N.V., a limitedliability company incorporated in the Netherlands, to acquire 100% of the voting shares of ABNAMRO Bank Curacao N.V. and its subsidiary ABN AMRO Asset Management (Curacao) N.V. (jointlyreferred to hereinafter as “ABN AMRO Curacao”). ABN AMRO Curacao’s main business activities arethe provision of fiduciary services to its clients. The acquisition date is anticipated to be January 31,2006.
The purchase price shall be an amount of US$ 70 million plus or minus an asset protection adjustment(based on the balance of average entrusted funds balances at closing), plus a deferred asset retentionpayment (based on the balance of average entrusted funds balances at the first anniversary of theclosing), plus additional bonus payments based on the after tax profits of ABN AMRO Curacao in theten month period ending October 31, 2006 and the twelve month period ending October 31, 2007.
Disclosure of the net assets of ABN AMRO Curaçao is not practicable as audited financial statementsare not available.

Notes to Consolidated Financial Statements
October 31, 2005(expressed in thousands of United States dollars)
96
35. Principal subsidiary undertakings
Country ofName incorporation
FirstCaribbean International Bank Limited BarbadosFirstCaribbean International Bank (Offshore) Limited BarbadosFirstCaribbean International Bank (Bahamas) Limited (95.2%) BahamasFirstCaribbean International Finance Corporation (Bahamas) Limited BahamasFirstCaribbean International (Bahamas) Nominees Company Limited BahamasFirstCaribbean International Land Holdings (TCI) Limited Turks & Caicos IslandsFirstCaribbean International Bank (Barbados) Limited BarbadosFirstCaribbean International Trust and Merchant Bank (Barbados) Limited BarbadosFirstCaribbean International Finance Corporation
(Leeward & Windward) Limited St. LuciaFirstCaribbean International Land Holdings (Barbados) Limited BarbadosFirstCaribbean International Bank (Jamaica) Limited (94.6%) JamaicaFirstCaribbean International Securities Limited JamaicaFirstCaribbean International Building Society Limited JamaicaFirstCaribbean International Bank (Cayman) Limited Cayman IslandsFirstCaribbean International Finance Corporation (Cayman) Limited Cayman IslandsFirstCaribbean International Finance Corporation
(Netherlands Antilles) Limited Netherlands AntillesFirstCaribbean International (Cayman) Nominees Company Limited Cayman IslandsFirstCaribbean International Banking & Financial Corporation Limited Trinidad
All subsidiaries are wholly owned unless otherwise stated.

97
BarbadosThe Companies Act, Chapter 308[Section 140]
1. Name of Company:FirstCaribbean International Bank Limited Company No. 8521
2. Particulars of Meeting:Twelfth Annual Meeting of the Shareholders of the Company to be held at the Poinsettia Room,Sherbourne Conference Centre, Two Mile Hill, St. Michael, Barbados on Thursday, March 23, 2006 at 5 p.m.
3. Solicitation:It is intended to vote the Proxy hereby by the Management of the Company (unless the shareholderdirects otherwise) in favour of all resolutions specified on the Proxy Form sent to the Shareholders withthis Circular and in the absence of a specific direction, in the discretion of the Proxy Holder in respectof any other resolution.
4. Any Director’s Statement Submitted Pursuant to Section 71 (2):No statement has been received from any Director of the Company pursuant to Section 71 (2) of theCompanies Act, Chapter 308.
5. Any Auditor’s Statement Submitted to Pursuant to Section 163 (1): No statement has been received from the Auditors of the Company pursuant to Section 163 (1) of theCompanies Act, Chapter 308.
6. Any Shareholder’s Proposal Submitted Pursuant to Section 112:No proposal has been received from any Shareholder pursuant to Section 112 of the Companies Act,Chapter 308.
Date Name and Title SignatureJanuary 31, 2006 Ella N. Hoyos
Corporate SecretaryFirstCaribbean InternationalBank Limited
Management Proxy Circular

98
Proxy Form
I/We, the undersigned shareholder/shareholders of FirstCaribbean International Bank Limited herebyappoint Mr. Michael Mansoor or failing him, Mr. Charles Pink, or any Director of the Company or__________________________________________ as my/our proxy to vote for me/us on my/our behalf asindicated below on the Resolutions to be proposed at the Annual Meeting of the shareholders of theCompany to be held on Thursday, March 23, 2006.
Dated this ____________day of ___________________________2006.
Name of shareholder(s) of the Company_____________________________________________________
Signature______________________________________________________________________________
Name(s) of signatory in block capitals________________________________________________________
Please indicate with an “X” in the spaces below how you wish your proxy to vote on the Resolutionsreferred to. If no indication is given the proxy will exercise his or her discretion as to how he or she votesor whether he or she abstains from voting.
Resolution 1To approve the adoption of the audited consolidatedfinancial statements and balance sheet of the Companyfor the year November 1, 2004 to October 31, 2005.
Resolution 2To approve the election of the following persons as a Director for the term hereinafter set forth:
(i) Renier Lemmens for a period of one year.(ii) Jacobo Gonzalez-Robatto for a period of one year.
To re-elect the following persons as Directors:(iii) John Eaton for a period of three years.(iv) Charles Pink for a period of three years.(v) Sir Allan Fields for a period of three years.
Resolution 3To approve the reappointment of PricewaterhouseCoopers as auditors, and to authorise the Directors to fix their remuneration.
FOR AGAINST
Notes:
1. If it is desired to appoint a proxy other than the named Directors, the necessary deletion must be madeand initialled and the name inserted in the space provided.
2. In the case of joint holders, the signature of any holder is sufficient, but the name of all joint holdersshould be stated.
3. If the appointer is a Corporation, this form must be under its Common Seal or under the name of anofficer of the Corporation duly authorised in this behalf.
4. To be valid, this form must be completed and deposited with the Registrar & Transfer Agent,FirstCaribbean International Trust and Merchant Bank (Barbados) Limited, c/o Capital MarketsDepartment, Rendezvous, Christ Church at least 48 hours before the time appointed for holding theMeeting or adjourned Meeting.


![FINANCIAL ESTIMATES [ DRAFT]€¦ · Draft Financial Estimates, 2020. – Valletta Ministry for Finance, 2019 ISBN: 978-99957-58-38-7 1. Draft Financial Estimates – Malta I. Title](https://static.documents.pub/doc/80x56/5f072e3e7e708231d41bb523/financial-estimates-draft-draft-financial-estimates-2020-a-valletta-ministry.jpg)


