24
Financial Statements and Reports 2016 Arup Group Limited

Financial Statements and Reports 2016Arup Group Limited
Arup Group Limited and its subsidiary undertakings | Financial Statements and Reports for the year ended 31 March 2016
Contents
4 Chairman’s foreword
5 Strategic report
6 Directors’ report
8 Independent auditors’ report
10 Consolidated income statement
10 Consolidated statement of comprehensive income
11 Consolidated balance sheet
12 Company balance sheet
13 Consolidated statement of changes in equity
13 Company statement of changes in equity
14 Consolidated statement of cash flows
15 Notes to the financial statements
Arup Group Limited and its subsidiary undertakings | Financial Statements and Reports for the year ended 31 March 2016
Cover: Arnhem Central Station, Arnhem, Netherlands
Client: ProRail
Architect: UNStudio
Photography credit: © Hufton+Crow

Arup Group Limited and its subsidiary undertakings | Financial Statements and Reports for the year ended 31 March 2016Arup Group Limited and its subsidiary undertakings | Financial Statements and Reports for the year ended 31 March 2016
4 5
The directors present their strategic report for Arup Group Limited (the “Group”) for the year ended 31 March 2016 which was approved by the board of directors on 31 October 2016.
Review of the businessThese are the results for the Group for the financial year ended 31 March 2016. The results show a profit for the financial year of £16.1m (2015: £8.2m). During the year the Group’s revenue increased by 10.2% (2015: increased by 7.4%).
The net assets as at 31 March 2016 are £83.5m (2015: £59.2m).
The performance developments of the Group are in line with the expectations of the directors.
The principal area of risk and operating uncertainty for the business is its ability to continue to secure new projects and deliver the performance of existing projects in line with management’s objectives. To monitor these, the directors use the following key performance indicators (KPIs):
• Revenue and profit per person is a financial KPI used to monitor the continued contribution to the Group. In calculating this measure, profit is stated before income tax, dividends and staff profit-sharing. For the year ended 31 March 2016, revenue per person was £97k (2015: £93k) and profit per person was £9k (2015: £7k).
• Staff turnover is a key non-financial measure of business performance. For the year ended 31 March 2016, staff turnover was 11.5% (2015: 11.0%).
By order of the Board
M J Ansley-Young Company Secretary
5 December 2016
Registered Office: 13 Fitzroy Street, London, W1T 4BQ
Strategic report
Strategic report for the year ended 31 March 2016
I am pleased to report another positive year for Arup Group, albeit in a challenging global environment requiring some difficult choices and decisions. Our income grew to £1.24bn in the year to 31 March 2016, an increase of 10.2% from 2015. Across the world we’ve collaborated with clients on more than 16,000 projects in the last year and increased our operating profit margin before staff profit-sharing to 10.1%. For Arup, growth is always a result not a driver, but it does ensure that we have the stability and resources to continue doing the best possible work, wherever we operate.
Over this year our markets strengthened in the US, Canada and parts of Latin America, meeting a key aim of our five-year strategy. Our UK operation also enjoyed a positive year despite uncertainty ahead of the EU referendum and Australia performed strongly in both infrastructure and buildings. In Europe, our operations in the Netherlands performed notably well, while uncertainty related to sanctions and low oil prices had a continued impact in Russia.
2016 has seen us successfully weather the property market slowdown in China, which remains one of our key strategic regions. We also saw modest growth in India, which continues to be a market of great interest despite its present challenges. Countries in South East Asia are still in need of significant infrastructure development and we’ve seen promising signs in Indonesia and a continuing strong performance in Singapore.
Major transport infrastructure remains a key global market for the firm. In the UK Arup is working on High Speed 2 (HS2) and the Forth Replacement Crossing. We have also worked on a number of large Chinese airports, new airports in Istanbul, Turkey and Mexico City, as well as expansions in Abu Dhabi, New York’s JFK and Los Angeles International in the US.
Developing future talentOur business model and culture continues to resonate in the communities in which we work, allowing us to recruit based on personal interests and values, as well as skills. The 8,000 applications we had for 275 UK graduate positions this year is just one example of this success. Shaping the built environment provides the immeasurable satisfaction of making a tangible impact on people’s day-to-day lives.
Rewarding our membersStaff members receive a percentage of our annual operating profit, ensuring that everyone benefits when the firm performs well. This year, we have been able to increase the amount of staff profit-sharing paid to staff members by 53.1%. Arup attracts the best talent, who produce high quality work for clients and that creates a virtuous circle of further opportunities. We also invest in our people’s future through extensive training opportunities and encourage them to have a voice in how our business develops. This ethos sustains the ‘unity and enthusiasm’ that Sir Ove Arup, our founder, recognised as critical for lasting success.
Recognition Arup submits exemplar projects for awards, as a means of recognising our people’s achievements and innovations. This year our teams were proud to be awarded NCE’s ‘Global Tunnelling Project of the Year ($500m+)’ award for the Lake Mead Intake No.3; the World Architecture Festival’s ‘Religious Building of the Year’ award for the Faculty of Islamic Studies in Doha; were included in the Sunday Times Top 50 Employers for Women and featured in Fortune Magazine’s ‘Change the World List’. These are just some of the ways in which our firm has been positively recognised in the last year.
Strong values, in actionAcross the firm our people are contributing to projects tackling the world’s most pressing social, economic and environmental challenges, from water provision and improvements to city resilience, to the ongoing effort to offset climate change. In these efforts, innovation, cross-disciplinary collaboration and a relentless focus on quality continue to set us apart.
As a global firm with a proud history, a shared set of values and wide-ranging expertise, Arup has a distinctive identity. By focusing on our clients, sticking to our principles and deploying our skills to have a positive impact, I believe we will continue to play a leading role in shaping a better world.
Gregory Hodkinson Chairman, Arup Group
Chairman’s foreword
Chairman’s foreword for the year ended 31 March 2016

Arup Group Limited and its subsidiary undertakings | Financial Statements and Reports for the year ended 31 March 2016Arup Group Limited and its subsidiary undertakings | Financial Statements and Reports for the year ended 31 March 2016
6 7Directors’ report for the year ended 31 March 2016
Employees (continued)Employee involvement in the Group’s performance is encouraged and maintained via participation in a staff profit-sharing scheme.
Transition to new accounting standardsThis is the first year that the Group has presented its results under International Financial Reporting Standards (“IFRSs”) and the results for the Company under Financial Reporting Standard 101 ‘Reduced Disclosure Framework’ (“FRS 101”). The last financial statements under UK GAAP were for the year ended 31 March 2015. The date of transition to IFRS and FRS 101 was 1 April 2014.
Statement of directors’ responsibilitiesThe directors are responsible for preparing the strategic report, directors’ report and the financial statements in accordance with applicable law and regulations.
Company law requires the directors to prepare financial statements for each financial year. Under that law the directors have prepared the Group and Company financial statements in accordance with IFRSs as adopted by the European Union, and the Company financial statements in accordance with United Kingdom Generally Accepted Accounting Practice (United Kingdom Accounting Standards, comprising FRS 101 and applicable law). Under company law the directors must not approve the financial statements unless they are satisfied that they give a true and fair view of the state of affairs of the Group and the Company and of the profit or loss of the Group for that period. In preparing these financial statements, the directors are required to:
• select suitable accounting policies and then apply them consistently;
• make judgements and accounting estimates that are reasonable and prudent;
• state whether IFRSs as adopted by the European Union and applicable UK Accounting Standards comprising FRS 101 have been followed, subject to any material departures disclosed and explained in the Group and Company financial statements respectively; and
• prepare the financial statements on the going concern basis unless it is inappropriate to presume that the Company will continue in business.
The directors are responsible for keeping adequate accounting records that are sufficient to show and explain the Company’s transactions and disclose with reasonable accuracy at any time the financial position of the Company and the Group and enable them to ensure that the financial statements comply with the Companies Act 2006. They are also responsible for safeguarding the assets of the Company and the Group and hence for taking reasonable steps for the prevention and detection of fraud and other irregularities.
The directors are responsible for the maintenance and integrity of the Group’s website. Legislation in the United Kingdom governing the preparation and dissemination of financial statements may differ from legislation in other jurisdictions.
Directors’ report continued
Disclosure of audit informationThe directors confirm that, as at the date this report was approved, so far as each director is aware, there is no relevant audit information of which the Company’s auditors are unaware and that he or she has taken all steps he or she ought to have taken as a director in order to make him or herself aware of any relevant audit information and to establish that the Company’s auditors are aware of that information.
Post balance sheet event - EU referendumOn 23 June 2016 the UK electorate voted to leave the European Union. This event commences a process that is likely to take a minimum of two years to complete, during which time the UK remains a member of the European Union. There will be a resulting period of uncertainty for the UK economy with increased volatility expected in financial markets. This does not impact the fair value of assets and liabilities reported at the balance sheet date of 31 March 2016.
By order of the Board
M J Ansley-Young Company Secretary
5 December 2016
Registered Office: 13 Fitzroy Street, London, W1T 4BQ
Directors’ report for the year ended 31 March 2016
The directors present their report together with the consolidated financial statements of Arup Group Limited for the year ended 31 March 2016 which were approved by the board of directors on 31 October 2016.
The capital of Arup Group Limited (the “Company”) is divided into equity shares, which are held in trust for the benefit of the employees (past and present) of the Group, and voting shares that are held by Ove Arup Partnership Charitable Trust.
Principal activitiesThe Group practices in the field of consulting engineering services, in architecture and in other related professional skills.
Future developmentsThe Group will continue to operate in similar markets. The Group has a solid, diversified portfolio and a breadth of quality employees that will help to exploit opportunities.
DividendsThe directors do not recommend a dividend payment for the year ended 31 March 2016 (2015: nil).
DirectorsThe directors of the Company during the year and up to the date of signing this report were as follows:
P A Bailey Sir M D Bear (Resigned 30 September 2015) A J Belfield T G A Carfrae P J Chamley G S Hodkinson K Y Kwok L M Lui D M Mitchell M Raman T J Stone (Appointed 19 November 2015) D A Whittleton N T Woods
Directors’ remunerationDirectors’ remuneration has been disclosed in note 5 to the financial statements.
Directors’ indemnitiesAs permitted by the Company’s Articles of Association, the directors have the benefit of an indemnity which is a qualifying third party indemnity provision as defined by section 234 of the Companies Act 2006. The indemnity was in force throughout the last financial year and is currently in force. The Company also purchased and maintained throughout the financial year Directors’ and Officers’ Liability Insurance in respect of itself, its directors and officers.
Independent auditorsThe Company’s auditors, PricewaterhouseCoopers LLP, have indicated their willingness to continue in office for another financial year.
Directors’ report
Financial risk managementThe Group’s financial assets and liabilities comprise cash at bank, trade and other receivables and trade and other payables, whose main purpose is to maintain adequate finance for the Group’s operations.
The Group is exposed to a number of financial risks and actively mitigates the risk of financial loss. The key aspects are:
• Liquidity risk: cash flow forecasts are prepared to ensure that sufficient funds are available to meet the Group’s liabilities as and when they fall due.
• Foreign exchange risk: where possible the Group matches its currency earnings with currency costs. Where this is not possible, appropriate derivative contracts may be used. There is no speculative use of financial instruments.
• Interest rate risk: the Group currently does not hedge interest rate risk, however the need to do so is regularly reviewed.
• Credit risk: the main exposure to credit risk is on amounts due from customers. Controls and procedures are in place to mitigate this risk. Cash investments are held with banks with a minimum credit rating of A-3/P2.
Note 1(d) in the notes to the financial statements provides further information on accounting for exchange rate differences.
Research and developmentThe Group engages in research and development on an ad-hoc basis as required to complete projects during the normal course of business. Costs incurred in research are immediately expensed to the income statement, whilst development costs are assessed for capitalisation against the criteria of IAS 38 ‘Intangible Assets’.
EmployeesThe maintenance of a highly skilled workforce is key to the future of the Group. Health and Safety matters are regularly reviewed by the directors and it is their policy to ensure that:
• full and fair consideration is given to all applications for employment made by disabled persons, having regard to their capabilities;
• when existing employees become disabled (whether from illness or accident) every reasonable effort is made to continue to provide suitable employment either in the same, or by training, in an alternative job; and
• disabled persons are given equal consideration for training, career development and opportunities for promotion within the Group.
The Group is active in the field of employee communications and employees are encouraged to express their views on major policy issues. ‘Working at Arup’ surveys are conducted to obtain feedback from employees. This survey is confidential and is used alongside consultation with employees where appropriate.
Each year, employees are provided with a Chairman’s report and financial information. Employees are informed of significant business issues via the use of email, discussions with senior management, the Group’s intranet and in-house publications.

Arup Group Limited and its subsidiary undertakings | Financial Statements and Reports for the year ended 31 March 2016Arup Group Limited and its subsidiary undertakings | Financial Statements and Reports for the year ended 31 March 2016
8 9Independent auditors’ report for the year ended 31 March 2016
Independent auditors’ report continued
What an audit of financial statements involves (continued)• the reasonableness of significant accounting estimates made by
the directors; and
• the overall presentation of the financial statements.
We primarily focus our work in these areas by assessing the directors’ judgements against available evidence, forming our own judgements, and evaluating the disclosures in the financial statements.
We test and examine information, using sampling and other auditing techniques, to the extent we consider necessary to provide a reasonable basis for us to draw conclusions. We obtain audit evidence through testing the effectiveness of controls, substantive procedures or a combination of both.
In addition, we read all the financial and non-financial information in the Financial Statements and Reports to identify material inconsistencies with the audited financial statements and to identify any information that is apparently materially incorrect based on, or materially inconsistent with, the knowledge acquired by us in the course of performing the audit. If we become aware of any apparent material misstatements or inconsistencies we consider the implications for our report.
Craig Skelton (Senior Statutory Auditor)
For and on behalf of PricewaterhouseCoopers LLP Chartered Accountants and Statutory Auditors
London
5 December 2016
Independent auditors’ report for the year ended 31 March 2016
Report on the financial statements
Our opinionIn our opinion:
• Arup Group Limited’s group financial statements and Company financial statements (the “financial statements”) give a true and fair view of the state of the Group’s and of the Company’s affairs as at 31 March 2016 and of the Group’s profit and cash flows for the year then ended;
• the Group financial statements have been properly prepared in accordance with IFRSs as adopted by the European Union;
• the Company financial statements have been properly prepared in accordance with United Kingdom Generally Accepted Accounting Practice; and
• the financial statements have been prepared in accordance with the requirements of the Companies Act 2006.
What we have auditedThe financial statements included within the Financial Statements and Reports, comprise:
• the Consolidated income statement and Consolidated statement of comprehensive income for the year then ended;
• the Consolidated balance sheet as at 31 March 2016;
• the Company balance sheet as at 31 March 2016;
• the Consolidated statement of changes in equity for the year then ended;
• the Company statement of changes in equity for the year then ended;
• the Consolidated statement of cash flows for the year then ended; and
• the Notes to the financial statements, which include a summary of significant accounting policies and other explanatory information.
The financial reporting framework that has been applied in the preparation of the Group financial statements is IFRSs as adopted by the European Union, and applicable law. The financial reporting framework that has been applied in the preparation of the Company financial statements is United Kingdom Accounting Standards, comprising FRS 101, and applicable law (United Kingdom Generally Accepted Accounting Practice).
In applying the financial reporting framework, the directors have made a number of subjective judgements, for example in respect of significant accounting estimates. In making such estimates, they have made assumptions and considered future events.
Opinion on other matters prescribed by the Companies Act 2006In our opinion, the information given in the Strategic Report and the Directors’ Report for the financial year for which the financial statements are prepared is consistent with the financial statements.
Independent auditors’ report to the members of Arup Group Limited
Other matters on which we are required to report by exception
Adequacy of accounting records and information and explanations receivedUnder the Companies Act 2006 we are required to report to you if, in our opinion:
• we have not received all the information and explanations we require for our audit; or
• adequate accounting records have not been kept, or returns adequate for our audit have not been received from branches not visited by us; or
• the Company financial statements are not in agreement with the accounting records and returns.
We have no exceptions to report arising from this responsibility.
Directors’ remunerationUnder the Companies Act 2006 we are required to report to you if, in our opinion, certain disclosures of directors’ remuneration specified by law are not made. We have no exceptions to report arising from this responsibility.
Responsibilities for the financial statements and the audit
Our responsibilities and those of the directorsAs explained more fully in the statement of directors’ responsibilities set out on page 7, the directors are responsible for the preparation of the financial statements and for being satisfied that they give a true and fair view.
Our responsibility is to audit and express an opinion on the financial statements in accordance with applicable law and International Standards on Auditing (UK and Ireland) (“ISAs (UK & Ireland)”). Those standards require us to comply with the Auditing Practices Board’s Ethical Standards for Auditors.
This report, including the opinions, has been prepared for and only for the Company’s members as a body in accordance with Chapter 3 of Part 16 of the Companies Act 2006 and for no other purpose. We do not, in giving these opinions, accept or assume responsibility for any other purpose or to any other person to whom this report is shown or into whose hands it may come save where expressly agreed by our prior consent in writing.
What an audit of financial statements involvesWe conducted our audit in accordance with ISAs (UK & Ireland). An audit involves obtaining evidence about the amounts and disclosures in the financial statements sufficient to give reasonable assurance that the financial statements are free from material misstatement, whether caused by fraud or error. This includes an assessment of:
• whether the accounting policies are appropriate to the Group and the Company’s circumstances and have been consistently applied and adequately disclosed;

Arup Group Limited and its subsidiary undertakings | Financial Statements and Reports for the year ended 31 March 2016Arup Group Limited and its subsidiary undertakings | Financial Statements and Reports for the year ended 31 March 2016
10 11Consolidated income statement and consolidated statement of comprehensive income for the year ended 31 March 2016 11Consolidated balance sheet as at 31 March 2016
Consolidated balance sheetAs at 31 March 2016
Note 31 March 2016
31 March 2015
1 April2014
£’000 £’000 £’000AssetsNon-current assetsProperty, plant and equipment 10 129,588 129,184 131,620 Intangible assets 9 3,377 3,270 2,385 Investments in associates 12 - 411 309 Deferred income tax assets 22 54,470 55,121 41,014 Available-for-sale financial assets 13 4 1,220 254 Derivative financial instruments 15 38 - -
187,477 189,206 175,582 Current assetsTrade and other receivables 16 381,192 342,791 297,714 Derivative financial instruments 15 140 - - Cash and cash equivalents 17 137,020 129,079 105,883
518,352 471,870 403,597
Total assets 705,829 661,076 579,179
LiabilitiesCurrent liabilitiesBorrowings 18 - 26 358 Derivative financial instruments 15 234 - - Trade and other payables 19 428,442 380,610 316,206 Current income tax liabilities 7,032 5,309 3,442 Provisions for other liabilities and charges 20 240 441 606 435,948 386,386 320,612
Non-current liabilitiesBorrowings 18 - 15,001 30,000 Derivative financial instruments 15 45 - - Deferred income tax liabilities 22 6,566 4,820 3,414 Post-employment benefit liabilities 29 169,871 185,962 127,748 Provisions for other liabilities and charges 20 6,139 5,594 4,803 Other non-current liabilities 21 3,774 4,140 4,269 186,395 215,517 170,234
Total liabilities 622,343 601,903 490,846Net assets 83,486 59,173 88,333
EquityShare capital 23 120 120 120 Retained earnings 83,366 59,053 88,213 Total equity 83,486 59,173 88,333
The notes on pages 15 to 44 are an integral part of these financial statements. The financial statements on pages 10 to 44 were approved and authorised for issue by the board of directors on 31 October 2016 and signed on its behalf by:
G S Hodkinson Chairman
Consolidated statement of comprehensive incomeFor the year ended 31 March 2016
Note
2016
£’000
2015£’000
Profit for the financial year 16,056 8,203
Other comprehensive income / (expense):
Items that will not be reclassified to profit or lossRemeasurement gains / (losses) of post employment benefit obligations 29 5,915 (50,715)
5,915 (50,715)Items that may be reclassified subsequently to profit or lossCurrency translation gains 2,342 13,352
Other comprehensive income / (expense) for the year, net of tax 8,257 (37,363)Total comprehensive income / (expense) for the year 24,313 (29,160)
The notes on pages 15 to 44 are an integral part of these financial statements.
Company number 1312454
Consolidated income statementFor the year ended 31 March 2016
Note
2016
£’000
2015£’000
Revenue 1,239,918 1,125,510
Employee benefit expense 4 (748,529) (662,804)Charges from sub-consultants and other direct project expenses (274,436) (257,794)Depreciation and amortisation expense 9 & 10 (19,880) (19,073)Accommodation (56,022) (52,299)Communications and other overheads (113,212) (108,899) (1,212,079) (1,100,869)Operating profit 6 27,839 24,641
Finance income 7 1,382 932 Finance costs 7 (7,138) (6,576)Share of (loss) / profit of investments accounted for using the equity method 12 (19) 22
Profit before income tax 22,064 19,019
Income tax expense 8 (6,008) (10,816)Profit for the financial year 16,056 8,203
All activities of the Group are derived from continuing operations in both the current and prior years.

Arup Group Limited and its subsidiary undertakings | Financial Statements and Reports for the year ended 31 March 2016Arup Group Limited and its subsidiary undertakings | Financial Statements and Reports for the year ended 31 March 2016
12 13
Company balance sheetAs at 31 March 2016
Note
31 March
2016
31 March 2015
£’000 £’000 AssetsNon-current assets Property, plant and equipment 10 2,125 2,177 Investments in subsidiaries 11 158,143 158,418 Available-for-sale financial assets 13 4 4
160,272 160,599 Current assetsTrade and other receivables 16 28,121 11,209 Cash and cash equivalents 17 17 32
28,138 11,241
Total assets 188,410 171,840
LiabilitiesCurrent liabilities Trade and other payables 19 162,151 112,733 Current income tax liabilities 650 950
162,801 113,683
Non-current liabilitiesBorrowings 18 - 15,001
- 15,001
Total liabilities 162,801 128,684 Net assets 25,609 43,156
EquityShare capital 23 120 120 Retained earnings 25,489 43,036 Total equity 25,609 43,156
The notes on pages 15 to 44 are an integral part of these financial statements. The financial statements on pages 10 to 44 were approved and authorised for issue by the board of directors on 31 October 2016 and signed on its behalf by:
G S Hodkinson Chairman
Consolidated statement of changes in equityFor the year ended 31 March 2016
Share capital Retained earnings Total
£’000 £’000 £’000
Balance as at 1 April 2014 120 88,213 88,333
Profit for the financial year - 8,203 8,203
Remeasurement of post-employment obligations - (62,499) (62,499)Remeasurement of post-employment obligations - tax - 11,784 11,784 Currency translation differences - gains - 13,352 13,352 Other comprehensive (expense) for the year - (37,363) (37,363)
Total comprehensive (expense) for the year - (29,160) (29,160)
Balance as at 31 March 2015 120 59,053 59,173
Profit for the financial year - 16,056 16,056
Remeasurement of post-employment obligations - 10,828 10,828 Remeasurement of post-employment obligations - tax - (4,913) (4,913)Currency translation differences - gains - 2,342 2,342Other comprehensive income for the year - 8,257 8,257
Total comprehensive income for the year - 24,313 24,313
Balance as at 31 March 2016 120 83,366 83,486
Company statement of changes in equityFor the year ended 31 March 2016
Share capital Retained earnings Total
£’000 £’000 £’000
Balance as at 1 April 2014 120 37,091 37,211 Profit for the financial year - 5,945 5,945
Balance as at 31 March 2015 120 43,036 43,156
Loss for the financial year - (17,547) (17,547)
Balance as at 31 March 2016 120 25,489 25,609
Company balance sheet as at 31 March 2016 Consolidated statement of changes in equity and Company statement of changes in equity for the year ended 31 March 2016Company number 1312454
Arup Group Limited and its subsidiary undertakings | Financial Statements and Reports for the year ended 31 March 2016Arup Group Limited and its subsidiary undertakings | Financial Statements and Reports for the year ended 31 March 2016
14 15Consolidated statement of cash flows for the year ended 31 March 2016
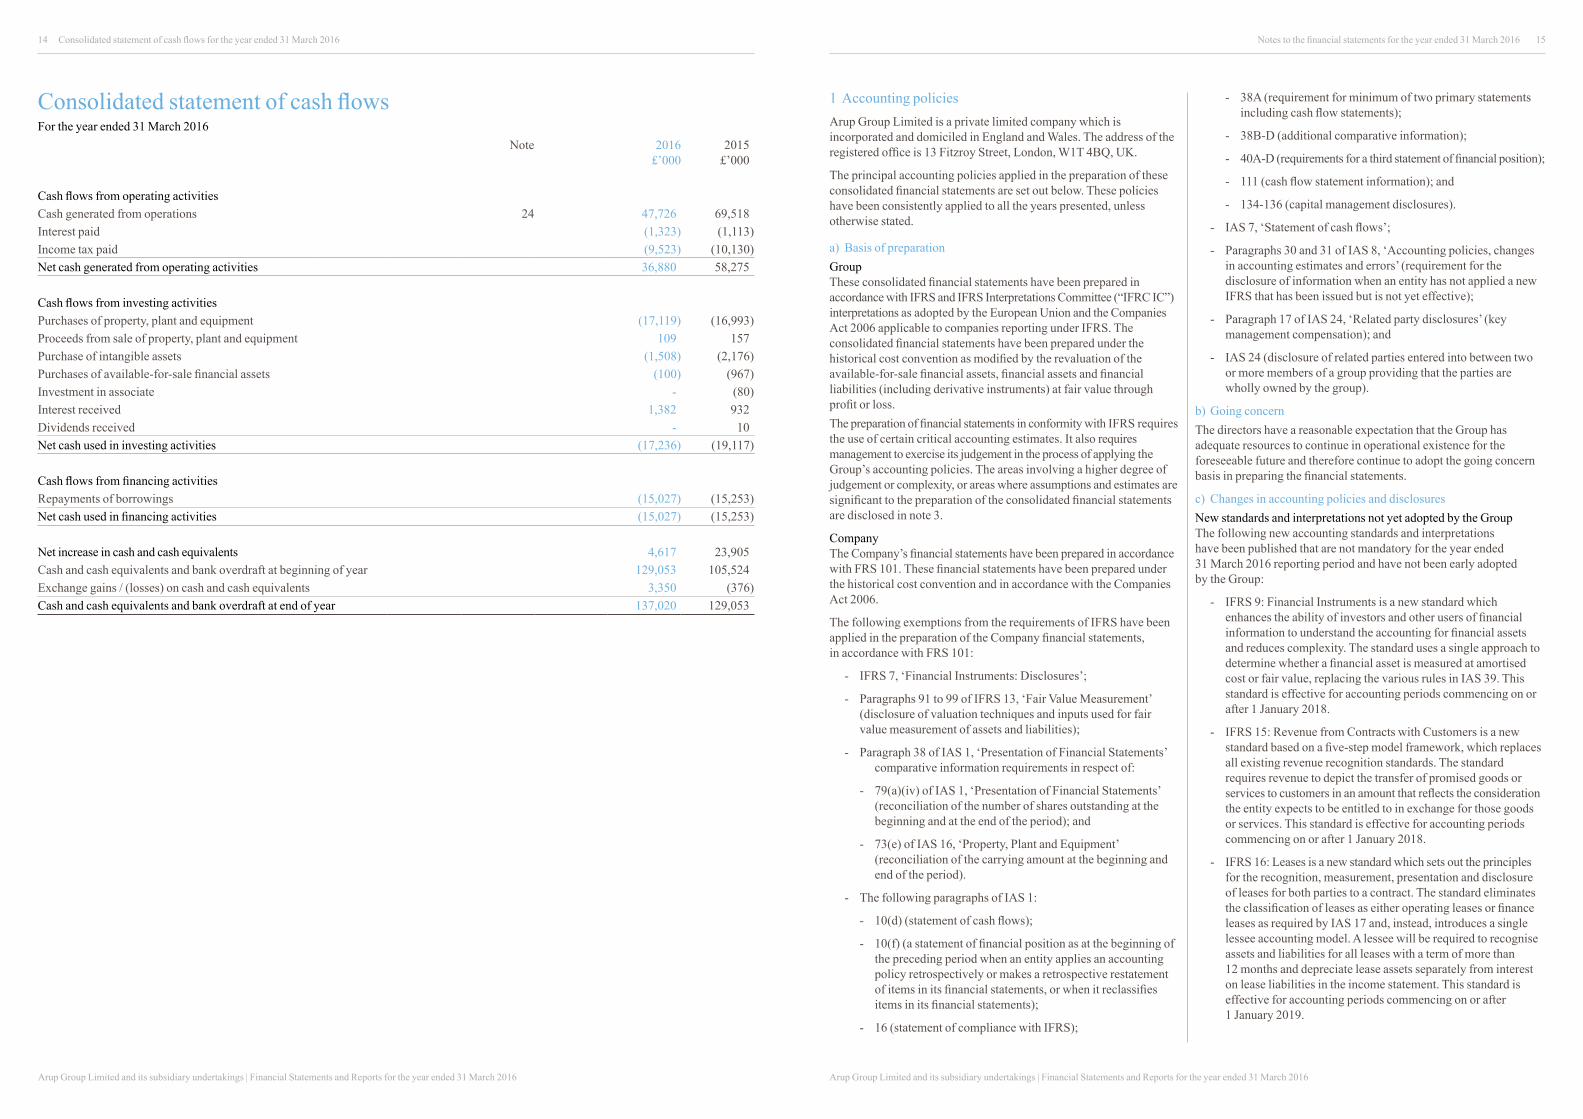
Consolidated statement of cash flowsFor the year ended 31 March 2016
Note 2016 £’000
2015 £’000
Cash flows from operating activitiesCash generated from operations 24 47,726 69,518 Interest paid (1,323) (1,113)Income tax paid (9,523) (10,130) Net cash generated from operating activities 36,880 58,275
Cash flows from investing activitiesPurchases of property, plant and equipment (17,119) (16,993)Proceeds from sale of property, plant and equipment 109 157 Purchase of intangible assets (1,508) (2,176)Purchases of available-for-sale financial assets (100) (967)Investment in associate - (80)Interest received 1,382 932 Dividends received - 10 Net cash used in investing activities (17,236) (19,117)
Cash flows from financing activitiesRepayments of borrowings (15,027) (15,253)Net cash used in financing activities (15,027) (15,253)
Net increase in cash and cash equivalents 4,617 23,905Cash and cash equivalents and bank overdraft at beginning of year 129,053 105,524 Exchange gains / (losses) on cash and cash equivalents 3,350 (376)Cash and cash equivalents and bank overdraft at end of year 137,020 129,053
1 Accounting policiesArup Group Limited is a private limited company which is incorporated and domiciled in England and Wales. The address of the registered office is 13 Fitzroy Street, London, W1T 4BQ, UK.
The principal accounting policies applied in the preparation of these consolidated financial statements are set out below. These policies have been consistently applied to all the years presented, unless otherwise stated.
a) Basis of preparationGroupThese consolidated financial statements have been prepared in accordance with IFRS and IFRS Interpretations Committee (“IFRC IC”) interpretations as adopted by the European Union and the Companies Act 2006 applicable to companies reporting under IFRS. The consolidated financial statements have been prepared under the historical cost convention as modified by the revaluation of the available-for-sale financial assets, financial assets and financial liabilities (including derivative instruments) at fair value through profit or loss.The preparation of financial statements in conformity with IFRS requires the use of certain critical accounting estimates. It also requires management to exercise its judgement in the process of applying the Group’s accounting policies. The areas involving a higher degree of judgement or complexity, or areas where assumptions and estimates are significant to the preparation of the consolidated financial statements are disclosed in note 3.
CompanyThe Company’s financial statements have been prepared in accordance with FRS 101. These financial statements have been prepared under the historical cost convention and in accordance with the Companies Act 2006.
The following exemptions from the requirements of IFRS have been applied in the preparation of the Company financial statements, in accordance with FRS 101:
- IFRS 7, ‘Financial Instruments: Disclosures’;
- Paragraphs 91 to 99 of IFRS 13, ‘Fair Value Measurement’ (disclosure of valuation techniques and inputs used for fair value measurement of assets and liabilities);
- Paragraph 38 of IAS 1, ‘Presentation of Financial Statements’ comparative information requirements in respect of:
- 79(a)(iv) of IAS 1, ‘Presentation of Financial Statements’ (reconciliation of the number of shares outstanding at the beginning and at the end of the period); and
- 73(e) of IAS 16, ‘Property, Plant and Equipment’ (reconciliation of the carrying amount at the beginning and end of the period).
- The following paragraphs of IAS 1:
- 10(d) (statement of cash flows);
- 10(f) (a statement of financial position as at the beginning of the preceding period when an entity applies an accounting policy retrospectively or makes a retrospective restatement of items in its financial statements, or when it reclassifies items in its financial statements);
- 16 (statement of compliance with IFRS);
Notes to the financial statements for the year ended 31 March 2016
- 38A (requirement for minimum of two primary statements including cash flow statements);
- 38B-D (additional comparative information);
- 40A-D (requirements for a third statement of financial position);
- 111 (cash flow statement information); and
- 134-136 (capital management disclosures).
- IAS 7, ‘Statement of cash flows’;
- Paragraphs 30 and 31 of IAS 8, ‘Accounting policies, changes in accounting estimates and errors’ (requirement for the disclosure of information when an entity has not applied a new IFRS that has been issued but is not yet effective);
- Paragraph 17 of IAS 24, ‘Related party disclosures’ (key management compensation); and
- IAS 24 (disclosure of related parties entered into between two or more members of a group providing that the parties are wholly owned by the group).
b) Going concernThe directors have a reasonable expectation that the Group has adequate resources to continue in operational existence for the foreseeable future and therefore continue to adopt the going concern basis in preparing the financial statements.
c) Changes in accounting policies and disclosuresNew standards and interpretations not yet adopted by the GroupThe following new accounting standards and interpretations have been published that are not mandatory for the year ended 31 March 2016 reporting period and have not been early adopted by the Group:
- IFRS 9: Financial Instruments is a new standard which enhances the ability of investors and other users of financial information to understand the accounting for financial assets and reduces complexity. The standard uses a single approach to determine whether a financial asset is measured at amortised cost or fair value, replacing the various rules in IAS 39. This standard is effective for accounting periods commencing on or after 1 January 2018.
- IFRS 15: Revenue from Contracts with Customers is a new standard based on a five-step model framework, which replaces all existing revenue recognition standards. The standard requires revenue to depict the transfer of promised goods or services to customers in an amount that reflects the consideration the entity expects to be entitled to in exchange for those goods or services. This standard is effective for accounting periods commencing on or after 1 January 2018.
- IFRS 16: Leases is a new standard which sets out the principles for the recognition, measurement, presentation and disclosure of leases for both parties to a contract. The standard eliminates the classification of leases as either operating leases or finance leases as required by IAS 17 and, instead, introduces a single lessee accounting model. A lessee will be required to recognise assets and liabilities for all leases with a term of more than 12 months and depreciate lease assets separately from interest on lease liabilities in the income statement. This standard is effective for accounting periods commencing on or after 1 January 2019.
Arup Group Limited and its subsidiary undertakings | Financial Statements and Reports for the year ended 31 March 2016
16 17
Arup Group Limited and its subsidiary undertakings | Financial Statements and Reports for the year ended 31 March 2016
The Group is currently assessing the impact of the new standards, amendments and interpretations that are not yet effective.
d) Foreign currency translationFunctional and presentation currencyThe Company’s functional currency is pound sterling (£). The financial statements are presented in pound sterling, which is the Group’s presentation currency.
Transactions and balancesForeign currency transactions are translated into the functional currency using the exchange rates prevailing at the dates of the transactions or valuation where items are remeasured. Foreign exchange gains and losses resulting from the settlement of such transactions and from the translation at year-end exchange rates of monetary assets and liabilities denominated in foreign currencies are recognised in the income statement.
e) RevenueRevenue represents the value of work performed on contracts in the year.
For contracts on which revenue exceeds fees rendered, the excess is included as amounts recoverable on contracts within trade and other receivables. For contracts on which fees rendered exceeds revenue, the excess is included as deferred income within trade and other payables.
The value of long term contracts is based on recoverable costs plus attributable profit. Cost is defined as engineering and technical staff costs and related overheads plus project expenses.
As projects reach stages where it is considered that their outcome can be reasonably foreseen, proportions of the expected total profit are brought into the financial statements. Provision is made for all known and anticipated losses.
f) Pre-contract costsThe Group accounts for all pre-contract costs in accordance with IAS 11 ‘Construction contracts’. Costs incurred before it becomes probable that a contract will be obtained are charged to expenses. Directly attributable costs incurred after that point are recognised in the balance sheet and charged to the income statement over the duration of the contract.
g) Current and deferred taxationCurrent and deferred income tax are recognised in the income statement for the year except where the taxation arises as a result of a transaction or event that is recognised in other comprehensive income or directly in equity. Income tax arising on transactions or events recognised in other comprehensive income or directly in equity is charged or credited to other comprehensive income or directly to equity respectively.
The current income tax charge is calculated on the basis of the tax laws enacted or substantively enacted at the balance sheet date in the countries where the Company and its subsidiaries operate and generate taxable income.
Deferred income tax is recognised on temporary differences arising between the tax bases of assets and liabilities and their carrying amounts in the consolidated financial statements. However, deferred tax liabilities are not recognised if they arise from the initial recognition of an asset or liability in a transaction other than a business combination that at the time of the transaction affects neither
accounting nor taxable profit or loss. Deferred income tax is determined using tax rates (and laws) that have been enacted or substantively enacted by the balance sheet date and are expected to apply when the related deferred income tax asset is realised or the deferred income tax liability is settled.
Deferred income tax assets are recognised only to the extent that it is probable that future taxable profits will be available against which the temporary differences can be utilised.
Deferred income tax assets and liabilities are offset when there is a legally enforceable right to offset current tax assets against current tax liabilities and when the deferred income tax assets and liabilities relate to income taxes levied by the same taxation authority on either the same taxable entity or different taxable entities where there is an intention to settle the balances on a net basis.
h) Intangible assetsComputer softwareAcquired computer software is capitalised on the basis of the costs incurred to acquire and bring into use the specific software. These costs are amortised using the straight-line method to allocate the cost of the software over its useful economic life of between 3 and 5 years. Computer software is stated at cost less accumulated amortisation.
i) Property, plant and equipmentProperty, plant and equipment is carried at cost less accumulated depreciation and impairment. Cost comprises the purchase price after discounts plus all directly attributable costs of bringing the asset to working condition for its intended use.
Subsequent costs are included in the asset’s carrying amount or recognised as a separate asset, as appropriate, only when it is probable that future economic benefits associated with the item will flow to the Group and the cost of the item can be measured reliably. The carrying amount of the replaced part is derecognised. All other repairs and maintenance costs are charged to the income statement during the financial period in which they are incurred.
Land is not depreciated. Depreciation on other assets is calculated using the straight-line method to allocate their cost or revalued amounts to their residual values over their estimated useful lives as follows: Freehold land and property is depreciated over 50 years; expenditure on leasehold properties is depreciated over the period of the lease; and all other property, plant and equipment is depreciated over a 3 to 10 year period.
Investment properties are accounted for using the cost model. The accounting treatment is in line with that of property, plant and equipment above.
j) Impairment of non-financial assetsAt each balance sheet date, the Group assesses whether there is objective evidence that an asset or group of assets is impaired. An impairment loss is recognised for the amount by which the carrying amount of the asset exceeds its recoverable amount. The recoverable amount is the higher of the fair value less costs to sell and value in use.
k) Financial assetsClassificationThe Group classifies its financial assets in the following categories: at fair value through profit or loss, loans and receivables, and available-for-sale. The classification depends on the purpose for which the financial assets were acquired. Management determines the classification of its financial assets at initial recognition.
Financial assets at fair value through profit or lossFinancial assets at fair value through profit or loss are financial assets held for trading. A financial asset is classified in this category if acquired principally for the purpose of selling in the short term. Derivatives are also categorised as held for trading. Assets in this category are classified as current assets if expected to be settled within 12 months, otherwise they are classified as non-current.
Loans and receivablesLoans and receivables are non-derivative financial assets with fixed or determinable payments that are not quoted in an active market. They are included in current assets, except where the maturity is greater than 12 months after the balance sheet date, in which case they are included as non-current assets. The Group’s loans and receivables comprise ‘trade and other receivables’ and ‘cash and cash equivalents’ in the balance sheet.
Available-for-sale financial assetsAvailable-for-sale financial assets are non-derivatives that are either designated in this category or not classified in any of the other categories. They are included in non-current assets unless the investment matures or management intends to dispose of it within 12 months of the end of the reporting period.
l) Recognition and measurementRegular purchases and sales of financial assets are recognised on the trade date (the date on which the Group commits to purchase or sell the asset). Investments are initially recognised at fair value plus transaction costs for all financial assets not carried at fair value through profit and loss. Financial assets carried at fair value through profit or loss are initially recognised at fair value, and transaction costs are expenses in the income statement. Financial assets are derecognised when the rights to receive cash flows from the investments have expired or have been transferred and the Group has transferred substantially all risks and rewards of ownership. Available-for-sale financial assets and financial assets at fair value through profit or loss are subsequently carried at fair value. Loans and receivables are subsequently carried at amortised cost using the effective interest method.
m) Offsetting financial instrumentsFinancial assets and liabilities are offset and the net amount reported in the balance sheet when there is a legally enforceable right to offset the recognised amounts and there is an intention to settle on a net basis or realise the asset and settle the liability simultaneously.
n) Impairment of financial assetsAssets carried at amortised costThe Group assesses at the end of each reporting period whether there is objective evidence that a financial asset or group of financial assets is impaired. A financial asset or a group of financial assets is impaired and impairment losses are incurred only if there is objective evidence of impairment as a result of one or more events that occurred after the initial recognition of the asset (a ‘loss event’) and that loss event (or events) has an impact on the estimated future cash flows of the financial asset or group of financial assets that can be reliably estimated.
Evidence of impairment may include indications that the debtor or a group of debtors is experiencing significant financial difficulty, default or delinquency in payments; the probability that they will enter bankruptcy or other financial reorganisation, and where observable data indicates that there is a measurable decrease in the estimated future cash flows, such as changes in arrears or economic conditions that correlate with defaults.
For the loans and receivables category, the amount of the loss is measured as the difference between the asset’s carrying amount and the present value of estimated future cash flows (excluding future credit losses that have not been incurred). The carrying amount of the asset is reduced and the amount of the loss is recognised in the income statement.
If, in a subsequent period, the amount of the impairment loss decreases and the decrease can be related objectively to an event occurring after the impairment was recognised (such as an improvement in the debtor’s credit rating), the reversal of the previously recognised impairment loss is recognised in the income statement.
Assets classified as available-for-saleThe Group assesses at the end of each reporting period whether there is objective evidence that a financial asset or a group of financial assets is impaired. If any such evidence exists, the cumulative loss (measured as the difference between the acquisition cost and the current fair value, less any impairment loss on that financial asset previously recognised in profit or loss) is removed from equity and recognised in profit or loss. If, in a subsequent period, the fair value of a debt instrument classified as available-for-sale increases and the increase can be objectively related to an event occurring after the impairment loss was recognised in profit or loss, the impairment loss is reversed through the income statement.
o) Derivatives financial instrumentsDerivatives are initially recognised at fair value on the date a derivative contract is entered into and are subsequently remeasured at their fair value. The Group does not apply hedge accounting and therefore fair value gains or losses are credited/charged to the income statement.
p) Trade receivablesTrade receivables are amounts due from customers for services performed in the ordinary course of business. If collection is expected in one year or less (or in the normal operating cycle of the business if longer), they are classified as current assets. If not, they are presented as non-current assets.
Trade receivables are recognised at fair value. A provision for impairment of trade receivables is established when there is objective evidence that the Group will not be able to collect all amounts due according to the original terms of the receivables.
q) Cash and cash equivalentsCash and cash equivalents include cash in hand, demand deposits and other short term highly liquid investments which are readily convertible to known amounts of cash and are subject to an insignificant risk of changes in value.
r) LeasesLeases in which a significant portion of the risks and rewards of ownership are retained by the lessor are classified as operating leases. Payments made under operating leases (net of any incentives received from the lessor) are charged to the income statement on a straight line basis over the period of the lease.
s) Trade payablesTrade payables are obligations to pay for goods or services that have been acquired in the ordinary course of business from suppliers. Trade payables are classified as current liabilities if payment is due within one year or less (or in the normal operating cycle of the business if longer). If not, they are presented as non-current liabilities.
Notes to the financial statements for the year ended 31 March 2016Notes to the financial statements for the year ended 31 March 2016

Arup Group Limited and its subsidiary undertakings | Financial Statements and Reports for the year ended 31 March 2016Arup Group Limited and its subsidiary undertakings | Financial Statements and Reports for the year ended 31 March 2016
18 19
t) Provisions for liabilitiesProvisions are recognised when the Group has a present legal or constructive obligation as a result of past events, it is probable that an outflow of resources will be required to settle the obligation and the amount has been reliably estimated.
The Group is required to perform dilapidation repairs on leased properties prior to the properties being vacated at the end of their lease term. Provision for such costs is made where a legal obligation is identified and the liability can be reasonably quantified.
u) Employee benefitsPension obligationsA defined contribution plan is a pension plan under which the Group pays fixed contributions into a separate entity. The Group has no legal or constructive obligations to pay further contributions if the fund does not hold sufficient assets to pay all employees the benefits relating to employee service in the current and prior periods. A defined benefit plan is a pension plan that is not a defined contribution plan.
Typically defined benefit plans define an amount of pension benefit that an employee will receive on retirement, usually dependent on one or more factors such as age, years of service and compensation.
The liability recognised in the balance sheet in respect of defined benefit pension plans is the present value of the defined benefit obligation at the end of the reporting period less the fair value of plan assets. The defined benefit obligation is calculated annually by independent actuaries using various methods (see note 29 for the methods used). The present value of the defined benefit obligation is determined by discounting the estimated future cash outflows using interest rates of high-quality corporate bonds that are denominated in the currency in which the benefits will be paid, and that have terms to maturity approximating to the terms of the related pension obligation. In countries where there is no deep market in such bonds, the market rates on government bonds are used.
Actuarial gains and losses arising from experience adjustments and changes in actuarial assumptions are charged or credited to equity in other comprehensive income in the period in which they arise.
For defined contribution plans, the Group pays contributions to publicly or privately administrated pension insurance plans on a mandatory, contractual or voluntary basis. The Group has no further payment obligation once the contributions have been paid. The contributions are recognised as employee benefit expense when they are due. Prepaid contributions are recognised as an asset to the extent that a cash refund or reduction in the future payments is available.
Staff profit-sharingThe Group recognises a liability and an expense for staff profit-sharing, based on a formula that takes into consideration the employees’ salary, length of service and grade.
v) Company income statementIn accordance with the concession under Section 408(3) of the Companies Act 2006, the Company income statement has not been separately presented in these financial statements.
2 Financial risk managementFinancial risk factorsThe Group’s activities expose it to a variety of financial risks: market risk (including foreign exchange risk and interest rate risk), credit risk and liquidity risk. The Group’s overall risk management programme
focuses on the unpredictability of financial markets and seeks to minimise potential adverse effects on the Group’s financial performance. The Group uses derivative financial instruments to manage certain risk exposures.
Risk management is carried out by a central treasury department (‘Group Treasury’) under policies approved by the board of directors. Group Treasury identifies, evaluates and hedges financial risks in close co-operation with the Group’s operating units. The board provides written principles for overall risk management, as well as written policies covering specific areas, such as foreign exchange risk, interest rate risk, credit risk, use of derivative financial instruments and investment of excess liquidity.
a) Market riski) Foreign exchange riskThe Group operates in a number of international territories. Each business undertakes a large proportion of its commercial transactions within its local market and in its local functional currency. Foreign exchange risk arises from commercial transactions undertaken in currencies other than the local functional currency, from financial assets and liabilities denominated in currencies other than the local functional currency and on the Group’s investments in foreign operations.
Group policy is for each business to undertake commercial transactions in its own functional currency whenever possible. When this is not possible, the Group manages its foreign currency exchange risk from future commercial transactions using appropriate derivative contracts arranged by Group Treasury. Cash flows are reviewed on a monthly basis throughout the duration of projects and the future cover is amended as appropriate.
The Group has certain investments in foreign operations, whose net assets are exposed to foreign currency translation risk. A proportion of the currency exposure arising from the net assets of the Group’s foreign operations is managed through borrowings denominated in the relevant foreign currencies.
The Group’s primary exposure to foreign exchange risk on unhedged financial instruments arises mainly in respect of movements between the US dollar and sterling, the Hong Kong dollar and sterling and between the euro and sterling.
At 31 March 2016, if sterling had strengthened/weakened by a reasonably possible change of 10% against the euro, post-tax profit for the year would have been lower/higher by £167k (2015: lower/higher by £7k) and equity would have been higher/lower by £3,447k (2015: higher/lower by £3,725k). If sterling had strengthened/weakened by a reasonably possible change of 10% against the Hong Kong dollar, post-tax profit for the year would have been higher/lower by £382k (2015: lower/higher by £457k) and equity would have been higher/lower by £2,364k (2015: higher/lower by £2,080k). If sterling had strengthened/weakened by a reasonably possible change of 10% against the US dollar, post-tax profit for the year would have been higher/lower by £4,090k (2015: higher/lower by £4,298k) and equity would have been higher/lower by £1,741k (2015: higher/lower by £1,516k).
ii) Interest rate riskThere is no material exposure to interest rate risk. Therefore, no interest hedging is currently undertaken by the Group or its subsidiaries.
b) Credit riskCredit risk is the risk that the Group will suffer financial loss as a result of counterparties defaulting on their contractual obligations.
On demand or
within 1 year Between 1
and 2 years Between 2
and 5 yearsOver
5 years As at 31 March 2016 £’000 £’000 £’000 £’000
Bank loan - - - - Bank overdraft - - - - Derivative financial instruments 45 234 - -Trade payables 12,175 - 2,060 -
On demand or within 1 year
Between 1 and 2 years
Between 2 and 5 years
Over 5 years
As at 31 March 2015 £’000 £’000 £’000 £’000
Bank loan - - 15,001 - Bank overdraft 26 - - - Trade payables 12,982 - - -
On demand or within 1 year
Between 1 and 2 years
Between 2 and 5 years
Over 5 years
As at 31 March 2014 £’000 £’000 £’000 £’000
Bank loan - - 30,000 - Bank overdraft 358 - - - Trade payables 16,155 - - -
The table below analyses the Group’s non-derivative financial liabilities by relevant maturity groupings based on the remaining period between the balance sheet date and the contractual maturity date. The amounts disclosed in the table are the contractual undiscounted cash flows.
For trade and other receivables, concentration of credit risk is very limited due to the Group’s broad customer base. An assessment of credit quality of the customer is made where appropriate using a combination of external rating agencies, past experience and other factors. In circumstances where credit information is unavailable or poor, the risk is mitigated primarily by the use of advance payments resulting in positive cash flows. Exposure and payment performance are monitored closely both at individual project and client level, with a series of escalating debt recovery actions taken where necessary. In view of current economic circumstances, additional management attention is focused on the recovery of debtors.
c) Liquidity riskThe Group funds its activities primarily through cash generated from its operations and also maintains undrawn committed bank facilities. The liquidity risk is managed with reference to short and long-term cash flow forecasts and the maturity of the bank facilities. These facilities contain financial covenants. Throughout the year the Group maintained robust headroom against its covenants and is expected to do so into the foreseeable future.
Surplus cash is invested by Group Treasury in interest bearing current accounts, term deposits and money market deposits through instruments with appropriate maturities or sufficient liquidity to provide sufficient headroom as determined by the above-mentioned forecasts.
Notes to the financial statements for the year ended 31 March 2016Notes to the financial statements for the year ended 31 March 2016
Arup Group Limited and its subsidiary undertakings | Financial Statements and Reports for the year ended 31 March 2016Arup Group Limited and its subsidiary undertakings | Financial Statements and Reports for the year ended 31 March 2016
20 21
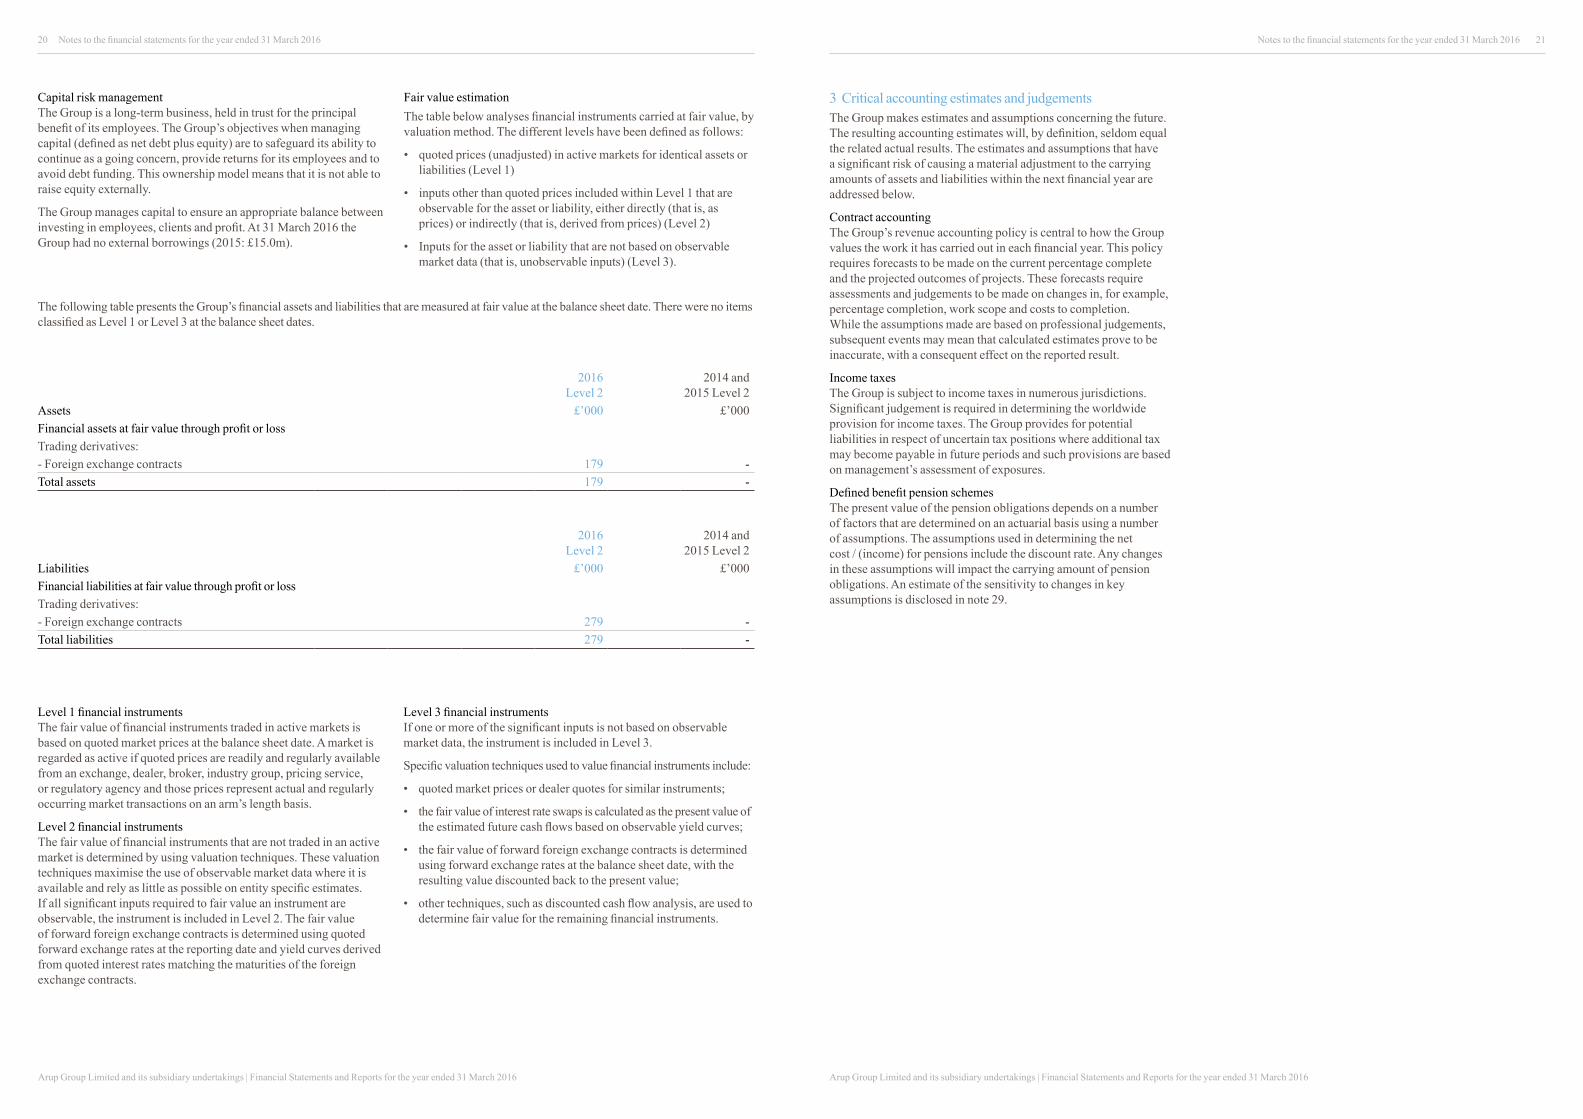
The following table presents the Group’s financial assets and liabilities that are measured at fair value at the balance sheet date. There were no items classified as Level 1 or Level 3 at the balance sheet dates.
2016
Level 2
2014 and 2015 Level 2
Assets £’000 £’000 Financial assets at fair value through profit or lossTrading derivatives: - Foreign exchange contracts 179 -Total assets 179 -
2016 Level 2
2014 and 2015 Level 2
Liabilities £’000 £’000Financial liabilities at fair value through profit or lossTrading derivatives:- Foreign exchange contracts 279 -Total liabilities 279 -
Level 1 financial instrumentsThe fair value of financial instruments traded in active markets is based on quoted market prices at the balance sheet date. A market is regarded as active if quoted prices are readily and regularly available from an exchange, dealer, broker, industry group, pricing service, or regulatory agency and those prices represent actual and regularly occurring market transactions on an arm’s length basis.
Level 2 financial instrumentsThe fair value of financial instruments that are not traded in an active market is determined by using valuation techniques. These valuation techniques maximise the use of observable market data where it is available and rely as little as possible on entity specific estimates. If all significant inputs required to fair value an instrument are observable, the instrument is included in Level 2. The fair value of forward foreign exchange contracts is determined using quoted forward exchange rates at the reporting date and yield curves derived from quoted interest rates matching the maturities of the foreign exchange contracts.
Level 3 financial instrumentsIf one or more of the significant inputs is not based on observable market data, the instrument is included in Level 3.
Specific valuation techniques used to value financial instruments include:
• quoted market prices or dealer quotes for similar instruments;
• the fair value of interest rate swaps is calculated as the present value of the estimated future cash flows based on observable yield curves;
• the fair value of forward foreign exchange contracts is determined using forward exchange rates at the balance sheet date, with the resulting value discounted back to the present value;
• other techniques, such as discounted cash flow analysis, are used to determine fair value for the remaining financial instruments.
3 Critical accounting estimates and judgementsThe Group makes estimates and assumptions concerning the future. The resulting accounting estimates will, by definition, seldom equal the related actual results. The estimates and assumptions that have a significant risk of causing a material adjustment to the carrying amounts of assets and liabilities within the next financial year are addressed below.
Contract accountingThe Group’s revenue accounting policy is central to how the Group values the work it has carried out in each financial year. This policy requires forecasts to be made on the current percentage complete and the projected outcomes of projects. These forecasts require assessments and judgements to be made on changes in, for example, percentage completion, work scope and costs to completion. While the assumptions made are based on professional judgements, subsequent events may mean that calculated estimates prove to be inaccurate, with a consequent effect on the reported result.
Income taxesThe Group is subject to income taxes in numerous jurisdictions. Significant judgement is required in determining the worldwide provision for income taxes. The Group provides for potential liabilities in respect of uncertain tax positions where additional tax may become payable in future periods and such provisions are based on management’s assessment of exposures.
Defined benefit pension schemesThe present value of the pension obligations depends on a number of factors that are determined on an actuarial basis using a number of assumptions. The assumptions used in determining the net cost / (income) for pensions include the discount rate. Any changes in these assumptions will impact the carrying amount of pension obligations. An estimate of the sensitivity to changes in key assumptions is disclosed in note 29.
Capital risk managementThe Group is a long-term business, held in trust for the principal benefit of its employees. The Group’s objectives when managing capital (defined as net debt plus equity) are to safeguard its ability to continue as a going concern, provide returns for its employees and to avoid debt funding. This ownership model means that it is not able to raise equity externally.
The Group manages capital to ensure an appropriate balance between investing in employees, clients and profit. At 31 March 2016 the Group had no external borrowings (2015: £15.0m).
Fair value estimationThe table below analyses financial instruments carried at fair value, by valuation method. The different levels have been defined as follows:
• quoted prices (unadjusted) in active markets for identical assets or liabilities (Level 1)
• inputs other than quoted prices included within Level 1 that are observable for the asset or liability, either directly (that is, as prices) or indirectly (that is, derived from prices) (Level 2)
• Inputs for the asset or liability that are not based on observable market data (that is, unobservable inputs) (Level 3).
Notes to the financial statements for the year ended 31 March 2016Notes to the financial statements for the year ended 31 March 2016
Arup Group Limited and its subsidiary undertakings | Financial Statements and Reports for the year ended 31 March 2016Arup Group Limited and its subsidiary undertakings | Financial Statements and Reports for the year ended 31 March 2016
22 23
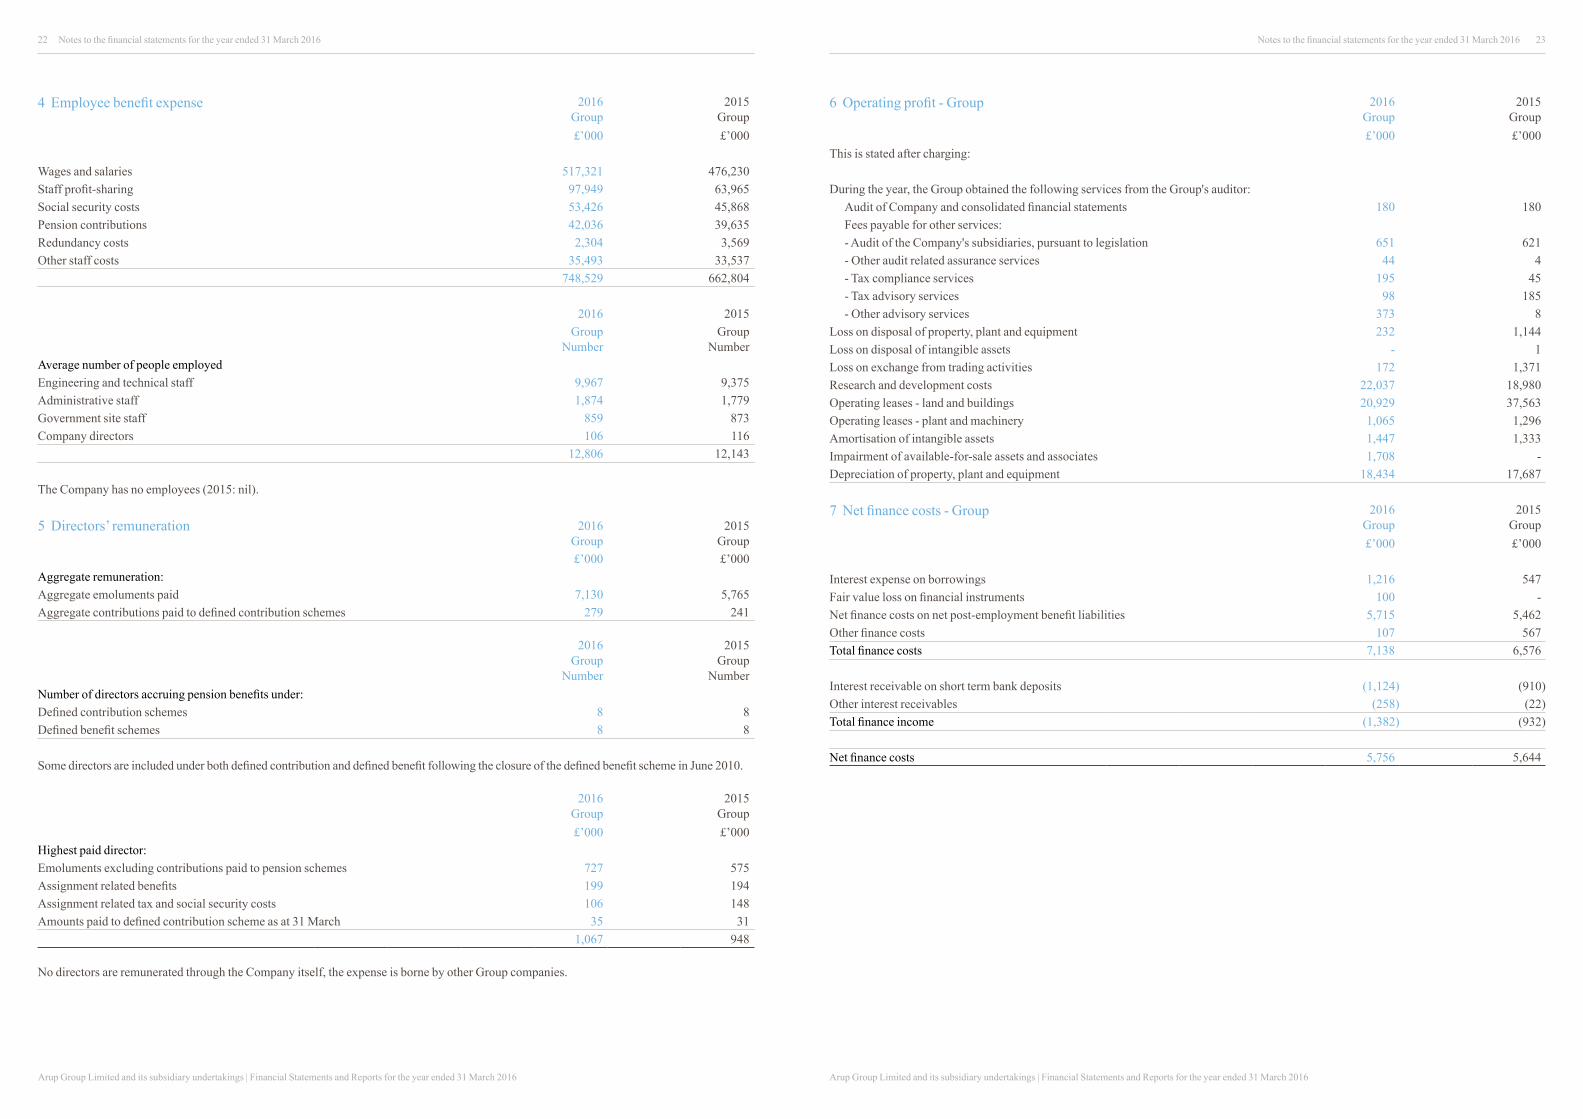
4 Employee benefit expense 2016 Group
2015 Group
£’000 £’000
Wages and salaries 517,321 476,230 Staff profit-sharing 97,949 63,965 Social security costs 53,426 45,868 Pension contributions 42,036 39,635 Redundancy costs 2,304 3,569 Other staff costs 35,493 33,537
748,529 662,804
2016 2015 Group
NumberGroup
NumberAverage number of people employedEngineering and technical staff 9,967 9,375 Administrative staff 1,874 1,779 Government site staff 859 873 Company directors 106 116
12,806 12,143
The Company has no employees (2015: nil).
5 Directors’ remuneration 2016 Group
2015 Group
£’000 £’000Aggregate remuneration:Aggregate emoluments paid 7,130 5,765Aggregate contributions paid to defined contribution schemes 279 241
2016 Group
Number
2015 Group
NumberNumber of directors accruing pension benefits under:Defined contribution schemes 8 8Defined benefit schemes 8 8
Some directors are included under both defined contribution and defined benefit following the closure of the defined benefit scheme in June 2010.
2016 Group
2015 Group
£’000 £’000Highest paid director:Emoluments excluding contributions paid to pension schemes 727 575 Assignment related benefits 199 194 Assignment related tax and social security costs 106 148 Amounts paid to defined contribution scheme as at 31 March 35 31
1,067 948
No directors are remunerated through the Company itself, the expense is borne by other Group companies.
6 Operating profit - Group 2016 Group
2015 Group
£’000 £’000This is stated after charging:
During the year, the Group obtained the following services from the Group's auditor:Audit of Company and consolidated financial statements 180 180 Fees payable for other services:- Audit of the Company's subsidiaries, pursuant to legislation 651 621 - Other audit related assurance services 44 4 - Tax compliance services 195 45 - Tax advisory services 98 185 - Other advisory services 373 8
Loss on disposal of property, plant and equipment 232 1,144 Loss on disposal of intangible assets - 1 Loss on exchange from trading activities 172 1,371 Research and development costs 22,037 18,980 Operating leases - land and buildings 20,929 37,563 Operating leases - plant and machinery 1,065 1,296 Amortisation of intangible assets 1,447 1,333 Impairment of available-for-sale assets and associates 1,708 -Depreciation of property, plant and equipment 18,434 17,687
7 Net finance costs - Group 2016 Group
2015 Group
£’000 £’000
Interest expense on borrowings 1,216 547Fair value loss on financial instruments 100 - Net finance costs on net post-employment benefit liabilities 5,715 5,462Other finance costs 107 567Total finance costs 7,138 6,576
Interest receivable on short term bank deposits (1,124) (910) Other interest receivables (258) (22)Total finance income (1,382) (932)
Net finance costs 5,756 5,644
Notes to the financial statements for the year ended 31 March 2016Notes to the financial statements for the year ended 31 March 2016

Arup Group Limited and its subsidiary undertakings | Financial Statements and Reports for the year ended 31 March 2016Arup Group Limited and its subsidiary undertakings | Financial Statements and Reports for the year ended 31 March 2016
24 25
8 Income tax expense 2016 2015£’000 £’000
(a) Analysis of tax charge
Current income tax- current tax on profits for the year 9,709 10,669 - adjustments in respect of prior years (488) (292)
Total current tax 9,221 10,377
Deferred tax (note 22)- origination and reversal of temporary differences (1,996) 343 - effect of changes in tax rates - - - over/(under) provision of deferred tax in respect of prior years (1,217) 96
Total deferred tax (3,213) 439
Income tax expense 6,008 10,816
(b) Factors affecting the tax charge for the year
The tax assessed for the year is higher (2015: higher) than the standard rate of corporation tax in the UK 20% (2015: 21%). The differences are explained below:
2016 2015£’000 £’000
Profit before income tax 22,064 19,019
Profit multiplied by the standard rate of corporation tax in the UK 4,413 3,994
Effects of:Income not subject to tax (776) (1,891)Expenses not deductible for tax purposes 4,047 5,179 Research and development tax credits (1,322) (1,196)Property, plant and equipment 100 235 Employee related provisions (186) 110 Impact of overseas tax 3,104 2,614 Tax increase arising from overseas tax suffered 68 142 Utilisation of tax losses (3,277) (178)Tax losses for which no deferred income tax asset was recognised 2,143 2 Adjustment in respect of prior years (1,767) (48)Unrelieved losses carried forward 410 491 Other (949) 1,362
Current tax charge 6,008 10,816
8 Income tax expense (continued)(c) Factors affecting current and future tax charges
Effective from 1 April 2015 the UK main corporation tax rate was 20% and this has been reflected in the financial statements. The rate of UK corporation tax will change from 20% to 19% on 1 April 2017 and to 18% on 1 April 2020. As deferred tax assets and liabilities are measured at the rates that are expected to apply in the periods of the reversal, deferred tax balances at 31 March 2016 have been calculated at the rate at which the relevant balance is expected to be recovered or settled. Further changes to the UK corporate tax rates were announced in the Chancellors Budget on 16 March 2016 which includes a reduction of the UK corporate rate to 17% on 1 April 2020. This will replace the 18% UK corporation tax rate that is currently legislated to take effect. As this change has not been substantively enacted at the balance sheet date its effect has not been included in these financial statements.
For the year ending 31 March 2016 local tax rates have been used to calculate deferred tax assets or liabilities.
9 Intangible assets
Group Computer
software£’000
Cost at 1 April 2014 16,670 Additions 2,176 Disposals (61)Adjustment for exchange differences 67 Balance at 31 March 2015 18,852
Additions 1,508 Disposals (6,285)Adjustment for exchange differences 337 Balance at 31 March 2016 14,412
Accumulated amortisation at 1 April 2014 14,285 Charge for the year 1,333 Disposals (59)Adjustment for exchange differences 23 Balance at 31 March 2015 15,582
Charge for the year 1,447 Disposals (6,285)Adjustment for exchange differences 291 Balance at 31 March 2016 11,035
Net book value at 31 March 2016 3,377 Net book value at 31 March 2015 3,270
The Company has no intangible assets.
Notes to the financial statements for the year ended 31 March 2016Notes to the financial statements for the year ended 31 March 2016
Arup Group Limited and its subsidiary undertakings | Financial Statements and Reports for the year ended 31 March 2016Arup Group Limited and its subsidiary undertakings | Financial Statements and Reports for the year ended 31 March 2016
26 27
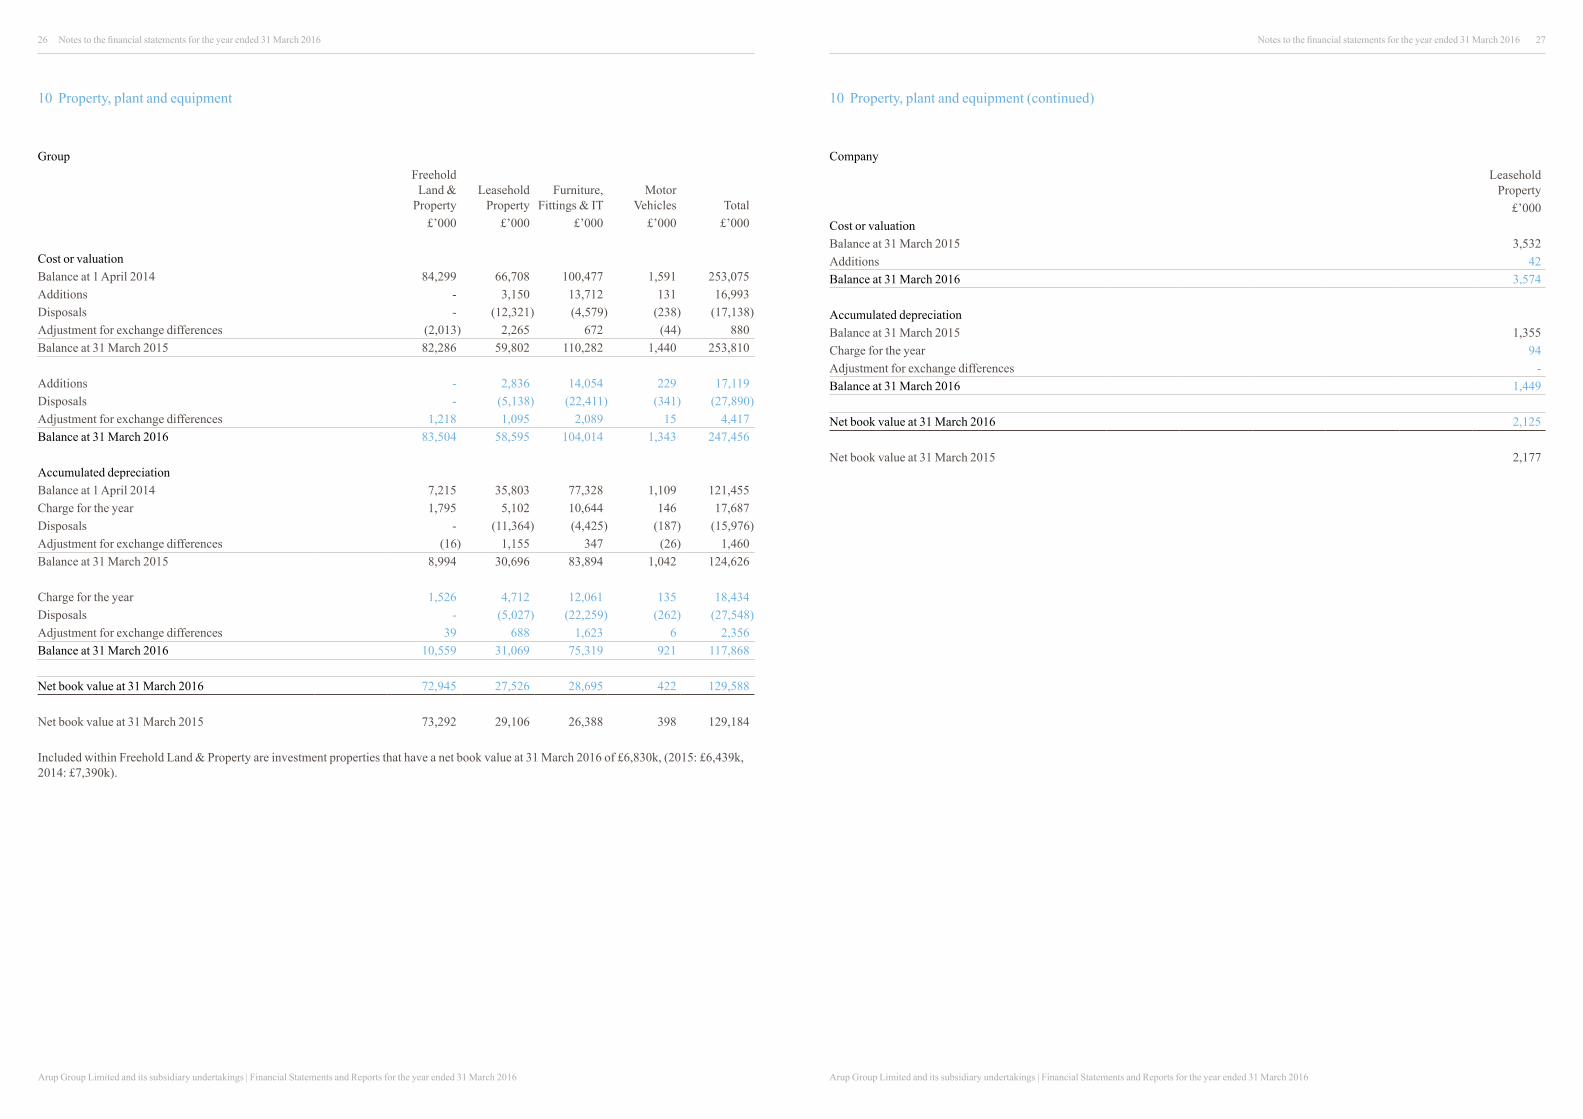
10 Property, plant and equipment
GroupFreehold
Land & Property
Leasehold Property
Furniture, Fittings & IT
Motor Vehicles Total
£’000 £’000 £’000 £’000 £’000
Cost or valuationBalance at 1 April 2014 84,299 66,708 100,477 1,591 253,075 Additions - 3,150 13,712 131 16,993 Disposals - (12,321) (4,579) (238) (17,138)Adjustment for exchange differences (2,013) 2,265 672 (44) 880 Balance at 31 March 2015 82,286 59,802 110,282 1,440 253,810
Additions - 2,836 14,054 229 17,119 Disposals - (5,138) (22,411) (341) (27,890)Adjustment for exchange differences 1,218 1,095 2,089 15 4,417 Balance at 31 March 2016 83,504 58,595 104,014 1,343 247,456
Accumulated depreciationBalance at 1 April 2014 7,215 35,803 77,328 1,109 121,455 Charge for the year 1,795 5,102 10,644 146 17,687 Disposals - (11,364) (4,425) (187) (15,976)Adjustment for exchange differences (16) 1,155 347 (26) 1,460 Balance at 31 March 2015 8,994 30,696 83,894 1,042 124,626
Charge for the year 1,526 4,712 12,061 135 18,434 Disposals - (5,027) (22,259) (262) (27,548)Adjustment for exchange differences 39 688 1,623 6 2,356 Balance at 31 March 2016 10,559 31,069 75,319 921 117,868
Net book value at 31 March 2016 72,945 27,526 28,695 422 129,588
Net book value at 31 March 2015 73,292 29,106 26,388 398 129,184
Included within Freehold Land & Property are investment properties that have a net book value at 31 March 2016 of £6,830k, (2015: £6,439k, 2014: £7,390k).
Notes to the financial statements for the year ended 31 March 2016Notes to the financial statements for the year ended 31 March 2016
10 Property, plant and equipment (continued)
CompanyLeasehold
Property£’000
Cost or valuationBalance at 31 March 2015 3,532 Additions 42 Balance at 31 March 2016 3,574
Accumulated depreciationBalance at 31 March 2015 1,355 Charge for the year 94 Adjustment for exchange differences - Balance at 31 March 2016 1,449
Net book value at 31 March 2016 2,125
Net book value at 31 March 2015 2,177

Arup Group Limited and its subsidiary undertakings | Financial Statements and Reports for the year ended 31 March 2016Arup Group Limited and its subsidiary undertakings | Financial Statements and Reports for the year ended 31 March 2016
28 29
Indirect holdings (continued): Country of incorporation
Arup North America Limited England & WalesArup Pacific Pty Limited AustraliaArup Projects 'A' Ltd England & WalesArup Projects 'A' Limited Hong KongArup Projects A Pty Ltd AustraliaArup Pty Limited AustraliaArup Riyadh Metro Limited England & WalesArup Services B.V. NetherlandsArup Services New York Limited England & WalesArup - S.I.G.M.A. Ltd MauritiusArup Singapore Private Limited SingaporeArup Texas Inc. USAArup Treasury Limited England & WalesArup USA Inc. USAArup Vietnam Limited VietnamBabylon Investment Company IrelandFitzroy Insurance Services Limited GuernseyFitzroy Property Guernsey Limited GuernseyFitzroy Street Limited England & WalesNetworked Electricity Storage Technology Limited (60% holding) England & WalesOASYS Limited England & WalesOvarpart Nominee Limited England & WalesOve Arup Limited England & WalesOve Arup & Partners Danmark A/S DenmarkOve Arup & Partners Hong Kong Limited England & WalesOve Arup & Partners International Limited England & WalesOve Arup & Partners Ireland Limited IrelandOve Arup & Partners Japan Limited England & WalesOve Arup & Partners Korea Limited KoreaOve Arup & Partners Limited England & WalesOve Arup & Partners PC USAOve Arup & Partners Poland Sp. z o. o. PolandOve Arup & Partners S.A.U. SpainOve Arup & Partners Scotland Limited ScotlandOve Arup (Thailand) Limited ThailandPT Arup Indonesia IndonesiaScotstoun Property Limited England & WalesShelbourne Plaza (Block C) Management Company Limited (78% holding) IrelandWilliamsburg Investment Company Ireland
Direct holdings: Country of incorporation
Arup Americas Inc. USAArup GmbH ≥ GermanyArup International Consultants (Shanghai) Co., Ltd ChinaArup Ireland Limited IrelandArup Partner Pty Limited AustraliaArup (Pty) Limited (70% holding) South AfricaOve Arup Holdings B.V. NetherlandsOve Arup Holdings Limited England & WalesOve Arup Holdings Private Limited SingaporeOve Arup International (Holdings) Limited Hong KongOve Arup Partnership Limited England & Wales
Indirect holdings:Arup Advisory Inc. USAArup Associates Limited England & WalesArup Botswana Limited England & WalesArup Brasil Consultoria Ltda BrazilArup B.V. NetherlandsArup (Cambodia) Limited CambodiaArup Canada Inc. CanadaArup China Limited Hong KongArup Colombia S.A.S. ColombiaArup Corporate Finance Limited England & WalesArup Deutschland GmbH GermanyArup d.o.o. SerbiaArup East Africa Limited KenyaArup Government Projects Inc. USAArup Gulf Limited England & WalesArup India Private Limited IndiaArup Ingeniería y Consultoría Mexico, S. de R.L. de C.V. MexicoArup International Limited England & WalesArup Ireland Incorporated IrelandArup Ireland Partner Limited IrelandArup Italia S.r.l. ItalyArup Latin America S.A.U. SpainArup Limited England & WalesArup (Luxembourg) S.a.r.l. LuxembourgArup Muhendislik ve Musavirlik Limited Sirketi TurkeyArup New Zealand Limited New Zealand
Key≥ Companies in the process of being liquidated
11 Investments in subsidiaries (continued)Cost
Investment Impairment Net Value
Movement of investment £’000 £’000 £’000
Balance as at 1 April 2014 173,354 (17,336) 156,018 Additions / recapitalisations 7,391 - 7,391 Disposals - (4,991) (4,991)Balance as at 31 March 2015 180,745 (22,327) 158,418
Disposals (275) - (275)Balance as at 31 March 2016 180,470 (22,327) 158,143
The directors believe that the carrying value of the investments are supported by their underlying net assets.
12 Investments in associates 2016 2015Group Group£’000 £’000
Balance as at 1 April 411 309 Share of (loss) / profit (19) 22 Increase in investment - 80 Impairment (392) - Balance as at 31 March - 411
During the year ending 31 March 2016 the Group’s investment in MBK Arup Sustainable Projects Limited was fully impaired. This is the Group’s sole associate. The Company has no investments in associates (2015: nil).
13 Available-for-sale financial assets
Group2016 2015
Movement of unlisted investments at cost £’000 £’000
Opening balance at 1 April 1,220 254Additions 100 966Impairment (1,316) - Balance at 31 March 4 1,220
During the year the investments in Arup Zimbabwe (Private) Limited and eFleet Integrated Service Limited were fully impaired. The directors believe that the carrying value of the remaining investments is supported by their underlying net assets.There is no exposure to credit risk and none of the remaining assets are either past due or impaired.
Company2016 2015
Movement of unlisted investments at cost £’000 £’000
Balance at 1 April and 31 March 4 4
The directors believe that the carrying value of the investments is supported by their underlying net assets.
Notes to the financial statements for the year ended 31 March 2016Notes to the financial statements for the year ended 31 March 2016
11 Investments in subsidiaries Arup Group Limited owns ordinary and preference shares in the companies noted below. These companies were all wholly owned subsidiary undertakings of Arup Group Limited at 31 March 2016 (unless otherwise stated), and their results are consolidated into the financial statements of Arup Group Limited. The operating companies were all engaged in the same principal activities as the Group, except for Arup Ireland Limited, Arup (Luxembourg) S.a.r.l., Fitzroy Property Guernsey Limited, Fitzroy Street Limited and Scotstoun Property Limited whose principal activities are property holdings; Fitzroy Insurance Services Limited whose principal activity is insurance services; and Arup Treasury Limited whose principal activity is group treasury.
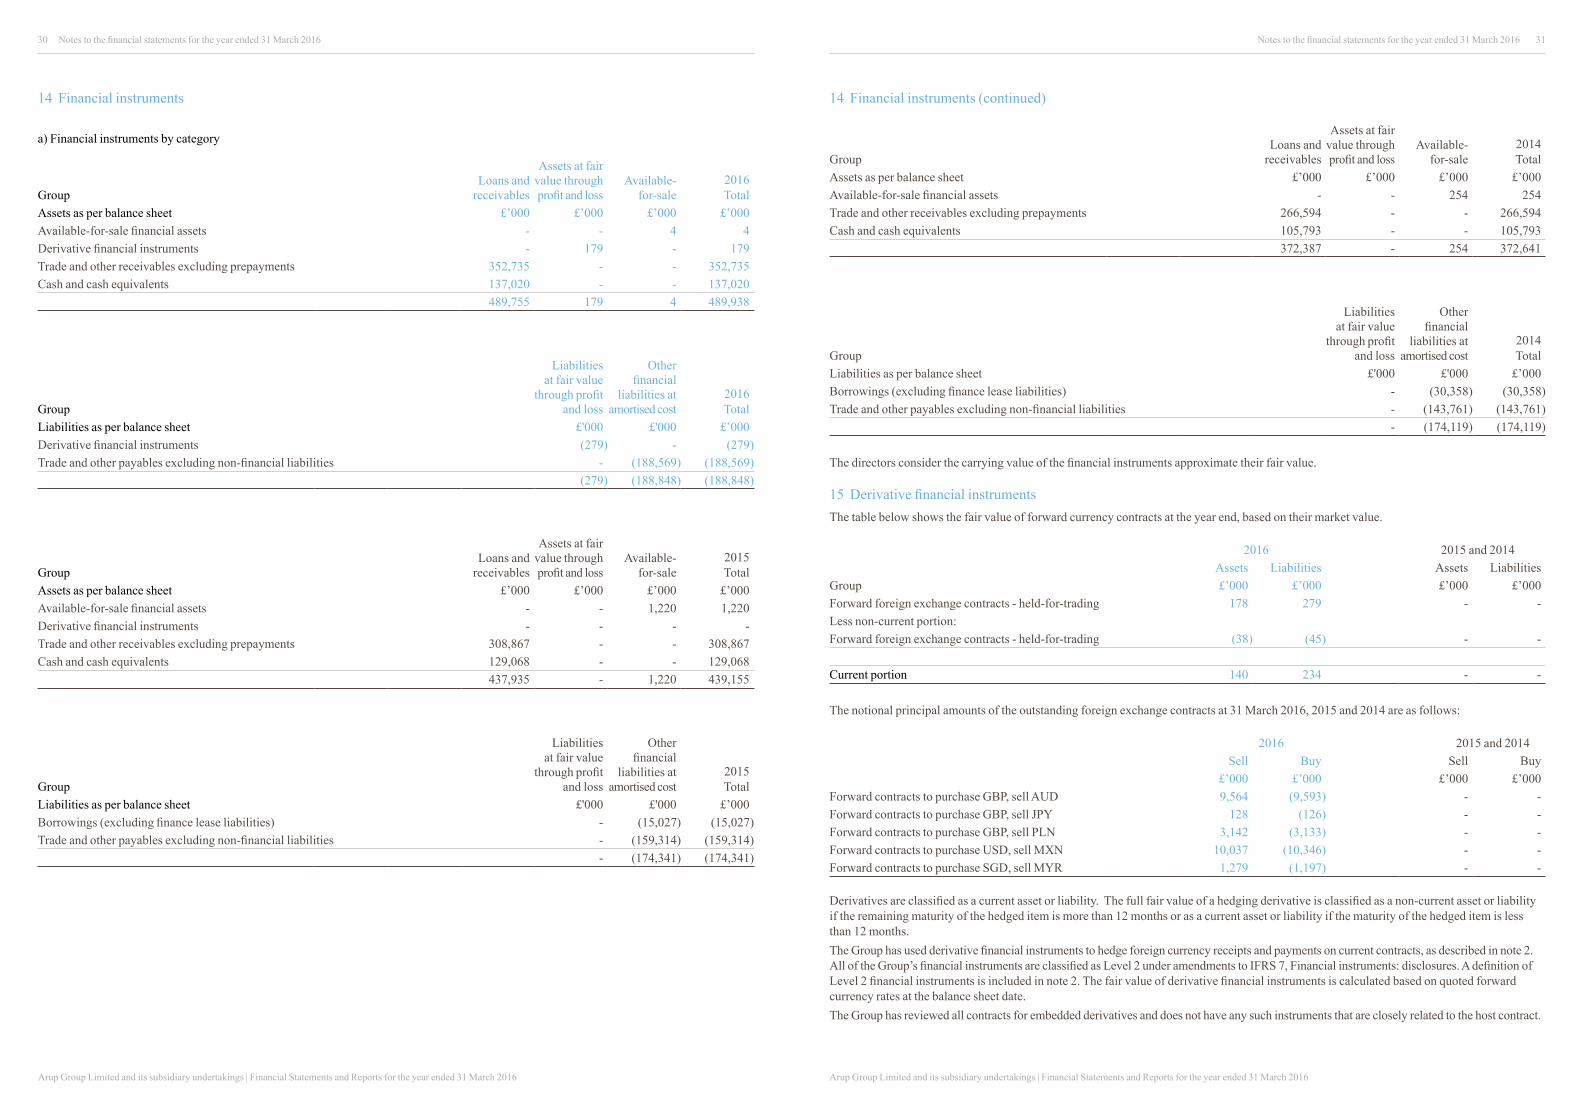
Arup Group Limited and its subsidiary undertakings | Financial Statements and Reports for the year ended 31 March 2016Arup Group Limited and its subsidiary undertakings | Financial Statements and Reports for the year ended 31 March 2016
30 31
14 Financial instruments
a) Financial instruments by category
GroupLoans and
receivables
Assets at fair value through profit and loss
Available-for-sale
2016 Total
Assets as per balance sheet £’000 £’000 £’000 £’000Available-for-sale financial assets - - 4 4 Derivative financial instruments - 179 - 179 Trade and other receivables excluding prepayments 352,735 - - 352,735 Cash and cash equivalents 137,020 - - 137,020
489,755 179 4 489,938
Group
Liabilities at fair value
through profit and loss
Other financial
liabilities at amortised cost
2016 Total
Liabilities as per balance sheet £'000 £'000 £’000Derivative financial instruments (279) - (279)Trade and other payables excluding non-financial liabilities - (188,569) (188,569)
(279) (188,848) (188,848)
GroupLoans and
receivables
Assets at fair value through profit and loss
Available-for-sale
2015 Total
Assets as per balance sheet £’000 £’000 £’000 £’000Available-for-sale financial assets - - 1,220 1,220Derivative financial instruments - - - -Trade and other receivables excluding prepayments 308,867 - - 308,867 Cash and cash equivalents 129,068 - - 129,068
437,935 - 1,220 439,155
Group
Liabilities at fair value
through profit and loss
Other financial
liabilities at amortised cost
2015 Total
Liabilities as per balance sheet £'000 £'000 £’000Borrowings (excluding finance lease liabilities) - (15,027) (15,027)Trade and other payables excluding non-financial liabilities - (159,314) (159,314)
- (174,341) (174,341)
14 Financial instruments (continued)
GroupLoans and
receivables
Assets at fair value through profit and loss
Available-for-sale
2014 Total
Assets as per balance sheet £’000 £’000 £’000 £’000Available-for-sale financial assets - - 254 254 Trade and other receivables excluding prepayments 266,594 - - 266,594 Cash and cash equivalents 105,793 - - 105,793
372,387 - 254 372,641
Group
Liabilities at fair value
through profit and loss
Other financial
liabilities at amortised cost
2014 Total
Liabilities as per balance sheet £'000 £'000 £’000Borrowings (excluding finance lease liabilities) - (30,358) (30,358)Trade and other payables excluding non-financial liabilities - (143,761) (143,761)
- (174,119) (174,119)
The directors consider the carrying value of the financial instruments approximate their fair value.
15 Derivative financial instrumentsThe table below shows the fair value of forward currency contracts at the year end, based on their market value.
2016 2015 and 2014Assets Liabilities Assets Liabilities
Group £’000 £’000 £’000 £’000Forward foreign exchange contracts - held-for-trading 178 279 - - Less non-current portion:Forward foreign exchange contracts - held-for-trading (38) (45) - -
Current portion 140 234 - -
The notional principal amounts of the outstanding foreign exchange contracts at 31 March 2016, 2015 and 2014 are as follows:
2016 2015 and 2014Sell Buy Sell Buy
£’000 £’000 £’000 £’000Forward contracts to purchase GBP, sell AUD 9,564 (9,593) - - Forward contracts to purchase GBP, sell JPY 128 (126) - - Forward contracts to purchase GBP, sell PLN 3,142 (3,133) - - Forward contracts to purchase USD, sell MXN 10,037 (10,346) - - Forward contracts to purchase SGD, sell MYR 1,279 (1,197) - -
Derivatives are classified as a current asset or liability. The full fair value of a hedging derivative is classified as a non-current asset or liability if the remaining maturity of the hedged item is more than 12 months or as a current asset or liability if the maturity of the hedged item is less than 12 months.The Group has used derivative financial instruments to hedge foreign currency receipts and payments on current contracts, as described in note 2. All of the Group’s financial instruments are classified as Level 2 under amendments to IFRS 7, Financial instruments: disclosures. A definition of Level 2 financial instruments is included in note 2. The fair value of derivative financial instruments is calculated based on quoted forward currency rates at the balance sheet date.The Group has reviewed all contracts for embedded derivatives and does not have any such instruments that are closely related to the host contract.
Notes to the financial statements for the year ended 31 March 2016Notes to the financial statements for the year ended 31 March 2016

Arup Group Limited and its subsidiary undertakings | Financial Statements and Reports for the year ended 31 March 2016Arup Group Limited and its subsidiary undertakings | Financial Statements and Reports for the year ended 31 March 2016
32 33
16 Trade and other receivables2016 2015
1 April 2014
Group Company Group Company Group£’000 £’000 £’000 £’000 £’000
Trade receivables 239,788 - 194,834 - 181,312 Less: Provision for impairment of trade receivables (19,183) - (16,428) - (15,058) Trade receivables - net 220,605 - 178,406 - 166,254 Amounts recoverable on contracts 103,731 - 99,206 - 75,312 Amounts due from Group undertakings - 27,849 - 10,819 - Foreign tax recoverable 3,217 - 1,793 - 2,242 Deferred tax asset 4,363 - 2,707 - 3,980 Corporation tax 3,026 - 3,026 - 1,526 Other receivables 17,793 272 23,729 390 17,281 Prepayments and accrued income 28,457 - 33,924 - 31,119
381,192 28,121 342,791 11,209 297,714
Amounts due from Group undertakings are unsecured, interest free, have no date of repayment and are repayable on demand.
The directors consider that the carrying value of trade and other receivables approximate their fair value.
Group At 31 March 2016, £110,470k (2015: £91,570k; 2014: £86,123k) of Group trade receivables were within normal payment terms and considered to be fully performing.
At 31 March 2016, £129,317k (2015: £103,264k; 2014: £95,189k) of Group trade receivables were past due but not impaired. The ageing analysis of these trade receivables is as follows:
Gross trade receivables Provisions for impairment
2016 20151 April
2014 2016 20151 April
2014£’000 £’000 £’000 £’000 £’000 £’000
Past due - 3 months 96,665 70,829 65,290 (3,374) (703) (644)3 - 6 months 14,875 12,546 11,565 (1,661) (1,754) (1,608) Over 6 months 17,778 19,889 18,334 (14,148) (13,971) (12,806)
129,318 103,264 95,189 (19,183) (16,428) (15,058)
The carrying amounts of the Group’s trade and other receivables are denominated in the following currencies:
2016 20151 April
2014£’000 £’000 £’000
British pounds 106,681 104,759 79,976 US dollar 63,454 52,930 51,285 Hong Kong dollar 46,964 47,000 42,918 Euro 37,972 32,369 25,541 Australian dollar 26,296 21,872 21,964 Chinese renminbi 24,405 24,526 21,555 Singaporean dollar 13,803 12,686 12,243 Qatari riyal 8,390 6,017 2,326 Mexican peso 7,891 - - South African rand 7,039 9,750 8,936 Emirati dirham 5,974 - - Canadian dollar 5,625 5,832 6,773 Other 26,698 25,050 24,197
381,192 342,791 297,714
16 Trade and other receivables (continued)Movements on the Group provision for impairment of trade receivables are as follows:
2016 2015£’000 £’000
At 1 April 16,428 15,058 Increase in provisions 10,208 8,787 Release of provisions (6,694) (6,364) Receivables written off as uncollectible (978) (1,734)Difference on exchange 219 681 Provision for impairment at 31 March 19,183 16,428
The maximum exposure to credit risk at the reporting date is the carrying value of each class of receivable mentioned above. The Group does not hold any collateral as security.
17 Cash and cash equivalents2016 2015
1 April 2014
Group Company Group Company Group£’000 £’000 £’000 £’000 £’000
Cash at bank and in hand 40,205 17 33,460 32 63,278 Short-term bank deposits 96,815 - 95,619 - 42,605
137,020 17 129,079 32 105,883
18 Borrowings2016 2015
1 April 2014
Group Company Group Company GroupCurrent £’000 £’000 £’000 £’000 £’000
Bank overdraft - - 26 - 358 - - 26 - 358
Non-currentBank loan - - 15,001 15,001 30,000
- - 15,001 15,001 30,000 Total borrowings - - 15,027 15,001 30,358
The carrying amounts and fair value of the non-current borrowings are as follows:
2016 20151 April
2014Group Company Group Company Group£’000 £’000 £’000 £’000 £’000
Bank loan - - 15,001 15,001 30,000 Bank overdraft - - 26 - 358
- - 15,027 15,001 30,358
Notes to the financial statements for the year ended 31 March 2016Notes to the financial statements for the year ended 31 March 2016
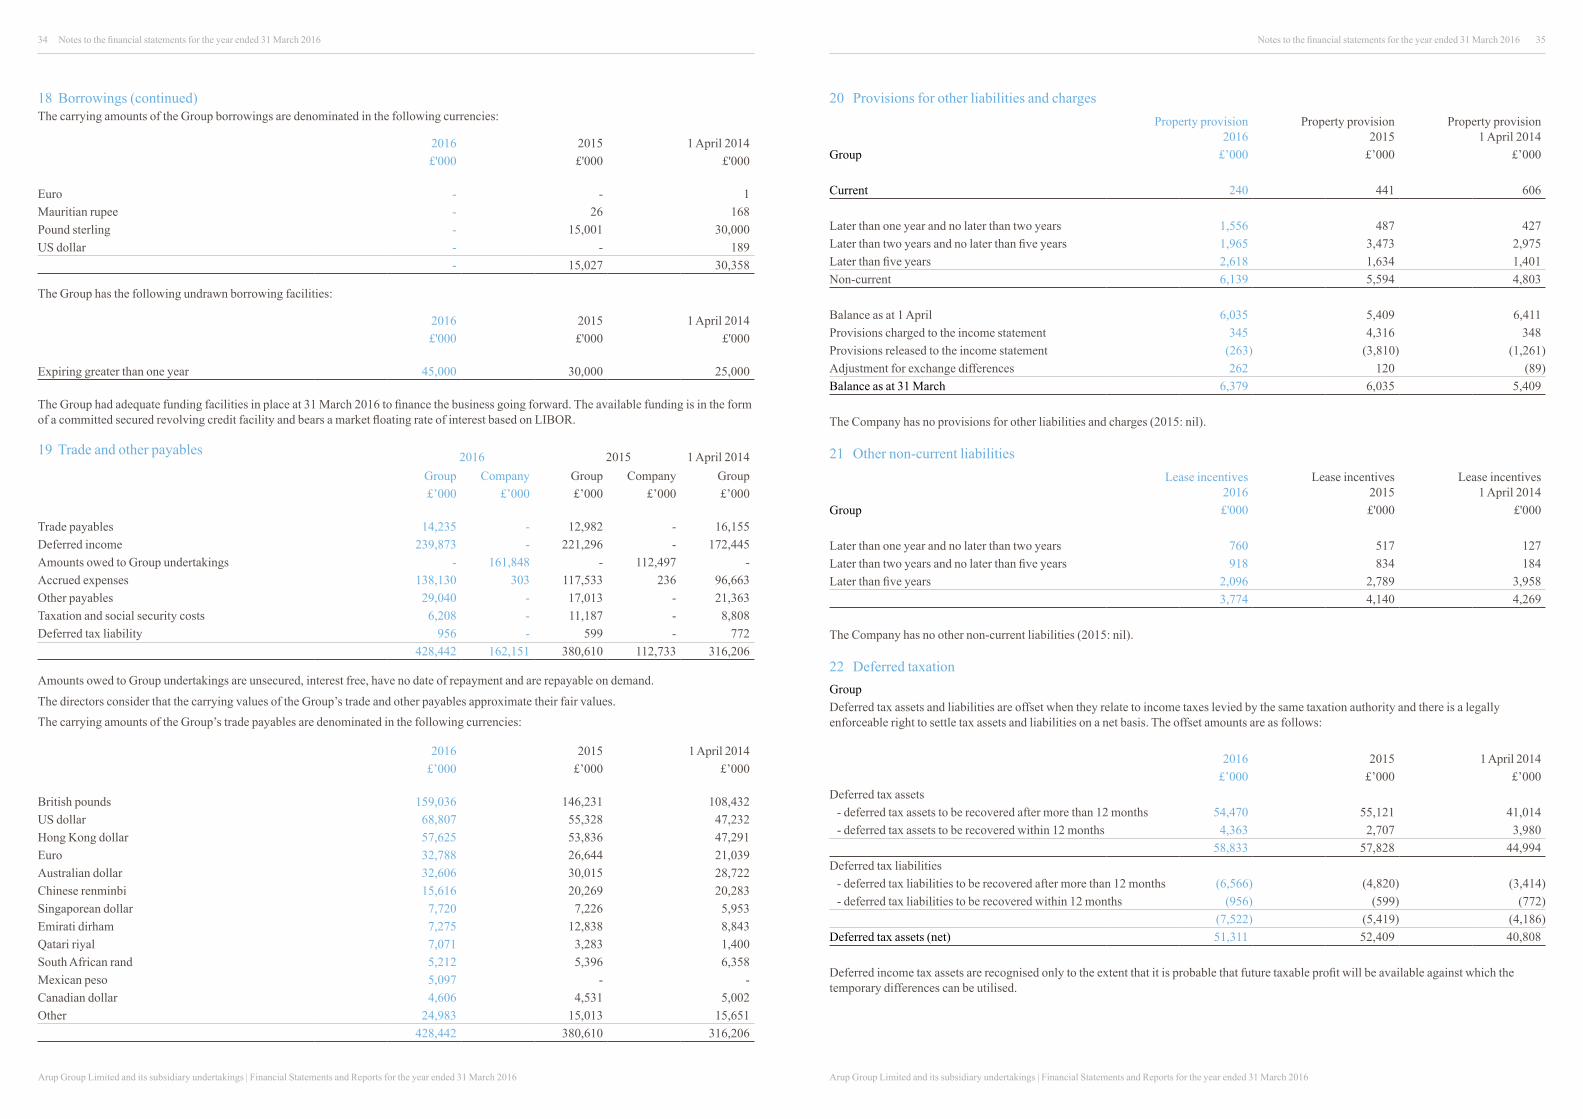
Arup Group Limited and its subsidiary undertakings | Financial Statements and Reports for the year ended 31 March 2016Arup Group Limited and its subsidiary undertakings | Financial Statements and Reports for the year ended 31 March 2016
34 35
18 Borrowings (continued)The carrying amounts of the Group borrowings are denominated in the following currencies:
2016 2015 1 April 2014£'000 £'000 £'000
Euro - - 1 Mauritian rupee - 26 168 Pound sterling - 15,001 30,000 US dollar - - 189
- 15,027 30,358
The Group has the following undrawn borrowing facilities:
2016 2015 1 April 2014£'000 £'000 £'000
Expiring greater than one year 45,000 30,000 25,000
The Group had adequate funding facilities in place at 31 March 2016 to finance the business going forward. The available funding is in the form of a committed secured revolving credit facility and bears a market floating rate of interest based on LIBOR.
19 Trade and other payables 2016 2015 1 April 2014Group Company Group Company Group£’000 £’000 £’000 £’000 £’000
Trade payables 14,235 - 12,982 - 16,155 Deferred income 239,873 - 221,296 - 172,445 Amounts owed to Group undertakings - 161,848 - 112,497 - Accrued expenses 138,130 303 117,533 236 96,663 Other payables 29,040 - 17,013 - 21,363 Taxation and social security costs 6,208 - 11,187 - 8,808 Deferred tax liability 956 - 599 - 772
428,442 162,151 380,610 112,733 316,206
Amounts owed to Group undertakings are unsecured, interest free, have no date of repayment and are repayable on demand.
The directors consider that the carrying values of the Group’s trade and other payables approximate their fair values.The carrying amounts of the Group’s trade payables are denominated in the following currencies:
2016 2015 1 April 2014£’000 £’000 £’000
British pounds 159,036 146,231 108,432 US dollar 68,807 55,328 47,232 Hong Kong dollar 57,625 53,836 47,291 Euro 32,788 26,644 21,039 Australian dollar 32,606 30,015 28,722 Chinese renminbi 15,616 20,269 20,283 Singaporean dollar 7,720 7,226 5,953 Emirati dirham 7,275 12,838 8,843 Qatari riyal 7,071 3,283 1,400 South African rand 5,212 5,396 6,358 Mexican peso 5,097 - - Canadian dollar 4,606 4,531 5,002 Other 24,983 15,013 15,651
428,442 380,610 316,206
20 Provisions for other liabilities and chargesProperty provision
2016Property provision
2015Property provision
1 April 2014 Group £’000 £’000 £’000
Current 240 441 606
Later than one year and no later than two years 1,556 487 427 Later than two years and no later than five years 1,965 3,473 2,975 Later than five years 2,618 1,634 1,401 Non-current 6,139 5,594 4,803
Balance as at 1 April 6,035 5,409 6,411 Provisions charged to the income statement 345 4,316 348 Provisions released to the income statement (263) (3,810) (1,261) Adjustment for exchange differences 262 120 (89) Balance as at 31 March 6,379 6,035 5,409
The Company has no provisions for other liabilities and charges (2015: nil).
21 Other non-current liabilitiesLease incentives
2016Lease incentives
2015Lease incentives
1 April 2014Group £'000 £'000 £'000
Later than one year and no later than two years 760 517 127Later than two years and no later than five years 918 834 184Later than five years 2,096 2,789 3,958
3,774 4,140 4,269
The Company has no other non-current liabilities (2015: nil).
22 Deferred taxationGroup Deferred tax assets and liabilities are offset when they relate to income taxes levied by the same taxation authority and there is a legally enforceable right to settle tax assets and liabilities on a net basis. The offset amounts are as follows:
2016 2015 1 April 2014£’000 £’000 £’000
Deferred tax assets - deferred tax assets to be recovered after more than 12 months 54,470 55,121 41,014 - deferred tax assets to be recovered within 12 months 4,363 2,707 3,980
58,833 57,828 44,994 Deferred tax liabilities
- deferred tax liabilities to be recovered after more than 12 months (6,566) (4,820) (3,414) - deferred tax liabilities to be recovered within 12 months (956) (599) (772)
(7,522) (5,419) (4,186) Deferred tax assets (net) 51,311 52,409 40,808
Deferred income tax assets are recognised only to the extent that it is probable that future taxable profit will be available against which the temporary differences can be utilised.
Notes to the financial statements for the year ended 31 March 2016Notes to the financial statements for the year ended 31 March 2016
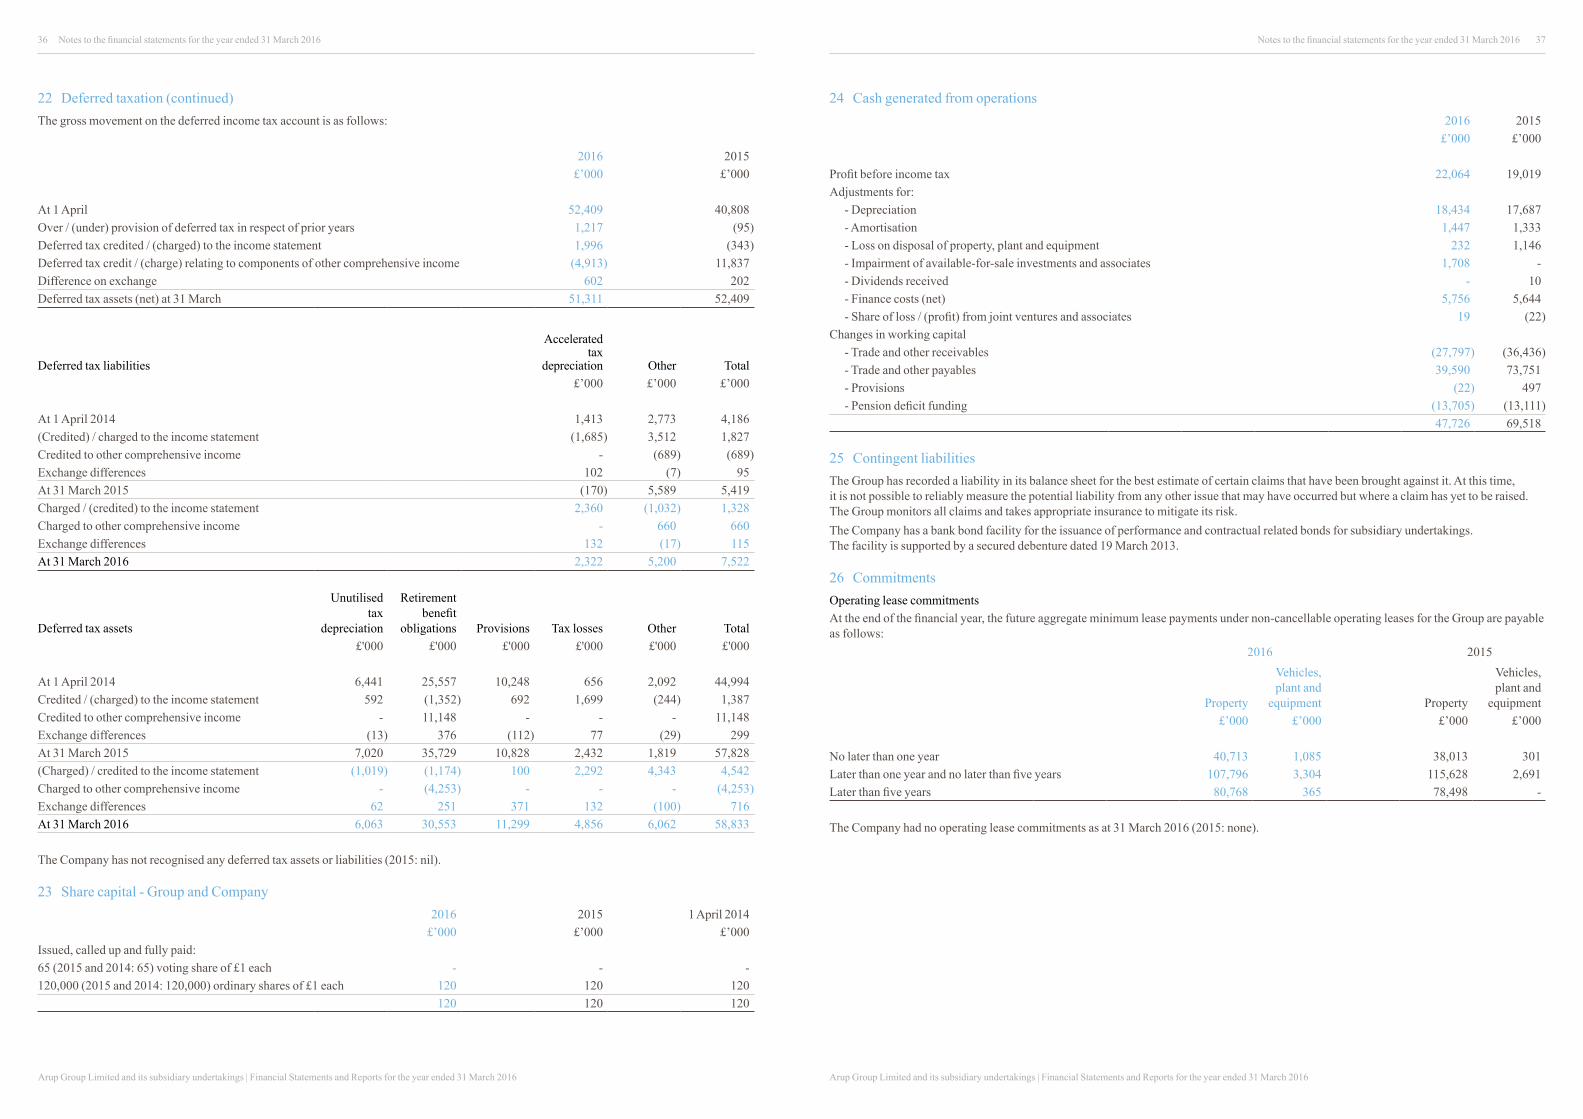
Arup Group Limited and its subsidiary undertakings | Financial Statements and Reports for the year ended 31 March 2016Arup Group Limited and its subsidiary undertakings | Financial Statements and Reports for the year ended 31 March 2016
36 37
22 Deferred taxation (continued)The gross movement on the deferred income tax account is as follows:
2016 2015£’000 £’000
At 1 April 52,409 40,808 Over / (under) provision of deferred tax in respect of prior years 1,217 (95) Deferred tax credited / (charged) to the income statement 1,996 (343) Deferred tax credit / (charge) relating to components of other comprehensive income (4,913) 11,837 Difference on exchange 602 202 Deferred tax assets (net) at 31 March 51,311 52,409
Deferred tax liabilities
Accelerated tax
depreciation Other Total£’000 £’000 £’000
At 1 April 2014 1,413 2,773 4,186 (Credited) / charged to the income statement (1,685) 3,512 1,827 Credited to other comprehensive income - (689) (689) Exchange differences 102 (7) 95 At 31 March 2015 (170) 5,589 5,419 Charged / (credited) to the income statement 2,360 (1,032) 1,328 Charged to other comprehensive income - 660 660 Exchange differences 132 (17) 115 At 31 March 2016 2,322 5,200 7,522
Deferred tax assets
Unutilised tax
depreciation
Retirement benefit
obligations Provisions Tax losses Other Total£'000 £'000 £'000 £'000 £'000 £'000
At 1 April 2014 6,441 25,557 10,248 656 2,092 44,994 Credited / (charged) to the income statement 592 (1,352) 692 1,699 (244) 1,387 Credited to other comprehensive income - 11,148 - - - 11,148 Exchange differences (13) 376 (112) 77 (29) 299 At 31 March 2015 7,020 35,729 10,828 2,432 1,819 57,828 (Charged) / credited to the income statement (1,019) (1,174) 100 2,292 4,343 4,542 Charged to other comprehensive income - (4,253) - - - (4,253) Exchange differences 62 251 371 132 (100) 716 At 31 March 2016 6,063 30,553 11,299 4,856 6,062 58,833
The Company has not recognised any deferred tax assets or liabilities (2015: nil).
23 Share capital - Group and Company2016 2015 1 April 2014
£’000 £’000 £’000Issued, called up and fully paid:65 (2015 and 2014: 65) voting share of £1 each - - - 120,000 (2015 and 2014: 120,000) ordinary shares of £1 each 120 120 120
120 120 120
Notes to the financial statements for the year ended 31 March 2016Notes to the financial statements for the year ended 31 March 2016
24 Cash generated from operations2016 2015
£’000 £’000
Profit before income tax 22,064 19,019 Adjustments for:
- Depreciation 18,434 17,687 - Amortisation 1,447 1,333 - Loss on disposal of property, plant and equipment 232 1,146 - Impairment of available-for-sale investments and associates 1,708 - - Dividends received - 10 - Finance costs (net) 5,756 5,644 - Share of loss / (profit) from joint ventures and associates 19 (22)
Changes in working capital- Trade and other receivables (27,797) (36,436)- Trade and other payables 39,590 73,751 - Provisions (22) 497 - Pension deficit funding (13,705) (13,111)
47,726 69,518
25 Contingent liabilitiesThe Group has recorded a liability in its balance sheet for the best estimate of certain claims that have been brought against it. At this time, it is not possible to reliably measure the potential liability from any other issue that may have occurred but where a claim has yet to be raised. The Group monitors all claims and takes appropriate insurance to mitigate its risk. The Company has a bank bond facility for the issuance of performance and contractual related bonds for subsidiary undertakings. The facility is supported by a secured debenture dated 19 March 2013.
26 CommitmentsOperating lease commitmentsAt the end of the financial year, the future aggregate minimum lease payments under non-cancellable operating leases for the Group are payable as follows:
2016 2015
Property
Vehicles, plant and
equipment Property
Vehicles, plant and
equipment£’000 £’000 £’000 £’000
No later than one year 40,713 1,085 38,013 301 Later than one year and no later than five years 107,796 3,304 115,628 2,691 Later than five years 80,768 365 78,498 -
The Company had no operating lease commitments as at 31 March 2016 (2015: none).
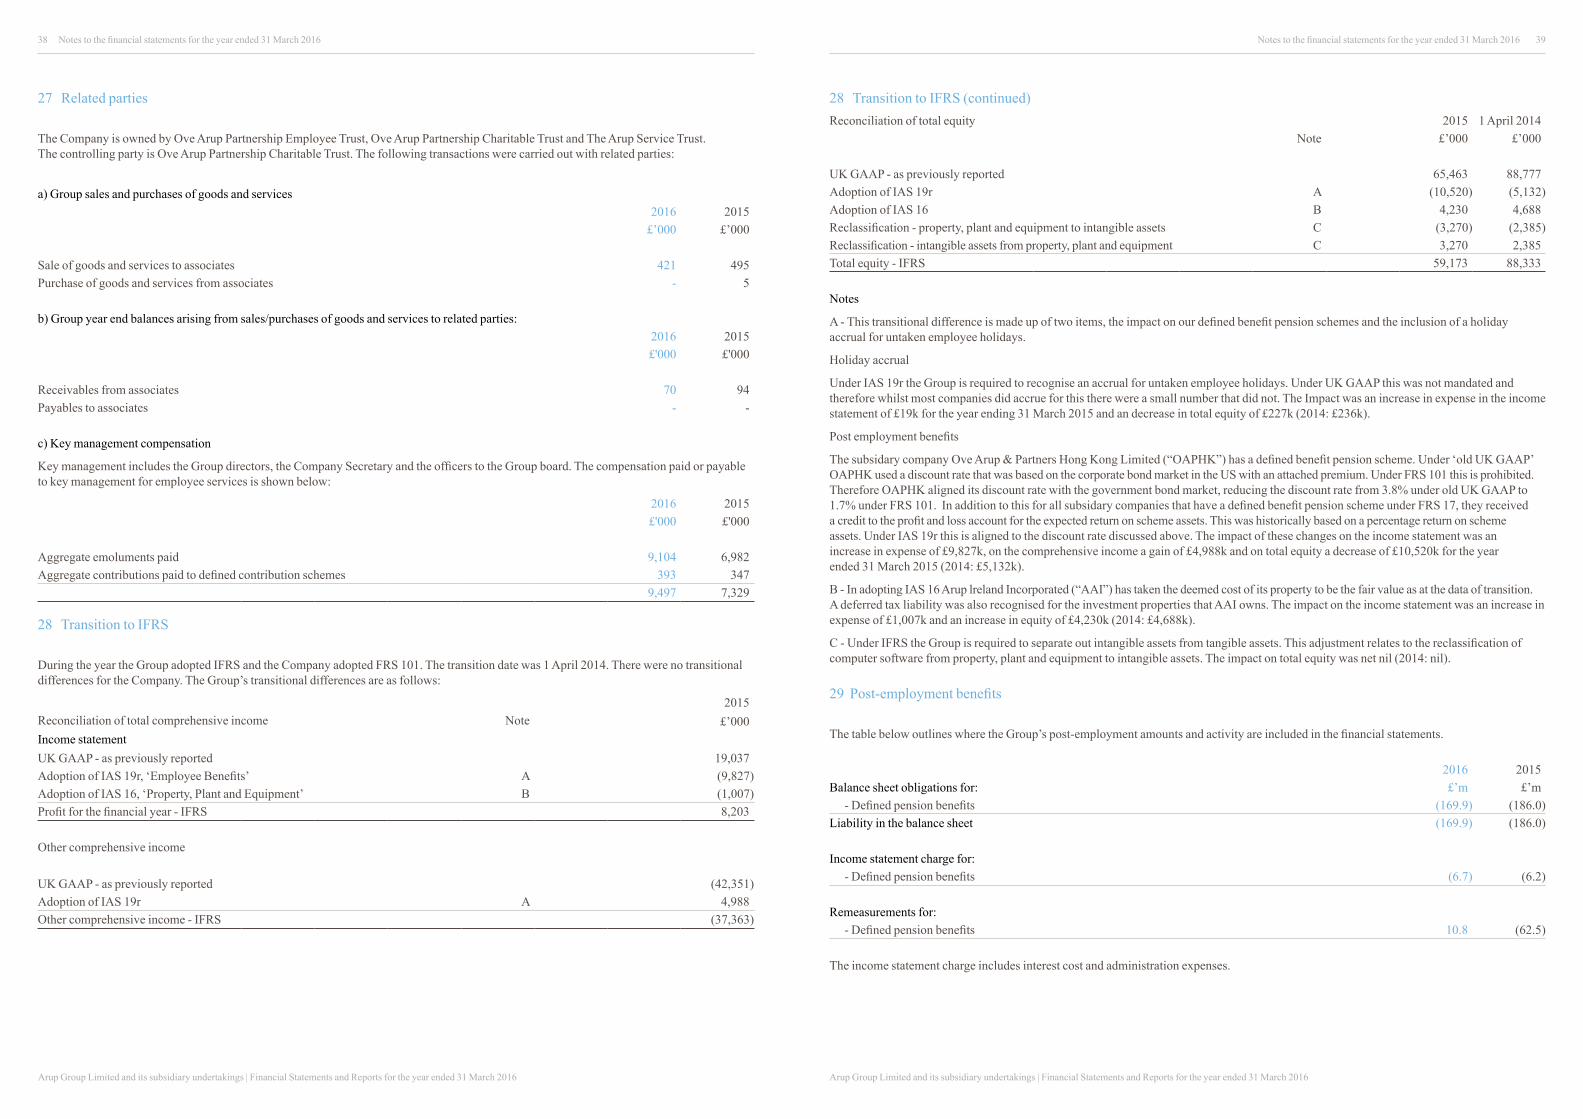
Arup Group Limited and its subsidiary undertakings | Financial Statements and Reports for the year ended 31 March 2016Arup Group Limited and its subsidiary undertakings | Financial Statements and Reports for the year ended 31 March 2016
38 39
27 Related parties
The Company is owned by Ove Arup Partnership Employee Trust, Ove Arup Partnership Charitable Trust and The Arup Service Trust. The controlling party is Ove Arup Partnership Charitable Trust. The following transactions were carried out with related parties:
a) Group sales and purchases of goods and services2016 2015
£’000 £’000
Sale of goods and services to associates 421 495 Purchase of goods and services from associates - 5
b) Group year end balances arising from sales/purchases of goods and services to related parties:2016 2015£'000 £'000
Receivables from associates 70 94 Payables to associates - -
c) Key management compensation
Key management includes the Group directors, the Company Secretary and the officers to the Group board. The compensation paid or payable to key management for employee services is shown below:
2016 2015£'000 £'000
Aggregate emoluments paid 9,104 6,982 Aggregate contributions paid to defined contribution schemes 393 347
9,497 7,329
28 Transition to IFRS
During the year the Group adopted IFRS and the Company adopted FRS 101. The transition date was 1 April 2014. There were no transitional differences for the Company. The Group’s transitional differences are as follows:
2015Reconciliation of total comprehensive income Note £’000Income statementUK GAAP - as previously reported 19,037Adoption of IAS 19r, ‘Employee Benefits’ A (9,827)Adoption of IAS 16, ‘Property, Plant and Equipment’ B (1,007)Profit for the financial year - IFRS 8,203
Other comprehensive income
UK GAAP - as previously reported (42,351)Adoption of IAS 19r A 4,988Other comprehensive income - IFRS (37,363)
Notes to the financial statements for the year ended 31 March 2016Notes to the financial statements for the year ended 31 March 2016
28 Transition to IFRS (continued)Reconciliation of total equity 2015 1 April 2014
Note £’000 £’000
UK GAAP - as previously reported 65,463 88,777Adoption of IAS 19r A (10,520) (5,132)Adoption of IAS 16 B 4,230 4,688Reclassification - property, plant and equipment to intangible assets C (3,270) (2,385)Reclassification - intangible assets from property, plant and equipment C 3,270 2,385Total equity - IFRS 59,173 88,333
Notes
A - This transitional difference is made up of two items, the impact on our defined benefit pension schemes and the inclusion of a holiday accrual for untaken employee holidays.
Holiday accrual
Under IAS 19r the Group is required to recognise an accrual for untaken employee holidays. Under UK GAAP this was not mandated and therefore whilst most companies did accrue for this there were a small number that did not. The Impact was an increase in expense in the income statement of £19k for the year ending 31 March 2015 and an decrease in total equity of £227k (2014: £236k).
Post employment benefits
The subsidary company Ove Arup & Partners Hong Kong Limited (“OAPHK”) has a defined benefit pension scheme. Under ‘old UK GAAP’ OAPHK used a discount rate that was based on the corporate bond market in the US with an attached premium. Under FRS 101 this is prohibited. Therefore OAPHK aligned its discount rate with the government bond market, reducing the discount rate from 3.8% under old UK GAAP to 1.7% under FRS 101. In addition to this for all subsidary companies that have a defined benefit pension scheme under FRS 17, they received a credit to the profit and loss account for the expected return on scheme assets. This was historically based on a percentage return on scheme assets. Under IAS 19r this is aligned to the discount rate discussed above. The impact of these changes on the income statement was an increase in expense of £9,827k, on the comprehensive income a gain of £4,988k and on total equity a decrease of £10,520k for the year ended 31 March 2015 (2014: £5,132k).
B - In adopting IAS 16 Arup lreland Incorporated (“AAI”) has taken the deemed cost of its property to be the fair value as at the data of transition. A deferred tax liability was also recognised for the investment properties that AAI owns. The impact on the income statement was an increase in expense of £1,007k and an increase in equity of £4,230k (2014: £4,688k).
C - Under IFRS the Group is required to separate out intangible assets from tangible assets. This adjustment relates to the reclassification of computer software from property, plant and equipment to intangible assets. The impact on total equity was net nil (2014: nil).
29 Post-employment benefits
The table below outlines where the Group’s post-employment amounts and activity are included in the financial statements.
2016 2015Balance sheet obligations for: £’m £’m
- Defined pension benefits (169.9) (186.0)Liability in the balance sheet (169.9) (186.0)
Income statement charge for:- Defined pension benefits (6.7) (6.2)
Remeasurements for:- Defined pension benefits 10.8 (62.5)
The income statement charge includes interest cost and administration expenses.

Arup Group Limited and its subsidiary undertakings | Financial Statements and Reports for the year ended 31 March 2016Arup Group Limited and its subsidiary undertakings | Financial Statements and Reports for the year ended 31 March 2016
40 41
29.1 Defined benefit pension plans The Group, through trustees, operates a number of defined benefit retirement schemes. These are registered in the UK, Hong Kong and Ireland. The valuation position of these schemes were assessed at 31 March 2016 by qualified independent actuaries for the purposes of the international accounting standard 19r, ‘Employee Benefits’.
The Group also has unfunded schemes in Japan, Philippines and Mauritius. As the unfunded schemes are not material to Arup Group Limited, apart from the summary below, no additional disclosures are included within these consolidated financial statements.
Defined benefit retirement schemes
UK registered scheme
Ove Arup & Partners International Limited (“OAPIL”) operated a UK registered contributory pension scheme, which had a defined benefit and a defined contribution section, for employees. On 31 March 2010, the scheme was closed to new members. With effect from 30 June 2010 the future accrual of benefits for existing members ceased. OAPIL replaced this scheme with a personal pension plan for employees with effect from 1 July 2010. All contributions for the new plan are held and managed by BlackRock Life Limited. OAPIL has no ongoing liability to the funds held by BlackRock Life Limited in respect of the employees.
For the pension scheme which closed on 30 June 2010, contributions were made in accordance with the rules of the scheme and the advice of independent qualified actuaries on the basis of triennial valuations. The most recent valuation was at 31 March 2013 using the projected unit method. The actuarial valuation at 31 March 2013 showed a funding level of 72% on an ongoing basis based on a market value of assets of £604.0m at that date. The most significant assumptions made by the actuary in carrying out this valuation were the assumptions of 2.9% and 0.6% above the gilt curve for the pre retirement and post retirement discount rates. A special employer’s contribution of £13.3m was made during the year to 31 March 2016 (2015: £12.1m), OAPIL is expected to make a contribution of £12.6m by 31 March 2017. The next actuarial valuation is being carried out as at 31 March 2016.
The scheme holds no assets that are issued or owned by OAPIL.
Management assessed the expected return on scheme assets based on a review of past returns and professional advice on the level of future returns.
Hong Kong registered scheme
OAPHK operates a Hong Kong registered retirement scheme that has a defined benefit component. This was closed to new entrants with effect from 1 January 2011 and was frozen for service accruals for existing members with effect from 1 January 2012. Actuarial funding valuations are continuously performed for the defined benefit component by an independent qualified actuary. The frequency of the valuation is typically tri-annual but can be more frequent depending on the funding level of the scheme. At 31 March 2016 a new funding valuation was performed, assets at this date on an ongoing basis represented 82.1% of the actuarially calculated liabilities for benefits that had accrued to members. The defined benefit component’s assets had a market value of £44.9m at that date. The most significant assumptions made by the actuary in carrying out this valuation were that the discount rate would be 5.0% p.a. and that salary inflation would be 4.0% p.a. A special employer’s contribution of £0.3m was made during the year to 31 March 2016 (2015: £0.9m), OAPHK is expected to make a contribution of £1.2m by 31 March 2017. The next funding valuation is scheduled to be carried out as at 31 March 2017.
Ireland registered scheme
Ove Arup & Partners Ireland Limited (“OAPI”) operates an Ireland registered defined benefit pension scheme and a defined contribution scheme.
The assets of the defined benefit scheme are held in separate trustee administered funds. The OAPI pension cost in respect of the defined benefit scheme, has been assessed in accordance with the advice of an independent qualified actuary using the attained age method of funding which provides for benefits over the working lifetime of the membership. Formal actuarial valuations are carried out every three years. The latest full valuation was at 1 April 2013. The results of that valuation confirmed that the scheme had a past service surplus of £0.9 million and a funding ratio of 102.5%. A special employer’s contribution of £0.1m was made during the year to 31 March 2016 (2015: £0.1m), OAPI is expected to make a contribution of £0.1m by 31 March 2017. The next actuarial valuation is being carried out as at 31 March 2016.
Notes to the financial statements for the year ended 31 March 2016Notes to the financial statements for the year ended 31 March 2016
29.1 Defined benefit pension plans (continued) Unfunded schemes
Japan unfunded scheme
Ove Arup & Partners Japan Limited provides a retirement allowance to employees. Provision is made in accordance with the advice of independent qualified actuaries. The most recent valuation was at 31 March 2016 using the projected unit method. The most significant assumptions made by the actuary in carrying out this valuation were that the discount rate would be 0.5% (2015: 1.0%) p.a. and that salary inflation would be 4.0% (2015: 4.0%) per annum. There was an employer contribution for the year to 31 March 2016 of £0.04m (2015: £0.01m). There was an actuarial loss in the year of £0.3m (2015: £0.2m). The pension liability recognised in the financial statements was £2.0m (2015: £1.4m).
Philippines unfunded scheme
Ove Arup & Partners Hong Kong Limited - Philippines branch operates a retirement benefit scheme in the Philippines which requires an annual actuarial valuation. The most recent valuation was at 31 March 2016 using the projected unit method. The most significant assumptions made by the actuary in carrying out this valuation were that the discount rate would be 5.0% (2015: 4.8%) per annum and that salary inflation would be 8.0% (2015: 8.0%) per annum. The pension liability recognised in the financial statements was £0.22m (2015: £0.16m). The actuarial gain for the year on this scheme was £0.02m (2015: loss of £0.03m) which has been recorded in the statement of comprehensive income.
Mauritius unfunded scheme
Arup - S.I.G.M.A. Ltd provides a retirement allowance to its employees. Provision is made in accordance with the advice of independent qualified actuaries. The most recent actuarial valuation of the plan assets and the present value of the defined benefit obligations were carried out at 31 December 2013. The pension liability recognised in the financial statements was £0.1m (2015: £0.1m).
UK, Hong Kong and Ireland registered schemes - further disclosure
The amounts recognised in the balance sheet are determined as follows: 2016 2015 01 April 2014£’m £’m £’m
Present value of funded obligations (923.8) (966.9) (824.4)Fair value of plan assets 756.2 782.6 698.1 Deficit of funded plans (167.6) (184.3) (126.3)
The movement in the defined benefit liability is as follows:
Present value of obligation
Fair value of plan assets Total
£’m £’m £’m
At 1 April 2014 (824.4) 698.1 (126.3)Administration expenses - (0.7) (0.7)Interest (expense) / income (35.8) 30.4 (5.4)
(860.2) 727.8 (132.4)
Remeasurements:- Return on plan assets, excluding amounts included in interest income - 73.4 73.4 - Gain from change in demographic assumptions 0.7 - 0.7 - Loss from change in financial assumptions (138.6) - (138.6)- Experience losses 2.2 - 2.2
(135.7) 73.4 (62.3)
Contributions: employers - 13.1 13.1 Payments from plans: benefit payments 29.9 (29.9) - Adjustment for exchange differences (0.9) (1.8) (2.7)At 31 March 2015 (966.9) 782.6 (184.3)

Arup Group Limited and its subsidiary undertakings | Financial Statements and Reports for the year ended 31 March 2016Arup Group Limited and its subsidiary undertakings | Financial Statements and Reports for the year ended 31 March 2016
42 43
29.1 Defined benefit pension plans (continued) Present value of obligation
Fair value of plan assets Total
£’m £’m £’m
At 31 March 2015 (966.9) 782.6 (184.3)
Administration expenses - (0.8) (0.8)Interest (expense) / income (31.1) 25.4 (5.7)
(998.0) 807.2 (190.8)
Remeasurements:- Return on plan assets, excluding amounts included in interest (expense) - (32.8) (32.8)- Gain from change in demographic assumptions 7.1 - 7.1 - Gain from change in financial assumptions 21.4 - 21.4 - Experience gains 15.5 - 15.5
44.0 (32.8) 11.2
Contributions: employers - 13.7 13.7 Payments from plans: benefit payments 37.1 (37.1) - Adjustment for exchange differences (6.9) 5.2 (1.7)At 31 March 2016 (923.8) 756.2 (167.6)
The defined benefit obligation and plan assets are composed by country as follows:
2016 2015UK Hong Kong Ireland UK Hong Kong Ireland£’m £’m £’m £’m £’m £’m
Present value of obligation (817.0) (59.3) (47.5) (855.4) (57.2) (54.3)Fair value of plan assets 674.5 30.3 51.4 696.7 33.1 52.8
(142.5) (29.0) 3.9 (158.7) (24.1) (1.5)
The significant actuarial assumptions were as follows:
2016 2015UK Hong Kong Ireland UK Hong Kong Ireland
Discount rate 3.6% 1.7% 1.9% 3.5% 1.6% 1.4%Salary growth rate N/A 5.0% N/A N/A 5.0% N/ARetail Price inflation 2.9% 2.5% 1.3% 2.9% 2.5% 1.4%Consumer Price inflation 1.6% N/A N/A 1.6% N/A N/APension growth rate:
- Pre 88 Guaranteed Minimum Pension 0.0% N/A N/A 0.0% N/A N/A- Post 88 Guaranteed Minimum Pension 1.6% N/A N/A 1.6% N/A N/A- NGMP accrued before 01/10/2006 (5% LPI) 2.8% N/A N/A 2.8% N/A N/A- Pension accrued after 30/09/20016 (2.5% LPI) 1.9% N/A N/A 1.9% N/A N/A
Notes to the financial statements for the year ended 31 March 2016Notes to the financial statements for the year ended 31 March 2016
29.1 Defined benefit pension plans (continued) Mortality %
UK108% SAPS Light tables for males and 101% SAPS Light tables for females using the CMI 2015 projections (2015 : CMI 2014), allowing for LTR of 1% per annum.
Hong KongAt 2016 (2015: no change) Mortality (%) Hong Kong Life Table 2013
Age Male Female25 0.038 0.02030 0.056 0.02635 0.082 0.03540 0.105 0.05745 0.161 0.09350 0.254 0.14355 0.420 0.23160 0.690 0.336
Ireland88% of ILT15 tables (males) and 91% of ILT15 tables (females) with CSO improvements from 2011 onwards (2015: no change).
Cash commutation
For the UK, 25% of members’ pensions are assumed to be taken as cash on current terms, for Hong Kong a 100% lump sum is taken on retirement and for Ireland no cash commutations are assumed to be taken.
Assumed life expectations on retirement
Assumptions regarding future mortality are set based on actuarial advice in accordance with published statistics and experience in each territory. These assumptions translate into an average life expectancy in years for a pensioner retiring at age 65 for the UK and age 62 for Ireland. Assumed life expectation is not shown for Hong Kong as 100% of their pension scheme benefit is paid on retirement.
2016 2015UK Hong Kong Ireland UK Hong Kong Ireland
Years Years Years Years Years YearsRetiring at the end of the reporting period:
- Male 22.8 N/A 23.9 23.0 N/A 23.8 - Female 24.6 N/A 26.5 24.9 N/A 26.4
Retiring 20 years after the end of the reporting period:
- Male 24.1 N/A 26.1 24.3 N/A 26.0 - Female 26.1 N/A 28.4 26.4 N/A 28.3

Arup Group Limited and its subsidiary undertakings | Financial Statements and Reports for the year ended 31 March 2016Arup Group Limited and its subsidiary undertakings | Financial Statements and Reports for the year ended 31 March 2016
44 45
29.1 Defined benefit pension plans (continued) Considering the key assumption of each scheme, the sensitivity of the defined benefit obligation to changes in the weighted principal assumption is:
UK Hong Kong Ireland
At 2016Increase in
assumptionDecrease in assumption
Increase in assumption
Decrease in assumption
Increase in assumption
Decrease in assumption
Impact on defined benefit obligation of a 50 basis points change:Discount rate (7.8%) 8.9% (5.7%) 6.2% (9.1%) 10.5%Salary growth rate N/A N/A 6.5% (6.0%) 3.7% (3.5%)Inflation 6.1% (5.6%) N/A N/A N/A N/A
The above sensitivity analyses are based on a change in assumption while holding all other assumptions constant. In practice, this is unlikely to occur, and changes in some of the assumptions may be correlated. When calculating the sensitivity of the defined benefit obligation to significant actuarial assumptions the same method (present value of the defined benefit obligation calculated with the projected unit credit method at the end of the reporting period) has been applied as when calculating the pension liability recognised within the balance sheet.
The assets in the scheme at 31 March were: 2016 2015
UK Hong Kong Ireland UK Hong Kong Ireland£’m £’m £’m £’m £’m £’m
Equities 166.5 22.5 23.9 200.7 25.1 29.5 Diversified growth fund 81.3 - - 146.1 - - Hedge funds 125.3 - - 73.0 - - Gilts and corporate bonds 93.1 - 22.3 97.4 - 19.1 Alternate credit 62.8 - - 40.5 - - Liability driven investment 105.2 - - 102.9 - - Property investments 37.0 - 3.1 34.7 - 2.2 Cash and net current assets 3.3 2.3 2.1 1.5 1.9 2.0 Debt instruments - 5.5 - - 6.1 -
674.5 30.3 51.4 696.8 33.1 52.8
Defined benefit membership data 2016 2015UK Hong Kong Ireland UK Hong Kong Ireland
Number Number Number Number Number Number
Deferred pensioners 3,859 467 95 3,956 504 101 Pensioners 1,306 - 29 1,241 - 27
5,165 467 124 5,197 504 128
30 Post balance sheet event On 23 June 2016 the UK electorate voted to leave the European Union. This decision commences a process that is likely to take a minimum of two years to complete, during this time the UK remains a member of the European Union. There will be a resulting period of uncertainty for the UK economy with increased volatility expected in financial markets. This does not impact the fair value of assets and liabilities reported at the balance sheet date of 31 March 2016.
Notes to the financial statements for the year ended 31 March 2016

Arup is an independent firm of designers, planners, engineers, consultants and technical specialists, working across every aspect of today’s built environment. Together we help our clients solve their most complex challenges – turning exciting ideas into tangible reality as we strive to find a better way and shape a better world.
arup.com


