Total Assets 73,681 92,349 115,835 122,237 148,576
Net Profit 1,567 1,832 2,188 2,465 3,045
KEY FINANCIAL INDICATORS
Net Interest Margin (NIM) 5.23% 4.83% 4.70% 4.97% 4.93%
Return on Average Assets (RoAA) 2.4% 2.2% 2.1% 2.1% 2.3%
Book Value Per Share (`) 149 174 204 248 287
Earnings Per Share (EPS) Face Value ` 5 per share 21.6 24.7 29.3 32.1 39.4
Return on Equity (RoE) 16.4% 15.4% 15.6% 14.0% 14.8%
Capital Adequacy Ratio** 19.5% 17.9% 17.0% 18.9% 17.6%
Gross NPA (` crore) 712 700 848 1,178 1,392
Net NPA (` crore) 243 273 361 634 697
Gross NPA Ratio 1.7% 1.3% 1.3% 1.6% 1.6%
Net NPA Ratio 0.6% 0.5% 0.6% 0.9% 0.8%
* Excludes Policyholders’ investments
** For the Year 2014 & 2015 Capital Adequacy Ratio and Tier I Ratio is computed on the basis of BASEL III Norms issued by RBI and for previous period based on BASEL II Norms.
Fee / NII Plus other Income 16.2% 16.6% 16.9% 16.7% 19.6%
NII / NII Plus other Income 72.9% 72.0% 73.4% 72.7% 67.6%
Capital Adequacy Ratio* 19.9% 17.5% 16.0% 18.8% 17.2%
Tier I * 18.0% 15.7% 14.7% 17.8% 16.2%
Gross NPA Ratio 2.0% 1.6% 1.6% 2.0% 1.9%
Net NPA Ratio 0.7% 0.6% 0.6% 1.1% 0.9%
*For the Year 2014 & 2015 Capital Adequacy Ratio and Tier I Ratio is computed on the basis of BASEL III Norms issued by RBI & for previous period based on BASEL II Norms.
27
#KONAKONAKOTAKFINANCIAL
HIGHLIGHTSCONSOLIDATED FINANCIAL
STATEMENTSBANK REPORTS
AND STATEMENTS
Highlights
28 ANNUAL REPORT 2014-15
Consolidation at a Glance
(` in Crore)
2014-2015 2013-2014 March 31, 2015 March 31, 2014
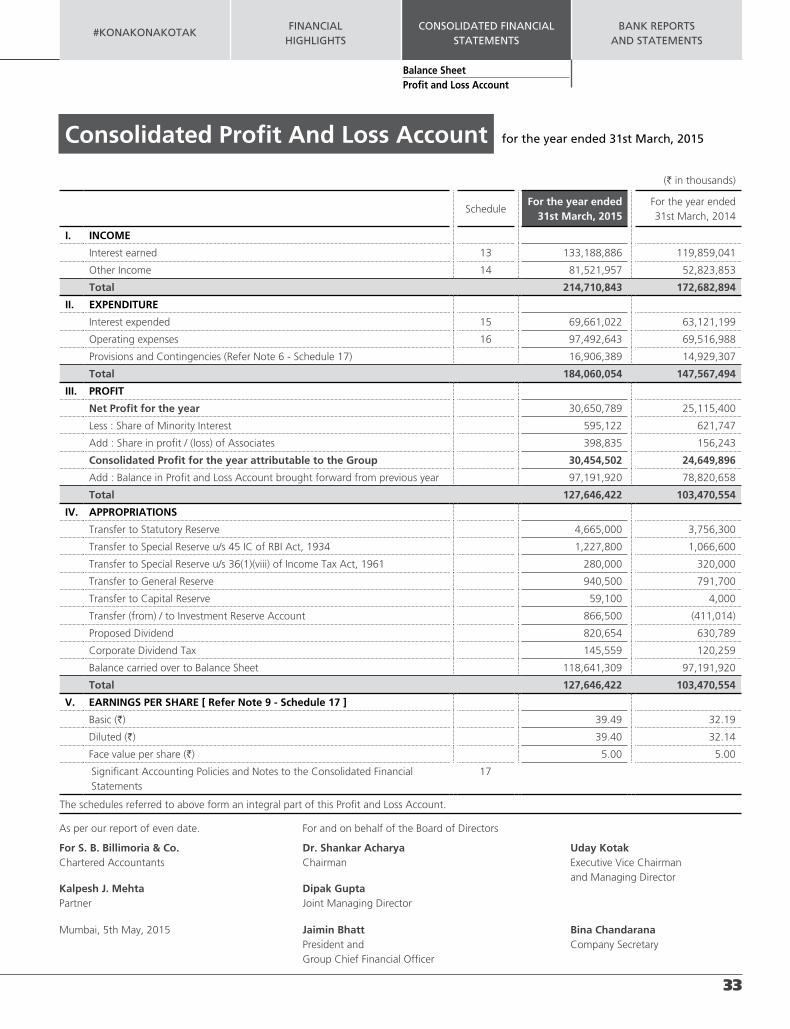
Profit before Tax
Profit after Tax
Profit before Tax
Profit after Tax
Networth Networth
Kotak Mahindra Bank Limited 2,832.96 1,865.98 2,272.45 1,502.52 14,141.09 12,275.08
Subsidiaries
Kotak Mahindra Prime Limited 773.95 507.36 751.66 491.18 3,349.72 2,842.73
Total 4,543.11 3,058.32 3,698.58 2,514.69 23,078.50 19,901.06
Add : Associates 39.88 15.62 585.90 549.11
Less : Dividend, Minority interest, Inter company and other adjustment
52.75 65.33 1,511.80 1,374.18
Consolidated Profit After Tax / Networth 3,045.45 2,464.98 22,153.32 19,075.99
Consolidated Earnings per Share (`) 39.40 32.14
Consolidated Book Value per Share (`) 286.83 247.64
29
#KONAKONAKOTAKFINANCIAL
HIGHLIGHTSCONSOLIDATED FINANCIAL
STATEMENTSBANK REPORTS
AND STATEMENTS
Independent Auditor’s ReportTO THE MEMBERS OF
KOTAK MAHINDRA BANK LIMITED
Report on the Consolidated Financial Statements
We have audited the accompanying consolidated financial statements of KOTAK MAHINDRA BANK LIMITED (“the Bank”), its Subsidiaries ( the Bank
and its subsidiaries together referred to as “the Group”) and Associates comprising of the Consolidated Balance Sheet as at 31st March, 2015, the
Consolidated Profit and Loss Account and the Consolidated Cash Flow Statement for the year then ended, and a summary of the significant accounting
policies and other explanatory information (hereinafter referred to as “the consolidated financial statements”).
Management’s Responsibility for the Consolidated Financial Statements
The Bank’s Management and Board of Directors are responsible for the preparation of these consolidated financial statements in terms of the
requirements of the Companies Act, 2013 (hereinafter referred to as “the Act”) that give a true and fair view of the consolidated financial position,
consolidated financial performance and consolidated cash flows of the Group including its Associates in accordance with the accounting principles
generally accepted in India, including the Accounting Standards specified under Section 133 of the Act, read with Rule 7 of the Companies (Accounts)
Rules, 2014. The respective Board of Directors of the companies included in the Group and of its associates are responsible for maintenance of adequate
accounting records in accordance with the provisions of the Act for safeguarding the assets of the Group and for preventing and detecting frauds and
other irregularities; the selection and application of appropriate accounting policies; making judgments and estimates that are reasonable and prudent;
and the design, implementation and maintenance of adequate internal financial controls, that were operating effectively for ensuring the accuracy and
completeness of the accounting records, relevant to the preparation and presentation of the financial statements that give a true and fair view and are
free from material misstatement, whether due to fraud or error, which have been used for the purpose of preparation of the consolidated financial
statements by the Directors of the Bank, as aforesaid.
Auditor’s Responsibility
Our responsibility is to express an opinion on these consolidated financial statements based on our audit. While conducting the audit, we have taken
into account the provisions of the Act, the accounting and auditing standards and matters which are required to be included in the audit report under
the provisions of the Act and the Rules made thereunder.
We conducted our audit in accordance with the Standards on Auditing specified under Section 143(10) of the Act. Those standards require that we
comply with ethical requirements and plan and perform the audit to obtain reasonable assurance about whether the consolidated financial statements
are free from material misstatement.
An audit involves performing procedures to obtain audit evidence about the amounts and disclosures in the consolidated financial statements. The
procedures selected depend on the auditor’s judgement, including the assessment of the risks of material misstatement of the consolidated financial
statements, whether due to fraud or error. In making those risk assessments, the auditor considers internal financial control relevant to the Bank’s
preparation and presentation of the consolidated financial statements that give a true and fair view in order to design audit procedures that are
appropriate in the circumstances, but not for the purpose of expressing an opinion on whether the Bank has an adequate internal financial controls
system over financial reporting in place and the operating effectiveness of such controls. An audit also includes evaluating the appropriateness of
accounting policies used and the reasonableness of the accounting estimates made by the Bank’s Board of Directors, as well as evaluating the overall
presentation of the consolidated financial statements.
We believe that the audit evidence obtained by us and the audit evidence obtained by the other auditors in terms of their reports referred to in sub-
paragraph (a) of the Other Matters paragraph below, is sufficient and appropriate to provide a basis for our audit opinion on the consolidated financial
statements.
Opinion
In our opinion and to the best of our information and according to the explanations given to us, the aforesaid consolidated financial statements give the
information required by the Act in the manner so required and give a true and fair view in conformity with the accounting principles generally accepted
in India, of the consolidated state of affairs of the Group and its associates as at 31st March, 2015, and their consolidated profit and their consolidated
cash flows for the year ended on that date.
Auditors’ Report
30 ANNUAL REPORT 2014-15
Other Matters
a) We did not audit the financial statements of thirteen subsidiaries whose financial statements reflect total assets of ` 70,707,366 (thousands) as at
31st March, 2015, total revenues of ` 15,511,639 (thousands) and net cash inflows amounting to ` 224,891 (thousands) for the year ended on
that date, as considered in the consolidated financial statements. The consolidated financial statements also include the Group’s share of net profit
of ` 372,392 (thousands) for the year ended 31st March, 2015 as considered in the consolidated financial statements, in respect of one associate
whose financial statements have not been audited by us. These financial statements have been audited by other auditors, whose report has been
furnished to us by the Management and our opinion on the consolidated financial statements, in so far as it relates to the amounts and disclosures
included in respect of these subsidiaries and associates, and our report in terms of sub-sections (3) of Section 143 of the Act, insofar as it relates
to the aforesaid subsidiaries and associates, is based solely on the reports of the other auditors.
b) The consolidated financial statements also include the Group’s share of net loss of ` 66,142 (thousands) for the year ended 31st March, 2015, as
considered in the consolidated financial statements, in respect of two associates, whose financial statements have not been audited by us. These
financial statements are unaudited and have been furnished to us by the Management and our opinion on the consolidated financial statements,
in so far as it relates to the amounts and disclosures included in respect of these associates, and our report in terms of sub-sections (3) of Section
143 of the Act in so far as it relates to the aforesaid associates, is based solely on such unaudited financial statements. In our opinion and according
to the information and explanations given to us by the Management, these financial statements are not material to the Group.
c) The auditors of a subsidiary of the Bank, Kotak Mahindra Old Mutual Life Insurance Limited (“the Company”), have reported in their audit opinion
“the actuarial valuation of liabilities for life policies in force and for policies in respect of which premium has been discontinued but liability exists as
at 31st March, 2015 is the responsibility of the Company’s Appointed Actuary (“the Appointed Actuary”). The actuarial valuation of these liabilities
for life policies in force and for policies in respect of which premium has been discontinued but liability exists as at 31st March, 2015 has been duly
certified by the Appointed Actuary and in his opinion, the assumptions for such valuation are in accordance with the guidelines and norms issued
by the Insurance Regulatory and Development Authority of India (“the IRDA”/“Authority”) and the Institute of Actuaries of India in concurrence
with the Authority.” The auditors of the Company have relied upon the Appointed Actuary’s certificate in this regard for forming their opinion on
the valuation of liabilities for life policies in force and for policies in respect of which premium has been discontinued but liability exists on financial
statements of the Company.
Our opinion on the consolidated financial statements, and our report on Other Legal and Regulatory Requirements below, is not modified in respect
of the above matters with respect to our reliance on the work done and the reports of the other auditors and the financial statements certified by the
Management.
Report on Other Legal and Regulatory Requirements
As required by Section143(3) of the Act, we report, to the extent applicable, that :
a. We have sought and obtained all the information and explanations which to the best of our knowledge and belief were necessary for the purposes
of our audit of the aforesaid consolidated financial statements.
b. In our opinion, proper books of account as required by law relating to preparation of the aforesaid consolidated financial statements have been
kept so far as it appears from our examination of those books and the reports of the other auditors.
c. The Consolidated Balance Sheet, the Consolidated Profit and Loss Account, and the Consolidated Cash Flow Statement dealt with by this Report
are in agreement with the relevant books of account maintained for the purpose of preparation of the consolidated financial statements.
d. In our opinion, the aforesaid consolidated financial statements comply with the Accounting Standards specified under Section 133 of the Act, read
with Rule 7 of the Companies (Accounts) Rules, 2014.
e. On the basis of the written representations received from the directors of the Bank as on 31st March, 2015 taken on record by the Board of
Directors of the Bank and the reports of the statutory auditors of its subsidiary companies and associate companies incorporated in India, none
of the directors of the Group companies and its associate companies incorporated in India is disqualified as on 31st March, 2015 from being
appointed as a director in terms of Section 164 (2) of the Act.
31
#KONAKONAKOTAKFINANCIAL
HIGHLIGHTSCONSOLIDATED FINANCIAL
STATEMENTSBANK REPORTS
AND STATEMENTS
Auditors’ Report
f. With respect to the other matters to be included in the Auditor’s Report in accordance with Rule 11 of the Companies (Audit and Auditor’s) Rules,
2014, in our opinion and to the best of our information and according to the explanations given to us :
i. The consolidated financial statements disclose the impact of pending litigations on the consolidated financial position of the Group and its
associates – Refer Schedule 12, Schedule 17-Note 2V and Schedule 17-Note 8 to the consolidated financial statements.
ii. Provision has been made in the consolidated financial statements, as required under the applicable law or accounting standards, for material
foreseeable losses, if any, on long-term contracts including derivative contracts – Refer Schedule 17-Note 2V and Schedule 17-Note 6 to the
consolidated financial statements in respect of such items as it relates to the Group, and its associates.
iii. There has been no delay in transferring amounts, required to be transferred, to the Investor Education and Protection Fund by the Bank, its
subsidiary companies and associate companies incorporated in India.
(Increase) / Decrease in investments [other than HTM and Long Term investment] (11,704,181) 32,108,489
Increase in Advances (171,827,971) (56,001,435)
Increase in Other Assets (6,146,634) (7,502,008)
Increase in Deposits 159,137,057 75,406,128
Increase in Policyholders' Funds 27,780,513 9,372,865
Increase in Other Liabilities and Provisions 20,111,436 11,797,665
17,350,220 65,181,704
Direct Taxes Paid (net of refunds) (14,183,023) (11,738,636)
NET CASH FLOW FROM OPERATING ACTIVITIES (A) 29,604,601 90,680,372
CASH FLOW FROM INVESTING ACTIVITIES
Purchase of Fixed assets (2,919,067) (4,423,281)
Proceeds from sale of Fixed assets 240,625 91,011
Proceeds from sale of investment in Associates 26,580 2,099
Investments in Associates (485,339) (32,358)
Increase in HTM and Long Term Investments (48,120,975) (6,933,124)
NET CASH FLOW USED IN INVESTING ACTIVITIES (B) (51,258,176) (11,295,653)
Consolidated Cash Flow Statement for the year ended 31st March, 2015
35
#KONAKONAKOTAKFINANCIAL
HIGHLIGHTSCONSOLIDATED FINANCIAL
STATEMENTSBANK REPORTS
AND STATEMENTS
Consolidated Cash Flow Statement
(` in thousands)
Year ended31st March, 2015
Year ended31st March, 2014
CASH FLOW FROM FINANCING ACTIVITIES
Dividend paid including corporate dividend tax (699,288) (641,513)
Money received on issue of shares / exercise of stock options 878,788 14,155,019
Share issue expenses - (1,355)
Increase / (Decrease) in borrowings 24,077,429 (71,648,271)
NET CASH FLOW FROM / (USED IN) FINANCING ACTIVITIES (C) 24,256,929 (58,136,120)
NET INCREASE IN CASH AND CASH EQUIVALENTS (A + B + C) 2,603,354 21,248,599
CASH AND CASH EQUIVALENTS AT THE BEGINNING OF THE YEAR (Refer Note below) 66,431,061 45,182,462
CASH AND CASH EQUIVALENTS AT THE END OF THE YEAR (Refer Note below) 69,034,415 66,431,061
Note :
Balance with banks in India in Fixed Deposit (As per Schedule 7 I (i) (b)) 3,569,367 3,431,278
Balance with banks in India in Current Account (As per Schedule 7 I (i) (a)) 1,683,476 1,471,361
Money at call and short notice in India (As per Schedule 7 I (ii)) 17,639,173 7,516,907
Cash in hand (As per Schedule 6 I) 5,431,071 4,484,204
Balance with RBI in Current Account (As per Schedule 6 II) 34,020,094 25,120,871
Balance with banks Outside India :
(i) In Current Account (As per Schedule 7 II (i)) 1,429,759 1,655,652
(ii) In Other Deposit Accounts (As per Schedule 7 II (ii)) 5,261,475 22,750,788
CASH AND CASH EQUIVALENTS AT THE END OF THE YEAR 69,034,415 66,431,061
1. The above Cash Flow Statement has been prepared under the “Indirect Method” as set out in Accounting Standard - 3 “Cash Flow Statements” specified under Section 133 of the Companies Act, 2013, read with Rule 7 of the Companies(Accounts) Rules, 2014.
2. The corresponding amounts of previous year have re-grouped, wherever necessary.
As per our report of even date. For and on behalf of the Board of Directors
For S. B. Billimoria & Co.Chartered Accountants
Dr. Shankar AcharyaChairman
Uday KotakExecutive Vice Chairman and Managing Director
Kalpesh J. MehtaPartner
Dipak GuptaJoint Managing Director
Mumbai, 5th May, 2015 Jaimin BhattPresident and Group Chief Financial Officer
Bina ChandaranaCompany Secretary
for the year ended 31st March, 2015 (Contd.)
Cash Flow Statement
36 ANNUAL REPORT 2014-15
Schedules forming part of Consolidated Balance Sheet as at 31st March, 2015
(` in thousands)
As at 31st March, 2015
As at 31st March, 2014
SCHEDULE 1 - CAPITALAuthorised Capital1,400,000,000 Equity Shares of ` 5/- each (31st March, 2014 : 1,000,000,000 Equity Shares of ` 5 each)
7,000,000 5,000,000
Issued, Subscribed and Paid-up Capital772,352,664 Equity Shares of ` 5/- each (31st March, 2014 : 770,311,001 Equity Shares of ` 5 each) fully paid-up (Refer Note 22 - Schedule 17)
3,861,763 3,851,555
Total 3,861,763 3,851,555 SCHEDULE 2 - RESERVES AND SURPLUSI. Statutory Reserve
Opening Balance 16,387,000 12,630,700
Add : Transfer from Profit and Loss Account 4,665,000 3,756,300
Total 21,052,000 16,387,000 II. Capital Reserve
Opening Balance 293,303 289,303
Add : Transfer from Profit and Loss Account 59,100 4,000
Total 352,403 293,303 III. General Reserve
Opening Balance 5,238,804 4,758,904
Add : Transfer from Profit and Loss Account 940,500 791,700
Add : Transfer on ESOPs lapsed 751 -
Less : Utilised for creation of Deferred tax liability on Special Reserve (Refer Note 19 - Schedule 17)
- 311,800
Total 6,180,055 5,238,804 IV. Securities Premium Account
Opening Balance 58,987,381 44,815,352
Add : Received during the year 945,767 14,173,384
Less : Utilised for Share Issue Expenses - 1,355
Less : Adjustment for Associate's Share issue expenses 7,051 -
Total 59,926,097 58,987,381 V. Special Reserve under Section 45IC of the RBI Act, 1934
Opening Balance 4,742,756 3,676,156
Add : Transfer from Profit and Loss Account 1,227,800 1,066,600
Total 5,970,556 4,742,756 VI. Debenture Redemption Reserve
Opening Balance 250 250
Add : Transfer from Profit and Loss Account - -
Total 250 250 VII. Capital Reserve on Consolidation
Opening Balance 1,474,546 1,474,546
Additions during the year - -
Total 1,474,546 1,474,546 VIII. Foreign Currency Translation Reserve
(Refer Note 2(G)(xi) - Schedule 17)
Opening Balance 1,040,719 656,259
Increase during the year 184,677 384,460
Total 1,225,396 1,040,719
37
#KONAKONAKOTAKFINANCIAL
HIGHLIGHTSCONSOLIDATED FINANCIAL
STATEMENTSBANK REPORTS
AND STATEMENTS
Schedules forming part of Consolidated Balance Sheet as at 31st March, 2015
Schedules
(` in thousands)
As at 31st March, 2015
As at 31st March, 2014
IX. Investment Reserve AccountOpening Balance - 411,014
Add : Transfer from / (to) Profit and Loss Account 866,500 (411,014)
Total 866,500 - X. Special Reserve under Section 36(1)(viii) of the Income Tax Act, 1961
Opening Balance 1,545,000 1,225,000
Add : Transfer from Profit and Loss Account 280,000 320,000
Total 1,825,000 1,545,000 XI. Capital Redemption Reserve
Opening Balance 6,800 6,800
Add : Transfer from Profit and Loss Account - -
Total 6,800 6,800 XII. Revaluation Reserve - Investment Property
(Refer Note 16 - Schedule 17)
Opening Balance - -
Additions during the year 203,344 -
Less : Transfer to Minority interest 52,869 -
Total 150,475 - XIII. Balance in the Profit and Loss Account 118,641,309 97,191,920
Total 217,671,387 186,908,479 SCHEDULE 2A - Minority Interest
Minority Interest at the date on which parent subsidiary relationship came into existence 396,700 396,700
Subsequent Increase 2,960,212 2,312,221
Total 3,356,912 2,708,921 SCHEDULE 3 - DEPOSITS A.I. Demand Deposits
i. From Banks 2,551,379 1,709,993
ii. From Others 127,562,598 82,570,463
Total 130,113,977 84,280,456 II. Savings Bank Deposits 140,361,089 100,870,498
III. Term Depositsi. From Banks 10,575,512 6,103,554
ii. From Others 447,384,014 378,043,027
Total 457,959,526 384,146,581 Total Deposits ( I + II + III) 728,434,592 569,297,535
B.i. Deposits of Branches in India 728,434,592 569,297,535
ii. Deposits of Branches Outside India - -
Total Deposits ( I + II) 728,434,592 569,297,535 SCHEDULE 4 - BORROWINGSI. Borrowings in India
II. Borrowings outside IndiaBanks, Institutions, Agencies and others (Refer Note 11 - Schedule 17) 47,594,328 24,601,511
Total 47,594,328 24,601,511 Total Borrowings (I + II) 314,148,793 290,071,364 Secured Borrowings included in I & II above 141,107,333 134,440,213
SCHEDULE 5 - OTHER LIABILITIES AND PROVISIONS I. Bills Payable 9,716,565 7,105,404
II. Interest Accrued 10,532,468 7,964,627
III. Others (including provisions) (Refer Note 5 and 19 - Schedule 17) 59,089,772 43,505,177
IV. Proposed Dividend (includes tax on dividend ) 989,304 722,379
Total 80,328,109 59,297,587 SCHEDULE 6 - CASH AND BALANCES WITH RESERVE BANK OF INDIAI. Cash in hand (including foreign currency notes) 5,431,071 4,484,204
II. Balances with RBI in current account 34,020,094 25,120,871
Total 39,451,165 29,605,075 SCHEDULE 7 - BALANCES WITH BANKS AND MONEY AT CALL AND SHORT NOTICEI. In India
(i) Balances with Banks [ Refer Note 4(a) - Schedule 17 ] (a) In Current Accounts 1,683,476 1,471,361
(b) In Other Deposit Accounts 3,569,367 3,431,278
Total 5,252,843 4,902,639 (ii) Money at Call and Short Notice (a) With Banks 17,639,173 7,516,907
Total 17,639,173 7,516,907 Total (i + ii) 22,892,016 12,419,546
II. Outside India(i) In Current Accounts 1,429,759 1,655,652
(ii) In Other Deposit Accounts 5,261,475 22,750,788
Total 6,691,234 24,406,440 Total (I + II) 29,583,250 36,825,986
SCHEDULE 8 - INVESTMENTSI. Investments in India in [ Refer Note 4(b), (c) and (d) - Schedule 17 ]i. Government Securities 278,689,801 211,052,231
ii. Other approved Securities - -
iii. Shares 69,557,572 42,090,863
iv. Debentures and Bonds 79,700,479 89,769,710
v. Associates * 7,347,037 6,507,207
vi. Others [Units, Certificate of Deposits, Commercial Paper (CP), 37,004,808 38,268,628
Security Receipts, RIDF Deposit and Pass Through Certificates (PTC)]
Total 472,299,697 387,688,639 II. Investments Outside India ini. Shares 6,789 3,332
ii. Others [Venture, Private Equity and other similar funds] 1,202,196 218,490
Total 1,208,985 221,822 Total Investments (I + II) 473,508,682 387,910,461
Schedules forming part of Consolidated Balance Sheet as at 31st March, 2015
39
#KONAKONAKOTAKFINANCIAL
HIGHLIGHTSCONSOLIDATED FINANCIAL
STATEMENTSBANK REPORTS
AND STATEMENTS
(` in thousands)
As at 31st March, 2015
As at 31st March, 2014
* Investment in Associates Equity Investment in Associates 1,470,555 992,324
Add : Goodwill on acquisition of Associates 20,856 27,210
(Share of pre-acquisition losses)
Less : Adjustment for Group's share in Associate's Share issue expenses 7,051 -
Less : Capital reserve on Consolidation (Share of pre-acquisition profits) 3,447 3,447
Cost of Investment in Associates 1,480,913 1,016,087 Add : Post-acquisition profit / loss of Associates (Equity method) 5,866,124 5,491,120
Total 7,347,037 6,507,207 SCHEDULE 9 - ADVANCESA. (i) Bills purchased and discounted # 19,723,762 11,753,149
(ii) Cash Credits, Overdrafts and Loans repayable on demand 150,328,609 123,913,952
(iii) Term Loans @ 716,269,775 581,258,139
# Bills purchased and discounted is net of Bills Rediscounted ` 1,258.05 crore
(previous year ` 1,681.10 crore)
@ net of borrowings under Inter Bank Participatory certificates of Nil (previous year ` 600.00 crore)
Total 886,322,146 716,925,240 B. (i) Secured by tangible assets * 726,542,833 596,242,718
(ii) Unsecured 159,779,313 120,682,522
Total 886,322,146 716,925,240 * including advances secured against book debts
I. Payments to and provision for employees [Refer Note 3 and 10 - Schedule 17] 23,754,643 19,151,155
II. Rent, taxes and lighting [Refer Note 15A - Schedule 17] 3,994,215 3,315,312
III. Printing and Stationery 674,783 602,008
IV. Advertisement, Publicity and Promotion 2,181,713 1,647,841
V. Depreciation on Group's property 2,368,933 2,078,572
VI. Directors' fees, allowances and expenses 9,315 6,870
VII. Auditors' fees and expenses 54,252 51,810
VIII. Law Charges 230,429 189,559
IX. Postage, telephones etc. 1,172,465 1,144,130
Schedules forming part of Consolidated Profit and Loss Account for the year ended 31st March, 2015
42 ANNUAL REPORT 2014-15
(` in thousands)
For the year ended 31st March, 2015
For the year ended 31st March, 2014
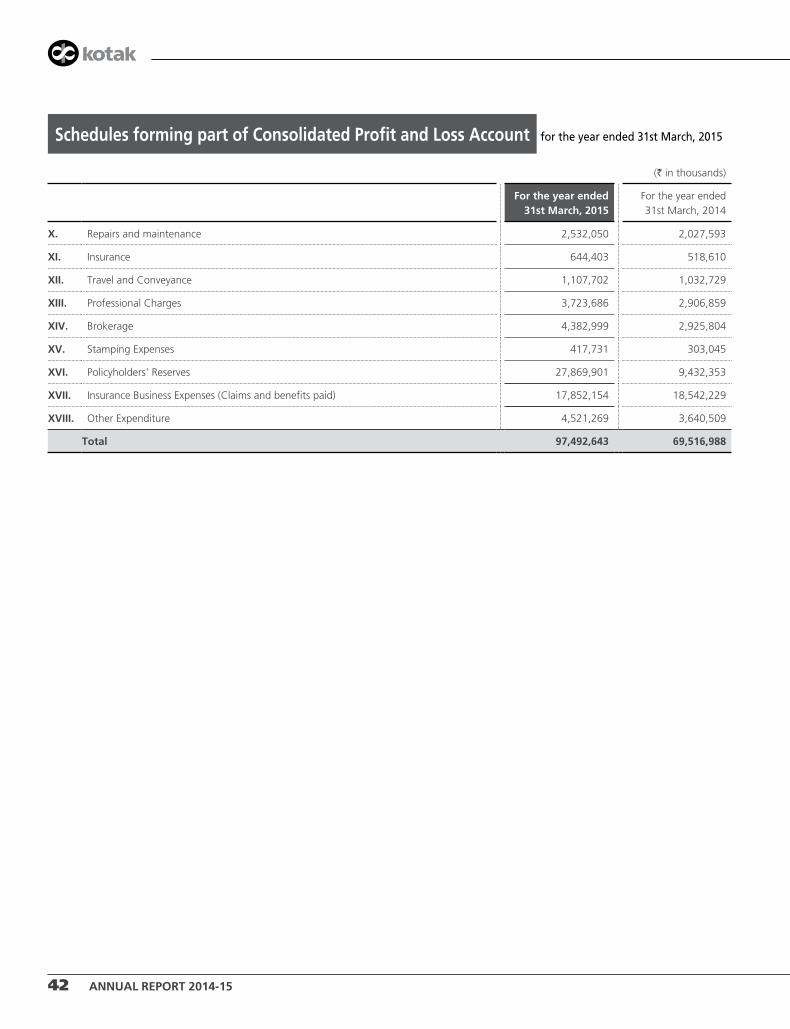
X. Repairs and maintenance 2,532,050 2,027,593
XI. Insurance 644,403 518,610
XII. Travel and Conveyance 1,107,702 1,032,729
XIII. Professional Charges 3,723,686 2,906,859
XIV. Brokerage 4,382,999 2,925,804
XV. Stamping Expenses 417,731 303,045
XVI. Policyholders' Reserves 27,869,901 9,432,353
XVII. Insurance Business Expenses (Claims and benefits paid) 17,852,154 18,542,229
XVIII. Other Expenditure 4,521,269 3,640,509
Total 97,492,643 69,516,988
Schedules forming part of Consolidated Profit and Loss Account for the year ended 31st March, 2015
#KONAKONAKOTAKFINANCIAL
HIGHLIGHTSCONSOLIDATED FINANCIAL
STATEMENTSBANK REPORTS
AND STATEMENTS
Schedules forming part of Consolidated Balance Sheet and Profit and Loss Account
Accounting Policies & Notes
43
SCHEDULE 17 – SIGNIFICANT ACCOUNTING POLICIES AND NOTES TO THE CONSOLIDATED FINANCIAL STATEMENTS
1. BASIS OF CONSOLIDATION :
a. The consolidated financial statements comprising of the financial statements of Kotak Mahindra Bank (“the Bank” or “KMBL”, its subsidiaries, which constitute “the Group”) and its associates are prepared in accordance with Accounting Standard 21 (AS-21), “Consolidated Financial Statements” and Accounting Standard 23 (AS-23), “Accounting for Investments in Associates in Consolidated Financial Statements” specified under Section 133 of the Companies Act, 2013, read with Rule 7 of the Companies (Accounts) Rules, 2014. The Bank consolidates entities in which it holds, directly or indirectly through subsidiaries, more than 50% of the voting rights or where it exercises control, on a line by line basis by adding together like items of assets, liabilities, income and expenses in accordance with AS-21. The Goodwill or Capital Reserve on consolidation represents the difference between the Group’s share in the networth of the subsidiary and the cost of acquisition at the time of making investment in the subsidiary. Intragroup balances, intragroup transactions and resulting unrealised profits / losses, if any, are eliminated in full. Minority interest representing the part of net results of operations and of the net assets of subsidiary attributable to interests not owned directly or indirectly through subsidiaries is presented separately from liabilities and the equity. Further, the Group accounts for investments in entities where it holds 20% to 50% of the voting rights or exercises significant influence by the equity method of accounting in accordance with AS-23. The financial statements of the subsidiaries, jointly controlled entities and associates used in consolidation are drawn up to the same reporting date as that of the holding company i.e. 31st March, 2015.
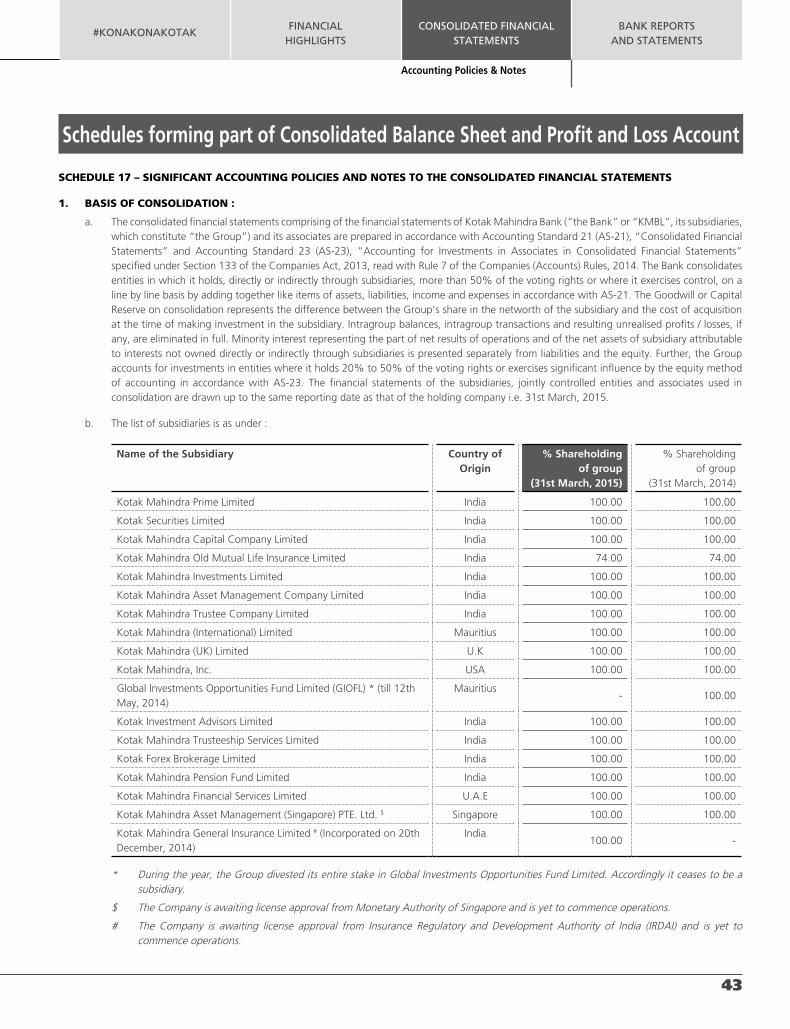
b. The list of subsidiaries is as under :
Name of the Subsidiary Country of Origin
% Shareholdingof group
(31st March, 2015)
% Shareholdingof group
(31st March, 2014)
Kotak Mahindra Prime Limited India 100.00 100.00
Kotak Securities Limited India 100.00 100.00
Kotak Mahindra Capital Company Limited India 100.00 100.00
Kotak Mahindra Old Mutual Life Insurance Limited India 74.00 74.00
Kotak Mahindra Investments Limited India 100.00 100.00
Kotak Mahindra Asset Management Company Limited India 100.00 100.00
Kotak Mahindra Trustee Company Limited India 100.00 100.00
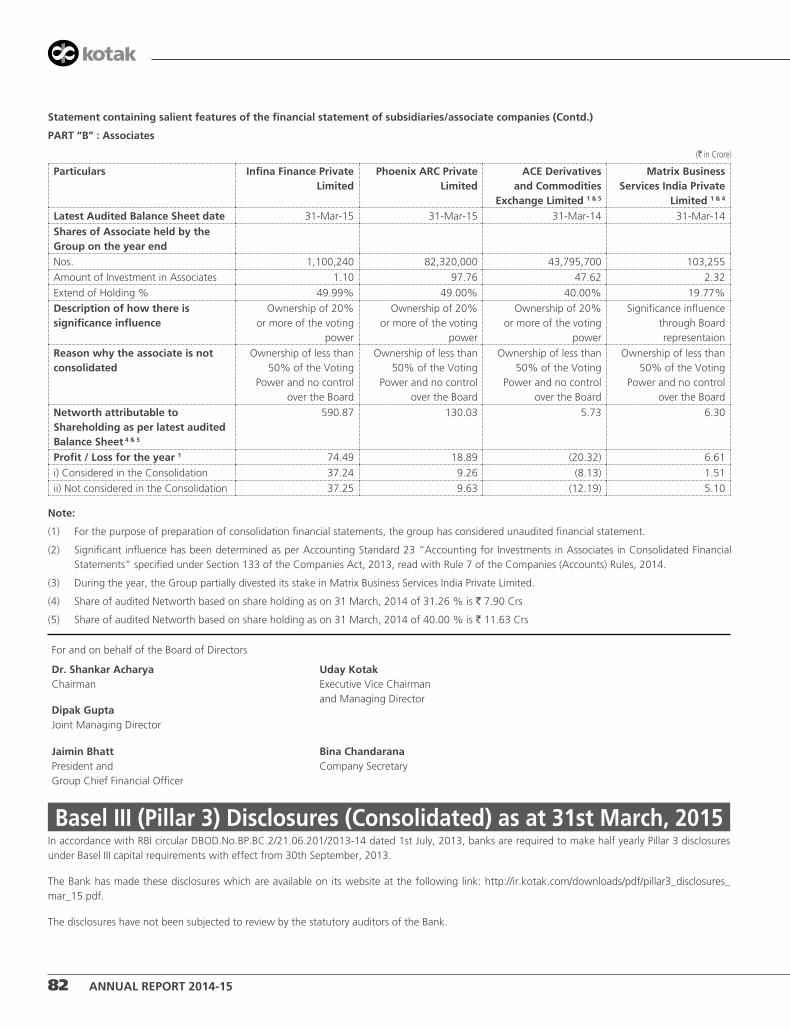
Matrix Business Services India Private Limited (Unaudited) * India 19.77 31.26
* During the year, the Group partially divested its stake in Matrix Business Services India Private Limited. However, the Group continues to account for the investment in accordance with AS-23.
2. SIGNIFICANT ACCOUNTING POLICIES :
A. ACCOUNTING METHODOLOGY
The Financial Statements have been prepared on historical cost basis of accounting. The Group adopts the accrual method of accounting and historical cost convention. The Financial Statements comply in all material aspects with the Accounting Standards specified under section 133 of the Companies Act, 2013 read with Rule 7 of the Companies (Accounts) Rules, 2014 and other relevant provisions of the Companies Act, 2013 (“the 2013 act”) / Companies Act, 1956 (“the 1956 act”), in so far as they apply, guidelines issued by the Reserve Bank of India (“RBI”), Insurance Regulatory and Development Authority of India (“IRDAI”) from time to time as applicable to relevant companies and the generally accepted accounting principles prevailing in India. In case the accounting policies followed by consolidating entities are different from those followed by Bank, the same have been disclosed separately.
B. USE OF ESTIMATES
The preparation of financial statements requires the Management to make estimates and assumptions considered in the reported amounts of assets and liabilities (including contingent liabilities) as on the date of the financial statements and the reported income and expenses during the reporting period. Management believes that the estimates used in preparation of the financial statements are prudent and reasonable. Actual results could differ from these estimates. Any revision in the accounting estimates is recognised prospectively in the current and future periods.
C. REVENUE RECOGNITION
a. Banking / Investing Activity :
i. Interest income (other than in respect of retail advances) is recognised on accrual basis except in case of non-performing assets (NPAs) where the income accrued gets reversed, and then recognised, only upon realisation, as per RBI guidelines. Penal interest is recognised as income on realisation.
ii. Interest income in respect of retail advances {except for a subsidiary, Kotak Mahindra Prime Limited (KMPL)} is accounted for by using the internal rate of return method on the net investment outstanding on the contract.
iii. Interest income on investments in Pass Through Certificates (PTCs) and loans bought out through the direct assignment route is recognised at their effective interest rate.
iv. KMPL accounts for auto finance income (including service charges and incentives) by using the internal rate of return method to provide a constant periodic rate of return after adjustment of brokerage expenses on the net investment outstanding on the contract. The volume-based incentives and brokerage are accounted as and when the said volumes are achieved. Income also includes gains made on termination of contracts.
v. Service charges, fees and commission income are recognised when due except for guarantee commission and letter of credit commission which is recognised over the period of the guarantee / letter of credit respectively, except as indicated in para iv above. Syndication / arranger fee is recognised as income as per the terms of engagement.
vi. Interest income on discounted instruments is recognised over the tenure of the instruments so as to provide a constant periodic rate of return.
#KONAKONAKOTAKFINANCIAL
HIGHLIGHTSCONSOLIDATED FINANCIAL
STATEMENTSBANK REPORTS
AND STATEMENTS
Schedules forming part of Consolidated Balance Sheet and Profit and Loss Account
Accounting Policies & Notes
45
vii. Gain on account of securitisation of assets is amortised over the life of the securities issued in accordance with the guidelines issued by the RBI.
viii. Gain on account of assignment of assets on bilateral basis is recognised based on the difference between the book value of the assigned assets and sale consideration received.
ix. Dividend income is accounted on an accrual basis when the right to receive the dividend is established.
x. In respect of non-performing assets acquired from other Banks / FIs and NBFCs, collections in excess of the consideration paid at each asset level or portfolio level is treated as income in accordance with RBI guidelines and clarifications.
b. Investment Banking Activity :
i. Issue management fees and placement fees, underwriting commission and financial advisory fees are accounted on completion of milestones specified in the contract.
c. Insurance Activity :
i. Premium is recognised as income when it is due from policyholders except on unit linked policies, where the premium is recognised when associated units are created.
ii. In accordance with the terms of insurance policies, uncollected premium on lapsed policies is not recognised as income until revived.
iii. Top Up / Lump sum contributions are accounted as a part of the single premium.
iv. Income from linked policies, which include fund management fees, policy administration charges, mortality charges and other charges, if any, are recovered from the linked fund in accordance with the terms and conditions of the insurance contracts and is accounted for as income when due.
v. Re-insurance premium ceded is accounted on due basis at the time when related premium income is accounted for. Commission on re-insurance ceded is accounted in accordance with the terms and conditions of the re-insurance treaties in the year in which re-insurance is ceded. Profit commission on re-insurance ceded is accounted as income in the year of final determination of profit.
vi. The lending fee (net of brokerage) earned on equity securities lent under Security Lending & Borrowing (SLB) is accrued over the contract period on a straight line basis.
d. Broking Activity :
i. Placement and other fee based income are accounted for on the basis of the progress of the assignment.
ii. Brokerage Income (net of service tax) :
l On fixed deposit is accounted on completion of the transaction.
l On primary market subscription / mobilisation is accounted on receipt of intimation of allotment.
l On secondary market transaction is recognised on the date of the transaction.
iii. Incentive on primary market subscription / mobilisation is accounted on the basis of receipt of intimation of allotment received by the Company.
In respect of depository activity, transaction fees (net of service tax) are recognised on completion of transaction. Account maintenance charges are recognised on time basis over the period of contract.
iv. Portfolio management fees are accounted on accrual basis as follows :
a. In case of fees based on fixed percentage of the corpus / fixed amount, income is accrued over the period of the agreement.
b. In case of fees based on the returns of the portfolio, income is accounted on the termination of the portfolio agreement / on each anniversary as per the agreement, whichever is earlier.
c. In case of upfront non-refundable fee, income is accounted in the year of receipt.
Schedules forming part of Consolidated Balance Sheet and Profit and Loss Account
46 ANNUAL REPORT 2014-15
v. Funds received from Portfolio Management Services (PMS) Investors and corresponding investments made on their behalf are not forming part of these financial statements.
e. Asset Management :
i. Investment management fees are recognised net of service tax on an accrual basis after deducting actual and estimated expenses from total expense accruals in scheme books (adjusted for exclusions as required by SEBI guidelines), such that it does not exceed the rates prescribed by the Securities and Exchange Board of India (‘SEBI’) (Mutual Fund) Regulations, 1996 (the ‘SEBI Regulations’) on an annual basis.
ii. Management fee from venture funds, private equity funds and other similar funds is recognised on accrual basis at the rates specified in the investment management agreement from the date of initial closing of funds under management.
iii. Portfolio Advisory Service fees are recognised net of service tax on accrual basis in accordance with the terms of agreement.
D. FIXED ASSETS AND INTANGIBLE ASSETS
Fixed assets / Intangible assets have been stated at cost less accumulated depreciation / amortisation. Cost includes cost of purchase inclusive of freight, duties and other incidental expenses and all expenditure like site preparation, installation costs and professional fees incurred on the asset before it is ready to put to use. Subsequent expenditure incurred on assets put to use is capitalised only when it increases the future benefit / functioning capability from / of such assets. A rebuttable presumption that the useful life of an Intangible asset will not exceed 10 years from the date the asset is available for use is considered by the Management. Gain or losses arising from the retirement or disposal of a Fixed asset / Intangible asset are determined as the difference between the net disposal proceeds and the carrying amount of assets and recognised as income or expense in the Profit and Loss Account. Profit on sale of premises of the Bank, if any, is transferred to Capital Reserve as per the RBI guidelines.
DEPRECIATION / AMORTISATION :
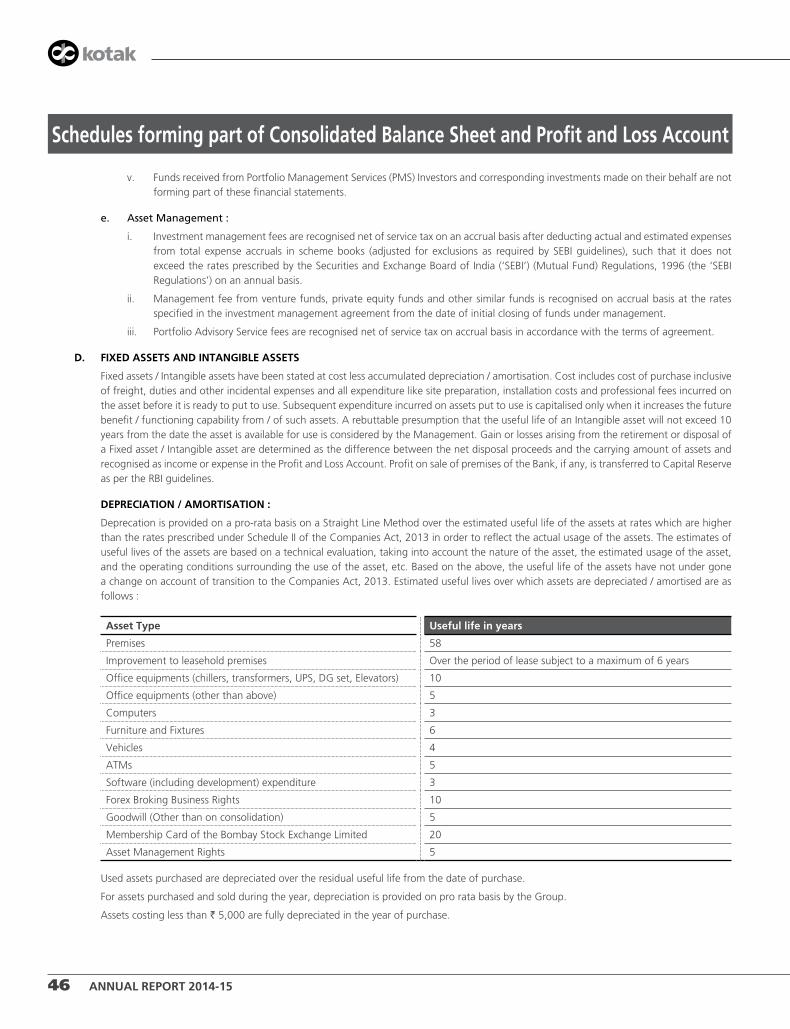
Deprecation is provided on a pro-rata basis on a Straight Line Method over the estimated useful life of the assets at rates which are higher than the rates prescribed under Schedule II of the Companies Act, 2013 in order to reflect the actual usage of the assets. The estimates of useful lives of the assets are based on a technical evaluation, taking into account the nature of the asset, the estimated usage of the asset, and the operating conditions surrounding the use of the asset, etc. Based on the above, the useful life of the assets have not under gone a change on account of transition to the Companies Act, 2013. Estimated useful lives over which assets are depreciated / amortised are as follows :
Asset Type Useful life in years
Premises 58
Improvement to leasehold premises Over the period of lease subject to a maximum of 6 years
Membership Card of the Bombay Stock Exchange Limited 20
Asset Management Rights 5
Used assets purchased are depreciated over the residual useful life from the date of purchase.
For assets purchased and sold during the year, depreciation is provided on pro rata basis by the Group.
Assets costing less than ` 5,000 are fully depreciated in the year of purchase.
#KONAKONAKOTAKFINANCIAL
HIGHLIGHTSCONSOLIDATED FINANCIAL
STATEMENTSBANK REPORTS
AND STATEMENTS
Schedules forming part of Consolidated Balance Sheet and Profit and Loss Account
Accounting Policies & Notes
47
E. EMPLOYEE BENEFITS
i Provident Fund – Defined Contribution Plan :
Contribution as required by the Statute made to the Government Provident Fund is debited to the Profit and Loss Account when incurred. The Group has no further obligations.
ii Gratuity – Defined Benefit Plan :
The Group provides for Gratuity, a defined benefit plan covering employees in accordance with the Payment of Gratuity Act, 1972. The Group’s liability is actuarially determined (using Projected Unit Credit Method) at the Balance Sheet date. The Bank and four of its subsidiaries make contributions to a Gratuity Fund administered by trustees and managed by a life insurance company. In other subsidiaries gratuity obligation is wholly unfunded. The contribution made to the trusts is recognised as planned assets. The defined benefit obligation recognised in the Balance Sheet represents the present value of the defined benefit obligation as reduced by the fair value of the plan assets.
iii Actuarial gains / losses are recognised immediately in the Profit and Loss Account in the year they are incurred.
iv Superannuation Fund – Defined Contribution Plan :
The Group contributes a sum equivalent to 15% of eligible employees’ salary subject to a maximum of ` 0.01 crore per eligible employee per annum, to the Superannuation Funds administered by trustees and managed by a Life Insurance Company. The Group recognises such contributions as an expense in the year they are incurred.
v New Pension Scheme - Defined Contribution Plan :
The Group contributes upto 10% of eligible employees’ salary per annum, to the New Pension Fund administered by a Pension Fund Regulatory and Development Authority (PFRDA) appointed pension fund manager. The Group recognises such contributions as an expense in the year they are incurred.
vi Compensated Absences - Other Long-Term Employee Benefits :
The Group accrues the liability for compensated absences based on the actuarial valuation as at the Balance Sheet date conducted by an independent actuary which includes assumptions about demographics, early retirement, salary increases, interest rates and leave utilisation. The net present value of the Group’s obligation is determined based on the Projected Unit Credit Method as at the Balance Sheet date. Actuarial Gains / Losses are recognised in the Profit and Loss Account in the year in which they arise.
vii Other Employee Benefits :
As per the Group policy, employees are eligible for an award after completion of a specified number of years of service with the Group. The obligation is measured at the Balance Sheet date on the basis of an actuarial valuation using the Projected Unit Credit Method.
The undiscounted amount of short-term employee benefits expected to be paid in exchange for the services rendered by employees is recognised during the period when the employee renders the service. These benefits include performance incentives.
F. INVESTMENTS
For the Bank
1. Classification :
In accordance with the RBI guidelines on investment classification and valuation, investments are classified on the date of purchase into “Held for Trading”(‘HFT’) “Available for Sale”(‘AFS’) and “Held to Maturity”(‘HTM’) categories (hereinafter called “categories”). Subsequent shifting amongst the categories is done in accordance with the RBI guidelines at the lower of the acquisition cost / carrying value / market value on the date of the transfer and depreciation, if any, on such transfer is fully provided.
Under each of these categories, investments are further classified under six groups (hereinafter called “groups”) - Government Securities, Other Approved Securities, Shares, Debentures and Bonds, Investments in Subsidiaries / Joint Ventures and Other Investments for the purposes of disclosure in the Balance Sheet.
Schedules forming part of Consolidated Balance Sheet and Profit and Loss Account
48 ANNUAL REPORT 2014-15
The Bank follows ‘Settlement Date’ accounting for recording purchase and sale transactions in securities, except in the case of equity shares where ‘Trade Date’ accounting is followed.
Basis of classification :
Investments that are held principally for resale within 90 days from the date of purchase are classified under HFT category. As per the RBI guidelines, HFT securities, which remain unsold for a period of 90 days are reclassified as AFS securities as on that date. Investments which the Bank intends to hold till maturity are classified as HTM securities. The Bank has classified investments in subsidiaries, joint ventures and associates under HTM category. Investments which are not classified in either of the above two categories are classified under AFS category.
2. Acquisition Cost :
The cost of investments is determined on weighted average basis. Broken period interest on debt instruments and government securities are considered as a revenue item. The transaction costs including brokerage, commission etc. paid at the time of acquisition of investments is charged to Profit and Loss Account.
3. Disposal of investments :
• Investments classified as HFT or AFS - Profit or loss on sale / redemption is included in the Profit and Loss Account.
• Investments classified as HTM - Profit on sale / redemption of investments is included in the Profit and Loss Account and is appropriated to Capital Reserve after adjustments for tax and transfer to Statutory Reserve. Loss on sale / redemption is charged to the Profit and Loss Account.
4. Valuation :
The valuation of investments is performed in accordance with the RBI guidelines as follows :
a. Investments classified as HTM – These are carried at their acquisition cost. Any premium on acquisition of debt instruments / government securities are amortised over the balance maturity of the security on a straight line basis. Any diminution, other than temporary, in the value of such securities is provided.
b. Investments classified as HFT or AFS – Investments in this category are marked to market and the net depreciation, if any, within each group is recognised in the Profit and Loss Account. Net appreciation, if any, is ignored. Further, provision for diminution other than temporary is made for, at the individual security level. Except in cases where provision for diminution other than temporary is created, the book value of the individual securities is not changed as a result of periodic valuations.
c. The market / fair value of quoted investments included in the ‘AFS’ and ‘HFT’ categories is measured with respect to the market price of the scrip as available from the trades / quotes on the stock exchanges, SGL account transactions, price list of RBI or prices declared by Primary Dealers Association of India (‘PDAI’) jointly with Fixed Income Money Market and Derivatives Association of India (‘FIMMDA’) as at the year end.
d. Treasury Bills, Exchange Funded Bills, Commercial Paper and Certificate of Deposits being discounted instruments, are valued at carrying cost.
e. Units of mutual funds are valued at the latest repurchase price / net asset value declared by the mutual fund.
f. Market value of investments where current quotations are not available, is determined as per the norms prescribed by the RBI as under :
• In case of unquoted bonds, debentures and preference shares where interest/dividend is received regularly (i.e. not overdue beyond 90 days), the market price is derived based on the YTM for Government Securities as published by FIMMDA / PDAI and suitably marked up for credit risk applicable to the credit rating of the instrument. The matrix for credit risk mark-up for each categories and credit ratings along with residual maturity issued by FIMMDA is adopted for this purpose;
• In case of bonds and debentures (including Pass Through Certificates) where interest is not received regularly (i.e. overdue beyond 90 days), the valuation is in accordance with prudential norms for provisioning as prescribed by the RBI. Interest on such securities is not recognised in the Profit and Loss Account until received;
#KONAKONAKOTAKFINANCIAL
HIGHLIGHTSCONSOLIDATED FINANCIAL
STATEMENTSBANK REPORTS
AND STATEMENTS
Schedules forming part of Consolidated Balance Sheet and Profit and Loss Account
Accounting Policies & Notes
49
• Equity shares, for which current quotations are not available or where the shares are not quoted on the stock exchanges, are valued at break-up value (without considering revaluation reserves, if any) which is ascertained from the Company’s latest Balance Sheet. In case the latest Balance Sheet is not available, the shares are valued at ` 1 per Company;
• Units of Venture Capital Funds (VCF) held under AFS category where current quotations are not available are marked to market based on the Net Asset Value (NAV) shown by VCF as per the latest audited financials of the fund. In case the audited financials are not available for a period beyond 18 months, the investments are valued at ` 1 per VCF. Investment in unquoted VCF after 23rd August, 2006 are categorised under HTM category for the initial period of three years and valued at cost as per RBI guidelines;
• Security receipts are valued as per the Net Asset Value (NAV) obtained from the issuing Reconstruction Company / Securitisation Company.
g. Non-performing investments are identified and valued based on the RBI guidelines.
h. Repurchase and reverse repurchase transactions - Securities sold under agreements to repurchase (Repos) and securities purchased under agreements to resell (Reverse Repos) are accounted as collateralised borrowing and lending transactions respectively. The difference between the consideration amount of the first leg and the second leg of the repo is recognised as interest income / interest expense over the period of the transaction.
For the insurance company :
a. Investments are recorded at cost on trade date which includes brokerage, transfer charges, transaction taxes as applicable, etc. but excludes pre-acquisition interest, if any and service tax on brokerage where cenvat credit is being claimed.
b. Bonus entitlements are recognised as investments on the ‘ex- bonus date’. Rights entitlements are recognised as investments on the ‘ex-rights date’.
c. Gain / Loss on transfer / sale of securities is the difference between the transfer / sale price and the net amortised cost / book value which is computed on a weighted average basis as on the date of transfer / sale. Sale consideration for the purpose of realised gain / loss is net of brokerage and taxes, if any.
Valuation – Shareholders’ Investments and non-linked policy-holders’ investments
d. All debt securities are considered as “held to maturity” for the purpose of valuation and are accordingly recorded at historical cost (excluding interest paid, if any). Debt securities including Government securities are stated at net amortised cost. Money market instruments are valued at historical cost subject to accretion of discount. The premium / discount, if any, on purchase of debt securities is amortised / accreted over the period to maturity on an internal rate of return.
e. Listed equity shares as at the Balance Sheet date are stated at fair value being the quoted closing price on National Stock Exchange Limited (“NSE”). If an equity share is not listed or traded on NSE, the share price of Bombay Stock Exchange Limited (“BSE”) is used. Equity shares awaiting listing are stated at historical cost subject to provision for diminution, if any.
In case of impairment in the value of investment as at the Balance Sheet date which is other than temporary, the amount of loss is recognised as an expense in the Profit and Loss Account to the extent of difference between the remeasured fair value of the investment and its acquisition cost as reduced by any previous impairment loss is recognised as expense in Profit and Loss Account. Any reversal of impairment loss is recognised in the Profit and Loss Account.
f. Investments in mutual funds are valued at the previous day’s Net Asset Value (NAV) of the funds in which they are invested. Investments in Alternative Investment Funds are valued at the NAV.
g. Unrealised gains due to change in the fair value of the investments is taken to a fair value change account and is adjusted in the carrying value of investment. The unrealised loss due to change in the fair value of investments, other than due to reversal of the gains recognised in fair value change account, is accounted in the Profit and Loss Account. The profit or loss on sale of investments includes the accumulated changes in the fair value change account.
h. Real estate investment property represents land or building held for investment purpose to earn rental income or for capital appreciation and is not occupied by the company. Such Investment property is initially valued at cost including any direct attributable cost. Investment
Schedules forming part of Consolidated Balance Sheet and Profit and Loss Account
50 ANNUAL REPORT 2014-15
in the real estate investment property is valued at historical cost plus revaluation, if any. Revaluation of the investment property is done at least once in three years. Any change in the carrying amount of the investment property is accounted to Revaluation Reserve. Impairment loss, if any, exceeding revaluation reserve is recognised as expenses in the Profit and Loss Account.
Valuation – Unit linked Business
i. All Government securities, except treasury bills, for linked business are valued at prices obtained from Credit Rating Information Service of India Limited (CRISIL). Debt Securities other than Government Securities are valued on the basis of CRISIL Bond valuer. The discount on purchase of treasury bills, certificate of deposit, commercial papers and CBLO are amortised over the period to maturity on an internal rate of return basis.
j. Listed equity shares are valued at fair value, being the last quoted closing price on the NSE (In case of securities not listed on NSE, the last quoted closing price on the BSE is used). Equity shares awaiting listing are stated at historical cost subject to provision for diminution, if any, in the value of such investment determined separately for each individual investment. Unrealised gains and losses are recognised in the Profit and Loss Account.
k. Mutual Fund Units are valued at the previous day’s closing Net Asset Value (NAV) of the fund in which they are invested.
l. All redeemable preference shares are considered as held to maturity and stated at historical cost, subject to amortisation of premium or accretion of discount over the period of maturity / holding on a straight line basis.
m. Transfer of investments (other than debt securities) from Shareholders’ fund to the Policyholders’ fund is at book value or market price, whichever is lower. Transfer of debt securities from Shareholders’ to Policyholders’ fund is transacted at the lower of net amortised cost or market value. Transfer of Investments between unit-linked funds are done at prevailing market price.
For other entities :
As required by Accounting Standard 13 (AS-13) “Accounting for Investments” specified under Section 133 of the Companies Act, 2013, read with Rule 7 of the Companies(Accounts) Rules, 2014, investments are classified into long term investments and current investments. Investments, which are intended to be held for more than one year from the date, on which the investments are made, are classified as long term investments and investments, which are intended to be held for less than one year from the date, on which the investments are made, are classified as current investments. Long term investments are carried at cost and provision for diminution in value is made to recognise a decline other than temporary in the value of investment, such reduction being determined and made for each investment individually. Current investments are valued at cost (calculated by applying weighted average cost method) or market / fair value whichever is lower. In case of investments in units of a mutual fund, the NAV of units is considered as market / fair value. The Securities acquired with the intention to trade are considered as Stock-in-Trade. Investments classified as “Stock-in-Trade” by some of the subsidiaries are valued at cost (calculated by applying weighted average cost method) or market price, whichever is lower. Brokerage, stamping and additional charges paid are included in the cost of investments. The profit or loss on sale of securities is recognised on trade date in the statement of Profit and loss account.
Securities lending and borrowing
a) Initial margin and / or additional margin paid over and above the initial margin, for entering into contracts for equity stock which are released on final settlement / squaring – up of the underlying contracts, are disclosed under Other Assets.
b) The marked to market on securities lending and borrowing instrument is determined on a portfolio basis with net unrealised losses being recognised in the Profit and Loss Account. Net unrealised gains are not recognised in the Profit and Loss Account on grounds of prudence as enunciated in Accounting Standard – 1 (AS-1) Disclosure of Accounting Policies specified under Section 133 of the Companies Act, 2013, read with rule 7 of the Companies (Accounts) Rules, 2014.
c) On final settlement or squaring up of contracts for equity stocks the realised profit or loss after adjusting the unrealised loss already accounted, if any, is recognised in the Profit and Loss Account.
d) The Lending and borrowing fees are recognised on pro-rata basis on the tenure of the contract.
#KONAKONAKOTAKFINANCIAL
HIGHLIGHTSCONSOLIDATED FINANCIAL
STATEMENTSBANK REPORTS
AND STATEMENTS
Schedules forming part of Consolidated Balance Sheet and Profit and Loss Account
Accounting Policies & Notes
51
G. FOREIGN CURRENCY AND DERIVATIVE TRANSACTIONS
For the Bank :
i. Foreign currency monetary assets and liabilities are translated at the Balance Sheet date at rates notified by the Foreign Exchange Dealers’ Association of India (FEDAI) and the resultant gain or loss is accounted in the Profit and Loss Account.
ii. Income and Expenditure items are translated at the rates of exchange prevailing on the date of the transaction except for representative office expenses which are translated at the monthly average rate of exchange.
iii. Outstanding forward exchange contracts (other than deposit and placement swaps) and spot contracts outstanding at the Balance Sheet date are revalued at rates notified by FEDAI for specified maturities and at interpolated rates of interim maturities. In case of forward contracts of greater maturities where exchange rates are not notified by FEDAI are revalued at the forward exchange rates implied by the swap curves in respective currencies. The resulting profits or losses are included in the Profit and Loss Account as per the regulations stipulated by the RBI / FEDAI.
iv. Foreign exchange swaps “linked” to foreign currency deposits and placements are translated at the prevailing spot rate at the time of swap. The premium / discount on the swap arising out of the difference in the exchange rate of the swap date and the maturity date of the underlying forward contract is amortised over the period of the swap and the same is recognised in the Profit and Loss Account.
v. Contingent liabilities on account of foreign exchange contracts, letters of credit, bank guarantees and acceptances and endorsements outstanding as at the Balance Sheet date on account of outstanding foreign exchange contracts are restated at year-end rates notified by FEDAI.
vi. Notional amounts of derivative transactions comprising of forwards, swaps, futures and options are disclosed as off Balance Sheet exposures. The Bank recognises all derivative contracts (other than those designated as hedges) at fair value, on the date on which the derivative contracts are entered into and are re-measured at fair value as at the balance sheet or reporting dates. Derivatives are classified as assets when the fair value is positive (positive marked to market) or as liabilities when the fair value is negative (negative marked to market). Changes in the fair value of derivatives other than those designated as hedges are recognised in the Profit and Loss Account.
vii. Outstanding derivative transactions designated as “Hedges” are accounted in accordance with hedging instrument on an accrual basis over the life of the underlying instrument. Option premium paid / received is accounted for in the Profit and Loss Account on expiry of the option. Option contracts are marked to market on every reporting date.
For other entities :
viii. On initial recognition, all foreign transactions are recorded by applying to the foreign currency amount exchange rate between the reporting currency and the foreign currency at the date of the transaction.
ix. Monetary assets and liabilities denominated in foreign currencies are restated at the closing rate of exchange as on the Balance Sheet date.
x. Exchange differences arising on settlement of the transaction and on account of restatement of assets and liabilities are dealt with in the Profit and Loss Account. In case of items which are covered by forward exchange contracts entered to hedge the foreign currency risk, the difference between the year-end rate and the rate on the date of the contract is recognised as exchange difference in the Profit and Loss Account and the premium paid on forward exchange contracts is amortised as expense or income over the life of the contract. Any profit / loss on cancellation or renewal of such a forward exchange contract is recognised as income or as expense.
xi. The financial statements of all subsidiaries incorporated outside India which are in the nature of non-integral foreign operations are converted on the following basis : (a) Income and expenses are converted at the average rate of exchange applicable for the year and (b) All assets and liabilities are translated at the closing rate as on the Balance Sheet date. The exchange difference arising out of year end translation is debited or credited as “Foreign Currency Translation Reserve” forming part of “Reserves and Surplus”.
Interest rate / Currency swaps :
xii. The outstanding swap trades at the Balance Sheet date are disclosed at the contract amount. The swaps which are in the nature of hedges are accounted on an accrual basis; these contracts are not marked to market. Accrued interest is adjusted against the interest
Schedules forming part of Consolidated Balance Sheet and Profit and Loss Account
52 ANNUAL REPORT 2014-15
cost / income of the underlying liability / asset. The foreign currency balances on account of principal of currency swaps outstanding as at the Balance Sheet date are revalued using the closing rate.
Currency options :
xiii. The outstanding option trades, in the nature of hedge, at the Balance Sheet date are disclosed at the contract amount. The premium paid is amortised over the life of the contract.
Equity index / equity futures, equity index / equity options, embedded derivatives / other derivatives :
xiv. Outstanding derivative contracts, including embedded derivatives, are measured at fair value as at each Balance Sheet date. Fair value of derivatives is determined using quoted market prices in an actively traded market, for the instrument, wherever available, as the best evidence of fair value. In the absence of quoted market prices in an actively traded market, a valuation technique is used to determine the fair value. In most cases the valuation techniques use observable market data as input parameters in order to ensure reliability of the fair value measure.
xv. The marked to market on derivative contracts is determined on a portfolio basis with net unrealised losses being recognised in the Profit and Loss Account. Net unrealised gains are not recognised in the Profit and Loss Account on grounds of prudence as enunciated in Accounting Standard – 1 (AS-1) Disclosure of Accounting Policies specified under Section 133 of the Companies Act, 2013, read with rule 7 of the Companies (Accounts) Rules, 2014.
xvi. Initial Margin - Derivative Instrument representing the initial margin paid and / or additional margin paid over and above the initial margin, for entering into contracts for equity index / stock futures and equity index / stock options / other derivatives, which are released on final settlement / squaring–up of the underlying contracts, are disclosed under Other Assets. “Deposit for Mark to Market Margin - Derivative Instrument” representing the deposit paid in respect of mark to market margin is disclosed under Other Assets.
xvii. On final settlement or squaring up of contracts for equity index / stock futures / other derivatives, the realised profit or loss after adjusting the unrealised loss already accounted, if any, is recognised in the Profit and Loss Account and shown as Profit / (Loss) on exchange transactions (net).
xviii. On settlement or squaring up of equity index / stock options / other derivatives before expiry, the premium prevailing in option contracts on that date is recognised in the Profit and Loss Account.
xix. When more than one contract in respect of the relevant series of equity index / stock futures or equity index / stock options / other derivatives contract to which the squared-up contract pertains is outstanding at the time of the squaring-up of the contract, the contract price of the contract so squared-up is determined using the weighted average cost method for calculating the profit / loss on squaring-up.
H. ADVANCES
Classification :
i. Advances are classified as performing and non-performing advances (‘NPAs’) based on the RBI guidelines and are stated net of bills rediscounted, specific provisions, interest in suspense for non-performing advances, claims received from Export Credit Guarantee Corporation, provisions for funded interest term loan classified as non-performing advances and provisions in lieu of diminution in the fair value of restructured assets. Also, NPAs are classified into sub-standard, doubtful and loss assets. Interest on NPAs is transferred to an interest suspense account and not recognised in the Statement of Profit and Loss until received.
ii. Amounts paid for acquiring non-performing assets from other Banks and NBFCs are considered as advances. Actual collections received on such non-performing assets are compared with the cash flows estimated while purchasing the asset to ascertain overdue. If the overdue is in excess of 90 days, the Bank classifies such assets into sub-standard, doubtful or loss as required by the RBI guidelines on purchase of non-performing assets.
iii. The Bank transfers advances through inter-bank participation with and without risk. In accordance with the RBI guidelines, in the case of participation with risk, the aggregate amount of the participation issued by the Bank is reduced from advances and where the Bank is participating, the aggregate amount of the participation is classified under advances. In the case of participation without risk, the aggregate amount of participation issued by the Bank is classified under borrowings and where the Bank is participating, the aggregate amount of participation is shown as due from banks under advances.
#KONAKONAKOTAKFINANCIAL
HIGHLIGHTSCONSOLIDATED FINANCIAL
STATEMENTSBANK REPORTS
AND STATEMENTS
Schedules forming part of Consolidated Balance Sheet and Profit and Loss Account
Accounting Policies & Notes
53
Provisioning :
For Bank :
iv. Provision for non-performing assets comprising sub-standard, doubtful and loss assets is made in accordance with the RBI guidelines. In addition, the Group considers accelerated specific provisioning that is based on past experience, evaluation of security and other related factors. Specific loan loss provision in respect of non-performing advances are charged to the Profit and Loss Account. Any recoveries made by the Bank in case of NPAs written off are recognised in the Profit and Loss Account.
v. The Bank considers a restructured account as one where the Bank, for economic or legal reasons relating to the borrower’s financial difficulty, grants to the borrower concessions that the Bank would not otherwise consider. Restructuring would normally involve modification of terms of the advance / securities, which would generally include, among others, alteration of repayment period / repayable amount / the amount of installments / rate of interest (due to reasons other than competitive reasons). Restructured accounts are classified as such by the Bank only upon approval and implementation of the restructuring package. Necessary provision for diminution in the fair value of a restructured account is made. Restructuring of an account is done at a borrower level.
vi. In accordance with RBI guidelines the Bank has provided general provision on standard assets including credit exposures computed as per the current marked to market values of interest rate and foreign exchange derivative contracts, and gold at levels stipulated by RBI from time to time - direct advances to sectors agricultural & SME at 0.25%, commercial real estate at 1.00%, restructured standard advances progressively to reach 5%, teaser rate housing loans at 2.00%, commercial real estate-residential housing at 0.75% and for other sectors at 0.40%.
vii. Further to provisions required as per the asset classification status, provisions are held for individual country exposure (except for home country) as per the RBI guidelines. Exposure is classified in the seven risk categories as mentioned in the Export Credit Guarantee Corporation of India Ltd. (‘ECGC’) guidelines and provisioning is done for that country if the net funded exposure is one percent or more of the Bank’s total assets based on the rates laid down by the RBI
viii. Provision for Unhedged Foreign Currency Exposure of borrowers are made as per the RBI guidelines.
For other entities :
ix. The Non-Banking Finance Company (NBFC) subsidiaries provide general provision on standard assets at 0.25% in accordance with the RBI guidelines.
x. Life insurance subsidiary provides general provision on standard assets at 0.40% in accordance with the IRDAI guidelines.
I. STRUCTURED LIABILITIES
The Group has issued structured liabilities wherein the return on these liabilities is linked to non-interest benchmarks; these liabilities are stated at net present value. Such structured liabilities have an embedded derivative which is the non-interest related return component. The embedded derivative is separated from the host contract and accounted separately {Refer Note 2 (G)(xiv)}.
The resultant debt component of such structured liabilities is recognised in the Balance Sheet under borrowings and is measured at amortised cost on a yield to maturity basis.
J. LIABILITY FOR POLICIES
i Provision is made for policy liabilities in respect of all “in force” policies and “lapsed policies” that are likely to be revived in future based on actuarial valuation done by the Appointed Actuary in accordance with accepted actuarial practices, requirements of IRDAI and the Institute of Actuaries of India.
ii Liabilities in respect of unit-linked policies which have lapsed and are not likely to be revived, are shown as Policyholders’ liabilities until expiry of the revival period.
iii Linked liabilities comprise of unit liability representing the fund value of policies.
K. ACTUARIAL METHOD – LIFE INSURANCE
i Actuarial method and assumptions : The actuarial liabilities have been calculated in accordance with generally accepted actuarial principles, the requirements of the Insurance Act 1938, IRDAI regulations and the prescribed guidance notes of the Institute of
Schedules forming part of Consolidated Balance Sheet and Profit and Loss Account
54 ANNUAL REPORT 2014-15
Actuaries of India by appointed actuary. In respect of unit linked policies, a unit reserve equal to the value of units as on the Balance Sheet date and an additional non-unit reserve calculated on gross premium prospective valuation method is created. The method adopted for par policies (accumulation contracts) is the value of the accumulated fund and an additional non-unit reserve calculated on gross premium prospective valuation method. In respect of individual conventional business / Group where premiums are guaranteed for more than one year, gross premium prospective method is used. Additional reserve on lapsed unit-linked policies is created and shown as ‘Policyholders’ Funds’.
ii The assumptions used in the Gross Premium valuation are based on conservative best estimates together with appropriate margins for adverse deviations from experience. The principal assumptions are interest, inflation, return to policyholders’ accounts, lapses, expenses, mortality and morbidity.
iii Reserves for group life one year renewable policies are calculated as the risk premium for the unexpired term with an allowance for expenses and a margin for adverse deviations. The actuarial liability for Group fund based / VIP fund is equal to premiums net of deductions accumulated with guaranteed interest plus a non-unit reserve to provide for expense and mortality.
iv Reserve for freelook cancellation is held to meet any premium refunds from policy freelook cancellations.
L. DISCOUNTED INSTRUMENTS
The liability is recognised at face value at the time of issuance of discounted instruments. The discount on the issue is amortised over the tenure of the instrument.
M. ACQUISITION COSTS
Acquisition costs such as commission and medical fees are costs that vary with and are primarily related to the acquisition of new and renewal insurance contracts. Such costs are recognised in the year in which they are incurred.
N. BULLION
The Bank imports bullion including precious metal bars on a consignment basis for selling to its wholesale and retail customers. The difference between the sale price to customers and actual price quoted by supplier is reflected under other income.
The Bank also borrows and lends gold, which is treated as borrowings / lending as the case may be in accordance with the RBI guidelines and the interest paid / received classified as interest expense / income and is accounted on an accrual basis.
O. TAXES ON INCOME
The Income Tax expense comprises Current tax and Deferred tax. Current tax is measured at the amount expected to be paid in India in respect of taxable income for the year in accordance with the Income tax Act, 1961 enacted in India. Tax expense relating to overseas subsidiaries are determined in accordance with the tax laws applicable in countries where such subsidiary is domiciled.
Minimum alternate tax (MAT) paid in a year is charged to the Profit and Loss Account as current tax. The Group recognises MAT credit available as an asset only to the extent that there is convincing evidence that the Group will pay normal income tax during the specified period, i.e., the period for which MAT credit is allowed to be carried forward.
Deferred tax assets and liabilities are recognised for the future tax consequences of timing differences being the difference between the taxable income and the accounting income that originate in one period and are capable of reversal in one or more subsequent period.
Deferred tax assets on account of timing differences are recognised only to the extent there is reasonable certainty that sufficient future taxable income will be available against which such deferred tax assets can be realised. In case of carry forward losses and unabsorbed depreciation, under tax laws, the deferred tax assets are recognised only to the extent there is virtual certainty supported by convincing evidence that sufficient future taxable income will be available against which such deferred tax assets can be realised.
Deferred tax assets and liabilities are measured using tax rates and tax laws that have been enacted or substantively enacted at the Balance Sheet date. Changes in deferred tax assets / liabilities on account of changes in enacted tax rates are given effect to in the Profit and Loss Account in the period of the change. The carrying amount of deferred tax assets are reviewed at each Balance Sheet date. The Group writes-down the carrying amount of a deferred tax asset to the extent that it is no longer reasonably certain or virtually certain, as the case may be, that sufficient future taxable income will be available against which deferred tax asset can be realised.
#KONAKONAKOTAKFINANCIAL
HIGHLIGHTSCONSOLIDATED FINANCIAL
STATEMENTSBANK REPORTS
AND STATEMENTS
Schedules forming part of Consolidated Balance Sheet and Profit and Loss Account
Accounting Policies & Notes
55
Deferred tax assets and deferred tax liabilities are off set when there is legally enforceable right to set-off assets against liabilities representing current tax and where the deferred tax assets and deferred tax liabilities relate to taxes on income levied by the same governing taxation laws. Deferred tax assets and deferred tax liabilities across various entities are not set off against each other as the Group does not have a legal right to do so.
P. SEGMENT REPORTING
In accordance with guidelines issued by the RBI vide DBOD.No.BP.BC.81/21.01.018/2006-07 dated 18th April, 2007 and Accounting Standard 17 (AS-17) on “Segment Reporting” specified under Section 133 of the Companies Act, 2013, read with Rule 7 of the Companies(Accounts) Rules, 2014, the Group’s business has been segregated into the following segments whose principal activities are as under :
Segment Principal activity
Treasury, Investments and BMU Dealing in debt, equity, money market, forex market, derivatives and investments and primary dealership of Government securities and Balance Sheet Management unit (BMU) responsible for Asset Liability Management.
Retail Banking Includes :
(1) Lending
Commercial vehicle finance, personal loans, home loans, agriculture finance, other loans / services and exposures which fulfill the four criteria for retail exposures laid down in Basel Committee on Banking Supervision document “International Convergence of Capital Measurement and Capital Standards : A Revised Framework”
(2) Branch Banking
Retail borrowings covering savings, current and term deposit accounts and Branch Banking network and services including distribution of financial products.
(3) Credit cards
Receivables / loans relating to credit card business.
Corporate / Wholesale Banking Wholesale borrowings and lendings and other related services to the corporate sector which are not included in Retail Banking.
Vehicle Financing Retail vehicle finance and wholesale trade finance
Other Lending Activities Financing against securities, securitisation and other loans / services not included under Retail Banking and Corporate / Wholesale Banking
Broking Brokerage income on market transactions done on behalf of clients, interest on delayed payments, distribution of financial products and forex broking.
Advisory and Transactional Services
Providing financial advisory and transactional services such as mergers and acquisition advice and equity / debt issue management services and revenue from being a professional clearing member.
Asset Management Management of investments on behalf of clients and funds.
Insurance Life insurance and General Insurance (Incorporated on 20th December, 2014)
A transfer pricing mechanism between segments has been established to arrive at interest cost on the borrowings of the segments based on borrowing costs, maturity profile of assets / liabilities etc. and which is disclosed as part of segment revenue.
Segment revenues consists of earnings from external customers and inter-segment revenue as stated above. Segment expenses consist of interest expenses including those allocated, operating expenses and provisions.
Segment results are net of segment revenue and segment expenses.
Segment assets include assets related to segments and exclude tax related assets. Segment liabilities include liabilities related to the segment excluding net worth, minority interest and employees’ stock option (grants outstanding), proposed dividend and dividend tax thereon.
Since the business operations of the Group are primarily concentrated in India, the Group is considered to operate only in the domestic segment.
Schedules forming part of Consolidated Balance Sheet and Profit and Loss Account
56 ANNUAL REPORT 2014-15
Q. EMPLOYEE SHARE BASED PAYMENTS
Equity-settled :
The Bank has formulated Employee Stock Option Schemes (ESOSs) in accordance with Securities and Exchange Board of India (Employee Stock Option Scheme) Guidelines, 1999. The Schemes provide for grant of options to employees of the Group to acquire the equity shares of the Bank that vest in cliff vesting or in a graded manner and that are to be exercised within a specified period. In accordance with the SEBI Guidelines and the guidance note on “Accounting for Employee Share-based payments” issued by The Institute of Chartered Accountants of India, the excess, if any, of the fair market price of the share preceding the date of grant of the option under ESOSs over the exercise price of the option is recognised as deferred employee compensation with a credit to Employee’s Stock Option (Grant) Outstanding account. The deferred employee compensation cost is amortised on a straight-line basis over the vesting period of the option. The options that do not vest because of failure to satisfy vesting condition are reversed by a credit to employee compensation expense, equal to the amortised portion of value of lapsed portion and credit to deferred employee compensation equal to the unamortised portion. In respect of the options which expire unexercised the balance standing to the credit of Employee’s Stock Option (Grant) Outstanding account is transferred to General Reserve. The fair market price is the latest available closing price, prior to the date of grant, on the stock exchange on which the shares of the Bank are listed.
Where the terms of an equity–settled award are modified, the minimum expense recognised in ‘Payments to and provision for employees’ is the expense as if the terms had not been modified. An additional expense is recognised for any modification which increases the total intrinsic value of the share–based payment arrangement, or is otherwise beneficial to the employee as measured at the date of modification.
Cash-settled :
The cost of cash-settled transactions (stock appreciation rights) is measured initially using intrinsic value method at the grant date taking into account the terms and conditions upon which the instruments were granted. This intrinsic value is amortised on a straight-line basis over the vesting period with a recognition of corresponding liability. This liability is remeasured at each Balance Sheet date up to and including the settlement date with changes in intrinsic value recognised in the Profit and Loss Account in ‘Payments to and provision for employees’.
R. CLAIMS / BENEFITS
Benefits paid comprise of policy benefit amount, surrenders, claim investigation fees and specific claims settlement costs where applicable and change in the outstanding provision for claims at the year end. Surrender and claims by death are accounted when intimated. Survival benefits are accounted when due. Maturity claims are accounted on the date of maturity. Amounts recoverable from reinsurers are accounted for in the same period as the related claim. Repudiated claims disputed before judicial authorities are provided for, based on the best judgment of the management considering the facts and evidence in respect of each such claim. Withdrawals under unit-linked policies are accounted in respective schemes when the associated units are cancelled.
S. LOSS ON SALE OF ADVANCES TO ASSET RECONSTRUCTION COMPANY
Loss on sale of Advances sold to Asset Reconstruction Company are recognised immediately to the Profit and Loss Account.
T. SECURITISATION
The Group enters into arrangements for sale of loans through Special Purpose Vehicles (SPVs). In most cases, post securitisation, the Group continues to service the loans transferred to the SPV. The Group also provides credit enhancement in the form of cash collaterals and / or by subordination of cash flows to Senior Pass Through Certificate (PTC) holders. In respect of credit enhancements provided or recourse obligations (projected delinquencies, future servicing etc.) accepted by the Group, appropriate provision / disclosure is made at the time of sale in accordance with Accounting Standard 29, (AS-29) “Provisions, Contingent Liabilities and Contingent Assets” specified under Section 133 of the Companies Act, 2013, read with Rule 7 of the Companies(Accounts) Rules, 2014.
In accordance with the RBI guidelines, the profit / premium on account of securitisation of assets at the time of sale is computed as the difference between the sale consideration and the book value of the securitised asset and is amortised over the tenure of the securities issued. The loss on account of securitisation is recognised immediately in the Profit and Loss Account.
The Group invests in PTCs of other SPVs which are accounted for at the deal value and are classified under Investments.
#KONAKONAKOTAKFINANCIAL
HIGHLIGHTSCONSOLIDATED FINANCIAL
STATEMENTSBANK REPORTS
AND STATEMENTS
Schedules forming part of Consolidated Balance Sheet and Profit and Loss Account
Accounting Policies & Notes
57
U. LEASES
As Lessee
Leases where the lessor effectively retains substantially all the risks and rewards of ownership, are classified as operating leases. Operating lease payments are recognised as an expense in the Profit and Loss Account on a straight-line basis over the lease term.
As Lessor
Assets subject to operating leases are included in fixed assets. Lease income is recognised in the Profit and Loss Account on a straight-line basis over the lease term.
Initial direct costs in respect of operating leases such as legal costs, brokerage costs, etc. are recognised immediately in the Profit and Loss Account.
The Group leases certain tangible assets and such leases where the Group has substantially transferred all the risks and rewards incident to legal ownership are classified as finance leases. Such assets are recognised as a receivable at an amount equal to the net investment in the lease. The lease payment is apportioned between finance income and the repayment of principle i.e. the net investment in the lease.
V. ACCOUNTING FOR PROVISIONS, CONTINGENT LIABILITIES AND CONTINGENT ASSETS
Provision is recognised when there is a present obligation as a result of past event; it is probable that an outflow of resources will be required to settle the obligation, in respect of which a reliable estimate can be made. Provisions are not discounted to its present value and are measured based on best estimate of the expenditure required to settle the obligation at the Balance Sheet date. These are reviewed at each Balance Sheet date and adjusted to reflect the current best estimates.
Contingent Liabilities are not recognised but are disclosed in the notes unless the outflow of resources is remote. Contingent assets are neither recognised nor disclosed in the financial statements.
The Bank estimates the liability for credit card reward points and cost per point using actuarial valuation conducted by an independent actuary, which includes assumptions such as mortality, redemption and spends.
W. SCHEME EXPENSES
Annual recurring expenses relating to schemes of Kotak Mahindra Mutual Fund which are in excess of internal expense limits are borne by the Group. The internal expense limits are within the overall expense limits prescribed by the SEBI. Further, scheme expenses also includes new fund offer expenses, and other expenses relating to the schemes which do not fall under regulation 52(4) of the SEBI (Mutual Funds) regulation 1996.
X. SHARE ISSUE EXPENSES
Share issue expenses are adjusted from Securities Premium Account in terms of Section 52 of the Companies Act, 2013.
Y. EARNINGS PER SHARE
Basic earnings per share are calculated by dividing the net profit or loss for the year attributable to equity shareholders (after deducting attributable taxes) by the weighted average number of equity shares outstanding during the year. The weighted average number of equity shares outstanding during the year is adjusted for events of bonus issue and stock split.
For the purpose of calculating diluted earnings per share, the net profit or loss for the year attributable to equity shareholders and the weighted average number of shares outstanding during the year are adjusted for the effects of all dilutive potential equity shares. Diluted earnings per share reflect the potential dilution that could occur if securities or other contracts to issue equity shares were exercised or converted during the year.
Z. IMPAIRMENT
The carrying amount of assets are reviewed at each Balance Sheet date if there is any indication of impairment based on internal / external factors. Impairment loss, if any, is provided in the Profit and Loss Account to the extent of carrying amount of assets exceeds their estimated recoverable amount.
Schedules forming part of Consolidated Balance Sheet and Profit and Loss Account
58 ANNUAL REPORT 2014-15
AA. CASH AND CASH EQUIVALENTS
Cash and cash equivalents in the Balance Sheet comprise Cash in hand, Balances with Reserve Bank of India and Balances with Banks and Money at Call and Short Notice (including the effect of changes in exchange rates on cash and cash equivalents in foreign currency).
NOTES TO ACCOUNTS
3. EMPLOYEE BENEFITS
a. The Group has recognised the following amounts in the Profit and Loss Account towards contributions to Provident Fund and Other Funds.
Provident Fund ` 85.91 crore (Previous Year ` 75.38 crore)
Superannuation Fund ` 0.75 crore (Previous Year ` 0.75 crore)
New Pension Fund ` 3.03 crore (Previous Year ` 1.94 crore)
b. In accordance with Indian regulations, the Group provides for gratuity, a defined benefit retirement plan covering all employees. The plan provides a lump sum payment to vested employees at retirement or on termination of employment based on the respective employee’s salary and the years of employment with the Group subject to maximum of ` 0.10 crore. There is no ceiling on gratuity payable to Directors.
The gratuity benefit is provided to the employees of the Bank and four of its subsidiaries through a fund administered by a Board of Trustees and managed by a life insurance subsidiary. The Bank and its four subsidiaries are responsible for settling the gratuity obligation through contributions to the fund. The plan is fully funded.
In respect of other subsidiaries in the Group, the gratuity obligation is wholly unfunded.
c. Reconciliation of opening and closing balance of the present value of the defined benefit obligation for gratuity benefits is given below.
(` in crore)
As on 31st March, 2015 As on 31st March, 2014
Funded Others Funded Others
Change in benefit obligations
Liability at the beginning of the year 96.10 6.36 91.67 5.87
Transfer of liabilities funded during the year - - - -
Current Service cost 17.32 0.63 18.91 0.74
Interest cost 9.97 0.62 8.66 0.51
Actuarial (gain) / loss on obligations 16.71 1.64 (10.97) (0.12)
Past Service cost - - - -
Liability assumed on transfer of employees (0.13) 0.04 (0.49) 0.52
Benefits paid (16.12) (1.64) (11.68) (1.16)
Liability at the end of the year 123.85 7.65 96.10 6.36
Change in plan assets
Fair value of plan assets at the beginning of the year 101.27 - 88.87 -
Expected return on plan assets 7.47 - 6.68 -
Actuarial Gain / (loss) 20.30 - 4.04 -
Benefits paid (16.12) (1.64) (11.68) (1.16)
Employer contributions 7.64 1.64 13.36 1.16
Fair value of plan assets as at the end of the year 120.56 - 101.27 -
#KONAKONAKOTAKFINANCIAL
HIGHLIGHTSCONSOLIDATED FINANCIAL
STATEMENTSBANK REPORTS
AND STATEMENTS
Schedules forming part of Consolidated Balance Sheet and Profit and Loss Account
Accounting Policies & Notes
59
Reconciliation of present value of the obligation and the fair value of the plan Assets
(` in crore)
As on 31st March, 2015 As on 31st March, 2014
Funded Others Funded Others
Fair value of plan assets as at the end of the year 120.56 - 101.27 -
Liability at the end of the year 123.85 7.65 96.10 6.36
Net Asset / (Liabilities) included in “Others” under “Other Assets” and “Other Liabilities”
(3.29) (7.65) 5.17 (6.36)
Expenses recognised for the year
Current service cost 17.32 0.63 18.91 0.74
Interest cost 9.97 0.62 8.66 0.51
Expected return on plan assets 7.47 - (6.68) -
Actuarial (gain) / loss (3.59) 1.64 (15.01) (0.12)
Effect of the limit in Para 59(b) - - - -
Net gratuity expense included in “[payments to and provision for employees]” under “Operating Expenses” [Schedule 16.I]
16.23 2.89 5.88 1.13
Actual return on plan assets 27.78 - 10.72 -
(` in crore)
As on 31st March, 2015 As on 31st March, 2014
Funded Others Funded Others
Reconciliation of the Liability recognised in the Balance Sheet
Net (Asset) / Liability at the beginning of the year (5.17) 6.36 2.80 5.87
Transfer of liabilities funded during the year - - - -
Expense recognised 16.23 2.89 5.88 1.13
Liability assumed on transfer of employees (0.13) 0.04 (0.49) 0.52
Net (Asset) / Liability is included in “Others” under “Other Assets” and “Other Liabilities”
3.29 7.65 (5.17) 6.36
Investment details of plan assets
The plan assets are invested in insurer managed funds. Major categories of plan assets as a percentage of fair value of total plan assets :
31st March, 2015 %
31st March, 2014 %
Government securities 27.66 29.60
Bonds, debentures and other fixed income instruments 14.68 12.19
Money market instruments 8.85 11.29
Equity shares 48.81 46.92
Total 100.00 100.00
Schedules forming part of Consolidated Balance Sheet and Profit and Loss Account
60 ANNUAL REPORT 2014-15
Actuarial assumptions used
As on 31st March, 2015
As on 31st March, 2014
Discount rate 7.98% p.a. 9.34% p.a.
Salary escalation rate 8.50% p.a. 8.50% p.a.
Expected rate of return on plan assets 7.50% p.a. 7.50% p.a.
The estimates of future salary increases, considered in actuarial valuation, take account of inflation, seniority, promotion and other relevant factors.
The overall expected rate of return on assets is determined based on the market prices prevailing on that date, applicable to the period over which the obligation is to be settled.
Experience adjustments
Amounts for the current and previous four years are as follows :
(` in crore)
Gratuity Year ended 31st March
2015 2014 2013 2012 2011
Defined benefit obligation 131.50 102.46 97.54 76.94 66.65
Experience adjustments on plan liabilities 4.25 1.84 (4.72) (0.30) 2.11
Experience adjustments on plan assets 20.30 4.04 1.66 (2.61) 0.64
The Group expects to contribute ` 10.10 crore to gratuity fund in financial year 2015-2016
The above information is as certified by the actuary and relied upon by the auditors.
Compensated absences
The actuarially determined liability for compensated absences of accumulated leaves of the employees of the Group is given below :
(` in crore)
31st March, 2015 31st March, 2014
Total actuarial liability 86.14 70.26
Assumptions :
Discount rate 7.98% p.a. 9.34% p.a.
Salary escalation rate 8.50% p.a. 8.50% p.a.
Long Service Award
The actuarially determined liability in respect of Long Service Award of the employees of the Group is given below :
(` in crore)
31st March, 2015 31st March, 2014
Total actuarial liability 6.70 0.75
Assumptions :
Discount rate 7.98% p.a. 9.34% p.a.
#KONAKONAKOTAKFINANCIAL
HIGHLIGHTSCONSOLIDATED FINANCIAL
STATEMENTSBANK REPORTS
AND STATEMENTS
Schedules forming part of Consolidated Balance Sheet and Profit and Loss Account
Accounting Policies & Notes
61
4. LIEN AND ENCUMBRANCES :
(a) Balance with Banks in other deposit accounts include ` 66.90 crore (previous year ` 107.02 crore) which are under lien.
(b) Investments include Government Securities with face Value of ` 1,905.24 crore (previous year ` 3,971.48 crore) pledged and encumbered for availment of fund transfer facility, clearing facility, margin requirements and RBI for liquidity adjustment facility (LAF).
(c) Stock in Trade pledged with National Securities Clearing Corporation Limited towards Exposure in Derivatives Segment as on 31st March, 2015 is ` 230.00 crore (previous year NIL).
(d) In order to meet the requirement of IRDAI, the Life insurance subsidiary has earmarked securities relating to 7.17% Government of India, 2015 having face value of ` 150,000 in constituent SGL Account with its Bankers (2014 – 7.17% Government of India, 2015 having face value of ` 150,000)
5. “Others” in Other Liabilities and Provisions (Schedule 5) include the following items shown as “Provision for Contingencies”, which have been recognised in the accounts in respect of obligations arising from past event, the settlement of which is expected to result in an outflow embodying economic benefits.
Provision for Contingencies :
(` in crore)
Description Balance as on 1st April, 2014
Addition during the year
Reversed/ paid during the year
Balance as on 31st March, 2015
Stamp duty on Trades 3.21 - - 3.21
Total 3.21 - - 3.21
Previous year 3.21 - - 3.21
6. PROVISIONS AND CONTINGENCIES :
Breakup of “Provisions and Contingencies” shown under the head Expenditure in Profit and Loss Account
(` in crore)
Year ended 31st March, 2015 2014
Provision for taxation (Refer Note 7 below) 1,484.90 1,183.96
Provision for Non-performing Assets and Contingencies (including write-offs and net of recoveries)
225.29 165.21
Provision for Standard Assets 73.77 16.77
Provision for UFC Exposure 17.82 -
Provision for Diminution in value of Investments (116.57) 146.07
Provision Others 5.43 (19.08)
Total 1,690.64 1,492.93
7. PROVISION MADE FOR TAXES DURING THE YEAR :
(` in crore)
Year ended 31st March, 2015 2014
Current tax 1,414.51 1,153.00
Deferred tax 70.18 30.78
Wealth Tax 0.21 0.18
Total 1,484.90 1,183.96
Schedules forming part of Consolidated Balance Sheet and Profit and Loss Account
62 ANNUAL REPORT 2014-15
8. DESCRIPTION OF CONTINGENT LIABILITIES :
Sr. No.
Contingent Liability* Brief Description
1. Claims not acknowledged as debts
This includes liability on account of income tax, interest tax, sales tax, lease tax demands, property tax demands and legal cases filed against the Group.
The Group is a party to various legal proceedings in the normal course of business. The Group does not expect the outcome of these proceedings to have a material adverse effect on the Group’s financial conditions, result of operations or cash flows. In respect of appeals filed by the Income Tax department with higher authorities, where the matter was settled in favour of the Group at the first appellate stage, and where in view of the Management, it gives rise to an item of timing difference, no contingent liability is envisaged by the Group.
2. Liability on account of outstanding forward exchange contracts
The Group enters into foreign exchange contracts with inter-bank participants on its own account and for customers. Forward exchange contracts are commitments to buy or sell foreign currency at a future date at the contracted rate.
3. Guarantees on behalf of constituents in and outside India
As a part of its banking activities, the Group issues guarantees on behalf of its customers. Guarantees generally represent irrevocable assurances that the Group will make payments in the event of customer failing to fulfill its financial or performance obligations.
4. Acceptances, endorsements and other obligations
These includes Documentary credit such as letters of obligations, enhance the credit standing of the customers of the Group, contingent liabilities on account of bills re-discounted by the Group and cash collateral provided by the Group on assets which have been securitised.
5. Other items for which the Group is contingently liable
These include liabilities in respect of interest rate swaps, currency swaps, forward rate agreements, futures and options contracts. The Group enters into these transactions on its own account and for customers. Currency Swaps are commitments to exchange cash flows by way of interest / principal in one currency against another, based on predetermined rates. Interest rate swaps are commitments to exchange fixed and floating interest rate cash flows. The notional amounts that are recorded as contingent liabilities are amounts used as a benchmark for the calculation of interest component of the contracts. This also includes liability in respect of Capital commitments relating to fixed assets and undrawn commitments in respect of investments.
* Also refer Schedule 12 – Contingent Liabilities
9. EARNINGS PER EQUITY SHARE :
Particulars As on 31st March, 2015
As on 31st March, 2014
Reconciliation between weighted shares used in the computation of basic and diluted earnings per share :
Weighted average number of equity shares used in computation of basic earnings per share 771,140,159 765,821,581
Effect of potential equity shares for stock options outstanding 1,854,016 1,251,038
Weighted average number of equity shares used in computation of diluted earnings per share 772,994,175 767,072,619
Following is the reconciliation between basic and diluted earnings per share :
Nominal value per share (`) 5.00 5.00
Basic earnings per share (`) 39.49 32.19
Effect of potential equity shares for stock options (`) 0.09 0.05
Diluted earnings per share (`) 39.40 32.14
Earnings used in the computation of basic and diluted earnings per share (` in crore) 3,045.45 2,464.99
#KONAKONAKOTAKFINANCIAL
HIGHLIGHTSCONSOLIDATED FINANCIAL
STATEMENTSBANK REPORTS
AND STATEMENTS
Schedules forming part of Consolidated Balance Sheet and Profit and Loss Account
Accounting Policies & Notes
63
10. EMPLOYEE SHARE BASED PAYMENTS :
At the General Meetings of the holding company, Kotak Mahindra Bank Limited, the shareholders of the Bank had unanimously passed Special Resolutions on 28th July, 2000, 26th July, 2004, 26th July, 2005, 5th July, 2007 and 21st August, 2007, to grant options to the eligible employees of the Bank and its subsidiary companies. Pursuant to these resolutions, the following four Employees Stock Option Schemes had been formulated and adopted :
(a) Kotak Mahindra Equity Option Scheme 2001-02;
(b) Kotak Mahindra Equity Option Scheme 2002-03;
(c) Kotak Mahindra Equity Option Scheme 2005; and
(d) Kotak Mahindra Equity Option Scheme 2007.
Consequent to the above, the Bank has granted stock options to the employees of the Group. The Bank under its various plan / schemes, has granted in aggregate 62,399,000 options as on 31st March, 2015 (previous year 61,348,520).
Stock appreciation rights
The Management has approved the grant of stock appreciation rights (SARs) to eligible employees as and when deemed fit. The SARs are settled in cash and vest on the respective due dates in a graded manner as per the terms and conditions of grant. The contractual life of the SARs outstanding range from 1.14 to 3.65 years.
Details of activity under SARs is summarised below :
Year Ended 31st March, 2015
Year Ended 31st March, 2014
Outstanding at the beginning of the year 1,342,810 1,523,706
Granted during the year 991,765 812,948
Settled during the year 1,268,614 854,962
Lapsed during the year 102,834 138,882
Outstanding at the end of the year 963,127 1,342,810
Equity-settled options
The Bank has granted options to employees of the Group vide various employee stock option schemes. During the year ended 31st March, 2015, the following schemes were in operation :
Plan 2007
Date of grant Various Dates
Date of Board Approval Various Dates
Date of Shareholders’ approval 5th July, 2007 as amended on 21st August, 2007
Number of options granted 32,508,800
Method of Settlement (Cash / Equity) Equity
Vesting Period 1 – 4.14 years
Exercise Period 0.30 – 1.08 years
Vesting Conditions Graded / Cliff vesting
Schedules forming part of Consolidated Balance Sheet and Profit and Loss Account
64 ANNUAL REPORT 2014-15
The details of activity under Plan 2007 have been summarised below :
Year ended 31st March, 2015 Year ended 31st March, 2014
Number of Shares
Weighted Average Exercise
Price (`)
Number of Shares
Weighted Average Exercise Price (`)
Outstanding at the beginning of the year 5,353,670 544.55 8,419,532 419.49
Granted during the year 1,077,480 800.99 1,141,160 711.19
Forfeited during the year 231,311 597.02 479,724 467.19
Exercised during the year 2,041,663 430.43 3,701,975 322.81
Expired during the year 7,217 324.68 25,323 357.56
Outstanding at the end of the year 4,150,959 664.70 5,353,670 544.55
Out of the above exercisable at the end of the year 248,090 407.72 308,891 295.25
Weighted average remaining contractual life (in years) 1.55 1.77
Weighted average fair value of options granted 247.36 215.96
The weighted average share price at the date of exercise for stock options exercised during the year was ` 1,126.03 (previous year ` 710.33).
The details of exercise price for stock options outstanding at the end of the year are :
31st March, 2015
Range of exercise prices (`) Number of options outstanding
Weighted average remaining contractual life of
options (in years)
Weighted average exercise price
(`)
101-200 - - -
201-300 1,038 - 250.00
301-400 72,430 0.65 332.14
401-500 217,652 0.25 421.00
501-600 667,705 1.14 549.96
601-700 1,440,000 1.59 640.00
701-800 799,804 1.64 726.57
801-900 952,330 2.05 812.00
31st March, 2014
Range of exercise prices (`) Number of options outstanding Weighted average remaining contractual life of options (in
years)
Weighted average exercise price
(`)
101-200 64,849 0.28 173.00
201-300 163,220 0.99 250.00
301-400 441,993 0.92 316.73
401-500 1,197,204 1.00 421.00
501-600 1,006,264 1.55 545.42
601-700 1,490,000 2.59 640.00
701-800 990,140 2.31 724.00
#KONAKONAKOTAKFINANCIAL
HIGHLIGHTSCONSOLIDATED FINANCIAL
STATEMENTSBANK REPORTS
AND STATEMENTS
Schedules forming part of Consolidated Balance Sheet and Profit and Loss Account
Accounting Policies & Notes
65
Stock Options granted
The fair value of the equity-settled and cash-settled options is estimated on the date of grant using Black-Scholes options pricing model taking into account the terms and conditions upon which the options were granted. The fair value of the cash-settled options is remeasured at the each Balance Sheet date. The following table lists the inputs to the model used for equity-settled and cash-settled options :
The expected volatility was determined based on historical volatility data and the Bank expects the volatility of its share price may reduce as it matures. The measure of volatility used in the Black-Scholes options pricing model is the annualised standard deviation of the continuously compounded rates of return on the stock over a period of time. For calculating volatility, the daily volatility of the stock prices on the National Stock Exchange, over a period prior to the date of grant, corresponding with the expected life of the options has been considered.
The above information has been prepared by the Group and relied upon by the auditors.
Effect of the employee share-based payment plans on the Profit and Loss Account and on the financial position :
(` in crore)
Year ended 31st March, 2015 2014
Total Employee compensation cost pertaining to share-based payment plans 141.46 72.13
Compensation cost pertaining to equity-settled employee share-based payment plan included above
2.26 4.69
Liability for employee stock options outstanding as at year end 4.75 11.15
Deferred Compensation Cost 1.76 2.62
Closing balance of liability for cash-settled options 71.51 61.94
Expense arising from increase in intrinsic value of liability for cash stock appreciation plan 55.33 7.89
Had the Group recorded the compensation cost computed on the basis of Fair Valuation method instead of intrinsic value method, employee compensation cost would have been higher by ` 31.35 crore (previous year ` 33.83 crore) and the profit after tax would have been lower by ` 20.69 crore (previous year ` 22.33 crore). Consequently the basic and diluted EPS would have been ` 39.22 (previous year ` 31.90) and ` 39.13 (previous year ` 31.84) respectively.
In computing the above information, certain estimates and assumptions have been made by the Management which have been relied upon by the auditors.
11. TIER II BONDS
a. Lower Tier II Bonds outstanding as on 31st March, 2015 ` 664.80 crore (previous year ` 664.80 crore).
b. Upper Tier II Bonds outstanding as on 31st March, 2015 ` 417.25 crore (previous year ` 405.62 crore) of which bonds issued outside India ` 281.25 crore (previous year ` 269.62 crore).
Schedules forming part of Consolidated Balance Sheet and Profit and Loss Account
66 ANNUAL REPORT 2014-15
12. Interest Expended-Others {Schedule 15.III} includes interest on subordinated debt (Lower and Upper Tier II) ` 81.89 crore (previous year ` 82.61 crore).
13. The Group charges off to the Profit and Loss Account all expenses related to acquisition costs of advances in the year in which they are incurred. KMPL, a subsidiary of the Bank, charges off such costs based on the Internal Rate of Return of a contract. On account of this difference in accounting policy, unamortised brokerage amounting to ` 113.05 crore (previous year ` 93.86 crore) is carried forward in the Balance Sheet under “Other Assets”.
14. Segment reporting
The Summary of the operating segments of the Group for the year ended 31st March, 2015 are as given below :
Other Lending Activities 1,101.81 886.74Broking 820.41 492.94Advisory and Transactional Services 100.11 74.77Asset Management 384.36 375.38Insurance 5,708.04 3,776.76Sub-total 25,593.19 19,993.09Add : Unallocated Income 13.62 6.26Less : inter-segment revenues (4,135.72) (2,731.06)
Total Income 21,471.09 17,268.29Segment Results :Treasury, Investments and BMU 675.62 352.38Retail Banking 957.01 793.35Corporate Banking 1,402.11 1,300.65Vehicle Financing 426.62 428.73Other Lending Activities 473.43 362.30Broking 278.81 92.74Advisory and Transactional Services 13.17 (1.79)Asset Management 52.43 100.00Insurance 257.59 261.43Sub-total 4,536.79 3,689.79Add : Unallocated Income / (Expense) 13.20 5.71Total Profit before tax, minority interest and associates 4,549.99 3,695.50Segment AssetsTreasury, Investments and BMU 39,803.12 32,231.19Retail Banking 79,499.41 61,655.43Corporate Banking 38,386.95 32,025.82Vehicle Financing 15,436.91 14,349.34Other Lending Activities 8,418.03 6,312.55Broking 1,675.66 1,150.19Advisory and Transactional Services 35.81 32.40Asset Management 1,360.73 1,433.72Insurance 15,527.08 12,365.76Sub-total 200,143.70 161,556.40Less : inter-segment assets (51,749.64) (39,576.40)Total 148,394.06 121,980.00Add : Unallocated Assets 181.70 256.63Total Assets as per Balance Sheet 148,575.76 122,236.63
#KONAKONAKOTAKFINANCIAL
HIGHLIGHTSCONSOLIDATED FINANCIAL
STATEMENTSBANK REPORTS
AND STATEMENTS
Schedules forming part of Consolidated Balance Sheet and Profit and Loss Account
Accounting Policies & Notes
67
(` in crore)
31st March, 2015 2014
Segment Liabilities
Treasury, Investments and BMU 37,559.14 30,044.63
Retail Banking 73,859.51 56,373.88
Corporate Banking 33,458.01 27,508.31
Vehicle Financing 12,327.16 11,189.01
Other Lending Activities 4,131.82 3,981.68
Broking 1,368.06 893.93
Advisory and Transactional Services 21.62 23.13
Asset Management 566.48 706.35
Insurance 14,319.53 11,515.63
Sub-total 177,611.33 142,236.55
Less : inter-segment liabilities (51,749.64) (39,576.40)
Total 125,861.69 102,660.15
Add : Unallocated liabilities 225.06 229.59
Add : Share Capital, Reserves and Surplus and Minority Interest 22,489.01 19,346.89
Total Capital and Liabilities as per Balance Sheet 148,575.76 122,236.63
Capital Expenditure
Treasury, Investments and BMU 157.89 664.85
Retail Banking 124.64 129.46
Corporate Banking 16.69 14.06
Vehicle Financing 1.77 1.66
Other Lending Activities 0.71 0.44
Broking 16.74 18.16
Advisory and Transactional Services 2.07 2.58
Asset Management 21.67 6.12
Insurance 24.58 21.68
Total 366.76 859.01
Depreciation / Amortisation
Treasury, Investments and BMU 77.86 60.81
Retail Banking 105.85 96.17
Corporate Banking 10.48 9.51
Vehicle Financing 2.25 2.56
Other Lending Activities 0.40 0.38
Broking 12.84 10.93
Advisory and Transactional Services 1.70 1.77
Asset Management 5.23 5.35
Insurance 20.28 20.38
Total 236.89 207.86
Segment information is provided as per the MIS available for internal reporting purposes, which includes certain estimates and assumptions. The methodology adopted in compiling and reporting the above information has been relied upon by the auditors.
Schedules forming part of Consolidated Balance Sheet and Profit and Loss Account
68 ANNUAL REPORT 2014-15
15. Leased Assets :
A - Assets taken on lease
(i) The Group has taken various premises and equipment under operating lease. The lease payments recognised in the Profit and Loss Account are ` 302.92 crore (previous year ` 247.26 crore).
(ii) The future minimum lease payments under non-cancelable operating lease not later than one year is ` 275.51 crore (previous year ` 224.72 crore), later than one year but not later than five years is ` 784.97 crore (previous year ` 878.79 crore) and later than five years ` 687.99 crore (previous year ` 454.18 crore).
The lease terms include renewal option after expiry of primary lease period. There are no restrictions imposed by lease arrangements. There are escalation clauses in the lease agreements.
B - Assets given on lease
The lease income recognised in the Profit and Loss Account in respect of premises and equipment under operating lease is ` 0.03 crore (previous year ` 0.04 crore).
The future minimum lease payments under non-cancelable operating lease – not later than one year is Nil (previous year Nil), later than one year but not later than five years is Nil (previous year Nil).
Details of gross investments, unearned finance income in respect of assets given under finance lease are as under :
(` in crore)
As on 31st March, 2015 2014
Gross Investments :
(i) Not later than 1 year 87.52 91.85
(ii) Between 1-5 years 136.30 146.87
Total 223.82 238.72
Unearned Finance Income :
(i) Not later than 1 year 20.12 21.74
(ii) Between 1-5 years 19.43 20.52
Total 39.55 42.26
Present Value of Rentals :
(i) Not later than 1 year 67.41 70.11
(ii) Between 1-5 years 116.85 126.35
Total 184.26 196.46
Accumulated provision on the Gross Investments 1.65 1.60
16. In accordance with the IRDAI Regulations, 2002 (Preparation of Financial Statements and Auditors’ Report of Insurance Companies), the Life Insurance subsidiary’s investment property has revalued at the market value of the property being the lower of valuation performed by two independent valuers as at 31st March, 2015. The real estate investment property is accordingly valued at ` 69.8 crore at 31st March, 2015 (previous year ` 49.1 crore). The historical cost of the property is ` 49.5 crore (previous year ` 49.1 crore).
#KONAKONAKOTAKFINANCIAL
HIGHLIGHTSCONSOLIDATED FINANCIAL
STATEMENTSBANK REPORTS
AND STATEMENTS
Schedules forming part of Consolidated Balance Sheet and Profit and Loss Account
Accounting Policies & Notes
69
17. The group enters into various types of derivative contracts such as interest rate swaps, cross currency interest rate swaps, foreign currency swaps, forwards, index / equity futures and options. The details of such derivatives for subsidiaries other than bank are as under :
Derivative instrument outstanding as on 31st March, 2015
As on 31st March, 2015 2014 Purpose
Particulars of Derivatives Quantity Quantity
Futures
S&P CNX Nifty Futures 85,375 20,950 Trading
S&P CNX Nifty Futures 400 1,000 Hedging
Bank Nifty Futures 3,600 6,925 Trading
Stock Futures 10,606,890 5,740,625 Trading
Stock Futures - 24,000 Hedging
Commodity Futures 200 900 Hedging
Options
S&P CNX Nifty Options Long 470,275 594,900 Trading
S&P CNX Nifty Options Long - 150,000 Hedging
S&P CNX Nifty Options Short 713,600 825,200 Trading
Matrix Business Services India Private Limited 0.05% 1.51
Inter-company and Other adjustments (2.64%) (589.49) 0.24% 6.76
Total 100.00% 22,153.32 100.00% 3,045.45
#KONAKONAKOTAKFINANCIAL
HIGHLIGHTSCONSOLIDATED FINANCIAL
STATEMENTSBANK REPORTS
AND STATEMENTS
Schedules forming part of Consolidated Balance Sheet and Profit and Loss Account
Accounting Policies & Notes
71
19. Other Liabilities and Provisions (Schedule 5.III) includes Deferred Tax Liability and “ Others – Other Assets”(Schedule 11.VI) includes Deferred Tax Assets as follows :
(` in crore)
Particulars Year ended 31st March, 2015
Year ended 31st March, 2014
Deferred Tax Assets
Provision for non-performing and doubtful debts, standard advances and contingencies 117.70 176.16
Depreciation on assets 32.71 23.74
Unabsorbed capital losses / business losses / provision for investments 2.72 2.64
Unamortised Income 0.18 0.42
Expenditure allowed on payment basis and others 82.85 30.74
Total Deferred Tax Assets 236.16 233.70
Deferred Tax Liabilities
Deferred expenses 39.12 31.90
Depreciation on assets 9.46 1.47
Others 63.43 6.00
Total Deferred Tax Liabilities 112.01 39.37
Net Deferred Tax Assets / (Liabilities) 124.15 194.33
For the previous year ended 31st March 2014, in accordance with RBI communication RBI/2013-14/412 DBOD. No.BP.BC.77/21.04.018/2013-14 dated 20th December, 2013 on Deferred Tax Liability (DTL) on Special Reserve created under Section 36(1) (viii) of the Income Tax Act, 1961, the Bank had reduced ` 31.18 crore from general reserves of the previous year towards DTL on special reserves created till year ended 31st March, 2013.
20. Fixed Assets
Fixed Assets as per Schedule 10 include intangible assets, details of which are as follows :
(` in crore)
Particulars Year ended 31st March, 2015
Year ended 31st March, 2014
PURCHASED SOFTWARE
Gross Block
At cost on 31st March of the preceding year 307.97 261.57
Additions during the year 32.41 46.58
Deductions during the year 14.04 0.18
Total 326.34 307.97
Amortisation
As on 31st March of the preceding year 251.81 214.41
Charge for the year 38.82 37.41
Deductions during the year 14.04 0.01
Amortisation to date 276.59 251.81
Net Block 49.75 56.16
Schedules forming part of Consolidated Balance Sheet and Profit and Loss Account
72 ANNUAL REPORT 2014-15
(` in crore)
Particulars Year ended 31st March, 2015
Year ended 31st March, 2014
MEMBERSHIP CARDS OF STOCK EXCHANGE
Gross Block
At cost on 31st March of the preceding year 4.66 4.66
Total 4.66 4.66
Amortisation
As on 31st March of the preceding year 3.82 3.62
Charge for the year 0.21 0.20
Amortisation to date 4.03 3.82
Net Block 0.63 0.84
GOODWILL
Gross Block
At cost on 31st March of the preceding year 1.88 1.88
Total 1.88 1.88
Amortisation
As on 31st March of the preceding year 1.88 1.88
Charge for the year - -
Amortisation to date 1.88 1.88
Net Block - -
FOREX BROKING BUSINESS RIGHTS
Gross Block
At cost on 31st March of the preceding year 3.83 3.83
Total 3.83 3.83
Amortisation
As on 31st March of the preceding year 3.83 3.83
Charge for the year - -
Amortisation to date 3.83 3.83
Net Block - -
ASSET MANAGEMENT RIGHTS
Gross Block
At cost on 31st March of the preceding year - -
Additions during the year 15.90 -
Deductions during the year - -
Total 15.90 -
Amortisation
As on 31st March of the preceding year - -
Charge for the year 0.52 -
Deductions during the year - -
Amortisation to date 0.52 -
Net Block 15.38 -
#KONAKONAKOTAKFINANCIAL
HIGHLIGHTSCONSOLIDATED FINANCIAL
STATEMENTSBANK REPORTS
AND STATEMENTS
Schedules forming part of Consolidated Balance Sheet and Profit and Loss Account
Accounting Policies & Notes
73
21. Related Party Disclosures :
Nature of relationship Name of Related Party
A Individual having significant influence over the enterprise
Mr. Uday S. Kotak along with his relatives and enterprises in which he has beneficial interest holds 39.95% of the equity share capital of Kotak Mahindra Bank Limited as on 31st March, 2015.
B Other Related Parties :
Associates ACE Derivatives and Commodity Exchange LimitedInfina Finance Private LimitedPhoenix ARC Private LimitedMatrix Business Services India Private Limited
Investing Party of the subsidiaries Old Mutual Plc.Old Mutual Life Assurance Company (South Africa) Limited
Enterprises over which relatives of Key Management Personnel have control / significant influence
Aero Agencies LimitedAllied Auto Accessories Private LimitedBusiness Standard Private Limited (earlier Business Standard Limited)Business Standard Online Limited (From 27th March, 2015)Kotak and Company LimitedKotak Commodity Services LimitedKomaf Financial Services LimitedAsian Machinery & Equipment Private LimitedCumulus Trading Company Private LimitedPalko Properties Private LimitedHarisiddha Trading and Finance Private LimitedKotak Trustee Company Private LimitedKotak Chemicals LimitedKotak Ginning & Pressing Industries LimitedInsurekot Sports Private Limited (earlier Insurekot Investments Private Limited)Puma Properties Private Limited
Key Management Personnel Mr. Uday S. Kotak – Executive Vice Chairman and Managing Director - KMBLMr. C. Jayaram - Joint Managing Director - KMBLMr. Dipak Gupta - Joint Managing Director - KMBL
Schedules forming part of Consolidated Balance Sheet and Profit and Loss Account
74 ANNUAL REPORT 2014-15
C. Details of related party transactions :
(` in crore)
Items/Related Party Associates Investing Party of the subsidiaries
Enterprises over which relatives of Key Management
Personnel have control / significant influence
Key Management
Personnel
Relatives of Key
Management Personnel
I. Liabilities
Other Liabilities 0.03 0.62 0.16 0.01
(0.25) (0.69) (0.11) (0.01)
Deposits 231.23 110.02 26.17 10.44
(253.65) (70.11) (1.47) (1.59)
Interest Payable 1.78 0.59 0.42 0.18
(1.97) (0.58) (0.02) (0.01)
II. Assets
Investments -Gross 149.95 0.03
(102.76) (#)
Diminution on Investments #
(-)
Others 0.58 -
(3.49) (0.53)
III. Expenses
Salaries / fees (Include ESOP cost)*
9.48
(9.81)
Others 0.90 4.32 0.08
(1.93) (3.56) (0.08)
Interest Paid 27.81 5.72 1.70 0.47
(37.81) (8.68) (0.35) (0.07)
IV. Income
Others 2.43 2.19 0.02 0.06
(2.16) (2.32) (0.02) (-)
V. Other Transactions
Dividend paid 24.60 0.16
(23.40) (0.14)
Reimbursement to companies 0.30 0.87
(0.24) (1.25)
Reimbursement from companies
0.73 1.54
(0.74) (1.99)
Purchase of Investments 48.54
(-)
#KONAKONAKOTAKFINANCIAL
HIGHLIGHTSCONSOLIDATED FINANCIAL
STATEMENTSBANK REPORTS
AND STATEMENTS
Schedules forming part of Consolidated Balance Sheet and Profit and Loss Account
Accounting Policies & Notes
75
(` in crore)
Items/Related Party Associates Investing Party of the subsidiaries
Enterprises over which relatives of Key Management
Personnel have control / significant influence
Key Management
Personnel
Relatives of Key
Management Personnel
Loan disbursed during the year 31.00
(-)
Loan repaid during the year 30.00
(-)
Purchase of Fixed Assets - 0.01
(0.16) (-)
Sale of Fixed Assets 0.20 0.02
(-) (-)
Deposits taken during the year 0.02
(0.02)
Deposits given during the year 0.02
(-)
Deposits repaid during the year #
(0.32)
Guarantees / Lines of credit 2.13
(2.13)
D. Material transactions with related parties :
(` in crore)
Items / Related Party Associates Investing Party of the
subsidiary
Enterprises over which relatives of Key Management
Personnel have control / significant
influence
Key Management
personnel
Relatives of Key
Management Personnel
Total
I. Liabilities :Other liabilities
Old Mutual Life Assurance Company (South Africa) Limited
0.62 0.62
(0.69) (0.69)
Aero Agencies Limited 0.10 0.10
(0.05) (0.05)
Kotak Commodity Services Limited
0.06 0.06
(0.05) (0.05)
Infina Finance Private Limited - -
(#) (#)
Others 0.03 - 0.01 0.04
(0.25) (0.01) (0.01) (0.27)
Schedules forming part of Consolidated Balance Sheet and Profit and Loss Account
76 ANNUAL REPORT 2014-15
(` in crore)
Items / Related Party Associates Investing Party of the
subsidiary
Enterprises over which relatives of Key Management
Personnel have control / significant
influence
Key Management
personnel
Relatives of Key
Management Personnel
Total
II. Assets :
Investments
ACE Derivatives and Commodity Exchange Limited
47.62 47.62
(45.39) (45.39)
Phoenix ARC Private Limited 98.91 98.91
(52.61) (52.61)
Others 3.42 0.03 3.45
(4.76) (#) (4.77)
Diminution on investments # #
(-) (-)
Others
Kotak Commodity Services Limited
- -
(0.53) (0.53)
ACE Derivatives and Commodity Exchange Limited
0.02 0.02
(3.38) (3.38)
Infina Finance Private Limited 0.48 0.48
(0.11) (0.11)
Others 0.08 0.08
(#) (#)
III. Expenses :
Salaries (Includes ESOP cost)
Mr. Uday Kotak* 2.47 2.47
(2.38) (2.38)
Mr. C. Jayaram* 3.00 3.00
(3.45) (3.45)
Mr. Dipak Gupta* 4.01 4.01
(3.98) (3.98)
Interest Paid
Infina Finance Private Limited 25.38 25.38
(28.76) (28.76)
Phoenix ARC Private Limited 1.44 1.44
(7.92) (7.92)
Kotak Commodity Services Limited
5.35 5.35
(7.89) (7.89)
Others 0.99 0.37 1.70 0.47 3.53
(1.12) (0.80) (0.35) (0.07) (2.34)
#KONAKONAKOTAKFINANCIAL
HIGHLIGHTSCONSOLIDATED FINANCIAL
STATEMENTSBANK REPORTS
AND STATEMENTS
Schedules forming part of Consolidated Balance Sheet and Profit and Loss Account
Accounting Policies & Notes
77
(` in crore)
Items / Related Party Associates Investing Party of the
subsidiary
Enterprises over which relatives of Key Management
Personnel have control / significant
influence
Key Management
personnel
Relatives of Key
Management Personnel
Total
Others
Aero Agencies Limited 4.30 4.30
(3.18) (3.18)
Kotak and Company Limited 0.01 0.01
(0.39) (0.39)
Matrix Business Services India Private Limited
0.90 0.90
(1.93) (1.93)
Others 0.01 0.08 0.09
(-) (0.08) (0.08)
IV. Income :
Others
Fee Income
Phoenix ARC Private Limited 0.52 0.52
(-) (-)
ACE Derivatives and Commodity Exchange Limited
0.22 0.22
(0.31) (0.31)
Infina Finance Private Limited 0.01 0.01
(-) (-)
Kotak Commodity Services Limited
2.16 2.16
(2.32) (2.32)
Others # # #
(-) (#) (#)
Premium Income
Phoenix ARC Private Limited # #
(#) (#)
Kotak Commodity Services Limited
0.02 0.02
(#) (#)
Others 0.01 0.06 0.07
(0.01) (-) (0.01)
Brokerage Income
Infina Finance Private Limited 1.68 1.68
(1.85) (1.85)
Others # 0.01 0.01
(-) (0.01) (0.01)
Schedules forming part of Consolidated Balance Sheet and Profit and Loss Account
78 ANNUAL REPORT 2014-15
(` in crore)
Items / Related Party Associates Investing Party of the
subsidiary
Enterprises over which relatives of Key Management
Personnel have control / significant
influence
Key Management
personnel
Relatives of Key
Management Personnel
Total
V. Other Transactions :
Dividend Paid
Mr. Uday Kotak 24.50 24.50
(23.32) (23.32)
Mr. C Jayaram 0.05 0.05
(0.04) (0.04)
Mr. Dipak Gupta 0.05 0.05
(0.04) (0.04)
Ms. Pallavi Kotak 0.04 0.04
(0.04) (0.04)
Ms. Indira Kotak 0.10 0.10
(0.08) (0.08)
Others 0.02 0.02
(0.01) (0.01)
Reimbursements made
Infina Finance Private Limited 0.21 0.21
(0.02) (0.02)
Kotak Commodity Services Limited
0.48 0.48
(1.25) (1.25)
Others 0.09 0.39 0.48
(0.21) (-) (0.21)
Reimbursements received
Kotak Commodity Services Limited
1.54 1.54
(1.99) (1.99)
ACE Derivatives and Commodity Exchange Limited
0.51 0.51
(0.57) (0.57)
Others 0.22 0.22
(0.17) (0.17)
Purchase of Investments
Phoenix ARC Private Limited 46.31 46.31
(-) (-)
ACE Derivatives and Commodity Exchange Limited
2.23 2.23
(-) (-)
Loan Disbursed during the year
Phoenix ARC Private Limited 30.00 30.00
(-) (-)
#KONAKONAKOTAKFINANCIAL
HIGHLIGHTSCONSOLIDATED FINANCIAL
STATEMENTSBANK REPORTS
AND STATEMENTS
Schedules forming part of Consolidated Balance Sheet and Profit and Loss Account
Accounting Policies & Notes
79
(` in crore)
Items / Related Party Associates Investing Party of the
subsidiary
Enterprises over which relatives of Key Management
Personnel have control / significant
influence
Key Management
personnel
Relatives of Key
Management Personnel
Total
ACE Derivatives and Commodity Exchange Limited
1.00 1.00
(-) (-)
Loan Repaid during the year
Phoenix ARC Private Limited 30.00 30.00
(-) (-)
Purchase of Fixed Assets
Kotak Commodity Services Limited
0.01 0.01
(-) (-)
ACE Derivatives and Commodity Exchange Limited
- -
(0.16) (0.16)
Sale of Fixed Assets
Phoenix ARC Private Limited 0.20 0.02 0.22
(-) (-) (-)
Deposits taken during the year
Kotak Commodity Services Limited
0.02 0.02
(0.02) (0.02)
Deposits given during the year
ACE Derivatives and Commodity Exchange Limited
0.02 0.02
(-) (-)
Deposits repaid during the year
Kotak Commodity Services Limited
# #
(0.32) (0.32)
Guarantees/Lines of credit 2.13 2.13
(2.13) (2.13)
* includes incentive paid during the year
# In the above table denotes amounts less than ` 50,000.00
Schedules forming part of Consolidated Balance Sheet and Profit and Loss Account
80 ANNUAL REPORT 2014-15
E. Maximum balance outstanding
(` in crore)
Items/Related Party Associates Investing Party of the
Subsidiary
Enterprise over which relative of Key
Management Personnel have control / significant
influence
Key Management
Personnel
Relatives of Key
Management Personnel
I. Liabilities
Deposits 2,771.59 161.93 34.25 17.65
(648.61) (167.54) (20.62) (9.99)
Other Liabilities 0.25 0.69 0.16 0.01
(0.25) (0.72) (2.36) (0.01)
II. Assets
Investments-Gross 149.95
(114.80)
Advances 30.00
(-)
Others 0.57 0.53
(1.32) (0.55)
Note : Figures of previous year are given in bracket.
22. The Board of Directors of Kotak Mahindra Bank Ltd (“Kotak”) and the Board of Directors of ING Vysya Bank Ltd (“ING Vysya”) at their respective meetings held on 20th November, 2014 have approved an amalgamation of ING Vysya with Kotak in the ratio of 725 shares of Kotak for every 1,000 shares of ING Vysya. Subsequently, the shareholders of Kotak and ING Vysya have approved the scheme of amalgamation at their respective Extra Ordinary General Meetings held on 7th January, 2015. The amalgamation is approved by the Reserve Bank of India (the “RBI”) under the Banking Regulation Act and the Competition Commission of India. The amalgamation is effective from 1st April, 2015.
23. Figures for the previous year have been regrouped / reclassified wherever necessary to conform to current year’s presentation.
For and on behalf of the Board of Directors
Dr. Shankar AcharyaChairman
Uday KotakExecutive Vice Chairman and Managing Director
Dipak GuptaJoint Managing Director
Jaimin BhattPresident and Group Chief Financial Officer
Bina ChandaranaCompany Secretary
Mumbai, 5th May, 2015
81
#KONAKONAKOTAKFINANCIAL
HIGHLIGHTSCONSOLIDATED FINANCIAL
STATEMENTSBANK REPORTS
AND STATEMENTS
Accounting Policies & NotesFo
rm A
OC
- 1
Purs
uan
t to
firs
t p
rovi
so t
o s
ub
-sec
tio
n (
3) o
f se
ctio
n 1
29 r
ead
wit
h r
ule
5 o
f C
om
pan
ies
(Acc
ou
nts
) R
ule
s, 2
014
Stat
emen
t co
nta
inin
g s
alie
nt
feat
ure
s o
f th
e fi
nan
cial
sta
tem
ent
of
sub
sid
iari
es/a
sso
ciat
e co
mp
anie
s
PART
“A”
: Su
bidi
arie
s(`
in C
rore
)
Part
icula
rsKo
tak
Mah
indr
a Pr
ime
Lim
ited
Kota
k Se
curit
ies
Lim
ited
Kota
k M
ahin
dra
Capi
tal
Com
pany
Li
mite
d
Kota
k M
ahin
dra
Old
M
utua
l Li
fe
Insu
ranc
e Li
mite
d
Kota
k M
ahin
dra
Gene
ral
Insu
ranc
e Li
mite
d
Kota
k M
ahin
dra
Inve
stm
ents
Li
mite
d
Kota
k M
ahin
dra
Asse
t M
anag
emen
t Co
mpa
ny
Lim
ited
Kota
k M
ahin
dra
Trus
tee
Com
pany
Li
mite
d
Kota
k M
ahin
dra
(Inte
rnat
iona
l) Li
mite
d
Kota
k M
ahin
dra
(UK)
Li
mite
d
Kota
k M
ahin
dra,
In
c.
Kota
k In
vest
men
t Ad
viso
rs
Lim
ited
Kota
k M
ahin
dra
Trus
tees
hip
Serv
ices
Lim
ited
Kota
k Fo
rex
Brok
erag
e Li
mite
d
Kota
k M
ahin
dra
Pens
ion
Fund
Ltd
Kota
k M
ahin
dra
Fina
ncia
l Se
rvice
s Lt
d
Shar
e Ca
pita
l 3
.50
1.6
0 3
.44
510
.29
1.0
5 4
.64
29.
80 0
.05
16.
16 7
.01
0.0
7 4
.59
0.0
5 4
.10
28.
00 8
.45
Rese
rves
& S
urpl
us 3
,346
.22
2,3
82.4
2 4
11.7
8 7
80.7
4 (0
.27)
612
.58
21.
33 5
0.50
336
.94
97.
81 1
4.85
261
.68
6.2
6 (4
.05)
(2.7
4) (1
.43)
Tota
l Ass
ets
20,
714.
28 4
,366
.73
431
.62
15,
763.
50 1
.06
3,6
32.8
0 1
03.2
8 5
5.51
782
.72
245
.99
15.
54 2
74.4
8 6
.83
1.1
2 2
5.55
12.
00
Tota
l Liab
ilites
17,
364.
56 1
,982
.71
16.
40 1
4,47
2.47
0.2
8 3
,015
.58
52.
15 4
.96
429
.62
141
.17
0.6
2 8
.21
0.5
2 1
.07
0.2
9 4
.98
Inve
stmen
ts (e
xclu
ding
in
vestm
ent i
n su
bsid
iaries
) 8
69.6
0 5
37.9
7 1
11.6
1 1
4,69
7.40
- 2
53.2
4 0
.70
54.
24 6
01.2
1 -
4.4
7 2
23.5
4 5
.72
- 2
5.21
-
Turn
over
2,6
40.4
3 9
59.8
4 8
9.12
5,7
12.7
9 -
391
.24
125
.43
11.
62 6
7.27
89.
38 1
3.97
80.
54 2
.81
0.5
4 1
.36
21.
17
Profi
t bef
ore
taxa
tion
773
.95
441
.40
16.
39 2
61.2
2 (0
.27)
158
.20
(35.
91)
10.
77 3
8.28
12.
02 (1
.85)
30.
02 0
.29
(0.2
8) (0
.25)
6.1
7
Prov
ision
for t
axat
ion
266
.59
151
.82
3.9
7 3
2.33
- 5
1.85
0.2
7 3
.63
2.9
4 0
.39
0.0
2 3
.99
0.0
1 -
- -
Profi
t afte
r tax
atio
n 5
07.3
6 2
89.5
8 1
2.42
228
.89
(0.2
7) 1
06.3
5 (3
6.18
) 7
.14
35.
34 1
1.63
(1.8
7) 2
6.03
0.2
8 (0
.28)
(0.2
5) 6
.17
Prop
osed
Divi
dend
(Equ
ity)
0.2
1 N
IL N
IL N
IL N
IL N
IL N
IL 3
.76
NIL
NIL
NIL
NIL
NIL
NIL
NIL
NIL
% o
f Sha
reho
ldin
g 1
00.0
0 1
00.0
0 1
00.0
0 7
4.00
100
.00
100
.00
100
.00
100
.00
100
.00
100
.00
100
.00
100
.00
100
.00
100
.00
100
.00
100
.00
Not
e:
(1)
Shar
e C
apita
l doe
s no
t in
clud
e Pr
efer
ence
Sha
re c
apita
l.
(2)
Tota
l lia
bilit
ies
incl
ude
curr
ent
liabi
litie
s an
d pr
ovis
ion,
Pre
fere
nce
Shar
e C
apita
l and
exc
lude
s Eq
uity
Sha
re C
apita
l and
Res
erve
s.
(3)
Inve
stm
ents
incl
ude
inve
stm
ents
and
sto
ck-in
-tra
de r
epor
ted
by t
he a
bove
ent
ities
and
als
o in
clud
e in
vest
men
ts h
eld
to c
over
pol
icy
hold
ers’
liab
ilitie
s an
d un
it lin
ked
liabi
litie
s.
(4)
Turn
over
is t
he t
otal
inco
me
repo
rted
by
each
of
the
entit
ies
in t
heir
finan
cial
sta
tem
ents
.
(5)
Div
iden
d ex
clud
es c
orpo
rate
div
iden
d ta
x.
(6)
% o
f Sh
areh
oldi
ng in
clud
es d
irect
and
indi
rect
hol
ding
thr
ough
sub
sidi
ary.
(7)
Kot
ak M
ahin
dra
Gen
eral
Insu
ranc
e Li
mite
d (K
MG
IL) w
as in
corp
orat
ed o
n 20
th D
ecem
ber,
201
4. K
MG
IL is
aw
aitin
g lic
ense
app
rova
l fro
m IR
DA
I and
is y
et t
o co
mm
ence
ope
ratio
ns.
(8)
The
figur
es in
res
pect
of
Kot
ak M
ahin
dra,
Inc.
, Kot
ak M
ahin
dra
(UK
) Lim
ited,
Kot
ak M
ahin
dra
(Inte
rnat
iona
l) Li
mite
d an
d K
otak
Mah
indr
a Fi
nanc
ial S
ervi
ces
Lim
ited
are
base
d on
the
acc
ount
s pr
epar
ed
unde
r In
dian
Acc
ount
ing
Stan
dard
s. T
he r
epor
ting
curr
ency
of
thes
e su
bsid
iarie
s is
US$
and
exc
hang
e ra
te a
s on
the
last
day
of
the
finan
cial
yea
r en
ding
31s
t M
arch
, 201
5 is
1 U
SD =
INR
62.5
0
(9)
Kot
ak M
ahin
dra
Ass
et M
anag
emen
t (S
inga
pore
) Pte
. Lim
ited
is y
et t
o co
mm
ence
ope
ratio
ns.
(10)
G
loba
l Inv
estm
ents
Opp
ortu
nitie
s Fu
nd L
imite
d (G
IOFL
) cea
sed
to b
e su
bsid
iary
fro
m 1
2th
May
, 201
4.
82 ANNUAL REPORT 2014-15
Statement containing salient features of the financial statement of subsidiaries/associate companies (Contd.)
PART “B” : Associates
(` in Crore)
Particulars Infina Finance Private Limited
Phoenix ARC Private Limited
ACE Derivatives and Commodities
Exchange Limited 1 & 5
Matrix Business Services India Private
Limited 1 & 4
Latest Audited Balance Sheet date 31-Mar-15 31-Mar-15 31-Mar-14 31-Mar-14
Shares of Associate held by the Group on the year endNos. 1,100,240 82,320,000 43,795,700 103,255
Amount of Investment in Associates 1.10 97.76 47.62 2.32
Extend of Holding % 49.99% 49.00% 40.00% 19.77%
Description of how there is significance influence
Ownership of 20% or more of the voting
power
Ownership of 20% or more of the voting
power
Ownership of 20% or more of the voting
power
Significance influence through Board representaion
Reason why the associate is not consolidated
Ownership of less than 50% of the Voting
Power and no control over the Board
Ownership of less than 50% of the Voting
Power and no control over the Board
Ownership of less than 50% of the Voting
Power and no control over the Board
Ownership of less than 50% of the Voting
Power and no control over the Board
Networth attributable to Shareholding as per latest audited Balance Sheet 4 & 5
590.87 130.03 5.73 6.30
Profit / Loss for the year 1 74.49 18.89 (20.32) 6.61
i) Considered in the Consolidation 37.24 9.26 (8.13) 1.51
ii) Not considered in the Consolidation 37.25 9.63 (12.19) 5.10
Note:
(1) For the purpose of preparation of consolidation financial statements, the group has considered unaudited financial statement.
(2) Significant influence has been determined as per Accounting Standard 23 “Accounting for Investments in Associates in Consolidated Financial Statements” specified under Section 133 of the Companies Act, 2013, read with Rule 7 of the Companies (Accounts) Rules, 2014.
(3) During the year, the Group partially divested its stake in Matrix Business Services India Private Limited.
(4) Share of audited Networth based on share holding as on 31 March, 2014 of 31.26 % is ` 7.90 Crs
(5) Share of audited Networth based on share holding as on 31 March, 2014 of 40.00 % is ` 11.63 Crs
For and on behalf of the Board of Directors
Dr. Shankar AcharyaChairman
Uday KotakExecutive Vice Chairman and Managing Director
Dipak GuptaJoint Managing Director
Jaimin BhattPresident and Group Chief Financial Officer
Bina ChandaranaCompany Secretary
Basel III (Pillar 3) Disclosures (Consolidated) as at 31st March, 2015In accordance with RBI circular DBOD.No.BP.BC.2/21.06.201/2013-14 dated 1st July, 2013, banks are required to make half yearly Pillar 3 disclosures under Basel III capital requirements with effect from 30th September, 2013.
The Bank has made these disclosures which are available on its website at the following link: http://ir.kotak.com/downloads/pdf/pillar3_disclosures_mar_15.pdf.
The disclosures have not been subjected to review by the statutory auditors of the Bank.