92
Annual Report and Financial Statements Part of you. From the start.

Annual Report and Financial Statements
Part of you. From the start.

Waterbuck at Haller Park - Mombasa

1
2010 | BAMBURI CEMENT LIMITED - ANNUAL REPORT
CONTENTS
2 5 year Performance Highlights
3 Value Added Statement
4 The Group Information
4 Our Vision
4 Our Ambitions
4 Our Values
4 Lafarge Group
5 Corporate Information
7 Board of Directors
10 Management Team
11 Chairman’s Statement
13 Managing Director’s Statement
16 Management’s Discussion and Analysis of
Financial Conditions and Results of Operation
16 Economic Highlights
16 Sector Highlights
16 Segment Highlights
20 Corporate Governance
24 Corporate Social Responsibility
24 Safety Performance
25 Community Development
28 Stakeholder Engagement
29 Awards and Recognitions 2010
30 Notice of Annual General Meeting
33 Financial Statements
43 Notes to Financial Statements
85 Shareholding
87 Proxy Form
Table of Contents
Page
First fi re kiln light up at Hima Cement’s new production line.

2
2010 | BAMBURI CEMENT LIMITED - ANNUAL REPORT
5 Year Performance Highlights
Group Turnover
10,84715,253
18,72719,953 17,579
5,641
6,858
8,74010,041
10,496
-
5,000
10,000
15,000
20,000
25,000
30,000
2006 2007 2008 2009 2010
Sh
s M
illio
n
Hima Bamburi
7.2
9.918.78
18.32
5.506.00 6.00
11.00
0
2
4
6
8
10
12
14
16
18
20
2006
EPS (Shs per share)
2007 2008 2009 2010
Sh
s p
er s
har
e 14.02
8.50
DPS (Shs per share)
7.2
9.9111.54
14.41
5.506.00 6.00
7.00
0
2
4
6
8
10
12
14
16
18
20
2006
EPS (Shs per share)
2007 2008 2009 2010
Sh
s p
er s
har
e 14.02
8.50
DPS (Shs per share)
Earnings/ Dividend per Share Earnings/ Dividend per ShareAdjusted for ARM divestment and Insurance claim
13,01714,229
15,496
19,497 20,165
-
5,000
10,000
15,000
20,000
25,000
2006 2007 2008 2009 2010
Sh
s M
illio
n
Shareholder Equity
Operating Income
3,987
5,513 5,962
7,731
0
1,000
2,000
3,000
4,000
5,000
6,000
7,000
8,000
2006 2007 2008 2009 2010
Sh
s M
illio
n
7,282
Profit attributable to shareholders
2,614
3,596 3,187
6,649
5,089
-
1,000
2,000
3,000
4,000
5,000
6,000
7,000
8,000
2006 2007 2008 2009 2010
Sh
s M
illio
n
121
7074
91
14
0
20
40
60
80
100
120
140
2006 2007 2008 2009 2010
Sh
s M
illio
n
Finance Costs
7391,237
5,840
1,912
3,704
1,928
4,146
9,008
3,409
8,735
-
1,000
2,000
3,000
4,000
5,000
6,000
7,000
8,000
9,000
10,000
2006 2007 2008 2009 2010
Sh
s M
illio
n
Net Cash used in Investing activities Net cashflow from operating activities
Investments and Net Cashflows from Operating Activities

3
2010 | BAMBURI CEMENT LIMITED - ANNUAL REPORT
Value Added Statement
CustomersNet cash from our activities
Shs 28,463m
CustomersNet cash from our activities
Shs 28,463m
Emplo
yeesSta
ff Cost
s Shs 2,127mCommunities
Contribution Shs 88m
Shar
ehol
ders
Div
iden
ds S
hs 3
,993
mSuppliers
Purchases Shs 11,301m
Governm
entTaxes Shs 3,229m
Debt Financiers
Loan Shs 3,034mBank
sInterest Shs 9
1m
Proj
ects
Capita
l Inv
estm
ents
Shs
3,4
29m

4
2010 | BAMBURI CEMENT LIMITED - ANNUAL REPORT
Our Vision
To be the leading market and end-user oriented Cement Company across Eastern Africa, with a strong and clear dedication to our communities.
Our Ambitions
To enable us achieve our vision as one entity driven by the same energy, the Group identifi ed tangible ambitions in fi ve key areas:
1. Safety, Health and Environment We are dedicated to:- Training employees, contractors and
business partners and adopting Best practices to ensure safety for all.
- The good health of our employees and welfare of our local communities
- Protecting the natural environment and limiting the impact of our activities on the ecology.
2. Innovation- We are committed to top line growth
through the introduction of new and innovative products. We commit to have a signifi cant amount of our turnover generated from new products.
3. Sustainable Market Leadership- We are committed to being the leader
in Eastern Africa market, with strong sales to the inland export markets.
4. Profi table Enterprise- To protect and augment our
profi tability by enhancing production and other internal effi ciencies while realising our aim to make cement affordable to our customers and end users.
5. Team Achievement We are focussed on:- Attracting the best talent, developing
the skills and potential of our people and recognising and rewarding achievement.
- Building a disciplined and motivated workforce that drives for outstanding results.
Our Values
As part of the Lafarge family, we are bound by shared values. The Lafarge brand stands for commitment to excellence and the values of the group are expressed in the ‘Lafarge Way’.
The Lafarge Way
Courage, integrity, commitment, consideration for others and an overriding concern for the group’s interest are the foundations of our management philosophy. Every employee is expected to demonstrate commitment to these values. We will achieve them by:
Making our people successful• Expecting people to give their best.• Leading by example.• Achieving greater results through
teamwork.
Focussing on performance improvement• Resulting from actions of all.• Making performance a daily
commitment.• Sharing systems and tools.
With a multi-local organisation• Building on our local and global
strengths.• Making our Business Units successful
by leveraging the resources of a decentralised organisation.
• Sharing clear processes and a limited number of respected and known rules.
Lafarge in Brief
Lafarge is the world leader in building materials, with top-ranking positions in all of its businesses: Cement, Aggregates & Concrete and Gypsum. With 76,000 employees in 78 countries, Lafarge posted sales of Euros 16.2 billion in 2010.
Lafarge was ranked 6th in the “Carbon Disclosure Project” and entered the global “Dow Jones Sustainability Index”
in 2010 in recognition of its sustainable development actions.
With the world’s leading building materials research facility, Lafarge places innovation at the heart of its priorities, working for sustainable construction and architectural creativity.
Additional information is available on the web site at www.lafarge.com.
Lafarge Group
The Group Information
Consolidated 2010 2009 M€ M€Sales 16,169 15,884Operating Income 2,441 2,477
Cement Division 2010 2009 M€ M€Sales 10,280 10,105Operating Income 2,230 2,343
2010 Key Figures

5
2010 | BAMBURI CEMENT LIMITED - ANNUAL REPORT
Corporate Information
DIRECTORS Executive H. Mansi (Egyptian) - Group Managing Director D. Njoroge - General Manager, Hima Cement Limited J. Oigara - Group Finance Director Non Executive R. Kemoli - Chairman S. W. Karanja C. C. Kisire S. M’Mbijjewe D. Brugier (French) J. Stull (American) A. Kazongo SECRETARY B. Kanyagia Certified Public Secretary (Kenya) Kenya-Re Towers, Upper Hill P. O. Box 10921 – 00100 GPO Nairobi
REGISTERED OFFICE Kenya-Re Towers, Upper Hill P. O. Box 10921 – 00100 GPO Nairobi
REGISTRARS Custody & Registrars Services Limited Bruce House Standard Street P. O. Box 8484 – 00100 GPO Nairobi
AUDITORS Deloitte & Touche Certified Public Accountants (Kenya) Deloitte Place, Waiyaki Way, Muthangari P. O. Box 40092 – 00100 GPO Nairobi
PRINCIPAL BANKERS Citibank N A Citibank House, Upper Hill P. O. Box 30711 – 00100 GPO Nairobi,Kenya
Standard Chartered Bank Kenya Limited Kenyatta Avenue Branch P. O. Box 40310 – 00100 GPO Nairobi, Kenya
Citibank N A Uganda Centre Court, Nakasero P. O. Box 7505 Kampala, Uganda
Standard Chartered Bank Uganda Limited Speke Road Branch, 5 Speke Road P. O. Box 7111 Kampala,Uganda

6
2010 | BAMBURI CEMENT LIMITED - ANNUAL REPORT
Corporate Information
The Nyali Bridge - Mombasa

7
2010 | BAMBURI CEMENT LIMITED - ANNUAL REPORT
NON EXECUTIVE DIRECTORS
Richard Kemoli, 75 holds a B. Sc (Econ) London Degree from Makerere University, Kampala and a Diploma in Management Studies at Regent Street Polytechnic (now University of Westminster, London). He is a member of the Institute of Directors, United Kingdom. He has 33 years experience with Commonwealth Development Corporations - East Africa Region. He is the Chairman of the Boards of Directors of Bamburi Cement Limited and the Unga Group of Companies together with being a director in several other companies.
Amb. Solomon Karanja, 74 is a BA graduate of Makerere University and holds an MA from University of London. He has worked as a Deputy to the University of East Africa Registrar and was the first Kenyan Registrar of the University of Nairobi. Subsequently he held the position of Executive Chairman, East Africa Portland Cement Company for twelve years until he was appointed Executive Chairman National Bank of Kenya in 1987. He has served as Chairman of the Kenya Golf Union, Muthaiga Golf Club and Fidelity Shield Insurance Company. Amb. Karanja has also been appointed by the Government to serve on several commissions. He recently retired as a Director of Muthaiga Country Club and also as the Kenyan Ambassador & Permanent Representative to UN Habitat after serving for two three year terms. Amb. Karanja is the Chairman of the Kenya Medical Supplies Agencies.
Board of Directors
John Stull, 50 holds a Bachelor of Science Degree in Chemical Engineering from the University of Akron and a Business Management Degree from Harvard University. He is the Regional President, Sub-Saharan Africa. He joined Lafarge in 1992 as Operations Manager rising to Plant Manager, Alpena MI with overall responsibility of the largest cement plants in North America. In 1996, he was promoted to Vice President, Manufacturing US Region, a position he held until 2000 when he was promoted to President Missouri Division, Ready-mix and Aggregates. Thereafter, John held numerous positions including Senior Vice President, Marketing and Supply Chain, Paris and Regional President, Latin America.
Sheila M’Mbijjewe MBS, 53 is a Chartered Accountant ICAEW and a Certified Public Accountant. She is the Chairperson of the Audit Committee. Sheila’s previous jobs have included the Finance Director position at PricewaterhouseCoopers, Stagecoach International and Standard Chartered Bank Kenya. She is a member of the Monetary Policy Committee of the Central Bank of Kenya.
Alex Kazongo, 46 is the Managing Trustee of the National Social Security Fund (NSSF). He holds a Bachelor of Commerce – Accounting Degree from the University of Nairobi and is a Member of the Institute of Certified Public Accountants of Kenya. Alex has a wealth of experience in investment and financial management from both the private and public sectors, having worked in senior positions at Kenya Ports Authority, Kenya Pipeline Company, Old Mutual, and Deloitte & Touche among others. He is also a director in National Bank of Kenya, East African Portland Cement Company Ltd and Consolidated Bank.
Chris C. Kisire, 44 is a holder of Bachelor of Commerce - Accounting Major and a Masters of Business & Administration degrees from the University of Nairobi. He also holds Certified Public Accountant of Kenya, CPA (K) and Certified Public Secretary of Kenya, CPS (K) qualifications. He is a member of the Institute of Certified Public Accountants of Kenya (ICPAK) and Institute of Certified Public Secretaries of Kenya (ICPSK). He has business experience spanning over nineteen years in Finance, Administration and Business Management both locally and internationally. He is currently the Group Chief Executive Officer of Sovereign Group Limited, an international investment Group.
Dominique Brugier, 52 is a graduate mechanical engineer from Ecole des Arts et Metiers, Paris. He joined Lafarge in 1991 as a Mechanical Expert. He moved to Lafarge China in 1995 as a Maintenance Manager, became Project Manager in 1997 and rose to Industrial Director in 2005. In 2009, he was promoted to the position of Director, Performance and Progress, East and West Sub-Saharan, Africa.

8
2010 | BAMBURI CEMENT LIMITED - ANNUAL REPORT
Board of Directors
Betty Kanyagia, 36 is a graduate of the University of Nairobi, LLB, a Commissioner for Oath and Notary Public. She practised with a law firm in Nairobi before joining PricewaterhouseCoopers, Tax and Legal Services Department as a Consultant. Betty joined Bamburi Cement Limited in 2003 as the Compensation and Benefits Manager, a position she held until she took over as Company Secretary in June 2007. She is a member of the Law Society of Kenya, the Chartered Institute of Arbitrators - Kenya Chapter, the Institute of Certified Public Secretaries of Kenya and the Commonwealth Lawyers Association.
SECRETARY
Joshua Oigara, 35 has an MBA from Edith Cowan University (ECU) in Australia. He holds a BCom. (HONS) degree in Accounting from the University of Nairobi and is a Certified Public Accountant of Kenya. He is a member of the Institute of Public Accountants of Kenya (ICPAK). He is a graduate of the Duke University Business School (Fuqua) Leadership Development Programme and the Institut Europeen d’Administration des Affaires (INSEAD) Advanced Management Programme. He started his professional career with PricewaterhouseCoopers in Kenya and also worked with Bidco Oil Refineries Limited before joining the Company in 2003. He was seconded to Hima Cement Limited in Uganda before being promoted to the Group Controller position in 2006. He was appointed as the Group Finance Director in 2008. He is a director in the Group’s three Subsidiary companies and chairs the Board Audit Committee for Mbeya Cement Company Limited. He has experience in commercial, performance improvement, IT management, business advisory and finance across various sectors in East Africa.
Hussein Mansi, 44 Managing Director, is a graduate of the University of Cairo, B. Sc (1988) and has a Post Graduate Certificate of Business Administration from the University of Leicester, UK (2004). He began his career in 1989 as a Design Engineer Saudi Building Systems. In January 1999, he joined the Orascom Cement Division, which was acquired by Lafarge in 2007, in the Egyptian Cement Company as Works Director, Sales and Marketing rising to Commercial Director, Algeria Cement Company, a position he held until December 2009.
David Njoroge, 40 is a holder of a Bachelor of Commerce degree, Accounting major and is a Certified Public Accountant. He has attended managerial, financial and leadership related courses’ both locally and internationally and has broad experience in finance and related fields. He joined the company in 1999 as Finance Manager a position he held until 2002 when he was promoted to Group Finance Director. In April 2006, he was appointed General Manager, Hima Cement Ltd and also responsible for the Group’s capacity increase projects in Uganda. He is also a director at the Nairobi Stock Exchange where he chairs the Finance and Manpower Committees.
EXECUTIVE DIRECTORS

9
2010 | BAMBURI CEMENT LIMITED - ANNUAL REPORT
Board of DirectorsBoa
rd o
f Dire
ctor
s
From
lef
t to
rig
ht s
tand
ing:
Josh
ua O
igar
a, C
hris
C. Kis
ire, Dav
id N
joro
ge, Hus
sein
Man
si, Dom
iniq
ue B
rugi
er, Am
b. S
olom
on K
aran
ja, A
lex
Kaz
ongo
From
lef
t to
rig
ht s
ittin
g:Bet
ty K
anya
gia,
Ric
hard
Kem
oli,
John
Stu
ll, S
heila
M’M
bijje
we

10
2010 | BAMBURI CEMENT LIMITED - ANNUAL REPORT
Management TeamM
anag
emen
t Te
am
From
lef
t to
rig
ht s
tand
ing:
Josh
ua O
igar
a, F
inan
ce D
irect
or; St
eve
Oke
yo, Sa
les
Dire
ctor
; Ro
bert N
yang
aya,
Mar
keting
Dire
ctor
; Hen
ri N
icot
, In
dust
rial
Dire
ctor
;Ta
riq
Iqba
l, Su
pply
Cha
in D
irect
or; Jo
b Odu
or, Pr
ojec
ts D
irect
or; Xa
vier
DeC
hare
nten
ay - Ind
ustria
l M
anag
er.
From
lef
t to
rig
ht s
ittin
gSu
san
Mai
ngi,
Hum
an R
esou
rce
and
Org
anis
atio
n Dire
ctor
; Hus
sein
Man
si, M
anag
ing
Dire
ctor
; Dav
id N
joro
ge, Gen
eral
Man
ager
, Him
a Ce
men
t
11
2010 | BAMBURI CEMENT LIMITED - ANNUAL REPORT
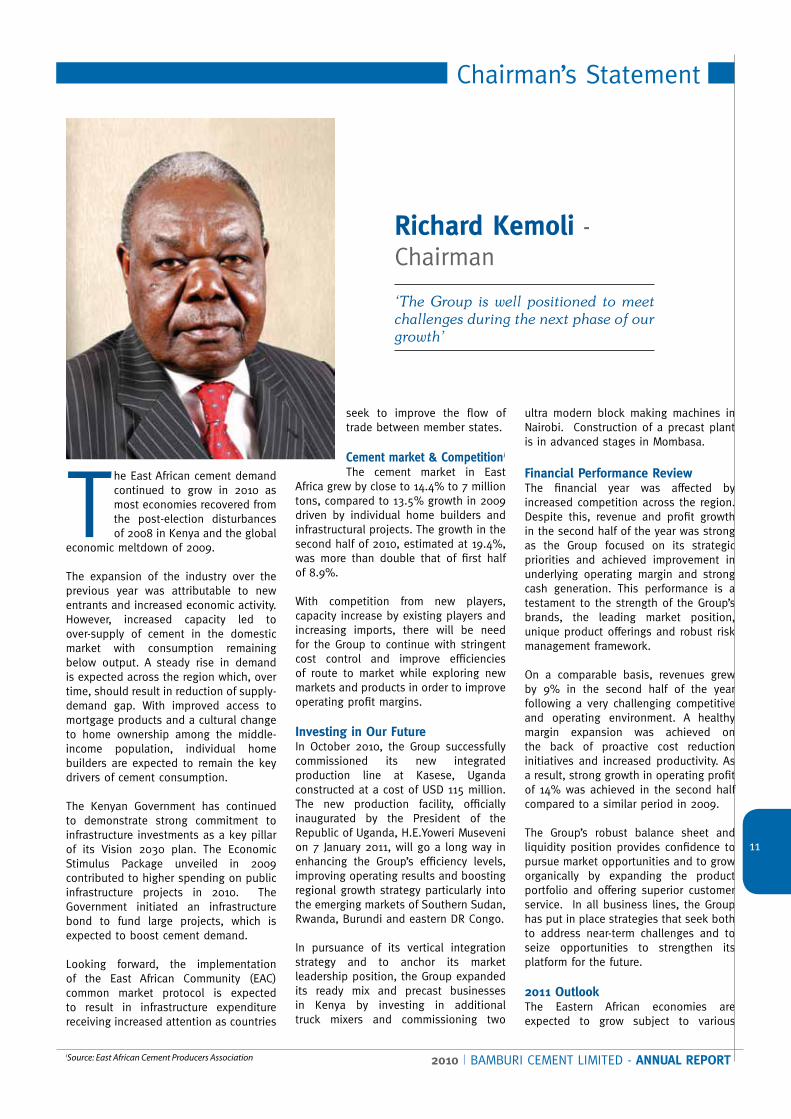
Chairman’s Statement
The East African cement demand continued to grow in 2010 as most economies recovered from the post-election disturbances of 2008 in Kenya and the global
economic meltdown of 2009. The expansion of the industry over the previous year was attributable to new entrants and increased economic activity. However, increased capacity led to over-supply of cement in the domestic market with consumption remaining below output. A steady rise in demand is expected across the region which, over time, should result in reduction of supply-demand gap. With improved access to mortgage products and a cultural change to home ownership among the middle-income population, individual home builders are expected to remain the key drivers of cement consumption.
The Kenyan Government has continued to demonstrate strong commitment to infrastructure investments as a key pillar of its Vision 2030 plan. The Economic Stimulus Package unveiled in 2009 contributed to higher spending on public infrastructure projects in 2010. The Government initiated an infrastructure bond to fund large projects, which is expected to boost cement demand.
Looking forward, the implementation of the East African Community (EAC) common market protocol is expected to result in infrastructure expenditure receiving increased attention as countries
seek to improve the flow of trade between member states.
Cement market & Competitioni
The cement market in East Africa grew by close to 14.4% to 7 million tons, compared to 13.5% growth in 2009 driven by individual home builders and infrastructural projects. The growth in the second half of 2010, estimated at 19.4%, was more than double that of first half of 8.9%.
With competition from new players, capacity increase by existing players and increasing imports, there will be need for the Group to continue with stringent cost control and improve efficiencies of route to market while exploring new markets and products in order to improve operating profit margins.
Investing in Our FutureIn October 2010, the Group successfully commissioned its new integrated production line at Kasese, Uganda constructed at a cost of USD 115 million. The new production facility, officially inaugurated by the President of the Republic of Uganda, H.E.Yoweri Museveni on 7 January 2011, will go a long way in enhancing the Group’s efficiency levels, improving operating results and boosting regional growth strategy particularly into the emerging markets of Southern Sudan, Rwanda, Burundi and eastern DR Congo.
In pursuance of its vertical integration strategy and to anchor its market leadership position, the Group expanded its ready mix and precast businesses in Kenya by investing in additional truck mixers and commissioning two
ultra modern block making machines in Nairobi. Construction of a precast plant is in advanced stages in Mombasa.
Financial Performance ReviewThe financial year was affected by increased competition across the region. Despite this, revenue and profit growth in the second half of the year was strong as the Group focused on its strategic priorities and achieved improvement in underlying operating margin and strong cash generation. This performance is a testament to the strength of the Group’s brands, the leading market position, unique product offerings and robust risk management framework.
On a comparable basis, revenues grew by 9% in the second half of the year following a very challenging competitive and operating environment. A healthy margin expansion was achieved on the back of proactive cost reduction initiatives and increased productivity. As a result, strong growth in operating profit of 14% was achieved in the second half compared to a similar period in 2009.
The Group’s robust balance sheet and liquidity position provides confidence to pursue market opportunities and to grow organically by expanding the product portfolio and offering superior customer service. In all business lines, the Group has put in place strategies that seek both to address near-term challenges and to seize opportunities to strengthen its platform for the future.
2011 OutlookThe Eastern African economies are expected to grow subject to various
Richard Kemoli - Chairman
‘The Group is well positioned to meet challenges during the next phase of our growth’
iSource: East African Cement Producers Association

12
2010 | BAMBURI CEMENT LIMITED - ANNUAL REPORT
Chairman’s Statement
uncertainties, key among them being the rising global fuel prices.
The regulatory environment will continue to be a challenge for cement manufacturers in the region. The influx of cheap cement into the region continues to pose a major threat to the cement industry. However, the Group together with other industry players is engaging the governments of EAC through the East Africa Cement Producers Association (EACPA).
The Group remains committed to deepening our relationships with our customers and key partners. We will continue to focus relentlessly on cost control, industrial productivity improvements and customer service while remaining alert to any opportunities that may arise.
Appreciation
The Group owes a debt of gratitude to all its shareholders, the Board of Directors, management and staff for guiding the Group during a very difficult and challenging year while re-positioning the Group to meet the challenges during the next phase of growth.
This was an extraordinary year and it made extraordinary demands on many of our people. It is through our staff that the Group’s distinctive character stood out for our customers. There can be no doubt that the Group’s resilience is testament to the indomitable spirit and capability of our staff. Our employees’ commitment to customer service and innovation will be key to securing our ambitions. The Board has the confidence that the Group has the leadership and the people to
exploit these opportunities to the best advantage of our shareholders.
I wish to highlight the four Financial Reporting awards the Group received during the period under review. These were Overall winner: Industrial, Commercial and Services category, Overall winner: International Financial Reporting Standards, First Runner up: Best Listed entities and First Runner Up: Corporate Social Responsibility. These awards could not have been achieved without the commitment, dedication and hard work of the Group’s employees.
I am also particularly grateful to our shareholders for their faith and continued support. Based on our combined effort, I have no doubt that we can successfully execute the goals we have set for ourselves.

13
2010 | BAMBURI CEMENT LIMITED - ANNUAL REPORT
Managing Director’s Statement
The group made a strong recovery in the second half of the year after a difficult first half. Despite subdued performance occasioned by increased
regional competition, capacity increases by major players and spiraling fuel costs, the group emerged stronger in the second half to post impressive results in all key operational and financial performance headers. The group’s financial results are a clear demonstration of our internal strengths and resolve to maintain regional market leadership.
Safety, Health and EnvironmentThe group continues to raise the bar on safety performance excellence in the region. During the year, the group performed exceptionally well by posting zero industrial and road fatalities for both employees and contractors leading to the group’s admission into the Lafarge Health and Safety Excellence Club, an exclusive club joined only after the fulfilment or strict performance standards and demonstration of excellence in safety maturity audits. These achievements were realized on the back of higher industrial activities spurred by the commissioning of the new plant in Uganda and the expansion of the ready mix concrete and precast units in Kenya.
Furthermore, as part of our continued focus on road safety management practices in the value chain, the group rolled out the ‘Mchukuzi’ Awards in June 2010 and subsequently ‘Know
your driver’ campaign in December 2010 to enhance safety partnering with contracted transport operators. To proactively enhance road safety along major routes, the group implemented route hazards mapping using geo-fencing on electronic vehicle tracking and global positioning systems (GPS). The group’s annual road safety campaigns in Kenya and Uganda branded ‘Waza Usalama’- Swahili word meaning ‘Think Safety’ attracted many stakeholders key among them transporters, Total Kenya limited, the World Bank, the Traffic Police department, the Ministry of Transport, the National Road Safety Council, the Provincial Administration as well as Municipalities in all areas we operate.
Health remains a key pillar in the group’s operating strategy anchored in our ambition to be the world’s safest business with zero accidents and zero occupational illnesses. During the year, the group successfully completed HIV/AIDS & Malaria Workplace Programme for 31 contractor companies through a Public Private Partnership with the German Development Agency (GIZ). More than 2000 contractor staff participated and have since benefitted from enhanced workplace health policies, registration with the National Health Insurance Fund (NHIF) and several promotion interventions at their workplaces.
The group’s environmental focus was recognized through the award for “The Best Environmental Compliant Firm
2010” - Cement Sector from the National Environmental Management Authority (NEMA). The group’s environmental protection through community partnering continues to yield positive results for communities.
During the year, over 50% of seedlings were sourced from community nurseries while maintenance of the Biofuels plantations carried out through the shamba system cultivators resulting in a 28% growth of community earnings over 2009 to KES 3.2 million.
The group has a strict policy for rehabilitation of quarries. During the year under review, quarry rehabilitation coverage was extended by a further 23% and by planting an additional 504,000 seedlings.
Capacity enhancementIn October 2010, the group successfully commissioned its fully integrated state of the art cement plant in Kasese, Uganda. The plant increased the annual cement output capacity from 500,000 tonnes to 850,000 tonnes. The USD 115 million plant is also expected to increase efficiency and profitability in the future.
In pursuant of the ready mix and precast businesses expansion strategy, the group invested in additional truck mixers and commissioned two ultra modern block making machines in Nairobi and is in progress of finalizing the Mombasa set up. These investments have cemented
Hussein Mansi - Group Managing Director
“The group steered through a challenging first half to emerge stronger in the second. We believe our investments will sustain profitability momentum into the future.’’

14
2010 | BAMBURI CEMENT LIMITED - ANNUAL REPORT
Managing Director’s Statement
the group’s market leadership position in the segment.
Operational and financial performanceThe Group demonstrated strong resilience in the face of new capacities by competition across all markets, by increasing its turnover in the second half of the year by 9% compared to a similar period last year.
Operating profit for the year decreased by 5.8% to Shs 7.3 billion driven by lower turnover and higher power prices in the first quarter of the year. However, there was strong recovery in the second half of the year on the back of improved efficiencies from the new production line in Uganda and major steps on cost reduction efforts, resulting in a 14% growth in operating profit compared to the previous year. The fixed operating expenses dropped by 8%, notwithstanding inflationary pressures. The improvements in the distribution system implemented in March 2009, resulted in lower distribution costs in
comparison to prior year.
Profit before tax and exceptional items dropped by 7.4%. The exceptional items in 2009 were the major one-off divestment gain from Athi River Mining of Shs 1.2 billion and receipt of Shs 218 million from the insurers in respect of the Mombasa Plant fire incident of 2007.
The Group’s working capital improvement initiatives taken during the year contributed to boosting its cash position. The Group refinanced its US dollar denominated loan from the ultimate holding company by a local currency loan to mitigate hard currency exposure in Uganda.
Outlook for 2011The group takes cognisance of increased competitive environment and continues to implement appropriate strategies to enhance its growth and profitability. The new production line at Kasese Plant, Uganda will go a long way in enhancing
the Group’s efficiency levels and improve operating results. The Group will focus on maintaining a superior offer to the market through, inter alia, innovation and first-rate customer service. Further, the Group will increase its efficiency by stringent cost management and rationalization of capital expenditure while remaining cognisant of its safety and health obligations and environmental stewardship responsibilities.
To steer through the anticipated challenges, the Group will leverage on the ongoing commercial initiatives to drive sales and grow its market share, improve industrial productivity to meet customer expectations and sustain the cash generation initiatives.
The group appreciates the support of all its stakeholders, its loyal customers, service providers, regional governments and talented staff and will continue to rely on them as it strives to cement its market leadership position.

15
2010 | BAMBURI CEMENT LIMITED - ANNUAL REPORTReady Mix Concrete Truck

16
2010 | BAMBURI CEMENT LIMITED - ANNUAL REPORT
Segment HighlightsKENYA
Bamburi Cement Limited
The company‘s operating profit dropped by 9.4% to Shs 5.8 billion (2009: Shs 6.4 billion) mainly due lower turnover occasioned by lower domestic volumes and realized prices accentuated by realignment of the competitive landscape.. The pressure on top line was greatly cushioned by strong reduction
in fixed expenses, production efficiency enhancements and improvements in the distribution system.
SalesThe company’s total sales revenues dropped by 12.9% to Shs 19.8 billion (2009: Shs 22.8 billion). Domestic volumes dropped on the back of evolving competition landscape.. Despite a 6.8% growth in export volumes, export sales revenues dropped marginally by 6.4%
to Shs 4.4 billion (2009: Shs 4.7 billion) mainly due to increased price competition in inland Africa markets. Increased regional demand was mainly driven by public infrastructure rehabilitation projects.
During the year, clinker sales volumes dropped to 23Kt (2009: 76Kt) mainly due to reduced clinker exports to Hima in Uganda on the back of capacity expansion and improved clinker productivity.
Management’s Discussion and Analysisof Financial Conditions and Results of Operation
Economic Highlights
Sector Highlights
Kenya’s economy demonstrated strong recovery from several shocks which included two consecutive droughts. Gross Domestic Product (GDP) growth remained strong at above 5% up from 2.6% in 2009 to stand at USD 32.4 billion. This was driven mainly by a rebound in agriculture and a boost in construction activity specifically in the second half, helped by the government’s renewed efforts to upgrade infrastructure.
According to the IMF, the ratification of the new constitution by the August 2010 referendum spurred confidence as it
provides an opportunity to address long-standing social and institutional problems and implement additional reforms, including on fiscal decentralization, the public expenditure framework, and land ownership.
Annual average inflation in the year declined to 4.08% from a high of 9.2% in 2009 mainly driven by lower food and electricity prices. The shilling depreciated against major hard currencies edging slightly above the Shs 80: USD barrier.
Uganda’s economy was characterized
by volatile currency movements against major hard currency mainly driven by speculation and sentiments overriding economic fundamentals.
The Uganda shilling edged out 6.8% weaker to the USD over the period compared to 2009. Headline inflation dropped to 3.1% taking benefit of increased food supplies. GDP growth was estimated above 6% (2009: 6.3%) edging out at approximately USD 16 billion mainly driven by a resilient agricultural sector.
East Africa cement consumption recorded an estimated growth of 14.4% to 7 million tonnes mainly due to increased government expenditure on development projects and donor funded projects. The region’s per capita consumption of cement stood at 60 kg/ca compared to an average of 54kg/ca in 2009.
In Kenya, cement market grew by 15.3% to 3.1 million tonnes on the back of increased government investment in infrastructure development projects. The growth in the first half was relatively slower at 8.5% but rose sharply to 21.5% in the last six months of the year.
In Uganda, the cement market grew by 12.9% to 1.5 million tons stimulated by privately financed construction projects. The Bujagali hydro power project, which has been a key driver of cement consumption in Uganda, is expected to be finalized in the first quarter of 2011.

17
2010 | BAMBURI CEMENT LIMITED - ANNUAL REPORT
1. Mombasa Plant
Boasting of a good lost time injury frequency rate of below 0.7, the plant concluded the year with a straight record of zero fatalities. Mombasa plant continued to perform well in the annual safety audits with a score of above 70%.
Clinker production reduced by 7.6% to 878kt (2009: 950kt), mainly due to lower kiln reliability significantly negated by frequent power interruptions. In pursuance of its alternative fuel substitution ambition, the plant successfully installed a tyre feeding system and continued to substitute petcoke in its kiln processes greatly reducing energy costs.
Cement milling production dropped to 590kt (2009: 641kt) on the back of heightened competition. The production of PowerMax (Cem II 42.5) launched in 2009 increased with growth in market uptake.
The plant’s fire protection project started in 2009 was completed in September and successfully commissioned in November 2010.
2. Nairobi Grinding Plant
The plant achieved four years without any lost time injury (LTI) or medical injury. Furthermore, during the year’s health and safety cross plant audit, the plant achieved the highest score in the Sub Saharan Africa Region of 86.55% compared to 80% in 2009.
Despite attaining a record cement mill utilization rate of 88.4%, the plant’s cement output shrunk to 1.2 million tonnes in 2010 (2009: 1.5 million tonnes) mainly due to increased domestic competition.
The Pozzolana Drier commissioned in 2009 continued to perform well. The plant achieved drier utilization factor of 85% with tangible benefits of better raw material consumption efficiency and higher mill output.
During the year, the fire hydrant and sprinkler alarm system initiated in 2009 as part of the overall fire protection project was installed and fully commissioned. This system will complement the other
fire protection initiatives that are in place, such as the 650,000 litre water tank, to ensure the site is prepared for any fire incident.
Cost environment
Total variable costs decreased by 14.4% mainly due to better power prices and lower imported clinker consumption partly negated by higher fuel prices. The production fixed costs in the year reduced mainly due to cost rationalization across board and continued focus on preventive maintenance practices.
3. Bamburi Special Products Bamburi Special Products Ltd (BSP), a wholly owned subsidiary, is the largest supplier of Ready Mix concrete and precast blocks in Kenya.
During the year, the company’s revenues grew by 40% to Shs 736 million mainly attributed to strong ready mix growth and better laying and distribution revenue streams. The strong top line performance was further augmented by resilient precast performance whose revenues marginally rose by 4%. Profit before tax rose 4 times to Shs 77 million (2009: Shs 10 million) mainly due to strong top line performance bolstered by improvements of ready mix performance.
Sales
Ready Mix operations experienced unprecedented growth in 2010 recording 178% growth in sales volumes to 27,190 m3 (2009: 9,766 m3 ) compared to 2009. This was due to increased uptake of ready mix solutions as a convenient alternative to conventional concrete mixing processes. Pre-cast volumes marginally dropped 2% to 506,169 m2 (2009: 517,351 m2) on the backdrop of diminishing household savings and slow housing demand. The company’s Mombasa operations is expected to commence in quarter one 2011.
Operations
The company attained 1,259 days without any lost time injury, an achievement that accentuates the company’s continued commitment to safety.
During the year, overall production costs grew by 39.3% due to increased production exacerbated by inflationary pressure on key raw materials and high fuel prices. Despite the cost pressure, Ready Mix operations received a major boost with investment in extra truck mixers and a mobile concrete pump, changing the concrete market. Furthermore, the company installed two new block making machines commissioned in November 2010.
These higher capacity machines are expected to significantly bolster production capacity and cement the company’s market leadership position. 2011 will see the installation of additional batching plants and trucking capacity intended to improve the company’s ability to service market demand.
4. Lafarge Eco-Systems Limited During the year, the company’s profit before tax dropped by 55.5% to Shs 8.9 million (2009: Shs 19.9 million) mainly due to lower revenues partly hampered by self sustaining diversification initiatives.
Operations
During the year, the Haller Park and forest trails, attracted 169,637 visitors (2008: 164,186) depicting improvement of domestic tourism.
During the year, the Bio-fuel plantations were extended by another 504,000 seedlings on 142ha, extending total plantation area to 597ha. Unfortunately, a significant number of trees were lost during the two consecutive drought seasons in 2009 and 2010, but the gaps were re-planted. Despite slower growth rates, new tree species were included, amongst them Cassia siamea, Acacia xanthophloea, Neem and various species of Bamboo to boost survival rates under harsh conditions.
More than 50% of the seedlings were bought from community nurseries, trained in seedling production and provided with seeds. During the year, the communities earned Shs3.2m (2009: 2.5m) through sale of seedlings to the Bio-fuel Project while maintenance of the plantations and weed control was carried out through shamba system cultivators and contracted
Industrial Operations

18
2010 | BAMBURI CEMENT LIMITED - ANNUAL REPORT
community groups on 180ha.
UGANDA
Hima Cement Limited
The company’s profit before tax dropped by 36% to Shs 1.0 billion (2009: Shs 1.6 billion) mainly due to higher depreciation charge and financing costs associated with the newly commissioned plant at Kasese.
Sales
The company’s turnover increased by 5% to Shs 10.5 billion (2009: Shs 10.0 billion). Domestic cement sales revenues rose by 31% to Shs 7.1 billion (2009: Shs 5.4 billion) mainly due to higher market presence accentuated by higher capacity. Export sales revenues dropped by 28% to Shs 3.4 billion (2009: Shs 4.7 billion) on
the back of increased competition in key inland Africa markets.
Operations
During the year, the plant attained impressive safety audit score of 73.4% from 66.1% in 2009 on the back of increased activities at the Kasese plant following the successful integration and commissioning of new operations line.
Overall production increased by 95% mainly attributed to the commissioning of the new plant and improved efficiency existing production facilities. This improvement was mainly attributable to better inspections and maintenance done during the shutdowns and the implementation of the Plant Operating Model (POM).
The new plant was up and running with clinker production starting mid May.
Cement mill and the packing plant were also successfully commissioned with the first bag officially launched and unveiled to the stakeholders on 30th July 2010. The new plant was also officially inaugurated by the president of Uganda His excellence President Yoweri Kaguta Museveni on 7th January 2011.
Cost Environment
During the year the business fuel costs increased by 14% due to the impact of increased world fuel prices coupled with axle loading rule enforcement by the government, this was mitigated by higher increase of alternative fuels in our kiln operations. Other operations costs (fixed and variable) increased considerately due to costs related to the new plant.
Hussein Mansi (MD), David Njoroge (GM-Hima Cement) with State Minister for Mines and Mineral Development- Hon Peter Lokeris (center) unveil the first bag from the Hima Cement’s new production line.

19
2010 | BAMBURI CEMENT LIMITED - ANNUAL REPORT
Highlights
Turkwell Hydro Power Station - North Rift-Kenya
20
2010 | BAMBURI CEMENT LIMITED - ANNUAL REPORT
Corporate Governance
Overview
The Bamburi Cement Limited Group of Companies remains committed to the highest standards of corporate governance believing that corporate governance is central to the effective management of the business and increasing shareholder value.
In furtherance of this commitment, the Group undertakes its businesses in full compliance of the laws and in observance of local customs and cultures in the countries within which it operates.
SEPARATION OF RESPONSIBILITIES
There is a clear division of responsibility between the Chairman and the Chief Executive Officer, which is set out in writing in the Board Charter and approved by the Board.
The Chairman is responsible for leadership of the Board, ensuring its effectiveness and setting its agenda. He also ensures effective communication with shareholders and facilitates relations between the different board members.
The Chief Executive Officer is responsible for the day to day management of the Company and the execution of the strategy agreed by the Board.
THE BOARD OF DIRECTORS
Mandate
All matters relating to the Board are guided by the Board Charter. In order to be relevant in the changing environment and improve Board contribution, the Board Charter was updated in 2010.
The Board is collectively responsible for promoting the success of the Company. It has a formal schedule of matters reserved to it for decision and approval,
this schedule was revised and updated in 2010.
The Board provides leadership for the Group and concentrates its efforts on strategic issues, governance, key projects, major investments, controls and monitors performance against the agreed targets. The Board also reviews regular updates on health and safety, which are critical for the Group.
To ensure it meets its responsibilities, the Board undertakes annual self evaluations while the Chairman and the Chief Executive Officer evaluate the performance of the individual members. The performance of the Chairman is evaluated by the Nomination & Corporate Governance Committee.
Membership
The composition of the board is set with the aim of having a board with an appropriate balance of skills and experience to support the Company’s strategy and meet the requirements to lead the Company effectively.
As at the date of this report, the Board had ten directors, seven of whom are non-executive directors. The position of Chair is held by an independent non-executive director. The non-executive directors are experienced and influential individuals from a range of industries and backgrounds, who bring wide and varied experience to the Board and committee deliberations. The Board is satisfied of the independence of the directors who have executive and non-executive directors’ roles with other companies and that they all have sufficient time available to devote to the Company.
Information and Development
The Chairman, working with the Company Secretary, ensures all members of the Board are properly briefed on issues
arising at Board meetings and that they have full and timely access to relevant information. Board papers are distributed two weeks prior to each meeting while the quality and supply of information provided is reviewed as part of the board evaluation process.
The Company has a programme for meeting the Board’s training and development needs. Training begins with comprehensive and tailored inductions that include visits to all sites including the Plants. Subsequent training is available on an ongoing basis to meeting any particular needs.
Further, all directors have access to the advice and services of the Company Secretary together with unlimited access to Company employees, officers, information and records. Directors can also obtain independent professional advice, where necessary and in furtherance of their duties, at the Company’s expense following the procedure laid down in the Board Charter.
The Board is required to have at least four meetings and any additional meetings can be called as deemed necessary. In the year 2010, the Board had four meetings and the attendance is as indicated in the next page.
Company Secretary
Appointment and removal of the Company Secretary is a matter reserved for the Board. She is the central source of information and advice to the Board and within the Company on matters of good governance and business ethics. She has the responsibility for ensuring board procedures are followed and governance matters are complied with.
The Company Secretary is also secretary to the Audit and Nomination & Corporate Governance Committees.

21
2010 | BAMBURI CEMENT LIMITED - ANNUAL REPORT
Corporate Governance
Audit Committee Meetings Attendance:
Name of Director Category 25 February 10 June 5 August 22 November
R. Kemoli Non-executive √ √ √ √C. Kisire Non-executive √ √ √ √S. M’Mbijjewe Non-executive √ √ √ √A. Kazongo Non-executive √ x x x
S. Karanja Non-executive √ √ √ √H. Mansi Executive √ √ √ √J. Stull Non-executive √ x x √D. Brugier Non-executive √ x x √David Njoroge Executive √ √ √ √Joshua Oigara Executive √ x √ √
Board Meeting Attendance
BOARD COMMITTEES
The Board has delegated some of its responsibilities to committees, which review the respective matters delegated to them and make recommendations to the Board. All decisions, however, can only be made by the Board.
Each committee has terms of reference approved by the Board and the Chair of each committee is required to report on their proceedings at the board meeting immediately following the committee meeting.
Audit Committee
The Audit Committee comprises entirely of independent non-executive directors. The Group Internal Audit Manager together with the internal and external auditors are required to attend the Board Audit Committee meetings while the Chief
Executive Officer and Finance Director attend by invitation. The Chairperson has direct access to the Group Internal Audit Manager.
The Audit Committee is responsible for monitoring the integrity of the financial statements and financial results together with reviewing the effectiveness of controls and risk management systems. It reviews the external and internal audit work plans, the external auditors fees together with the Management’s implementation of the recommendations from the auditors.
The Committee is required to meet at least four times a year, normally one day prior to the Board meetings and additional meetings may be called if deemed necessary. In the year under review, the Audit Committee met five times including one meeting with the auditors in the absence of Management.
Nomination and Corporate Governance Committee
In 2010, the Nomination & Corporate Governance Committee Charter was reviewed in light of the changing business environment and the need to strengthen the Committee. The committee comprises of three directors, two of whom are non-executive.
The NCG Committee evaluates the balance of the skills on the Board, recommends appointment of directors, reviews the performance of the Board and manages succession planning. It also reviews corporate governance policies taking into account the Company’s corporate governance objectives.
The committee is required to meet at least once a year while other meetings can be held when need arises.
Name of Directors 24 Feb 5 May 9 June 3 August 19 Nov
S. M’Mbijjewe √ √ √ √ √C. Kisire √ √ √ √ x
A. Kazongo √ √ x x x
D. Brugier √ √ x x √Auditors
S. Kibirige √ √ √ √ √Deloitte & Touche √ √ n/a n/a √

22
2010 | BAMBURI CEMENT LIMITED - ANNUAL REPORT
Corporate Governance
Executive Committee
The Executive Committee (ExCom) comprises of the Chief Executive Officer, General Manager – Hima, Finance Director, Human Resources & Organization Director, Industrial Director, Marketing Director, Projects Director – Kenya, Sales Director and Supply Chain Director.
The day to day management of the Company is delegated to the ExCom, which is chaired by the Chief Executive Officer. It creates the framework of strategy, organization and objectives to ensure the successful delivery of results.
The ExCom is required to meet at least twice a month while additional meetings may be scheduled where necessary. In 2010, the ExCom had twelve full day and ten half day meetings
CONTROL ENVIRONMENT
ASSESSMENT
Risk Management
Accepting that risk is an inherent part of doing business, the Group has designed risk management systems to identify, evaluate and monitor key risks while providing assurance that these are fully understood and managed.
Identified risks and risk management are subject to regular review to ensure compliance with internal controls and
legislation. The risk management system is designed to provide reasonable but not absolute assurance that risks are appropriately identified, evaluated and managed.
Internal Controls
The Board has overall responsibility for the systems of internal control which are fully embedded into the operations of the Company. Certain responsibilities, such as review of the effectiveness of the internal control system and ensuring any required remedial action has been taken on identified weaknesses, are delegated to the Audit Committee.
Internal controls comprise of methods and procedures adopted by Management to provide reasonable assurance in safeguarding assets, prevention and detection of error, accuracy and completeness of accounting records together with reliability of financial statements.
During the year, the Company reviewed all the business cycles and the final versions were approved. The benefits from the process were seen during the year but will have better impact in the coming year.
CODE OF CONDUCT
All employees are required to maintain the highest ethical standards in ensuring the Company’s business practises are
conducted in a manner which, in all reasonable circumstances, is above reproach. To this end, the Group has a Code of Business Conduct to which all employees must adhere, with regular training and education, including e-learning, undertaken to ensure compliance.
The Group has developed a procedure that specifies the manner in which any potential violations of the Code of Business Conduct should be handled together with the method and level of investigation. The procedure also establishes a whistle blowing hotline that is independently operated to enable employees make confidential disclosures of suspected breaches.
The Code of Business Conduct is enforced with appropriate discipline in consistent basis and action taken to prevent recurrence of breach.
COMMUNICATION
The Group is committed to maintaining open and good communication with investors through the Annual General Meeting, annual report, press releases and the corporate website www.bamburicement.com. During the AGM, shareholders have the opportunity to meet and question the Board. The Group continues to promote dialogue with other stakeholders and media.
A manyatta at Haller Park- Mombasa.

23
2010 | BAMBURI CEMENT LIMITED - ANNUAL REPORT
Mandela National Stadium Namboole - Kampala

24
2010 | BAMBURI CEMENT LIMITED - ANNUAL REPORT
Lafarge Cement division Co-President Guillame Roux hands over Excellence Certificate to Nairobi Grinding Plant management team.
Corporate Social Responsibility
As a strong testimony to our concerted efforts towards achieving “world class” Health and Safety standards, Bamburi Cement was officially inducted into the prestigious Lafarge Health and Safety Excellence Club for having fulfilled strict performance indicators and excelling in the maturity audits carried out throughout its operations in Kenya. Only two other Lafarge business units in Africa are members of this club and the induction confirms the Groups resilience in this area despite operating in a very challenging environment.
In 2010, we achieved a fatality free year for our operations in both Kenya and Uganda. This outstanding achievement was realised against a background of increased activities within our industrial sites following the commissioning of a new line in Uganda and the expansion project of our ready mix concrete and blocks unit in Kenya. We had more activity on the roads due to increased
volumes of cement transfers especially in Uganda while the situation in Kenya was made much more difficult by an increased national road carnage rate.
Road SafetyWe achieved a zero major accident record despite a very challenging year for the group in the area of road transport. The group developed two new advisories on logistics safety and people road transport. We succeeded in the implementation of a comprehensive 14 element road safety program in Kenya and this was used as a basis for formulation of these new safety requirements by the group. Due to our success in this area, we also got the opportunity to host 29 Lafarge Business units from Africa and Middle East who visited Kenya for purposes of benchmarking on road safety best case practice.
Road Safety management system
We identified three pillars, namely the Owner, the Driver and the Truck underpinned by visible management commitment, as part of a conceptual framework for management of road safety. This was consolidated into an operational document in the form of a road safety manual. As part of our focus on management practices amongst our contracted transporters, we introduced
the Mchukuzi Awards in June 2010. Within this program, we are seeking to professionalise the way our transporters operate.
This will enable us to move to the next level where the transporters take full charge of road safety. We focused on increasing our level of communication with our drivers by rolling out mandatory weekly toolbox talks with drivers in all our sites. This has culminated with an initiative known as ‘Know your driver campaign’ started in December 2010. We have reviewed the driver training program to incorporate collision avoidance as a key segment of the 2- day program. This was in response to the increased cases of near-misses reported by our drivers where third party drivers are to blame.
Route Hazard Mapping
We continued to proactively look out for potential accident hot spots in all major routes used by our drivers. This route hazard mapping was integrated to our electronic vehicle tracking systems using global positions system (GPS) through geo-fencing. We now require our drivers to observe lower speeds and avoid overtaking in areas marked out as black spots. This is monitored in real time basis daily from a central control centre located in the Athiriver grinding plant.
SAFETY PERFORMANCE
“Proud Member of the Lafarge Health and Safety Excellence Club”

25
2010 | BAMBURI CEMENT LIMITED - ANNUAL REPORT
Corporate Social Responsibility
Partnerships and collaboration
We have continued to reach out to other stakeholders in road transport safety. Our focus is to increase the network of key players who are aligned to our vision of zero accidents on our roads. Towards this end we launched our annual road safety campaigns and road shows in Kenya and Uganda in December under a shared theme ‘Waza Usalama’. We partnered with our transporters and were supported by other stakeholders such as Total Kenya limited, the World Bank, the Traffic Police department, the Ministry of Transport, the National Road Safety Council, the Provincial Administration as well as Municipalities in areas where we operate. The media also supported our cause in 2010 by featuring some of our initiatives and sharing the message with the rest of the country.
Industrial Health & SafetyIn 2010, we consolidated our success in managing safety through increasing the level of management and shop floor employee involvement in promotion of a safe working environment.
A number of initiatives stood out:
Visible Felt Leadership
Demonstrating management commitment to safety remained a key pillar of our safety philosophy. Towards this end we embarked on Visible Felt Leadership (VFL) program within which the top 75 managers of the business engaged staff informally at their places of work. 743 VFL reports were submitted. The program has served to influence employee behaviour and provide an opportunity of senior management to be more in touch with operational challenges that employees face.
Implementation of Group Standards and Advisories
The Groups Standards on Health was a key focus for 2010. These standards amongst other elements improved our Medical Emergency response capacity. We now have ambulances in all plant sites and have had clear partnerships with local medical facilities around our plants for purposes of quick management of casualties in the event of an accident. First responder training targeting all employees was started with the intention of enabling every person on site to respond in case of a medical emergency. We began a detailed review of the health
status of our employees through a health assessment program. This has enabled us to address potential health issues.
Improvement on Emergency infrastructure
We revamped our fire protection system in our plants thereby increasing our ability to fight fire emergencies. Above this all the sites have well trained fire marshals.
Finally, we realise, with pride, that we have come closer to our zero accidents, zero occupational illnesses target and we look forward to achieve our ambition of being amongst the world safest businesses in 2011.
COMMUNITY DEVELOPMENT
KENYA
InfrastructureIn line with our business objective of being a key contributor to the development of infrastructure in the region, several projects to this effect continued to be implemented. The Cement for Schools Program in its second year running saw more than 14,000 bags delivered to approximately 80 schools across
Gongoni Primary School pupils after receiving a cheque from Bamburi Cement for restocking their Library.

26
2010 | BAMBURI CEMENT LIMITED - ANNUAL REPORT
Kenya towards renovation projects, in liaison with the Ministry of Education (School Infrastructure Programme). The company worked closely with schools’ administration to ensure that the cement was used for the right purpose. The project is expected to be completed in 2011. Approximately Shs 8 million was also spent in the Coast Province towards the construction of additional classrooms in Kazandani Primary School, Sinking of community boreholes and wells in Shanzu and Vipingo, water-tanks in Denyenye and Lawakera. Local Administration offices in Kisauni and Ngombeni also benefited from renovations and furniture donations.The company also made significant equipment donations to the Coast General Renal and Cancer Clinics as our focus on Health changed to investing in sustainable programs.
Environment
A Tribute to the Green Schools Program
2010 marked the completion of one of our most significant community environmental projects, whose main goal was to expose children to environmental conservation and provide access to water for the children. “The Green Schools Program”. The project has been running for the past 7 years at a total cost of Shs 49 million. 134 schools across Kenya have benefited in this program and were at the end of 2010 presented with certificates of participation. To date the program has ensured the planting of 558,000 trees in schools and donation of 156 water tanks. More than 59,000 school children participated in this program.
Baobab Trust
A tribute to a life long partnership
The Boabab Trust is a non-profit organization established in Mombasa to particularly work closely with the local communities through education, farm trainings and other community initiatives. Dr. Rene Haller founded this organization in 1991 and has used his knowledge in developing sustainable eco-systems, most notably his contribution to the restoration of a limestone quarry into the famous Haller Park.
Bamburi Cement has been a continuing partner to the trust on various projects namely;
i) Sustainable Agriculture - Farmer Field Training
The objective of the farm training program is to educate the community, local grass root farmers and the surrounding stakeholder’s with skills in small scale farming using simple alternative demonstration methods for the challenging environmental conditions.
In 2010, we provided intensive training to over 500 community members, organisations and government ministries. The Mtopanga Training and Demonstration Farm is the center that facilitates this education with focus on organic farming, integrated fish farming, livestock and poultry keeping. On September 16th 2010, we had the annual Farmer’s Field Day which provided an avenue for farmers and our technicians to exchange ideas and experiences on the various aspects of sustainable farming.
We supported 8,700 community members by establishing community outreach stations in Mdengerekeni, Kimbunga, Mitedi and Vikwatani to gauge the effectiveness of these training programs and the success is quite evident. The local communities are still using our best practice methods in land and forest restoration; inter cropping methods, establishing water catchment sections and soil erosion control through terracing but to name a few.
ii) Nguuni Health Center
In 2010, the health service program managed to help 7,400 people from the local communities including diagnosing and treatment of around 9,700 diseases. Having most of the communities living below the poverty line, the trust operates a medical outreach service aimed at helping vulnerable and isolated people who are unable to travel to the main clinic for medical assistance. The community also benefits from the various workshops and health campaigns usually carried out by the trust to engage and communicate messages on the important topics affecting them.
iii) Nguuni Nature Sanctuary and Educational Center
The trust’s approach to wildlife conservation has been to demonstrate it
as a sustainable resource. This has been done by ensuring all wildlife and floras are maintained with the introduction of a variety of animals and plant species into the rehabilitated land, building a self-sustaining eco-system. The sanctuary is home to a big number of ostriches, elands, oryx, water bucks, giraffes and camels.
The sanctuary also opened an Education Center in October 2006 as the first free children’s library in Kenya. It enhances students’ learning and a reading culture with environmental education during the occasional individual and school tours.
iv) Sea Turtle Conservation
As one of the first projects initiated by the trust, the sea turtle program has progressed into its 21st year of existence in the protection and raise of awareness for these endangered species. The trust recorded a 3% hatching growth of 144 hatched nests from last year (2009: 109 nests) that were reported along the managed beaches.
The Bamburi Hatchery still remains as the haven where unsecured nesting sites are brought in for incubation and later on released into the ocean after the hatching process. The Trusts close link with the local fishermen over the years has also contributed to the success of this project as we rely on their report on any sea turtle nesting sites and mortalities discovered along the beaches.
Marine Turtles help in managing some species of sea weed and soft coral that might excessively grow causing species of reef animals or plants to die off. They are economically important to humans and are linked to coastal communities in developing countries as a source of food.
UGANDA
Health & Sanitation
Hima Cement Limited officially handed over Kyabenda Health Center constructed in partnership with the Kyabenda- Kamwenge community. It serves as a catchment area of over 20km and is facilitated with a general ward, maternity ward, consultation rooms, a store, a VIP latrine and a solar system which provides lighting for the health center.
Corporate Social Responsibility

27
2010 | BAMBURI CEMENT LIMITED - ANNUAL REPORT
Corporate Social ResponsibilityA Tribute to Baobab Trust
Sustainable Farming
Nguuni Nature Sanctuary and Education Center
Nguuni Health Center
Sea Turtle Conservation

28
2010 | BAMBURI CEMENT LIMITED - ANNUAL REPORT
In addition, a 5-stance VIP latrines were constructed in Kabirizi Primary School and Kanara Secondary School both along Kamwenge- Dura road; Kyanya Primary School, Merryland Secondary School, Kiruli SDA Primary School and Kabatunda Primary School all in Kasese district. Rwesande Health Centre in Kasese was also provided with a 5-stance VIP latrine in September 2010 as part of support to community sanitation. In partnership with SNV Netherlands Development Organisation Uganda, an ecological sanitation toilet was constructed at Kanara Primary school as a pilot project of environment friendly latrines.
Under the Green schools project, 5 schools were supplied with concrete water tanks of 10,000 litre capacity. The schools are; Rugonjo Muslim Primary School, Kanara Primary School, Busabura Primary School in Kamwenge; and at Karusandara Seed Secondary School and Muzahura Primary School in Kasese.
EducationHima Cement in partnership with Monitor Publications Limited launched a programme dabbed “Newspapers in Education”. The objective of the programme was to improve literacy in primary schools that we were already supporting through the Green Schools
project. Ten schools in Kamwenge and six schools in Kasese were selected for the program and each receive the monitor newspaper weekly with a child friendly pull out.
In addition, two classrooms were constructed at Kanara Secondary School along Kamwenge - Dura road. As a result of this upgrading of the school infrastructure, the school was awarded a certificate by Ugandan National Examinations Board, authorising the school to conduct national examinations. The school was also provided with 72 three-seater desks.
Several projects were also handed over to community in 2010. In Rugonjo Muslim Primary School - Kamwenge, Hima Cement constructed 4 new classrooms, a 5-stance latrine and provided 74 three-seater desks and teachers’ furniture and planted 4,000 trees.
Another major project that was handed over was Katahooka Primary School in Ntungamo district. The project included; construction of a 4-classroom block, furnishing of the four classrooms with 72 three-seater desks, and construction of a 10,000 litre capacity water tank and a 5-stance VIP latrine. 5,000 trees were also planted in this school.
STAKEHOLDER ENGAGEMENT
KENYA
During the year, a total of 26 meetings were held with local community leaders and representatives in Athi River, Kisauni, Vipingo and Diani. This was evidence that the stakeholder cycle implemented in 2009 has been internalized and has created a structured approach to engaging with our neighbours.
Key areas of concern for the company in 2010 were issues to do with trespassing, illegal mining, security and reckless driving of “matatus” along the Felix Mandl road. The communities expressed their interest of our increased involvement in promoting education as well as health and safety promotion.
The company responded to these concerns by setting aside Shs 1,000,000 annually towards the Kisauni CDF Bursary fund and prioritising infrastructure development in schools by constructing more than ten classrooms, as well as engaging the community on road safety and health awareness. In 2011/2012 the company has plans to make investments toward the upgrade of plant equipment with a view to installing state of the art environmentally friendly technology.
Corporate Social Responsibility
Hima public primary school readers club read Monitor newspapers before a debate.

29
2010 | BAMBURI CEMENT LIMITED - ANNUAL REPORT
Corporate Social Responsibility
UGANDA
Key leaders from Ngoma and Kanara trading centres, the nearest trading centres to the Dura quarry met on 15th April 2010 to update the leaders on our operations in Dura. The Deputy Resident District Commissioner, Mr. Elijah Biryabarema chaired the meetings on behalf of the community leaders who were about 200 in attendance. The local leaders were actively involved in the discussions in which several issues were addressed.
Further on 28th April 2010, the Group MD, Mr. Hussein Mansi met with area
MPs for Kitagwenda and Busongora North together with other top leaders from Kamwenge and Kasese. The meeting focused on understanding the concerns of the community regarding our operations.
Another meeting was held with the business community of Hima Town Council to sensitize them on best practices and requirements of running a successful business. The ultimate goal was to develop a professional business community that can supply some of the products and services required at the plant. It was also an opportunity to build relationships with the business
community of Kasese.
Hima Cement Plant also conducted a successful stakeholder week from 16th - 19th August 2010 giving an opportunity to stakeholders to engage directly with us and understand our operations.
The activities of the week included;• Plant tour by employees’ dependants• Plant tour by Hima community
members.• Road shows in Kasese Town and
Hima Town.• Fun-fare activities at Hima play
ground.
Awards and Recognitions in 2010
Kenya1. Financial Reporting (FiRe) Awards: Overall Winner - Industrial, Commercial and
Services Overall Winner - International Financial
Reporting Standards (IFRS) 1st Runners Up - Listed Entities 1st Runners Up - Corporate Social Investment
2. Best Environmental Compliant Firm (Cement Sector) - Award from the National Environmental Management Authority.
3. Gold Award - Comprehensive Workplace Programs Partnership Award - USAID (United States Agency for International Development)
4. Certificate of Recognition - Promotion of Socio - Economic Development - Kilifi County Council.
Uganda1. Gold Award - Overall Investor of the year- HIMA
Cement.
2. Diamond Awards - Annual Presidential Export Award.
3. Sponsorship Award - Daily Monitor Newspaper for the Literacy in Education
Hima Cement receiving overall Investor of the Year Award 2010
Bamburi Cement staff after scooping four FiRe Awards 2010

30
2010 | BAMBURI CEMENT LIMITED - ANNUAL REPORT
Notice of AGM
NOTICE OF ANNUAL GENERAL MEETING
NOTICE IS HEREBY GIVEN that the 60th Annual General Meeting of the Shareholders of Bamburi Cement Limited will be held in Mombasa at the Nyali International Beach Hotel on Thursday 9 June 2011 at 2.00 pm. for the following purposes:
1. To table the proxies and to note the presence of a quorum.
2. To read the notice convening the meeting.
3. To receive the Chairman’s statement, the Report of the Directors and the Audited Accounts for the year ended 31 December 2010.
4. To declare dividends: a) To ratify the payment of the interim dividend of Shs 1.50/= per ordinary share paid on 31 October 2010; b) To declare a final dividend payment of Shs 7.00/= per ordinary share for the year ended 31 December 2010.
5. To approve Directors’ fees for 2010 and increase Directors’ fees in 2011.
6. To re-elect directors: a) In accordance with Article 96 of the Company’s Articles of Association R. Kemoli retires by rotation and being eligible, offers
himself for re-election; b) In accordance with Article 96 of the Company’s Articles of Association S. Karanja retires by rotation and being eligible, offers
himself for re-election; c) In accordance with Article 96 of the Company’s Articles of Association J. Oigara retires by rotation and being eligible, offers
himself for re-election.
7. To note that Deloitte and Touche continue in office as Auditors in accordance with Section 159 (2) of the Companies Act and to authorize the Directors to fix their remuneration for 2011.
SPECIAL BUSINESS8. To consider and, if thought fit, pass the following resolution as a special resolution: a) that the Articles of Association be amended as per the attached proposals; b) that the Articles of Association be reprinted and signed by the Chairman for purposes of identification; c) that the signed Articles of Association be adopted as the new Articles of Association of the Company in substitution for and
to the exclusion of the existing Articles of Association.
9. To transact any other business of the Company of which due notice has been received.
By order of the Board
B KanyagiaSECRETARY27 April 2011
A member entitled to attend and vote at the above meeting is entitled to appoint a proxy, who need not be a member of the Company, to attend and vote in his stead. Proxy forms must be lodged at the registered office of the Company, P.O. Box 10921, 00100 Nairobi not less than 48 hours before the time of the meeting. A proxy form is provided with this report.

31
2010 | BAMBURI CEMENT LIMITED - ANNUAL REPORT
PAGES
33 Report of the Directors
34 Statement of Directors’ responsibilities
35 Independent Auditors’ report
36 Consolidated statement of comprehensive income
37 Consolidated statement of fi nancial position
38 Company statement of fi nancial position
39 Consolidated statement of changes in equity
41 Company statement of changes in equity
42 Consolidated statement of cash fl ows
43 Notes to the fi nancial statements
Table of Contents
FINANCIAL STATEMENTSFOR THE YEAR ENDED 31 DECEMBER 2010
Housekeeping at Bamburi Cement Nairobi Grinding Plant

32
2010 | BAMBURI CEMENT LIMITED - ANNUAL REPORT
Hima Cement New Production Line - Uganda

33
2010 | BAMBURI CEMENT LIMITED - ANNUAL REPORT
Financial StatementsFor the year ended 31 December 2010
REPORT OF THE DIRECTORS
The Directors have the pleasure of presenting their report together with the audited financial statements for the year ended 31 December 2010.
PRINCIPAL ACTIVITIES
The Group is primarily engaged in the manufacture and sale of cement and cement related products. The Group also owns and manages a world class nature and environmental park developed from rehabilitated quarries.
RESULTS Shs’million
Group profit before taxation 7,564Taxation charge (2,265)
Group profit for the year 5,299
Attributable to:Owners of the parent company 5,089Non-controlling interests 210
5,299
DIVIDENDS
During the year, an interim dividend amounting to Shs 544 million (2009 – Shs 544 million) which amounts to Shs 1.50 per share (2009 – Shs 1.50 per share) was paid. The Directors recommend that a final dividend of Shs 7.00 (2009 – Shs 5.50) per share equivalent to a total sum of Shs 2,541 million (2009 – Shs 1,997 million) be paid to owners of the Company. The final dividend is subject to approval by the owners of the Company at the next Annual General Meeting.
DIRECTORS
The present Board of Directors is shown on pages 7 and 8.
AUDITORS
Deloitte & Touche, have expressed their willingness, to continue in office in accordance with Section 159 (2) of the Kenyan Companies Act.
BY ORDER OF THE BOARD
B. KanyagiaSecretaryNairobi25 February 2011

34
2010 | BAMBURI CEMENT LIMITED - ANNUAL REPORT
Financial StatementsFor the year ended 31 December 2010
STATEMENT OF DIRECTORS’ RESPONSIBILITIES
The Kenyan Companies Act requires the Directors to prepare financial statements for each financial year which give a true and fair view of the state of affairs of the Group and of the company as at the end of the financial year and of the operating results of the Group for that year. It also requires the Directors to ensure that the parent company and its subsidiaries keep proper accounting records, which disclose with reasonable accuracy at any time the financial position of the Group and of the parent company. They are also responsible for safeguarding the assets of the Group.
The Directors are responsible for the preparation and fair presentation of these financial statements in accordance with International Financial Reporting Standards and the requirements of the Kenyan Companies Act and for such controls as the directors determine are necessary to enable the preparation of financial statements that are free from material misstatements, whether due to fraud or error.
The Directors accept responsibility for the annual financial statements, which have been prepared using appropriate accounting policies supported by reasonable and prudent judgments and estimates, in conformity with International Financial Reporting Standards and in the manner required by the Kenyan Companies Act. The Directors are of the opinion that the financial statements give a true and fair view of the state of the financial affairs of the Group and of the company and of the Group’s operating results. The Directors further accept responsibility for the maintenance of accounting records which may be relied upon in the preparation of financial statements, as well as adequate systems of internal financial control.
Nothing has come to the attention of the Directors to indicate that the company and its subsidiaries will not remain going concerns for at least the next twelve months from the date of this statement.
Joshua Oigara Hussein MansiDirector Director25 February 2011 25 February 2011

35
2010 | BAMBURI CEMENT LIMITED - ANNUAL REPORT
Financial StatementsFor the year ended 31 December 2010
INDEPENDENT AUDITORS’ REPORT TO THE MEMBERS OF BAMBURI CEMENT LIMITED
Report on the Financial Statements
We have audited the accompanying financial statements of Bamburi Cement Limited and its subsidiaries, set out on pages 36 to 84, which comprise the consolidated and company statements of financial position as at 31 December 2010, and the consolidated statement of comprehensive income, consolidated and company statements of changes in equity and consolidated statement of cash flows for the year then ended, and a summary of significant accounting policies and other explanatory notes.
Directors’ Responsibility for the Financial Statements
The Directors are responsible for the preparation and fair presentation of these financial statements in accordance with International Financial Reporting Standards and the requirements of the Kenyan Companies Act, and for such controls as the directors determine are necessary to enable the preparation of financial statements that are free from material misstatements, whether due to fraud or error.
Auditors’ Responsibility
Our responsibility is to express an opinion on these financial statements based on our audit. We conducted our audit in accordance with International Standards on Auditing. Those standards require that we comply with ethical
requirements and plan and perform the audit to obtain reasonable assurance as to whether the financial statements are free from material misstatement.
An audit involves performing procedures to obtain audit evidence about the amounts and disclosures in the financial statements. The procedures selected depend on our judgment, including the assessment of the risks of material misstatement of the financial statements, whether due to fraud or error. In making those risk assessments, we considered the internal controls relevant to the entity’s preparation and fair presentation of the financial statements in order to design audit procedures that were appropriate in the circumstances, but not for the purpose of expressing an opinion on the entity’s internal controls. An audit also includes evaluating the appropriateness of accounting policies used and the reasonableness of accounting estimates made by the Directors, as well as evaluating the overall presentation of the financial statements.
We believe that the audit evidence we have obtained is sufficient and appropriate to provide a basis for our audit opinion.
Opinion
In our opinion, the accompanying financial statements give a true and fair view of the state of financial affairs of
the company and its subsidiaries as at 31 December 2010 and of its profit and cash flows for the year then ended in accordance with International Financial Reporting Standards and the Kenyan Companies Act.
Report on Other Legal Requirements
As required by the Kenyan Companies Act we report to you, based on our audit, that:
i) we have obtained all the information and explanations which to the best of our knowledge and belief were necessary for the purposes of our audit;
ii) in our opinion, proper books of account have been kept by the company, so far as appears from our examination of those books; and
ii) the company’s statement of financial position is in agreement with the books of account.
Certified Public Accountants (Kenya)25 February 2011Nairobi

36
2010 | BAMBURI CEMENT LIMITED - ANNUAL REPORT
Financial StatementsFor the year ended 31 December 2010
CONSOLIDATED STATEMENT OF COMPREHENSIVE INCOMEFor the year ended 31 December 2010
2010 2009 Notes Shs’million Shs’million
Revenue 28,075 29,994Direct Costs 4 (18,457) (19,179)
Gross Profit 9,618 10,815
Investment income 5 143 103Other gains and losses 6 230 1,775Distribution costs (467) (846)Marketing expenses (173) (89)Administration expenses 7 (1,064) (1,422)Other expenses 8 (632) (726)Finance costs 9 (91) (14)
Profit before taxation 7,564 9,596Taxation charge 11 (2,265) (2,626)
Profit for the year 12 5,299 6,970
OTHER COMPREHENSIVE INCOME
Exchange differences on translation of foreign operations (654) 67Net gain on revaluation of available for sale financial assets 20(b) 5 60Cumulative gain reclassified from equity on disposal of available for sale investments 20(c) - (1,197)
Gain on hedging instruments entered into for cash flow hedges 28 -
OTHER COMPREHENSIVE INCOME FOR THE YEAR NET OF TAX (621) (1,070)
TOTAL COMPREHENSIVE INCOME FOR THE YEAR 4,678 5,900
Profit attributable to:Owners of the Company 5,089 6,649Non-controlling interests 210 321
5,299 6,970
Total comprehensive income attributable to:Owners of the Company 4,662 5,562Non-controlling interests 16 338
4,678 5,900
Earnings per share – basic and diluted 13 Shs 14.02 Shs 18.32
Dividends per share 14(c) Shs 8.50 Shs 11.00

37
2010 | BAMBURI CEMENT LIMITED - ANNUAL REPORT
CONSOLIDATED STATEMENT OF FINANCIAL POSITIONAt 31 December 2010
2010 2009 Notes Shs’million Shs’million
ASSETSNon current assetsProperty, plant and equipment 15(a) 17,833 11,847Prepaid operating lease rentals 16 187 9Intangible assets 17 76 101Capital work in progress 18 1,219 6,259Other equity investments 20 911 906Goodwill 21 217 217 20,443 19,339
Current assetsCorporate tax recoverable 11(c) 10 9Inventories 22 3,523 4,338Trade and other receivables 23(a) 1,686 1,999Cash flow hedge contracts 24 28 -Bank and cash balances 25(a) 7,616 6,427
12,863 12,773
TOTAL ASSETS 33,306 32,112
EQUITY AND LIABILITIESCapital and reservesShare capital 26 1,815 1,815Revaluation surplus 27(a) 2,063 2,249Fair value reserve 27(b) 708 703Translation reserve 27(c) (377) 56Cash flow hedging reserve 27(d) 25 -Retained earnings 15,931 14,674
Equity attributable to owners of the company 20,165 19,497Non-controlling interests 1,461 1,444
Total equity 21,626 20,941
Non-current liabilitiesDeferred tax liability 28 2,620 2,445Provision for liabilities and charges 29 529 581Loan from ultimate holding company 31(a) - 2,962Term loan 31(b) 1,067 239 4,216 6,227
Current liabilitiesCorporate tax payable 11(c) 72 356Unclaimed dividends 14(a) 30 30Provision for liabilities and charges 29 261 202Trade and other payables 30 5,215 3,986Loan from ultimate holding company 31(a) - 370Term Loan 31(b) 1,886 - 7,464 4,944
33,306 32,112
The financial statements on pages 36 to 84 were approved by the board of Directors on 25 February 2011 and were signed on its behalf by:
Joshua Oigara Hussein MansiDirector Director
Financial StatementsFor the year ended 31 December 2010

38
2010 | BAMBURI CEMENT LIMITED - ANNUAL REPORT
Financial StatementsFor the year ended 31 December 2010
COMPANY STATEMENT OF FINANCIAL POSITIONAt 31 December 2010
2010 2009 Notes Shs’million Shs’million
ASSETSNon current assetsProperty, plant and equipment 15(b) 8,128 8,400Prepaid operating lease rentals 16 1 1Intangible assets 17 72 100Capital work in progress 18 810 556Investments in subsidiaries 19 968 968Other equity investments 20 (b) 911 906Loan to subsidiary 35 (iii) 257 - 11,147 10,931
Current assetsInventories 22 2,341 3,409Loan to subsidiary 35 (iii) 29 -Trade and other receivables 23(a) 2,180 2,203Cash flow hedge contracts 24 19 -Bank and cash balances 25 7,215 5,865
11,784 11,477
TOTAL ASSETS 22,931 22,408
EQUITY AND RESERVESCapital and reservesShare capital 26 1,815 1,815Revaluation surplus 27(a) 1,942 2,126Fair value reserve 27(b) 708 703Cash flow hedging reserve 27(d) 19 -Retained earnings 12,837 12,094
Shareholders’ funds 17,321 16,738
Non-current liabilitiesDeferred tax liability 28 1,707 1,762Provision for liabilities and charges 29 513 500 2,220 2,262
Current liabilitiesCorporate tax payable 11(c) 72 328Unclaimed dividends 14(a) 30 30Provision for liabilities and charges 29 147 149Trade and other payables 30 3,141 2,901 3,390 3,408
22,931 22,408
The financial statements on pages 36 to 84 were approved by the board of Directors on 25 February 2011 and were signed on its behalf by:
Joshua Oigara Hussein MansiDirector Director

39
2010 | BAMBURI CEMENT LIMITED - ANNUAL REPORT
CONSO
LIDAT
ED S
TATE
MEN
T OF
CHAN
GES
IN E
QUIT
YFo
r th
e ye
ar e
nded
31
Dec
embe
r 20
10
At
trib
utab
le
Ca
sh fl
ow
to e
quity
Non
-
Shar
e Re
valu
atio
n Fa
ir v
alue
he
dge
Tran
slat
ion
Reta
ined
ho
lder
s of
co
ntro
lling
capi
tal
surp
lus
rese
rve
re
serv
e re
serv
e ea
rnin
gs
pare
nt
inte
rest
s To
tal
Sh
s’m
illio
n Sh
s’m
illio
n Sh
s’m
illio
n
Shs’m
illio
n Sh
s’m
illio
n Sh
s’m
illio
n Sh
s’m
illio
n Sh
s’m
illio
n Sh
s’m
illio
n
At 1
Jan
uary
200
9 1,
815
2,44
5 1,
840
- 19
9,
377
15,4
96
1,10
6 16
,602
Profi
t fo
r th
e ye
ar
- -
- -
- 6,
649
6,64
9 32
1 6,
970
Oth
er c
ompr
ehen
sive
inc
ome
for
the
year
Ex
chan
ge d
iffer
ence
s on
tra
nsla
tion
of fo
reig
n op
erat
ions
-
5 -
- 37
8
50
17
67Net
gai
n on
ava
ilabl
e fo
r sa
le inv
estm
ents
-
- 60
-
- -
60
- 60
Cum
ulat
ive
gain
rec
lass
ified
fro
m e
quity
on
disp
osal
of av
aila
ble
for sa
le inv
estm
ents
-
- (1
,197
) -
- -
(1,1
97)
- (1
,197
)
Tota
l co
mpr
ehen
sive
inc
ome
for
the
year
-
5 (1
,137
) -
37
6,65
7 5,
562
338
5,90
0
Tran
sfer
of ex
cess
dep
reci
atio
n -
(287
) -
_ -
287
- -
-Def
erre
d ta
x on
exc
ess
depr
ecia
tion
-
86
- _
- (8
6)
- -
-Div
iden
ds:
- fin
al d
ivid
ends
for
200
8 de
clar
ed a
nd p
aid
- -
- _
- (1
,017
) (1
,017
) -
(1,0
17)
- in
terim
for
200
9 de
clar
ed a
nd p
aid
- -
- _
- (5
44)
(544
) -
(544
)
At 3
1 Dec
embe
r 20
09
1,81
5 2,
249
703
- 56
14
,674
19
,497
1,
444
20,9
41
At 1
Jan
uary
201
0 1,
815
2,24
9 70
3 -
56
14,6
74
19,4
97
1,44
4 20
,941
Profi
t fo
r th
e ye
ar
- -
- -
- 5,
089
5,08
9 21
0 5,
299
Oth
er c
ompr
ehen
sive
inc
ome
for
the
year
Ex
chan
ge d
iffer
ence
s on
tra
nsla
tion
of fo
reig
n op
erat
ions
-
16
- -
(433
) (4
1)
(45
8)
(196
) (65
4)Net
los
s on
ava
ilabl
e fo
r sa
le inv
estm
ents
-
- 5
- -
- 5
- 5
Gai
n on
hed
ging
ins
trum
ents
ent
ered
int
o fo
r ca
shflo
w h
edge
s -
- -
25
- -
25
3 28
Tota
l co
mpr
ehen
sive
inc
ome
for
the
year
-
16
5 25
(4
33)
5,04
8 4,
661
17
4,67
8
Tran
sfer
of ex
cess
dep
reci
atio
n -
(284
) -
- -
284
- -
-Def
erre
d ta
x on
exc
ess
depr
ecia
tion
-
85
- -
- (8
5)
- -
-Re
valu
atio
n re
serv
e re
alis
ed o
n di
spos
al o
f pr
oper
ty
- (4
) -
- -
4 -
- -
Def
erre
d ta
x on
rev
alua
tion
rea
lised
on
disp
osal
of pr
oper
ty
- 1
- -
- (1
) -
- -
Div
iden
ds:
- fin
al d
ivid
ends
for
200
9 de
clar
ed a
nd p
aid
- -
- -
- (1
,997
) (1
,997
) -
(1,9
97)
- in
terim
div
iden
ds for
201
0 de
clar
ed a
nd p
aid
- -
- -
- (5
44)
(544
) -
(544
)
- sp
ecia
l in
terim
div
iden
ds d
ecla
red
and
paid
-
- -
- -
(1,4
52)
(1,4
52)
- (1
,452
)
At 3
1 Dec
embe
r 20
10
1,81
5 2,
063
708
25
(377
) 15
,931
20
,165
1,
461
21,6
26

40
2010 | BAMBURI CEMENT LIMITED - ANNUAL REPORT
Financial StatementsFor the year ended 31 December 2010
CONSOLIDATED STATEMENT OF CHANGES IN EQUITYFor the year ended 31 December 2010 (Continued)
The reserve accounts included in the statement of changes in equity are explained below:
The revaluation surplus represents the net cumulative surplus arising from revaluations of property, plant and equipment - Note 27(a).
The fair value reserve represents the cumulative surplus or deficit arising from revaluation of available-for-sale investments from cost to fair value based on the market values of the equities at the end of the reporting period – Note 27(b).
Retained earnings represent accumulated profits retained by the Group after payment of dividends to the shareholders.
The translation reserve represents the cumulative position on translation gains and losses arising from conversion of a net assets of the foreign subsidiary company to the reporting currency – Note 27(c).
The cash flow hedging reserve represents the cumulative effective portion of gains or losses arising on changes of fair value of hedging instruments entered into for cash flow hedges – Note 27(d).

41
2010 | BAMBURI CEMENT LIMITED - ANNUAL REPORT
Share Revaluation value Cash flow Retained Hedging capital surplus reserve reserve earnings Total Shs’million Shs’million Shs’million Shs’million Shs’million Shs’million
At 1 January 2009 1,815 2,309 1,840 - 7,586 13,550Profit for the year - - - - 5,886 5,886Other comprehensive income for the year Net gain on available for sale investments - - 60 - - 60Cumulative gain reclassified from equity on disposal of available for sale investments - - (1,197) - - (1,197)
Total comprehensive income for the year - - (1,137) - 5,886 4,749 Transfer of excess depreciation - (262) - - 262 -Deferred tax on excess depreciation - 79 - - (79) -Dividends: - final dividends for 2008 declared and paid - - - - (1,017) (1,017) - interim dividends for 2009 declared and paid - - - - (544) (544)
At 31 December 2009 1,815 2,126 703 - 12,094 16,738 At 1 January 2010 1,815 2,126 703 - 12,094 16,738
Profit for the year - - - - 4,552 4,552Other comprehensive income for the year Net loss on available for sale investments - - 5 - - 5Gain on hedging instruments entered into for cashflow hedges - - - 19 - 19
Total comprehensive income for the year - - 5 19 4,552 4,576 TTransfer of excess depreciation - (262) - - 262 -Deferred tax on excess depreciation - 78 - - (78) -Dividends: - - - - - - - final dividends for 2009 declared and paid - - - - (1,997) (1,997) - interim dividends for 2010 declared and paid - - - - (544) (544) - special interim divided declared and paid - - - - (1,452) (1,452)
At 31 December 2010 1,815 1,942 708 19 12,837 17,321
The reserve accounts included in the statement of changes in equity are explained below:
The revaluation surplus represents the net cumulative surplus arising from revaluations of property, plant and equipment – Note 27(a).
The fair value reserve represents the cumulative surplus or deficit arising from revaluation of available-for-sale investments from cost to fair value based on the market values of the equities at the end of the reporting period – Note 27(b).
The retained earnings represent accumulated profit retained by the company after payment of dividends to the shareholders.
The cash flow hedging reserve represents the cumulative effective portion of gains or losses arising on changes of fair value of hedging instruments entered into for cash flow hedges – Note 27(d).
Financial StatementsFor the year ended 31 December 2010
COMPANY STATEMENT OF CHANGES IN EQUITYFor the year ended 31 December 2010

42
2010 | BAMBURI CEMENT LIMITED - ANNUAL REPORT
Financial StatementsFor the year ended 31 December 2010
CONSOLIDATED STATEMENT OF CASH FLOWSFor the year ended 31 December 2010
2010 2009 Notes Shs’million Shs’million
CASH FLOWS FROM OPERATING ACTIVITIESCash generated from operations 34 10,949 10,623Interest received 5 128 85Interest paid 9 (91) (14)Taxation paid 11(c) (2,251) (1,732)
Net cash generated from operating activities 8,735 8,962
CASH FLOWS FROM INVESTING ACTIVITIES
Purchase of property, plant and equipment, intangible assets and expenditure on capital work in progress (3,429) (3,281)Proceeds from disposal of available for sale investments 20 (c) - 1,346Proceeds from disposals of property, plant and equipment 5 5Dividends received 5 15 18
Net cash used in investing activities (3,409) (1,912)
CASH FLOWS FROM FINANCING ACTIVITIES
Dividends paid to owners of the Company 14(b) (3,993) (1,561)Loans repaid 31(a) (3,034) (1,104)Term loan received 31(b) 2,872 239
Net cash (used in)/generated from financing activities (4,155) (2,426)
NET INCREASE IN CASH AND CASH EQUIVALENTS 1,171 4,624
MOVEMENT IN CASH AND CASH EQUIVALENTS
At beginning of the year 6,427 1,758Net increase in cash and cash equivalents above 1,171 4,624Effects of exchange rate changes on cash held in foreign currencies 18 45
At end of the year 25(b) 7,616 6,427

43
2010 | BAMBURI CEMENT LIMITED - ANNUAL REPORT
Financial StatementsFor the year ended 31 December 2010
Notes to the Financial Statements
(b) New and revised IFRSs and interpretations in issue but not yet effective
Effective for annual periods beginning on or after1 July 2010
1 July 2011
1 January 2011
1 January 20131 January 20121 January 2011
1 July 2010 and 1 January 20111 February 2010
1 July 2010
IFRS 1, First-time Adoption of International Financial Reporting Standards – limited exemption from comparative IFRS 7 disclosures for first-time adoptersIFRS 1, First-time Adoption of International Financial Reporting Standards – replacement of ‘fixed dates’ for certain exceptions with ‘the date of transition to IFRSs’; and additional exemption for entities ceasing to suffer from severe hyperinflation.IFRS 7, Financial Instruments: Disclosures – amendments enhancing disclosures about transfers of financial assetsIFRS 9, Financial Instruments – Classification and MeasurementIAS 12, Income Taxes – limited scope amendment (recovery of underlying assets)IAS 24, Related Party Disclosures – revised definition of related partiesNew and Amendments to standards
Various improvements resulting from May 2010 Annual Improvements to IFRSsIAS 32, Financial Instruments: Presentation – amendments relating to classification of rights issuesNew interpretationIFRIC 19, Extinguishing Financial Liabilities with Equity Instruments
1 ACCOUNTING POLICIES
Statement of compliance
The financial statements have been prepared in accordance with International Financial Reporting Standards.
For the Kenyan companies Act reporting purposes, in these financial statements the balance sheet is represented by/equivalent to the statement of financial position and the profit and loss account is presented in the statement of comprehensive income.
Adoption of new and revised International Financial Reporting Standards (IFRSs)
(a) Relevant new and revised IFRS affecting disclosures and presentation in the current year (and /or prior years)
The following new and revised IFRSs have been applied in the current period and have affected the amounts reported in these financial statements.
• Amendments to IAS 1 Presentation of Financial Statements (as part of Improvements to IFRSs issued in 2009)
• Amendments to IAS 7 Statement of Cash Flows (as part of Improvements to IFRSs issued in 2009)
Impact of the relevant new and revised standards and interpretations in issue
Amendments to IAS 1 Presentation of Financial Statements (as part of Improvements to IFRSs issued in 2009)
The amendments to IAS 1 clarify that the potential settlement of a liability by
the issue of equity is not relevant to its classification as current or noncurrent.
This amendment has had no effect on the amounts reported because the company has not previously issued instruments of this nature.
Amendments to IAS 7 Statement of Cash Flows (as part of Improvements to IFRSs issued in 2009)
The amendments to IAS 7 specify that only expenditures that result in a recognised asset in the statement of financial position can be classified as investing activities in the statement of cash flows. The Group will apply this amendment prospectively. The directors, however, anticipate no material impact to the Group’s financial statements.

44
2010 | BAMBURI CEMENT LIMITED - ANNUAL REPORT
Financial StatementsFor the year ended 31 December 2010
Notes to the Financial Statements
(c) Impact of the relevant new and revised IFRSs in issue but not yet effective
Amendments to IFRS 7 Financial Instruments: Disclosures (as part of Improvements to IFRSs issued in 2010)The amendments to IFRS 7 clarify the required level of disclosures about credit risk and collateral held and provide relief from disclosures previously required regarding renegotiated loans. The Group will apply this amendment prospectively. The directors, however, anticipate no material impact to the Group’s financial statements.
Amendments to IAS 1 Presentation of Financial Statements (as part of Improvements to IFRSs issued in 2010)The amendments to IAS 1 clarify that an entity may choose to present the required analysis of items of other comprehensive income either in the statement of changes in equity or in the notes to the financial statements The Group will apply this amendment prospectively. The directors, however, anticipate no material impact to the Group’s financial statements.
IFRS 9, Financial InstrumentsIFRS 9 Financial Instruments issued in November 2009 and amended in October 2010 introduces new requirements for the classification and measurement of financial assets and financial liabilities and for derecognition.
• IFRS 9 requires all recognised financial assets that are within the scope of IAS 39 Financial Instruments: Recognition and Measurement to be subsequently measured at amortised cost or fair value. Specifically, debt investments that are held within a business model whose objective is to collect the contractual cash flows, and that have contractual cash flows that are solely payments of principal and interest on the principal outstanding are generally measured at amortised
cost at the end of subsequent accounting periods. All other debt investments and equity investments are measured at their fair values at the end of subsequent accounting periods.
• The most significant effect of IFRS 9 regarding the classification and measurement of financial liabilities relates to the accounting for changes in fair value of a financial liability (designated as at fair value through profit or loss) attributable to changes in the credit risk of that liability. Specifically, under IFRS 9, for financial liabilities that are designated as at fair value through profit or loss, the amount of change in the fair value of the financial liability that is attributable to changes in the credit risk of that liability is recognised in other comprehensive income, unless the recognition of the effects of changes in the liability’s credit risk in other comprehensive income would create or enlarge an accounting mismatch in profit or loss. Changes in fair value attributable to a financial liability’s credit risk are not subsequently reclassified to profit or loss. Previously, under IAS 39, the entire amount of the change in the fair value of the financial liability designated as at fair value through profit or loss was recognised in profit or loss.
IFRS 9 is effective for annual periods beginning on or after 1 January 2013, with earlier application permitted.
The directors anticipate that IFRS 9 will be adopted in the Group’s consolidated financial statements for the annual period beginning 1 January 2013 and that the application of the new Standard will not have a significant impact on amounts reported in respect of the Groups’ financial assets and financial liabilities.
IFRS 7, Financial Instruments; DisclosuresTitled Disclosures – Transfers of Financial Assets increase the disclosure requirements for transactions involving transfers of financial assets. These amendments are intended to provide greater transparency around risk exposures when a financial asset is transferred but the transferor retains some level of continuing exposure in the asset. The amendments also require disclosures where transfers of financial assets are not evenly distributed throughout the period.
The directors do not anticipate that these amendments to IFRS 7 will have a significant effect on the Group’s disclosures regarding transfers of financial instruments previously effected, however, if the Group enters into other types of transfers of financial assets in the future, disclosures regarding those transfers may be affected.
IAS 24, Related Party Disclosures (as revised in 2009) The amendment modifies the definition of a related party and simplifies disclosures for government-related entities.
The disclosure exemptions introduced in IAS 24 (as revised in 2009) do not affect the Group because the Group is not a government-related entity. However, disclosures regarding related party transactions and balances in these financial statements may be affected when the revised version of the Standard is applied in future accounting periods because some counterparties that did not previously meet the definition of a related party may come within the scope of the Standard.

45
2010 | BAMBURI CEMENT LIMITED - ANNUAL REPORT
Financial StatementsFor the year ended 31 December 2010
Notes to the Financial Statements
IAS 32, Financial Instruments presentationTitled Classification of Rights Issues address the classification of certain rights issues denominated in a foreign currency as either an equity instrument or as a financial liability. To date, the Group has not entered into any arrangements that would fall within the scope of the amendments. However, if the Group does enter into any rights issues within the scope of the amendments in future accounting periods, the amendments to IAS 32 will have an impact on the classification of those rights issues.
IFRIC 19, Extinguishing financial liabilities with equity instruments. The amendment provides guidance regarding the accounting for the extinguishment of a financial liability by the issue of equity instruments. To date, the Group has not entered into transactions of this nature. However, if the Group does enter into any such transactions in the future, IFRIC 19 will affect the required accounting. In particular, under IFRIC 19, equity instruments issued under such arrangements will be measured at their fair value, and any difference between the carrying amount of the financial liability extinguished and the fair value of equity instruments issued will be recognised in profit or loss.
IFRS 3, ‘Business combinations’ effective 1 July 2009
The revised standard continues to apply the acquisition method to business combinations, with some significant changes. For example, all payments to purchase a business are to be recorded at fair value at the acquisition date, with contingent payments classified as debt subsequently re-measured through the profit or loss. There is a choice, on an acquisition-by-acquisition basis, to measure the non-controlling interest in the acquire either at fair vale or at the non-controlling interest’s proportionate share of the acquiree’s net assets. All acquisition-related costs
should be expensed. The Group applied IFRS 3 (revised) prospectively to all business combinations from 1 January 2010 although there were no business combination arrangements that took place in the year.
(ii) Impact of new and amended standards and interpretations on the financial statements for the year ended 31 December 2010 and future annual periods
IAS 27, ‘Consolidated and separate financial statements’ effective 1 July 2009
The revised standard requires the effects of all transactions with non-controlling interests to be recorded in equity if there is no change in control and these transactions will no longer result in goodwill or gains and losses. The standard also specifies the accounting when control is lost; any remaining interest in the entity is re-measured to fair value, and a gain or loss is recognised in profit or loss. The Group adopted IAS 27 (revised) prospectively to transactions with non-controlling interests from 1 January 2010.
(iii) Early adoption of standards
The Group did not early-adopt any new or amended standards in 2010.
The Group’s principal accounting policies are set out below:
(a) Basis of preparation
The financial statements are prepared under the historical cost convention as modified by the revaluation of certain items of property, plant and equipment and the carrying of available-for-sale investments at fair value.
(b) Consolidation
Subsidiary undertakings, which are those companies in which the Group either directly or indirectly, has an interest of more than one half of the voting rights or otherwise has power to exercise control over the operations, are consolidated. A listing of the subsidiaries in the Group is provided in Note 19. Subsidiaries are
consolidated from the date on which effective control is transferred to the Group and consolidation ceases from the date of disposal. All inter-company transactions, balances and unrealised gains on transactions between Group companies are eliminated; losses are also eliminated unless cost cannot be recovered.
Where necessary, accounting policies for subsidiaries have been changed to achieve consistency with the policies adopted by the parent company.Non-controlling interests that are present ownership interests and entitle their holders to a proportionate share of the entity’s net assets in the event of liquidation may be initially measured either at fair value or at the non-controlling interests’ proportionate share of the recognised amounts of the acquiree’s identifiable net assets. The choice of measurement basis is made on a transaction-by-transaction basis. Other types of non-controlling interests are measured at fair value or, when applicable, on the basis specified.
(c) Revenue recognition
Sales are recognised upon dispatch for self collection or else on delivery of products to customers or performance of service. The sales are stated net of value added tax and discounts, and after eliminating sales within the Group.
Interest income is recognised as it accrues, unless its collectability is in doubt. Dividends receivable are recognised as income in the period in which they are declared by investee companies.
(d) Translation of foreign currencies
i) Transactions and balances
Transactions in foreign currencies during the year are translated into Kenya Shillings at rates ruling at the transaction dates. Assets and liabilities which are expressed in foreign currencies are translated into Kenya Shillings at rates ruling at the end of reporting period. The resulting differences from conversion and translation are dealt with in the profit or loss for the year in which they arise.

46
2010 | BAMBURI CEMENT LIMITED - ANNUAL REPORT
Financial StatementsFor the year ended 31 December 2010
Notes to the Financial Statements
ii) Translation of foreign operations
The results and financial position of all the group entities (none of which has the currency of a hyperinflationery economy) that have a functional currency different from the presentation currency are translated into the presentation currency as follows:
• Assets and liabilities for each statement of financial position presented are translated into Kenya Shillings using exchange rates prevailing at the end of the reporting period;
• Income and expenses for each statement of comprehensive income are translated at average exchange rates (unless this average is not a reasonable approximation of the cumulative effect of the rates prevailing on the transaction dates, in which case income and expenses are translated at the dates of the transactions); and
• All resulting exchange differences are recognised under other comprehensive income and accumulated in a separate heading, translation reserve, in the consolidated statement of changes in equity
On consolidation, exchange differences arising from the translation of the net investment in foreign entities are taken to shareholders’ equity. When a foreign operation is sold, the cumulative amount of the exchange differences relating to that foreign entity, recognised in other comprehensive income and accumulated on the separate component of equity, is reclassified from equity to profit or loss when the gain or loss on disposal is recognised.
(e) Borrowing costs
Borrowing costs that are directly attributable to the acquisition, construction or production of qualifying assets, which are assets that necessarily take a substantial period of time to get ready for their intended use or sale, are
capitalised as part of the cost of those assets, until such a time as the assets are substantially ready for their intended use or sale.
Investment income earned on the temporary investment of specific borrowings pending their expenditure on qualifying assets is deducted from the borrowing costs eligible for capitalisation.
All other borrowing costs are recognised in profit or loss in the period in which they are incurred.
(f) Leases
Leases are classified as finance leases whenever the terms of the lease transfer substantially all risks and rewards of ownership to the Group or the company as the lessee. All other leases are classified as operating leases.
Rentals payable under operating leases are amortised on the straight line basis over the term of the relevant lease.
(g) Goodwill
Goodwill arising on consolidation represents the excess of the cost of acquisition over the fair value of the Group’s share of the net assets of the acquired subsidiary as at the date of acquisition. Goodwill is initially recognised as an asset at cost and is subsequently measured at cost less any accumulated impairment losses.
For the purpose of impairment testing, goodwill is allocated to the cash generating units expected to benefit from the synergies of the business combination. Cash generating units to which goodwill has been allocated are tested for impairment annually. If the recoverable amount of the cash generating unit is less than the carrying amount of the unit, the impairment loss is allocated to reduce the carrying amount of the goodwill allocated to the unit. An impairment loss recognised for goodwill is not reversed in a subsequent period.
(h) Property, plant and equipment
All property, plant and equipment are initially recorded at cost. Freehold land and buildings are subsequently shown at their revalued amounts based on valuations by external independent valuers, less accumulated depreciation and any accumulated impairment losses. Plant and machinery is revalued internally on the basis of a valuation model prescribed by engineers and consultants at the technical centre of the ultimate shareholder. The valuations are carried out approximately once every five years.
All other property and equipment are stated at historical cost less accumulated depreciation less any accumulated impairment losses. Increases in the carrying value of buildings arising on revaluation are recognised in other comprehensive income and accumulated in equity under the heading of revaluation surplus. Increases are recognised in profit or loss to the extent that it reverses a revaluation decrease of the same asset previously recognised in profit or loss. Decreases arising from revaluation of assets are recognised in profit or loss. However, decreases that offset previous increases of the same asset are recognised in other comprehensive income to the extent of any credit balance existing in the revaluation surplus in respect of that asset.
Each year the difference between depreciation based on the revalued carrying amount of an asset (the depreciation charged to the income statement) and depreciation based on the asset’s original cost is transferred from the revaluation reserve to retained earnings.
Depreciation is calculated on the straight line basis to write down the cost of each item of property plant and equipment, or the revalued amount, to its residual value over its expected useful life as follows:
Buildings, plant and machinery 14 - 22 yearsEquipment and mobile plant 3 - 10 yearsResidential buildings 40 years

47
2010 | BAMBURI CEMENT LIMITED - ANNUAL REPORT
Financial StatementsFor the year ended 31 December 2010
Notes to the Financial Statements
Freehold land is not depreciated as it is deemed to have an infinite life. Where the carrying amount of an asset is greater than its estimated recoverable amount, it is written down immediately to its recoverable amount.
The gain or loss arising on disposal or retirement of an item of property, plant and equipment is determined as the difference between the actual proceeds and the carrying amount of the asset and is recognised in the profit or loss in the year in which the disposal or retirement occurs.
(i) Intangible assets
Computer software costs are stated at cost less accumulated amortisation and any accumulated impairement losses. The costs are amortised over the expected useful lives of the software on the straight line basis. Currently, the estimated useful life is five years.
(j) Taxation
Current taxation is provided on the basis of the results for the year, as shown in the financial statements, adjusted in accordance with tax legislation.
Deferred tax is provided, using the liability method, for all temporary differences arising between the tax bases of assets and liabilities and their carrying values for financial reporting purposes.
Deferred tax assets are only recognised to the extent that it is probable that future taxable profits will be available against which the temporary differences can be utilised.
Income tax assets and income tax liabilities are offset only when there is a legally enforceable right to set off the tax assets against current tax liabilities and when they relate to income taxes levied by the same taxation authority and the Group intends to settle the tax assets and the tax liabilities on a net basis.
(k) Inventories
Inventories of consumables and spare parts are stated at weighted average cost less
provision for obsolete and slow moving items. All other inventories are stated at the lower of cost and net realisable value. Cost includes direct cost and appropriate overheads and is determined on the first-in first-out method. Net realisable value is the estimated selling price of the inventories in the ordinary course of the Group’s business less the estimated costs of completion and the estimated costs necessary to make the sale.
(l) Dividends payable
Dividends payable on ordinary shares are charged to retained earnings in the period in which they are declared. Proposed dividends are not accrued for until ratified in an Annual General Meeting.
(m) Financial instruments
Financial assets and financial liabilities are recognised in the Group’s statement of financial position when the company has become party to the contractual provisions of the instrument.
Financial assets
i) Classification and measurement
The Group classifies its financial assets into the following IAS 39 categories: Financial assets at fair value through profit or loss; loans and receivables; held to maturity financial assets; and available for sale financial assets. Management determines the appropriate classification of its financial instruments at initial recognition.
Financial assets at fair value through profit or loss
This category has two sub-categories: Financial assets held for trading and those designated at fair value through profit or loss at inception.
A financial asset is classified as held for trading if:
a) it has been acquired or incurred principally for the purpose of selling or repurchasing it in the near term; or b) on initial recognition it is part of a portfolio
of identified financial instruments that the Group manages together and for which there is evidence of a recent actual pattern of short-term profit taking; or; c) it is a derivative that is not designated and effective as a hedging instrument.
A financial asset other than a financial asset held for trading may be designated as at fair value through profit or loss if:
a) such designation eliminates or significantly reduces a measurement or recognition inconsistency that would otherwise arise; or b) the financial asset forms part of a Group of financial assets or financial liabilities or both, which is managed and its performance is evaluated on a fair value basis, in accordance with the Group’s documented risk management or investment strategy and information about the grouping is provided internally on that basis; or c) it forms part of a contract containing one or more embedded derivatives, and IAS 39 Financial Instruments: Recognition and Measurement permits the entire combined contract (asset or liability) to be designated as at fair value through profit or loss.
Financial instruments at fair value through profit or loss are recognised initially at fair value; transaction costs are taken directly to the statement of comprehensive income. Gains and losses arising from changes in fair value are included directly in the statement of comprehensive income. The net gain or loss recognised in the statement of comprehensive income incorporates any dividend or interest earned on the financial asset.
Loans and receivables
Loans and receivables are non derivative financial assets with fixed or determinable payments that are not quoted in an active market. They arise when the Group provides money, goods or services directly to a debtor with no intention of trading the receivable.
Loans and receivables are measured at amortised cost using the effective interest method, less any impairment.

48
2010 | BAMBURI CEMENT LIMITED - ANNUAL REPORT
Financial StatementsFor the year ended 31 December 2010
Notes to the Financial Statements
Held to maturity financial assets
Held to maturity investments are non-derivative financial assets with fixed or determinable payments and fixed maturities that management has the positive intention and ability to hold to maturity. Where a sale of other than an insignificant amount of held-to-maturity assets occurs, the entire category would be tainted and classified as available for sale.
Held to maturity investments are initially recognised at fair value including direct and incremental transaction costs and measured subsequently at amortised cost using the effective interest method less any impairment, with revenue recognised on an effective yield basis.
Available-for-sale financial assets
Available for sale investments are those that are intended to be held for an indefinite period of time, which may be sold in response to needs for liquidity or changes in interest rates or equity prices or that are not classified as loans and receivables, held-to-maturity investments or financial assets at fair value through profit or loss.
Available-for-sale investments are initially recognised at fair value, which is the cash consideration including any transaction costs, and measured subsequently at fair value. Gains and losses arising from changes in fair value are recognised in other comprehensive income and accumulated in the fair value reserve with the exception of impairment losses, which are recognised in profit or loss.
Where the investment is disposed of or is determined to be impaired, the cumulative gain or loss previously accumulated in the fair value reserve is reclassified to profit or loss.
Dividends on available for sale equity instruments are recognised in the statement of comprehensive income when the Group’s right to receive the dividends is established.
ii) Reclassification of financial assets
Reclassifications are accounted for at the fair value of the financial asset at the date of reclassification.
iii) De-recognition of financial assets
Financial assets are derecognised when the contractual rights to receive cash flows from the financial assets have expired or where the Group has transferred substantially all risks and rewards of ownership of the asset to another entity. If the Group neither transfers nor retains substantially all the risks and rewards of ownership and continues to control the transferred asset, the Group recognises its retained interest in the asset and an associated liability for amounts it may have to pay. If the Group retains substantially all the risks and rewards of ownership of a transferred financial asset, the Group continues to recognise the financial asset and also recognises a collateralised borrowing for the proceeds received.
iv) Impairment of financial assets
Financial assets, other than those at fair value through profit or loss, are assessed for indicators of impairment at each reporting period end. Financial assets are impaired where there is objective evidence that, as a result of one or more events that occurred after the initial recognition of the financial asset, the estimated future cash flows of the asset have been affected.For listed and unlisted equity investments classified as available-for-sale, a significant or prolonged decline in the fair value of the security below its cost is considered to be objective evidence of impairment.
For all other financial assets, objective evidence of impairment could include; the Group’s past experience of collecting payments, an increase in the number of delayed payments past the average credit period, delinquency, and initiation of bankruptcy proceedings as well as observable changes in national or local economic conditions that correlate with default on receivables.
For certain categories of financial asset, such as trade receivables, assets that are assessed not to be impaired individually are, in addition, assessed for impairment on a collective basis. Objective evidence of impairment for a portfolio of receivables could include the Group’s past experience of collecting payments, an increase in the number of delayed payments in the portfolio past the average credit period of 30 days, as well as observable changes in national or local economic conditions that correlate with default on receivables.
For financial assets carried at amortised cost, the amount of the impairment loss recognised is the difference between the asset’s carrying amount and the present value of estimated future cash flows, discounted at the financial asset’s original effective interest rate.
The carrying amount of the financial asset is reduced by the impairment loss directly for all financial assets with the exception of trade receivables, where the carrying amount is reduced through the use of an allowance account. When a trade receivable is considered uncollectible, it is written off against the allowance account. Subsequent recoveries of amounts previously written off are credited against the allowance account. Changes in the carrying amount of the allowance account are recognised in profit or loss.
When an available-for-sale financial asset is considered to be impaired, cumulative gains or losses previously recognised in other comprehensive income are reclassified to profit or loss in the period.
In respect of available-for-sale equity securities, impairment losses previously recognised in profit or loss are not reversed through profit or loss. Any increase in fair value subsequent to an impairment loss is recognised in other comprehensive income.
Financial liabilities and equity instruments issued by the Group.
i) Classification and measurement
Debt and equity instruments are classified as either financial liabilities or as equity

49
2010 | BAMBURI CEMENT LIMITED - ANNUAL REPORT
Financial StatementsFor the year ended 31 December 2010
Notes to the Financial Statements
in accordance with the substance of the contractual arrangement.
Equity instruments
An equity instrument is any contract that evidences a residual interest in the assets of an entity after deducting all of its liabilities. Equity instruments issued by the Group are recorded at the proceeds received, net of direct issue costs.
Financial liabilities
Financial liabilities are classified as other financial liabilities. Other financial liabilities, including borrowings, are initially measured at fair value, net of transaction costs.
Other financial liabilities are subsequently measured at amortised cost using the effective interest method, with interest expense recognised on an effective yield basis. The effective interest method is a method of calculating the amortised cost of a financial liability and of allocating interest expense over the relevant period. The effective interest rate is the rate that exactly discounts estimated future cash payments through the expected life of the financial liability, or (where appropriate) a shorter period, to the net carrying amount on initial recognition.
ii) De-recognition of financial liabilities
The Group derecognises financial liabilities when, and only when, the Group’s obligations are discharged, cancelled or they expire.
(n) Derivative financial instruments
The Group enters into a variety of derivative financial instruments to manage its exposure to changes in fuel prices and foreign exchange rate risk.
Derivatives are initially recognised at fair value at the date the derivative contract is entered into and are subsequently remeasured to their fair value at the end of each reporting period. The resulting gain or loss is recognised in profit or loss immediately.
A derivative with a positive fair value is recognised as a financial asset; a derivative with a negative fair value is recognised as a financial liability. A derivative is presented as a non-current asset or a non-current liability if the remaining maturity of the instrument is more than 12 months and it is not expected to be realised or settled within 12 months. Other derivatives are presented as current assets or current liabilities.
(o) Offsetting
Financial assets and liabilities are offset and the net amount reported in the statement of financial position when there is a legally enforceable right to set off the recognised amounts and there is an intention to settle on net basis, or realise the asset and settle the liability simultaneously.
(p) Retirement benefits obligations
The Group operates a defined contribution pension scheme for eligible employees. The scheme is administered by an independent administration company and is funded by contributions from the Group companies and employees.
The Group also makes contributions to the statutory defined contribution schemes in the two countries where operations are based.
Unionisable staff who retire on attaining the age of 55 years or are declared redundant are eligible for service gratuity and pension based on each employee’s length of service with the Group, as provided for in the collective bargaining agreement.
The Group’s obligations to the staff retirement schemes are charged to the profit or loss as they fall due or in the case of service gratuity as they accrue to each employee.
(q) Impairment of non financial assets
At each reporting period end, the Group reviews the carrying amounts of its tangible and intangible assets to determine whether there is any indication
that those assets have suffered an impairment loss. If any such indication exists, the recoverable amount of the asset is estimated in order to determine the extent of the impairment loss.
Where it is not possible to estimate the recoverable amount of an individual asset, the Group estimates the recoverable amount of the cash generating unit to which the asset belongs.
Any impairment losses are recognised as an expense immediately. Where an impairment loss subsequently reverses, the carrying amount of the asset is increased to the revised estimate of its recoverable amount. A reversal of an impairment loss is recognised as income immediately.
(r) Provisions
Provisions are recognised when the Group has a present obligation (legal or constructive) as a result of a past event, it is probable that the Group will be required to settle the obligation, and a reliable estimate can be made of the amount of obligation.
The amount recognised as a provision is the best estimate of the consideration required to settle the present obligation at the reporting period end taking into account the risks and uncertainties surrounding the obligation.
Restructuring Provisions
Restructuring provisions mainly comprise employee termination payments and are recognised in the year in which the Group becomes legally or constructively committed to payment.
Employee termination benefits are recognised only after either an agreement is in place with the appropriate employee representatives specifying the terms of redundancy and numbers of employees affected, or after individual employees have been advised of the specific terms. Costs related to the ongoing activities of the Group are not provided for in advance.

50
2010 | BAMBURI CEMENT LIMITED - ANNUAL REPORT
(s) Employee entitlements
Employee entitlements to long service awards are recognised when they accrue to employees. A provision is made for the estimated liability for long-service awards as a result of services rendered by employees up to the reporting period end.Employee entitlements to annual leave are recognised when they accrue to employees. A provision is made for the estimated liability for annual leave at the reporting period end
(t) Segmental reporting
Operating segments are reported in a manner consistent with the internal reporting provided to the Chief Operating Decision Maker (the Group Managing Director). The management then
allocates resources to and assesses the performance of the operating segments of the Group.
Segment result is segment revenue less segment expenses.
Segment revenue is the revenue that is directly attributable to a segment plus the relevant portion of the group’s revenue that can be allocated to the segment on a reasonable basis.
Segment expenses are expenses resulting from the operating activities of a segment plus the relevant portion of an expense that can be allocated to the segment on a reasonable basis.
Segment assets and liabilities comprise those operating assets and liabilities that
are directly attributable to the segment or can be allocated to the segment on a reasonable basis.
Capital expenditure represents the total cost incurred during the year to acquire segment assets (property, plant and equipment) that are expected to be used during more than one year.
(u) Comparatives
Where necessary, comparative figures have been adjusted to conform with changes in presentation in the current year.
Financial StatementsFor the year ended 31 December 2010
Notes to the Financial Statements

51
2010 | BAMBURI CEMENT LIMITED - ANNUAL REPORT
Financial StatementsFor the year ended 31 December 2010
Notes to the Financial Statements
In accordance with IFRS 8, Operating segments, the information presented hereafter by operating segment is the same as that reported to the Chief Operating Decision Maker (the Group Managing Director) for the purposes of making decisions about allocating resources to the segment and assessing its performance.
The Group analyses its organisational structure and internal reporting system for the purpose of identifying suitable segment reporting format for the Group. In particular, the Group has identified geographical segments as the primary segment reporting format that is suitable for the Group. The Group is organised on a regional basis into two
main geographical segments: Kenya and Uganda.
Both geographical segments are mainly involved in the manufacture and sale of cement which comprises over 95% of the business activities of the Group. The remaining business activities, which include manufacture and sale of paving
3 SEGMENT INFORMATION
2 CRITICAL ACCOUNTING JUDGEMENTS AND KEY SOURCES OF ESTIMATION UNCERTAINTY
In the process of applying the Group’s accounting policies, the Directors have made estimates and assumptions that affect the reported amounts of assets and liabilities within the next financial year.
Estimates and judgements are continually evaluated and are based on historical experience and other factors, including expectations of future events that are believed to be reasonable under the circumstances. Actual results may differ from these estimates.
The estimates and underlying assumptions are reviewed on an ongoing basis. Revisions to accounting estimates are recognised in the period in which the estimate is revised if the revision affects only that period, or in the period of the revision and future periods if the revision affects both current and future periods.
The key areas of judgement and sources of estimation uncertainty are as set out below:
Inventories provision
Management makes provisions for spares that exceed the set maximum level based on the usage of the inventory by comparing items in stock with the recent past consumption. The maximum level is determined by taking into consideration the lead time, the specified order quantity, the source of the spares and the
projected usage rate.
Impairment losses
At each reporting period end, the Group reviews the carrying amounts of its tangible and intangible assets to determine whether there is any indication that those assets have suffered an impairment loss. If any such indication exists, the recoverable amount of the asset is estimated in order to determine the extent of the impairment loss.
Where it is not possible to estimate the recoverable amount of an individual asset, the Group estimates the recoverable amount of the cash generating unit to which the asset belongs. Any impairment losses are recognised as an expense immediately. Where an impairment loss subsequently reverses, the carrying amount of the asset is increased to the revised estimate of its recoverable amount. A reversal of an impairment loss, other than that arising from goodwill, is recognised as income immediately.
Determining whether goodwill is impaired requires an estimation of the value in use of the cash-generating units to which goodwill has been allocated.
Useful lives of property, plant and equipment
The Group reviews the estimated useful lives of property, plant and equipment at
the end of each reporting period. During the financial year, no changes to the useful lives were identified by the Directors.
Contingent liabilities
As disclosed in note 32 to these financial statements, the Group is exposed to various contingent liabilities in the normal course of business including a number of legal cases.
The Directors evaluate the status of these exposures on a regular basis to assess the probability of the Group incurring related liabilities. However, provisions are only made in the financial statements where, based on the Directors’ evaluation, a present obligation has been established.
Income taxes
The group is subject to income taxes in various jurisdictions. Significant judgement is required in determining the Group’s provision for income taxes. There are many transactions and calculations for which the ultimate tax determination is uncertain during the ordinary course of business. The group recognises liabilities for anticipated tax audit issues based on estimates of whether additional taxes will be due. Where the final outcome of these matters is different from the amounts that were initially recorded, such differences will impact the income tax and deferred tax provision in the period in which such determination is made.

52
2010 | BAMBURI CEMENT LIMITED - ANNUAL REPORT
Financial StatementsFor the year ended 31 December 2010
Kenya Uganda Group Shs’million Shs’million Shs’million
Revenue 17,579 10,496 28,075Profit before taxation 6,556 1,008 7,564Income taxation expense (1,957) (308) (2,265)Profit for the year 4,599 700 5,299
Segment assets 24,065 9,241 33,306
Segment liabilities 5,719 5,961 11,680
Capital additions 847 2,582 3,429
Depreciation and amortisation 731 284 1,015
Year ended 31 December 2010 - All figures in million of Kenya Shillings
Year ended 31 December 2009 - All figures in million of Kenya Shillings
Total assets are shown by the geographical area in which the assets are located. Segment assets consist primarily of property, plant and equipment, intangible assets, inventories, receivables and operating cash and mainly exclude unquoted
investments. Segment liabilities comprise operating liabilities, dividends payable and certain corporate borrowings.
In addition to the depreciation and amortisation reported above,
impairment losses of Shs Nil (2009: 11 million) were recognised in respect of property, plant and equipment. These losses were attributable to Kenya reportable segment.
Notes to the Financial Statements
Kenya Uganda Group Shs’million Shs’million Shs’million
Revenue 19,953 10,041 29,994Profit before taxation 8,015 1,581 9,596Income taxation expense (2,115) (511) (2,626)Profit for the year 5,900 1,070 6,970
Segment assets 23,382 8,730 32,112
Segment liabilities 5,785 5,386 11,171
Capital additions 456 2,825 3,281
Depreciation and amortisation 656 180 836
blocks and rehabilitation of quarries that are used as source of raw materials for cement productions, are not deemed significant for separate segment reporting.
Group management internally evaluates its performance based upon:
• Operating income before capital gains, impairment and restructuring
• Capital employed (defined as the total of goodwill, intangible and tangible assets and working capital).

53
2010 | BAMBURI CEMENT LIMITED - ANNUAL REPORT
Financial StatementsFor the year ended 31 December 2010
Notes to the Financial Statements
2010 20094 COST OF SALES Shs’million Shs’million
Energy 5,088 4,781 Maintenance supplies and contract works 1,062 1,275 Imported clinker 1,429 2,440 Packaging 1,052 1,052 Additives and production supplies 2,013 2,014 Freight of raw materials 2,303 2,572 Purchased cement and clinker costs 1,368 1,286 Staff costs 1,455 1,353 Professional fees 425 533 Telecommunication costs 40 91 Transport and Travelling costs 82 107 Rentals, Security and business licences 210 223 Depreciation 922 737 Amortisation 20 11 Others 988 704 18,457 19,179
5 INVESTMENT INCOME
Interest income – Held to maturity bank deposits 128 85 Dividends income – Available for sale equity investments 15 18
143 103
6 OTHER GAINS AND LOSSES
Profit on disposal of Available for sale equity investments (note 20(c)) - 1,203 Insurance claim - 218 Profit on disposal of property, plant and equipment 5 2 Loss on impairment of property, plant and equipment - (11) Sundry income 369 222 Net foreign exchange (losses)/gains (144) 141 230 1,775
7 ADMINISTRATION EXPENSES Staff costs 672 880 Professional fees 41 69 Telecommunication costs 138 201 Transport and travelling costs 57 108 Rentals, security and business licences 95 96 Bank charges 61 68 1,064 1,422
Information about major customers
Included in the revenues of Shs 28,075 million (2009: Shs 29,994 million) are approximately Shs 1,420 million (2009: Shs 1,131 million) which arose from sales to the group’s largest customer.
GROUP

54
2010 | BAMBURI CEMENT LIMITED - ANNUAL REPORT
Financial StatementsFor the year ended 31 December 2010
Notes to the Financial Statements
2010 20098 OTHER EXPENSES Shs’million Shs’million
Depreciation 61 73 Amortisation 12 15 Contract works 51 23 Technical fees 444 430 Other costs 64 185 632 726
9 FINANCE COSTS
Interest expense 91 14
10 a PROFIT BEFORE TAXATION
The profit before taxation is arrived at after charging Staff costs 2,127 2,233 Depreciation 983 810 Amortisation of intangible assets 29 26 Amortisation of leasehold land 3 - Directors’ emoluments: (note 35 (iv)) - Fees 4 5 - Other emoluments 134 115 Auditors’ remuneration 9 9
b STAFF COSTS
Defined contribution plans 85 95 Defined benefit plans - Gratuities 60 116 Other employee benefits 1,982 2,022
2,127 2,233
Presented as;
Cost of sales (Note 4) 1,455 1,353 Administration expenses (Note 7) 672 880
2,127 2,233
GROUP

55
2010 | BAMBURI CEMENT LIMITED - ANNUAL REPORT
Financial StatementsFor the year ended 31 December 2010
Notes to the Financial Statements
2010 200911 TAXATION Shs’million Shs’million
(a) Taxation charge Current taxation based on the adjusted profit at 30% 1,992 2,069 (Over)/underprovision of current tax in prior years (3) 354
Net current taxation charge 1,989 2,423
Deferred tax charge (note 28) 338 506 Over provision of deferred tax in prior years (note 28) (62) (303)
Net deferred tax charge 276 203 Total taxation charge 2,265 2,626
(b) Reconciliation of expected tax based on accounting profit to taxation charge:
Profit before taxation 7,564 9,596
Tax calculated at the domestic rates applicable of 30 % 2,269 2,879 Tax effect of income not subject to tax (5) (366) Tax effect of expenses not deductible for tax purposes 66 62 (Over)/underprovision of current tax in prior years (3) 354 Over provision of deferred tax in prior years (62) (303)
Total taxation charge 2,265 2,626
2010 2009 2010 2009 Shs’million Shs’million Shs’million Shs’million
(c) Corporate tax movement
Net tax (recoverable)/payable at beginning of the year 347 (341) 328 (392) Taxation charge 1,992 2,069 1,986 1,722 Taxation paid (2,251) (1,732) (2,239) (1,333) Prior years under-provision (3) 354 (3) 331 Foreign exchange differences (23) (3) - - Net tax payable at end of the year 62 347 72 328
Comprising: Tax payable 72 356 72 328 Tax recoverable (10) (9) - -
Net tax payableat end of the year 62 347 72 328
GROUP
GROUP COMPANY

56
2010 | BAMBURI CEMENT LIMITED - ANNUAL REPORT
Financial StatementsFor the year ended 31 December 2010
Notes to the Financial Statements
12 PROFIT FOR THE YEAR
Included in the profit for the year is an amount of Shs 4,552 million (2009 – 5,886 million) which relates to and is dealt with in the company’s financial statements.
13 EARNINGS PER SHARE
Basic and diluted earnings per share is calculated by dividing the net profit attributable to the equity shareholders by the weighted average number of ordinary shares in issue during the year, as shown below:
2010 2009
Net profit attributable to owners of the Group (Shs million) 5,089 6,649
Weighted average number of ordinary shares (million) 363 363
Basic and diluted earnings per share (Shs) 14.02 18.32
There were no potentially dilutive shares as at 31 December 2010 and as at 31 December 2009. There were also no discontinued operations during the year (2009: Nil). 2010 2009 14 DIVIDENDS Shs’million Shs’million
(a) Unclaimed dividends
At beginning of year 30 30 Declared during the year 3,993 1,561 Dividends claimed in the year - note (b) (3,993) (1,561)
At end of year 30 30
(b) Payments during the year 2010:
Final dividend for previous year 1,997 1,017 Interim dividend for current year 544 544 Special interim dividend – post year end 1,452 - 3,993 1,561
(c) Dividends declared in respect of the year
Interim dividend - paid in the year 544 544 Final dividend proposed – post year end 2,541 1,997 Special interim dividend – post year end - 1,452
3,085 3,993
Dividends per share (based on number of shares per note 13) Sh 8.50 Shs 11.00
Proposed final dividendOn 31 October 2010, an interim dividend of Shs 1.50 (2009-Shs 1.50) per share representing an amount of Shs 544 million (2009: Shs 544 million) was declared and paid.
In respect of the current year, the Directors propose that a final dividend of Shs 7.00 (2009 – Shs 5.50) per share equivalent to a total sum of Shs 2,541 million (2009 – Shs 1,997 million) be paid to the shareholders.
GROUP & COMPANY

57
2010 | BAMBURI CEMENT LIMITED - ANNUAL REPORT
Financial StatementsFor the year ended 31 December 2010
Notes to the Financial Statements
The final dividend is subject to approval by owners of the Group at the Annual General Meeting and has not been included as a liability in these financial statements.
Withholding taxPayment of dividends is subject to withholding tax at a rate of 10% for non-resident owners of the group and 5% for resident shareholders. For resident owners of the group, withholding tax is only deductible where the shareholding is below 12.5%.
15 PROPERTY, PLANT AND EQUIPMENT Land and Plant Office residential and equipment Mobile a) GROUP buildings machinery and tools plant Total Shs’million Shs’million Shs’million Shs’million Shs’million Cost or valuation At 1 January 2009 1,307 21,214 646 724 23,891 Foreign exchange adjustments* 2 (18) 6 1 (9) Additions 16 2,106 168 96 2,386 Disposals - - (6) (6) (12) Transfers (1) 38 (25) 1 13
At 31 December 2009 1,324 23,340 789 816 26,269 At 1 January 2010 1,324 23,340 789 816 26,269 Foreign exchange adjustments * (56) (512) (35) (22) (625) Additions 97 7,141 135 20 7,393 Disposals - - - (4) (4) Transfers - (23) - - (23) At 31 December 2010 1,365 29,946 889 810 33,010 Depreciation 1 January 2010 246 12,355 426 597 13,624 Foreign exchange adjustments* - (18) 1 1 (16) Charge for the year 19 676 79 36 810 Disposals - - (3) (6) (9) Transfers (1) 35 (22) 1 13
At 31 December 2009 264 13,048 481 629 14,422
At 1 January 2010 264 13,048 481 629 14,422 Foreign exchange adjustments* (23) (158) (23) (20) (224) Charge for the year 28 831 84 40 983 Disposals - - - (4) (4) At 31 December 2010 269 13,721 542 645 15,177 Net book value At 31 December 2010 1,096 16,225 347 165 17,833
At 31 December 2009 1,060 10,292 308 187 11,847
14 DIVIDENDS (Continued)
*The foreign exchange adjustments arise from the translation of the carrying values relating to assets held by a subsidiary, HimCem Holdings Limited.

58
2010 | BAMBURI CEMENT LIMITED - ANNUAL REPORT
Land and Plant Office residential and equipment Mobile buildings machinery and tools plant Total Shs’million Shs’million Shs’million Shs’million Shs’million Cost or valuation At 1 January 2009 857 18,256 326 489 19,928 Additions - 1,165 151 87 1,403 Disposals - - - - - Transfers - 38 (25) - 13
At 31 December 2009 857 19,459 452 576 21,344
At 1 January 2010 857 19,459 452 576 21,344 Additions - 362 67 - 429 Transfers - (23) - - (23)
At 31 December 2010 857 19,798 519 576 21,750 Depreciation At 1 January 2009 46 11,551 251 474 12,322 Charge for the year 8 541 51 9 609 Disposals - - - - - Transfers - 35 (22) - 13
At 31 December 2009 54 12,127 280 483 12,944
At 31 December 2009 54 12,127 280 483 12,944 Charge for the year 8 606 51 13 678 At 31 December 2010 62 12,733 331 496 13,622
Net book value At 31 December 2010 795 7,065 188 80 8,128
At 31 December 2009 803 7,332 172 93 8,400
Financial StatementsFor the year ended 31 December 2010
Notes to the Financial Statements
15 PROPERTY, PLANT AND EQUIPMENT (Continued)
b) COMPANY
(c) OTHER DISCLOSURES
If the property, plant and equipment were stated on the historical cost basis, the amounts would be as follows:
2010 2009 2010 2009 Shs’million Shs’million Shs’million Shs’million
Cost 20,016 12,899 9,222 8,803 Accumulated depreciation (4,006) (4,679) (3,835) (3,405)
Net book value 16,010 8,220 5,387 5,398
GROUP COMPANY

59
2010 | BAMBURI CEMENT LIMITED - ANNUAL REPORT
Financial StatementsFor the year ended 31 December 2010
Notes to the Financial Statements
GROUP COMPANY
The Group’s land, buildings, plant, and machinery were last revalued on 1 January 2006. Land and buildings were valued on the basis of open market value by independent valuers, Burn & Fawcett Chartered Surveyors, valuers and estate agents in Kenya and Contrad Properties Limited in Uganda. Plant and machinery were revalued on a depreciated replacement cost basis using a valuation model prescribed by engineers and consultants at the technical centre of the ultimate shareholder.
Land and residential buildings include freehold land with a carrying value of Shs 504 million (2009: Shs 504 million) located in Mombasa and limestone deposits with a carrying value of Shs 79 million (2009: Shs 93 million) in Kasese, Uganda.
The Group’s plant and machinery, office equipment and mobile plant with a cost of Shs 900 million were fully depreciated as at 31 December 2010 (2009: Shs 1,100 million). The normal annual depreciation charge on these assets in the year ended 31 December 2010 would have been Shs 150 million (2009: Shs 203 million).
The company’s plant and machinery, office equipment and mobile plant with a cost of Shs 711 million were fully depreciated as at 31 December 2010 (2009: Shs 861 million). The normal annual depreciation charge on these assets in the year ended 31 December 2010 would have been Shs 119 million (2009: Shs 149 million).
16 PREPAID OPERATING LEASE RENTALS
2010 2009 2010 2009 Shs’million Shs’million Shs’million Shs’million
Net carrying value at beginning and end of year 187 9 1 1
The operating lease rentals relate to leasehold land, mainly raw materials quarries, located in Mombasa and Athi River in Kenya and Kasese in Uganda.

60
2010 | BAMBURI CEMENT LIMITED - ANNUAL REPORT
Financial StatementsFor the year ended 31 December 2010
Notes to the Financial Statements
17 INTANGIBLE ASSETS – COMPUTER SOFTWARE
GROUP COMPANY Shs’million Shs’million Cost At 1 January 2009 372 298 Additions 104 104 Transfers (13) (13)
At 31 December 2009 463 389 At 1 January 2010 463 389 Additions 4 -
At 31 December 2010 467 389 Amortisation
At 1 January 2009 349 276 Charge for the year 26 26 Transfers (13) (13)
At 31 December 2009 362 289
At 1 January 2010 362 289 Charge for the year 29 28
At 31 December 2010 391 317 Net book value At 31 December 2010 76 72 At 31 December 2009 101 100
*The foreign exchange adjustments arise from the translation of the carrying values relating to assets held by a subsidiary, HimCem Holdings Limited.
18 CAPITAL WORK IN PROGRESS
Capital work in progress relates to ongoing work in respect of additions and replacements to various plants as at year end. The main addition during the year relates to the capacity increase project, Project Rwenzori, carried out in Hima Cement Limited, a subsidiary company domiciled in Uganda. No depreciation has been charged during the year.
2010 2009 2010 2009 Shs’million Shs’million Shs’million Shs’million
At 1 January 6,258 5,477 556 1,734 Additions 974 3,124 666 238 Transfers to property plant and equipment (4,942) (2,229) (306) (1,301) Transfers to intangible assets - (104) - (104) Impairment losses recognised in profit or loss - (11) - (11) Retirements (106) - (106) - Foreign exchange adjustments* (965) 2 - -
At 31 December 1,219 6,259 810 556 *The foreign exchange adjustments arise from the translation of the carrying values relating to assets held by a subsidiary, HimCem Holdings Limited.
GROUP COMPANY

61
2010 | BAMBURI CEMENT LIMITED - ANNUAL REPORT
Financial StatementsFor the year ended 31 December 2010
Notes to the Financial Statements
19 INVESTMENTS IN SUBSIDIARIES Held at cost less impairment provisions: Details of the subsidiaries in the Group are provided below:
COMPANY
Holding 2010 2009 % Shs’million Shs’million
Simbarite Limited (Kenya) 100 53 53Less: impairment provision (22) (22)
31 31
Bamburi Special Products Limited (Kenya) 100 20 20Bamburi Cement Limited, Uganda (Kenya) 100 - - HimCem Holdings Limited (Channel Islands) 100 911 911Lafarge Eco Systems Limited (Kenya) 100 5 5Diani Estate Limited (Kenya) 100 1 1Kenya Cement Marketing Limited (Kenya) 50 - -Portland Mines Limited (Kenya) 50 - -Seruji Management Limited (Channel Islands) 100 - -
968 968
Except where indicated above, the subsidiaries are incorporated in Kenya. HimCem Holdings Limited has a 70% holding in its subsidiary, Hima Cement Limited, a company incorporated in Uganda.
20 OTHER EQUITY INVESTMENTS – Available for sale
These represent Available-For-Sale investments, which are carried at fair value annually at the close of business on the reporting date. For investments traded in active markets, fair value is determined by reference to Stock Exchange quoted bid prices. For other investments, fair value is determined by reference to the current market for similar instruments or by reference to the discounted cash flows of the underlying net assets. The market value of the quoted equity shares at 31 December 2010 was Shs 911 million (2009: Shs 906 million). Changes in the fair values are recognised in the other comprehensive income and accumulated in fair value reserve in equity.
a) Movement in available-for-sale investments
GROUP AND COMPANY 2010 2009 Shs’million Shs’million
At 1 January 906 2,186Disposals (note 20(b)) - (1,340) Fair value gains (note 20(b)) 5 60
At 31 December 911 906

62
2010 | BAMBURI CEMENT LIMITED - ANNUAL REPORT
Financial StatementsFor the year ended 31 December 2010
Notes to the Financial Statements
20 OTHER EQUITY INVESTMENTS - Available for sale (Continued) b) Analysis of the equity investments Number of shares Valuation At Additions/ At At Additions/ Decrease in At 1.1.2009 (disposals) 31.12.2009 1.1.2009 (disposals) market value 31.12.2009 Quoted investments Units Units Units Shs’ million Shs’ million Shs’ million Shs’ million East African Portland Cement Limited 11,265,068 - 11,265,068 895 - 6 901 Kenya Oil company Limited 90,550 - 90,550 7 - (2) 5 Athi River Mining Limited 13,959,300 (13,959,300) - 1,284 (1,340) 56 - 2,186 (1,340) 60 906
Number of shares Valuation Increase/ At Additions/ At At Additions/ (decrease) in At 1.1.2010 (disposals) 31.12.2010 1.1.2010 (disposals) market value 31.12.2010 Quoted investments Units Units Units Shs’ million Shs’ million Shs’ million Shs’ million East African Portland Cement Limited 11,265,068 - 11,265,068 901 - - 901 Kenya Oil company Limited 905,500 - 905,500 5 - 5 10
906 - 5 911
c) Gain on disposal of the equity investments 2010 2009 Gain on Gain on Cost Proceeds disposal Cost Proceeds disposal Shs’million Shs’million Shs’million Shs’million Shs’million Shs’million Quoted investments - - - 143 1,346 1,203 Comprising: Cumulative gain reclassified from fair value reserve on disposal - - - - - 1,197 Gain during the year - - - - - 6
- - - - - 1,203
d) Disposals of the equity investments comprise: GROUP AND COMPANY 2010 2009 Shs’million Shs’million
Cost of equity investments disposed - 143 Cummulative gain reclassified from fair value reserve on disposal - 1,197
Total disposals (note 20(b)) - 1,340

63
2010 | BAMBURI CEMENT LIMITED - ANNUAL REPORT
Financial StatementsFor the year ended 31 December 2010
Notes to the Financial Statements
2010 200921 GOODWILL Shs’million Shs’million
At beginning and end of the year 217 217
The goodwill arose from the acquisition of a subsidiary, HimCem Holdings Limited, in 1999. HimCem is the majority owner of the Group’s operating company in Uganda, Hima Cement Limited.
During the current financial year, the Directors assessed the recoverable amount of goodwill and determined that the goodwill is not impaired. The recoverable amount of the cash generating units was assessed by reference to value in use.
GROUP COMPANY
2010 2009 2010 200922 INVENTORIES Shs’million Shs’million Shs’million Shs’million
Raw materials 485 624 384 498 Bio fuel supplies 281 208 281 208 Consumables and spare parts 1,515 1,944 986 1,409 Finished and semi-finished goods 884 945 473 725 Fuel and packaging 358 617 217 569
3,523 4,338 2,341 3,409
The Bio fuel supplies relate to direct operating costs incurred in respect to the on-going Bio-fuels project. These costs include those relating to labour, seedlings, transportation and other directly attributable overheads.
23 TRADE AND OTHER RECEIVABLES
(a) Analysis of trade and other receivables: GROUP COMPANY 2010 2009 2010 2009 Shs’million Shs’million Shs’million Shs’million
Trade receivables 301 435 50 62 Prepayments 711 1,095 596 813 Deposits 29 21 27 20 Other receivables 466 239 270 78 Receivables from related companies (Note 35 (ii)) 179 209 1,237 1,230
1,686 1,999 2,180 2,203
GROUP

64
2010 | BAMBURI CEMENT LIMITED - ANNUAL REPORT
Financial StatementsFor the year ended 31 December 2010
Notes to the Financial Statements
23 TRADE AND OTHER RECEIVABLES(Continued)
(b) Movement in the provision for insurance claim receivable: 2010 2009 Shs’million Shs’million
Balance at beginning of the year - 1,001 Amounts written off during the year as uncollectible - (783) Amounts recovered during the year - (218)
- -
(c) Trade receivables: The average credit period on sales of finished goods is 30 days. The bulk of the trade receivables are covered
by bank guarantees in favour of the Group. Before accepting any new customer, the Group uses a credit scoring system to assess the potential customer’s credit quality and defines credit limits by customer. Limits and scoring attributed to customers are reviewed quarterly.
The trade receivables are carried net of provision for bad and doubtful debts. The movement in the provision for bad and doubtful debts is as set out below:
GROUP COMPANY 2010 2009 2010 2009 Shs’million Shs’million Shs’million Shs’million
At beginning of year 362 358 242 223 Impairment losses (255) 36 (212) 33 Amounts recovered (27) (32) (20) (14)
At end of year 80 362 10 242
In determining the recoverability of a trade receivable, the Group considers any change in the credit quality of
the trade receivable from the date credit was initially granted up to the reporting date.
GROUP AND COMPANY

65
2010 | BAMBURI CEMENT LIMITED - ANNUAL REPORT
Financial StatementsFor the year ended 31 December 2010
Notes to the Financial Statements
24 CASH FLOW HEDGE CONTRACTS GROUP COMPANY 2010 2009 2010 2009 Shs’million Shs’million Shs’million Shs’million
Derivatives designated and effective as hedging instruments 28 - 19 -
The Group has entered into cash flow hedge contracts with its holding company Lafarge SA. The contracts have different maturity dates ranging upto 12 months from the end of the reporting period.
25 BANK AND CASH BALANCES (a) Analysis of bank and cash balances: GROUP COMPANY 2010 2009 2010 2009 Shs’million Shs’million Shs’million Shs’million
Cash at bank and on hand 1,272 1,037 896 629 Cash deposits with related party (note 35(ii)) 6,077 5,036 6,077 5,036 Short term bank deposits – Held to maturity 267 354 242 200
7,616 6,427 7,215 5,865
(b) Cash and cash equivalents:
For the purposes of the cash flow statement, cash and cash equivalents comprise balances with less than three months’ maturity from the date of acquisition, including cash in hand, deposits held at call with banks and other short term highly liquid investments with original maturities of three months or less, net of bank overdrafts. Analysis of cash and cash equivalents is as set out below:
GROUP COMPANY 2010 2009 2010 2009 Shs’million Shs’million Shs’million Shs’million
Bank and cash balances (note 25(a)) 7,616 6,427 7,215 5,865
(c) Cash deposit with related party:
The short-term bank deposits mature within 90 days from the date of placement.
GROUP COMPANY 2010 2009 2010 2009 Shs’million Shs’million Shs’million Shs’million
Short term fixed deposits 2,674 354 2,424 200
The weighted average interest rates earned on the short-term bank deposits during the year were as shown below:
GROUP COMPANY 2010 2009 2010 2009 Local currencies 2.5% 5.66% 3.14% 4.61% Foreign currencies 0.26% 0.59% 0.41% 0.40%

66
2010 | BAMBURI CEMENT LIMITED - ANNUAL REPORT
Financial StatementsFor the year ended 31 December 2010
Notes to the Financial Statements
GROUP COMPANY 2010 2009 2010 2009 Shs’million Shs’million Shs’million Shs’million
Local currencies 3.13% 3.43% 3.13% 3.43% Foreign currencies 0.24% 0.66% 0.24% 0.72%
26 SHARE CAPITAL 2010 2009 Shs’million Shs’million
Authorised 366,600,000 ordinary shares of Shs 5 each 1,833 1,833 100,000, 7% redeemable cumulative preference shares of Shs 20 each 2 2
1,835 1,835
Issued and fully paid 362,959,275 ordinary shares of Shs 5 each 1,815 1,815 Fully paid ordinary shares, which have a par value of Shs 5 each, carry a right of one vote per share and have rights
to dividends.
27 RESERVES
a. Revaluation reserve
The revaluation reserve arises on the revaluation of property, plant and equipment. When revalued and assets are sold, the portion of the revaluation reserve that relates to those assets are effectively realised and transferred directly to retained earnings. The revaluation reserve is not distributable.
b. Fair value reserve
The fair value reserve represents accumulated gains and losses arising on the revaluation of available- for-sale financial assets that have been recognised in other comprehensive income, net of amounts reclassified to profit or loss when those assets have been disposed of or are determined to be impaired.
2010 2009 Shs’million Shs’million
At 1 January 703 1,840 Net gain arising on revaluation of available for sale investments (note 20(b)) 5 60 Cumulative gain reclassified to profit or loss on sale of available for sale investments (note 20(c)) - (1,197)
At 31 December 708 703
GROUP AND COMPANY
GROUP AND COMPANY
(d) Cash deposit with related party
The weighted average interest rates earned on the cash deposited with related party during the year were as shown below:

67
2010 | BAMBURI CEMENT LIMITED - ANNUAL REPORT
Financial StatementsFor the year ended 31 December 2010
Notes to the Financial Statements
27 RESERVES (Continued)
c. Translation reserve
Exchange differences relating to the translation of the net assets of the Group’s foreign operations from their functional currency to the Group’s presentation currency (Kenya shillings) are recognised directly in other comprehensive income and accumulated in the foreign currency translation reserve. Exchange differences previously accumulated in the foreign currency translation reserve are reclassified to profit or loss on the disposal or partial disposal of the foreign operation.
d. Cash flow hedging reserve
The cash flow hedging reserve represents the cumulative effective portion of gains or losses arising on changes in fair value of hedging instruments entered into for cash flow hedges. The cumulative gain or loss arising on changes in fair value of the hedging instruments that are recognised and accumulated under the heading of cash flow hedging reserve will be reclassified to profit or loss only when the hedged transaction affects the profit or loss, or included as a basis adjustment to the non-financial hedged item, consistent with the relevant accounting policy.
28 DEFERRED TAX LIABILITY
Deferred taxes are calculated on all temporary differences under the liability method using a principal tax rate of 30% (2009: 30%). The makeup of the deferred tax liabilities at the year end and the movement on the deferred tax account during the year are as presented below:
GROUP COMPANY 2010 2009 2010 2009 Shs’million Shs’million Shs’million Shs’million
Accelerated capital allowances on property, plant and equipment 3,162 1,822 1,132 1,233 Foreign exchange differences (19) (10) (8) (16) Provisions (280) (404) (217) (333) Revaluation surplus 931 1,041 800 878 Tax Losses (1,174) - - - Other temporary differences - (4) - - 2,620 2,445 1,707 1,762
The movement on the deferred tax account during the year is as follows: GROUP COMPANY 2010 2009 2010 2009 Shs’million Shs’million Shs’million Shs’million
At beginning of year 2,445 2,222 1,762 1,712 Income statement charge (note11 (a)) 338 506 (4) 347 Prior years over provision (note11 (a)) (62) (303) (51) (297) Foreign exchange differences (101) 20 - -
At end of year 2,620 2,445 1,707 1,762 Deferred tax liabilities amounting to Shs 85 million (2009: Shs 86 million) in respect of the Group and Shs 78 million
(2009: Shs 79 million) in respect of the company has been transferred within shareholders’ equity from retained earnings to revaluation reserves. This represents deferred tax on the difference between the actual depreciation charge on the property, plant and equipment and the equivalent depreciation charge based on the historical cost of the property, plant and equipment.

68
2010 | BAMBURI CEMENT LIMITED - ANNUAL REPORT
Restructuring, Service site restoration gratuity and Long service 2010 2009 and litigation holiday pay awards Total Total Shs’million Shs’million Shs’million Shs’million Shs’million
GROUP At beginning of year 62 628 93 783 631 Additional provisions 3 89 11 103 266 Utilised during the year (1) (82) (13) (96) (114)
At end of year 64 635 91 790 783 Less: current portion (57) (204) - (261) (202)
Non current portion 7 431 91 529 581
COMPANY
At beginning of year 56 500 93 649 577 Additional provisions 2 57 10 69 165 Utilised during the year (1) (44) (13) (58) (93)
At end of year 57 513 90 660 649 Less: Current portion (57) (90) - (147) (149)
Non-current portion - 423 90 513 500
The provision for service gratuity, annual leave and long service awards represent entitlements that accrue as a result of services offered by employees.
The provision for restructuring, site restoration and litigation relate to future outflows that will be required to settle related liabilities or finalise the ongoing restructuring activities of the Group, including termination benefits.
Financial StatementsFor the year ended 31 December 2010
Notes to the Financial Statements
29 PROVISIONS FOR LIABILITIES AND CHARGES

69
2010 | BAMBURI CEMENT LIMITED - ANNUAL REPORT
Financial StatementsFor the year ended 31 December 2010
Notes to the Financial Statements
30 TRADE AND OTHER PAYABLES GROUP COMPANY 2010 2009 2010 2009 Shs’million Shs’million Shs’million Shs’million Trade payables 3,257 2,179 1,448 1,182 Accrued expenses 1,517 1,650 1,319 1,632 Other payables 337 63 330 56 Payable to related companies (Note 35 (ii)) 104 94 44 31
5,215 3,986 3,141 2,901
The average credit period on purchases is 34 days. The Group has financial risk management policies in place to ensure that all payables are paid within the credit timeframe.
31 BORROWINGS
a) Loan from ultimate holding company - unsecured
During the year, Lafarge SA, the ultimate holding company, did not extend any loans to the company nor its subsidiary, Hima Cement Limited. The loan balances are as shown below.
GROUP COMPANY 2010 2009 2010 2009 Shs’million Shs’million Shs’million Shs’million
At beginning of year 3,332 4,512 - 1,104 Loans received - - - - Foreign exchange differences (298) (76) - - Repayments (3,034) (1,104) - (1,104)
At end of year - 3,332 - -
Maturity: Repayable within one year - 370 - - Repayable after one year - 2,962 - -
At end of year - 3,332 - -
b) Term Loan In June 2008, Hima Cement Limited, a subsidiary company, signed a syndicated loan facility equivalent to Shs 1,789
million (Ugx 45 billion) with lead arranger Stanbic Bank Uganda Limited, During the year, Hima Cement Limited drew Shs 1,225 million (2009: 239 million) from the facility to finance the ongoing Ruwenzori capacity expansion project. The loan is secured against a corporate guarantee from Lafarge SA and is payable in 5 equal installments starting June 2011 and fully matures in June 2015. The facility is structured in two tranche’s of 50% each. Tranche A is at fixed interest rate equivalent to 5 year treasury bond plus 70 basis points while Tranche B is at floating interest rate equivalent to 182day treasury bill plus 100 basis points.
In October 2010, Hima Cement Ltd signed a one year revolving credit facility equivalent to Shs 1,569 million (Ugx
45.5 billion) with Stanbic Bank Uganda Limited. During the year, Hima Cement Limited drew Shs 1,569 million (Ugx 45.5 billion) to finance Ruwenzori capacity expansion project. This loan is secured against a corporate guarantee from Lafarge SA and is payable in full in October 2011. Interest on the facility is charged at 2.5% per annum above the 364 day treasury bill yield re-priced semi-annually.

70
2010 | BAMBURI CEMENT LIMITED - ANNUAL REPORT
GROUP
Financial StatementsFor the year ended 31 December 2010
Notes to the Financial Statements
31 BORROWINGS (Continued)
c) Effective interest rates The weighted average interest rates incurred on borrowing facilities during the year were:
GROUP COMPANY 2010 2009 2010 2009 Local currencies – loans 8.94% 14.98% - - Foreign currencies – ultimate holding company - 4.66% - 2.86%
d) Borrowing facilities
As at end of the year, the Group had borrowing facilities amounting to a total of Shs 3,280 million (2009 – Shs 4,332 million), out of which the undrawn facilities amounted to Shs 2,630 million (2009 – Shs 2,766 million).
The borrowing facilities are annual facilities that were subject to review at various dates during the year 2010. They consist of overdrafts, letters of credit, guarantees among others.
32 CONTINGENT LIABILITIES GROUP COMPANY 2010 2009 2010 2009 Shs’million Shs’million Shs’million Shs’million Bonds issued by the Group’s bankers in favour of Kenya Revenue Authority 563 1,030 563 1,030
Bonds issued by the Group’s bankers in favour of suppliers 456 241 221 113
Insurance bond issued to Uganda Revenue Authority - 10 - -
At end of year 1,019 1,281 784 1,143
Guarantees The guarantees and bonds are issued by the Group’s bankers in favour of third parties and the Group has entered
into counter-indemnities with the same banks. These guarantees are part of the bank facilities disclosed in note 31 above and are issued in the normal course of business.
Legal matters The Group is involved in a number of legal proceedings which are yet to be concluded upon. The Directors have
evaluated the pending cases and determined that no material liabilities are likely to arise from these cases which arose in the normal course of business.
Taxation matters The Group is regularly subject to an evaluation, by the taxation authorities, of its direct and indirect taxation affairs
and in connection with such reviews, tax assessments can be issued by the taxation authorities in respect of the Group’s taxation affairs.
2010 2009 Shs’million Shs’million At 1 January 239 - Received during the year 2,872 239 Foreign Exchange difference (158) - At 31 December 2,953 239

71
2010 | BAMBURI CEMENT LIMITED - ANNUAL REPORT
GROUP
Financial StatementsFor the year ended 31 December 2010
Notes to the Financial Statements
33 CAPITAL COMMITMENTS
Authorised and contracted
Capital expenditure contracted for at the reporting period end but not recognised in the financial statements is as follows:
GROUP COMPANY 2010 2010 2010 2009 Shs’million Shs’million Shs’million Shs’million Commitments for the acquisition of property, plant and equipment 1,091 1,095 25 100
Capital commitments include a contract with CBMI Construction Company Limited for the construction of an integrated cement plant in Kasese, Uganda. The construction was completed in 2010. The contract currency is US dollars.
Authorised but not contracted
Capital expenditure authorised but not contracted for at the reporting period end:
GROUP COMPANY 2010 2009 2010 2009 Shs’million Shs’million Shs’million Shs’million Commitments for the acquisition of property, plant and equipment 163 339 86 71
34 CASH GENERATED FROM OPERATIONS
Reconciliation of profit before taxation to cash generated from operations:
Note 2010 2009 Shs’million Shs’million
Profit before taxation 7,564 9,596
Adjustments for: Depreciation 15(a) 983 810 Amortisation of intangible assets 17 29 26 Amortisation of leasehold land 3 - Gain on disposal of property, plant and equipment 6 (5) (2) Loss on impairment of property, plant and equipment 18 - 11 Profit on disposal of equity investments 20(c) - (1,203) Interest income 5 (128) (85) Dividend income 5 (15) (18) Interest expense 9 91 14 Operating profit before working capital changes 8,522 9,149
Changes in working capital balances: Decrease in inventories 681 659 Decrease in trade and other receivables 132 268 Increase in financial assets (28) - Increase in provisions for liabilities and charges 30 122 Increase in trade and other payables 1,612 425 Cash generated from operations 10,949 10,623

72
2010 | BAMBURI CEMENT LIMITED - ANNUAL REPORT
Financial StatementsFor the year ended 31 December 2010
Notes to the Financial Statements
GROUP
35 RELATED PARTIES
The ultimate parent of the Group is Lafarge SA, incorporated in France. There are other companies which are related to Bamburi Cement Limited through common shareholdings or common directorships.
(i) Related party transactions
In the normal course of business, the Group sells cement to an associate of its ultimate shareholder. During the year, the group did not sell cement to the associate (2009: Nil).
The company receives technical assistance from the majority shareholder, which is paid for under a five year agreement.
The following transactions were carried out with related parties during the year.
2010 2009 Shs’million Shs’million
Interest received 79 1 Sales of goods and services 782 555 Purchases of goods and services 1,925 5,698
Transactions with related parties were made on terms and conditions similar to those offered to major customers or available from major suppliers.

73
2010 | BAMBURI CEMENT LIMITED - ANNUAL REPORT
Financial StatementsFor the year ended 31 December 2010
Notes to the Financial Statements
GROUP
35 RELATED PARTIES (Continued)
(ii) Outstanding balances arising from sale and purchase of goods and services to/from related companies at the year end.
GROUP COMPANY 2010 2009 2010 2009 Shs’million Shs’million Shs’million Shs’million Receivables from related parties 179 209 179 209 Receivables from subsidiaries - - 1,058 1,021
Total receivables (note 23(a)) 179 209 1,237 1,230
Payables to related parties (note 30) 104 94 44 31
Short term cash deposits (note 25(a)) 6,077 5,036 6,077 5,036
Cash flow hedges (note 24) 28 - 19 -
The short term deposits represent amounts held in investment accounts with the principal shareholder, Lafarge SA’s,
central treasury department on terms similar to those offered by unrelated financial institutions.
(iii) Loan to subsidiary
As at the end of the year, the balance due to the company in respect of a loan to its subsidiary, Bamburi Special Products Limited, amounted to Shs 286 Million (2009 - Shs Nil ). The loan was unsecured and the related effective interest on the loan was 10% (2009 - Nil). The loan repayment period is 10 years from January 2011.
(iv) Key management compensation
The remuneration of Directors and members of key management during the year were as follows:
2010 2009 Shs’million Shs’million
Fees for services as a director 4 5
Other emoluments Salaries and other short-term employment benefits 126 107 Post-employment benefits 8 8 Other long-term benefits - - Termination Benefits - - Share based Payment - -
134 115
Total 138 120
Guaranteed Long-term Loans 18 14

74
2010 | BAMBURI CEMENT LIMITED - ANNUAL REPORT
Financial StatementsFor the year ended 31 December 2010
Notes to the Financial Statements
36 OPERATING LEASE COMMITMENTS 2010 2009 Shs’million Shs’million
Lease payments committed under operating leases:
Not later than 1 year 175 41 Later than 1 year but not later than 5 years 167 139
342 180
37 RETIREMENT BENEFITS SCHEME
The Group operates a defined contribution retirement benefit plans for eligible employees. The assets of the plans are held separately from those of the Group in funds under the control of trustees. The scheme is administered by an independent administration company and is funded by contributions from the Group companies and employees. The Group’s obligations to the staff retirement benefits plans are charged to the income statement as they fall due or in the case of service gratuity as they accrue to each employee.
The Group also makes contributions to the statutory defined contribution schemes in the two countries where operations are based. The only obligation of the Group with respect to the retirement benefit plan is to make the specified contributions.
The total expense recognised in the income statement of Shs 85 million (2009: Shs 95 million) represents contributions payable to these plans by the Group at rates specified in the rules of the plans. The expense has been included within the retirement benefits costs under staff costs in note 10.
38 FINANCIAL RISK MANAGEMENT
Introduction and overview
The Group’s activities expose it to a variety of financial risks and those activities involve the analysis, evaluation, acceptance and management of some degree of risk or combination of risks. Taking risk is core to the group’s business and the operational risks are an inevitable consequence of being in business. The Group’s aim is therefore to achieve an appropriate balance between risk and return and minimise potential adverse effects on its financial performance. The key types of risks include:
Market risk – includes currency, interest rate and other price risk Credit risk Liquidity risk
The Group’s overall risk management programme focuses on the unpredictability of changes in the business environment and seeks to minimise potential adverse effects of such risks on its financial performance within the options available in Kenya and Uganda by setting acceptable levels of risks.
GROUP

75
2010 | BAMBURI CEMENT LIMITED - ANNUAL REPORT
Financial StatementsFor the year ended 31 December 2010
Notes to the Financial Statements
38 FINANCIAL RISK MANAGEMENT (Continued)
Risk Management Framework
Financial risk management is carried out by Corporate Finance Department under policies approved by the Board of Directors.
The Group’s Corporate Treasury function identifies, evaluates and hedges financial risks in close cooperation with operating units. The board provides written principals for overall risk management, as well as written policies covering specific areas such as credit risk, liquidity risk, foreign exchange risk, interest rate risk, price risk, use of derivative and non derivative financial instruments.
The Group seeks to minimize the effects of these risks by using derivative financial instruments to hedge these risk exposures. The use of financial derivatives is governed by the ultimate parent’s policies approved by the Board of Directors.
The Group does not enter into or trade in financial instruments, including derivative financial instruments, for speculative purposes.
The Corporate Treasury function reports quarterly to the Lafarge SA risk management committee, an independent body that monitors risks and policies implemented to mitigate risk exposures.
The board has put in place an internal audit function to assist it in assessing the risk faced by the group on an ongoing basis, evaluate and test the design and effectiveness of its internal accounting and operational controls.
(i) Market risks
Market risk is the risk arising from changes in market prices, such as interest rate, equity prices and foreign exchange rates which will affect the Group’s income or the value of its holding of financial instruments. The objective of market risk management is to manage and control market risk exposures within acceptable parameters, while optimising the return. Overall responsibility for managing market risk rests with the Group Finance Director. The Group’s Finance Department is responsible for the development of detailed risk management policies (subject to review and approval by Group Finance Director) and for the day to day implementation of those policies.
There has been no change to the Group’s exposure to market risks or the manner in which it manages and measures the risk.
a) Foreign currency risk management
The Group undertakes certain transactions denominated in foreign currencies. Therefore, exposures to exchange rate fluctuations arise. Exchange rate exposures are managed within approved policy parameters utilizing forward foreign exchange contracts.
The carrying amounts of the Group’s foreign currency denominated monetary assets and liabilities at the end of the reporting period are as follows:

76
2010 | BAMBURI CEMENT LIMITED - ANNUAL REPORT
Financial StatementsFor the year ended 31 December 2010
Notes to the Financial Statements
38 FINANCIAL RISK MANAGEMENT (Continued)
(i) Market risks (Continued) a) Foreign currency risk management (Continued)
Group foreign currency risk:
EUR USD TOTAL Shs’million Shs’million Shs’million 31 December 2010: Assets Trade and other receivables - 938 938 Bank balances 543 3,040 3,583
Total assets 543 3,978 4,521
Liabilities Trade and other payables 131 2,505 2,636
Total liabilities 131 2,505 2,636
Net exposure position 412 1,473 1,885
31 December 2009:
Assets Trade and other receivables 539 712 1,251 Bank balances 371 1,917 2,288
Total assets 910 2,629 3,539
Liabilities Trade and other payables 124 2,079 2,203 Loan from ultimate holding company - 3,332 3,332
Total liabilities 124 5,411 5,535
Net exposure position 786 (2,782) (1,996)

77
2010 | BAMBURI CEMENT LIMITED - ANNUAL REPORT
Financial StatementsFor the year ended 31 December 2010
Notes to the Financial Statements
38 FINANCIAL RISK MANAGEMENT (Continued)
(i) Market risks (Continued) a) Foreign currency risk management (Continued)
Company foreign currency risk: EUR USD TOTAL Shs’million Shs’million Shs’million
31 December 2010
Assets Trade and other receivables - 938 938 Bank balances 443 2,951 3,394
Total assets 443 3,889 4,332
Liabilities Trade and other payables 48 675 723
Total liabilities 48 675 723
Net exposure position 395 3,212 3,609
31 December 2009:
Assets Trade and other receivables 539 712 1,251 Bank balances 334 1,680 2,014
Total assets 873 2,392 3,265
Liabilities Trade and other payables - 1,107 1,107
Total liabilities - 1,107 1,107
Net exposure position 873 1,285 2,158

78
2010 | BAMBURI CEMENT LIMITED - ANNUAL REPORT
Financial StatementsFor the year ended 31 December 2010
Notes to the Financial Statements
38 FINANCIAL RISK MANAGEMENT (Continued)
(i) Market risks (Continued)
a) Foreign currency risk management (Continued)
Foreign currency sensitivity analysis
The following sensitivity analysis shows how profit and equity would change if the Kenya Shilling had depreciated against the other currencies by 5% on the reporting period end with all other variables held constant. The reverse would also occur if the Kenya Shilling appreciated with all other variables held constant. This is mainly attributable to the change in value of foreign exchange receivables, payables and cash.
2010 2009 Shs’million Shs’million Group EUR 21 39 USD 72 27
93 66
Company EUR 64 44 USD 159 64
223 108
b) Interest rate risk
The Group is exposed to interest rate risk as entities in the Group borrow funds at both fixed and floating interest rates in the form of long term loans and short term loans (overdrafts). The Group also holds cash deposits with financial institutions. The interest rates on the cash deposits are fixed and agreed upon in advance.
Management closely monitors the interest rate trends to minimise the potential adverse impacts of interest rate changes. Deposits are placed at fixed interest rates and management is therefore able to plan for the resulting income. For the facilities with variable rates, the Group is in regular contact with the lenders in a bid to obtain the best available rates.
During the year, a 5% increase/decrease of the annual interest rate would have resulted in an increase/decrease in pre-tax profit of Shs 93 million (2009- Shs 66 million).
c) Price risk
Quoted assets are valued at their market prices. These values are subject to frequent variations and adverse market movements. This risk is mitigated by the fact that equity investments are held for strategic rather than trading purposes. The Group does not actively trade on equity investments.
At 31 December 2010, if the prices at the Nairobi Stock Exchange had appreciated/depreciated by 5% with all other variables held constant would have resulted in an increase/ decrease on other comprehensive income of Shs 46 million (2009 Shs 45 million) as a result of changes in fair value of available for sale shares.
GROUP

79
2010 | BAMBURI CEMENT LIMITED - ANNUAL REPORT
Notes to the Financial Statements
38 FINANCIAL RISK MANAGEMENT (Continued)
(ii) Credit risk management
Credit risk refers to the risk that a counter party will default on its contractual obligations resulting in financial loss to the Group. The Group has adopted a policy of only dealing with creditworthy counterparties and obtaining sufficient collateral, where appropriate, as a means of mitigating the risk of financial loss from defaults. The Group’s exposure and the credit rating of its counterparties are continuously monitored and the aggregate value of transactions concluded is spread amongst approved counterparties. Credit exposure is controlled by counterparty limits that are reviewed and approved by the management annually.
The credit risk exposures are classified in three categories:
Fully performing Past due Impaired
Maximum exposure to credit risk before collateral held or other credit enhancements
The carrying amount of financial assets recorded in the financial statements representing the Group’s maximum exposure to credit risk without taking account of the value of any collateral obtained is made up as follows:
GROUP COMPANY 2010 2009 2010 2009 Shs’million Shs’million Shs’million Shs’million
Trade receivables 301 435 50 62 Other receivables 1,385 1,564 2,130 2,141
1,686 1,999 2,180 2,203
Bank balances 7,616 6,427 7,215 5,865 Trade receivables consist of a large number of customers, spread across diverse industries and geographical areas. On
an ongoing basis, a credit evaluation is performed on the financial condition of accounts receivable. The credit risk on liquid funds is limited because the counterparties are banks with high credit-ratings assigned by international credit-rating agencies.
The Group does not have any significant credit risk exposure to any single counterparty or any Group of counterparties having similar characteristics. The Group defines counterparties as having similar characteristics if they are related entities. Concentration of credit risk did not exceed 5% of gross monetary assets at any time during the year.
Financial StatementsFor the year ended 31 December 2010

80
2010 | BAMBURI CEMENT LIMITED - ANNUAL REPORT
38 FINANCIAL RISK MANAGEMENT (Continued)
(ii) Credit risk management (Continued)
Analysis of Group credit exposure:
Gross Impairment Net Gross Impairment Net 2010 2010 2010 2009 2009 2009 Shs’million Shs’million Shs’million Shs’million Shs’million Shs’million Fully performing 1,274 - 1,274 1,950 - 1,950 Past due 526 114 412 814 765 49
Trade and other receivables (note 23(a)) 1,800 114 1,686 2,764 765 1,999
Included in the impairment provision is an amount of Shs Nil (2009 – Shs 403 million) relating to other receivables.
Analysis of company credit risk:
Gross Impairment Net Gross Impairment Net 2010 2010 2010 2009 2009 2009 Shs’million Shs’million Shs’million Shs’million Shs’million Shs’million
Fully performing 1,503 - 1,474 2,130 - 2,130 Past due 753 47 706 753 680 73
Trade and other receivables (note 23(a)) 2,256 47 2,180 2,883 680 2,203
Included in the impairment provision is an amount of Shs Nil (2009 – Shs 403 million) relating to other receivables.
Fully performing
The Group classifies financial assets under this category for those exposures that are upto date and in line with contractual agreements. These exposures will normally be maintained within approved product programs and with no signs of impairment or distress.
Past due but not impaired
The financial assets that are past due relate to trade receivables overdue by over 30 days. The receivables are not impaired and continue to be paid. The Group is actively following these receivables. No collateral is held with respect to the debt.
Impaired financial assets
Impaired financial assets are financial assets for which the Group determines that it is probable that it will be unable to collect all payments due according to the contractual terms of the agreement(s). No collateral is held with respect to the debt.
Financial StatementsFor the year ended 31 December 2010
Notes to the Financial Statements

81
2010 | BAMBURI CEMENT LIMITED - ANNUAL REPORT
Notes to the Financial Statements
38 FINANCIAL RISK MANAGEMENT (Continued)
(iii) Liquidity risk management
This is the risk that the group will encounter difficulties in meeting its financial commitments from its financial liabilities that are settled by delivering cash or another financial asset. Prudent liquidity risk management includes maintaining sufficient cash to meet company obligations.
Ultimate responsibility for liquidity risk management rests with the Board of Directors, which has developed and put in place an appropriate liquidity risk management framework for the management of the Group’s short, medium and long-term funding and liquidity management requirements. The Group manages liquidity risk by maintaining adequate reserves, banking facilities and reserve borrowing facilities, by continuously monitoring forecast and actual cash flows and matching the maturity profiles of financial assets and liabilities.
The following table analyses the Group’s remaining contractual maturity for its non-derivative financial liabilities with agreed repayment periods. The table has been drawn up based on the undiscounted cash flows of financial liabilities based on the earliest date on which the Group can be required to pay. The tables include both interest and principal cash flows and exclude the impact of netting agreements. The contractual maturity is based on the earliest date on which the Group may be required to pay.
Balances due within 12 months equal their carrying balances, as the impact of discounting is not significant.
GROUP – Financial liabilities: 120 days Total amount 0-30 days 31-90 days 91-120 days and above Shs’million Shs’million Shs’million Shs’million Shs’million
31 December 2010: Trade and other payables (note 30) 5,215 3,841 495 643 236 Unclaimed dividends 30 - - - 30 Loan from ultimate holding company 2,953 - - - 2,953
8,198 3,841 495 643 3,219
31 December 2009: Trade and other payables (note 30) 4,096 2,203 627 217 1,049 Unclaimed dividends 30 - - - 30 Loan from ultimate holding company 4,512 - - - 4,512
8,638 2,203 627 217 5,591
Financial StatementsFor the year ended 31 December 2010

82
2010 | BAMBURI CEMENT LIMITED - ANNUAL REPORT
Financial StatementsFor the year ended 31 December 2010
Notes to the Financial Statements
38 FINANCIAL RISK MANAGEMENT (Continued)
(iii) Liquidity risk management (Continued)
COMPANY – Financial liabilities: 120 days Total amount 0-30 days 31-90 days 91-120 days and above Shs’million Shs’million Shs’million Shs’million Shs’million
31 December 2010: Trade and other payables (note 30) 3,141 1,770 475 655 241 Unclaimed dividends 30 - - - 30
3,171 1,770 475 655 271
31 December 2009:
Trade and other payables (note 30) 3,364 845 1,173 289 1,057 Unclaimed dividends 30 - - - 30 Loan from ultimate holding company 1,104 - - - 1,104
4,498 845 1,173 289 2,191
(iv) Capital risk management
The Group’s objectives when managing capital are:
To ensure that entities in the Group will be able to continue as going concerns while maximizing the return to stakeholders through the optimization of the debt and equity balance.
To maintain a strong capital base to support the current and future development needs of the business.
The capital structure of the Group consists of debt, which includes borrowings, cash and cash equivalents and equity attributable to equity holders of the parent, comprising issued capital, reserves and retained earnings.
The Board of Directors reviews the capital structure on a regular basis. As part of this review, the board considers the cost of capital and the risks associated with each class of capital. Based on the review, the Group analyses and assesses the gearing ratio to determine the level and its optimality.
This ratio is calculated as net debt divided by total capital. Net debt is calculated as total borrowings less cash and cash equivalents.
There have been no material changes in the Group’s management of capital during the year.

83
2010 | BAMBURI CEMENT LIMITED - ANNUAL REPORT
Notes to the Financial Statements
38 FINANCIAL RISK MANAGEMENT (Continued)
(iv) Capital risk management (Continued)
The constitution of capital managed by the Group is as shown below:
GROUP COMPANY
2010 2009 2010 2009 Shs’million Shs’million Shs’million Shs’million
Equity 21,626 20,941 17,321 16,738
Total borrowings (2,953) (3,571) - - Less: cash and cash equivalents (note 25(b)) 7,616 6,427 7,215 5,865
Net debt 4,663 2,856 7,215 5,865
Gearing - - - -
(v) Fair value of financial assets and liabilities
The table below shows an analysis of financial instruments at fair value by level of the fair value hierarchy. The financial instruments are grouped into levels 1 to 3 based on the degree to which the fair value is observable.
i) Level 1 fair value measurements are those derived from quoted prices (unadjusted) in active markets for identical assets or liabilities;
ii) Level 2 fair value measurements are those derived from inputs other than quoted prices included within level 1 that are observable for the asset or liability, either directly (i.e. as a price) or indirectly (i.e. derived from prices);and
iii) Level 3 fair value measurements are those derived from valuation techniques that include inputs for the asset or liability that are not based on observable market data (unobservable inputs)
Financial StatementsFor the year ended 31 December 2010

84
2010 | BAMBURI CEMENT LIMITED - ANNUAL REPORT
Financial StatementsFor the year ended 31 December 2010
Notes to the Financial Statements
Note Level Level Level Total 1 2 3 Shs’million Shs’million Shs’million Shs’million GROUP AND COMPANY 31 December 2010 Available for sale financial assets Investment in quoted shares 20 911 - - 911 Cash flow hedge contracts 24 - 28 - 28
Total 911 28 - 939
31 December 2009 Available for sale financial assets Investment in quoted shares 20 906 - - 906
There were no transfers between levels 1, 2 and 3 in the period.
39 FAIR VALUE
The directors consider that there is no material difference between the fair value and carrying value of the company’s financial assets and liabilities where fair value details have not been presented.
40 COUNTRY OF INCORPORATION
The company is incorporated and domiciled in Kenya under the Companies Act. The ultimate parent of the Group is Lafarge SA, incorporated in France. The Group is primarily engaged in the manufacture and sale of cement and cement related products.
41 POST BALANCE SHEET EVENTS
On 7 January 2011, the High Court in Kampala, Uganda entered a judgement for Kampala International University in respect of a long outstanding case against Hima Cement Ltd for Shs 79 million (UGX 2.286 billion) plus costs. The Company has been granted a stay pending appeal on condition of provision of a bank guarantee for the sum of Shs 83 million (UGX 2.386 billion).
The Board of Directors approved the financial statements on 25 February 2011 and authorised that the financial statements be issued. On this date, the Directors were not aware of any matter or circumstances arising since the end of the financial year, not otherwise dealt with in the financial statements, which would significantly affect the financial position of the Group and results of its operation as laid out in these financial statements.
42 CURRENCY
The individual financial statements of each Group entity are presented in the currency of the primary economic environment in which the entity operates (its functional currency). For the purpose of the consolidated financial statements, the results and financial position of each entity are presented in Kenya Shillings million (Shs’ Million), which is the functional currency of the Group, and the presentation currency for the consolidated financial statements.
38 FINANCIAL RISK MANAGEMENT (Continued)

85
2010 | BAMBURI CEMENT LIMITED - ANNUAL REPORT
Shareholding
Top 10 Shareholders as at 31 December 2010
Share Analysis by Domicile as at 31 December 2010
Share Analysis by volume as at 31 December 2010
Financial StatementsFor the year ended 31 December 2010
Rank Name of Shareholder Shares %age
1 Fincem Holding Ltd 106,360,798 29.30%
2 Kencem Holding Limited 106,360,797 29.30%
3 Board of Trustees - National Social Security Fund 50,990,913 14.05%
4 Paramount Company Ltd 40,000,000 11.02%
5 Baloobhai Chhotabhai Patel 4,180,305 1.38%
6 Board of Trustees - National Social Security Fund 2,377,721 0.66%
7 Standard Chartered Nominees Ltd – A/c 9230 2,053,779 0.57%
8 Kenya Reinsurance Corporation Ltd 1,171,543 0.32%
9 Kenya Commercial Bank Nominees Ltd – A/c 769G 1,038,650 0.29%
10 Standard Chartered Nominees Ltd – A/c 9389 1,025,445 0.28%
DOMICILE NUMBER OF SHARES % NUMBER OF HOLDERS
Foreign Institutions 216,465,411 59.53% 37
Foreign Individuals 286,616 0.08% 46
Local Institutions 93,791,177 25.91% 642
Foreign Individuals 52,416,071 14.48% 2,304
TOTAL 362,959,275 100.00% 3,029
VOLUME NUMBER OF SHARES % NUMBER OF HOLDERS
1 - 500 240,231 0.07% 1,122
501 - 5,000 2,452,151 0.68% 1,199
5,001 - 10,000 1,703,954 0.47% 234
10,001 - 100,000 11,280,304 3.11% 360
100,001 - 1,000,000 30,901,999 8.51% 104
1,000,001 - 99999999999 316,380,636 87.17% 10
TOTAL 362,959,275 100.00% 3,029

86
2010 | BAMBURI CEMENT LIMITED - ANNUAL REPORT
NotesNotesNotes

87
2010 | BAMBURI CEMENT LIMITED - ANNUAL REPORT
Proxy FormThe SecretaryBamburi Cement LimitedCorporate OfficesKenya Re Tower, 6th FloorUpper Hill, Off Ragati RoadP. O. Box 10921, 00100NAIROBI, KENYA
I/WE --------------------------------------------------------------------------------------------------------------------------------------------------
--------------------------------------------------------------------------------------------------------------------------------------------------
of --------------------------------------------------------------------------------------------------------------------------------------------------
--------------------------------------------------------------------------------------------------------------------------------------------------
a member of BAMBURI CEMENT LIMITED hereby appoint
--------------------------------------------------------------------------------------------------------------------------------------------------
of --------------------------------------------------------------------------------------------------------------------------------------------------
or in his/her place THE CHAIRMAN OF THE MEETING as my/our proxy and/or representative to vote at his/her
discretion for me/us and on my/our behalf at the Annual General Meeting to be held on Thursday 9 June 2011
and at every adjournment thereof.
AS WITNESS my/our hand(s) this ___________________________day of ___________________________ 2011
(Usual Signature)
Proxy forms must reach the registered office of the company by 2.00 pm Tuesday 7 June 2011.

88
2010 | BAMBURI CEMENT LIMITED - ANNUAL REPORT
Staple here Staple here
Proxy form:for the year ended 31 December 2010
The SecretaryBamburi Cement Ltd. Corporate Offices6th floor, Kenya-Re Towers, Upper Hill, off Ragati RoadP. O. Box 10921, 00100NAIROBI, KENYA
Fold here
Affix Stamp
Fold here

Giraffes at Nguuni Nature Sanctuary - Mombasa

Bamburi Cement Limited Corporate Office,Nairobi 6th & 9th Floors, Kenya-Re Towers,
Mara Ragati Road, Upper Hill P. O. Box 10921 - 00100, Nairobi, Kenya
Tel: (+254 - 20) 2893000 / 2710487Fax: (+245 - 20) 2710581
www.bamburicement.com


