33
FINANCIAL STATEMENTS Fiscal years ended MAY 31, 2017 and 2016 (With Independent Auditor’s Report Thereon)
| Date post: | 03-Aug-2018 |
| Category: |
Documents |
| Upload: | nguyenliem |
| View: | 218 times |
| Download: | 0 times |

FINANCIAL STATEMENTS
Fiscal years ended MAY 31, 2017 and 2016
(With Independent Auditor’s Report Thereon)

Independent Auditor’s Report To the Board of Trustees University of Miami Coral Gables, Florida Report on the Financial Statements We have audited the accompanying financial statements of the University of Miami (the University), which comprise the statements of financial position as of May 31, 2017 and 2016, and the related statements of activities and cash flows for the years then ended, and the related notes to the financial statements. Management’s Responsibility for the Financial Statements Management is responsible for the preparation and fair presentation of these financial statements in accordance with accounting principles generally accepted in the United States of America; this includes the design, implementation and maintenance of internal control relevant to the preparation and fair presentation of financial statements that are free from material misstatement, whether due to fraud or error. Auditor’s Responsibility Our responsibility is to express an opinion on these financial statements based on our audits. We conducted our audits in accordance with auditing standards generally accepted in the United States of America. Those standards require that we plan and perform the audit to obtain reasonable assurance about whether the financial statements are free from material misstatement. An audit involves performing procedures to obtain audit evidence about the amounts and disclosures in the financial statements. The procedures selected depend on the auditor’s judgment, including the assessment of the risks of material misstatement of the financial statements, whether due to fraud or error. In making those risk assessments, the auditor considers internal control relevant to the entity’s preparation and fair presentation of the financial statements in order to design audit procedures that are appropriate in the circumstances, but not for the purpose of expressing an opinion on the effectiveness of the entity’s internal control. Accordingly, we express no such opinion. An audit also includes evaluating the appropriateness of accounting policies used and the reasonableness of significant accounting estimates made by management, as well as evaluating the overall presentation of the financial statements. We believe that the audit evidence we have obtained is sufficient and appropriate to provide a basis for our audit opinion. Opinion In our opinion, the financial statements referred to above present fairly, in all material respects, the financial position of the University of Miami as of May 31, 2017 and 2016, and the changes in its net assets and its cash flows for the years then ended in accordance with accounting principles generally accepted in the United States of America.
Fort Lauderdale, Florida August 29, 2017

Assets 2017 2016
Cash and cash equivalents 191.2$ 381.7$
Accounts and loans receivable, net 480.2 437.8
Contributions receivable, net 262.7 146.9
Other assets 88.1 77.3
Investments 1,125.1 994.4
Property and equipment, net 1,791.7 1,721.8
Trusts held by others 50.9 45.6
Total Assets 3,989.9$ 3,805.5$
Liabilities
Accounts payable and accrued expenses 240.5$ 221.9$
Deferred revenues and other deposits 101.8 101.5
Accrued pension and postretirement benefit costs 174.1 259.9
Other liabilities 226.4 189.9
Actuarial liability of annuities payable 6.7 7.1
Liability for medical self-insurance 85.6 109.5
Government advances for student loans 23.5 22.7
Bonds and notes payable 1,128.5 1,151.7
Total Liabilities 1,987.1 2,064.2
Net Assets
Unrestricted 827.9 779.3
Temporarily restricted 612.5 462.1
Permanently restricted 562.4 499.9
Total Net Assets 2,002.8 1,741.3
Total Liabilities and Net Assets 3,989.9$ 3,805.5$
2
UNIVERSITY OF MIAMI
( in millions )
See accompanying notes to financial statements.
May 31, 2017 and 2016STATEMENTS OF FINANCIAL POSITION
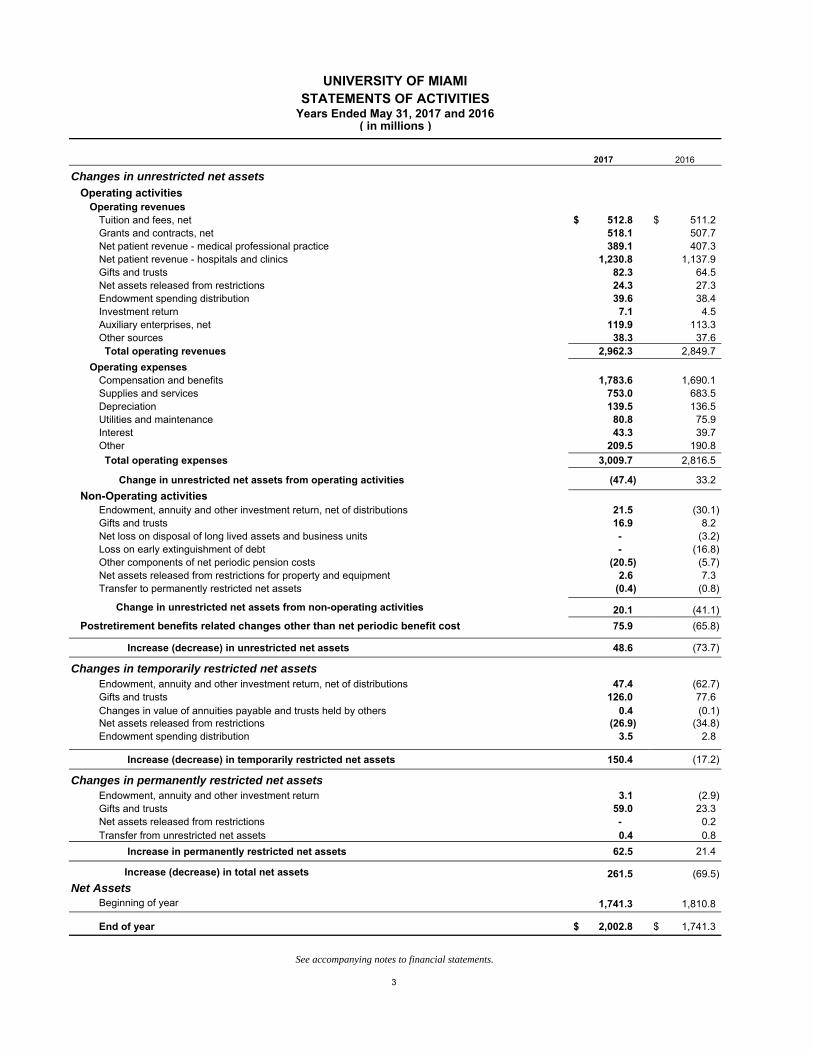
UNIVERSITY OF MIAMISTATEMENTS OF ACTIVITIES
2017 2016
Changes in unrestricted net assets
Operating activitiesOperating revenues
Tuition and fees, net 512.8$ 511.2$ Grants and contracts, net 518.1 507.7 Net patient revenue - medical professional practice 389.1 407.3 Net patient revenue - hospitals and clinics 1,230.8 1,137.9 Gifts and trusts 82.3 64.5 Net assets released from restrictions 24.3 27.3 Endowment spending distribution 39.6 38.4 Investment return 7.1 4.5 Auxiliary enterprises, net 119.9 113.3 Other sources 38.3 37.6 Total operating revenues 2,962.3 2,849.7
Operating expensesCompensation and benefits 1,783.6 1,690.1 Supplies and services 753.0 683.5 Depreciation 139.5 136.5 Utilities and maintenance 80.8 75.9 Interest 43.3 39.7 Other 209.5 190.8
Total operating expenses 3,009.7 2,816.5
Change in unrestricted net assets from operating activities (47.4) 33.2
Non-Operating activitiesEndowment, annuity and other investment return, net of distributions 21.5 (30.1) Gifts and trusts 16.9 8.2 Net loss on disposal of long lived assets and business units - (3.2) Loss on early extinguishment of debt - (16.8) Other components of net periodic pension costs (20.5) (5.7) Net assets released from restrictions for property and equipment 2.6 7.3 Transfer to permanently restricted net assets (0.4) (0.8)
Change in unrestricted net assets from non-operating activities 20.1 (41.1)
Postretirement benefits related changes other than net periodic benefit cost 75.9 (65.8)
Increase (decrease) in unrestricted net assets 48.6 (73.7)
Changes in temporarily restricted net assetsEndowment, annuity and other investment return, net of distributions 47.4 (62.7) Gifts and trusts 126.0 77.6 Changes in value of annuities payable and trusts held by others 0.4 (0.1) Net assets released from restrictions (26.9) (34.8) Endowment spending distribution 3.5 2.8
Increase (decrease) in temporarily restricted net assets 150.4 (17.2)
Changes in permanently restricted net assetsEndowment, annuity and other investment return 3.1 (2.9) Gifts and trusts 59.0 23.3 Net assets released from restrictions - 0.2 Transfer from unrestricted net assets 0.4 0.8
Increase in permanently restricted net assets 62.5 21.4
Increase (decrease) in total net assets 261.5 (69.5)
Net AssetsBeginning of year 1,741.3 1,810.8
End of year 2,002.8$ 1,741.3$
3
Years Ended May 31, 2017 and 2016
See accompanying notes to financial statements.
( in millions )

UNIVERSITY OF MIAMI
STATEMENTS OF CASH FLOWS
May 31, 2017 and 2016 ( in millions )
2017 2016
Cash flows from operating activities
Increase (decrease) in total net assets 261.5$ (69.5)$
Adjustments to reconcile (decrease) increase in total net assets to net cash provided by operating activities
Net realized and unrealized (gains) losses on investments and other assets (104.6) 67.5
Gifts for plant expansion and endowment (164.1) (87.1)
Depreciation 139.5 136.5
Provision for doubtful accounts 72.3 101.4
Net loss (gain) on sale and/or disposal of other assets and property and equipment 2.0 2.3
Present value adjustment on annuities payable and trusts held by others (.2) .3
Amortization of debt premiums, discounts and issue costs (2.0) (2.6)
Loss on early extinguishment of debt - 16.7
Other components of net periodic pension costs (75.9) 65.8
Change in operating assets and liabilities
Decrease (increase) in
Accounts and loans receivable, net (117.8) (131.9)
Contributions receivable, net 22.7 24.2
Other assets (10.7) (10.7)
Increase (decrease) in
Accounts payable and accrued expenses 29.3 (5.6)
Deferred revenues, annuities payable and other liabilities 34.9 0.3 Accrued pension and postretirement benefit costs (9.9) (23.5)
Medical self-insurance (23.9) 12.3
Government advances for student loans .8 (.5)
Net cash provided by operating activities 53.9 95.9
Cash flows from investing activitiesPurchases of investments (786.5) (198.2)
Proceeds from the sales and maturities of investments and sales of property and equipment 767.6 279.3
Capital expenditures for property and equipment (219.8) (194.5)
Student and shared appreciation mortgage loans:
New loans made (0.2) (5.5)
Principal collected 3.3 8.9
Net cash used in investing activities (235.6) (110.0)
Cash flows from financing activitiesGifts for plant expansion and endowment 12.4 67.7
Proceeds from the issuance of debt - 823.4
Payments to retire bonds and notes payable (21.2) (625.6)
Net cash (used in) provided by financing activities (8.8) 265.5
Cash and cash equivalents
Net (decrease) increase (190.5) 251.4
Beginning of year 381.7 130.3
End of year 191.2$ 381.7$
4
See accompanying notes to financial statements.

UNIVERSITY OF MIAMI NOTES TO FINANCIAL STATEMENTS
May 31, 2017 and 2016
5
1. ORGANIZATION
The University of Miami (the University) is a private not-for-profit institution located in South Florida. Founded in 1925, the University owns and operates educational and research facilities as well as a health care system. Its mission is to educate and nurture students, to create knowledge through innovative research programs, to provide service to our community and beyond, and to pursue excellence in health care. These financial statements include the accounts of the University’s departments and facilities, including its hospitals and clinics. All significant intercompany accounts and transactions have been eliminated in the preparation of these statements.
2. SUMMARY OF SIGNIFICANT ACCOUNTING POLICIES AND REPORTING PRACTICES
Basis of Presentation The financial statements of the University have been prepared on the accrual basis of accounting and in conformity with accounting principles generally accepted in the United States of America (U.S. GAAP) for not-for-profit organizations. The three net asset categories as reflected in the accompanying financial statements are as follows:
Unrestricted - Net assets which are free of donor-imposed restrictions. It includes the University’s investment in property and equipment and amounts designated by management for support of operations, programs, and facilities expansion. The University has determined that any donor-imposed restrictions for current or developing programs and activities are generally met within the operating cycle of the University and, therefore, the University’s policy is to record these net assets as unrestricted. This category includes all revenues, expenses, gains and losses that are not changes in permanently or temporarily restricted net assets.
Temporarily Restricted - Net assets whose use by the University is limited by donor-imposed stipulations
that either expire with the passage of time or that can be fulfilled or removed by actions of the University pursuant to those stipulations. These net assets are available for program purposes, i.e., education, research, public service, and scholarships, as well as for buildings and equipment.
Permanently Restricted - Net assets whose use by the University is limited by donor-imposed stipulations that neither expire with the passage of time nor can be fulfilled or otherwise removed by actions of the University. These net assets are invested in perpetuity, the income from which is expended for program purposes, i.e., education, research, public service, and scholarships.
Use of Estimates The preparation of the financial statements in conformity with U.S. GAAP requires that management make estimates and assumptions that affect the reported amounts of assets, liabilities, revenues, and expenses during the reporting period as well as the disclosure of contingent assets and liabilities. Actual results could differ from those estimates. Income Taxes The University is exempt from federal income taxes under Section 501(c) (3) of the Internal Revenue Code, except for unrelated business income tax which is insignificant. Accordingly, no provision for income taxes is made in the financial statements. At May 31, 2017, there were no uncertain tax positions. The University files tax returns with U.S. federal and other tax authorities for which generally the statute of limitations may go back to the year ended May 31, 2014. Cash Equivalents All highly liquid investments with a maturity of three months or less when purchased are considered to be cash equivalents. At May 31, 2017 and 2016, cash equivalents included $29.0 and $126.6 million, respectively of amounts held in escrow that are restricted by the 2015A and 2015B bonds for certain project costs (see note 10).
UNIVERSITY OF MIAMI NOTES TO FINANCIAL STATEMENTS
May 31, 2017 and 2016
6
2. SUMMARY OF SIGNIFICANT ACCOUNTING POLICIES AND REPORTING PRACTICES
(Continued)
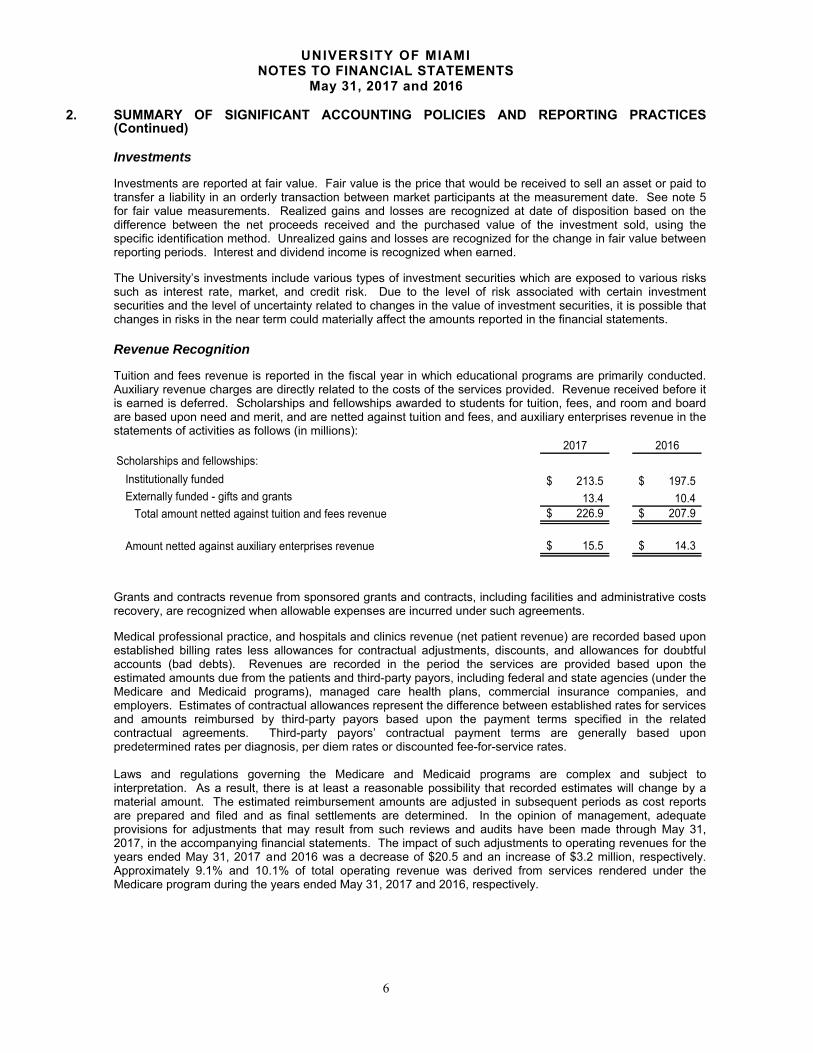
Investments Investments are reported at fair value. Fair value is the price that would be received to sell an asset or paid to transfer a liability in an orderly transaction between market participants at the measurement date. See note 5 for fair value measurements. Realized gains and losses are recognized at date of disposition based on the difference between the net proceeds received and the purchased value of the investment sold, using the specific identification method. Unrealized gains and losses are recognized for the change in fair value between reporting periods. Interest and dividend income is recognized when earned.
The University’s investments include various types of investment securities which are exposed to various risks such as interest rate, market, and credit risk. Due to the level of risk associated with certain investment securities and the level of uncertainty related to changes in the value of investment securities, it is possible that changes in risks in the near term could materially affect the amounts reported in the financial statements.
Revenue Recognition
Tuition and fees revenue is reported in the fiscal year in which educational programs are primarily conducted. Auxiliary revenue charges are directly related to the costs of the services provided. Revenue received before it is earned is deferred. Scholarships and fellowships awarded to students for tuition, fees, and room and board are based upon need and merit, and are netted against tuition and fees, and auxiliary enterprises revenue in the statements of activities as follows (in millions):
2017 2016Scholarships and fellowships:
Institutionally funded 213.5$ 197.5$ Externally funded - gifts and grants 13.4 10.4
Total amount netted against tuition and fees revenue 226.9$ 207.9$
Amount netted against auxiliary enterprises revenue 15.5$ 14.3$
Grants and contracts revenue from sponsored grants and contracts, including facilities and administrative costs recovery, are recognized when allowable expenses are incurred under such agreements. Medical professional practice, and hospitals and clinics revenue (net patient revenue) are recorded based upon established billing rates less allowances for contractual adjustments, discounts, and allowances for doubtful accounts (bad debts). Revenues are recorded in the period the services are provided based upon the estimated amounts due from the patients and third-party payors, including federal and state agencies (under the Medicare and Medicaid programs), managed care health plans, commercial insurance companies, and employers. Estimates of contractual allowances represent the difference between established rates for services and amounts reimbursed by third-party payors based upon the payment terms specified in the related contractual agreements. Third-party payors’ contractual payment terms are generally based upon predetermined rates per diagnosis, per diem rates or discounted fee-for-service rates. Laws and regulations governing the Medicare and Medicaid programs are complex and subject to interpretation. As a result, there is at least a reasonable possibility that recorded estimates will change by a material amount. The estimated reimbursement amounts are adjusted in subsequent periods as cost reports are prepared and filed and as final settlements are determined. In the opinion of management, adequate provisions for adjustments that may result from such reviews and audits have been made through May 31, 2017, in the accompanying financial statements. The impact of such adjustments to operating revenues for the years ended May 31, 2017 and 2016 was a decrease of $20.5 and an increase of $3.2 million, respectively. Approximately 9.1% and 10.1% of total operating revenue was derived from services rendered under the Medicare program during the years ended May 31, 2017 and 2016, respectively.

UNIVERSITY OF MIAMI NOTES TO FINANCIAL STATEMENTS
May 31, 2017 and 2016
7
2. SUMMARY OF SIGNIFICANT ACCOUNTING POLICIES AND REPORTING PRACTICES
(Continued)
Revenue Recognition (Continued)
Gifts of cash, property and marketable securities are recorded as revenue at fair value when received. Unconditional pledges (note 4) are recognized as revenue based on the estimated present value of the future cash flows, net of allowances, when the commitment is received. Pledges made and collected in the same reporting period are recorded when received in the appropriate net asset category. Conditional pledges are recorded as revenue only when donor stipulations are substantially met. Deferred Revenue Deferred Revenue represents amounts collected but not earned as of May 31, 2017. This is primarily composed of revenue for grants and contracts that are not billed on a cost reimbursement basis and student tuition received in advance of the semester. If a program is conducted over a fiscal year end, deferred revenue is recorded for all revenue related to programs predominately conducted in the next fiscal year.
Auxiliary Enterprises Auxiliary enterprises include residence halls, food services, retail stores, and athletics. Fee charges are directly related to the costs of services rendered and are recognized as revenue when the services or goods are delivered.
Annuities Payable and Trusts Held by Others Certain gift annuities, charitable lead and remainder annuity trust agreements have been entered into with donors. Assets reported under these agreements are valued at fair value based on either the present value of expected cash flows or the value of the University’s share of the underlying assets. These assets are included in trusts held by others on the statements of financial position, except for gift annuities which are included in cash and cash equivalents and investments. Gift annuities included in cash and cash equivalents, and investments totaled $16.4 and $17.7 million at May 31, 2017 and 2016, respectively. Generally, revenue from gift annuities and trusts is recognized at the date the agreements are established net of liabilities for the present value of the estimated future payments to donors and/or other beneficiaries. The liabilities are adjusted during the term of the gift annuities for changes in the value of the assets, accretion of the discount, and other changes in the estimates of future benefits. The University is also the beneficiary of certain perpetual trusts which are also included in trusts held by others on the statements of financial position. The fair value of the trusts, which are based on either the present value of the estimated future cash receipts or the fair value of the assets held in the trust, are recognized as assets and gift and trust revenue as of the date the University is notified of the establishment of the trust. The carrying value of the assets is adjusted for changes in fair value. Medical School Faculty physicians, in addition to teaching and conducting research, engage in the practice of medicine, which generates patient care revenue. Revenues and expenses, including compensation and administrative operations from the practice of medicine, are reflected as University revenues and expenses. The University and the Public Health Trust of Miami-Dade County, Florida (PHT), owner and operator of Jackson Memorial Hospital (JMH), have entered into an affiliation agreement related to their independent missions within the designated land and facilities that comprise the Jackson Memorial Medical Center. Pursuant to that agreement, the PHT provides clinical facilities for the teaching of the University’s medical students. Medical education of its students is the sole responsibility of the University. In addition, the University has agreed to permit its faculty to apply for privileges at JMH to train and supervise JMH house staff (interns, residents, and fellows) and to treat hospital patients in their capacity as members of JMH’s attending medical staff. All such treatment and training is the sole responsibility of the PHT in its capacity as the legal owner and operator of the Jackson Health System’s public hospitals and clinics and its statutory teaching hospital (JMH). The affiliation agreement provides the terms for the mutual reimbursement of services provided.
UNIVERSITY OF MIAMI NOTES TO FINANCIAL STATEMENTS
May 31, 2017 and 2016
8
2. SUMMARY OF SIGNIFICANT ACCOUNTING POLICIES AND REPORTING PRACTICES
(Continued)
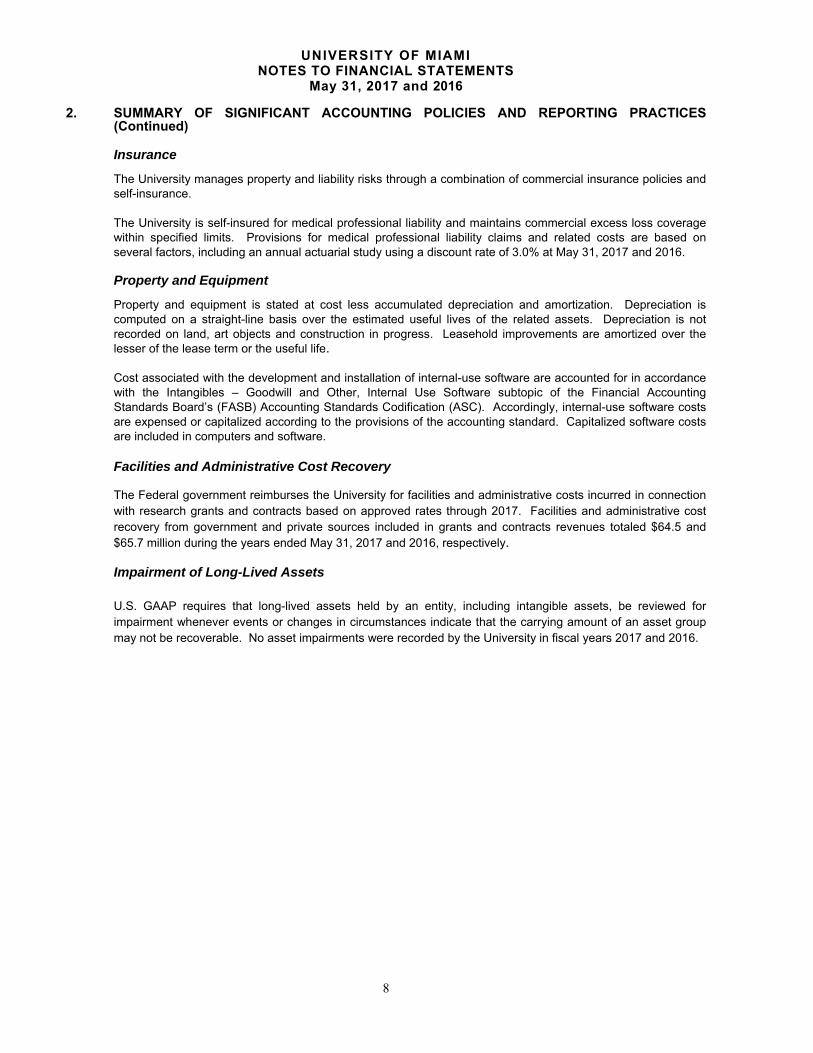
Insurance The University manages property and liability risks through a combination of commercial insurance policies and self-insurance. The University is self-insured for medical professional liability and maintains commercial excess loss coverage within specified limits. Provisions for medical professional liability claims and related costs are based on several factors, including an annual actuarial study using a discount rate of 3.0% at May 31, 2017 and 2016.
Property and Equipment Property and equipment is stated at cost less accumulated depreciation and amortization. Depreciation is computed on a straight-line basis over the estimated useful lives of the related assets. Depreciation is not recorded on land, art objects and construction in progress. Leasehold improvements are amortized over the lesser of the lease term or the useful life. Cost associated with the development and installation of internal-use software are accounted for in accordance with the Intangibles – Goodwill and Other, Internal Use Software subtopic of the Financial Accounting Standards Board’s (FASB) Accounting Standards Codification (ASC). Accordingly, internal-use software costs are expensed or capitalized according to the provisions of the accounting standard. Capitalized software costs are included in computers and software. Facilities and Administrative Cost Recovery
The Federal government reimburses the University for facilities and administrative costs incurred in connection with research grants and contracts based on approved rates through 2017. Facilities and administrative cost recovery from government and private sources included in grants and contracts revenues totaled $64.5 and $65.7 million during the years ended May 31, 2017 and 2016, respectively.
Impairment of Long-Lived Assets U.S. GAAP requires that long-lived assets held by an entity, including intangible assets, be reviewed for impairment whenever events or changes in circumstances indicate that the carrying amount of an asset group may not be recoverable. No asset impairments were recorded by the University in fiscal years 2017 and 2016.

UNIVERSITY OF MIAMI NOTES TO FINANCIAL STATEMENTS
May 31, 2017 and 2016
9
2. SUMMARY OF SIGNIFICANT ACCOUNTING POLICIES AND REPORTING PRACTICES
(Continued) Recent Accounting Pronouncements In February 2016, the FASB issued ASU 2016-02, Leases (Topic 842). The guidance in this ASU supersedes the leasing guidance in Topic 840, Leases. Under the new guidance, lessees are required to recognize lease assets and lease liabilities on the balance sheet for all leases with terms longer than 12 months. Leases will be classified as either finance or operating, with classification affecting the pattern of expense recognition in the income statement. The new standard is effective for fiscal years beginning after December 15, 2018. We are currently evaluating the impact of our pending adoption of the new standard on our financial statements.
In May 2014, the FASB issued ASU 2014-09, Revenue from Contracts with Customers (Topic 606), requiring an entity to recognize the amount of revenue to which it expects to be entitled for the transfer of promised goods or services to customers. The updated standard will replace most existing revenue recognition guidance in U.S. GAAP when it becomes effective and permits the use of either a full retrospective or retrospective with cumulative effect transition method. In August 2015, the FASB issued ASU 2015-14 which defers the effective date of ASU 2014-09 one year making it effective for annual reporting periods beginning after December 15, 2017. The University has not yet selected a transition method and is currently evaluating the effect that the standard will have on the financial statements.
Effective for financial statements issued for fiscal years beginning after December 15, 2018, the FASB issued ASU 2017-07, Improving the Presentation of Net Periodic Pension Cost and Net Periodic Postretirement Benefit Cost. This ASU requires the service cost component of defined benefit pension cost and postretirement benefit cost (net benefit cost) to be reported in the same line items as other compensation costs arising from services rendered by the pertinent employees during the period. Other components of net benefit cost must be recorded separately, outside the subtotal of income from operations. Only the service cost component will be eligible for capitalization for self-constructed assets. The University adopted this standard for the fiscal year ended May 31, 2017 and retroactively applied it to May 31, 2016.
In August 2016, the FASB issued ASU 2016-14, Not-for-Profit Entities (Topic 958): Presentation of Financial Statements of Not-for-Profit Entities, which simplifies and improves how a not-for-profit organization classifies its net assets, as well as the information it presents in financial statements and notes about its liquidity, financial performance, and cash flows. Among other changes, the ASU replaces the three current classes of net assets with two new classes, "net assets with donor restrictions" and "net assets without donor restrictions", and expands disclosures about the nature and amount of any donor restrictions. The new standard is effective for annual periods beginning after December 15, 2017 and interim periods within fiscal years beginning after December 15, 2018, with early adoption permitted. The University is currently evaluating the impact the adoption of this guidance will have on its consolidated financial statements. Subsequent events The University evaluated events and transactions occurring subsequent to May 31, 2017, through August 29, 2017, the date of issuance of the financial statements. During this period, there were no subsequent events requiring recognition or disclosure in the financial statements.
Reclassifications Certain amounts in the prior year’s financial statements have been reclassified to conform to the current year’s presentation.

UNIVERSITY OF MIAMI NOTES TO FINANCIAL STATEMENTS
May 31, 2017 and 2016
10
3. ACCOUNTS AND LOANS RECEIVABLE At May 31, accounts and loans receivable consist of the following (in millions):
2017 2016
Patient care 297.1$ 254.6$
Grants, contracts and other 120.7 109.8
Shared appreciation mortgages 25.2 26.8
Student 13.0 17.5
Student loans, net 24.2 29.1
Total 480.2$ 437.8$
Accounts and loans receivable, net:
Approximately 11.6% and 12.4% of receivables are due from the Medicare program at May 31, 2017 and 2016, respectively. Accounts and loans receivable, and student loans receivable are net of allowances for doubtful accounts of $145.0 and $.6 million, respectively, for 2017 and $146.0 and $.6 million, respectively, for 2016. Shared appreciation mortgages were provided as part of a program to attract and retain excellent faculty and senior administrators through home mortgage financing assistance. Shared appreciation notes amounting to $27.6 and $29.3 million (gross of $2.4 and $2.5 million allowance for doubtful accounts) at May 31, 2017 and 2016, respectively, from University faculty and senior administrators are collateralized by second mortgages on residential properties. The program was suspended effective December 31, 2008 with limited exceptions. Student loans are made primarily pursuant to federal programs and availability of funding. The related receivables have significant government restrictions as to marketability, interest rates, and repayment terms. Their fair value is not readily determinable.
4. CONTRIBUTIONS RECEIVABLE (PLEDGES)
Unconditional pledges are recorded at the present value of their future cash flows using a discount rate commensurate with the risk involved at the time the pledge is recorded. They are expected to be realized in the following periods at May 31, (in millions):
2017 2016In one year or less 40.7$ 43.5$ Between one year and five years 222.5 86.0 More than five years 57.6 58.2
320.8 187.7 Discount of $31.8 and allowance of doubtful pledges $26.3 for 2017 and $23.2 and $17.6 for 2016, respectively (58.1) (40.8)
Total 262.7$ 146.9$
The methodology for calculating the allowance is based on the administration’s review of individually significant outstanding pledges, analysis of the aging of payment schedules for all outstanding pledges, as well as other factors including current economic conditions.
UNIVERSITY OF MIAMI NOTES TO FINANCIAL STATEMENTS
May 31, 2017 and 2016
11
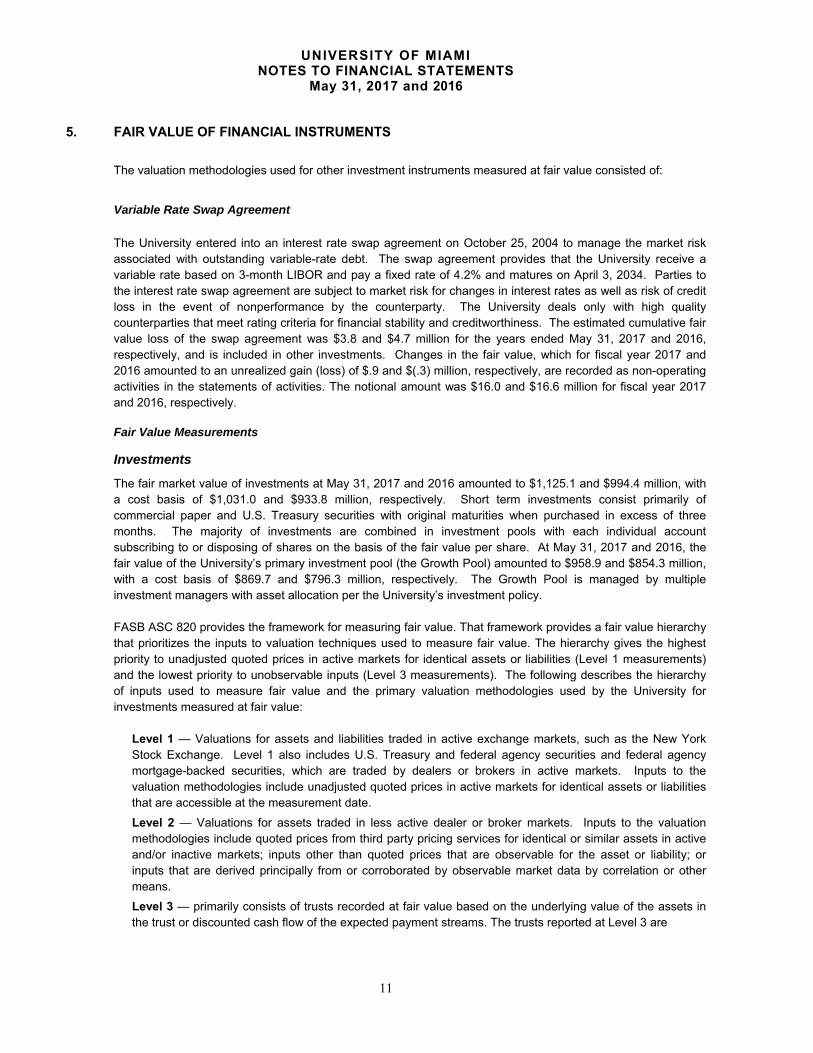
5. FAIR VALUE OF FINANCIAL INSTRUMENTS
The valuation methodologies used for other investment instruments measured at fair value consisted of:
Variable Rate Swap Agreement
The University entered into an interest rate swap agreement on October 25, 2004 to manage the market risk associated with outstanding variable-rate debt. The swap agreement provides that the University receive a variable rate based on 3-month LIBOR and pay a fixed rate of 4.2% and matures on April 3, 2034. Parties to the interest rate swap agreement are subject to market risk for changes in interest rates as well as risk of credit loss in the event of nonperformance by the counterparty. The University deals only with high quality counterparties that meet rating criteria for financial stability and creditworthiness. The estimated cumulative fair value loss of the swap agreement was $3.8 and $4.7 million for the years ended May 31, 2017 and 2016, respectively, and is included in other investments. Changes in the fair value, which for fiscal year 2017 and 2016 amounted to an unrealized gain (loss) of $.9 and $(.3) million, respectively, are recorded as non-operating activities in the statements of activities. The notional amount was $16.0 and $16.6 million for fiscal year 2017 and 2016, respectively.
Fair Value Measurements Investments
The fair market value of investments at May 31, 2017 and 2016 amounted to $1,125.1 and $994.4 million, with a cost basis of $1,031.0 and $933.8 million, respectively. Short term investments consist primarily of commercial paper and U.S. Treasury securities with original maturities when purchased in excess of three months. The majority of investments are combined in investment pools with each individual account subscribing to or disposing of shares on the basis of the fair value per share. At May 31, 2017 and 2016, the fair value of the University’s primary investment pool (the Growth Pool) amounted to $958.9 and $854.3 million, with a cost basis of $869.7 and $796.3 million, respectively. The Growth Pool is managed by multiple investment managers with asset allocation per the University’s investment policy. FASB ASC 820 provides the framework for measuring fair value. That framework provides a fair value hierarchy that prioritizes the inputs to valuation techniques used to measure fair value. The hierarchy gives the highest priority to unadjusted quoted prices in active markets for identical assets or liabilities (Level 1 measurements) and the lowest priority to unobservable inputs (Level 3 measurements). The following describes the hierarchy of inputs used to measure fair value and the primary valuation methodologies used by the University for investments measured at fair value:
Level 1 — Valuations for assets and liabilities traded in active exchange markets, such as the New York Stock Exchange. Level 1 also includes U.S. Treasury and federal agency securities and federal agency mortgage-backed securities, which are traded by dealers or brokers in active markets. Inputs to the valuation methodologies include unadjusted quoted prices in active markets for identical assets or liabilities that are accessible at the measurement date.
Level 2 — Valuations for assets traded in less active dealer or broker markets. Inputs to the valuation methodologies include quoted prices from third party pricing services for identical or similar assets in active and/or inactive markets; inputs other than quoted prices that are observable for the asset or liability; or inputs that are derived principally from or corroborated by observable market data by correlation or other means.
Level 3 — primarily consists of trusts recorded at fair value based on the underlying value of the assets in the trust or discounted cash flow of the expected payment streams. The trusts reported at Level 3 are

UNIVERSITY OF MIAMI NOTES TO FINANCIAL STATEMENTS
May 31, 2017 and 2016
12
5. FAIR VALUE OF FINANCIAL INSTRUMENTS (Continued)
primarily perpetual trusts managed by third parties invested in stocks, mutual funds, and fixed income securities that are traded in active markets with observable inputs, which would result in Level 1 and 2 hierarchal reporting. However, since the University will never receive the trust assets, these perpetual trusts are reported as Level 3.
Categories included in limited partnerships and limited liability companies and other investments, represent alternative investments which are valued at the net asset value (NAV) of the entities as determined by the fund managers. The University uses the NAV of hedge funds and limited partnerships as fair value as a practical expedient except where certain conditions exist. Those conditions include, changes to key personnel, material amendments to key terms, material pending litigations, imposition of gates and redemption fees. Investments recorded at NAV are not classified in the fair value hierarchy. The level in the fair value hierarchy within which a fair value measurement in its entirety falls is based on the lowest level of any input that is significant to the fair value measurement. The University utilizes valuation techniques that maximize the use of observable inputs and minimize the use of unobservable inputs. There have been no changes in the methodologies used at May 31, 2017. During the years ended May 31, 2017 and May 31, 2016, all mutual funds were transferred from Level 2 to Level 1 based on the latest information available.

UNIVERSITY OF MIAMI NOTES TO FINANCIAL STATEMENTS
May 31, 2017 and 2016
13
5. FAIR VALUE OF FINANCIAL INSTRUMENTS (Continued)
Fair Value Measurements (continued) Investments
Total Level 1 Level 2 Level 3Assets:
Cash equivalents $ 65.1 $ 65.1
$ - $ -
Short term investments 137.3 128.2 9.1 -
Corporate bonds 25.4 - 25.4 -
Debt securities:U.S. treasury & other government agencies 14.1 14.1 - - Issued by foreign government .1 - .1 -
Publicly traded stocks:
Large-mid cap 80.3 80.3 - -
Small cap 33.7 33.7 - -
International 23.7 23.7 - -
Mutual funds:
Equities:
Emerging markets 55.0 55.0 - -
International 60.4 60.4 - -
Large-mid cap 174.5 174.5 - -
Small cap 19.9 19.9 - -
Fixed income 107.1 107.1 - -
Balanced .9 .9 - - Multi-asset funds measured at NAV 1 9.2 - - -
Limited partnerships and limited
liability companies:
Equities:Emerging markets measured at NAV 1 44.4 - - - International measured at NAV 1 60.4 - - - Large-mid cap measured at NAV 1 74.2 - - -
Fixed income measured at NAV 1 1.1 - - - Private equity measured at NAV 1 27.7 - - -
Other:Event arbitrage measured at NAV 1 44.5 - - - Long-short composite measured at NAV 1 38.7 - - -
Multi-strategy measured at NAV 1 87.0
Real assets related securities measured at NAV 1 3.6 - - - Real estate measured at NAV 1 5.7 - - -
Interest rate swap (3.8) - (3.8) -
Total investments and cash equivalents 1,190.2 762.9 30.8 -
Trusts held by others 50.9 - - 50.9
Total assets $ 1,241.1 $ 762.9 $ 30.8 $ 50.9
Fair Value Measurement at May 31, 2017 (in millions)

UNIVERSITY OF MIAMI NOTES TO FINANCIAL STATEMENTS
May 31, 2017 and 2016
14
5. FAIR VALUE OF FINANCIAL INSTRUMENTS (Continued) Fair Value Measurements (continued) Investments
Total Level 1 Level 2 Level 3Assets:
Cash equivalents $ 192.5 $ 192.5
$ - $ -
Short term investments 111.8 100.0 11.8 -
Corporate bonds 43.0 - 43.0 -
Debt securities:U.S. treasury & other government agencies .2 .2 - - Issued by foreign government .1 - .1 -
Publicly traded stocks:
Large-mid cap 48.8 48.8 - -
Small cap 27.0 27.0 - -
Mutual funds:
Equities:
Emerging markets 19.9 19.9 - -
International 73.2 73.2 - -
Large-mid cap 72.2 72.2 - -
Small cap 31.9 31.9 - -
Fixed income 63.9 63.9 - -
Balanced .9 .9 - - Multi-asset funds measured at NAV 1 8.7 - - -
Limited partnerships and limited
liability companies:
Equities:Emerging markets measured at NAV 1 44.9 - - - International measured at NAV 1 127.6 - - - Large-mid cap measured at NAV 1 101.8 - - -
Fixed income measured at NAV 1 56.5 - - - Private equity measured at NAV 1 27.2 - - -
Other:Event arbitrage measured at NAV 1 47.6 - - - Long-short composite measured at NAV 1 50.6 - - -
Real assets related securities measured at NAV 1 26.1 - - - Real estate measured at NAV 1 13.3 - - -
Interest rate swap (4.7) - (4.7) -
Other investments 1.9 - 1.9 -
Total investments and cash equivalents 1,186.9 630.5 52.1 -
Trusts held by others 45.6 - - 45.6
Total assets $ 1,232.5 $ 630.5 $ 52.1 $ 45.6
Fair Value Measurement at May 31, 2016 (in millions)
1 In accordance with ASC Subtopic 820-10, certain investments that are measured at fair value using the net asset value per share practical expedient have not been classified in the fair value hierarchy. The fair value amounts presented in this table are intended to permit reconciliation of the fair value hierarchy to the amounts presented in the statements of financial position.

UNIVERSITY OF MIAMI NOTES TO FINANCIAL STATEMENTS
May 31, 2017 and 2016
15
5. FAIR VALUE OF FINANCIAL INSTRUMENTS (Continued)
Fair Value Measurements (continued) Investments
The following tables set forth a summary of changes in the fair value of the University’s level 3 assets which are valued at net asset value:
The total level 3 change in value related to trusts held by others at May 31, 2017 and 2016 total $5.3 and $(3.5) million, respectively, and are reflected as part of investment return and changes in value of annuities payable and trusts held by others in the statements of activities.
The following tables summarize the University’s investments whose fair value is reported using net asset value per share (in millions) using the practical expedient:
Investments: Fair ValueRedemption Frequency
Days Notice
Multi-asset funds (a) 9.2$ -$ (D) 1 day
Limited partnerships and limited liability companies:
Equities:
Emerging markets (b) 44.4 - (M) 10-30 days
International (c) 60.4 - (M) 6 days
Large-mid cap (d) 74.2 - (Q) 60 days
Fixed income (e) 1.1 - N/A N/A
Private equity (f) 27.7 20.5 * N/A
Other:
Event arbitrage (g) 44.5 - (Q) 65 days
Long-short composite (h) 38.7 - (A) 45 days
Multi-strategy (a) 87.0 (BM), (W) 5-75 days
Real assets related
securities (i)
Real estate (j) 5.7 4.1 * N/A
Total investments 396.5$ 30.7$
At May 31, 2017Future
Commitments
3.6 6.1 * N/A
Redemption Frequency: (A) Annually, (Q) Quarterly, (M) Monthly, (D) Daily, (BM) Bi-Monthly, (W) Weekly.
For the years ended (in millions):
Trusts held by others
May 31, 2015 49.1$
Net unrealized loss included in net assets (3.5)
May 31, 2016 45.6$
Net unrealized gain included in net assets 5.3
May 31, 2017 50.9$

UNIVERSITY OF MIAMI NOTES TO FINANCIAL STATEMENTS
May 31, 2017 and 2016
16
5. FAIR VALUE OF FINANCIAL INSTRUMENTS (Continued)
Fair Value Measurements (continued)
Investments
Investments: Fair ValueRedemption Frequency
Days Notice
Multi-asset funds (a) 8.7$ -$ (D) 1 day
Limited partnerships and limited liability companies:
Equities:
Emerging markets (b) 44.9 - (M) 10-30 days
International (c) 127.6 - (M) 5-6 days
Large-mid cap (d) 101.8 - (Q) 60 days
Fixed income (e) 56.5 - (M) 10 days
Private equity (f) 27.2 13.1 * N/A
Other:
Event arbitrage (g) 47.6 - (Q) 65 days
Long-short composite (h) 50.6 - (Q), (A) 45-60 days
Real assets related
securities (i)
Real estate (j) 13.3 4.4 * N/A
Total investments 504.3$ 25.1$
At May 31, 2016Future
Commitments
26.1 7.6 (M)* 10 days
Redemption Frequency: (A) Annually, (Q) Quarterly, (M) Monthly, (D) Daily.
(*) The expected liquidation date for these assets range from 2017 to 2028 and are based on a combination of the inception date of the fund and the expected life of the fund as outlined in the partnership agreement inclusive of the manager's ability to extend the fund's life. (a) This class consists of investments across stocks, bonds, currencies and commodities.
(b) This class consists of investments in small and mid-cap equities domiciled in or with significant underlying exposure to emerging markets. The fund managers utilize a fundamental, bottom-up process and focus on finding quality companies at compelling valuations.
(c) This class consists of investments in equities domiciled outside of the United States. The fund managers may utilize all-cap, all-style strategy or may focus on narrower strategies, but all funds have a long time horizon.
(d) This class follows a highly diversified strategy with more than 1,000 holdings held across the independently constructed analyst portfolios. Overall investments are geared to be long/short beta neutral with exposures in line with the S&P 500.
(e) This class consists of investments in debt securities. Some fund managers focus on buying government bonds throughout the world and may also engage in currency hedges and may do so via futures. Other fund managers focus on buying below investment grade corporate debt.
(f) This class consists of investments in private equity. These fund managers will make direct investments in private companies or in one case a fund of funds that makes commitments to other private equity, venture capital and buyout funds. These fund managers invest across all sectors in both the US and globally. The portfolios are illiquid and will be locked for 10 – 12 years.
(g) This class consists of investments that focus on event driven and credit strategies. Event-driven strategies are when the hedge funds buy the debt of companies that are in financial distress or have already filed for bankruptcy. Credit strategies focus on capital structure arbitrage. These fund managers look for relative value between senior and junior securities of the same corporate issuer. They also trade securities of equivalent credit quality from different corporate issuers, or different tranches in the complex capital of structured debt vehicles.

UNIVERSITY OF MIAMI NOTES TO FINANCIAL STATEMENTS
May 31, 2017 and 2016
17
5. FAIR VALUE OF FINANCIAL INSTRUMENTS (Continued)
Fair Value Measurements (continued) (h) This class consists of hedge funds that focus on decentralized stock selection, predominately long equity strategy with some opportunistic debt investing. Fund managers typically hold 10-20 long positions and 5-15 shorts positions, with a gross exposure usually below 140%, focused on the small and mid-cap portion of the market.
(i) This class consists of investments that hedge inflation through the holding of real assets directly or indirectly. Indirectly holding may occur through a fund of funds with underlying holdings in publicly traded mutual funds that invest commodity markets, fixed income securities, and equities. Direct holding may occur through direct investment in private companies in the energy and mining sector. The later holding is illiquid and will be locked for 10 – 12 years.
(j) This class consists of investments in underlying properties via debt and/or equity positions. These fund managers look to uncover real estate opportunities in traditional properties (commercial, residential, industrial, etc.) but will also look for more unique opportunities. The fund managers vary in focus from regional to global. These investments are illiquid and will typically exist for 10 – 12 years.
The University’s investment policy and strategy for its investments, as established by the Investment Committee (the Committee) of the Board and ratified by the Executive Committee of the Board, is to provide for growth of capital with a moderate level of volatility by investing assets based on its target allocations. The weighted average target allocations for University assets is 55.0% equity securities, 10.0% fixed income, and 35.0% other investments. Equity securities include investments in large-mid cap and small cap companies primarily located in the United States, as well as international companies similar to the S&P 500, Russell 2000 and MSCI Indexes. Fixed income securities include corporate bonds of companies from diversified industries, mortgage-backed securities, and U.S. treasuries similar to the Barclays Capital Aggregate and Citigroup World Gov’t Bond Indexes. Other investments include private equity funds, real estate funds, and hedge funds similar to those of the HFRI Fund of Funds, S&P 500, DJ/UBS Commodity, and NCREIF Property Indexes. Investments periodically are rebalanced to meet established target allocations. In addition, the Committee reviews its investment policy and target allocations periodically and effects changes when required, to ensure that strategic objectives are achieved.

UNIVERSITY OF MIAMI NOTES TO FINANCIAL STATEMENTS
May 31, 2017 and 2016
18
5. FAIR VALUE OF FINANCIAL INSTRUMENTS (Continued)
Fair Value Measurements (continued)
Investment Return
The University’s endowment spending distribution policy is to distribute five percent of the three-year moving average fair market value of the endowment investment pool. This policy is designed to protect the purchasing power of the endowment and to minimize the effect of capital market fluctuations on operating budgets.
The components of total investment return as reflected in the statements of activities are as follows (in millions):
2017 2016
Operating:
Endowment spending distribution $ 39.6 $ 38.4
Investment return 7.1 4.5
Total operating investment return 46.7 42.9
Non-Operating:
Unrestricted:Endowment interest and dividend income, realized and unrealized
losses, net of endowment spending distribution 17.3 (21.4) Other net realized and unrealized gains (losses) 3.6 (8.7)
Total unrestricted non-operating investment return 20.9 (30.1)
Temporarily restricted:Investment income (loss), net of endowment spending distribution 47.4 (62.7) Endowment distributions reinvested 3.5 2.8
Permanently restricted investment return 3.1 (2.9)
Total non-operating investment gain (loss) 74.9 (92.9)
Total investment return $ 121.6 $ (50.0)
6. FAIR VALUE OF OTHER FINANCIAL INSTRUMENTS The carrying amounts of cash and cash equivalents, patient, student and other receivables, accounts payable and accrued expenses approximate fair value due to the short maturity of these financial instruments. The carrying amounts of notes payable with variable interest rates approximate their fair value since the variable rates reflect current market rates for notes with similar maturities and credit quality. The fair value of bonds and notes payable with fixed interest rates, which is classified as level 2 within the fair value hierarchy, is based on rates assumed to be currently available for bond issues with similar terms and average maturities. The estimated fair value of these bonds payable at May 31, 2017 and 2016 approximated $1,090.3 and $1,142.9 million, respectively. The carrying amounts of these bonds payable at May 31, 2017 and 2016 were $1,013.6 and $1,030.5 million, respectively.

UNIVERSITY OF MIAMI NOTES TO FINANCIAL STATEMENTS
May 31, 2017 and 2016
19
7. PROPERTY AND EQUIPMENT
Property and equipment and related accumulated depreciation and amortization at May 31 consist of the following (in millions):
Useful Lives 2017 2016
Land $ 90.1 $ 90.1
Land improvements 20 years 121.2 115.7
Buildings and building improvements 8 to 50 years 2,070.9 1,866.2
Leasehold improvements 1 to 50 years 58.2 50.0
Construction in progress 113.9 189.1
Moveable equipment 3 to 20 years 608.2 580.5
Computers and software 5 to 15 years 181.1 169.3
Library materials 12 years 113.8 114.0
Art objects 57.5 56.1
3,414.9 3,231.0 Accumulated depreciation and amortization (1,623.2) (1,509.2) Total $ 1,791.7 $ 1,721.8
Interest on borrowings is capitalized during construction, net of any project specific borrowings’ investment income earned through the temporary investment of project borrowings. Net interest expense of $6.0 and $6.4 million was capitalized for the years ended May 31, 2017 and 2016, respectively.
8. ENDOWMENT
As required by accounting principles generally accepted in the United States of America, net assets associated with endowment funds, including funds designated by the Board to function as endowments, are classified and reported based on the existence or absence of donor-imposed restrictions. Quasi endowment funds are resources segregated for long-term investment and include investment return on unrestricted investments, and other resources designated by the Board for future programs and operations. Spending Policy The University’s endowment spending distribution policy in support of its programs is to distribute five percent of the three-year moving average fair market value of the endowment investment pool. New endowments must be received prior to December 31 in order to activate the spending distribution for the next fiscal year. In addition, no distribution is made from an endowment until its funding reaches, by December 31, the level stipulated by policy. Further, endowments to establish Chairs and Professorships have an additional delay of one year before distributions are made.
UNIVERSITY OF MIAMI NOTES TO FINANCIAL STATEMENTS
May 31, 2017 and 2016
20
8. ENDOWMENT (Continued)
Return Objectives and Risk Parameters The University has adopted investment and spending policies to protect the purchasing power of the endowment and to minimize the effect of capital market fluctuations on operating budgets.
The intent of the University’s policy for its primary investment pool (the Growth Pool), as approved by the Board, is to achieve a rate of return equal to or greater than the respective benchmark, while assuming a moderate level of risk. To satisfy its long-term rate-of-return objectives, the University relies on a total return strategy in which investment returns are achieved through both capital appreciation (realized and unrealized) and current yield (interest and dividends). The University targets a diversified asset allocation that places a greater emphasis on equity based investments to achieve its long-term return objectives within prudent risk constraints. The current long-term return objective is to earn a return of at least the Consumer Price Index plus 5%, net of fees. Actual returns in any given year may vary from this amount. Application of Relevant Law The Board’s interpretation of its fiduciary responsibilities for donor-restricted endowments under Uniform Prudent Management of Institutional Funds Act in Florida (FL UPMIFA) is that it is required to use reasonable care and caution as would be exercised by a prudent investor, in considering the investment management and expenditures of endowment funds. In accordance with FL UPMIFA, the Board may expend so much of an endowment fund as the Board determines to be prudent for the uses and purposes for which the endowment fund is established, consistent with the goal of conserving the long-term purchasing power of the endowment fund. FL UPMIFA specifies that unless stated otherwise in the gift instrument, donor-restricted assets in an endowment fund are restricted assets until appropriated for the spending distribution. Barring the existence of specific instructions in gift agreements for donor-restricted endowments, the University’s policy is to report (a) the historical value for such endowments as permanently restricted net assets and (b) the net accumulated appreciation as temporarily restricted net assets. The amounts appropriated for the spending distribution are based on the endowment spending rate per unit and the number of units for each fund. The unspent market appreciation of donor-restricted endowment funds is presented as temporarily restricted net assets until appropriated for expenditure by the University. When losses on the investments of a donor-restricted endowment fund exceed the net appreciation classified in temporarily restricted net assets, the excess loss reduces unrestricted net assets. Gains that restore the fair value of the assets of the endowment fund to the fund's required level (historic dollar value) are classified as an increase to the same class of net assets that was previously reduced for the excess loss - unrestricted net assets. After the fair value of the assets of the endowment fund equals the required level, gains are again available for expenditure, and those gains that are restricted by the donor are classified as increases in temporarily restricted net assets. At May 31, 2017 and 2016, the net deficiency in the market value of certain endowment related assets which fell below the donor required level amounted to $1.3 and $5.8 million, respectively, and resulted from unfavorable market fluctuations that occurred shortly after the investment of new permanently restricted contributions, as well as continued appropriations for certain programs deemed prudent by the University.

UNIVERSITY OF MIAMI NOTES TO FINANCIAL STATEMENTS
May 31, 2017 and 2016
21
8. ENDOWMENT (Continued)
Endowment net assets consist of the following (in millions):
UnrestrictedTemporarily Restricted
Permanently Restricted Total
At May 31, 2016:
Donor-restricted endowment funds:
At historical value $ - $ 34.3 $ 444.0 $ 478.3
Accumulated net (depreciation) appreciation (5.8) 203.2 - 197.4
Quasi endowment funds 168.9 - - 168.9
Total $ 163.1 $ 237.5 $ 444.0 $ 844.6
At May 31, 2017:
Donor-restricted endowment funds:
At historical value $ - $ 34.4 $ 482.7 $ 517.1
Accumulated net (depreciation) appreciation (1.3) 250.8 - 249.5
Quasi endowment funds 182.0 - - 182.0
Total $ 180.7 $ 285.2 $ 482.7 $ 948.6
Changes in endowment net assets for the fiscal years ended May 31, 2017 and 2016 consist of (in millions):
UnrestrictedTemporarily Restricted
Permanently Restricted Total
Balance, May 31, 2015 182.8$ 288.4$ 416.1$ 887.3$
Endowment investment return:
Investment income 2.3 8.7 - 11.0
Net appreciation (realized and unrealized) (15.3) (33.0) - (48.3)
Total investment return (13.0) (24.3) - (37.3)
Gifts and Trusts 0.1 4.0 27.1 31.2
Endowment spending distribution for programs (8.5) (32.7) - (41.2)
Endowment distributions reinvested 0.1 2.8 - 2.9
Net transfers to quasi endowment funds 1.6 - - 1.6
Other - (0.7) 0.8 0.1 Balance, May 31, 2016 163.1 237.5 444.0 844.6
Endowment investment return:
Investment income 2.4 9.1 - 11.5
Net appreciation (realized and unrealized) 23.4 72.3 - 95.7
Total investment return 25.8 81.4 - 107.2
Gifts and Trusts - 0.5 38.2 38.7
Endowment spending distribution for programs (8.5) (34.6) - (43.1)
Endowment distributions reinvested - 3.5 - 3.5
Net transfers to quasi endowment funds 0.3 - - 0.3
Other - (3.1) 0.5 (2.6) Balance, May 31, 2017 180.7$ 285.2$ 482.7$ 948.6$
UNIVERSITY OF MIAMI NOTES TO FINANCIAL STATEMENTS
May 31, 2017 and 2016
22
9. PENSION AND OTHER POSTRETIREMENT BENEFIT PLANS
The University has two non-contributory retirement plans, the Faculty Retirement Plan and the Employee Retirement Plan. These two plans were closed to employees hired after May 31, 2007. Effective June 1, 2007 a new retirement plan was established, the Retirement Savings Plan. The University also sponsors an unfunded, defined benefit postretirement health plan that covers all full-time and part-time regular employees who elect coverage and satisfy the plan’s eligibility requirements when they retire. The plan is contributory with retiree contributions established as a percentage of the total cost for retiree health care and for the health care of their dependents. The University pays all benefits on a current basis. The Retirement Savings Plan (Savings Plan) is a defined contribution plan in which the University makes an automatic core contribution of 5% of pay with a dollar-for-dollar match on voluntary contributions up to an additional 5% of pay once the employee meets certain eligibility requirements. Eligible employees can begin making voluntary contributions to the Savings Plan at any time. Participation is limited to faculty and staff hired on or after June 1, 2007 or who elected, prior to June 1, 2007, to transfer to this plan from the Faculty Retirement Plan or from the Employee Retirement Plan. Core and matching contributions to the Savings Plan for 2017 and 2016 were $50.9 and $46.5 million, respectively. The Retirement Savings Plan II (Savings Plan II) is a defined contribution plan the University established, effective January 1, 2008, that covers substantially all employees of the University of Miami Hospital (UMH). The plan is available to employees who meet certain eligibility requirements and requires that UMH match certain percentages of participants’ contributions up to certain maximum levels. Eligible employees can begin making voluntary contributions to the Savings Plan II at any time. Core and matching contributions to the Savings Plan II were $7.5 and $6.7 million for the years ended May 31, 2017 and 2016, respectively. Faculty Retirement Plan (Faculty Plan) is a defined contribution plan for eligible faculty hired between September 30, 1977 and May 31, 2007, and certain faculty hired on or before September 30, 1977, who ceased participation in the Employee Retirement Plan. Under the terms of the Faculty Plan, the University makes contributions to individual retirement accounts for each eligible faculty member. Payment from the retirement account commences when the faculty member has separated from service and elects to begin distributions in accordance with plan provisions.
Contributions to the Faculty Plan are based upon a combination of compensation, tenure status, length of service, and other factors and are funded as accrued. These contributions were $19.5 and $22.9 million for the years ended May 31, 2017 and 2016, respectively. In addition to the above noted plans, there are deferred compensation arrangements for certain employees, principally clinical faculty, the liability for which is included in other liabilities. The Employee Retirement Plan (Employee Plan) is a defined benefit plan primarily for full-time non-faculty employees hired before June 1, 2007. Employee Plan assets are held by a Trustee. The benefit is based on the higher of two formulas: a formula based on years of service and the employee's compensation for the consecutive five year period of employment that produces the highest average; and a cash balance benefit formula determined each year based on compensation and investment earnings.

UNIVERSITY OF MIAMI NOTES TO FINANCIAL STATEMENTS
May 31, 2017 and 2016
23
9. PENSION AND OTHER POSTRETIREMENT BENEFIT PLANS (Continued)
Effective June 1, 2017, the Employee Plan will be amended to comply with IRS regulations requiring that the annual cash balance interest credit be determined using the average yield on US long-term corporate bonds for the 24-month period ending January 31 of the preceding plan year. The annual interest crediting rate shall be no less than 4%. In addition, the annual cash balance pay credit for service between 10 and 15 years was increased from 6% of pay 7% of pay. These changes are captioned in the table below as ‘Plan Assumption Changes’. The measurement date for the Employee Plan and postretirement health plan is May 31 for fiscal years 2017 and 2016. The following benefit payments, which reflect expected future service, are expected to be paid, for the fiscal years ending May 31 (in millions):
The University expects to contribute $40.0 million to the Employee Plan and $.3 million to its postretirement health plan during the fiscal year ending May 31, 2018.
Pension Benefits
Postretirement Benefits
2018 $ 55.1 $ .32019 56.2 .32020 57.2 .42021 57.4 .42022 56.8 .5
2023-2027 291.0 3.1

UNIVERSITY OF MIAMI NOTES TO FINANCIAL STATEMENTS
May 31, 2017 and 2016
24
9. PENSION AND OTHER POSTRETIREMENT BENEFIT PLANS (Continued)
The tables that follow provide a reconciliation of the changes in the plans’ projected benefit obligations, fair value of assets and funded status (in millions):
PostretirementPension Benefits Benefits
2017 2016 2017 2016Change in Benefit ObligationBenefit obligation at beginning of year $ 953.6 $ 928.3 $ 3.7 $ 7.3Service cost – benefits attributed to employee service during period ' and administrative expenses 19.1 19.7 .5 .5Interest costs accrued to measure benefit obligation at present value 37.0 38.8 .3 .2Plan participant contributions - - .5 .6Actuarial loss (gain) 14.7 21.5 3.1 (4.3)Benefits paid and administrative expenses (54.7) (54.8) (.7) (.6)Plan assumption changes (25.2) - - - Benefit obligation at end of year 944.5 953.5 7.4 3.7
Change in Plan AssetsEmployee Plan assets at fair value at beginning of year 697.3 718.0 - - Investment return on Employee Plan assets 85.2 (15.4) - - Benefits paid and Employee Plan expenses (54.7) (54.8) (.7) (.6)Employer contributions 50.0 49.5 0.2 - Plan participant contributions - - .5 .6Employee Plan assets at fair value at end of year 777.8 697.3 - -
Funded statusAccrued pension and postretirement benefit costs recognized
on the statements of financial position $ (166.7) $ (256.2) $ (7.4) $ (3.7)
Amounts recognized in unrestricted net assets consist of: Net actuarial loss (gain) $ 358.8 $ 417.3 $ (.7) $ (3.9) Prior service credit (58.0) (37.3) (.4) (.5)
$ 300.8 $ 380.0 $ (1.1) $ (4.4)
At May 31, 2017 and 2016, the accumulated benefit obligation of the Employee Plan was $920.1 and $933.7 million, respectively, $142.3 and $236.4 million, respectively, in excess of Employee Plan assets. The following table provides the components of net periodic pension cost for the plans (in millions):
PostretirementPension Benefits Benefits
2017 2016 2017 2016Service costs: benefits attributed to employee service during periods and administrative expenses $ 19.1 $ 19.7 $ .5 $ .5Interest costs accrued to measure benefit obligation at present value 36.9 38.8 .3 .3Expected return on Employee Plan assets (53.5) (54.0) - - Amortization of prior service cost/(credit) - includes changes in pension formula and cost of Employee Plan amendments (4.5) (4.5) (.1) (.1)Recognized net actuarial loss and assumption changes 41.6 25.4 (.1) (.1)
Net periodic benefit cost $ 39.6 $ 25.4 $ .6 $ .6
The components of net periodic benefit cost other than the service cost component are included in the line item “Other components of net periodic pension cost” in the Statement of Activities.

UNIVERSITY OF MIAMI NOTES TO FINANCIAL STATEMENTS
May 31, 2017 and 2016
25
9. PENSION AND OTHER POSTRETIREMENT BENEFIT PLANS (Continued)
The net actuarial loss and prior service credit expected to be recognized in net periodic benefit cost over the next fiscal year are as follows (in millions):
Pension Postretirement
Benefits BenefitsNet actuarial loss (gain) 35.7$ -$ Prior service credit (7.9) (.1)
A 7.75% annual rate of increase in the per capita cost of covered health care benefits was assumed for 2017. The rate is assumed to decrease each year until reaching the ultimate of 5.1% in 2099. Assumed health care cost trend rates have an effect on the amounts reported for the health care plan. A load factor was applied to the trend rates to reflect the impact of excise tax in 2020 and beyond. A 1% change in assumed health care cost trend rates would have the following effect (in millions):
1% Increase 1% Decrease
Effect on total of service and interest cost components of net periodic postretirement health care benefit cost $ .1 $ (.1)
Effect on the health care component of the accumulated postretirement benefit obligation
.9 (.7)
The following weighted-average assumptions were used for the above calculations:
PostretirementPension Benefits Benefits
2017 2016 2017 2016Discount rate for benefit obligation 3.95% 4.00% 3.75% 3.95%Discount rate for net periodic benefit cost 4.00% 4.25% 3.95% 4.20%Expected return on Employee Plan assets 7.80% 7.80% N/A N/ARate of compensation increase related to
net periodic benefit cost 2.50%/3.00% 2.50%/3.00% N/A N/A
The rate of compensation increase assumption related to the benefit obligation is 2.5% thru fiscal year 2020, and 3.0% thereafter. To develop the expected long-term rate of return for the Employee Plan assets, the University considered the historical returns of the major market indicators relating to the target asset allocation, as well as the current economic and financial market conditions. The University used mortality tables issued in October 2014 by the Society of Actuaries. The mortality assumptions selected are the mixed-collar adjusted RP-2014 sex distinct pre- and post-annuitant mortality tables. These rates have been projected to 2014 using one-dimensional Scale BB. These tables represent recent mortality experience for a large US population dataset that is reasonably representative of the population covered under the Plan. Mortality improvement is also assumed beyond the valuation date because recent experience evidenced by Social Security beneficiaries indicates that longevity has continued to improve. For years after 2014, generational improvement is projected using scale MP-2014, modified to converge to a .75% long term rate of mortality improvement in 2022 for ages 65-84, lesser improvement rates are used at older ages.

UNIVERSITY OF MIAMI NOTES TO FINANCIAL STATEMENTS
May 31, 2017 and 2016
26
9. PENSION AND OTHER POSTRETIREMENT BENEFIT PLANS (Continued)
Employee Plan Assets The investment policy and objectives, as established by the University, are to ensure that the Employee Plan has sufficient liquidity and investment returns relative to anticipated cash flow and funding requirements, including benefit obligations. The University has incorporated a Dual-Trigger Dynamic Glide Path (“Dynamic Glide Path”) approach to the asset allocation for the Employee Plan. The intent of the Dynamic Glide Path is to minimize the Plan’s funded ratio volatility. The current Dynamic Glide Path asset allocation of the Employee Plan assets for a funded ratio of greater than 80% but less than or equal to 90% is as follows: 20% - 40% Public Equities; 40% - 70% Fixed Income (Duration Matched); 2.5% - 10% Fixed Income (Non-Duration Matched); 2.5% - 27.5% other investments. Public Equity securities include registered mutual funds, unregistered limited partnerships, common collective trusts, and 103-12 investment entities which invest in large cap, mid cap, small cap, and emerging companies primarily located in the United States, as well as international and emerging markets companies whose benchmarks are tied to the S&P 500 and MSCI Indexes. Fixed income securities include collective investment funds and registered mutual funds which invest in government and government agency securities, corporate credit (investment grade and high yield), structured products, etc., whose benchmarks are tied to the Barclays U.S. Aggregate Bond Index and Barclays U.S. Long Credit Index. Other investments include uncorrelated long and short investments in markets and instruments, illiquid investments in public and private equity companies, real estate, and common collective trusts investing in real assets related securities similar to those of the HFRI Fund of Funds Index, Cambridge Associates Global Private Equity Index and Bloomberg Commodity Index. At a minimum, the University reviews the Dynamic Glide Path and asset allocation annually for appropriateness. During the years ended May 31, 2017 and 2016, all mutual funds were transferred from Level 2 to Level 1 based on the latest information available. See Note 5 for fair value measurement narrative disclosures.

UNIVERSITY OF MIAMI NOTES TO FINANCIAL STATEMENTS
May 31, 2017 and 2016
27
9. PENSION AND OTHER POSTRETIREMENT BENEFIT PLANS (Continued)
Employee Plan Assets (continued)
Total Level 1 Level 2 Level 3
Small cap 43.6$ 43.6$ -$ -$
Mutual funds:
Equities:
Emerging markets 27.7 27.7 - -
International 34.7 34.7 - -
Fixed income 46.3 46.3 - -
Limited partnerships and limited liability companies:
Equities: Emerging markets measured at NAV 1 12.2 - - -
Large-mid cap measured at NAV 1 59.4 - - -
Private equity measured at NAV 1 9.6 - - -
Other: Event arbitrage measured at NAV 1 1.2 - - -
Real estate measured at NAV 1 3.4 - - -
Money market accounts 11.0 11.0 - -
Common collective trusts:
Equities:Large cap measured at NAV 1 119.1 - - -
Small cap measured at NAV 1 10.2 - - -
Fixed income measured at NAV 1 107.6 - - -
Multi-strategy measured at NAV 1 22.3 - - -
Emerging markets measured at NAV 1 12.3 - - -
103-12 Investment entities:
Equities:International measured at NAV 1 68.9 - - -
Corporate & Government Bonds: - - -
Fixed income 157.8 77.8 80.0 -
Other investmentsPrivate equity measured at NAV 1 4.5 - - -
Long-short composite measured at NAV 1 .1 - - -
Fixed income measured at NAV 1 .4 - - -
Multi-strategy measured at NAV 1 22.9 - - -
Real assets related securities measured at NAV 1 .1 - - -
Other 2.5 2.5
Total 777.8$ 243.6$ 80.0$ -$
Publicly traded stocks:
Fair Value Measurement at May 31, 2017 (in millions)

UNIVERSITY OF MIAMI NOTES TO FINANCIAL STATEMENTS
May 31, 2017 and 2016
28
9. PENSION AND OTHER POSTRETIREMENT BENEFIT PLANS (Continued)
Employee Plan Assets (continued)
Total Level 1 Level 2 Level 3
Large-mid cap 26.4$ 26.4$ -$ -$
Small cap 19.1 19.1 - -
Mutual funds:
Equities:
Emerging markets 13.3 13.3 - -
International 39.6 39.6 - -
Large-mid cap 43.9 43.9 - -
Limited partnerships and limited liability companies:
Equities: Emerging markets measured at NAV 1 20.2 - - -
Large-mid cap measured at NAV 1 64.3 - - -
Private equity measured at NAV 1 10.7 - - -
Other: Event arbitrage measured at NAV 1 27.7 - - -
Real estate measured at NAV 1 7.7 - - -
Long-short composite measured at NAV 1 14.7 - - -
Money market accounts 26.7 26.7 - -
Common collective trusts:Fixed income measured at NAV 1 251.6 - - -
Real assets related securities measured at NAV 1 15.0 - - -
103-12 Investment entities:
Equities:International measured at NAV 1 76.0 - - -
Small cap 30.3 - - -
Fixed income measured at NAV 1 6.8 - - -
Other investmentsPrivate equity measured at NAV 1 3.6 - - -
Long-short composite measured at NAV 1 .1 - - -
Fixed income measured at NAV 1 .4 - - -
Real assets related securities measured at NAV 1 .1 - - -
Other (.9)
Total 697.3$ 169.0$ -$ -$
Publicly traded stocks:
Fair Value Measurement at May 31, 2016 (in millions)
1 In accordance with ASC Subtopic 820-10, certain investments that are measured at fair value using the net asset value per share practical expedient have not been classified in the fair value hierarchy. The fair value amounts presented in this table are intended to permit reconciliation of the fair value hierarchy to the amounts presented in the statements of financial position.

UNIVERSITY OF MIAMI NOTES TO FINANCIAL STATEMENTS
May 31, 2017 and 2016
29
10. BONDS AND NOTES PAYABLE
Bonds and notes payable at May 31 consist of the following (in millions):
Final 2017Series Maturity Interest Rate 2017 2016
Miami-Dade County, Florida 2007B to
Educational Facilities Authority 2015A 2017 to 2050 2.189% to 5.75% $ 971.3 $ 985.6
Notes payable to banks and others - 2017 to 2030 13.3 14.3
Notes payable to banks and others - 2017 to 2021 Variable 106.0 111.9
Par amount of bonds and notes payable 1,090.6 1,111.8
Net unamortized premium 44.9 47.2
Net unamortized issue costs (7.0) (7.3)
Total $ 1,128.5 $ 1,151.7
The annual maturities for bonds and notes payable at May 31, 2017 are as follows (in millions):
2018 21.9$
2019 24.5
2020 42.1
2021 84.6
2022 15.3
Thereafter 902.2
Total 1,090.6$
In December 2014, the University borrowed $16.8 million from a bank to refinance an existing note. The loan has a variable interest rate equal to LIBOR Floating Rate plus .80% per annum, and has a maturity date of December 16, 2019. The outstanding balance at May 31, 2017 and 2016 was $14.8 and $15.6 million respectively.
Effective August 4, 2015, the University entered into a $600.0 million senior credit facility with a syndicate of lenders, including a new revolving credit facility of $500.0 million and a new Term Loan A of $100.0 million. The $250.0 million Tranche A line of credit has a variable interest rate equal to the LIBOR Daily Floating Rate plus 0.70% per annum, and has a maturity date of August 4, 2018. The $250.0 million Tranche B line of credit has a variable interest rate equal to the LIBOR Daily Floating Rate plus 1.00% per annum, and has a maturity date of August 4, 2020. The Term Loan A has a variable interest rate equal to LIBOR Daily Floating Rate plus 0.80% per annum, and has a maturity date of August 4, 2020. The pricing for all three tranches are based on a pricing grid based on the University’s credit ratings. At May 31, 2017 there were no amounts outstanding on the Tranche A and B line of credit. The outstanding balance for the Term Loan A at May 31, 2017 and 2016 was $91.2 and $96.3 million, respectively.
In October 2015, the University issued $403.0 million of Series 2015A, and $258.1 million of Series 2015B Revenue and Revenue Refunding Bonds through the Miami-Dade County Educational Facilities Authority (MDCEFA). A portion of the proceeds of the bonds were used to advance refund all of the MDCEFA Series 2007A and Series 2008A bonds, by transferring sufficient proceeds to an escrow account held by a trustee to be used to pay all future debt service on the 2007A and 2008A bonds. As a result, the 2007A and 2008A bonds are considered legally defeased and the liabilities have been removed from these financial statements. The escrow agreement is collateralized by United States Treasury securities. Although the refunding resulted in a loss on early extinguishment of debt of $16.8 million, the new bonds bear lower rates thus achieving significant

UNIVERSITY OF MIAMI NOTES TO FINANCIAL STATEMENTS
May 31, 2017 and 2016
30
10. BONDS AND NOTES PAYABLE (Continued)
future savings for the University.
A portion of the proceeds are to be used to finance or refinance all or a part of the costs of the acquisition, construction, renovation and equipping of educational, research, medical, healthcare, parking and other facilities owned and operated by the University, including an ambulatory care center, the acquisition, installation, and implementation of an ERP-Workday system and a nursing simulation hospital.
Total interest paid on all bonds and notes was $51.5 and $47.5 million for the years ended May 31, 2017 and 2016, respectively. All of the bonds and notes payable listed in the table above are unsecured.
11. NET ASSETS
12. GIFTS AND TRUSTS
The University’s Advancement Office (Advancement) reports total gifts and trusts based on the Management Reporting Standards issued by the Council for Advancement and Support of Education (CASE). Gifts, trusts, and pledges (gifts and trusts) reported for financial statement purposes are recorded on the accrual basis.
Unrestricted net assets consist of the following at May 31 (in millions): 2017 2016
Designated for operations, programs, facilities expansion and student loans $ 142.0 $ 187.8
Cumulative pension and postretirement benefits related changes other than ' net periodic benefit cost (299.7) (375.5)
Invested in plant facilities 804.9 803.9
Endowment and similar funds 180.7 163.1
Total unrestricted net assets $ 827.9 $ 779.3
2017 2016
Gifts for programs and facilities expansion $ 83.6 $ 77.3
Contributions (pledges) and trusts 234.0 136.7
Life income and annuity funds 9.7 10.6
Endowment and similar funds 285.2 237.5
Total temporarily restricted net assets $ 612.5 $ 462.1
Temporarily restricted net assets consist of the following at May 31 (in millions):
2017 2016
Contributions (pledges) and trusts $ 79.7 $ 55.9
Endowment and similar funds 482.7 444.0
Total permanently restricted net assets $ 562.4 $ 499.9
Permanently restricted net assets consist of the following at May 31 (in millions):
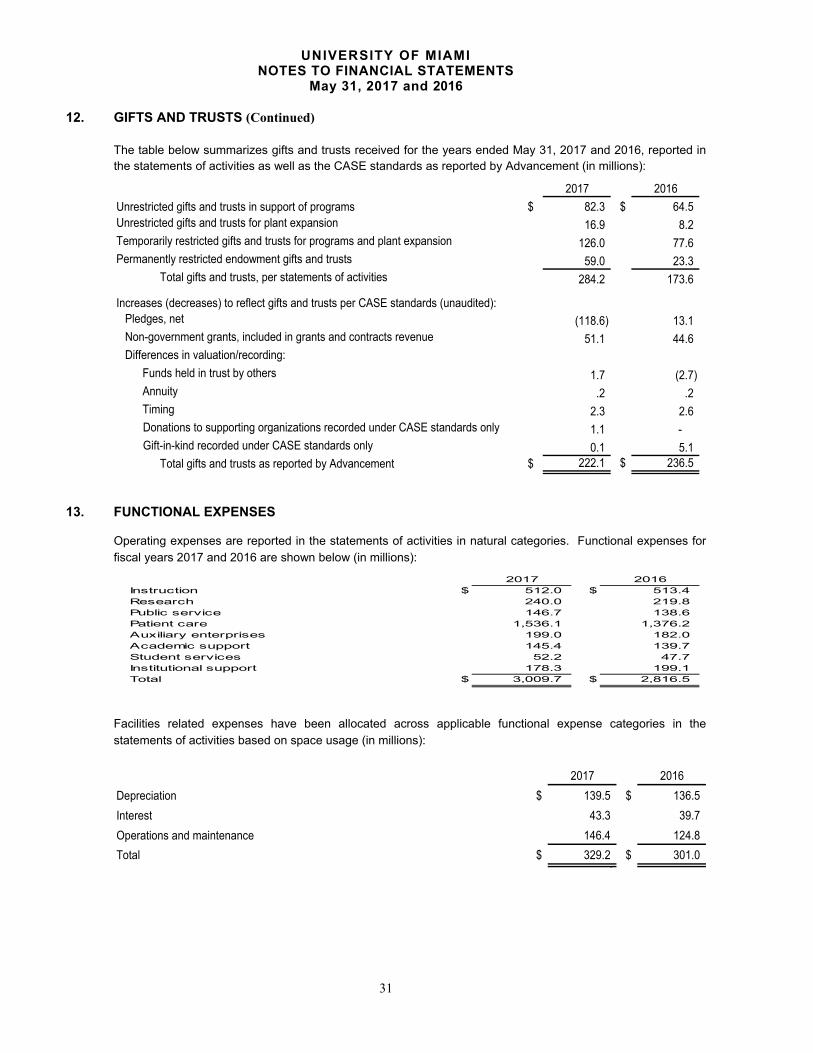
UNIVERSITY OF MIAMI NOTES TO FINANCIAL STATEMENTS
May 31, 2017 and 2016
31
12. GIFTS AND TRUSTS (Continued)
The table below summarizes gifts and trusts received for the years ended May 31, 2017 and 2016, reported in the statements of activities as well as the CASE standards as reported by Advancement (in millions):
2017 2016
Unrestricted gifts and trusts in support of programs $ 82.3 $ 64.5 Unrestricted gifts and trusts for plant expansion 16.9 8.2 Temporarily restricted gifts and trusts for programs and plant expansion 126.0 77.6 Permanently restricted endowment gifts and trusts 59.0 23.3
Total gifts and trusts, per statements of activities 284.2 173.6
Increases (decreases) to reflect gifts and trusts per CASE standards (unaudited):Pledges, net (118.6) 13.1 Non-government grants, included in grants and contracts revenue 51.1 44.6 Differences in valuation/recording:
Funds held in trust by others 1.7 (2.7) Annuity .2 .2Timing 2.3 2.6
Donations to supporting organizations recorded under CASE standards only 1.1 - Gift-in-kind recorded under CASE standards only 0.1 5.1
Total gifts and trusts as reported by Advancement $ 222.1 $ 236.5
13. FUNCTIONAL EXPENSES
Operating expenses are reported in the statements of activities in natural categories. Functional expenses for fiscal years 2017 and 2016 are shown below (in millions): Facilities related expenses have been allocated across applicable functional expense categories in the statements of activities based on space usage (in millions):
2017 2016
Depreciation $ 139.5 $ 136.5
Interest 43.3 39.7
Operations and maintenance 146.4 124.8
Total $ 329.2 $ 301.0 0
2017 2016Instruction $ 512.0 $ 513.4 Research 240.0 219.8 Public service 146.7 138.6 Patient care 1,536.1 1,376.2 Auxiliary enterprises 199.0 182.0 Academic support 145.4 139.7 Student services 52.2 47.7 Institutional support 178.3 199.1 Total $ 3,009.7 $ 2,816.5

UNIVERSITY OF MIAMI NOTES TO FINANCIAL STATEMENTS
May 31, 2017 and 2016
32
14. COMMITMENTS AND CONTINGENCIES
The University had contractual obligations of approximately $98.4 million at May 31, 2017 for various construction projects and purchases of equipment. The University, in its normal operations, is a defendant in various legal actions. Additionally, amounts received and expended under various federal and state programs are subject to audit by governmental agencies. Management is of the opinion that the outcome of these matters would not have a material effect on the University's financial position or results of operations.
The University leases certain real property. These leases are classified as operating leases and have lease terms ranging up to sixty-eight years. Total lease expense for the years ended May 31, 2017 and 2016 was $37.3 million and $33.8 million, respectively. Future minimum lease payments under noncancelable operating leases at May 31, 2017 are as follows (in millions):
The University leases certain equipment. These leases are classified as capital leases and have lease terms ranging up to five years. Future minimum lease payments at May 31, 2017 are as follows (in millions):
2018 4.0$
2019 3.0
2020 1.6
2021 0.7
Total minimum obligations 9.3$ Less amount representing interest 0.3
Present value of net minimum obligation reported in Other Liabilities 9.0$
2018 18.6$
2019 16.9
2020 13.7
2021 11.5
2022 10.8
Thereafter 277.5
Total 349.0$


