24
Financial Statements for the Year Ended March 31, 2020 The Bank of Okinawa, Ltd.

Financial Statements for the Year Ended March 31, 2020
The Bank of Okinawa, Ltd.

Table of Contents
I. Summary of Business Results for the Year Ended March 31, 2020 1. Business performance Non-consolidated/consolidated ……… 1
2. Net business profit Non-consolidated ……… 3
3. Interest margins Non-consolidated ……… 3
4. Gains and losses on securities Non-consolidated ……… 4
5. Capital ratio (domestic standards) Non-consolidated/consolidated ……… 4
6. ROE Non-consolidated ……… 5
II. Loans and Bills Discounted 1. Risk-monitored loans (under the Banking Law) Non-consolidated/consolidated ……… 6
2. Allowance for loan losses Non-consolidated/consolidated ……… 8
3. Coverage of risk monitored loans Non-consolidated/consolidated ……… 8
4. Mandatory disclosure of bad debt under the Financial Reconstruction Law Non-consolidated/consolidated ……… 10
5. Coverage of assets subject to mandatory disclosure under the Financial
Reconstruction Law Non-consolidated/consolidated ……… 10
6.
Allowance ratio and coverage ratio of assets subject to mandatory disclosure under the
Financial Reconstruction Law by asset category and borrower category Non-consolidated/consolidated ……… 11
7. Asset self-assessment and classification of assets Non-consolidated ……… 12
8. Asset self-assessment and mandatory disclosure of assets under the Financial
Reconstruction Law Non-consolidated ……… 14
9. Loans and bills discounted by industrial segment Non-consolidated ……… 15
(1) Loans made by industrial segment Non-consolidated ……… 15
(2) Risk-monitored loans by industrial segment Non-consolidated ……… 15
(3) Loan and bad debt balances - wholesaling & retailing, construction, real
estate, finance (excluding banking) Non-consolidated ……… 16
(4) Consumer loan balance Non-consolidated ……… 17
(5) Loans to SMEs and ratio of loans to SMEs to total loans Non-consolidated ……… 17
10. Loans guaranteed by credit guarantee associations Non-consolidated ……… 17
11. Loan balance to affiliate non-bank financial institutions Non-consolidated ……… 17
12. Deposits and loan balances Non-consolidated ……… 17
13. Deposit made by individuals and corporations by deposit category (average balance) Non-consolidated ……… 18
III. Performance Forecasts 1. Full-year performance forecasts for the year ending March 31, 2021 Non-consolidated ……… 19
2. Employees and branches Non-consolidated ……… 19
3. Shareholdings Non-consolidated ……… 20
4. Bad debt Non-consolidated ……… 20
(1) Credit cost Non-consolidated ……… 20
(2) Bad debt balance Non-consolidated ……… 20
(3) Bad debt final disposal and new occurrence Non-consolidated ……… 21
(4) Reserves for possible loan losses by borrower category and reserve ratios Non-consolidated ……… 21
(5) Bad debt ratios (under the Financial Reconstruction Law) Non-consolidated/consolidated ……… 22

1
I. Summary of Business Results for the Year Ended March 31, 2020 1. Business performance Non-consolidated (¥ million)
(Japanese) FY19
YoY increase (decrease) FY18
Gross business profit 業 務 粗 利 益 29,105 389 28,715
Net interest income 資 金 利 益 27,924 550 27,373
Net fees and commissions 役 務 取 引 等 利 益 1,650 (293) 1,943
Trust fees う ち 信 託 報 酬 118 (38) 156
Expenses for the disposal of bad debt included in trust account
(1) 信 託 勘 定 不 良 債 権
処 理 額- - -
Other business profit そ の 他 業 務 利 益 (469) 131 (601)
Expenses (excluding non-recurrent items) 経費(除く臨時処理分) 21,724 452 21,271
Personnel expenses 人 件 費 9,506 24 9,482
Non-personnel expenses 物 件 費 10,648 353 10,295
Taxes 税 金 1,569 75 1,494
Real net business profit 実 質 業 務 純 益 7,380 (63) 7,444
Business profit on core banking operations コ ア 業 務 純 益 8,122 (134) 8,257
Gains (losses) on cancellation of investment trusts 投 資 信 託 解 約 損 益 751 566 185
Excluding gains (losses) on cancellation of investment trusts
除く投資信託解約損益 7,371 (701) 8,072
Provision of general allowance for possible loan losses (2) 一 般 貸 倒 引 当 金
繰 入 額(209) (209) -
Net business profit 業 務 純 益 7,589 145 7,444
Gains (losses) on bond trading うち国債等債券関係
損 益 ( 5 勘 定 尻 )(742) 71 (813)
Non-recurrent items 臨 時 損 益 (857) (2,988) 2,131
Recoveries of written-off claims うち償却債権取立益 183 (70) 253
Net gains (losses) on equity trading うち株式等関係損益
( 3 勘 定 尻 )(326) (2,227) 1,901
Losses on bad debt disposal (3) うち不良債権処理損失 1,271 915 355
Provision of specific allowance for loan losses 個別貸倒引当金繰入額 711 711 -
Written-off of loans 貸 出 金 償 却 559 204 355
Reversal of allowance for loan losses (4) うち貸倒引当金戻入益 - (17) 17
Reversal of general allowance for loan losses 一般貸倒引当金戻入額 - (675) 675 Provision of specific allowance for loan losses 個別貸倒引当金繰入額 - (658) 658
Reversal of reserve for compensation for trust principal losses (5) うち信託元本補填引当金
戻 入 額40 19 20
Ordinary profit 経 常 利 益 6,731 (2,843) 9,575
Extraordinary gains (losses) 特 別 損 益 (61) 27 (89)
Gain on receipt of national subsidies 国 庫 補 助 金 受 贈 益 - (203) 203
Losses on disposal of noncurrent assets 固 定 資 産 処 分 損 益 (61) 2 (64)
Impairment gain (loss) 減 損 損 益 - (85) 85
Loss on tax purpose reduction entry of noncurrent assets 固 定 資 産 圧 縮 損 - (143) 143
Income before income taxes 税 引 前 当 期 純 利 益 6,669 (2,815) 9,485
Income taxes-current 法 人 税 、 住 民 税 及 び
事 業 税1,962 (834) 2,796
Income taxes-deferred 法 人 税 等 調 整 額 (198) (62) (135)
Total income taxes 法 人 税 等 合 計 1,764 (897) 2,661
Net income 当 期 純 利 益 4,905 (1,918) 6,824
Credit cost ((1) + (2) + (3) - (4) - (5)) 与 信 費 用 1,021 704 317
(Note) Real net business profit = net business profit + provision of general allowance for possible loan losses + expenses for the disposal of bad debt included in trust account
Business profit on core banking operations=real net business profit - gains (losses) on bond trading

2
Consolidated (¥ million)
(Japanese) FY19
YoY increase (decrease) FY18
Gross business profit 連 結 業 務 粗 利 益 32,817 520 32,297
Interest income 資 金 利 益 28,521 532 27,988
Trust fees 信 託 報 酬 118 (38) 156
Fees and commissions 役 務 取 引 等 利 益 2,231 (419) 2,651
Other business profit そ の 他 業 務 利 益 1,946 445 1,500
Operating expenses 営 業 経 費 24,023 360 23,663
Loan-loss provisions 貸 倒 償 却 引 当 費 用 1,473 482 990
Provision of general allowance for possible loan losses 一 般 貸 倒 引 当 金 繰 入 額 (243) 478 (721)
Provision of specific allowance for loan losses 個 別 貸 倒 引 当 金 繰 入 額 639 (243) 882
Written-off of loans 貸 出 金 償 却 1,077 247 829
Net gains (losses) on equity securities 株 式 等 関 係 損 益 (325) (2,229) 1,903
Other そ の 他 1,122 80 1,042
Ordinary profit 経 常 利 益 8,117 (2,471) 10,588
Extraordinary gains (losses) 特 別 損 益 (62) 27 (90)
Gain on receipt of national subsidies 国 庫 補 助 金 受 贈 益 - (203) 203
Losses on disposal of noncurrent assets 固 定 資 産 処 分 損 益 (62) 2 (65)
Impairment loss 減 損 損 失 - (85) 85
Loss on tax purpose reduction entry of noncurrent assets 固 定 資 産 圧 縮 損 - (143) 143
Income before income taxes 税 金 等 調 整 前
当 期 純 利 益8,054 (2,443) 10,498
Income taxes-current 法 人 税 、 住 民 税 及 び
事 業 税2,453 (826) 3,279
Income taxes-deferred 法 人 税 等 調 整 額 (161) (11) (149)
Total income taxes 法 人 税 等 合 計 2,291 (837) 3,129
Net income 当 期 純 利 益 5,762 (1,606) 7,369
Net income attributable to non-controlling interests 非 支 配 株 主 に 帰 属 す る
当 期 純 利 益214 44 169
Net income attributable to owners of the parent 親 会 社 株 主 に 帰 属 す る
当 期 純 利 益5,548 (1,650) 7,199
(Note) Gross business profit = interest income + fund procurement cost for the acquisition of money held in trust + trust fees + fees and commissions + other business profit (Reference) (¥ million)
Net business profit (on a consolidated basis)* 連 結 業 務 純 益 9,252 (446) 9,698
(Note) Gross business profit - operating expenses (excluding non-recurrent items) - provision of general allowance for possible loan losses
(Consolidated) (Number of companies)
Number of consolidated subsidiaries 連 結 子 会 社 数 8 0 8
Number of entities accounted for using equity method 持 分 法 適 用 会 社 数 0 0 0

3
2. Net business profit (non-consolidated) (¥ million)
(Japanese) FY19 YoY increase (decrease)
FY18
Net business profit (prior to provision of general allowance for possible loan losses)
業 務 純 益
(一般貸引繰入前)7,380 (63) 7,444
Per staff (¥ thousand) 職員一人当たり(千円) 6,417 (164) 6,581
Net business profit 業 務 純 益 7,589 145 7,444
Per staff (¥ thousand) 職員一人当たり(千円) 6,599 17 6,581
(Note) The average number of employees during the term (excluding those seconded to other organizations) is employed.
3. Interest margins (non-consolidated) (1) Aggregate
(%)
(Japanese) FY19 YoY increase (decrease)
FY18
Yield on fund operation (A) 資 金 運 用 利 回 1.41 0.01 1.40
Yield on loans 貸 出 金 利 回 1.52 (0.04) 1.56
Yield on securities 有 価 証 券 利 回 0.99 0.08 0.91
Fund procurement cost (B) 資 金 調 達 原 価 1.09 0.01 1.08
Yield on deposits 預 金 等 利 回 0.05 0.01 0.04
Yield on external debt* 外 部 負 債 利 回 (0.00) 0.00 (0.00)
Gross interest margin (A)-(B) 総 資 金 利 鞘 0.32 0.00 0.32
(Note) External debt* = call money + bills sold + borrowed money
(2) Domestic
(%)
(Japanese) FY19 YoY increase (decrease)
FY18
Yield on fund operation (A) 資 金 運 用 利 回 1.38 (0.01) 1.39
Yield on loans 貸 出 金 利 回 1.52 (0.04) 1.56
Yield on securities 有 価 証 券 利 回 0.97 0.10 0.87
Fund procurement cost (B) 資 金 調 達 原 価 1.01 (0.02) 1.03
Yield on deposits 預 金 等 利 回 0.02 0.00 0.02
Yield on external debt* 外 部 負 債 利 回 (0.00) 0.00 (0.00)
Gross interest margin (A)-(B) 総 資 金 利 鞘 0.37 0.01 0.36
(Note) External debt* = call money + bills sold + borrowed money
4
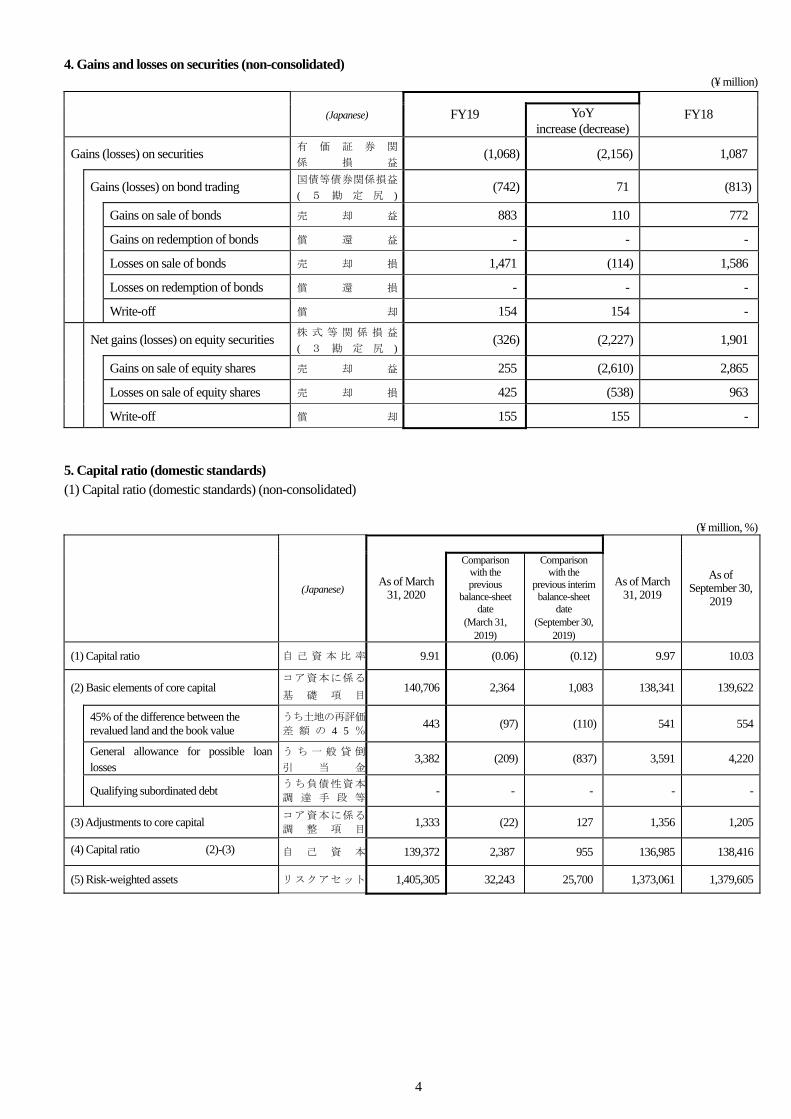
4. Gains and losses on securities (non-consolidated) (¥ million)
(Japanese) FY19 YoY
increase (decrease) FY18
Gains (losses) on securities 有 価 証 券 関
係 損 益(1,068) (2,156) 1,087
Gains (losses) on bond trading
国債等債券関係損益
( 5 勘 定 尻 )(742) 71 (813)
Gains on sale of bonds 売 却 益 883 110 772
Gains on redemption of bonds 償 還 益 - - -
Losses on sale of bonds 売 却 損 1,471 (114) 1,586
Losses on redemption of bonds 償 還 損 - - -
Write-off 償 却 154 154 -
Net gains (losses) on equity securities
株 式 等 関 係 損 益
( 3 勘 定 尻 )(326) (2,227) 1,901
Gains on sale of equity shares 売 却 益 255 (2,610) 2,865
Losses on sale of equity shares 売 却 損 425 (538) 963
Write-off 償 却 155 155 -
5. Capital ratio (domestic standards) (1) Capital ratio (domestic standards) (non-consolidated)
(¥ million, %)
(Japanese) As of March
31, 2020
Comparison with the previous
balance-sheet date
(March 31, 2019)
Comparison with the
previous interim balance-sheet
date (September 30,
2019)
As of March 31, 2019
As of September 30,
2019
(1) Capital ratio 自 己 資 本 比 率 9.91 (0.06) (0.12) 9.97 10.03
(2) Basic elements of core capital コア資本に係る
基 礎 項 目140,706 2,364 1,083 138,341 139,622
45% of the difference between the revalued land and the book value
うち土地の再評価
差 額 の 4 5 %443 (97) (110) 541 554
General allowance for possible loan losses
う ち 一 般 貸 倒
引 当 金3,382 (209) (837) 3,591 4,220
Qualifying subordinated debt
うち負債性資本
調 達 手 段 等- - - - -
(3) Adjustments to core capital コア資本に係る
調 整 項 目1,333 (22) 127 1,356 1,205
(4) Capital ratio (2)-(3) 自 己 資 本 139,372 2,387 955 136,985 138,416
(5) Risk-weighted assets リスクアセット 1,405,305 32,243 25,700 1,373,061 1,379,605

5
(2) Capital ratio (domestic standards) (consolidated) (¥ million, %)
(Japanese) As of March
31, 2020
Comparison with the previous
balance-sheet date
(March 31, 2019)
Comparison with the
previous interim balance-sheet
date (September 30,
2019)
As of March 31, 2019
As of September 30,
2019
(1) Capital ratio 自 己 資 本 比 率 10.52 (0.07) (0.15) 10.59 10.67
(2) Basic elements of core capital コ ア 資 本 に 係 る
基 礎 項 目 152,488 2,604 842 149,884 151,645
45% of the difference between the revalued land and the book value
うち土地の再評価差額
の 4 5 % 443 (97) (110) 541 554
General allowance for possible loan losses
う ち 一 般 貸 倒
引 当 金4,149 (243) (944) 4,392 5,094
Qualifying subordinated debt
う ち 負 債 性 資 本
調 達 手 段 等 - - - - -
(3) Adjustments to core capital コ ア 資 本 に 係 る
調 整 項 目 1,430 (52) 111 1,483 1,318
(4) Capital ratio (2)-(3) 自 己 資 本 151,057 2,656 730 148,401 150,327
(5) Risk-weighted assets リ ス ク ア セ ッ ト 1,434,626 34,462 26,648 1,400,164 1,407,978
6. ROE (non-consolidated)
(%)
(Japanese) FY19 YoY
increase (decrease)
FY18
Net business profit basis 業 務 純 益 ベ ー ス 5.19 0.04 5.15
Business profit on core banking operations basis コア業務純益ベース 5.55 (0.16) 5.71
Net income basis 当 期 純 利 益 ベ ー ス 3.35 (1.37) 4.72
(Calculation formula) Net business profit (business profit on core banking operations, net income)
(Net assets at the beginning of period + net assets at the end of period) ÷ 2 ×100
* Business profit on core banking operations = Net business profit – gains (losses) on bond trading + provision of general allowance for possible loan losses + written-off claims under trust accounts
* Subscription rights to shares are excluded from net assets.
(Reference)
ROE (shareholders’ equity basis; non-consolidated) (%)
(Japanese) FY19 YoY
increase (decrease)
FY18
Net business profit basis 業 務 純 益 ベ ー ス 5.57 (0.05) 5.62
Business profit on core banking operations basis コア業務純益ベース 5.96 (0.27) 6.23
Net income basis 当 期 純 利 益 ベ ー ス 3.60 (1.55) 5.15
(Calculation formula) Net business profit (business profit on core banking operations, net income)
(Shareholders’ equity at the beginning of period + shareholders’ equity at the end of period) ÷ 2 ×100

6
II. Loans and Bills Discounted 1. Risk-monitored loans (under the Banking Law) * Partial charge-offs are recorded. ** Accrued interests are not recorded (on the self-assessment basis). Non-consolidated (¥ million)
(Japanese) As of March
31, 2020
Comparison with the previous
balance-sheet date
(March 31, 2019)
Comparison with the
previous interim balance-sheet
date (September 30,
2019)
As of March 31, 2019
As of September 30, 2019
Loans to bankrupt borrowers 破綻先債権額 1,156 (132) 145 1,289 1,011
Delinquent loans 延 滞 債 権 額 11,414 651 337 10,762 11,076
Past due loans (3 months or more)
3 ヶ 月 以 上
延 滞 債 権 額371 (72) (96) 443 468
Restructured loans 貸出条件緩和
債 権 額7,399 517 641 6,881 6,757
Risk- m
onitored assets
リスク管理債権
Total 合 計 20,341 964 1,028 19,376 19,313
(Note) Including trust accounts.
(¥ million)
Loans (term-end balance) 貸 出 金 残 高
( 末 残 )1,652,167 20,431 28,406 1,631,735 1,623,760
(Note) Including trust accounts.
(%)
Loans to bankrupt borrowers 破 綻 先 債 権 0.07 (0.00) 0.00 0.07 0.06
Delinquent loans 延 滞 債 権 0.69 0.03 0.00 0.66 0.68
Past due loans (3 months or more)
3 ヶ 月 以 上
延 滞 債 権0.02 (0.00) (0.00) 0.02 0.02
Restructured loans 貸出条件緩和
債 権0.44 0.02 0.03 0.42 0.41
As a percentage of total loans
貸出金残高比
Total 合 計 1.23 0.04 0.04 1.18 1.18
(Note) Including trust accounts. Consolidated (¥ million)
(Japanese) As of March
31, 2020
Comparison with the previous
balance-sheet date
(March 31, 2019)
Comparison with the
previous interim balance-sheet
date (September 30,
2019)
As of March 31, 2019
As of September 30, 2019
Loans to bankrupt borrowers 破綻先債権額 1,170 (121) 150 1,291 1,019
Delinquent loans 延 滞 債 権 額 11,926 656 365 11,269 11,560
Past due loans (3 months or more)
3 ヶ 月 以 上
延 滞 債 権 額371 (72) (96) 443 468
Restructured loans 貸出条件緩和
債 権 額7,399 517 641 6,881 6,757
Risk- m
onitored assets
リスク管理債権
Total 合 計 20,867 981 1,061 19,886 19,806
(Note) Including trust accounts.
(¥ million)
Loans (term-end balance) 貸 出 金 残 高
( 末 残 )1,640,393 20,327 28,693 1,620,066 1,611,700
(Note) Including trust accounts.

7
(%)
Loans to bankrupt borrowers 破 綻 先 債 権 0.07 (0.00) 0.00 0.08 0.06
Delinquent loans 延 滞 債 権 0.72 0.03 0.01 0.69 0.71
Past due loans (3 months or more)
3 ヶ 月 以 上
延 滞 債 権0.02 (0.00) (0.00) 0.02 0.02
Restructured loans 貸出条件緩和
債 権0.45 0.02 0.03 0.42 0.41
As a percentage of total loans
貸出金残高比
Total 合 計 1.27 0.04 0.04 1.22 1.22
(Note) Including trust accounts.

8
2. Allowance for loan losses Non-consolidated (¥ million)
(Japanese) As of March
31, 2020
Comparison with the previous
balance-sheet date(March 31, 2019)
Comparison with the previous
interim balance-sheet date
(September 30, 2019)
As of March 31, 2019
As of September 30,
2019
Allowance for possible loan losses
貸 倒 引 当 金 6,407 (221) (560) 6,628 6,967
General allowance 一般貸倒引当金 3,382 (209) (837) 3,591 4,220
Specific allowance 個別貸倒引当金 3,024 (12) 277 3,036 2,747
Reserve for compensation for trust principal losses
信託元本補填
引 当 金 22 (40) (31) 62 54
Consolidated (¥ million)
(Japanese) As of March
31, 2020
Comparison with the previous
balance-sheet date(March 31, 2019)
Comparison with the previous
interim balance-sheet date
(September 30, 2019)
As of March 31, 2019
As of September 30,
2019
Allowance for possible loan losses
貸 倒 引 当 金 8,608 (433) (663) 9,042 9,272
General allowance 一般貸倒引当金 4,149 (243) (944) 4,392 5,094
Specific allowance 個別貸倒引当金 4,459 (190) 280 4,649 4,178
Reserve for compensation for trust principal losses
信託元本補填
引 当 金 22 (40) (31) 62 54
3. Coverage of risk monitored loans Non-consolidated (¥ million, %)
(Japanese) As of March
31, 2020
Comparison with the previous
balance-sheet date(March 31, 2019)
Comparison with the previous
interim balance-sheet date
(September 30, 2019)
As of March 31, 2019
As of September 30,
2019
Risk-monitored loans (A) リスク管理債権額 20,341 964 1,028 19,376 19,313
Coverage 保 全 額 16,899 232 431 16,667 16,468
Allowance for possible loan losses (B)
貸 倒 引 当 金 3,937 (81) 168 4,019 3,769
Collateral and guarantees (C)
担 保 ・ 保 証 等 12,961 313 262 12,648 12,698
Coverage ratio (B+C)/(A) 保 全 率 83.07 86.01 85.26
Allowance for possible loan losses (B/A)
貸 倒 引 当 金 19.35
1 38) 0 15)
20.74 19.51
Collateral and guarantees (C/A)
担 保 ・ 保 証 等 63.72
1 55) 2 03)
65.27 65.75
(Note) Including trust accounts.

9
Consolidated (¥ million, %)
(Japanese) As of March
31, 2020
Comparison with the previous
balance-sheet date(March 31, 2019)
Comparison with the previous
interim balance-sheet date
(September 30, 2019)
As of March 31, 2019
As of September 30,
2019
Risk-monitored loans (A) リスク管理債権額 20,867 981 1,061 19,886 19,806
Coverage 保 全 額 17,418 247 463 17,171 16,955Allowance for possible loan losses (B)
貸 倒 引 当 金 4,072 (54) 218 4,126 3,854
Collateral and guarantees (C)
担 保 ・ 保 証 等 13,345 301 244 13,044 13,100
Coverage ratio (B+C)/(A) 保 全 率 83.47 (2.87) (2.13) 86.34 85.60Allowance for possible loan losses (B/A)
貸 倒 引 当 金 19.51 (1.23) 0.05 20.75 19.46
Collateral and guarantees (C/A)
担 保 ・ 保 証 等 63.95 (1.63) (2.19) 65.59 66.14
(Note) Including trust accounts.

10
4. Mandatory disclosure of bad debt under the Financial Reconstruction Law * Partial charge-offs are recorded. Non-consolidated (¥ million, %)
(Japanese) As of March
31, 2020
Comparison with the previous
balance-sheet date
(March 31, 2019)
Comparison with the
previous interim balance-sheet
date (September 30,
2019)
As of March 31, 2019
As of September 30, 2019
Bankrupt and quasi-bankrupt assets 破産更生債権及び
これらに準ずる債権5,587 (1,998) (1,215) 7,586 6,803
Doubtful assets 危 険 債 権 6,999 2,517 1,691 4,481 5,307
Substandard loans 要 管 理 債 権 7,771 445 545 7,325 7,225
Total (A) 合 計 20,358 964 1,021 19,393 19,336
Normal assets 正 常 債 権 1,640,677 18,345 26,892 1,622,332 1,613,785
Total credit balance (B) 総 与 信 残 高 1,661,036 19,310 27,913 1,641,725 1,633,122As a percentage of total credit balance
(A)/(B) 総 与 信 残 高 に
占 め る 割 合1.22 0.04 0.04 1.18 1.18
Partial charge-offs 部 分 直 接
償 却 額2,029 215 (441) 1,813 2,470
(Note) Including trust accounts.
Consolidated (¥ million, %)
(Japanese) As of March
31, 2020
Comparison with the previous
balance-sheet date
(March 31, 2019)
Comparison with the
previous interim balance-sheet
date (September 30,
2019)
As of March 31, 2019
As of September 30, 2019
Bankrupt and quasi-bankrupt assets 破産更生債権及び
これらに準ずる債権6,100 (1,984) (1,184) 8,085 7,285
Doubtful assets 危 険 債 権 7,011 2,519 1,694 4,492 5,317
Substandard loans 要 管 理 債 権 7,771 445 545 7,325 7,225
Total (A) 合 計 20,883 981 1,054 19,902 19,829
Normal assets 正 常 債 権 1,628,394 18,223 27,146 1,610,170 1,601,247
Total credit balance (B) 総 与 信 残 高 1,649,278 19,204 28,201 1,630,073 1,621,076
As a percentage of total credit balance (A)/(B)
総 与 信 残 高 に
占 め る 割 合1.26 0.04 0.04 1.22 1.22
Partial charge-offs 部 分 直 接
償 却 額9,367 929 586 8,438 8,781
(Note) Including trust accounts.
5. Coverage of assets subject to mandatory disclosure under the Financial Reconstruction Law Non-consolidated (¥ million)
(Japanese) As of March
31, 2020 Comparison with
the previous balance-sheet date (March 31, 2019)
Comparison with the previous
interim balance-sheet date
(September 30, 2019)
As of March 31, 2019
As of September 30, 2019
Coverage (C) 保 全 額 16,916 234 424 16,681 16,491
Allowance for loan losses 貸 倒 引 当 金 3,948 (78) 162 4,027 3,785
Collateral and guaranteed 担保・保証等 12,967 312 262 12,654 12,705
(Note) Including trust accounts.
(%)
Coverage ratio (C)/(A) 保 全 率 83.09 (2.92) (2.19) 86.01 85.28

11
Consolidated (¥ million)
(Japanese) As of March
31, 2020 Comparison with
the previous balance-sheet date (March 31, 2019)
Comparison with the previous
interim balance-sheet date
(September 30, 2019)
As of March 31, 2019
As of September 30, 2019
Coverage (C) 保 全 額 17,434 249 456 17,185 16,978
Allowance for loan losses 貸 倒 引 当 金 4,083 (51) 212 4,134 3,870
Collateral and guaranteed 担保・保証等 13,351 300 243 13,050 13,107
(Note) Including trust accounts. (%)
Coverage ratio (C)/(A) 保 全 率 83.48 (2.86) (2.13) 86.34 85.62
6. Allowance ratio and coverage ratio of assets subject to mandatory disclosure under the Financial Reconstruction Law by
asset category and borrower category Allowance ratios and coverage ratios of assets subject to mandatory disclosure under the Financial Reconstruction Law (non-consolidated) (¥ million, %)
As of March 31, 2020 (Japanese) Bankrupt and quasi-
bankrupt assets Doubtful assets
Substandard loans
Total
Total credit balance (A) 総 与 信 額 5,587 6,999 7,771 20,358
Covered portion (B) 担 保 等 の 保 全 額 3,800 4,757 4,409 12,967
Uncovered portion (C)=(A)-(B) 未 保 全 額 1,787 2,241 3,361 7,390
Allowance for loan losses (D) 引 当 額 1,787 1,225 936 3,948
Allowance ratio (D)/(C) 引 当 率 100.00 54.64 27.84 53.42
Coverage ratio [(B)+(D)]/(A) 保 全 率 100.00 85.47 68.79 83.09
(Note) Including trust accounts.
Allowance ratio and coverage ratio of assets by borrower category (non-consolidated) (¥ million, %)
As of March 31, 2020 (Japanese)
Bankrupt assets Effectively bankrupt assets
Potentially bankrupt assets Total
Total credit balance (A) 総 与 信 額 1,158 4,429 6,999 12,587
Covered portion (B) 担 保 等 の 保 全 額 991 2,809 4,757 8,557
Uncovered portion (C)=(A)-(B) 未 保 全 額 167 1,620 2,241 4,029
Allowance for loan losses (D) 引 当 額 167 1,620 1,225 3,012
Allowance ratio (D)/(C) 引 当 率 100.00 100.00 54.64 74.76
Coverage ratio [(B)+(D)]/(A) 保 全 率 100.00 100.00 85.47 91.92
(Note) Including trust accounts.

12
Allowance ratios and coverage ratios of assets subject to mandatory disclosure under the Financial Reconstruction Law (consolidated) (¥ million, %)
As of March 31, 2020 (Japanese) Bankrupt and quasi-
bankrupt assets Doubtful assets
Substandard loans
Total
Total credit balance (A) 総 与 信 額 6,100 7,011 7,771 20,883
Covered portion (B) 担 保 等 の 保 全 額 4,184 4,757 4,409 13,351
Uncovered portion (C)=(A)-(B) 未 保 全 額 1,916 2,254 3,361 7,532
Allowance for loan losses (D) 引 当 額 1,916 1,230 936 4,083
Allowance ratio (D)/(C) 引 当 率 100.00 54.59 27.84 54.21
Coverage ratio [(B)+(D)]/(A) 保 全 率 100.00 85.40 68.78 83.48
(Note) Including trust accounts.
Allowance ratio and coverage ratio of assets by borrower category (consolidated) (¥ million, %)
As of March 31, 2020 (Japanese)
Bankrupt assets Effectively bankrupt assets
Potentially bankrupt assets Total
Total credit balance (A) 総 与 信 額 1,171 4,929 7,011 13,112
Covered portion (B) 担 保 等 の 保 全 額 1,002 3,181 4,757 8,941
Uncovered portion (C)=(A)-(B) 未 保 全 額 169 1,747 2,254 4,171
Allowance for loan losses (D) 引 当 額 169 1,747 1,230 3,147
Allowance ratio (D)/(C) 引 当 率 100.00 100.00 54.59 75.45
Coverage ratio [(B)+(D)]/(A) 保 全 率 100.00 100.00 85.40 92.19
(Note) Including trust accounts.
7. Asset self-assessment and classification of assets (non-consolidated)
(¥ million, %)
As of March 31, 2020 As of March 31, 2019 (Japanese)
Amounts As a percentage
of total credit (%)Amount
As a percentage of total credit (%)
Total credit balance 総 与 信 残 高 1,661,036 100.00 1,641,725 100.00
Classification I 非 分 類 額 1,501,045 90.36 1,509,110 91.92
Total classified amount 分 類 額 合 計 159,990 9.60 132,615 8.07
Classification II Ⅱ 分 類 159,088 9.57 132,029 8.04
Classification III Ⅲ 分 類 902 0.05 585 0.03
Classification IV Ⅳ 分 類 - - - -
(Notes)
1. Total credit balance: total balance of securities loaned, loans and bills discounted, foreign exchanges, accrued interest, suspense payments and customers’ liabilities for acceptances
and guarantees. The provision of specific allowance for loan losses is deducted from figures of each classification.
2. Classification I: Assets not classified under Classifications II, III, or IV assets, with no risks of noncollectivity or impairment of asset value
Classification II: Assets perceived to have an above-average risk of noncollectivity
Classification III: Assets for which final collection or asset value is very doubtful and which pose a high risk of incurring loss for which reasonable estimation is difficult
Classification IV: Assets assessed as uncollectible or worthless

13
Self-assessment borrower categories 自己査定区分
Standards for write-offs and reserves 償却・引当基準
Bankrupt assets 破綻先債権
Effectively bankrupt assets 実質破綻先債権
Provision of specific allowance for possible loan losses in a full amount of the portion not covered by collateral and guarantees, or direct charge-offs 担保・保証等で保全されていない債権額の100%を個別貸倒引当金として計上するか、又は直接償却
する。
Potentially bankrupt assets 破綻懸念先債権
Provision of specific allowance for possible loan losses in an amount of estimated losses calculated by multiplying the estimated loss rate based on the historical default rate 貸倒実績率に基づく予想損失率を乗じて算定した予想損失額に相当する額を個別貸倒引当金として
計上する。
Assets requiring monitoring 要管理先債権
Provision of general allowance for possible loan losses in an amount of estimated losses calculated by multiplying the estimated loss rate for three years based on the historical default rate to the asset balance 対象債権残高に対し、貸倒実績率に基づく今後3年間の予想損失率を乗じて算定した予想損失額を
一般貸倒引当金として計上する。
Other assets requiring caution その他要注意先債権
Normal assets 正常先債権
Provision of general allowance for possible loan losses in an amount of estimated losses calculated by multiplying the estimated loss rate for one year based on the historical default rate to the asset balance 対象債権残高に対し、貸倒実績率に基づく今後1年間の予想損失率を乗じて算定した予想損失額を
一般貸倒引当金として計上する。
However, the following standards for write-offs and reserves have been adopted for the DCFs and DDSs.
DCF DCF先
Provision of general allowances for possible loan losses in an amount of asset balance after deduction of discounted present value of future cash flows 対象先の将来キャッシュ・フローの割引現在価値を見積り、当該額を対象債権残高から控除した金額を一般貸倒引当金とし
て計上する。
DDS DDS先
Estimated loan losses on total monetary claims in an amount calculated by using the estimated loss rate without regard to preference or subordination, or in an amount equivalent to acquisition cost or write-off cost estimating that the collectible amount of subordinated loans is zero 当該債務者に対する金銭債権全体について、優先・劣後の関係を考慮せずに予想損失率を用いて計上する。又は、資本的劣
後ローンの回収可能見込額をゼロと算定し、取得原価又は償却原価と同額を貸倒見込額として計上する。

14
8. Asset self-assessment and mandatory disclosure of assets under the Financial Reconstruction Law (non-consolidated) (¥ million)
Asset self-assessment (by assets category) 自己査定結果(債務者区分)
Scope: Total credits 対象:総与信
Classification 分類
Assets category (after charge-
offs) 債務者区分 (償却後)
I 非分類
II Ⅱ分類
III Ⅲ分類
IV Ⅳ分類
Assets subject to mandatory
disclosure under the Financial
Reconstruction Law
金融再生法 開示債権
Scope: Total credits対象:総与信
Risk-monitored loans リスク 管理債権
Scope: Loans and bills
discounted 対象:貸出金
Allowance引当金
Coverage ratio
(Allowance ratio) 保全率
(引当率)
Portion of claims secured by reserves,
collateral or guarantees
引当・担保・保証
等による保全部分
Bankrupt
loans 破綻先債権
1,156
Bankrupt assets 破綻先 1,158
286 871
167 100.00%
Portion of claims secured by reserves,
collateral or guarantees
引当・担保・保証
等による保全部分
Effectively
bankrupt assets 実質破綻先
4,429
2,322 2,107
Fully reserved全額引当
Direct charge-offs
償却引当
Bankrupt and
quasi-bankrupt assets
破産更生債権 及びこれらに 準ずる債権
5,587
Coverage ratio:
保全率:
100.00% 1,620 100.00%
Portion of claims secured by reserves,
collateral or guarantees
引当・担保・保証
等による保全部分
Potentially bankrupt assets
破綻懸念先
6,999
2,461 3,635
Necessary amount reserved 必要額を
引当
902
Doubtful assets
危険債権 6,999
Coverage
ratio: 保全率: 85.47%
Delinquent loans
延滞債権
11,414
1,225 85.47%
(54.64%)
Past due loans (3 months or
more) 3ヶ月以上 延滞債権
371
Substandard
loans 要管理債権
7,771
Coverage ratio:
保全率:
68.78% Restructured
loans 貸出条件 緩和債権
7,399
Assets requiring
monitoring 要管理先
10,670
1,744
8,925
1,041
68.98% (23.94%)
Total 合計
20,341
Subtotal 小計
20,358
Overall coverage
全体の保全率 83.09%
Assets requiring caution
要注意先
Other assets
requiring caution 要管理先 以外の 要注意先
167,899
24,351 143,547 1,827
Normal assets 正 常 先
1,469,878 1,469,878
Normal assets正常債権
1,640,677
515
Total 合計
1,661,036 1,501,045 159,088 902 - 1,661,036 1,652,167 6,397
81.39% (48.37%)
(Note) Including trust accounts.
Provision of reserves in an estimated loss amount for three years based on historical default rates. Fully reserved for loans converted to subordinated debt (DDS). 貸倒実績率に基 づく3年間の予 想損失額を引 当。資本的劣後 ローン(DDS) は全額引当。
Provision of reserves in an estimated loss amount for one year based on historical default rates. 貸倒実績率に 基づく1年間 の予想損失額 を引当。
Collateral: 担保: 6,319 Non-Covered: 信用: 4,351

15
9. Loans and bills discounted by industrial segment (non-consolidated) (1) Loans made by industrial segment (non-consolidated)
(¥ million)
(Japanese)
As of March 31,
2020
Comparison with the
previous balance-
sheet date
(March 31, 2019)
Comparison with the
previous interim
balance-sheet date
(September 30, 2019)
As of March 31,
2019
As of September 30, 2019
Domestic branches (excl. the special account for international financial transactions)
国内店分(除く特別
国際金融取引勘定)1,652,167 20,431 28,406 1,631,735 1,623,760
Manufacturing 製 造 業 34,461 (389) (537) 34,851 34,999
Agriculture and forestry 農 業 , 林 業 2,528 216 115 2,312 2,413
Fishery 漁 業 614 101 50 512 563
Mining and quarrying of stone and gravel 鉱 業 , 採 石 業 ,砂 利 採 取 業
3,280 (213) 1,078 3,493 2,201
Construction 建 設 業 54,582 3,154 6,109 51,428 48,473
Electricity, gas, heat and water supply 電気・ガス・熱供
給 ・ 水 道 業12,807 2,533 102 10,274 12,705
Telecommunications 情 報 通 信 業 11,446 208 493 11,238 10,952
Transport and postal activities 運 輸 業 , 郵 便 業 10,338 (2,216) 2 12,554 10,335
Wholesaling and retailing 卸 売 業 , 小 売 業 94,159 (5,617) (3,123) 99,777 97,283
Finance and insurance 金 融 業 , 保 険 業 22,865 2,029 3,604 20,835 19,260
Real estate, and goods rental and leasing 不動産業, 物品賃貸業 522,636 19,949 8,820 502,686 513,815
Miscellaneous services 各 種 サ ー ビ ス 業 184,472 1,951 6,144 182,520 178,328
Local government bodies 地 方 公 共 団 体 117,945 (10,697) (438) 128,642 118,383
Others そ の 他 580,029 9,421 5,983 570,607 574,045
(Note) Including trust accounts.
(2) Risk-monitored loans by industrial segment (non-consolidated)
(¥ million)
(Japanese)
As of March 31,
2020
Comparison with the
previous balance-
sheet date
(March 31, 2019)
Comparison with the
previous interim
balance-sheet date
(September 30, 2019)
As of March 31,
2019
As of September 30, 2019
Domestic branches (excl. the special account for international financial transactions)
国内店分(除く特別
国際金融取引勘定)20,341 964 1,028 19,376 19,313
Manufacturing 製 造 業 1,804 (213) (148) 2,018 1,953
Agriculture and forestry 農 業 , 林 業 405 391 364 13 41
Fishery 漁 業 423 (5) (0) 428 424
Mining and quarrying of stone and gravel 鉱 業 , 採 石 業 ,砂 利 採 取 業
5 (12) (6) 17 11
Construction 建 設 業 1,034 473 (50) 560 1,084
Electricity, gas, heat and water supply 電気・ガス・熱供
給 ・ 水 道 業47 16 3 30 44
Telecommunications 情 報 通 信 業 137 (41) 23 178 113
Transport and postal activities 運 輸 業 , 郵 便 業 117 48 44 69 72
Wholesaling and retailing 卸 売 業 , 小 売 業 2,160 360 416 1,799 1,744
Finance and insurance 金 融 業 , 保 険 業 - - (1) - 1
Real estate, and goods rental and leasing 不動産業, 物品賃貸業 4,951 2,397 1,920 2,554 3,030
Miscellaneous services 各 種 サ ー ビ ス 業 4,372 (2,222) (1,377) 6,595 5,749
Local government bodies 地 方 公 共 団 体 - - - - -
Others そ の 他 4,881 (228) (159) 5,109 5,040
(Note) Including trust accounts.
16
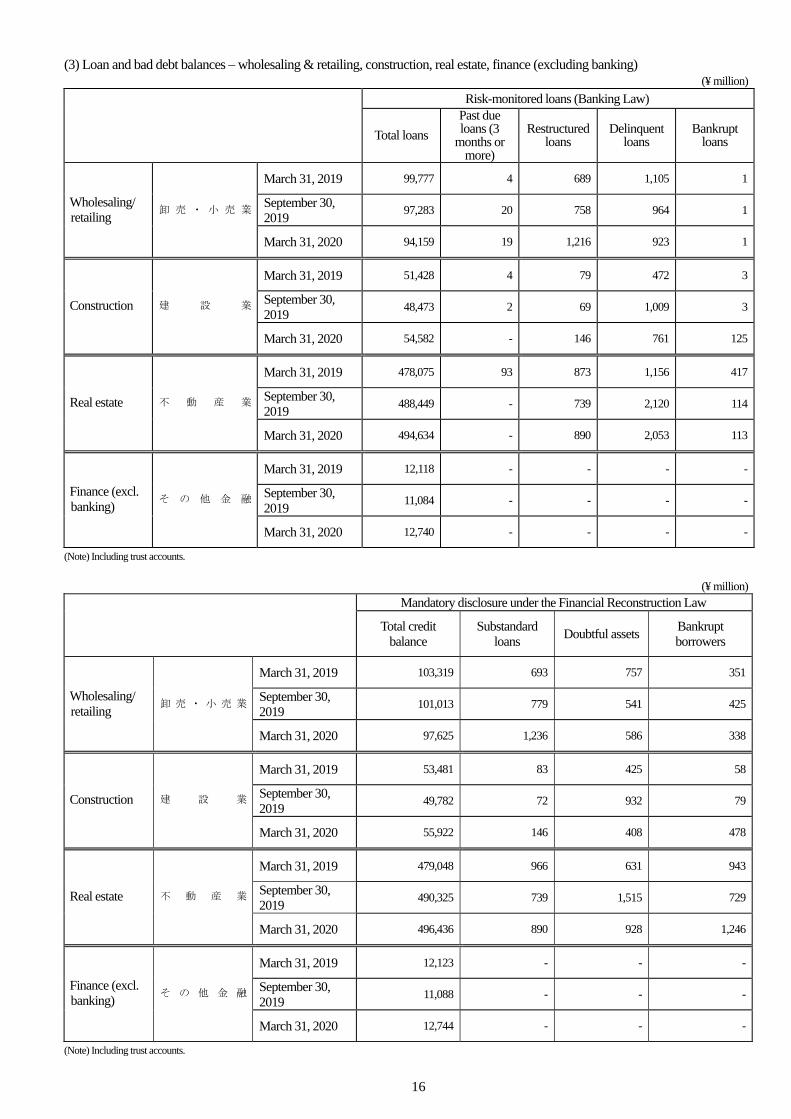
(3) Loan and bad debt balances – wholesaling & retailing, construction, real estate, finance (excluding banking) (¥ million)
Risk-monitored loans (Banking Law)
Total loans
Past due loans (3
months or more)
Restructured loans
Delinquent loans
Bankrupt loans
March 31, 2019 99,777 4 689 1,105 1
September 30, 2019
97,283 20 758 964 1Wholesaling/ retailing
卸 売 ・ 小 売 業
March 31, 2020 94,159 19 1,216 923 1
March 31, 2019 51,428 4 79 472 3
September 30, 2019
48,473 2 69 1,009 3Construction 建 設 業
March 31, 2020 54,582 - 146 761 125
March 31, 2019 478,075 93 873 1,156 417
September 30, 2019
488,449 - 739 2,120 114Real estate 不 動 産 業
March 31, 2020 494,634 - 890 2,053 113
March 31, 2019 12,118 - - - -
September 30, 2019
11,084 - - - -Finance (excl. banking)
そ の 他 金 融
March 31, 2020 12,740 - - - -
(Note) Including trust accounts.
(¥ million)
Mandatory disclosure under the Financial Reconstruction Law
Total credit balance
Substandard loans
Doubtful assets Bankrupt borrowers
March 31, 2019 103,319 693 757 351
September 30, 2019
101,013 779 541 425Wholesaling/ retailing
卸 売 ・ 小 売 業
March 31, 2020 97,625 1,236 586 338
March 31, 2019 53,481 83 425 58
September 30, 2019
49,782 72 932 79Construction 建 設 業
March 31, 2020 55,922 146 408 478
March 31, 2019 479,048 966 631 943
September 30, 2019
490,325 739 1,515 729Real estate 不 動 産 業
March 31, 2020 496,436 890 928 1,246
March 31, 2019 12,123 - - -
September 30, 2019
11,088 - - -Finance (excl. banking)
そ の 他 金 融
March 31, 2020 12,744 - - -
(Note) Including trust accounts.

17
(4) Consumer loan balance (non-consolidated) (¥ million)
(Japanese) As of March 31, 2020
Comparison with the previous
balance-sheet date (March 31, 2019)
Comparison with the previous interim balance-sheet date
(September 30, 2019)
As of March 31,
2019
As of September 30,
2019
696,117 17,221 9,023 678,896 687,093Loans to consumers
生活密着型ローン
残 高 [696,447] [17,173] [8,991] [679,274] [687,456]620,285 16,851 8,181 603,434 612,104
Housing loans (incl. mortgage loans)
うち住宅ローン 残 高 [620,424] [16,829] [8,171] [603,595] [612,253]
75,832 370 842 75,462 74,989 Other than housing loans
うちその他ローン 残 高 [76,022] [344] [819] [75,678] [75,203]
(Note) Amounts posted under trust accounts are included in the figures recorded on the lower rows.
(5) Loans to SMEs and ratio of loans to SMEs to total loans (non-consolidated)
(¥ million, %)
(Japanese) As of March 31, 2020
Comparison with the previous
balance-sheet date(March 31, 2019)
Comparison with the previous interim balance-sheet date(September 30, 2019)
As of March 31,
2019
As of September 30,
2019
1,466,386 30,109 22,422 1,436,277 1,443,964Loans to SMEs 中小企業等貸出残高
[1,467,449] [29,887] [22,304] [1,437,562] [1,445,144]88.81 0.72 (0.18) 88.09 88.99As a
percentage of total loans
中小企業等貸出比率[88.81] [0.71] [(0.18)] [88.10] [88.99]
(Note) Amounts posted under trust accounts are included in the figures recorded on the lower rows.
10. Loans guaranteed by credit guarantee associations (non-consolidated)
(¥ million)
(Japanese) As of
March 31, 2020
As of March 31,
2019
As of September 30,
2019
Loans guaranteed by credit guarantee associations
信用保証協会保証付の
融 資 残 高54,366 53,385 51,037
11. Loan balance to affiliate non-bank financial institutions (non-consolidated)
(¥ million)
As of March 31, 2020 As of March 31, 2019 As of September 30, 2019
13,750 13,858 13,986
12. Deposits and loan balances (non-consolidated)
(¥ million)
As of March 31, 2020
Comparison with the previous
balance-sheet date(March 31, 2019)
Comparison with the previous interim balance-sheet date(September 30, 2019)
As of March 31, 2019
As of September 30,
2019
2,063,642 50,054 (12,466) 2,013,587 2,076,108(term-end balance) [2,083,444] [46,365] [(14,252)] [2,037,078] [2,097,696]
2,055,095 61,458 2,328 1,993,637 2,052,766Deposits 預 金
(average balance) [2,076,901] [57,802] [1,803] [2,019,098] [2,075,097]
1,651,104 20,653 28,524 1,630,450 1,622,580(term-end balance) [1,652,167] [20,431] [28,406] [1,631,735] [1,623,760]
1,614,026 49,653 6,496 1,564,373 1,607,530Loans 貸 出 金
(average balance) [1,615,203] [49,409] [6,445] [1,565,793] [1,608,757]
(Note) Amounts posted under trust accounts are included in the figures recorded on the lower rows.

18
13. Deposit made by individuals and corporations by deposit category (average balance; non-consolidated) (¥ million)
(Japanese)
As of March 31,
2020
Comparison with the previous
balance-sheet date
(March 31, 2019)
Comparison with the
previous interim balance-sheet
date (September 30,
2019)
As of March 31, 2019
As of September 30,
2019
Individuals 個 人 預 金 1,310,865 57,577 14,170 1,253,288 1,296,695
Liquid deposits 流 動 性 預 金 848,585 67,374 16,587 781,211 831,997
Time deposits 定 期 性 預 金 462,280 (9,796) (2,417) 472,077 464,697
Corporations 法 人 預 金 622,114 14,903 (1,160) 607,210 623,274
Liquid deposits 流 動 性 預 金 434,073 25,047 (260) 409,026 434,334
Time deposits 定 期 性 預 金 188,040 (10,143) (900) 198,183 188,940
(Notes) 1. Including trust accounts.
2. Deposits from corporations exclude deposits made by local governments and other public bodies and financial institutions.

19
III. Performance Forecasts 1. Full-year performance forecasts for the year ending March 31, 2021 (non-consolidated)
(¥ million)
(Japanese) Year ending March 31,
2021 forecasts Year ended March 31,
2020 results
Ordinary income 経 常 収 益 33,900 37,008
Ordinary profit 経 常 利 益 5,100 6,731
Net income 当 期 純 利 益 3,800 4,905
Net business profit 業 務 純 益 6,200 7,589
Real net business profit 実 質 業 務 純 益 5,900 7,380
Business profit on core banking operations
コ ア 業 務 純 益 5,900 8,122
Bad debt disposal 不 良 債 権 処 理 額 1,500 1,230
(Note) Including bad debt disposal posted under trust accounts. Net business profit (non-consolidated)
(¥ million) Net business profit posted under trust account
(prior to write-off) Prior to provision of general allowance
信託勘定償却前業務純益
Prior to provision of general allowance
Excluding gains
(losses) on bond trading
After making
provision of general
allowance
Excluding gains (losses)
on bond trading
After making
provision of general
allowance
一般貸引 繰入前 除く債券損益
一般貸引 繰 入 後
一般貸引 繰入前 除く債券損益
一般貸引 繰入後
Year ended March 31, 2019 7,444 8,257 7,444 7,444 8,257 7,444
Year ended March 31, 2020 7,380 8,122 7,589 7,380 8,122 7,589
1H ended September 30, 2019
3,759 3,631 3,130 3,759 3,631 3,130
Year ending March 31, 2021 forecasts 5,900 5,900 6,200 5,900 5,900 6,200
1H ending September 30, 2020 forecasts
2,800 2,900 3,100 2,800 2,900 3,100
2. Employees and branches (non-consolidated) (1) Employees
(Japanese) As of March 31,
2020
Comparison with the previous
balance-sheet date(March 31, 2019)
Comparison with the previous
interim balance-sheet date
(September 30, 2019)
As of March 31, 2019
As of September 30,
2019
Regular employees 在 籍 行 員 数 1,142 27 (29) 1,115 1,171
(2) Branches
(Japanese) As of March 31,
2020
Comparison with the previous
balance-sheet date(March 31, 2019)
Comparison with the previous
interim balance-sheet date
(September 30, 2019)
As of March 31, 2019
As of September 30,
2019
Number of branches 店 舗 数 65 (4) 0 (0) 0 (0) 65 (4) 65 (4)
(Note) Branches include sub-branches. Figures in parenthesis are the number of sub-branches.
20
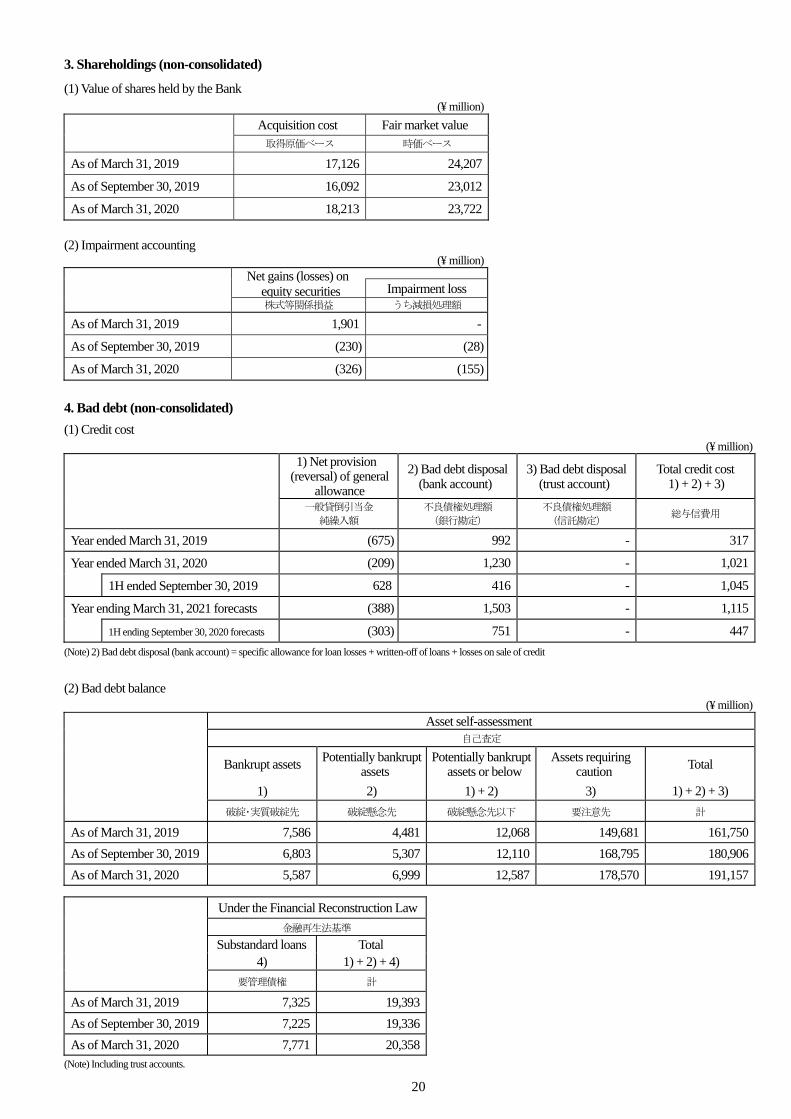
3. Shareholdings (non-consolidated)
(1) Value of shares held by the Bank (¥ million)
Acquisition cost Fair market value
取得原価ベース 時価ベース
As of March 31, 2019 17,126 24,207
As of September 30, 2019 16,092 23,012
As of March 31, 2020 18,213 23,722
(2) Impairment accounting
(¥ million) Net gains (losses) on
equity securities Impairment loss 株式等関係損益 うち減損処理額
As of March 31, 2019 1,901 -
As of September 30, 2019 (230) (28)
As of March 31, 2020 (326) (155)
4. Bad debt (non-consolidated) (1) Credit cost
(¥ million) 1) Net provision
(reversal) of general allowance
2) Bad debt disposal (bank account)
3) Bad debt disposal (trust account)
Total credit cost 1) + 2) + 3)
一般貸倒引当金 純繰入額
不良債権処理額 (銀行勘定)
不良債権処理額 (信託勘定)
総与信費用
Year ended March 31, 2019 (675) 992 - 317
Year ended March 31, 2020 (209) 1,230 - 1,021
1H ended September 30, 2019 628 416 - 1,045
Year ending March 31, 2021 forecasts (388) 1,503 - 1,115
1H ending September 30, 2020 forecasts (303) 751 - 447
(Note) 2) Bad debt disposal (bank account) = specific allowance for loan losses + written-off of loans + losses on sale of credit
(2) Bad debt balance (¥ million)
Asset self-assessment 自己査定
Bankrupt assets Potentially bankrupt assets
Potentially bankrupt assets or below
Assets requiring caution Total
1) 2) 1) + 2) 3) 1) + 2) + 3)
破綻・実質破綻先 破綻懸念先 破綻懸念先以下 要注意先 計
As of March 31, 2019 7,586 4,481 12,068 149,681 161,750
As of September 30, 2019 6,803 5,307 12,110 168,795 180,906
As of March 31, 2020 5,587 6,999 12,587 178,570 191,157
Under the Financial Reconstruction Law
金融再生法基準
Substandard loans Total 4) 1) + 2) + 4)
要管理債権 計
As of March 31, 2019 7,325 19,393
As of September 30, 2019 7,225 19,336
As of March 31, 2020 7,771 20,358(Note) Including trust accounts.

21
(3) Bad debt final disposal and new occurrence
a. Bad debt balance (under the Financial Reconstruction Law) (¥ million)
Bankrupt and quasi-bankrupt assets, etc.
Doubtful assets Total
破産更生等債権 危険債権 合計
As of March 31, 2019 7,586 4,481 12,068
As of September 30, 2019 6,803 5,307 12,110
As of March 31, 2020 5,587 6,999 12,587
New occurrence during FY19 2,405 2,442 4,847
Removed from balance sheet during FY19 2,237 2,090 4,328
Net increase (decrease) during FY19 (1,998) 2,517 519
New occurrence during 2H FY19 992 1,864 2,856
Removed from balance sheet during 2H FY19 959 1,420 2,379
Net increase (decrease) during 2H FY19 (1,215) 1,691 476(Note) Including trust accounts.
b. Removal from balance sheet by type of disposal measure (¥ million)
(Japanese) FY19 results 1H FY19 results FY18 results
Liquidation and similar measures 清 算 型 処 理 - - -
Corporate rehabilitation 再 建 型 処 理 - - -
Improved performance by corporate rehabilitation
再建型処理に伴う
業 況 改 善- - -
Securitization 債 権 流 動 化 - - -
Sale to RCC R C C 向 け 売 却 - - -
Direct charge-offs 直 接 償 却 1,283 714 1,002
Other そ の 他 3,044 2,235 2,830
Collection/repayment 回 収 ・ 返 済 2,162 1,913 1,849 Improved
performance 業 況 改 善 882 322 980
Total 合 計 4,328 2,950 3,832
(4) Reserves for possible loan losses by borrower category and reserve ratios
As of March 31,
2020 As of September
30, 2019 As of March 31,
2019
Bankrupt and effectively bankrupt assets
実 質 破 綻 ・ 破 綻 先 債 権
As a percentage of portion not secured by collateral
無担保部分の100.00
%¥1.7
billion100.00
% ¥1.7
billion 100.00
%¥2.2
billion
Potentially bankrupt assets 破 綻 懸 念 先 債 権
As a percentage of portion not secured by collateral
無担保部分の54.65
%¥1.2
billion52.52
% ¥1.0
billion 55.27
%¥0.8
billion
Assets requiring monitoring (substandard loans)
要管理先債権 As a percentage of debt amount
債 権 額 の9.76
%¥1.0
billion12.45
% ¥1.1
billion 11.30
%¥1.0
billion
Assets requiring caution (excl. substandard loans)
その他要注意
先 債 権 As a percentage of debt amount
債 権 額 の1.08
%¥1.8
billion1.71
% ¥2.7
billion 1.38
%¥1.9
billion
Normal assets 正 常 先 債 権 As a percentage of debt amount
債 権 額 の0.03
%¥0.5
billion0.03
% ¥0.3
billion 0.05
%¥0.6
billion(Note) The Bank recorded provisions for possible losses on assets requiring caution (excl. substandard loans), assets requiring monitoring (substandard loans) and potentially
bankrupt assets in the amount of ¥1.2 billion, ¥0.6 billion and ¥0.0 billion respectively, as of March 31, 2020, with regard to the portion which has been converted to Debt Debt Swap (DDS).

22
(5) Bad debt ratios (under the Financial Reconstruction Law) (%)
(Japanese) FY17 1H FY18 FY18 1H FY19 FY19
Non-consolidated 単 体 ベ ー ス 1.37 1.35 1.18 1.18 1.22Consolidated 連 結 ベ ー ス 1.41 1.39 1.22 1.22 1.26


