54
G 60 MINISTRY OF SOCIAL DEVELOPMENT | ANNUAL REPORT 2013/2014 84 Financial Statements

G 60 MINISTRY OF SOCIAL DEVELOPMENT | ANNUAL REPORT 2013/2014
84
Financial Statements

G 60 MINISTRY OF SOCIAL DEVELOPMENT | ANNUAL REPORT 2013/2014
85
Reporting entityThe Ministry of Social Development (the Ministry) is a government department as defined by section 2 of the Public Finance Act 1989 and is domiciled in New Zealand.
The primary objective of the Ministry is to provide services to the public rather than to make a financial return. Accordingly, the Ministry has designated itself as a public benefit entity for the purposes of applying New Zealand’s equivalents to the International Financial Reporting Standards (NZ IFRS).
The financial statements of the Ministry are for the year ended 30 June 2014. The financial statements were authorised for issue by the Chief Executive of the Ministry on 30 September 2014.
In addition, the Ministry has reported on Crown activities and trust monies it administers.
Basis of preparation
Statement of complianceThe financial statements of the Ministry have been prepared in accordance with the requirements of the Public Finance Act 1989, which includes the requirements to comply with New Zealand Generally Accepted Accounting Practice (NZ GAAP) and Treasury Instructions.
These financial statements have been prepared in accordance with NZ GAAP. They comply with NZ IFRS, and other applicable financial reporting standards, as appropriate for public benefit entities.
The accounting policies set out below have been applied consistently to all periods presented in these financial statements.
Measurement baseThe financial statements have been prepared on a historical cost basis, modified by the revaluation of land and buildings, and certain financial instruments (including derivative instruments).
Functional and presentation currencyThe financial statements are presented in New Zealand dollars and all values are rounded to the nearest thousand dollars ($000). The functional currency of the Ministry is New Zealand dollars.
Changes in accounting policiesThere have been no changes in accounting policies during the financial year.
Standards, amendments and interpretations issued that are not yet effective and have not been early adoptedStandards, amendments and interpretations issued but not yet effective that have not been early adopted, and which are relevant to the Ministry, are:
The Minister of Commerce has approved a new Accounting Standards Framework (incorporating a Tier Strategy) developed by the External Reporting Board (XRB). Under this Accounting Standards Framework, the Ministry is classified as a Tier 1 reporting entity and it will be required to apply full Public Benefit Entity Accounting Standards (PAS). These standards have been developed by the XRB based on the current International Public Sector Accounting Standards. The effective date for the new standards for public sector entities is for reporting periods beginning on or after 1 July 2014 and were published in May 2013. This means the Ministry will transition to the new standards in preparing its 30 June 2015 financial statements.
Due to the changes in the Accounting Standards Framework for public benefit entities, it is expected that all new NZ IFRS and amendments to existing NZ IFRS will not be applicable to public benefit entities. The XRB has effectively frozen the financial reporting requirements for public benefit entities until the new Accounting Standards Framework is effective. Accordingly, no disclosure has been made about new or amended NZ IFRS that exclude public benefit entities from their scope.
The Ministry anticipates that these standards will have no material impact on the financial statements in the period of initial application. It is likely that the changes arising from this framework will affect the disclosures required in the financial statements. However, it is not practicable to provide a reasonable estimate until a detailed review has been completed.
Significant accounting policiesThe following particular accounting policies, which materially affect the measurement of financial results and financial position, have been applied.
Budget figuresThe budget figures are those included in the Information Supporting the Estimates of Appropriations for the Government of New Zealand for the year ended 30 June 2014, which are consistent with the financial information in the Main Estimates. In addition, the financial statements also present the updated budget information from the Supplementary Estimates, which includes the transfers made under section 26A of the Public Finance Act 1989.
Statement of Accounting Policies: Departmental

G 60 MINISTRY OF SOCIAL DEVELOPMENT | ANNUAL REPORT 2013/2014
86
The budget figures have been prepared in accordance with NZ GAAP, using accounting policies that are consistent with those adopted in preparing these financial statements.
RevenueThe Ministry gets revenue from providing outputs to the Crown and for services to third parties. Revenue is recognised when it is earned and is reported in the financial period it relates to.
Cost allocationThe Ministry accumulates and allocates costs to Departmental output expenses using a three-staged costing system, outlined below.
The first stage allocates all direct costs to output expenses as and when they are incurred. The second stage accumulates and allocates indirect costs to output expenses based on cost drivers, such as full-time equivalent (FTE) staff and workload information obtained from surveys, which reflect an appropriate measure of resource consumption/use. The third stage accumulates and allocates overhead costs to output expenses based on resource consumption/use where possible, such as the FTE staff ratio, or where an appropriate driver cannot be found then in proportion to the cost charges in the previous two stages.
Criteria for direct and indirect costsDirect costs are costs that vary directly with the level of activity and are causally related to, and readily assignable to, an output expense. Overhead costs are costs that do not vary with the level of activity undertaken. Indirect costs are costs other than direct costs or overhead costs.
For the year ended 30 June 2014, direct costs accounted for 86.2 per cent of the Ministry’s costs (2013: 85.5 per cent).
Expenses
GeneralExpenses are recognised in the period to which they relate.
Interest expenseInterest expense is accrued using the effective interest rate method.
The effective interest rate exactly discounts estimated future cash payments through the expected life of the financial liability to that liability’s net carrying amount. The method applies this rate to the principal outstanding to determine the interest expense for each period.
Foreign currencyForeign currency transactions (including those for which foreign exchange forward contracts are held) are translated into New Zealand dollars using the exchange rates prevailing at the dates of the transactions. Foreign exchange gains and losses resulting from the settlement of such transactions, and from the translation at year-end exchange rates of monetary assets and liabilities denominated in foreign currencies, are recognised in the Statement of Comprehensive Income.
Financial instrumentsFinancial assetsCash and cash equivalents includes cash on hand, cash in transit, bank accounts and deposits with a maturity of no more than three months from the date of acquisition.
Debtors and other receivables are initially measured at fair value and are subsequently measured at amortised cost using the effective interest rate, less impairment changes.
Impairment of a receivable is established when there is objective evidence the Ministry will not be able to collect amounts due according to the original terms of the receivable. Significant financial difficulties for the debtor, a probability the debtor will enter into bankruptcy, and defaults in payments are considered indicators the debt is impaired. The amount of the impairment is the difference between the asset’s carrying amount and the present value of estimated future cash flows, discounted using the original effective interest rate. The carrying amount of the asset is reduced through the use of an allowance account, and the amount of the loss is recognised in the Statement of Comprehensive Income. Overdue receivables that are renegotiated are reclassified as current (ie, not past due).
Financial liabilitiesThe major financial liability types are creditors and other payables. Both are designated at amortised cost using the effective interest rate method. Financial liabilities entered into with a duration of less than 12 months are recognised at their nominal value.
Property, plant and equipmentProperty, plant and equipment consists of land, buildings, furniture and fittings, computer equipment, motor vehicles and plant and equipment.
Property, plant and equipment items are shown at cost or valuation, less accumulated depreciation and impairment losses.
Individual assets, or groups of assets, are capitalised if their cost is greater than $2,000.
G 60 MINISTRY OF SOCIAL DEVELOPMENT | ANNUAL REPORT 2013/2014
87
AdditionsThe cost of an item of property, plant and equipment is recognised as an asset if, and only if, it is probable the future economic benefits or service potential associated with the item will flow to the Ministry and the cost of the item can be measured reliably.
In most instances, an item of property, plant and equipment is recognised at its cost. Where an asset is acquired at no cost, or for a nominal cost, it is recognised at fair value at the date of acquisition.
DisposalsGains and losses on disposal are determined by comparing the proceeds of disposal with the carrying amount of the asset. Gains and losses on disposal are included in the Statement of Comprehensive Income. When revalued assets are sold, the amounts included in the property, plant and equipment revaluation reserves for those assets are transferred to general funds.
Subsequent costsCosts incurred after the initial acquisition are capitalised only when it is probable the future economic benefits or service potential associated with the item will flow to the Ministry and the cost of the item can be measured reliably.
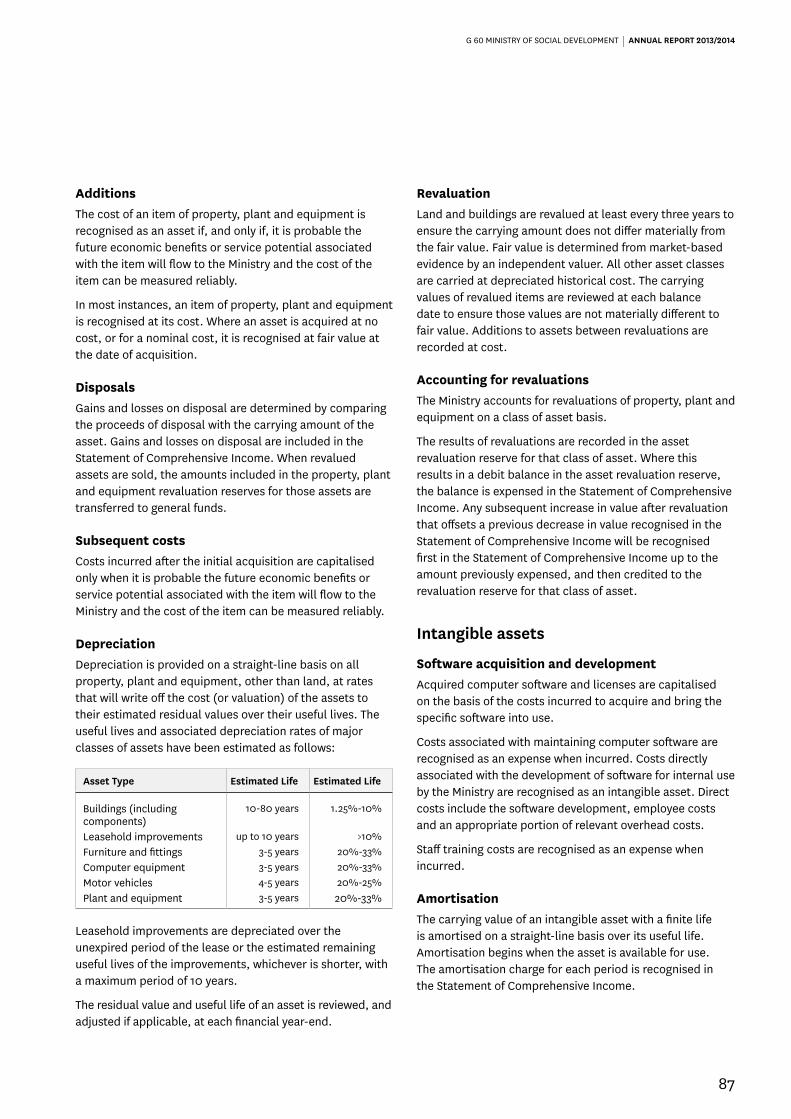
DepreciationDepreciation is provided on a straight-line basis on all property, plant and equipment, other than land, at rates that will write off the cost (or valuation) of the assets to their estimated residual values over their useful lives. The useful lives and associated depreciation rates of major classes of assets have been estimated as follows:
Asset Type Estimated Life Estimated Life
Buildings (including components)
10-80 years 1.25%-10%
Leasehold improvements up to 10 years >10%Furniture and fittings 3-5 years 20%-33%Computer equipment 3-5 years 20%-33%Motor vehicles 4-5 years 20%-25%Plant and equipment 3-5 years 20%-33%
Leasehold improvements are depreciated over the unexpired period of the lease or the estimated remaining useful lives of the improvements, whichever is shorter, with a maximum period of 10 years.
The residual value and useful life of an asset is reviewed, and adjusted if applicable, at each financial year-end.
RevaluationLand and buildings are revalued at least every three years to ensure the carrying amount does not differ materially from the fair value. Fair value is determined from market-based evidence by an independent valuer. All other asset classes are carried at depreciated historical cost. The carrying values of revalued items are reviewed at each balance date to ensure those values are not materially different to fair value. Additions to assets between revaluations are recorded at cost.
Accounting for revaluationsThe Ministry accounts for revaluations of property, plant and equipment on a class of asset basis.
The results of revaluations are recorded in the asset revaluation reserve for that class of asset. Where this results in a debit balance in the asset revaluation reserve, the balance is expensed in the Statement of Comprehensive Income. Any subsequent increase in value after revaluation that offsets a previous decrease in value recognised in the Statement of Comprehensive Income will be recognised first in the Statement of Comprehensive Income up to the amount previously expensed, and then credited to the revaluation reserve for that class of asset.
Intangible assets
Software acquisition and developmentAcquired computer software and licenses are capitalised on the basis of the costs incurred to acquire and bring the specific software into use.
Costs associated with maintaining computer software are recognised as an expense when incurred. Costs directly associated with the development of software for internal use by the Ministry are recognised as an intangible asset. Direct costs include the software development, employee costs and an appropriate portion of relevant overhead costs.
Staff training costs are recognised as an expense when incurred.
AmortisationThe carrying value of an intangible asset with a finite life is amortised on a straight-line basis over its useful life. Amortisation begins when the asset is available for use. The amortisation charge for each period is recognised in the Statement of Comprehensive Income.

G 60 MINISTRY OF SOCIAL DEVELOPMENT | ANNUAL REPORT 2013/2014
88
The useful lives and associated amortisation rate of our major class of intangible assets have been estimated as follows:
Asset Type Estimated Life Estimated Life
Developed computer software 3-8 years 12.5%-33%
Impairment of non-financial assetsIntangible assets that have an indefinite useful life are not subject to amortisation and are tested annually for impairment. Intangible assets not yet available for use at the balance sheet date are tested for impairment annually.
Property, plant and equipment and intangible assets that have a finite useful life are reviewed for impairment whenever events or changes in circumstances indicate the carrying amount may not be recoverable. An impairment loss is recognised for the amount by which the asset’s carrying amount exceeds its recoverable amount. The recoverable amount is the higher of an asset’s fair value less costs to sell and its value in use.
Value in use is the depreciated replacement cost for an asset where the future economic benefits or service potential of the asset are not primarily dependent on the asset’s ability to generate net cash inflows and where the Ministry would, if deprived of the asset, replace its remaining future economic benefits or service potential.
If an asset’s carrying amount exceeds its recoverable amount, the asset is impaired and the carrying amount is written down to the recoverable amount. For revalued assets, the impairment loss is recognised against the revaluation reserve for that class of asset. Where that results in a debit balance in the revaluation reserve, the balance is recognised in the Statement of Comprehensive Income.
The reversal of an impairment loss on a revalued asset is credited to the revaluation reserve. However, to the extent an impairment loss for that class of asset was previously recognised in the Statement of Comprehensive Income, a reversal of the impairment loss is also recognised in the Statement of Comprehensive Income.
For assets not carried at a revalued amount, the reversal of an impairment loss is recognised in the Statement of Comprehensive Income.
Non-current assets held for saleNon-current assets held for sale are classified as held for sale if their carrying amount will be recovered principally through a sale transaction rather than through continuing use. Non-current assets held for sale are measured at the lower of their carrying amount and their fair value less costs to sell.
Impairment losses for write-downs of non-current assets held for sale are recognised in the Statement of Comprehensive Income.
Increases in fair value (less costs to sell) are recognised up to the level of any impairment losses previously recognised.
Non-current assets held for sale (including those that are part of a disposal group) are not depreciated or amortised while they are classified as held for sale.
Income taxGovernment departments are exempt from income tax as public authorities. Accordingly, no charge for income tax has been provided for.
Goods and Services Tax (GST)All items in the financial statements, including the appropriation statements, are stated exclusive of GST except for receivables and payables, which are stated inclusive of GST. Where GST is not recoverable as an input tax, it is recognised as part of the related asset or expense.
The net amount of GST recoverable from, or payable to, the Inland Revenue Department (IRD) is included as part of the receivables or payables in the Statement of Financial Position.
The net GST paid to or received from the IRD, including the GST relating to investing and financing activities, is classified as an operating cash flow in the Statement of Cash Flows.
Commitments and contingencies are disclosed exclusive of GST.
LeasesAn operating lease is a lease that does not transfer substantially all the risks and rewards incidental to the ownership of an asset. Lease payments under an operating lease are recognised as an expense on a straight-line basis over the lease term.

G 60 MINISTRY OF SOCIAL DEVELOPMENT | ANNUAL REPORT 2013/2014
89
Determining whether a lease agreement is a finance lease or an operating lease requires judgement as to whether the agreement transfers substantially all the risks and rewards of ownership to the Ministry. Judgement is required on various aspects that include, but are not limited to, the fair value of the leased asset, the economic life of the leased asset, whether to include renewal options in the lease term, and an appropriate discount rate to calculate the present value of the minimum lease payments. Classification as a finance lease means the asset is recognised in the Statement of Financial Position as property, plant and equipment. With an operating lease no such asset is recognised.
The Ministry has exercised its judgement on the appropriate classification of equipment leases, and has determined the Ministry has no finance leases.
ProvisionsThe Ministry recognises a provision for future expenditure of uncertain amount or timing when there is a present obligation (either legal or constructive) as a result of a past event. A provision is recognised when it is probable an outflow of future economic benefits will be required to settle the obligation and a reliable estimate can be made of the amount of the obligation. Provisions are not recognised for future operating losses.
Provisions are measured at the present value of the expenditure expected to be required to settle the obligation using a pre-tax discount rate that reflects current market assessments of the time value of money and the risks specific to the obligation. The increase in the provision due to the passage of time is recognised as a finance cost.
CommitmentsExpenses yet to be incurred on non-cancellable contracts entered into on or before balance date are disclosed as commitments to the extent there are equally unperformed obligations.
Cancellable commitments that have penalty or exit costs explicit in the agreement on exercising the option to cancel are included in the Statement of Commitments at the value of that penalty or exit cost.
Contingent assets and liabilitiesContingent assets and liabilities are disclosed at the point the contingency is evident.
Employee entitlements
Short-term employee entitlementsEmployee entitlements the Ministry expects to be settled within 12 months of balance date are measured at nominal values based on accrued entitlements at current rates of pay.
These include annual leave earned but not yet taken at balance date, retiring and long service leave entitlements expected to be settled within 12 months, and sick leave.
The Ministry recognises a liability for sick leave to the extent absences in the coming year are expected to be greater than the sick leave entitlements earned in the coming year. The amount is calculated based on the unused sick leave entitlements that can be carried forward at balance date, to the extent the Ministry anticipates they will be used by staff to cover future absences.
The Ministry recognises a liability and an expense for performance payments where it is contractually obliged to pay them, or where there is a past practice that has created a constructive obligation.
Long-term employee entitlementsEntitlements payable beyond 12 months, such as long service leave and retiring leave, have been calculated on an actuarial basis. The calculations are based on:
• likely future entitlements based on years of service, years to entitlement, the likelihood staff will reach the point of entitlement and contractual entitlements information.
• the present value of the estimated future cash flows.
Statement of Cash FlowsCash means cash balances on hand and held in bank accounts.
Operating activities are those activities where the Ministry receives cash from its income sources and makes cash payments for the supply of goods and services.
Investing activities are those activities relating to the acquisition and disposal of non-current assets.
Financing activities comprise capital injections or the repayment of capital to the Crown.

G 60 MINISTRY OF SOCIAL DEVELOPMENT | ANNUAL REPORT 2013/2014
90
Taxpayers’ fundsTaxpayers’ funds are the Crown’s investment in the Ministry and are measured as the difference between total assets and total liabilities. Taxpayers’ funds are disaggregated and classified as general funds and property, plant and equipment revaluation reserves.
Revaluation reservesThese reserves relate to the revaluation of land and buildings to fair value.
Critical accounting estimates and assumptionsIn preparing these financial statements the Ministry has made estimates and assumptions about the future. These estimates and assumptions may differ from the subsequent actual results. Estimates and judgements are continually evaluated and are based on historical experience and other factors, including expectations of future events believed to be reasonable under the circumstances. The estimates and assumptions that have a significant risk of causing a material adjustment to the carrying amounts of assets and liabilities within the next financial year are discussed below.
Retirement and long service leaveAn analysis of the Ministry’s exposure to estimates and uncertainties around its retirement and long service leave liability is contained in the notes (refer Note 14).
Critical judgements in applying the Ministry’s accounting policiesIn accounting for revaluations of land and buildings the Ministry accepts the judgements of the work performed by our independent registered valuer, Andrew Parkyn ANZIV of Quotable Value Limited (refer Note 8).
There were no other significant items for which management had to exercise critical judgement in applying the Ministry’s accounting policies for the year ended 30 June 2014.
G 60 MINISTRY OF SOCIAL DEVELOPMENT | ANNUAL REPORT 2013/2014
91
Actual2013
$000 Notes
Actual2014
$000
MainEstimates
2014$000
SupplementaryEstimates
2014$000
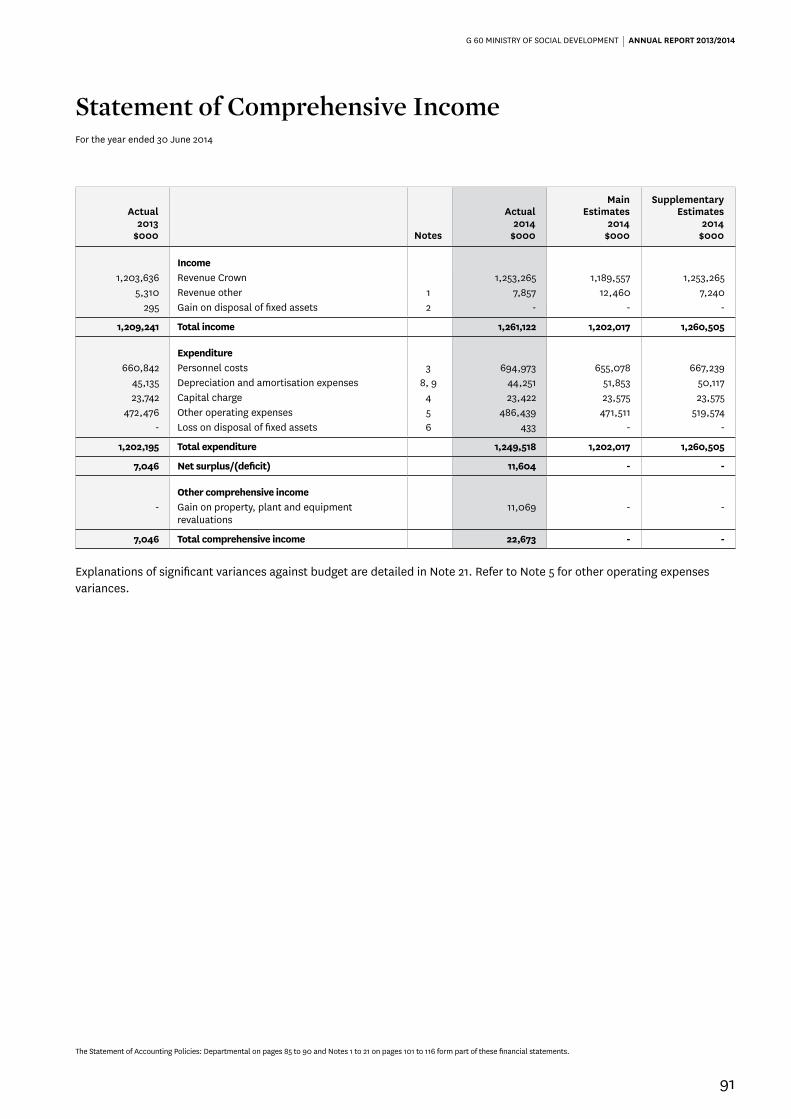
Income1,203,636 Revenue Crown 1,253,265 1,189,557 1,253,265
5,310 Revenue other 1 7,857 12,460 7,240 295 Gain on disposal of fixed assets 2 - - -
1,209,241 Total income 1,261,122 1,202,017 1,260,505
Expenditure660,842 Personnel costs 3 694,973 655,078 667,239
45,135 Depreciation and amortisation expenses 8, 9 44,251 51,853 50,117 23,742 Capital charge 4 23,422 23,575 23,575
472,476 Other operating expenses 5 486,439 471,511 519,574 - Loss on disposal of fixed assets 6 433 - -
1,202,195 Total expenditure 1,249,518 1,202,017 1,260,505
7,046 Net surplus/(deficit) 11,604 - -
Other comprehensive income- Gain on property, plant and equipment
revaluations11,069 - -
7,046 Total comprehensive income 22,673 - -
Explanations of significant variances against budget are detailed in Note 21. Refer to Note 5 for other operating expenses variances.
Statement of Comprehensive IncomeFor the year ended 30 June 2014
The Statement of Accounting Policies: Departmental on pages 85 to 90 and Notes 1 to 21 on pages 101 to 116 form part of these financial statements.

G 60 MINISTRY OF SOCIAL DEVELOPMENT | ANNUAL REPORT 2013/2014
92
Statement of Financial PositionAs at 30 June 2014
Actual2013
$000 Notes
Actual2014
$000
MainEstimates
2014$000
SupplementaryEstimates
2014$000
Taxpayers’ funds256,896 General funds 261,887 256,896 261,887
35,875 Revaluation reserve 46,944 35,875 35,875
292,771 Total taxpayers’ funds 15 308,831 292,771 297,762
AssetsCurrent assets
32,695 Cash and cash equivalents 31,259 40,701 27,990 11,078 Accounts receivable 7 18,353 7,798 11,078 13,056 Prepayments 13,960 10,205 13,056
93,068 Crown receivable 108,859 53,000 81,411
149,897 Total current assets 172,431 111,704 133,535
Non-current assets297,380 Property, plant and equipment 8 302,813 317,662 312,253
50,756 Intangible assets 9 75,925 57,640 52,930
348,136 Total non-current assets 378,738 375,302 365,183
498,033 Total assets 551,169 487,006 498,718
LiabilitiesCurrent liabilities
93,955 Accounts payable and accruals 10 120,411 96,731 98,708 2,013 Revenue received in advance 11 2,108 - -7,046 Return of operating surplus to the Crown 12 11,604 - -
56,347 Provision for employee entitlements 14 60,761 53,622 56,347 6,142 Other provisions 13 6,199 6,916 6,142
165,503 Total current liabilities 201,083 157,269 161,197
Non-current liabilities39,759 Provision for employee entitlements 14 41,255 36,966 39,759
39,759 Total non-current liabilities 41,255 36,966 39,759
205,262 Total liabilities 242,338 194,235 200,956
292,771 Net assets 308,831 292,771 297,762
Explanations of significant variances against budget are detailed in Note 21.
Brendan Boyle Bruce Simpson Chief Executive Chief Financial Officer
30 September 2014 30 September 2014
The Statement of Accounting Policies: Departmental on pages 85 to 90 and Notes 1 to 21 on pages 101 to 116 form part of these financial statements.

G 60 MINISTRY OF SOCIAL DEVELOPMENT | ANNUAL REPORT 2013/2014
93
Actual2013
$000 Note
Actual2014
$000
MainEstimates
2014$000
SupplementaryEstimates
2014$000
300,771 Balance at 1 July 292,771 292,771 292,771 7,046 Total comprehensive income 22,673 - -
(7,046) Return of operating surplus to the Crown 12 (11,604) - -- Capital injections 4,991 - 4,991
(8,000) Capital withdrawal - - -
292,771 Balance at 30 June 308,831 292,771 297,762
Statement of Changes in Taxpayers’ FundsFor the year ended 30 June 2014
The Statement of Accounting Policies: Departmental on pages 85 to 90 and Notes 1 to 21 on pages 101 to 116 form part of these financial statements.

G 60 MINISTRY OF SOCIAL DEVELOPMENT | ANNUAL REPORT 2013/2014
94
Actual2013
$000 Note
Actual2014
$000
MainEstimates
2014$000
SupplementaryEstimates
2014$000
Cash flows from operating activities1,218,004 Receipts from Crown revenue 1,237,474 1,201,557 1,264,922
3,892 Receipts from other revenue 7,869 12,460 7,240 (475,176) Payments to suppliers (472,442) (472,407) (518,606)(655,875) Payments to employees (685,581) (651,782) (665,467)
(23,742) Payments for capital charge (23,422) (23,575) (23,575)(602) Goods and services tax (net) 938 - -
66,501 Net cash flow from operating activities 16 64,836 66,253 64,514
Cash flows from investing activities2,276 Receipts from sale of property, plant and
equipment1,844 1,800 1,800
(25,854) Purchase of property, plant and equipment (24,743) (45,175) (51,129)(17,659) Purchase of intangible assets (41,316) (17,821) (17,833)
(41,237) Net cash flow from investing activities (64,215) (61,196) (67,162)
Cash flows from financing activities- Capital contribution from the Crown 4,991 - 4,991
(8,000) Capital withdrawal from the Crown - - -(14,983) Return of operating surplus to Crown (7,048) (4,000) (7,048)
(22,983) Net cash flow from financing activities (2,057) (4,000) (2,057)
2,281 Net increase/(decrease) in cash held (1,436) 1,057 (4,705)30,414 Cash and cash equivalents at the beginning of
the year32,695 39,644 32,695
32,695 Cash and cash equivalents at the end of the year 31,259 40,701 27,990
The goods and services tax (GST) (net) component of operating activities reflects the net GST paid to and received from the Inland Revenue Department. The GST (net) component is presented on a net basis, as the gross amounts do not provide meaningful information for financial statement purposes and to be consistent with the presentation basis of the other primary financial statements.
Refer to Note 16 for reconciliation of net surplus/(deficit) to net cash from operating activities. Explanations of significant variances against budget are detailed in Note 21.
Statement of Cash FlowsFor the year ended 30 June 2014
The Statement of Accounting Policies: Departmental on pages 85 to 90 and Notes 1 to 21 on pages 101 to 116 form part of these financial statements.

G 60 MINISTRY OF SOCIAL DEVELOPMENT | ANNUAL REPORT 2013/2014
95
The Ministry operates trust accounts as the agent under section 66 of the Public Finance Act 1989. The transactions through these accounts and their balances as at 30 June are not included in the Ministry’s own financial statements. Movements in these accounts during the year ended 30 June 2014 were as follows:
Actual2013
$000
Actual2014
$000
William Wallace Trust
404 Balance at 1 July 410
(34) Distributions (57)40 Revenue 52
410 Balance at 30 June 405
William Wallace Trust AccountThe William Wallace Awards are held by Child, Youth and Family on an annual basis to celebrate the achievements of young people in care. The awards are in the form of scholarship funding for tertiary study or a contribution to vocational and leadership programmes. The Trust was established in May 1995 to hold funds from an estate for the above purpose.
Statement of Trust MoniesAs at 30 June 2014
The Statement of Accounting Policies: Departmental on pages 85 to 90 and Notes 1 to 21 on pages 101 to 116 form part of these financial statements.

G 60 MINISTRY OF SOCIAL DEVELOPMENT | ANNUAL REPORT 2013/2014
96
Actual2013
$000
Actual2014
$000
Capital commitments- Property, plant and equipment 43,690
- Total capital commitments 43,690
Operating commitmentsNon-cancellable accommodation leases
41,879 Not later than one year 38,924 74,116 Later than one year and not later than five years 87,477 13,534 Later than five years 188,393
129,529 Total non-cancellable accommodation leases 314,794
129,529 Total operating commitments 314,794
129,529 Total commitments 358,484
Capital commitmentsThe Ministry had capital commitments of $43.7 million as at balance date (2013: nil). This mainly relates to the leasehold improvement costs associated with the relocation of MSD National Office to 56 The Terrace, Wellington.
Non-cancellable accommodation leasesThe Ministry has long-term leases on premises, which are subject to regular reviews. The amounts disclosed above as future commitments are based on the current rental rates.
The Operating and Capital commitments for 2013/2014 include the lease commitment for the new MSD National Office based at 56 The Terrace, Wellington.
In addition to the above costs the Ministry has sub-lease rental recoveries of $0.543 million expected to be received in the following year, 2014/2015 (2013: $0.248 million). Refer to Note 1 for sub-lease rental recoveries for 2013/2014.
Statement of CommitmentsAs at 30 June 2014
The Statement of Accounting Policies: Departmental on pages 85 to 90 and Notes 1 to 21 on pages 101 to 116 form part of these financial statements.

G 60 MINISTRY OF SOCIAL DEVELOPMENT | ANNUAL REPORT 2013/2014
97
Unquantifiable contingent liabilitiesThere is legal action against the Crown relating to historical abuse claims. At this stage the number of claimants and the outcomes of these cases are uncertain. The disclosure of an amount for these claims may prejudice the legal proceedings.
Quantifiable contingent liabilities
Actual2013
$000
Actual2014
$000
65 Personal grievances claims 175 125 Other claims 125
190 Total contingent liabilities 300
Personal grievancesPersonal grievances claims represents amounts claimed by employees for personal grievances cases. There are 15 personal grievances claims (2013: 11 personal grievances claims).
Other claimsOther claims represents outstanding grievances claims from our clients for unpaid benefit entitlements and Child, Youth and Family disputes. There are three claims (2013: three claims).
Quantifiable contingent assets
Actual2013
$000
Actual2014
$000
2,000 Canterbury earthquake claim 5,000
2,000 Total contingent assets 5,000
The Ministry has an unsettled business interruption insurance claim resulting from the 2010/2011 Christchurch earthquakes (2013: $2.0 million).
Statement of Contingent Liabilities and Contingent AssetsAs at 30 June 2014
The Statement of Accounting Policies: Departmental on pages 85 to 90 and Notes 1 to 21 on pages 101 to 116 form part of these financial statements.

G 60 MINISTRY OF SOCIAL DEVELOPMENT | ANNUAL REPORT 2013/2014
98
Statement of Departmental Expenses and Capital Expenditure against AppropriationsFor the year ended 30 June 2014
Expenditure Including
Remeasure-ments
2013$000 Summary By Output Expenses
Expenditure Including
Remeasure-ments
2014$000
Remeasure-ments93
2014$000
Expenditure Excluding
Remeasure-ments
2014$000
AppropriationVoted94
2014$000
Appropriations for output expenses
Vote Social Development443 Administration of Trialling New Approaches to Social
Sector Change 1,212 1 1,213 1,382
6,814 Adoption Services 6,521 5 6,526 6,704344,499 Care and Protection Services 350,019 171 350,190 350,301
1,242 Children’s Action Plan 5,554 - 5,554 5,69013,533 Collection of Balances Owed by Former Clients and Non-
beneficiaries13,429 11 13,440 13,711
8,220 Development and Funding of Community Services 8,229 6 8,235 8,32934,556 Family and Community Services 35,720 15 35,735 35,89235,290 Income Support and Assistance to Seniors 37,757 31 37,788 37,828
- Improved Employment and Social Outcomes Support MCA 277,382 323 277,705 284,064- Administering Income Support 147,326 209 147,535 151,291- Improving Employment Outcomes - Service Provision 120,953 111 121,064 123,049- Improving Work Readiness - Service Provision 9,103 3 9,106 9,724
5,686 Management of Service Cards MCOA 6,176 6 6,182 6,6544,553 Administration of Community Services Card 5,031 5 5,036 5,2511,133 Management of SuperGold Card 1,145 1 1,146 1,403
15,844 Management of Student Loans 16,068 12 16,080 16,23715,743 Management of Student Support, excluding Student Loans 16,749 14 16,763 17,1025,359 Planning, Correspondence and Monitoring 5,226 4 5,230 5,5543,505 Prevention Services 3,904 2 3,906 4,0201,784 Promoting Positive Outcomes for Disabled People 5,309 1 5,310 5,785
2,606 Property Management Centre of Expertise 3,845 1 3,846 3,85533,616 Services to Protect the Integrity of the Benefit System 34,995 24 35,019 35,139
- Social Housing Services 9,490 7 9,497 9,54532,318 Social Policy Advice MCOA 29,086 16 29,102 29,630
6,155 Forecast, Modelling, Information Monitoring and Analysis
6,291 3 6,294 6,450
3,410 Longitudinal Studies - - - - 17,304 Policy Advice 17,841 11 17,852 18,1805,449 Research and Evaluation 4,954 2 4,956 5,000
452,860 Tailored Sets of Services to Help People into Work or Achieve Independence
226,604 - 226,604 226,604
54,635 Vocational Skills Training 23,392 - 23,392 23,3922,714 Youth Development 2,897 2 2,899 2,953
129,540 Youth Justice Services 128,586 77 128,663 128,681
1,200,807 Total Vote Social Development 1,248,150 729 1,248,879 1,259,052
Responsible MinistersMinister for Social Development is responsible for all appropriations above except:• Minister of Health is responsible for Administration of Trialling New Approaches to Social Sector Change• Minister of Revenue is responsible for Management of Student Loans• Minister for Disability Issues is responsible for Promoting Positive Outcomes for Disabled People• Minister of State Services is responsible for Property Management Centre of Expertise• Minister of Youth Affairs is responsible for Youth Development.
93 The remeasurement adjustment relates to movements in the unvested long service leave provision due to changes in discount rates. The Ministry is appropriated for expenditure excluding remeasurements.
94 This includes adjustments made in the Supplementary Estimates and transfers made under section 26A of the Public Finance Act 1989.
The Statement of Accounting Policies: Departmental on pages 85 to 90 and Notes 1 to 21 on pages 101 to 116 form part of these financial statements.
G 60 MINISTRY OF SOCIAL DEVELOPMENT | ANNUAL REPORT 2013/2014
99
Expenditure Including
Remeasure-ments
2013$000 Summary By Output Expenses
Expenditure Including
Remeasure-ments
2014$000
Remeasure-ments95
2014$000
Expenditure Excluding
Remeasure-ments
2014$000
AppropriationVoted96
2014$000
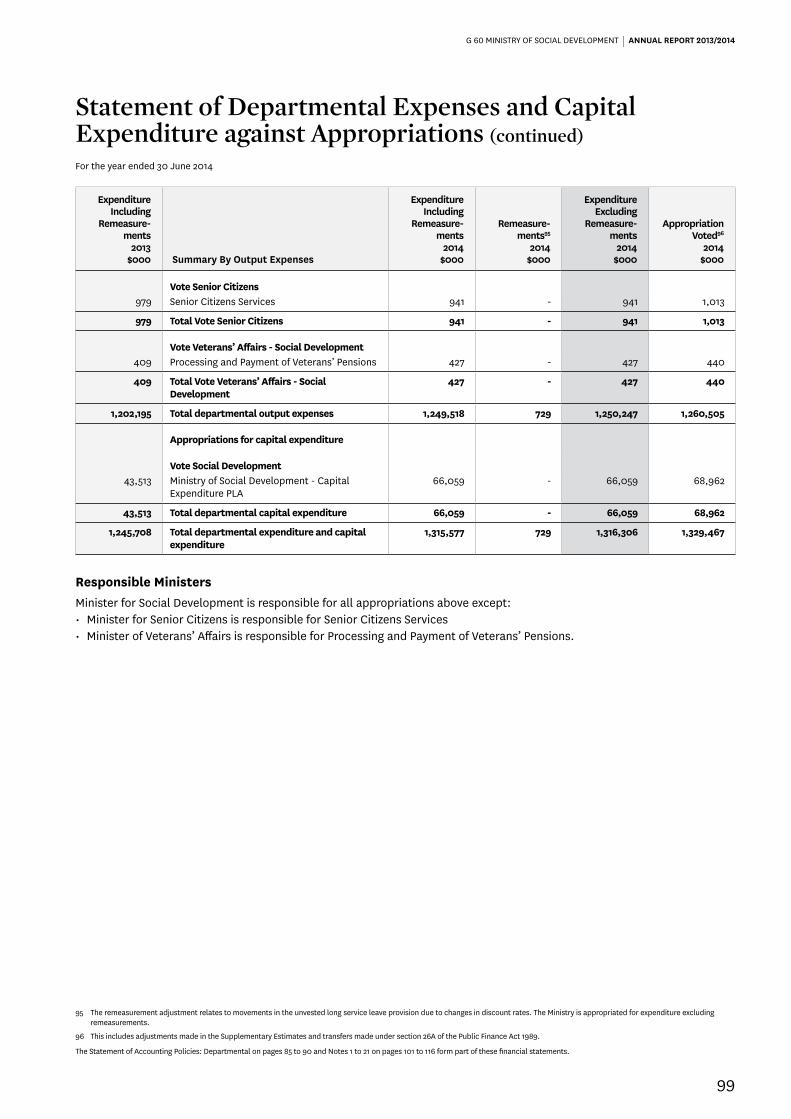
Vote Senior Citizens979 Senior Citizens Services 941 - 941 1,013
979 Total Vote Senior Citizens 941 - 941 1,013
Vote Veterans’ Affairs - Social Development409 Processing and Payment of Veterans’ Pensions 427 - 427 440
409 Total Vote Veterans’ Affairs - Social Development
427 - 427 440
1,202,195 Total departmental output expenses 1,249,518 729 1,250,247 1,260,505
Appropriations for capital expenditure
Vote Social Development43,513 Ministry of Social Development - Capital
Expenditure PLA66,059 - 66,059 68,962
43,513 Total departmental capital expenditure 66,059 - 66,059 68,962
1,245,708 Total departmental expenditure and capital expenditure
1,315,577 729 1,316,306 1,329,467
Responsible MinistersMinister for Social Development is responsible for all appropriations above except:• Minister for Senior Citizens is responsible for Senior Citizens Services• Minister of Veterans’ Affairs is responsible for Processing and Payment of Veterans’ Pensions.
95 The remeasurement adjustment relates to movements in the unvested long service leave provision due to changes in discount rates. The Ministry is appropriated for expenditure excluding remeasurements.
96 This includes adjustments made in the Supplementary Estimates and transfers made under section 26A of the Public Finance Act 1989.
Statement of Departmental Expenses and Capital Expenditure against Appropriations (continued)
For the year ended 30 June 2014
The Statement of Accounting Policies: Departmental on pages 85 to 90 and Notes 1 to 21 on pages 101 to 116 form part of these financial statements.

G 60 MINISTRY OF SOCIAL DEVELOPMENT | ANNUAL REPORT 2013/2014
100
Transfers approved under section 26A of the Public Finance Act 1989The Appropriation Voted includes adjustments made in the Supplementary Estimates and the following transfers made under section 26A of the Public Finance Act 1989.
SupplementaryEstimates
2014$000
Section 26ATransfers
2014$000
AppropriationVoted97
2014$000
Vote Social DevelopmentAdoption Services 6,814 (110) 6,704Prevention Services 4,040 (20) 4,020Youth Justice Services 129,546 (865) 128,681Care and Protection Services 349,306 995 350,301
Total appropriations for output expenses 489,706 - 489,706
Statement of Unappropriated Departmental Expenses and Capital Expenditure against AppropriationsFor the year ended 30 June 2014
The Ministry had no unappropriated departmental operating or capital expenditure in 2013/2014 (2013: nil).
There were no breaches of projected departmental net asset schedules in 2013/2014 (2013: nil).
97 This includes adjustments made in the Supplementary Estimates and transfers made under section 26A of the Public Finance Act 1989.
Statement of Departmental Expenses and Capital Expenditure against Appropriations (continued)
For the year ended 30 June 2014
The Statement of Accounting Policies: Departmental on pages 85 to 90 and Notes 1 to 21 on pages 101 to 116 form part of these financial statements.

G 60 MINISTRY OF SOCIAL DEVELOPMENT | ANNUAL REPORT 2013/2014
101
Note 1: Revenue other
Actual2013
$000
Actual2014
$000
248 Sub-lease rental recoveries 317 5,062 Other recoveries 7,540
5,310 Total revenue other 7,857
The Ministry received revenue from child support receipts on behalf of children in foster care ($1.813 million), the Property Management Centre of Expertise (PMCoE) property portal ($2.686 million), Tertiary Education Commission ($1.901 million) and Strengthening Families interagency support ($0.662 million). The Ministry received other revenues ($0.478 million) and revenue from sub-leased premises ($0.317 million).
Note 2: Gain on disposal of fixed assets
Actual2013
$000
Actual2014
$000
295 Gain on disposal of fixed assets -
295 Total gains -
During the year, the Ministry disposed of assets including motor vehicles that reached a pre-determined mileage and/or life. The net gain on asset disposals was nil (2013: $295,235).
Note 3: Personnel costs
Actual2013
$000
Actual2014
$000
628,473 Salaries and wages 656,804 5,517 Increase/(decrease) in employee entitlements 5,910 1,653 Increase/(decrease) in restructuring costs 2,195
14,795 Defined superannuation contribution scheme 18,420 10,404 Other personnel expenses 11,644
660,842 Total personnel costs 694,973
Obligations for contributions to the State Sector Retirement Savings Scheme, KiwiSaver and the Government Superannuation Fund are accounted for as defined superannuation contribution schemes and are recognised as an expense in the Statement of Comprehensive Income.
Note 4: Capital chargeThe Ministry pays a capital charge to the Crown on its taxpayers’ funds at 31 December and 30 June each financial year. The capital charge rate for the year ended 30 June 2014 was 8 per cent (2013: 8 per cent).
Notes to the Financial Statements

G 60 MINISTRY OF SOCIAL DEVELOPMENT | ANNUAL REPORT 2013/2014
102
Actual2013
$000
Actual2014
$000
MainEstimates
2014$000
SupplementaryEstimates
2014$000
1,034 Audit fees98 931 1,178 1,178 69,482 Rental, leasing and occupancy costs 72,396 70,000 73,000
10 Bad debts written off 58 - -80 Impairment of receivables (195) - -
118,182 Client financial plan costs99 120,216 120,000 121,000 - Employment support and subsidies100 60,463 - 62,310
22,422 Non-specific client costs101 27,605 25,000 28,000 54,635 Vocational Skills Training 23,392 46,784 23,392 32,621 Office operating expenses 32,966 31,000 33,000
107,719 IT related operating expenses 82,088 98,000 92,600 7,313 Travel expenses 8,237 7,100 8,500
6,650 Consultancy and contractors’ fees 9,808 7,000 10,000 14,301 Professional fees 7,954 15,000 9,000 38,027 Other operating expenses 40,520 50,449 57,594
472,476 Total operating costs 486,439 471,511 519,574
Major other operating expenses variancesEmployment support and subsidies is a new category of expenditure in 2013/2014 as a result of the implementation of the Improved Employment and Social Outcomes Support MCA from 1 January 2014.
Vocational Skills Training expenses decreased in 2013/2014 mainly due to the transfer of funding to Vote Tertiary Education ($13.912 million) and the transfer of funding to the Non-departmental other expense Employment Assistance to provide funding for other education, training and employment interventions to support beneficiaries into work ($16.141 million).
IT related operating expenses decreased in 2013/2014 mainly due to the completion of system changes for Welfare Reform in the prior year.
Note 6: Loss on disposal of fixed assets
Actual2013
$000
Actual2014
$000
- Loss on disposal of fixed assets 433
- Total losses 433
During the year, the Ministry incurred a loss on disposal of fixed assets. This was mainly from the disposal of leasehold improvements no longer in use (2013: nil).
98 Audit fees includes statutory audit fees and disbursements.
99 Client financial plan costs includes monies paid for the provision of the care and protection of children and young persons, and the provision of programmes and services to support the resolution of behaviour and relationship difficulties. A portion of these costs is used to support statutory processes to promote opportunities for family/whānau, hapū/iwi and family groups to consider care and protection and youth justice issues and to contribute to a decision-making process that often removes the need for court involvement.
100 Employment support and subsidies includes costs related to employment assistance including employment subsidies, training for work, partnership with industry, health interventions and employment placement and job search initiatives.
101 Non-specific client costs include costs which cannot be attributed to a specific client. It includes costs for maintaining an infrastructure that supports the Ministry to meet its legal and support obligations for the care and protection of children and young persons and the casework resolution process. The costs can be grouped into four main categories:• Family home costs including bed availability allowances, family home supplies and foster parent resettlement grants• Residential costs including programmes and client costs• Costs for Care and Protection resource panels of external advisors mandated by the Children, Young Persons, and Their Families Act 1989 to advise on procedures• External provider contract costs for specific programmes run by non-government organisations to help children and young people.
Note 5: Other operating expenses
G 60 MINISTRY OF SOCIAL DEVELOPMENT | ANNUAL REPORT 2013/2014
103
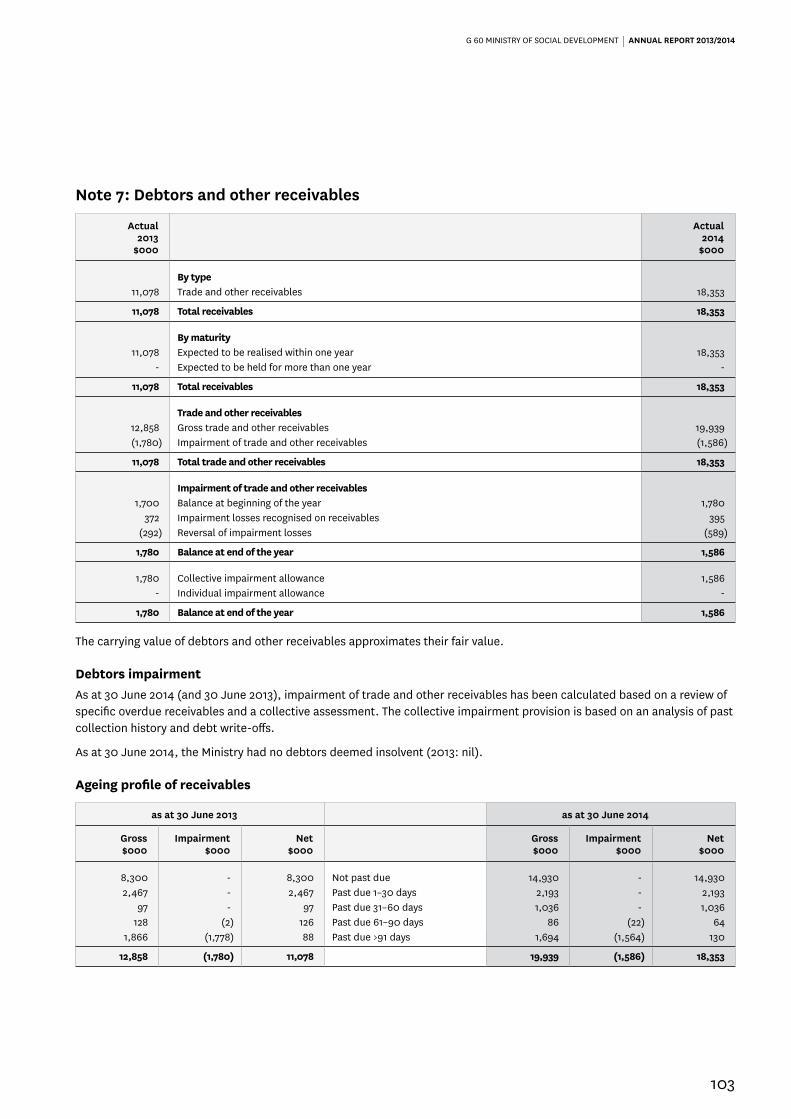
Note 7: Debtors and other receivables
Actual2013
$000
Actual2014
$000
By type11,078 Trade and other receivables 18,353
11,078 Total receivables 18,353
By maturity11,078 Expected to be realised within one year 18,353
- Expected to be held for more than one year -
11,078 Total receivables 18,353
Trade and other receivables12,858 Gross trade and other receivables 19,939 (1,780) Impairment of trade and other receivables (1,586)
11,078 Total trade and other receivables 18,353
Impairment of trade and other receivables1,700 Balance at beginning of the year 1,780
372 Impairment losses recognised on receivables 395 (292) Reversal of impairment losses (589)
1,780 Balance at end of the year 1,586
1,780 Collective impairment allowance 1,586 - Individual impairment allowance -
1,780 Balance at end of the year 1,586
The carrying value of debtors and other receivables approximates their fair value.
Debtors impairmentAs at 30 June 2014 (and 30 June 2013), impairment of trade and other receivables has been calculated based on a review of specific overdue receivables and a collective assessment. The collective impairment provision is based on an analysis of past collection history and debt write-offs.
As at 30 June 2014, the Ministry had no debtors deemed insolvent (2013: nil).
Ageing profile of receivables
as at 30 June 2013 as at 30 June 2014
Gross$000
Impairment$000
Net$000
Gross$000
Impairment$000
Net$000
8,300 - 8,300 Not past due 14,930 - 14,930 2,467 - 2,467 Past due 1–30 days 2,193 - 2,193
97 - 97 Past due 31–60 days 1,036 - 1,036 128 (2) 126 Past due 61–90 days 86 (22) 64
1,866 (1,778) 88 Past due >91 days 1,694 (1,564) 130
12,858 (1,780) 11,078 19,939 (1,586) 18,353

G 60 MINISTRY OF SOCIAL DEVELOPMENT | ANNUAL REPORT 2013/2014
104
Note 8: Property, plant and equipment
Land$000
Buildings$000
Furniture & Fittings
$000
Computer Equipment
$000
Motor Vehicles
$000
Plant & Equipment
$000Total$000
Cost or revaluation
Balance as at 1 July 2012 49,983 199,440 72,965 113,612 28,806 16,999 481,805
Additions by purchase - 5,725 8,496 2,686 3,786 1,576 22,269 Revaluation increase/(decrease) - - - - - - -Work in progress movement - 2,902 - 732 - (49) 3,585 Asset transfers - - - - - - -Other asset movement - - - - - - -Disposals - - (2,984) (1,007) (5,802) (17) (9,810)
Balance as at 30 June 2013 49,983 208,067 78,477 116,023 26,790 18,509 497,849
Balance as at 1 July 2013 49,983 208,067 78,477 116,023 26,790 18,509 497,849
Additions by purchase - 7,103 7,520 5,725 4,677 576 25,601 Revaluation increase/(decrease) 7,135 (17,300) - - - - (10,165)Work in progress movement - (9,906) 431 8,490 - 125 (860)Asset transfers - - - (558) - - (558)Other asset movement - - 20 - - (19) 1 Disposals - - (6,389) (11,816) (5,122) (243) (23,570)
Balance as at 30 June 2014 57,118 187,964 80,059 117,864 26,345 18,948 488,298
Accumulated depreciation and impairment losses
Balance as at 1 July 2012 - 7,027 54,086 97,111 11,824 8,709 178,757
Depreciation expense - 7,258 8,677 8,008 3,617 1,980 29,540 Eliminate on disposal - - (2,984) (1,007) (3,822) (17) (7,830)Eliminate on revaluation - - - - - - -Asset transfers - - - - - - -Other asset movement - - - - - 2 2
Balance as at 30 June 2013 - 14,285 59,779 104,112 11,619 10,674 200,469
Balance as at 1 July 2013 - 14,285 59,779 104,112 11,619 10,674 200,469
Depreciation expense - 6,949 9,011 6,666 3,415 2,060 28,101 Eliminate on disposal - - (5,742) (11,816) (3,494) (240) (21,292)Eliminate on revaluation - (21,234) - - - - (21,234)Asset transfers - - - (558) - - (558)Other asset movement - - 17 - - (18) (1)
Balance as at 30 June 2014 - - 63,065 98,404 11,540 12,476 185,485
Carrying amounts
At 1 July 2012 49,983 192,413 18,879 16,501 16,982 8,290 303,048
At 30 June and 1 July 2013 49,983 193,782 18,698 11,911 15,171 7,835 297,380
At 30 June 2014 57,118 187,964 16,994 19,460 14,805 6,472 302,813
ValuationThe most recent valuation of land and buildings was performed by an independent registered valuer, Andrew Parkyn ANZIV of Quotable Value Limited. The valuation is effective as at 30 June 2014.
The valuation involved a full physical inspection of all the Ministry’s land and buildings assets and has been completed in compliance with the New Zealand Institute of Chartered Accountants (NZICA) New Zealand equivalents to International Financial Reporting Standards (NZ IFRS).
Land
Land is valued at fair value using market-based evidence based on its highest and best use with reference to comparable land values. Adjustments have been made to the ‘unencumbered’ land value where there is a designation against the land or the use of the land is restricted because of reserve or endowment status. These adjustments are intended to reflect the negative effect on the value of the land where an owner is unable to use the land more intensely.

G 60 MINISTRY OF SOCIAL DEVELOPMENT | ANNUAL REPORT 2013/2014
105
Buildings
Non-specialised buildings are valued at fair value using market-based evidence. Market rents and capitalisation rate methodologies were applied in determining the fair value of buildings. Residential centres have been valued using market-based evidence where it exists. If there is no active market evidence the optimised depreciated replacement cost has been used.
Work in progressThe total amount of property, plant and equipment under construction and work in progress is $20.532 million (2013: $21.392 million). This includes building works under construction and work in progress as at 30 June 2014 of $7.179 million (2013: $16.654 million).
RestrictionsThere are no restrictions over the title of the Ministry’s property, plant and equipment assets; nor are any property, plant and equipment assets pledged as security for liabilities.
Note 9: Intangible assets
Internally Generated
Software $000
Total$000
Cost or revaluation
Balance as at 1 July 2012 219,523 219,523
Additions by purchase and internally generated 9,562 9,562 Work in progress movement 8,099 8,099 Asset transfers - -Other asset movement 2 2 Disposals - -
Balance as at 30 June 2013 237,186 237,186
Balance as at 1 July 2013 237,186 237,186
Additions by purchase and internally generated 36,518 36,518 Work in progress movement 4,801 4,801 Asset transfers 558 558 Other asset movement 3 3 Disposals (664) (664)
Balance as at 30 June 2014 278,402 278,402
Accumulated amortisation and impairment losses
Balance as at 1 July 2012 170,835 170,835
Amortisation expense 15,595 15,595 Disposals - -Asset transfers - -Other asset movement - -
Balance as at 30 June 2013 186,430 186,430
Balance as at 1 July 2013 186,430 186,430
Amortisation expense 16,150 16,150 Disposals (661) (661)Asset transfers 558 558 Other asset movement - -
Balance as at 30 June 2014 202,477 202,477
Carrying amounts
At 1 July 2012 48,688 48,688
At 30 June and 1 July 2013 50,756 50,756
At 30 June 2014 75,925 75,925
G 60 MINISTRY OF SOCIAL DEVELOPMENT | ANNUAL REPORT 2013/2014
106
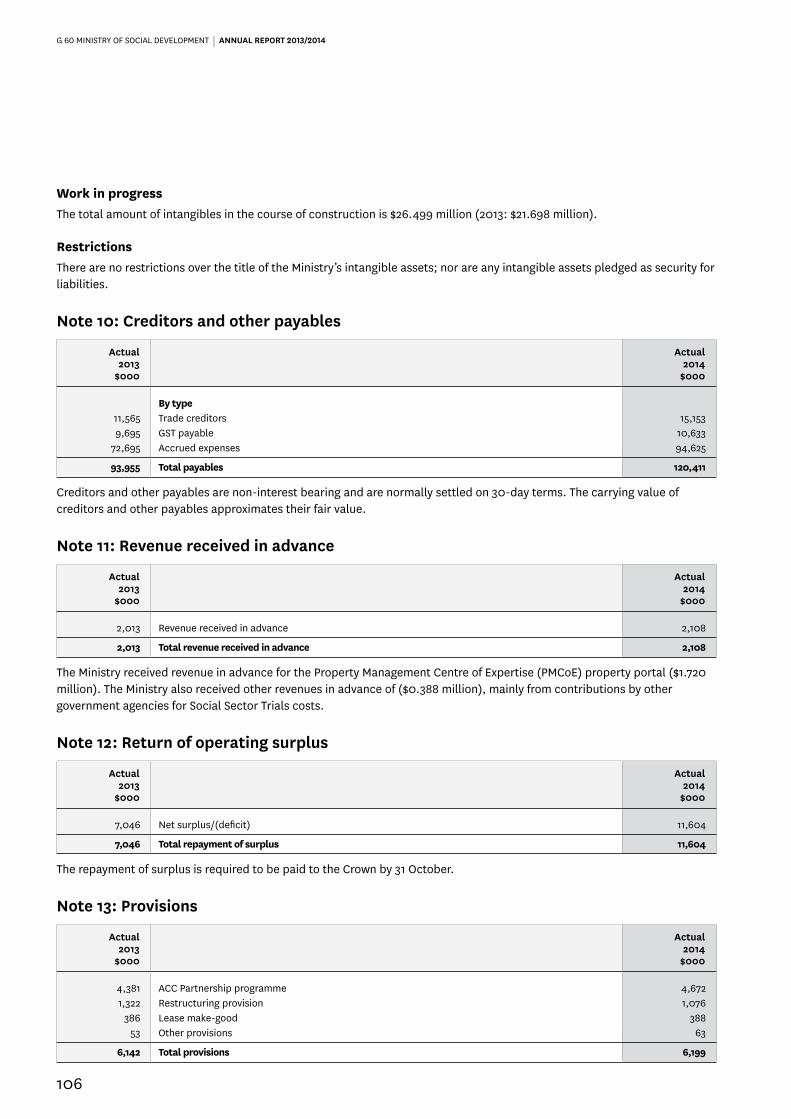
Work in progressThe total amount of intangibles in the course of construction is $26.499 million (2013: $21.698 million).
RestrictionsThere are no restrictions over the title of the Ministry’s intangible assets; nor are any intangible assets pledged as security for liabilities.
Note 10: Creditors and other payables
Actual2013
$000
Actual2014
$000
By type11,565 Trade creditors 15,153 9,695 GST payable 10,633
72,695 Accrued expenses 94,625
93,955 Total payables 120,411
Creditors and other payables are non-interest bearing and are normally settled on 30-day terms. The carrying value of creditors and other payables approximates their fair value.
Note 11: Revenue received in advance
Actual2013
$000
Actual2014
$000
2,013 Revenue received in advance 2,108
2,013 Total revenue received in advance 2,108
The Ministry received revenue in advance for the Property Management Centre of Expertise (PMCoE) property portal ($1.720 million). The Ministry also received other revenues in advance of ($0.388 million), mainly from contributions by other government agencies for Social Sector Trials costs.
Note 12: Return of operating surplus
Actual2013
$000
Actual2014
$000
7,046 Net surplus/(deficit) 11,604
7,046 Total repayment of surplus 11,604
The repayment of surplus is required to be paid to the Crown by 31 October.
Note 13: Provisions
Actual2013
$000
Actual2014
$000
4,381 ACC Partnership programme 4,672 1,322 Restructuring provision 1,076
386 Lease make-good 388 53 Other provisions 63
6,142 Total provisions 6,199

G 60 MINISTRY OF SOCIAL DEVELOPMENT | ANNUAL REPORT 2013/2014
107
Provisions by category
ACC Partnership Programme
$000
Lease Make-Good
$000Restructure
$000Others
$000Total$000
2013
Balance as at 1 July 2012 4,894 381 1,569 72 6,916
Additional provisions made 1,640 - 83 1 1,724 Amounts used (2,153) - (330) (9) (2,492)Unused amounts reversed - - - (11) (11)Discount unwind - 5 - - 5
Balance as at 30 June 2013 4,381 386 1,322 53 6,142
2014
Balance as at 1 July 2013 4,381 386 1,322 53 6,142
Additional provisions made 2,929 80 21 10 3,040 Amounts used (2,638) - (267) - (2,905)Unused amounts reversed - (90) - - (90)Discount unwind - 12 - - 12
Balance as at 30 June 2014 4,672 388 1,076 63 6,199
ACC Partnership programmeThe Ministry belongs to the ACC Accredited Employer programme, whereby the Ministry accepts the management and financial responsibility of the work-related illnesses and accidents of its employees. The Ministry, under the Full Self Cover Plan (FSCP), has opted for a stop loss limit of 160 per cent of the industry premium and a High Cost Claims Cover (HCCC) limit of $250,000.
The liability for the ACC Partnership programme is measured at the present value of expected future payments to be made for employees’ injuries and claims up to the reporting date using actuarial techniques. Consideration is given to the expected future wage and salary levels and the experience of employees’ claims and injuries. Expected future payments are discounted using market yields at the reporting date on New Zealand government bonds with terms to maturity that match, as closely as possible, the estimated future cash outflows.
The Ministry manages its exposure arising from the programme by promoting a safe and healthy working environment by:
• implementing and monitoring health and safety policies
• providing induction training on health and safety
• actively managing workplace injuries to ensure employees return to work as soon as possible
• recording and monitoring workplace injuries and near misses to identify risk areas and implementing mitigating actions
• identifying workplace hazards and implementing appropriate safety procedures.
The Ministry is not exposed to any significant concentrations of insurance risk as work-related injuries are generally the result of an isolated event to an individual employee.
An external independent actuarial valuer, Melville Jessup Weaver, has calculated the Ministry’s liability. The valuation is effective as at 30 June 2014. The valuer has attested he is satisfied as to the nature, sufficiency and accuracy of the data used to determine the outstanding claims liability. There are no qualifications contained in the actuarial valuer’s report.
G 60 MINISTRY OF SOCIAL DEVELOPMENT | ANNUAL REPORT 2013/2014
108
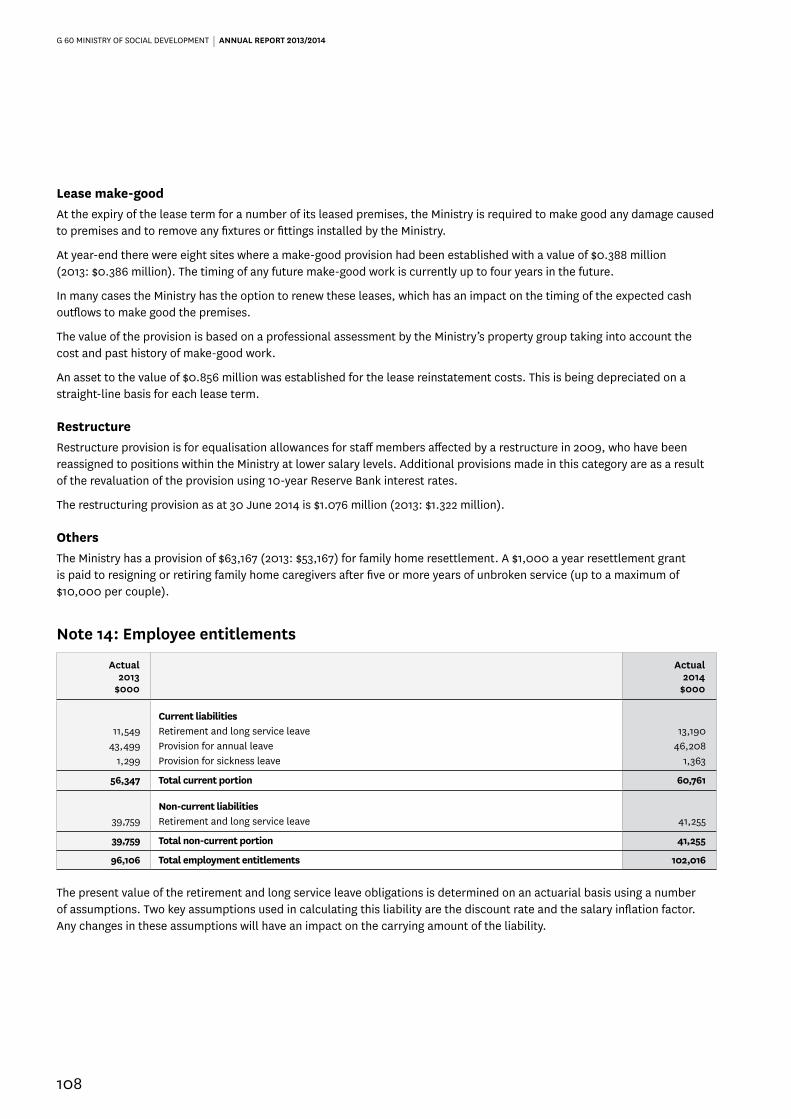
Lease make-goodAt the expiry of the lease term for a number of its leased premises, the Ministry is required to make good any damage caused to premises and to remove any fixtures or fittings installed by the Ministry.
At year-end there were eight sites where a make-good provision had been established with a value of $0.388 million (2013: $0.386 million). The timing of any future make-good work is currently up to four years in the future.
In many cases the Ministry has the option to renew these leases, which has an impact on the timing of the expected cash outflows to make good the premises.
The value of the provision is based on a professional assessment by the Ministry’s property group taking into account the cost and past history of make-good work.
An asset to the value of $0.856 million was established for the lease reinstatement costs. This is being depreciated on a straight-line basis for each lease term.
RestructureRestructure provision is for equalisation allowances for staff members affected by a restructure in 2009, who have been reassigned to positions within the Ministry at lower salary levels. Additional provisions made in this category are as a result of the revaluation of the provision using 10-year Reserve Bank interest rates.
The restructuring provision as at 30 June 2014 is $1.076 million (2013: $1.322 million).
OthersThe Ministry has a provision of $63,167 (2013: $53,167) for family home resettlement. A $1,000 a year resettlement grant is paid to resigning or retiring family home caregivers after five or more years of unbroken service (up to a maximum of $10,000 per couple).
Note 14: Employee entitlements
Actual2013
$000
Actual2014
$000
Current liabilities11,549 Retirement and long service leave 13,190
43,499 Provision for annual leave 46,208 1,299 Provision for sickness leave 1,363
56,347 Total current portion 60,761
Non-current liabilities39,759 Retirement and long service leave 41,255
39,759 Total non-current portion 41,255
96,106 Total employment entitlements 102,016
The present value of the retirement and long service leave obligations is determined on an actuarial basis using a number of assumptions. Two key assumptions used in calculating this liability are the discount rate and the salary inflation factor. Any changes in these assumptions will have an impact on the carrying amount of the liability.

G 60 MINISTRY OF SOCIAL DEVELOPMENT | ANNUAL REPORT 2013/2014
109
The Ministry uses the interest rates and the salary inflation factor as supplied and published by the Treasury.
Discount rates and salary inflation applied:
as at 30 June 2013
Employee Entitlement Variables
as at 30 June 2014
2014%
2015%
2016%
2015%
2016%
2017%
2.71 3.14 5.50 Discount rates 3.70 4.04 5.50 3.50 3.50 3.50 Salary inflation 3.50 3.50 3.50
The financial impact of changes to the discount rates and salary inflation variables:
Movements
Actual2014
$000
Salary + 1%2014
$000
Salary - 1%2014
$000
Discount + 1%2014
$000
Discount - 1%2014
$000
Current 13,190 43 (43) (32) 33 Non-current 41,255 4,049 (3,566) (3,287) 3,788
Total 54,445 4,092 (3,609) (3,319) 3,821
Note 15: Taxpayers’ funds
Actual2013
$000
Actual2014
$000
General funds 264,896 Balance at 1 July 256,896
7,046 Surplus/(deficit) 11,604 - Capital contribution 4,991
(8,000) Capital withdrawal -(7,046) Repayment of surplus (11,604)
256,896 General funds at 30 June 261,887
Revaluation reserves 35,875 Balance at 1 July 35,875
- Revaluations 11,069
35,875 Revaluation reserves at 30 June 46,944
292,771 Total taxpayers’ funds 308,831

G 60 MINISTRY OF SOCIAL DEVELOPMENT | ANNUAL REPORT 2013/2014
110
Note 16: Reconciliation of net surplus/(deficit) to net cash from operating activities
Actual2013
$000
Actual2014
$000
MainEstimates
2014$000
SupplementaryEstimates
2014$000
7,046 Net surplus/(deficit) after tax 11,604 - -
Add/(less) non-cash items29,540 Depreciation 28,101 38,117 34,456 15,595 Amortisation 16,150 13,736 15,661
45,135 Total non-cash items 44,251 51,853 50,117
Add/(less) items classified as investing or financing activities(295) (Gains)/losses on disposal of property, plant and equipment 433 - -
(295) Total items classified as investing or financing activities 433 - -
Add/(less) working capital movements11,085 (Increase)/decrease in accounts receivable (23,065) 12,000 11,657
(2,851) (Increase)/decrease in prepayments (903) - -424 Increase/(decrease) in accounts payable 26,453 2,400 2,740
1,213 Increase/(decrease) in revenue received in advance 95 - -2,725 Increase/(decrease) in provision for employee entitlements 4,415 - -(774) Increase/(decrease) in other provisions 57 - -
11,822 Net movements in working capital items 7,052 14,400 14,397
Add/(less) movements in non-current liabilities2,793 Increase/(decrease) in provision for employee entitlements 1,496 - -
2,793 Net movements in non-current liabilities 1,496 - -
66,501 Net cash inflow from operating activities 64,836 66,253 64,514
Note 17: Related party transactionsThe Ministry is a wholly-owned entity of the Crown. The Government significantly influences the role of the Ministry as well as being its major source of revenue. All related party transactions are entered into on an arm’s-length basis.
Significant transactions with government-related entitiesThe Ministry received funding from the Crown of $1.253 billion (2013: $1.204 billion) to provide services to the public for the year ended 30 June 2014.
Collectively, but not individually, significant transactions with government-related entitiesIn conducting its activities, the Ministry is required to pay various taxes and levies (such as GST, FBT, PAYE, and ACC levies) to the Crown and entities related to the Crown. The payment of these taxes and levies, other than income tax, is based on the standard terms and conditions that apply to all tax and levy payers. The Ministry is exempt from paying income tax.
The Ministry also purchases goods and services from entities controlled, significantly influenced, or jointly controlled by the Crown. Purchases from these government-related entities for the year ended 30 June 2014 totalled $52.841 million (2013: $80.046 million). These purchases included the purchase of electricity from Genesis Energy, air travel from Air New Zealand, legal services from the Crown Law Office, postal services from New Zealand Post and vocational skills training from the Tertiary Education Commission.

G 60 MINISTRY OF SOCIAL DEVELOPMENT | ANNUAL REPORT 2013/2014
111
Transactions with key management personnelKey management personnel compensation includes the remuneration for the Chief Executive and nine members of the Senior Management Team.
Actual2013
$000
Actual2014
$000
3,024 Salaries and other short-term employee benefits 3,121 62 Post-employment benefits 55
- Other long-term benefits - - Termination benefits -
3,086 Total key management personnel compensation 3,176
It excludes the remuneration and other benefits received by the Minister for Social Development. The Minister’s remuneration and other benefits are received not only for her role as a member of the key management personnel of the Ministry. The Minister’s remuneration and other benefits are set by the Remuneration Authority under the Civil List Act 1979 and are paid under Permanent Legislative Authority, and are not paid by the Ministry of Social Development.
Related party transactions involving key management personnel (or their close family members):
• Related parties of key management personnel who are in receipt of statutory benefits, pensions or student loans are receiving them based on their own entitlements and eligibility criteria to such benefits, pensions or student loans.
• A member of the Senior Management Team was on the board of Vitae as chair until 27 February 2014. The Ministry had transactions with Vitae to the value of $36,079.45 during the year for staff support – chaplaincy costs and employee assistance services.
No provision is required, nor any expense recognised, for the impairment of receivables from related parties.
Note 18: Events after the balance sheet dateNo significant events, which may have had an impact on the actual results, have occurred between year-end and the signing of the financial statements.
Note 19: Financial instrument risksThe Ministry’s activities expose it to a variety of financial instrument risks, including market risk, credit risk and liquidity risk. The Ministry has a series of policies to manage the risks associated with financial instruments and seeks to minimise its exposure from financial instruments. These policies do not allow any transactions that are speculative in nature to be entered into.
Market risk
Currency risk
Currency risk is the risk the fair value or future cash flows of a financial instrument will fluctuate because of changes in foreign exchange rates.
The Ministry purchases some capital equipment internationally and is exposed to currency risk arising from various currency exposures, primarily from the United States and Australian dollars. Currency risk arises from future capital purchases and recognised liabilities, which are denominated in a foreign currency.
As at 30 June 2014, there were no significant foreign exchange exposures that required a sensitivity analysis to be prepared (2013: no significant foreign exchange exposures).

G 60 MINISTRY OF SOCIAL DEVELOPMENT | ANNUAL REPORT 2013/2014
112
Interest rate risk
Interest rate risk is the risk the fair value of a financial instrument or the cash flows from a financial instrument will fluctuate, due to changes in market interest rates.
The Ministry has no interest-bearing financial instruments and, accordingly, has no exposure to interest rate risk.
Credit riskCredit risk is the risk a third party will default on its obligation to the Ministry, causing the Ministry to incur a loss.
In the normal course of the Ministry’s business, credit risk arises from debtors, deposits with banks and derivative financial instrument assets.
The Ministry is only permitted to deposit funds with Westpac, a registered bank, and to enter into foreign exchange forward contracts with the New Zealand Debt Management Office. These entities have high credit ratings.
For its other financial instruments, the Ministry does not have significant concentrations of credit risk. The Ministry’s maximum credit exposure for each class of financial instrument is represented by the total carrying amount of cash and cash equivalents, net debtors (refer Note 7), and derivative financial instrument assets. There is no collateral held as security against these financial instruments, including those instruments that are overdue or impaired.
Liquidity riskLiquidity risk is the risk the Ministry will encounter difficulty raising liquid funds to meet its commitments as they fall due.
In meeting its liquidity requirements, the Ministry closely monitors its forecast cash requirements with expected cash draw-downs from the New Zealand Debt Management Office. The Ministry maintains a target level of available cash to meet liquidity requirements.
Financial instrument risks
Classes and categories of financial assets:
as at 30 June 2013Designation
as at 30 June 2014Designation
Amortised cost
$000
Loans & receivables
$000
Held for trading
$000
Fair value through
P&L$000
Total$000
Amortised cost
$000
Loans & receivables
$000
Held for trading
$000
Fair value through
P&L$000
Total$000
- 32,695 - - 32,695 Cash and cash equivalents
- 31,259 - - 31,259
- 104,146 - - 104,146 Trade and other receivables
- 127,212 - - 127,212
- 136,841 - - 136,841 Total financial assets by designation
- 158,471 - - 158,471
Classes and categories of financial liabilities:
as at 30 June 2013Designation
as at 30 June 2014Designation
Amortised cost
$000
Held for trading
$000
Fair value through
P&L$000
Total$000
Amortised cost
$000
Held for trading
$000
Fair value through
P&L$000
Total$000
81,700 - - 81,700 Accounts payable 104,705 - - 104,705
81,700 - - 81,700 Total financial liabilities by designation 104,705 - - 104,705
G 60 MINISTRY OF SOCIAL DEVELOPMENT | ANNUAL REPORT 2013/2014
113
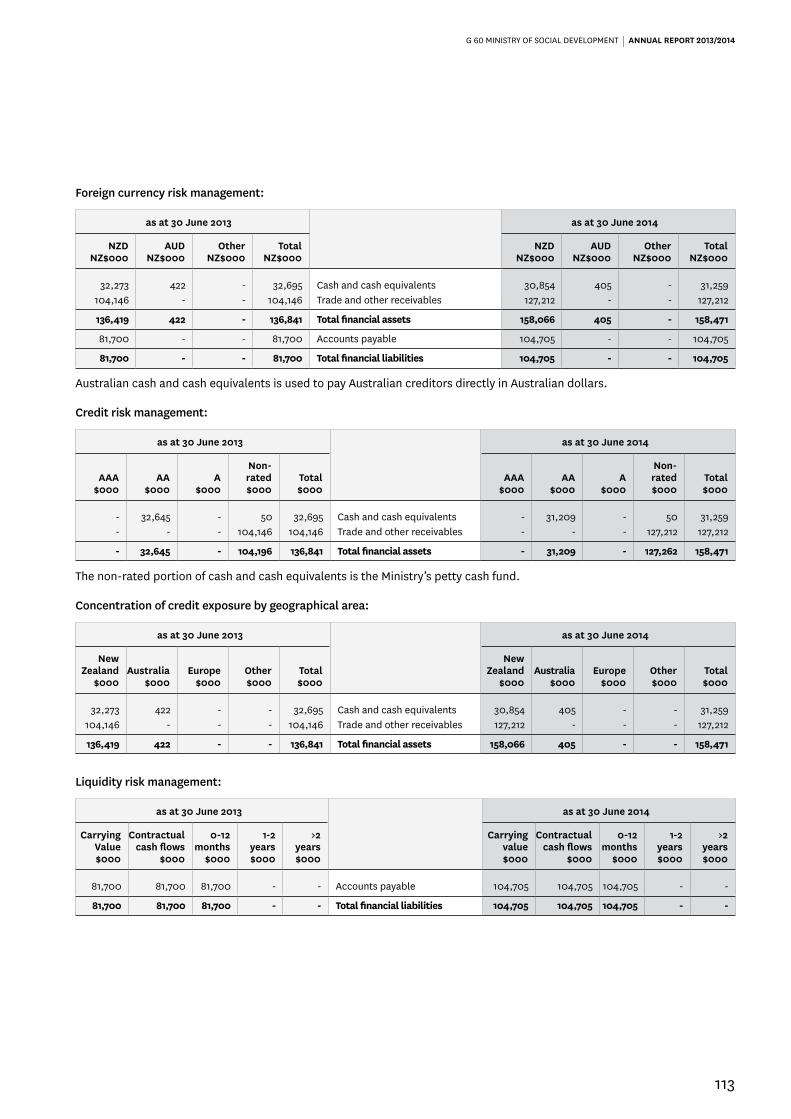
Foreign currency risk management:
as at 30 June 2013 as at 30 June 2014
NZDNZ$000
AUDNZ$000
OtherNZ$000
TotalNZ$000
NZDNZ$000
AUDNZ$000
OtherNZ$000
TotalNZ$000
32,273 422 - 32,695 Cash and cash equivalents 30,854 405 - 31,259 104,146 - - 104,146 Trade and other receivables 127,212 - - 127,212
136,419 422 - 136,841 Total financial assets 158,066 405 - 158,471
81,700 - - 81,700 Accounts payable 104,705 - - 104,705
81,700 - - 81,700 Total financial liabilities 104,705 - - 104,705
Australian cash and cash equivalents is used to pay Australian creditors directly in Australian dollars.
Credit risk management:
as at 30 June 2013 as at 30 June 2014
AAA$000
AA$000
A$000
Non-rated$000
Total$000
AAA$000
AA$000
A$000
Non-rated$000
Total $000
- 32,645 - 50 32,695 Cash and cash equivalents - 31,209 - 50 31,259 - - - 104,146 104,146 Trade and other receivables - - - 127,212 127,212
- 32,645 - 104,196 136,841 Total financial assets - 31,209 - 127,262 158,471
The non-rated portion of cash and cash equivalents is the Ministry’s petty cash fund.
Concentration of credit exposure by geographical area:
as at 30 June 2013 as at 30 June 2014
New Zealand
$000Australia
$000Europe
$000Other$000
Total$000
New Zealand
$000Australia
$000Europe
$000Other$000
Total$000
32,273 422 - - 32,695 Cash and cash equivalents 30,854 405 - - 31,259104,146 - - - 104,146 Trade and other receivables 127,212 - - - 127,212
136,419 422 - - 136,841 Total financial assets 158,066 405 - - 158,471
Liquidity risk management:
as at 30 June 2013 as at 30 June 2014
Carrying Value$000
Contractual cash flows
$000
0-12 months
$000
1-2 years$000
>2 years$000
Carrying value$000
Contractual cash flows
$000
0-12 months
$000
1-2 years$000
>2 years$000
81,700 81,700 81,700 - - Accounts payable 104,705 104,705 104,705 - -
81,700 81,700 81,700 - - Total financial liabilities 104,705 104,705 104,705 - -

G 60 MINISTRY OF SOCIAL DEVELOPMENT | ANNUAL REPORT 2013/2014
114
Note 20: Capital managementThe Ministry’s capital is its equity (or taxpayers’ funds), which comprises general funds and revaluation reserves. Equity is represented by net assets.
The Ministry manages its revenues, expenses, assets, liabilities and general financial dealings prudently. The Ministry’s equity is largely managed as a by-product of managing income, expenses, assets, liabilities, and the Ministry’s compliance with the Government Budget processes, Treasury Instructions and the Public Finance Act 1989.
The objective of managing the Ministry’s equity is to ensure the Ministry effectively achieves its goals and objectives for which it has been established, while remaining a going concern.
Note 21: Major budget variationsExplanations for major variances from the Ministry’s estimated figures in the Forecast Financial Statements 2013/2014 are as follows:
Notes
Actual2014
$000
MainEstimates
2014$000
SupplementaryEstimates
2014$000
Main Estimates vs ActualVariance
2014$000
Statement of Comprehensive IncomeIncomeRevenue Crown (a) 1,253,265 1,189,557 1,253,265 (63,708)Revenue other (b) 7,857 12,460 7,240 4,603 ExpenditurePersonnel costs (c) 694,973 655,078 667,239 (39,895)
Statement of Financial PositionTaxpayers’ fundsRevaluation reserve (d) 46,944 35,875 35,875 (11,069)
AssetsCurrent assetsAccounts receivable (e) 18,353 7,798 11,078 (10,555)Prepayments (f) 13,960 10,205 13,056 (3,755)Crown receivable (g) 108,859 53,000 81,411 (55,859)
Non-current assetsIntangible assets (h) 75,925 57,640 52,930 (18,285)
Statement of Cash FlowsCash flows from operating activitiesReceipts from Crown revenue (i) 1,237,474 1,201,557 1,264,922 (35,917)Receipts from other revenue (j) 7,869 12,460 7,240 4,591 Payments to employees (k) (685,581) (651,782) (665,467) 33,799
Cash flows from investing activitiesPurchase of property, plant and equipment (l) (24,743) (45,175) (51,129) (20,432)Purchase of intangible assets (m) (41,316) (17,821) (17,833) 23,495
Statement of Comprehensive Incomea) Increase in Revenue Crown was mainly due to the transfer of $62 million from Non-departmental other expense
Employment Assistance into the new Multi-Category Expenses and Capital Expenditure (MCA) Improved Employment and Social Outcomes Support from 1 January 2014.
b) Revenue other is lower due to the Ministry receiving less in sub-lease rental recoveries, which has reduced significantly over time. The Supplementary budget has been adjusted to reflect the current lower levels of sub-lease recoveries.
c) Personnel costs budget variance is mainly due to new funding for Social Housing transfer, Children’s Action Plan and Welfare Reform costs for new staff.

G 60 MINISTRY OF SOCIAL DEVELOPMENT | ANNUAL REPORT 2013/2014
115
Statement of Financial Positiond) Revaluation reserve budget variance was due to the change in valuation of the Ministry’s land and buildings as a result of
the full valuation performed by Quotable Value Limited as at 30 June 2014.
e) Accounts receivable actual is higher than budget mainly due to the Canterbury Earthquake Recovery Authority (CERA) payments being higher in June than was anticipated. CERA owed the Ministry $13 million as at 30 June 2014 representing one month’s payments made on behalf of CERA.
f) Prepayments is higher than budget due to the timing of a CURAM software license prepayment transaction of $3.3 million in June 2014.
g) Crown receivable relates to funds the Ministry has not drawn down for 2014 and previous years, mainly due to delays with capital projects.
h) Intangibles are higher than budget with the capitalisation of the major capital project Enhanced Online Services.
Statement of Cash Flowsi) Receipts from Crown Revenue is higher than budget mainly due to the changes to Revenue Crown associated with the new
MCA Improved Employment and Social Outcomes Support.
j) Receipts from Revenue other is lower than budget due to the Ministry receiving less funding from sub-lease rental recoveries.
k) Payments to employees is higher than budget due to the introduction of new funding during the year that has increased personnel costs as explained in Note (c) above.
l) Purchase of property, plant and equipment is lower than budget in the current year due to timing delays on major capital projects. However, expenditure levels are similar to the previous year.
m) Purchase of intangible assets is higher than budget due to the work during the year on a number of major IT capital projects including Enhanced Online Services (EOS), Data Centre Migration and CURAM software upgrade.
Changes in appropriationsThe table below summarises the material changes in appropriations between the Main Estimates and the final Supplementary Estimates for the 2013/2014 financial year.
Notes
MainEstimates
2014$000
AppropriationVoted102
2014$000
Variance2014
$000
Vote Social DevelopmentAppropriations for output expensesAdministration of Trialling New Approaches to Social Sector Change (a) 2,832 1,382 (1,450)Children’s Action Plan (b) 400 5,690 5,290
Improved Employment and Social Outcomes Support MCAAdministering Income Support (c) - 151,291 151,291 Improving Employment Outcomes - Service Provision (c) - 123,049 123,049 Improving Work Readiness - Service Provision (c) - 9,724 9,724
Property Management Centre of Expertise (d) 2,755 3,855 1,100 Social Housing Services (e) - 9,545 9,545
Social Policy Advice MCOALongitudinal Studies (f) 3,001 - (3,001)
Tailored Sets of Services to Help People into Work or Achieve Independence
(g) 441,563 226,604 (214,959)
Vocational Skills Training (h) 46,784 23,392 (23,392)
102 This includes adjustments made in the Supplementary Estimates under section 26A of the Public Finance Act 1989.
G 60 MINISTRY OF SOCIAL DEVELOPMENT | ANNUAL REPORT 2013/2014
116
Variance explanationa) This appropriation decreased by $1.450 million due to a transfer to the Non-departmental output expense, Trialling New
Approaches to Social Sector Change, to fund seven Trial locations led by non-government organisations NGOs.
b) This appropriation increased by $5.290 million mainly due to a draw-down of funding from the Vulnerable Children’s contingency fund.
c) This is a newly established Multi-Category Appropriation (MCA) from 1 January 2014.
d) This appropriation increased by $1.100 million in 2013/2014 due to an increased level of work activity performed by the Property Management Centre of Expertise (PMCoE) on behalf of other agencies.
e) This is a newly established appropriation in 2013/2014 due to a transfer of the social housing needs assessment and related functions from Housing New Zealand Corporation.
f) This appropriation was transferred to the Non-departmental output expense Families Commission in 2013/2014 with the Families Commission assuming responsibility for managing the Growing Up in New Zealand Longitudinal study.
g) This appropriation decreased by $214.959 million due to the transfer of funds to the Multi-Category Appropriation (MCA) Improved Employment and Social Outcomes Support from 1 January 2014.
h) This appropriation decreased by $23.392 million in 2013/2014 due to firstly transferring funding to Vote Tertiary Education as a result of reprioritising Foundation Focused Training Opportunities funding; and secondly, a transfer to Non-departmental other expense Employment Assistance to provide funding for other education, training and employment interventions to support beneficiaries into work.
The Supplementary Estimates of Appropriations and Supporting Information 2013/2014 contains more information on appropriation variances.

G 60 MINISTRY OF SOCIAL DEVELOPMENT | ANNUAL REPORT 2013/2014
117
Actual2013
$000
Actual2014
$000
Summary20,328,737 Expenditure against appropriations 20,826,556
11,722 Revenue 12,653 581,230 Capital receipts 610,562 669,929 Assets 722,806 643,867 Liabilities 325,816
437 Trust monies 1,283
Further details of the Ministry’s management of these Crown expenses, revenue, assets and liabilities are provided in the Statement of Objectives and Service Performance section of this report.
These non-departmental balances are consolidated into the Financial Statements of the Government, and therefore readers of these statements and schedules should also refer to the Financial Statements of the Government for 2013/2014.
The Statement of Accounting Policies: Non-Departmental on pages 118 to 119 and Notes 1 to 4 on pages 131 to 137 form an integral part of these financial statements and schedules.
Non-Departmental Financial Statements and SchedulesFor the year ended 30 June 2014

G 60 MINISTRY OF SOCIAL DEVELOPMENT | ANNUAL REPORT 2013/2014
118
Statement of Accounting Policies: Non-Departmental
Reporting entityThese non-departmental statements and schedules present financial information on public funds managed by the Ministry on behalf of the Crown.
These non-departmental balances are consolidated into the Financial Statements of the Government. For a full understanding of the Crown’s financial position, results of operations and cash flows for the year, readers should refer to the Financial Statements of the Government.
Basis of preparationThe non-departmental statements and schedules have been prepared in accordance with the Government’s accounting policies set out in the Financial Statements of the Government, and in accordance with relevant Treasury Instructions and Treasury Circulars.
The measurement and recognition rules applied in the preparation of these non-departmental schedules and statements are consistent with the New Zealand Generally Accepted Accounting Practice for public benefit entities.
Changes in accounting policiesThere have been no changes in accounting policies during the financial year.
Significant accounting policiesThe accounting policies set out below have been applied consistently to all periods presented in these financial statements.
Budget figuresThe budget figures are consistent with the financial information in the Main Estimates. In addition, these financial statements also present the updated budget information from the Supplementary Estimates.
RevenuesThe Ministry administers revenue on behalf of the Crown. This revenue includes student loan administration fees, interest revenue, maintenance capitalisation and miscellaneous revenue.
Student loan administration fee revenue is recognised when the eligible student loan application has been processed.
Interest revenue is the interest on Major Repairs Advance (MRA), which was advances made for the repairs or maintenance of clients’ homes. This programme is no longer current.
Maintenance capitalisation relates to the old child support scheme managed by the Ministry before 1 July 1992. Up until that date, a person who had custody of a child could seek financial support (ie, maintenance) from the non-custodial parent. The maintenance capitalisation revenue is the re-establishment of historical maintenance debt previously written off. The current child support scheme is managed by the Inland Revenue Department.
Miscellaneous revenue is all the other non-departmental revenues received by the Ministry.
ExpensesExpenses are recognised in the period they relate to.
Welfare benefits are recognised in the period when an application for a benefit has been received and the eligibility criteria met.
Where grants and subsidies are discretionary until payment, the expense is recognised when the payment is made. Otherwise, the expense is recognised when the specified criteria have been fulfilled and notice has been given to the Crown.
Foreign currencyTransactions in foreign currencies are initially translated at the foreign exchange rate at the date of the transaction. Foreign exchange gains and losses, resulting from the settlement of such transactions and from the translation at year-end exchange rates of monetary assets and liabilities denominated in foreign currencies, are recognised in the Schedule of Non-Departmental Income or in the Schedule of Non-Departmental Expenses. For information on foreign currency risk management, refer Note 4.
Financial instruments
Financial assetsCash and cash equivalents includes cash on hand, cash in transit, bank accounts and deposits with a maturity of no more than three months from the date of acquisition.
Debtors and other receivables are initially measured at fair value and are subsequently measured at amortised cost using the effective interest rate less any provision for impairment, except for social benefit debt receivables.
The impairment of a receivable is established when there is objective evidence the Ministry will not be able to collect amounts due according to the original terms of the receivable. Significant financial difficulties for the debtor, a probability the debtor will enter into bankruptcy and
G 60 MINISTRY OF SOCIAL DEVELOPMENT | ANNUAL REPORT 2013/2014
119
defaults in payments are considered indicators the debt is impaired. The amount of the impairment is the difference between the asset’s carrying amount and the present value of estimated future cash flows, discounted using the effective interest rates. The carrying amount of the asset is reduced through the use of an allowance account, and the amount of the loss is recognised in the Schedule of Non-Departmental Expenses. When a debt is uncollectible, it is written off against the allowance account for debtors. Overdue receivables that are renegotiated are reclassified as current (ie, not past due).
Financial liabilitiesThe major financial liability type is accounts payable. This is designated at amortised cost using the effective interest rate method. Financial liabilities entered into with a duration of less than 12 months are recognised at their nominal value.
DerivativesForeign exchange forward contracts are recognised both initially and subsequently at fair value. They are reported as either assets or liabilities depending on whether the derivative is in a net gain or a net loss position respectively. These derivatives are entered into for risk management purposes.
Social benefit receivablesSocial benefit debt receivables relate to benefit overpayments, advances on benefits and recoverable special needs grants (refer Note 3). They are initially assessed at nominal amount or face value. These receivables are subsequently tested for impairment.
Goods and Services TaxAll items in the financial statements, including the appropriation statements, are stated exclusive of GST, except for receivables and payables, which are stated inclusive of GST. In accordance with Treasury Instructions, GST is returned on revenue received on behalf of the Crown, where applicable. An input tax deduction is not claimed on non-departmental expenditure. Instead, the amount of GST applicable to non-departmental expenditure is recognised as a separate expense and eliminated against GST revenue at the consolidation of the government financial statements.
CommitmentsFuture expenses and liabilities to be incurred on non-cancellable contracts entered into at balance date are
disclosed as commitments to the extent there are equally unperformed obligations.
Cancellable commitments that have penalty or exit costs explicit in their agreements are included in the Statement of Commitments at the value of that penalty or exit cost.
Contingent assets and liabilitiesContingent assets and liabilities are disclosed at the point the contingency is evident.
Critical accounting estimates and assumptionsIn preparing these financial statements the Ministry has made estimates and assumptions about the future. These estimates and assumptions may differ from the subsequent actual results. Estimates and judgements are continually evaluated and are based on historical experience and other factors, including expectations of future events believed to be reasonable under the circumstances. The estimates and assumptions that have a significant risk of causing a material adjustment to the carrying amounts of assets and liabilities within the next financial year are discussed below.
Social benefit receivablesSocial benefit receivables are initially measured at nominal amount and are subsequently tested for impairment. Note 3 provides an analysis of the uncertainties relating to the valuation of social benefit receivables.
Critical judgements in applying the Ministry’s accounting policiesIn applying the Ministry’s social benefit receivables policy requires judgements to determine a value to place on future repayments of benefit overpayments, advances on benefits and recoverable special needs grants. Judgement is required on various aspects that include, but are not limited to, the use of interest rates, mortality rates, allowance for collection costs and calculation of future rates of default on the receivables.
The Ministry has exercised its judgement on the appropriateness of its valuation of the social benefit receivables (refer Note 3).
There were no other significant items for which management had to exercise critical judgement in applying the Ministry’s accounting policies for the year ended 30 June 2014.
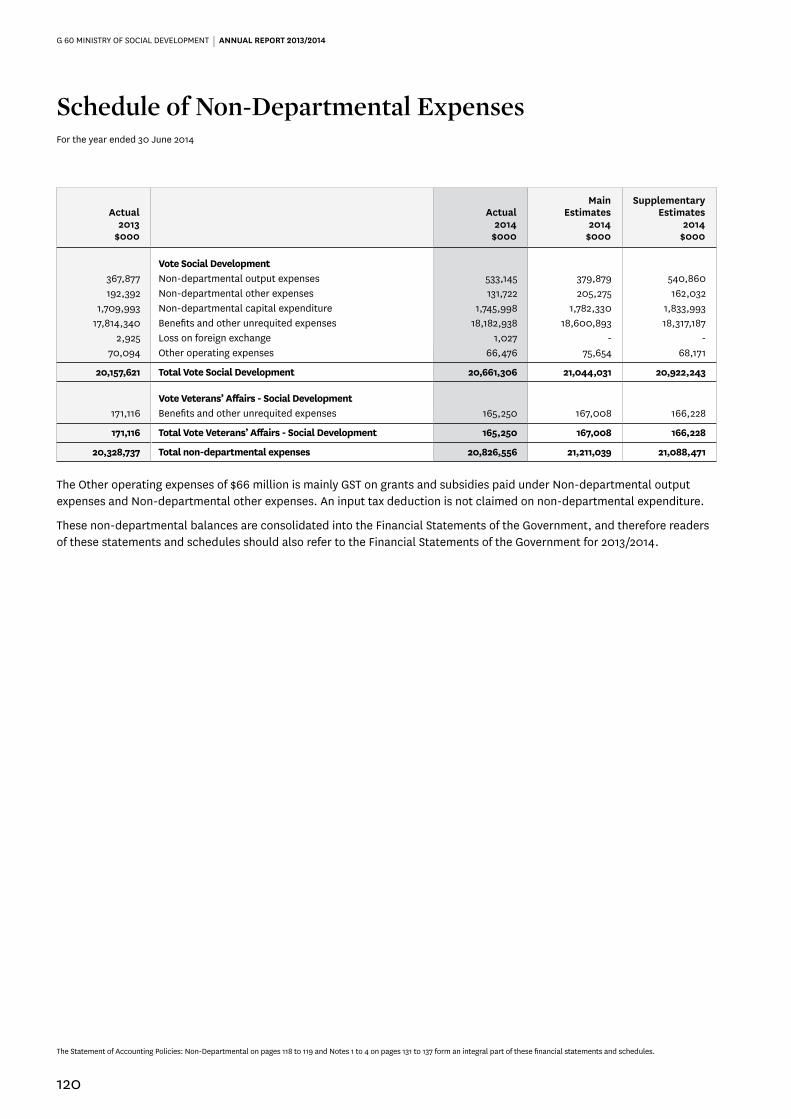
G 60 MINISTRY OF SOCIAL DEVELOPMENT | ANNUAL REPORT 2013/2014
120
The Statement of Accounting Policies: Non-Departmental on pages 118 to 119 and Notes 1 to 4 on pages 131 to 137 form an integral part of these financial statements and schedules.
Actual2013
$000
Actual2014
$000
MainEstimates
2014$000
SupplementaryEstimates
2014$000
Vote Social Development367,877 Non-departmental output expenses 533,145 379,879 540,860192,392 Non-departmental other expenses 131,722 205,275 162,032
1,709,993 Non-departmental capital expenditure 1,745,998 1,782,330 1,833,99317,814,340 Benefits and other unrequited expenses 18,182,938 18,600,893 18,317,187
2,925 Loss on foreign exchange 1,027 - - 70,094 Other operating expenses 66,476 75,654 68,171
20,157,621 Total Vote Social Development 20,661,306 21,044,031 20,922,243
Vote Veterans’ Affairs - Social Development171,116 Benefits and other unrequited expenses 165,250 167,008 166,228
171,116 Total Vote Veterans’ Affairs - Social Development 165,250 167,008 166,228
20,328,737 Total non-departmental expenses 20,826,556 21,211,039 21,088,471
The Other operating expenses of $66 million is mainly GST on grants and subsidies paid under Non-departmental output expenses and Non-departmental other expenses. An input tax deduction is not claimed on non-departmental expenditure.
These non-departmental balances are consolidated into the Financial Statements of the Government, and therefore readers of these statements and schedules should also refer to the Financial Statements of the Government for 2013/2014.
Schedule of Non-Departmental ExpensesFor the year ended 30 June 2014

G 60 MINISTRY OF SOCIAL DEVELOPMENT | ANNUAL REPORT 2013/2014
121
Statement of Non-Departmental Expenditure and Capital Expenditure against AppropriationsFor the year ended 30 June 2014
Actual2013
$000 Type of Appropriation
Actual2014
$000
AppropriationVoted
2014$000
Vote Social DevelopmentNon-departmental output expenses
1,445 Assistance to Disadvantaged Persons 945 9502,157 Children’s Commissioner 2,157 2,157
14,961 Connected Communities 14,045 14,04717,789 Counselling and Rehabilitation Services 17,674 17,6778,677 Education and Prevention Services 8,543 8,5627,124 Families Commission 10,305 10,305
77,087 Family Wellbeing Services 83,877 84,903- Income Related Rent Subsidy for Community Housing Providers 74 2,900
39 Independent Advice on Government Priority Areas MCOA 216 53839 Other Advice 216 329
- Policy Advice - 209- Provision of Housing and Related Services for Tenants Paying Income Related Rent 149,573 151,535
6,230 Services for Young People 5,185 5,2442,290 Strengthening Providers and Communities 2,381 2,382
109,263 Strong Families 108,212 108,4963,336 Student Placement Services 3,336 3,3371,729 Trialling New Approaches to Social Sector Change 4,762 4,835
89,213 Vocational Services for People with Disabilities 88,274 88,902880 Youth Development Partnership Fund 889 889
25,657 Youth Support Services MCOA 32,697 33,2017,664 Support for Youth Payment and Young Parent Payment recipients 13,410 14,964
17,993 Support to prevent disengaged young people from coming on to benefit at the age of 18 19,287 18,237
367,877 Total non-departmental output expenses 533,145 540,860
Non-departmental other expenses78,776 Debt Write-downs103 65,127 93,98392,876 Employment Assistance 43,900 43,900
3,945 Mainstream Supported Employment Programme 3,290 3,54616,795 Out of School Care Programmes 19,396 19,603
Improved Employment and Social Outcomes Support MCA- Improving Employment Outcomes - Assistance 9 1,000
192,392 Total non-departmental other expenses 131,722 162,032
Non-departmental capital expenditure143,245 Recoverable Assistance 144,967 147,848
1,566,748 Student Loans 1,601,031 1,686,145
1,709,993 Total non-departmental capital expenditure 1,745,998 1,833,993
Explanations of significant variances against budget are detailed in Note 1.
These non-departmental balances are consolidated into the Financial Statements of the Government, and therefore readers of these statements and schedules should also refer to the Financial Statements of the Government for 2013/2014.
Responsible MinistersMinister for Social Development is responsible for all appropriations above except:• Minister of Youth Affairs is responsible for Services for Young People and Youth Development Partnership Fund• Minister of Health is responsible for Trialling New Approaches to Social Sector Change• Minister of Revenue is responsible for Student Loans.
103 Debt Write-downs in 2013/2014 includes $2.35 million of remeasurement due to changes in interest and collection cost rates.
The Statement of Accounting Policies: Non-Departmental on pages 118 to 119 and Notes 1 to 4 on pages 131 to 137 form an integral part of these financial statements and schedules.
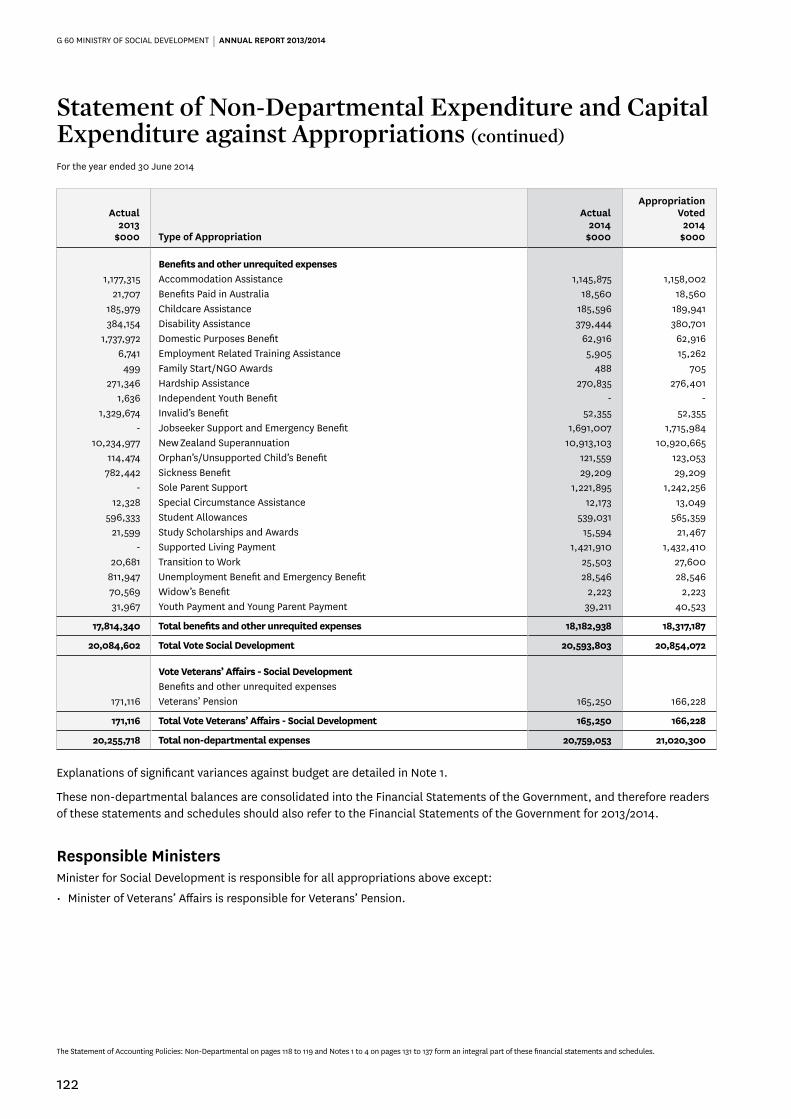
G 60 MINISTRY OF SOCIAL DEVELOPMENT | ANNUAL REPORT 2013/2014
122
Statement of Non-Departmental Expenditure and Capital Expenditure against Appropriations (continued)
For the year ended 30 June 2014
Actual2013
$000 Type of Appropriation
Actual2014
$000
AppropriationVoted
2014$000
Benefits and other unrequited expenses1,177,315 Accommodation Assistance 1,145,875 1,158,002
21,707 Benefits Paid in Australia 18,560 18,560185,979 Childcare Assistance 185,596 189,941384,154 Disability Assistance 379,444 380,701
1,737,972 Domestic Purposes Benefit 62,916 62,9166,741 Employment Related Training Assistance 5,905 15,262
499 Family Start/NGO Awards 488 705271,346 Hardship Assistance 270,835 276,401
1,636 Independent Youth Benefit - - 1,329,674 Invalid’s Benefit 52,355 52,355
- Jobseeker Support and Emergency Benefit 1,691,007 1,715,98410,234,977 New Zealand Superannuation 10,913,103 10,920,665
114,474 Orphan’s/Unsupported Child’s Benefit 121,559 123,053782,442 Sickness Benefit 29,209 29,209
- Sole Parent Support 1,221,895 1,242,25612,328 Special Circumstance Assistance 12,173 13,049
596,333 Student Allowances 539,031 565,35921,599 Study Scholarships and Awards 15,594 21,467
- Supported Living Payment 1,421,910 1,432,41020,681 Transition to Work 25,503 27,600
811,947 Unemployment Benefit and Emergency Benefit 28,546 28,54670,569 Widow’s Benefit 2,223 2,22331,967 Youth Payment and Young Parent Payment 39,211 40,523
17,814,340 Total benefits and other unrequited expenses 18,182,938 18,317,187
20,084,602 Total Vote Social Development 20,593,803 20,854,072
Vote Veterans’ Affairs - Social DevelopmentBenefits and other unrequited expenses
171,116 Veterans’ Pension 165,250 166,228
171,116 Total Vote Veterans’ Affairs - Social Development 165,250 166,228
20,255,718 Total non-departmental expenses 20,759,053 21,020,300
Explanations of significant variances against budget are detailed in Note 1.
These non-departmental balances are consolidated into the Financial Statements of the Government, and therefore readers of these statements and schedules should also refer to the Financial Statements of the Government for 2013/2014.
Responsible MinistersMinister for Social Development is responsible for all appropriations above except:
• Minister of Veterans’ Affairs is responsible for Veterans’ Pension.
The Statement of Accounting Policies: Non-Departmental on pages 118 to 119 and Notes 1 to 4 on pages 131 to 137 form an integral part of these financial statements and schedules.

G 60 MINISTRY OF SOCIAL DEVELOPMENT | ANNUAL REPORT 2013/2014
123
There was no unappropriated expenditure for the year ended 30 June 2014 (2013: nil).
The demand-driven nature of the Benefits and Other Unrequited Expenses (BOUE) and Non-departmental capital expenditure appropriations means they are forecast on a mid-point average basis during the year. Under this method of forecasting, it was expected the actual expenditure on some of the forecast items would be more than the mid-point forecast and on other forecast items the actual expenditure would be less than the mid-point forecast. As an appropriation is a legal upper limit on expenditure, using a mid-point forecast to determine the amount of the appropriation inevitably means there will be unappropriated expenditure for some forecast items requiring separate ministerial approval.
To reduce the likelihood of unappropriated expenditure, each item in the 2013/2014 Supplementary Estimates included forecasts set within reason at the higher end of their forecast range. In addition, the Ministry can seek approval under section 26B of the Public Finance Act 1989 for demand-driven expenditure likely to exceed the forecasts prepared for the 2013/2014 Supplementary Estimates. In 2013/2014, this approval was not required with all expenditure within appropriation voted budget levels.
There were no instances of unappropriated expenditure in excess of section 26B approvals at year-end (2013: nil).
Statement of Non-Departmental Unappropriated Expenditure and Capital ExpenditureFor the year ended 30 June 2014
The Statement of Accounting Policies: Non-Departmental on pages 118 to 119 and Notes 1 to 4 on pages 131 to 137 form an integral part of these financial statements and schedules.

G 60 MINISTRY OF SOCIAL DEVELOPMENT | ANNUAL REPORT 2013/2014
124
Actual2013
$000 Note
Actual2014
$000
MainEstimates
2014$000
SupplementaryEstimates
2014$000
2 Interest revenue 4 - - 214 Maintenance capitalisation 366 60 450216 Miscellaneous revenue 1,315 - -
11,290 Student Loan - administration fee 2 10,968 11,334 11,410
11,722 Total non-departmental income 12,653 11,394 11,860
Explanations of significant variances against budget are detailed in Note 1.
For additional detail on student loan advances refer Note 2.
These non-departmental balances are consolidated into the Financial Statements of the Government, and therefore readers of these statements and schedules should also refer to the Financial Statements of the Government for 2013/2014.
Schedule of Non-Departmental IncomeFor the year ended 30 June 2014
The Statement of Accounting Policies: Non-Departmental on pages 118 to 119 and Notes 1 to 4 on pages 131 to 137 form an integral part of these financial statements and schedules.

G 60 MINISTRY OF SOCIAL DEVELOPMENT | ANNUAL REPORT 2013/2014
125
Actual2013
$000 Note
Actual2014
$000
MainEstimates
2014$000
SupplementaryEstimates
2014$000
219,625 Benefit recoveries - current debt 217,970 232,180 215,6381,030 Benefit recoveries - liable parent contributions 985 960 607
79,097 Benefit recoveries - non-current debt 86,931 82,861 87,383184,725 Overseas pension recoveries 214,214 197,943 221,56996,753 Student Loans - repayment of principal 2 90,462 115,203 96,458
581,230 Total non-departmental capital receipts 610,562 629,147 621,655
Explanations of significant variances against budget are detailed in Note 1.
For additional detail on student loan advances refer Note 2.
These non-departmental balances are consolidated into the Financial Statements of the Government, and therefore readers of these statements and schedules should also refer to the Financial Statements of the Government for 2013/2014.
Schedule of Non-Departmental Capital ReceiptsFor the year ended 30 June 2014
The Statement of Accounting Policies: Non-Departmental on pages 118 to 119 and Notes 1 to 4 on pages 131 to 137 form an integral part of these financial statements and schedules.

G 60 MINISTRY OF SOCIAL DEVELOPMENT | ANNUAL REPORT 2013/2014
126
Actual2013
$000 Notes
Actual2014
$000
MainEstimates
2014$000
SupplementaryEstimates
2014$000
Current assets164,848 Cash and cash equivalents 148,805 74,336 164,848185,282 Social benefit receivables 3 199,460 174,654 199,829
(101,526) Provision for doubtful debts – social benefit receivables
3 (105,556) - -
3,495 Other receivables 3 13,314 7,789 3,495(1,140) Provision for doubtful debts – other receivables 3 (834) (1,065) (1,140)
435 Prepayments – benefits and allowances 34,012 33,042 34,391
251,394 Total current assets 289,201 288,756 401,423
Non-current assets979,758 Social benefit receivables 3 1,036,790 1,028,399 1,025,861
(561,314) Provision for doubtful debts - socal benefit receivables
3 (603,272) (740,015) (742,840)
91 Other advances 87 85 83- Foreign exchange forward contracts - 961 -
418,535 Total non-current assets 433,605 289,430 283,104
669,929 Total non-departmental assets 722,806 578,186 684,527
Explanations of significant variances against budget are detailed in Note 1.
For additional detail on Accounts receivable – benefits and allowances refer Note 3.
These non-departmental balances are consolidated into the Financial Statements of the Government, and therefore readers of these statements and schedules should also refer to the Financial Statements of the Government for 2013/2014.
Schedule of Non-Departmental AssetsAs at 30 June 2014
The Statement of Accounting Policies: Non-Departmental on pages 118 to 119 and Notes 1 to 4 on pages 131 to 137 form an integral part of these financial statements and schedules.

G 60 MINISTRY OF SOCIAL DEVELOPMENT | ANNUAL REPORT 2013/2014
127
Actual2013
$000
Actual2014
$000
MainEstimates
2014$000
SupplementaryEstimates
2014$000
Current liabilities556,133 Accruals - other than government departments 156,586 165,000 164,35084,506 Tax payable 165,493 145,191 152,691
1,373 Other current liabilities 1,076 780 1,3741,855 Foreign exchange forward contracts 2,661 - 1,854
643,867 Total non-departmental liabilities 325,816 310,971 320,269
Explanations of significant variances against budget are detailed in Note 1.
These non-departmental balances are consolidated into the Financial Statements of the Government, and therefore readers of these statements and schedules should also refer to the Financial Statements of the Government for 2013/2014.
Schedule of Non-Departmental LiabilitiesAs at 30 June 2014
The Statement of Accounting Policies: Non-Departmental on pages 118 to 119 and Notes 1 to 4 on pages 131 to 137 form an integral part of these financial statements and schedules.

G 60 MINISTRY OF SOCIAL DEVELOPMENT | ANNUAL REPORT 2013/2014
128
The Ministry has no non-departmental commitments at balance date (2013: nil).
Schedule of Non-Departmental Contingent Liabilities and Contingent AssetsAs at 30 June 2014
Unquantifiable contingent liabilitiesThe Ministry on behalf of the Crown has no unquantifiable contingent liabilities (2013: nil).
Quantifiable contingent liabilitiesThere are no quantifiable cases lodged against the Ministry that remain unresolved as at 30 June 2014 (2013: nil).
Contingent assetsThe Ministry on behalf of the Crown has no contingent assets (2013: nil).
These non-departmental balances are consolidated into the Financial Statements of the Government, and therefore readers of these statements and schedules should also refer to the Financial Statements of the Government for 2013/2014.
Schedule of Non-Departmental CommitmentsAs at 30 June 2014
The Statement of Accounting Policies: Non-Departmental on pages 118 to 119 and Notes 1 to 4 on pages 131 to 137 form an integral part of these financial statements and schedules.

G 60 MINISTRY OF SOCIAL DEVELOPMENT | ANNUAL REPORT 2013/2014
129
The Ministry operates trust accounts as the agent under section 66 of the Public Finance Act 1989. The transactions through these accounts and their balances as at 30 June 2014 are not included in the Ministry’s own financial statements. Movements in these accounts during the year ended 30 June 2014 were as follows:
Actual2013
$000
Actual2014
$000
Australian Debt Recoveries
2 Balance at 1 July 3
19 Contributions 13(18) Distributions (14)
- Revenue - - Expenditure -
3 Balance at 30 June 2
Australian Embargoed Arrears
356 Balance at 1 July 379
5,424 Contributions 5,943(5,401) Distributions (5,296)
- Revenue - - Expenditure -
379 Balance at 30 June 1,026
Maintenance
33 Balance at 1 July 54
514 Contributions 533(496) Distributions (338)
3 Revenue 2- Expenditure -
54 Balance at 30 June 251
Netherlands Debt
11 Balance at 1 July 1
69 Contributions 108(79) Distributions (105)
- Revenue - - Expenditure -
1 Balance at 30 June 4
437 Total trust monies 1,283
Statement of Trust MoniesAs at 30 June 2014
The Statement of Accounting Policies: Non-Departmental on pages 118 to 119 and Notes 1 to 4 on pages 131 to 137 form an integral part of these financial statements and schedules.
G 60 MINISTRY OF SOCIAL DEVELOPMENT | ANNUAL REPORT 2013/2014
130
Australian Debt Recoveries Trust AccountAn agreement exists between the Australian and New Zealand Governments for the Ministry to deduct monies from customers in receipt of a benefit in New Zealand for debts owing in Australia. The trust account records these transactions and transfers the amounts held in the trust account to the Australian Government on a monthly basis.
Australian Embargoed Arrears Trust AccountUnder the reciprocal agreement between the Australian and New Zealand Governments, the New Zealand Government is required to make regular contributions to any former New Zealand residents living in Australia in receipt of a benefit in Australia. The trust account has been established to record any one-off arrears payments.
Maintenance Trust AccountThe Ministry is responsible for collecting maintenance arrears owing as at 30 June 1992. Amounts are collected from the non-custodial parent and deposited into the trust account. These amounts are then paid into the custodial parent’s bank account.
Netherlands Debt Trust AccountAn agreement exists between the Netherlands and New Zealand Governments for the Ministry to deduct monies from customers in receipt of a benefit in New Zealand for debts owing in the Netherlands. The trust account records these transactions and transfers the amounts held in the trust account to the Netherlands Government on a monthly basis.
These non-departmental balances are consolidated into the Financial Statements of the Government, and therefore readers of these statements and schedules should also refer to the Financial Statements of the Government for 2013/2014.
The Statement of Accounting Policies: Non-Departmental on pages 118 to 119 and Notes 1 to 4 on pages 131 to 137 form an integral part of these financial statements and schedules.

G 60 MINISTRY OF SOCIAL DEVELOPMENT | ANNUAL REPORT 2013/2014
131
Notes to the Non-Departmental Financial Statements
Note 1: Explanation of major variances against budgetExplanations for major variances from the Ministry’s non-departmental estimated figures in the Main Estimates are as follows:
Schedule of income and expensesNon-departmental output expenses were higher than Mains Estimates mainly due to the introduction of the new appropriation Provision of Housing and Related Services for Tenants Paying Income Related Rent in November 2013.
Non-departmental other expenses were lower than Mains Estimates due to the transfer of funds from Employment Assistance to the new Multi-Category Appropriation (MCA) Improved Employment and Social Outcomes Support from 1 January 2014.
There are no other significant variances against budget.
Schedule of assets and liabilitiesCash and cash equivalents is higher in 2013/2014 compared with the original budget due to the timing of the cash draw-down from the Treasury.
There are no other significant variances against budget.
Changes in actual results and Supplementary Estimates104
Explanations for major variances from the Ministry’s Supplementary Estimates figures are as follows:
Notes
Actual2014
$000
AppropriationVoted
2014$000
Variance2014
$000
Vote Social DevelopmentNon-departmental output expensesIncome Related Rent Subsidy for Community Housing Providers (a) 74 2,900 2,826
Independent Advice on Government Priority Areas MCOAOther Advice (b) 216 329 113 Policy Advice (b) - 209 209
Non-departmental other expensesDebt Write-downs (c) 65,127 93,983 28,856 Improved Employment and Social Outcomes Support MCA
Improving Employment Outcomes – Assistance (d) 9 1,000 991
Non-departmental capital expenditureStudent Loans (e) 1,601,031 1,686,145 85,114
Benefits and other unrequited expensesEmployment Related Training Assistance (f) 5,905 15,262 9,357 Family Start/NGO Awards (g) 488 705 217 Student Allowances (h) 539,031 565,359 26,328 Study Scholarships and Awards (i) 15,594 21,467 5,873
104 Variances against original budget are detailed in the section ‘Changes in appropriations’ refer page 132.

G 60 MINISTRY OF SOCIAL DEVELOPMENT | ANNUAL REPORT 2013/2014
132
Variance explanationa) Income Related Rent Subsidy for Community Housing Providers was lower than budget because the demand has been very
low since it was established from 14 April 2014 when the social housing functions were transferred from Vote Housing.
b) Other Advice and Policy Advice were both underspent because expenditure in this MCOA is dependent on when specific work is commissioned which has been low during 2013/2014.
c) Debt Write-downs was lower than budget because of the supplementary add-on105 of $10 million (10.6 per cent of appropriation voted) and changes to the rates used to calculate the debt write-down provision.
d) Improving Employment Outcomes – Assistance expenditure has been lower than expected since the establishment of the Improved Employment and Social Support MCA from 1 January 2014. This has been due to lower demand for this service. However the underspend represents only 0.3 per cent of the total budgeted amount for the MCA.
e) Student Loans was lower than budget mainly because of the supplementary add-on of $45 million (2.7 per cent of appropriation voted) and lower than expected student loan borrowers during the quarter ended June 2014.
f) Employment Related Training Assistance is a capped item containing the Training Incentive Allowance and the Course Participation Assistance Grant. The cap is set higher than current demand and underspends are expected.
g) Family Start/NGO Awards is a capped appropriation of $705,000. The actual expenditure of $488,000 was in line with expenditure trends since 2011/2012. As Family Start/NGO Awards is a capped item, underspends are expected.
h) Student Allowances was lower than budget mainly due to the supplementary add-on of $24 million (4.2 per cent of appropriation voted).
i) Study Scholarship and Awards was underspent mainly due to TeachNZ expenditure being below forecast. TeachNZ is a capped item and the cap is set higher than current demand with underspends expected.
Changes in appropriationsThe table below summarises the material changes in appropriations between the Main Estimates and the final Supplementary Estimates for the 2013/2014 financial year.
Notes
MainEstimates
2014$000
AppropriationVoted
2014$000
Variance2014
$000
Vote Social DevelopmentNon-departmental output expensesProvision of Housing and Related Services for Tenants Paying Income Related Rent
(a) - 151,535 151,535
Non-departmental other expensesEmployment Assistance (b) 102,133 43,900 (58,233)Improved Employment and Social Outcomes Support MCA
Improving Employment Outcomes - Assistance (c) - 1,000 1,000
Non-departmental capital expenditureStudent Loans (d) 1,631,661 1,686,145 54,484
Benefits and other unrequited expensesAccommodation Assistance (e) 1,191,296 1,158,002 (33,294)Domestic Purposes Benefit (f) 149,349 62,916 (86,433)Invalid’s Benefit (f) 116,468 52,355 (64,113)New Zealand Superannuation (g) 10,894,365 10,920,665 26,300 Sickness Benefit (f) 69,833 29,209 (40,624)Supported Living Payment (h) 1,391,858 1,432,410 40,552 Unemployment Benefit and Emergency Benefit (f) 64,589 28,546 (36,043)Widow’s Benefit (f) 5,996 2,223 (3,773)
105 The supplementary add-on refers to the budget adjustments that the Ministry makes in the Supplementary Estimates each year to its forecast appropriations to minimise the risk of unappropriated expenditure. These appropriations are demand-driven and are required to be forecast at a mid-point estimate during the normal course of the year. This is to accurately reflect the information and circumstances at the date the forecasts are set. However, as this mid-point method can increase the unappropriated expenditure risk, the Ministry is permitted to make supplementary add-on adjustments to its final year-end budgets.

G 60 MINISTRY OF SOCIAL DEVELOPMENT | ANNUAL REPORT 2013/2014
133
Variance explanationa) This is a new appropriation in 2013/2014 to provide for the transfer of functions related to the assessment of eligibility for
social housing and the calculation of Income Related Rent subsidies from Vote Housing.
b) This appropriation decreased by $58.233 million to $43.900 million in 2013/2014 mainly due to the transfer of funds to the Multi-Category Appropriation (MCA) Improved Employment and Social Outcomes Support from 1 January 2014.
c) This is part of the newly established Multi-Category Appropriation (MCA) Improved Employment and Social Outcomes Support from 1 January 2014.
d) Student Loans appropriation increased by $54.484 million in 2013/2014 mainly due to the supplementary add-on of $45 million which reduced the likelihood of overspending.
e) This appropriation decreased by $33.294 million mainly due to fewer Accommodation Assistance recipients, which was a result of fewer main benefit recipients.
f) This appropriation decreased in 2013/2014 because the Appropriation Voted is two weeks of actual spending compared with a whole forecast month of expenditure in the Main Estimates. This appropriation ceased on 14 July 2013 and was replaced by new appropriations under Welfare Reform.
g) This appropriation increased by $26.300 million in 2013/2014 mainly due to a higher number of recipients because of demographic trends offset by higher than expected overseas pension recoveries.
h) This appropriation increased by $40.552 million in 2013/2014 mainly due to a higher number of recipients and a supplementary add-on of $10 million to reduce the likelihood of overspending.
The Supplementary Estimates of Appropriations and Supporting Information 2013/2014 contains more information on appropriation variances.
Note 2: Student loan advances
Carrying value of student loans
As at 30 June 2014
Actual2013
$000
Actual2014
$000
Vote Social DevelopmentStudent loans
- Opening nominal balance - 1,566,796 New lending 1,601,031
(96,753) Repayment (90,462)(1,481,333) Loan balance transfer to IRD (1,521,537)
11,290 Administration fee 10,968
- Closing nominal balance -
- Net carrying value of student loans -
The Student Loan Scheme is administered by the Ministry of Social Development in conjunction with the Ministry of Education and the Inland Revenue Department (IRD). The Ministry’s role is to assess and make payments to students undertaking tertiary education. Student loans are transferred to the IRD on a daily basis for collection. The interest rate risk and the credit risk on student loans are held by the IRD.

G 60 MINISTRY OF SOCIAL DEVELOPMENT | ANNUAL REPORT 2013/2014
134
Note 3: Accounts receivable – benefits and allowancesBalances owed to the Ministry are made up of benefits and allowances overpayments, recoverable assistance and fraud repayments. Interest is not charged on benefit recovery and demands for repayment are restricted to prevent client hardship.
The carrying value and the fair value are the same for these amounts. Since there is no market comparison, the fair value is determined by discounting the expected future cash flows by the appropriate interest rates at year-end. The effective interest rates applied at year-end were between 4.85 per cent and 5.73 per cent (3.86 per cent and 6.37 per cent at 30 June 2013).
The fair value of the portfolio as at 30 June 2014 is $540 million ($505 million at 30 June 2013).
Social benefit and Other receivablesAs at 30 June 2014
Actual2013
$000
Actual2014
$000
Account receivables1,165,040 Gross social benefit receivables 1,236,250 (662,840) Impairment of social benefit receivables106 (708,828)
3,495 Other receivables 13,314(1,140) Provision for doubtful debts – other receivables (834)
504,555 Total receivables 539,902
Impairment of social benefit receivables(602,015) Opening balance (662,840)
(78,702) Impairment losses recognised on receivables (65,434)17,877 Amounts written off as uncollectible 19,446
(662,840) Balance at end of the year (708,828)
(662,840) Collective impairment allowance (708,828)- Individual impairment allowance -
(662,840) Balance at end of the year (708,828)
Ageing of social benefit receivables past due but not impaired29,562 Less than six months 31,232 67,008 Between six months and one year 61,094
- Greater than one year -
96,570 Total social benefit receivables past due but not impaired 92,326
Significant assumption behind the carrying value is:3.86%-6.37% Effective interest rate 4.85%-5.73%
The estimated fair value of the Social Benefit Debt and Other receivables portfolio and key assumptions underpinning the fair valuation are:
504,555 Fair value 539,902 (17,768) Impact on fair value of a 1% increase in discount rate (19,651)19,907 Impact on fair value of a 1% decrease in discount rate 22,193
Impairment is calculated on a collective basis, not on an individual basis. There was a net movement in impairment losses of $46 million during the 2013/2014 year (2013: $61 million).
The fair value is sensitive to the discount rate and the expected future cash flows. An increase in the discount rate of 1 per cent would decrease fair value by approximately $20 million. A decrease in the discount rate of 1 per cent would increase fair value by approximately $22 million. Since there are no contractual repayment terms, future cash flows assume existing cash flow receipts will continue. These are adjusted for likely negative future events such as death.
106 Impairment of social benefit receivables includes $2.35 million of remeasurement due to changes in interest and collection cost rates.
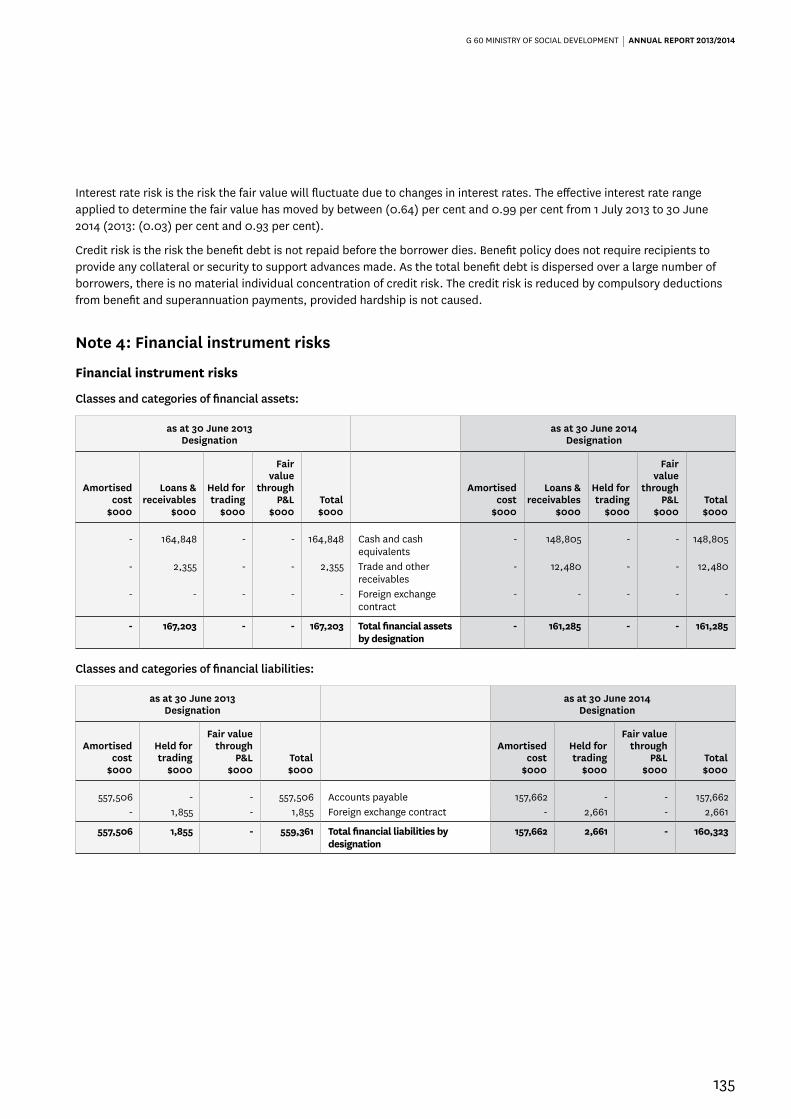
G 60 MINISTRY OF SOCIAL DEVELOPMENT | ANNUAL REPORT 2013/2014
135
Interest rate risk is the risk the fair value will fluctuate due to changes in interest rates. The effective interest rate range applied to determine the fair value has moved by between (0.64) per cent and 0.99 per cent from 1 July 2013 to 30 June 2014 (2013: (0.03) per cent and 0.93 per cent).
Credit risk is the risk the benefit debt is not repaid before the borrower dies. Benefit policy does not require recipients to provide any collateral or security to support advances made. As the total benefit debt is dispersed over a large number of borrowers, there is no material individual concentration of credit risk. The credit risk is reduced by compulsory deductions from benefit and superannuation payments, provided hardship is not caused.
Note 4: Financial instrument risks
Financial instrument risks
Classes and categories of financial assets:
as at 30 June 2013 Designation
as at 30 June 2014 Designation
Amortised cost
$000
Loans & receivables
$000
Held for trading
$000
Fair value
through P&L
$000Total$000
Amortised cost
$000
Loans & receivables
$000
Held for trading
$000
Fair value
through P&L
$000Total$000
- 164,848 - - 164,848 Cash and cash equivalents
- 148,805 - - 148,805
- 2,355 - - 2,355 Trade and other receivables
- 12,480 - - 12,480
- - - - - Foreign exchange contract
- - - - -
- 167,203 - - 167,203 Total financial assets by designation
- 161,285 - - 161,285
Classes and categories of financial liabilities:
as at 30 June 2013 Designation
as at 30 June 2014 Designation
Amortised cost
$000
Held for trading
$000
Fair value through
P&L$000
Total$000
Amortised cost
$000
Held for trading
$000
Fair value through
P&L$000
Total$000
557,506 - - 557,506 Accounts payable 157,662 - - 157,662 - 1,855 - 1,855 Foreign exchange contract - 2,661 - 2,661
557,506 1,855 - 559,361 Total financial liabilities by designation
157,662 2,661 - 160,323

G 60 MINISTRY OF SOCIAL DEVELOPMENT | ANNUAL REPORT 2013/2014
136
Foreign currency risk management:
as at 30 June 2013 as at 30 June 2014
NZDNZ$000
AUDNZ$000
OtherNZ$000
TotalNZ$000
NZDNZ$000
AUDNZ$000
OtherNZ$000
TotalNZ$000
146,222 18,626 - 164,848 Cash and cash equivalents 146,899 1,906 - 148,8052,355 - - 2,355 Trade and other receivables 12,480 - - 12,480
- - - - Foreign exchange contract - - - -
148,577 18,626 - 167,203 Total financial assets 159,379 1,906 - 161,285
557,506 - - 557,506 Accounts payable 157,662 - - 157,6621,855 - - 1,855 Foreign exchange contract 2,661 - - 2,661
559,361 - - 559,361 Total financial liabilities 160,323 - - 160,323
The Ministry needs to reimburse the Australian Government for income support assistance provided to New Zealanders eligible under the 1994 Reciprocal Agreement. The reimbursement is paid in Australian dollars. The Ministry has bought foreign exchange forward contracts with the New Zealand Debt Management Office (NZDMO) to hedge the currency risk. At balance date, the Ministry had a series of foreign exchange forward contracts which entitles the Ministry to exchange NZ$20.002 million with the NZDMO for AUD$15.996 million. On 30 June 2014, the market value of these contracts was a liability of NZ$2.661 million (2013: liability of NZ$1.855 million).
Credit risk management:
as at 30 June 2013 as at 30 June 2014
AAA$000
AA$000
A$000
Non-rated$000
Total$000
AAA$000
AA$000
A$000
Non-rated$000
Total$000
- 164,848 - - 164,848 Cash and cash equivalents - 148,805 - - 148,805 - - - 2,355 2,355 Trade and other receivables - - - 12,480 12,480 - - - - - Foreign exchange contract - - - - -
- 164,848 - 2,355 167,203 Total financial assets - 148,805 - 12,480 161,285
Credit risk is the risk a third party will default on its obligation to the Ministry, causing the Ministry to incur a loss.
In the normal course of the Ministry’s business, credit risk arises from debtors, deposits with banks and derivative financial instrument assets.
The Ministry is only permitted to deposit funds with Westpac, a registered bank, and to enter into foreign exchange forward contracts with the New Zealand Debt Management Office. These entities have high credit ratings.
For its other financial instruments, the Ministry does not have significant concentrations of credit risk.
Concentration of credit exposure by geographical area:
as at 30 June 2013 as at 30 June 2014
New Zealand
$000Australia
$000Europe
$000Other$000
Total$000
New Zealand
$000Australia
$000Europe
$000Other$000
Total$000
146,222 18,626 - - 164,848 Cash and cash equivalents 146,899 1,906 - - 148,805 2,355 - - - 2,355 Trade and other receivables 12,480 - - - 12,480
- - - - - Foreign exchange contract - - - - -
148,577 18,626 - - 167,203 Total financial assets 159,379 1,906 - - 161,285
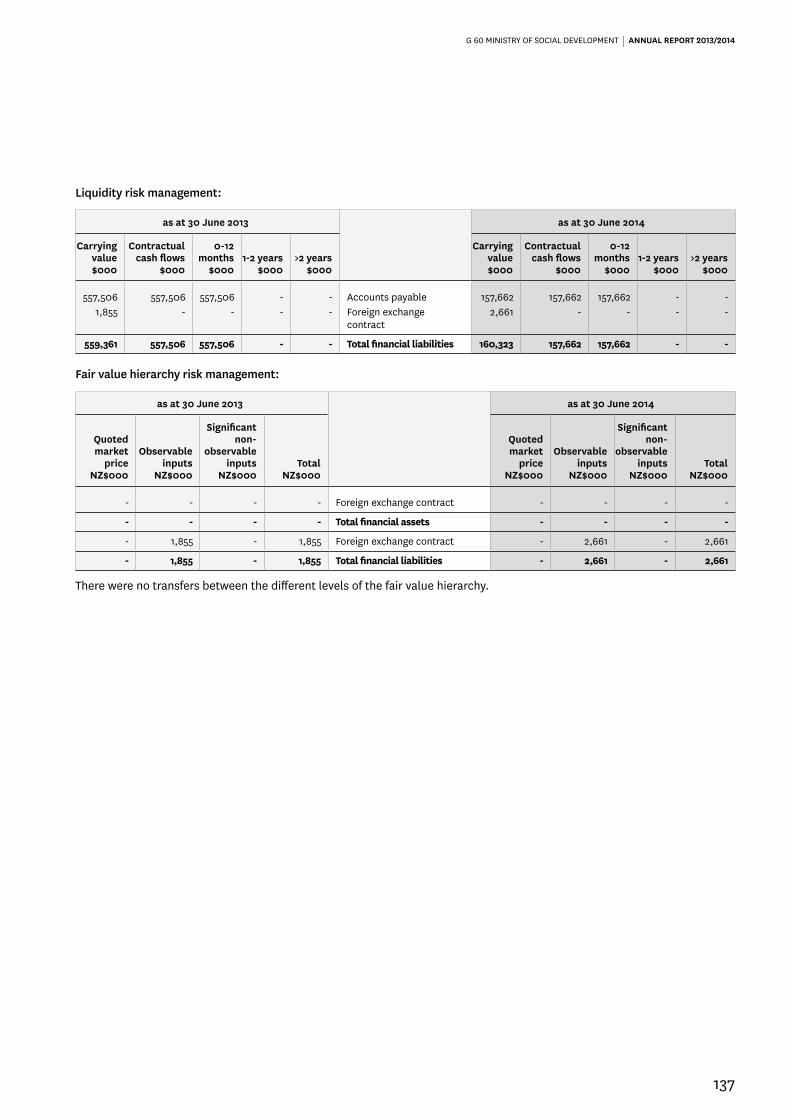
G 60 MINISTRY OF SOCIAL DEVELOPMENT | ANNUAL REPORT 2013/2014
137
Liquidity risk management:
as at 30 June 2013 as at 30 June 2014
Carrying value$000
Contractual cash flows
$000
0-12 months
$0001-2 years
$000>2 years
$000
Carrying value$000
Contractual cash flows
$000
0-12 months
$0001-2 years
$000>2 years
$000
557,506 557,506 557,506 - - Accounts payable 157,662 157,662 157,662 - - 1,855 - - - - Foreign exchange
contract 2,661 - - - -
559,361 557,506 557,506 - - Total financial liabilities 160,323 157,662 157,662 - -
Fair value hierarchy risk management:
as at 30 June 2013 as at 30 June 2014
Quoted market
priceNZ$000
Observable inputs
NZ$000
Significant non-
observable inputs
NZ$000Total
NZ$000
Quoted market
priceNZ$000
Observable inputs
NZ$000
Significant non-
observable inputs
NZ$000Total
NZ$000
- - - - Foreign exchange contract - - - -
- - - - Total financial assets - - - -
- 1,855 - 1,855 Foreign exchange contract - 2,661 - 2,661
- 1,855 - 1,855 Total financial liabilities - 2,661 - 2,661
There were no transfers between the different levels of the fair value hierarchy.


