23
Financial Statements of TOTAL CAPITAL CANADA LTD. Years ended December 31, 2017 and 2016
Financial Statements of
TOTAL CAPITAL CANADA LTD.
Years ended December 31, 2017 and 2016
KPMG LLP 205 5th Avenue SW Suite 3100 Calgary AB T2P 4B9 Telephone 403-691-8000 Fax 403-691-8008 www.kpmg.ca
KPMG LLP is a Canadian limited liability partnership and a member firm of the KPMG network of independent member firms affiliated with KPMG International Cooperative (“KPMG International”), a Swiss entity. KPMG Canada provides services to KPMG LLP.
INDEPENDENT AUDITORS’ REPORT
To the Shareholder and Directors of Total Capital Canada Ltd.
We have audited the accompanying financial statements of Total Capital Canada Ltd., which
comprise the statements of financial position as at December 31, 2017 and December 31,
2016, the statements of income (loss) and comprehensive income (loss), changes in
shareholder’s equity and cash flows for the years then ended, and notes, comprising a
summary of significant accounting policies and other explanatory information.
Management’s Responsibility for the Financial Statements
Management is responsible for the preparation and fair presentation of these financial
statements in accordance with International Financial Reporting Standards, and for such
internal control as management determines is necessary to enable the preparation of
financial statements that are free from material misstatement, whether due to fraud or error.
Auditors’ Responsibility
Our responsibility is to express an opinion on these financial statements based on our audits.
We conducted our audits in accordance with Canadian generally accepted auditing
standards. Those standards require that we comply with ethical requirements and plan and
perform the audit to obtain reasonable assurance about whether the financial statements
are free from material misstatement.
An audit involves performing procedures to obtain audit evidence about the amounts and
disclosures in the financial statements. The procedures selected depend on our judgment,
including the assessment of the risks of material misstatement of the financial statements,
whether due to fraud or error. In making those risk assessments, we consider internal control
relevant to the entity’s preparation and fair presentation of the financial statements in order
to design audit procedures that are appropriate in the circumstances, but not for the purpose
of expressing an opinion on the effectiveness of the entity’s internal control. An audit also
includes evaluating the appropriateness of accounting policies used and the reasonableness
of accounting estimates made by management, as well as evaluating the overall
presentation of the financial statements.
We believe that the audit evidence we have obtained in our audits is sufficient and
appropriate to provide a basis for our audit opinion.

2
Opinion
In our opinion, the financial statements present fairly, in all material respects, the financial
position of Total Capital Canada Ltd. as at December 31, 2017 and December 31, 2016,
and its financial performance and its cash flows for the years then ended in accordance with
International Financial Reporting Standards.
Chartered Professional Accountants February 7, 2018 Calgary, Canada

TOTAL CAPITAL CANADA LTD. Statements of Financial Position As at December 31 (Thousands of U.S. dollars)
Page | 1
2017 2016
Assets Current assets
Cash 1,162 1,053 Related party loans (note 4) 33,364 -
Interest receivable on related party loans (note 4) 37,798 16,918 Fair value of derivatives (notes 8 and 9) 2,552 -
74,876 17,971 Related party loans (note 4) 9,735,916 12,992,858 Fair value of derivatives (notes 8 and 9) 1,528 - Deferred tax asset 112 135 9,812,432 13,010,964
Liabilities and Shareholder’s Equity Current liabilities
Accounts payable and accrued liabilities 812 1,008 Related party loans (note 4) 40,350 16,918 Fair value of derivatives (notes 8 and 9) 33,364 -
Debt (note 5) 4,513,522 6,562,017 4,588,048 6,579,943
Fair value of derivatives (notes 8 and 9) 167,535 750,398 Related party loans (note 4) 1,528 - Debt (note 5) 5,054,128 5,679,456 Shareholder’s equity
Share capital (note 6) 50 50 Retained earnings 1,143 1,117
1,193 1,167 9,812,432 13,010,964 Nature of operations, basis of presentation and economic dependence (note 1) See accompanying notes to financial statements.

TOTAL CAPITAL CANADA LTD. Statements of Income (Loss) and Comprehensive Income (Loss) Years ended December 31 (Thousands of U.S. dollars)
Page | 2
2017 2016 Finance income (note 7) 1,253,656 230,906 Finance expense (note 7) (1,253,607) (230,822) Net finance income before income tax expense 49 84 Income tax expense (recovery)
Current – (68) Deferred 23 227
23 159
Net income (loss) and comprehensive income (loss) 26 (75)
See accompanying notes to financial statements.

TOTAL CAPITAL CANADA LTD. Statements of Changes in Shareholder’s Equity Years ended December 31 (Thousands of U.S. dollars)
Page | 3
Opening Net income Closing 2017 balance 2017 balance
Share capital 50 – 50 Retained earnings 1,117 26 1,143
Total shareholder's equity 1,167 26 1,193 Opening Net loss Closing 2016 balance 2016 balance Share capital 50 – 50 Retained earnings 1,192 (75) 1,117
Total shareholder's equity 1,242 (75) 1,167 See accompanying notes to financial statements.
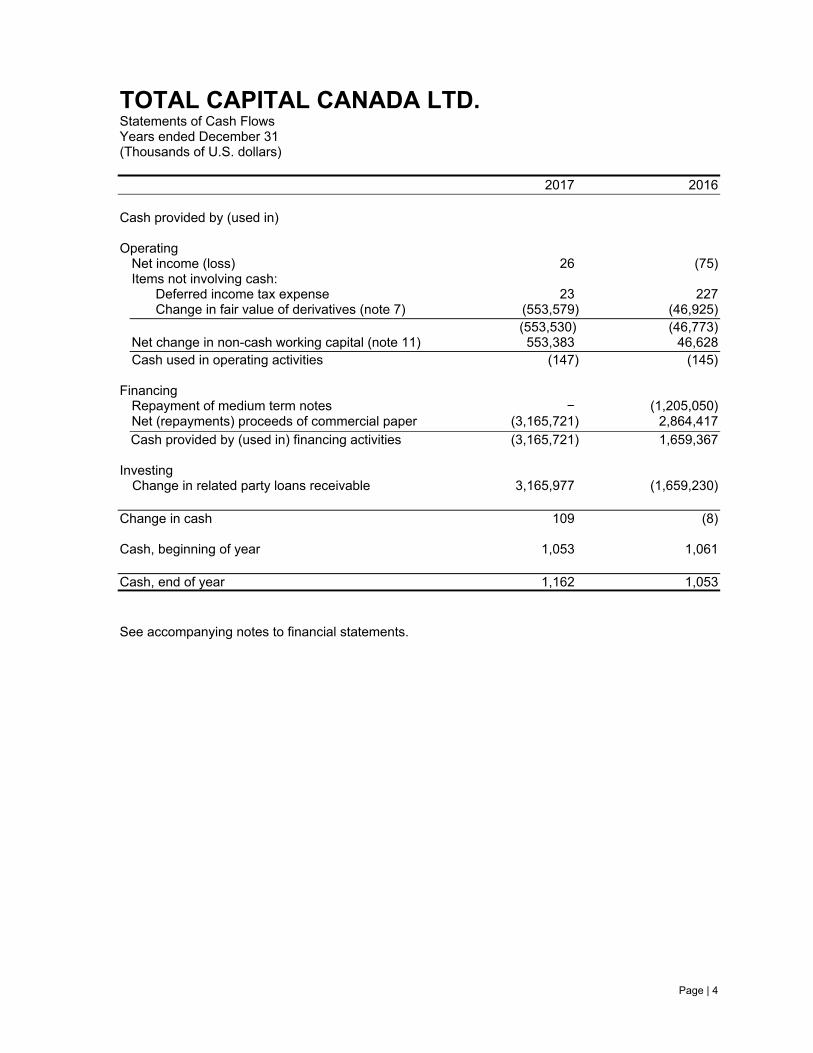
TOTAL CAPITAL CANADA LTD. Statements of Cash Flows Years ended December 31 (Thousands of U.S. dollars)
Page | 4
2017 2016 Cash provided by (used in) Operating
Net income (loss) 26 (75) Items not involving cash: Deferred income tax expense 23 227 Change in fair value of derivatives (note 7) (553,579) (46,925) (553,530) (46,773) Net change in non-cash working capital (note 11) 553,383 46,628 Cash used in operating activities (147) (145)
Financing
Repayment of medium term notes − (1,205,050) Net (repayments) proceeds of commercial paper (3,165,721) 2,864,417
Cash provided by (used in) financing activities (3,165,721) 1,659,367
Investing Change in related party loans receivable 3,165,977 (1,659,230)
Change in cash 109 (8) Cash, beginning of year 1,053 1,061 Cash, end of year 1,162 1,053
See accompanying notes to financial statements.

TOTAL CAPITAL CANADA LTD. Notes to the Financial Statements Years ended December 31, 2017 and 2016 (Thousands of U.S. dollars)
Page | 5
1. Nature of operations, basis of presentation and economic dependence
Total Capital Canada Ltd. (“TCCL” or the “Company”) was incorporated on April 9, 2007 under the
Business Corporations Act (Alberta). TCCL is a wholly-owned subsidiary of Total S.A. TCCL issues
debt securities and commercial paper. TCCL lends substantially all proceeds of its borrowings to
Total E&P Canada Ltd. (“TEPC”), which is also ultimately owned by Total S.A., and has Canadian
oil and gas operations.
The related party loans to TEPC corresponding to the debt are not expected to be repaid within the
next 12 months and as a result they are classified as a long-term asset. The debt is both current
and long-term in nature and as a result, TCCL has a working capital deficit of $4.5 billion at
December 31, 2017. The current portion of the debt is expected to be refinanced upon maturity.
The ultimate recoverability of the related party loans from TEPC is dependent upon TEPC
successfully developing its oil sands reserves and realizing positive cash flows from its operations
as well as receiving the continued support of Total S.A. Total S.A. has fully and unconditionally
guaranteed the debt securities issued by TCCL as to payment of principal, premium, if any, interest
and any other amounts due.
The Company’s registered office is located at 2900, 240 – 4th Avenue S.W., Calgary, Alberta,
Canada, T2P 4H4.
2. Basis of presentation
(a) Statement of compliance
These financial statements have been prepared in accordance with International Financial
Reporting Standards (“IFRS”) as issued by the International Accounting Standards Board.
The financial statements were authorized for issue by the Board of Directors on February 7,
2018.
(b) Basis of measurement
The financial statements have been prepared on the historical cost basis except for the
following:
(i) derivative financial instruments are measured at fair value with changes in fair value
recorded in profit or loss.
(ii) held for trading financial assets are measured at fair value with changes in fair value
recorded in profit or loss.
The methods used to measure fair values are discussed in note 9.
(c) Functional and presentation currency
The financial statements are presented in U.S. dollars, which is the functional currency of the
Company.

TOTAL CAPITAL CANADA LTD. Notes to the Financial Statements Years ended December 31, 2017 and 2016 (Thousands of U.S. dollars)
Page | 6
2. Basis of presentation (continued)
(d) Use of estimates and judgments
The preparation of financial statements in conformity with IFRS requires management to make
judgments, estimates and assumptions that affect the application of accounting policies and
the reported amounts of assets, liabilities, income and expenses. Actual results may differ from
these estimates.
Estimates and underlying assumptions are reviewed on an ongoing basis. Revisions to
accounting estimates are recognized in the year in which the estimates are revised and in any
future years affected.
The most significant area of estimation uncertainty and critical judgments in applying
accounting policies in the financial statements relate to the fair value of the derivative contracts
described in notes 8 and 9.
3. Significant accounting policies
(a) Foreign currency translation
Transactions in foreign currencies are translated to U.S. dollars at exchange rates at the dates
of the transactions. Monetary assets and liabilities denominated in foreign currencies are
translated to U.S. dollars at the period end exchange rate. Foreign currency differences arising
on translation are recognized in profit or loss.
(b) Financial instruments
(i) Non-derivative financial instruments
Non-derivative financial instruments comprise cash, interest receivable, related party
loans, accounts payable and accrued liabilities and debt. Non-derivative financial
instruments are recognized initially at fair value. Subsequent to initial recognition non-
derivative financial instruments are measured as described below.
Financial assets at fair value through profit or loss
An instrument is measured at fair value through profit or loss if it is held for trading or is
designated as such upon initial recognition. Financial instruments are designated at fair
value through profit or loss if the Company manages such investments and makes
purchase and sale decisions based on their fair value in accordance with the Company’s
risk management or investment strategy. Upon initial recognition, attributable transaction
costs are recognized in profit or loss. Financial assets at fair value through profit or loss
are measured at fair value, and changes therein are recognized in profit or loss. The
Company has designated cash at fair value through profit or loss.

TOTAL CAPITAL CANADA LTD. Notes to the Financial Statements Years ended December 31, 2017 and 2016 (Thousands of U.S. dollars)
Page | 7
3. Significant accounting policies (continued)
(b) Financial instruments (continued)
Other
Other non-derivative financial instruments which include interest receivable, related party
loans, accounts payable and accrued liabilities and debt are measured at amortized cost
using the effective interest method, less any impairment losses.
(ii) Derivative financial instruments
The Company holds derivative financial instruments to hedge its foreign currency and
interest rate exposures (see note 8). Derivatives are recognized initially at fair value;
attributable transaction costs are recognized in profit or loss as incurred. Subsequent to
initial recognition, derivatives are measured at fair value, and changes therein are
accounted for in profit or loss.
(iii) Share capital
Common shares are classified as equity. Incremental costs directly attributable to the issue
of ordinary shares are recognized as a deduction from equity, net of any tax effects.
(c) Income tax
Income tax expense comprises current and deferred tax. Income tax expense is recognized in
profit or loss except to the extent that it relates to items recognized directly in equity, in which
case it is recognized in equity.
Current tax is the expected tax payable or receivable on the taxable income or loss for the year,
using tax rates enacted or substantively enacted at the reporting date, and any adjustment to
tax payable in respect of previous years.
Deferred tax is recognized in respect of temporary differences between the carrying amounts
of assets and liabilities for financial reporting purposes and the amounts used for taxation
purposes. Deferred tax is measured at the tax rates that are expected to be applied to
temporary differences when they reverse, based on the laws that have been enacted or
substantively enacted by the reporting date.

TOTAL CAPITAL CANADA LTD. Notes to the Financial Statements Years ended December 31, 2017 and 2016 (Thousands of U.S. dollars)
Page | 8
3. Significant accounting policies (continued)
(d) Finance income and expenses
Finance income comprises interest income on related party loans, management fee with
related party, gain on derivatives, other financial income which is comprised of the offset of the
losses on derivatives and foreign exchange, and foreign exchange gains. Interest income is
recognized as it accrues in profit or loss, using the effective interest method.
Finance expense comprises interest expense on borrowings, finance fees, loss on derivatives,
transaction costs, other financial expense which is comprised of the offset of the gains on
derivatives and foreign exchange, and foreign exchange losses.
Foreign currency gains and losses, reported under finance income and expenses, are reported
on a net basis.
(e) Standards issued but not yet effective
IFRS 9 Financial Instruments
The mandatory effective date of IFRS 9 is for annual periods beginning on or after January 1,
2018. IFRS 9 includes revised guidance on the classification and measurement of financial
assets, a new ‘expected credit loss’ model for calculation of impairment on financial assets and
new hedge accounting requirements. The Company will adopt IFRS 9 in its financial statements
for the annual period beginning on January 1, 2018. The Company does not expect the
standard to have a material impact on the financial statements.
IFRS 15 Revenue from Contracts with Customers
IFRS 15 is effective for annual periods beginning on or after January 1, 2018. The standard
contains a single model that applies to contracts with customers and two approaches to
recognizing revenue: at a point in time or over time. The model features a contract-based five-
step analysis of transactions to determine whether, how much and when revenue is recognized.
New estimates and judgmental thresholds have been introduced, which may affect the amount
and/or timing of revenue recognized. The Company will adopt IFRS 15 in its financial
statements for the annual period beginning on January 1, 2018. The Company does not expect
the standard to have a material impact on the financial statements.
IFRS 16 Leases
The new standard is effective for annual periods beginning on or after January 1, 2019. IFRS
16 will replace IAS 17 Leases. This standard introduces a single lessee accounting model and
requires a lessee to recognize assets and liabilities for all leases with a term of more than 12
months, unless the underlying asset is of low value. The Company intends to adopt IFRS 16 in
its financial statements for the annual period beginning on January 1, 2019. The Company
does not expect the standard to have a material impact on the financial statements.
TOTAL CAPITAL CANADA LTD. Notes to the Financial Statements Years ended December 31, 2017 and 2016 (Thousands of U.S. dollars)
Page | 9
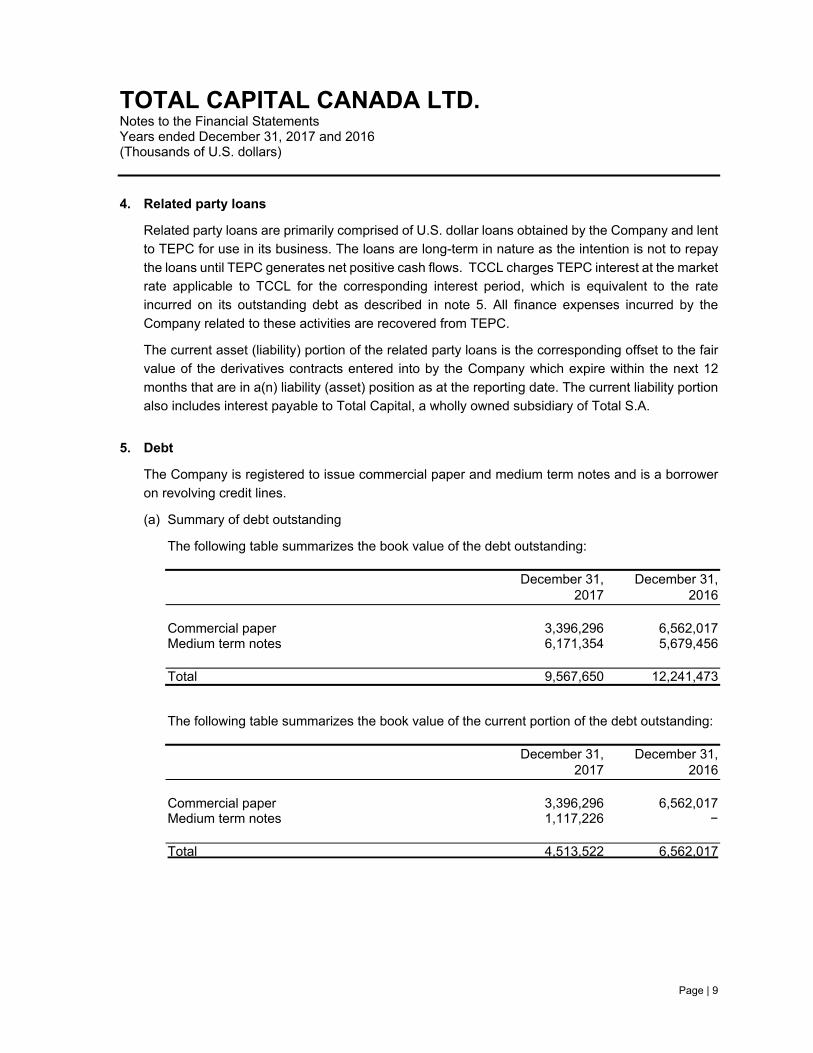
4. Related party loans
Related party loans are primarily comprised of U.S. dollar loans obtained by the Company and lent
to TEPC for use in its business. The loans are long-term in nature as the intention is not to repay
the loans until TEPC generates net positive cash flows. TCCL charges TEPC interest at the market
rate applicable to TCCL for the corresponding interest period, which is equivalent to the rate
incurred on its outstanding debt as described in note 5. All finance expenses incurred by the
Company related to these activities are recovered from TEPC.
The current asset (liability) portion of the related party loans is the corresponding offset to the fair
value of the derivatives contracts entered into by the Company which expire within the next 12
months that are in a(n) liability (asset) position as at the reporting date. The current liability portion
also includes interest payable to Total Capital, a wholly owned subsidiary of Total S.A.
5. Debt
The Company is registered to issue commercial paper and medium term notes and is a borrower
on revolving credit lines.
(a) Summary of debt outstanding
The following table summarizes the book value of the debt outstanding: December 31, December 31, 2017 2016 Commercial paper 3,396,296 6,562,017 Medium term notes 6,171,354 5,679,456 Total 9,567,650 12,241,473
The following table summarizes the book value of the current portion of the debt outstanding: December 31, December 31, 2017 2016 Commercial paper 3,396,296 6,562,017 Medium term notes 1,117,226 − Total 4,513,522 6,562,017
TOTAL CAPITAL CANADA LTD. Notes to the Financial Statements Years ended December 31, 2017 and 2016 (Thousands of U.S. dollars)
Page | 10
5. Debt (continued)
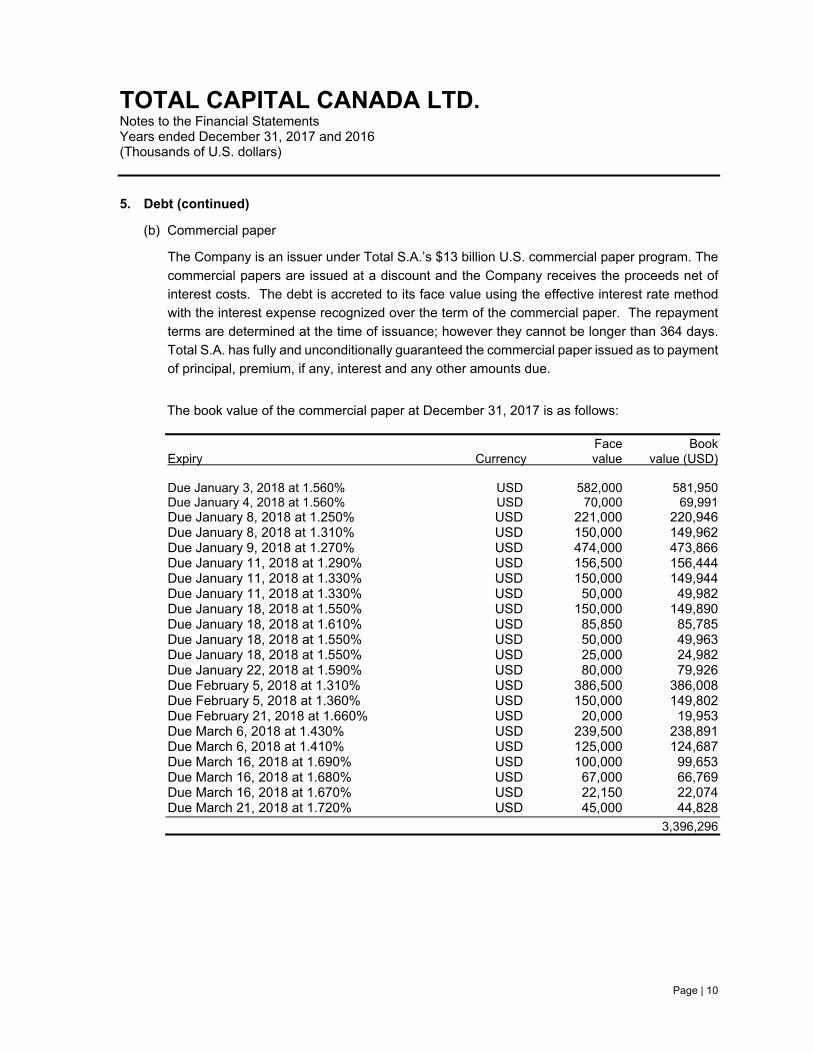
(b) Commercial paper
The Company is an issuer under Total S.A.’s $13 billion U.S. commercial paper program. The
commercial papers are issued at a discount and the Company receives the proceeds net of
interest costs. The debt is accreted to its face value using the effective interest rate method
with the interest expense recognized over the term of the commercial paper. The repayment
terms are determined at the time of issuance; however they cannot be longer than 364 days.
Total S.A. has fully and unconditionally guaranteed the commercial paper issued as to payment
of principal, premium, if any, interest and any other amounts due.
The book value of the commercial paper at December 31, 2017 is as follows: Face Book Expiry Currency value value (USD) Due January 3, 2018 at 1.560% USD 582,000 581,950 Due January 4, 2018 at 1.560% USD 70,000 69,991 Due January 8, 2018 at 1.250% USD 221,000 220,946 Due January 8, 2018 at 1.310% USD 150,000 149,962 Due January 9, 2018 at 1.270% USD 474,000 473,866 Due January 11, 2018 at 1.290% USD 156,500 156,444 Due January 11, 2018 at 1.330% USD 150,000 149,944 Due January 11, 2018 at 1.330% USD 50,000 49,982 Due January 18, 2018 at 1.550% USD 150,000 149,890 Due January 18, 2018 at 1.610% USD 85,850 85,785 Due January 18, 2018 at 1.550% USD 50,000 49,963 Due January 18, 2018 at 1.550% USD 25,000 24,982 Due January 22, 2018 at 1.590% USD 80,000 79,926 Due February 5, 2018 at 1.310% USD 386,500 386,008 Due February 5, 2018 at 1.360% USD 150,000 149,802 Due February 21, 2018 at 1.660% USD 20,000 19,953 Due March 6, 2018 at 1.430% USD 239,500 238,891 Due March 6, 2018 at 1.410% USD 125,000 124,687 Due March 16, 2018 at 1.690% USD 100,000 99,653 Due March 16, 2018 at 1.680% USD 67,000 66,769 Due March 16, 2018 at 1.670% USD 22,150 22,074 Due March 21, 2018 at 1.720% USD 45,000 44,828 3,396,296

TOTAL CAPITAL CANADA LTD. Notes to the Financial Statements Years ended December 31, 2017 and 2016 (Thousands of U.S. dollars)
Page | 11
5. Debt (continued)
(b) Commercial paper (continued)
The book value of the commercial paper at December 31, 2016 is as follows: Face Book Expiry Currency value value (USD) Due January 3, 2017 at 0.760% USD 199,000 198,941 Due January 3, 2017 at 0.810% USD 100,000 99,996 Due January 3, 2017 at 0.760% USD 10,000 9,997 Due January 3, 2017 at 0.760% USD 25,000 24,993 Due January 3, 2017 at 0.760% USD 2,000 1,999 Due January 3, 2017 at 0.760% USD 55,000 54,984 Due January 3, 2017 at 0.760% USD 100,000 99,970 Due January 6, 2017 at 0.690% USD 600,000 599,944 Due January 9, 2017 at 0.695% USD 244,000 243,962 Due January 9, 2017 at 0.720% USD 800,000 799,872 Due January 9, 2017 at 0.620% USD 147,000 146,980 Due January 10, 2017 at 0.700% USD 10,000 9,998 Due January 10, 2017 at 0.720% USD 100,000 99,982 Due January 10, 2017 at 0.610% USD 50,000 49,992 Due January 12, 2017 at 0.720% USD 396,000 395,913 Due January 12, 2017 at 0.700% USD 10,000 9,998 Due January 12, 2017 at 0.710% USD 26,000 25,994 Due January 12, 2017 at 0.710% USD 25,000 24,995 Due January 17, 2017 at 0.710% USD 57,000 56,982 Due January 17, 2017 at 0.620% USD 50,000 49,986 Due January 17, 2017 at 0.710% USD 5,000 4,998 Due January 17, 2017 at 0.720% USD 100,000 99,968 Due January 17, 2017 at 0.760% USD 474,000 473,840 Due January 18, 2017 at 0.780% USD 35,000 34,987 Due January 18, 2017 at 0.760% USD 15,000 14,995 Due January 18, 2017 at 0.780% USD 15,000 14,994 Due January 18, 2017 at 0.770% USD 72,500 72,474 Due January 18, 2017 at 0.760% USD 200,000 199,928 Due January 19, 2017 at 0.710% USD 50,000 49,982 Due January 20, 2017 at 0.710% USD 120,000 119,955 Due January 20, 2017 at 0.720% USD 100,000 99,962 Due January 26, 2017 at 0.720% USD 114,000 113,943 Due January 30, 2017 at 0.680% USD 50,000 49,973 Due January 30, 2017 at 0.680% USD 100,000 99,945 Due February 1, 2017 at 0.790% USD 183,500 183,375 Due February 1, 2017 at 0.790% USD 100,000 99,932 Due February 13, 2017 at 0.720% USD 35,000 34,970 Due February 15, 2017 at 0.720% USD 75,000 74,933 Due February 15, 2017 at 0.740% USD 73,000 72,932 Due February 17, 2017 at 0.740% USD 50,000 49,952 Due March 17, 2017 at 0.930% USD 5,000 4,990 Due March 20, 2017 at 0.880% USD 75,000 74,857

TOTAL CAPITAL CANADA LTD. Notes to the Financial Statements Years ended December 31, 2017 and 2016 (Thousands of U.S. dollars)
Page | 12
5. Debt (continued)
(b) Commercial paper (continued) The book value of the commercial paper at December 31, 2016 is as follows: Face Book Expiry Currency value value (USD)
Due March 20, 2017 at 0.940% USD 100,000 99,796 Due March 20, 2017 at 0.930% USD 50,000 49,899 Due March 20, 2017 at 0.960% USD 500,000 498,961 Due March 21, 2017 at 0.950% USD 25,000 24,948 Due March 21, 2017 at 0.950% USD 255,000 254,468 Due March 21, 2017 at 0.930% USD 100,000 99,796 Due March 21, 2017 at 0.955% USD 50,000 49,879 Due March 21, 2017 at 0.950% USD 75,000 74,820 Due March 22, 2017 at 0.955% USD 294,000 293,282 Due April 22, 2017 at 1.080% USD 65,000 64,805 6,562,017
(c) Medium term notes
TCCL issues notes under Total S.A.’s €35 billion Euro Medium Term Note Program, the $16
billion U.S. Medium Term Note Program and the $2 billion Australian Medium Term Note
Program. Interest is charged at a fixed or floating rate determined at the time of issuance. The
repayment terms of the notes are determined at the time of issuance. Total S.A. has fully and
unconditionally guaranteed the medium term notes issued as to payment of principal, premium,
if any, interest and any other amounts due.
The book value of the medium term notes at December 31, 2017 is as follows:
Notional Book Expiry value Currency value (USD) January 15, 2018 1,000,000 USD 1,000,000 September 6, 2018 150,000 AUD 117,226 September 23, 2019 100,000 AUD 78,151 January 31, 2020 100,000 CAD 79,277 July 9, 2020 750,000 EUR 899,475 March 18, 2022 1,000,000 EUR 1,199,300 July 15, 2023 1,000,000 USD 998,975 September 18, 2029 1,500,000 EUR 1,798,950 6,171,354

TOTAL CAPITAL CANADA LTD. Notes to the Financial Statements Years ended December 31, 2017 and 2016 (Thousands of U.S. dollars)
Page | 13
5. Debt (continued)
(c) Medium term notes (continued)
The book value of the medium term notes at December 31, 2016 is as follows:
Notional Book Expiry value Currency value (USD) January 15, 2018 1,000,000 USD 1,000,000 September 6, 2018 150,000 AUD 108,328 September 23, 2019 100,000 AUD 72,218 January 31, 2020 100,000 CAD 74,295 July 9, 2020 750,000 EUR 790,575 March 18, 2022 1,000,000 EUR 1,054,100 July 15, 2023 1,000,000 USD 998,790 September 18, 2029 1,500,000 EUR 1,581,150 5,679,456
There were no medium term note issuances or repayments for the year ended December 31,
2017. The change in book value of the medium term notes from December 31, 2016 to
December 31, 2017 is due to foreign exchange translation of $491,712 and amortization of
debt issue costs of $186.
(d) Revolving credit line
TCCL is a swingline borrower on a US$150 million multicurrency revolving credit agreement
(incorporating a US$ swingline option) with a chartered American bank. The interest rate on
the credit facility is charged a variable rate determined on the date of issuance. The credit
facility is fully and unconditionally guaranteed by Total S.A. To date, no amounts have been
drawn on this facility.
6. Share capital
Structure of the share capital
The Company is authorized to issue an unlimited number of common shares, and as of
December 31, 2017 and December 31, 2016, has 50,000 issued and outstanding common
shares with a face value of $1.00 each. All of the shares are held by Total S.A.

TOTAL CAPITAL CANADA LTD. Notes to the Financial Statements Years ended December 31, 2017 and 2016 (Thousands of U.S. dollars)
Page | 14
7. Finance income and finance expense
(a) Finance income Year Ended Year Ended
December 31, 2017 December 31, 2016 Income on related party loans 207,666 136,564 Management fee with related party 699 990 Gain on derivatives 553,579 46,925 Foreign exchange gain on translation of foreign currency denominated debt – 46,427 Other financial income 491,712 –
1,253,656 230,906
(b) Finance expense
Year Ended Year Ended December 31, 2017 December 31, 2016
Interest 207,666 136,547 Finance fees 650 923 Other financial expense 553,579 93,352 Foreign exchange loss on translation of foreign currency denominated debt 491,712 – 1,253,607 230,822
8. Financial risk management and financial instruments overview
The Company has exposure to the following risks from its use of financial instruments:
● credit risk
● liquidity risk
● market risk
The following disclosure presents information about the Company’s exposure to each of the above
risks, the Company’s objectives, policies and processes for measuring and managing risk, and the
management of capital.
(a) Risk management framework
The Board of Directors of the Company has overall responsibility for the establishment and
oversight of the Company’s risk management framework.
TOTAL CAPITAL CANADA LTD. Notes to the Financial Statements Years ended December 31, 2017 and 2016 (Thousands of U.S. dollars)
Page | 15
8. Financial risk management and financial instruments overview (continued)
(a) Risk management framework (continued)
The risk management policies are established to identify and analyze the risks faced by the
Company, to set appropriate risk limits and controls, and to monitor risks and adherence to
limits. Risk management policies and systems are reviewed regularly to reflect changes in
market conditions and the Company’s activities.
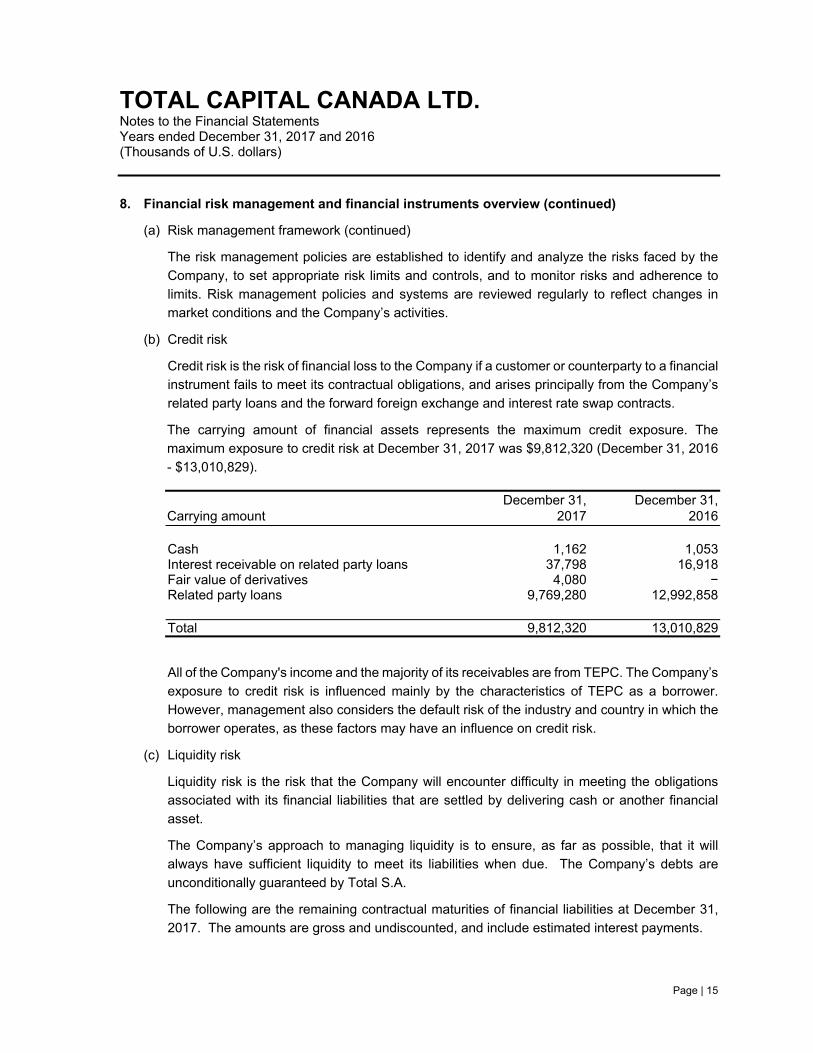
(b) Credit risk
Credit risk is the risk of financial loss to the Company if a customer or counterparty to a financial
instrument fails to meet its contractual obligations, and arises principally from the Company’s
related party loans and the forward foreign exchange and interest rate swap contracts.
The carrying amount of financial assets represents the maximum credit exposure. The
maximum exposure to credit risk at December 31, 2017 was $9,812,320 (December 31, 2016
- $13,010,829). December 31, December 31, Carrying amount 2017 2016 Cash 1,162 1,053 Interest receivable on related party loans 37,798 16,918 Fair value of derivatives 4,080 − Related party loans 9,769,280 12,992,858
Total 9,812,320 13,010,829
All of the Company's income and the majority of its receivables are from TEPC. The Company’s
exposure to credit risk is influenced mainly by the characteristics of TEPC as a borrower.
However, management also considers the default risk of the industry and country in which the
borrower operates, as these factors may have an influence on credit risk.
(c) Liquidity risk
Liquidity risk is the risk that the Company will encounter difficulty in meeting the obligations
associated with its financial liabilities that are settled by delivering cash or another financial
asset.
The Company’s approach to managing liquidity is to ensure, as far as possible, that it will
always have sufficient liquidity to meet its liabilities when due. The Company’s debts are
unconditionally guaranteed by Total S.A.
The following are the remaining contractual maturities of financial liabilities at December 31,
2017. The amounts are gross and undiscounted, and include estimated interest payments.

TOTAL CAPITAL CANADA LTD. Notes to the Financial Statements Years ended December 31, 2017 and 2016 (Thousands of U.S. dollars)
Page | 16
8. Financial risk management and financial instruments overview (continued)
(c) Liquidity risk (continued)
Also included in debt are the contractual undiscounted cash flows relating to derivative financial
liabilities held for risk management purposes which are not usually closed out prior to
contractual maturity. Contractual Less Greater Carrying cash than one than one amount flows year year
Derivative and Non-derivative financial liabilities: Debt (notional value excluding
interest) 9,567,650 9,948,340 4,552,485 5,395,855 Interest expense on debt – 764,642 112,639 652,003 Interest differential on swaps – 371,407 44,350 327,057 Related party loans 41,878 41,878 40,350 1,528 Accounts payable and
accrued liabilities 812 812 812 –
9,610,340 11,127,079 4,750,636 6,376,443
The interest payments on variable rate commercial papers and medium term notes in the above
table reflect current market interest rates at the reporting date and these amounts may change
as market interest rates change. The future cash flows on derivative instruments may be
different from the amount in the above table as interest rates and exchange rates change.
Except for those financial liabilities, it is not expected that the cash flows included in the maturity
analysis could occur significantly earlier, or at significantly different amounts.
(d) Market risk
Market risk is the risk that changes in market prices, such as foreign exchange rates, interest
rates and equity prices will affect the Company’s income or the value of its holdings of financial
instruments. The objective of market risk management is to manage and control market risk
exposures within acceptable parameters, while optimizing the return.
The Company buys and sells derivatives, and also incurs financial liabilities, in order to manage
market risks. All such transactions are carried out within the guidelines set by the Board of
Directors of the Company. The Company does not apply hedge accounting but enters into
derivative contracts to hedge its economic exposure.

TOTAL CAPITAL CANADA LTD. Notes to the Financial Statements Years ended December 31, 2017 and 2016 (Thousands of U.S. dollars)
Page | 17
8. Financial risk management and financial instruments overview (continued)
(d) Market risk (continued)
(i) Currency risk
Currency risk is the risk that the future cash flows will fluctuate as a result of changes in
exchange rates. The Company manages its exposure to foreign exchange fluctuations on
its non-U.S. dollar denominated medium term notes by entering into cross-currency interest
rate swaps with Total Capital (see interest rate risk section below for the notional value
details). Gains or losses on the cross-currency and interest rate swaps are flowed through
to TEPC, so that the Company’s exposure to foreign currency exchange risk is insignificant.
(ii) Interest rate risk
Interest rate risk is the risk that future cash flows will fluctuate as a result of changes in
market interest rates. The interest charged on the medium term notes fluctuates with the
interest rates posted by the lenders. Any change in interest rates resulting in changes to
interest expense is flowed through to TEPC. The Company uses long-term interest rate
swaps, along with the aforementioned currency swaps, to manage the associated risk.
At December 31, 2017, the Company had the following cross currency and interest rate
swap contracts related to the outstanding medium term notes:
Notional Notional Fair value Expiry value Currency value (USD) Swap rate (USD) January 15, 2018 1,000,000 USD 1,000,000 LIBOR+58.425bp 2,552 September 6, 2018 150,000 AUD 152,985 LIBOR+37.000bp (33,364) September 23, 2019 100,000 AUD 90,300 LIBOR+25.500bp (9,493) January 31, 2020 100,000 CAD 92,005 LIBOR+30.500bp (11,476) July 9, 2020 500,000 EUR 651,750 LIBOR+82.500bp (33,908) July 9, 2020 250,000 EUR 325,700 LIBOR+82.400bp (16,759) March 18, 2022 500,000 EUR 647,450 LIBOR+64.230bp (36,621) March 18, 2022 500,000 EUR 647,000 LIBOR+64.520bp (36,236) July 15, 2023 500,000 USD 500,000 LIBOR+81.250bp (5,159) September 18, 2029 500,000 EUR 647,200 3.3645% (9,155) September 18, 2029 500,000 EUR 647,400 3.1925% 1,528 September 18, 2029 500,000 EUR 647,050 3.3555% (8,728)
(196,819)

TOTAL CAPITAL CANADA LTD. Notes to the Financial Statements Years ended December 31, 2017 and 2016 (Thousands of U.S. dollars)
Page | 18
8. Financial risk management and financial instruments overview (continued)
(d) Market risk (continued)
(ii) Interest rate risk (continued)
At December 31, 2016, the Company had the following cross currency and interest rate
swap contracts related to the outstanding medium term notes:
Notional Notional Fair Expiry value Currency value (USD) Swap rate value (USD) January 15, 2018 1,000,000 USD 1,000,000 LIBOR+58.425bp (4,978) September 6, 2018 150,000 AUD 152,985 LIBOR+37.000bp (41,089) September 23, 2019 100,000 AUD 90,300 LIBOR+25.500bp (15,024) January 31, 2020 100,000 CAD 92,005 LIBOR+30.500bp (15,377) July 9, 2020 500,000 EUR 651,750 LIBOR+82.500bp (105,147) July 9, 2020 250,000 EUR 325,700 LIBOR+82.400bp (52,381) March 18, 2022 500,000 EUR 647,450 LIBOR+64.230bp (108,943) March 18, 2022 500,000 EUR 647,000 LIBOR+64.520bp (108,573) July 15, 2023 500,000 USD 500,000 LIBOR+81.250bp (690) September 18, 2029 500,000 EUR 647,200 LIBOR+85.740bp (99,816) September 18, 2029 500,000 EUR 647,400 LIBOR+85.170bp (99,619) September 18, 2029 500,000 EUR 647,050 LIBOR+84.520bp (98,761)
(750,398)
9. Determination of fair values
A number of the Company’s accounting policies and disclosures require the determination of fair
value. Fair values have been determined for measurement and/or disclosure purposes based on
the following methods. When applicable, further information about the assumptions made in
determining fair values is disclosed in the notes specific to that asset or liability.
(a) Cash, interest receivable, accounts payable and accrued liabilities and debt
The fair value of cash, interest receivable, accounts payable and accrued liabilities and
commercial paper is estimated as the present value of future cash flows, discounted at the
market rate of interest at the reporting date. At December 31, 2017, the fair value of these
balances approximated their carrying value due to their short term to maturity.
The fair value of the medium term notes has been determined on an individual basis by
discounting future cash flows with the zero coupon interest rate curves existing at December
31, 2017 (level 2 fair value).
TOTAL CAPITAL CANADA LTD. Notes to the Financial Statements Years ended December 31, 2017 and 2016 (Thousands of U.S. dollars)
Page | 19
9. Determination of fair values (continued)
(a) Cash, interest receivable, accounts payable and accrued liabilities and debt (continued)
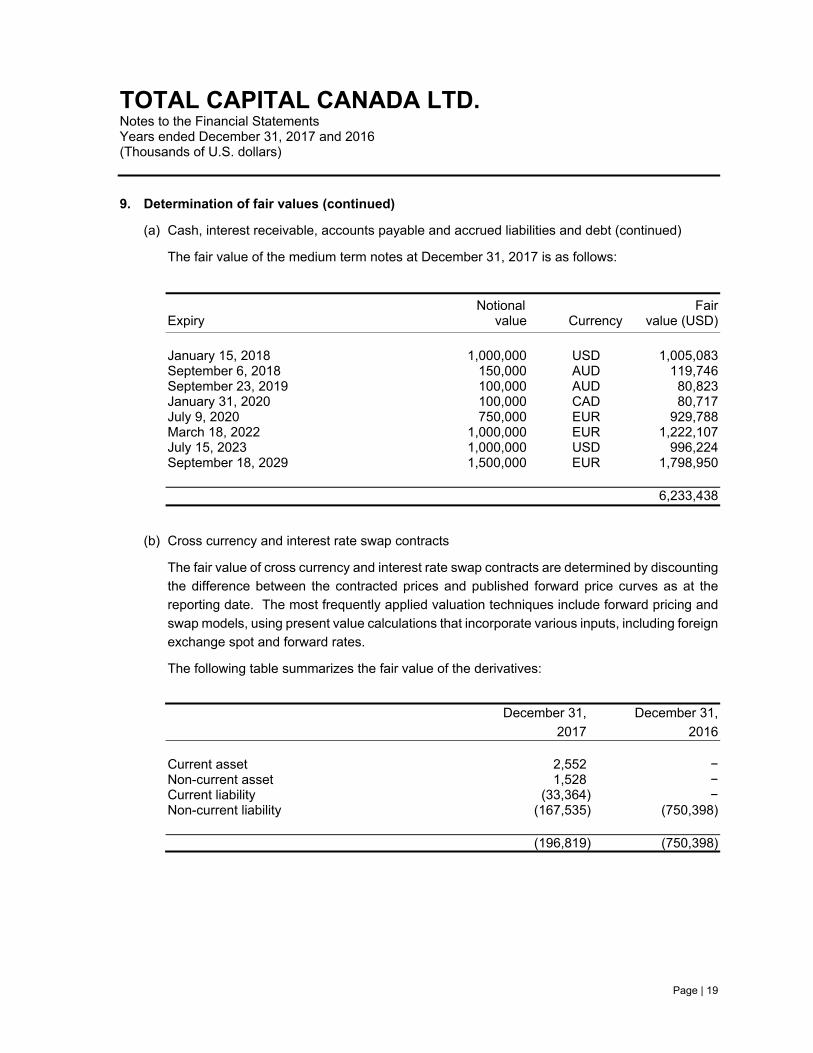
The fair value of the medium term notes at December 31, 2017 is as follows:
Notional Fair Expiry value Currency value (USD)
January 15, 2018 1,000,000 USD 1,005,083 September 6, 2018 150,000 AUD 119,746 September 23, 2019 100,000 AUD 80,823 January 31, 2020 100,000 CAD 80,717 July 9, 2020 750,000 EUR 929,788 March 18, 2022 1,000,000 EUR 1,222,107 July 15, 2023 1,000,000 USD 996,224 September 18, 2029 1,500,000 EUR 1,798,950 6,233,438
(b) Cross currency and interest rate swap contracts
The fair value of cross currency and interest rate swap contracts are determined by discounting
the difference between the contracted prices and published forward price curves as at the
reporting date. The most frequently applied valuation techniques include forward pricing and
swap models, using present value calculations that incorporate various inputs, including foreign
exchange spot and forward rates.
The following table summarizes the fair value of the derivatives:
December 31, December 31,
2017 2016 Current asset 2,552 − Non-current asset 1,528 − Current liability (33,364) − Non-current liability (167,535) (750,398) (196,819) (750,398)

TOTAL CAPITAL CANADA LTD. Notes to the Financial Statements Years ended December 31, 2017 and 2016 (Thousands of U.S. dollars)
Page | 20
9. Determination of fair values (continued)
(b) Cross currency and interest rate swap contracts (continued)
Level 1 Fair Value Measurements
Level 1 fair value measurements are based on unadjusted quoted market prices.
Level 2 Fair Value Measurements
Level 2 fair value measurements are based on valuation models and techniques where the
significant inputs are derived from quoted indices. The fair value of the foreign exchange and
interest rate swaps were determined using level 2 fair value measurements.
Level 3 Fair Value Measurements
Level 3 fair value measurements are based on unobservable information.
10. Capital management
The Company’s objective is to obtain debt financing from the capital markets and to provide the
financing obtained to TEPC. The Company considers its capital structure to include working
capital, debt and shareholder’s equity. The Company’s shareholder’s equity is not subject to
external restrictions and the Company has not paid or declared any dividends since incorporation.
There are no financial covenants in the Company’s debt agreements.
11. Supplemental cash flow information
Year Ended Year Ended December 31, 2017 December 31, 2016 Interest receivable on related party loans (20,880) (1,334) Accounts payable and accrued liabilities (196) (297) Interest payable (related party loans) 20,880 1,334 Change in related party loans related to fair value of derivatives: Current asset (33,364) 61,755 Non-current asset 582,863 (11,652) Current liability 2,552 − Non-current liability 1,528 (3,178) Net change in non-cash working capital 553,383 46,628

![Niguel Shores Community Association | 33654 Niguel Shores ......2019/10/11 · Kel sch s , Reser.vations -fcr golf on I unch. bnc]ays other. than Fun—Day be made thr.cugh Eä-tccl](https://static.documents.pub/doc/80x56/610e4594fcd75e48ae1e2697/niguel-shores-community-association-33654-niguel-shores-20191011-.jpg)


