70
Financial Statements prepared in accordance with US GAAP - Fiscal 2009
Financial Statements prepared inaccordance with US GAAP - Fiscal 2009
REPORT FOR THE YEAR ENDED MARCH 31, 2008
Contents
Board of Directors 1
Management Team 2
Report of Independent Auditors 4
Combined and consolidated balance sheet as on March 31, 2008 and 2009 5
Combined and consolidated statements of income for the years ended March 31, 2007, 2008 and 2009 6
Statement of shareholders’ equity for the years ended March 31, 2007, 2008 and 2009 7
Combined and consolidated statements for cash flows for the years ended March 31, 2007, 2008 and 2009 8
Notes to combined and consolidated financial statements 10
Management Discussion and Analysis of Financial Condition and Results of Operations of 43TCS LImited in accordance with U.S. GAAP
1
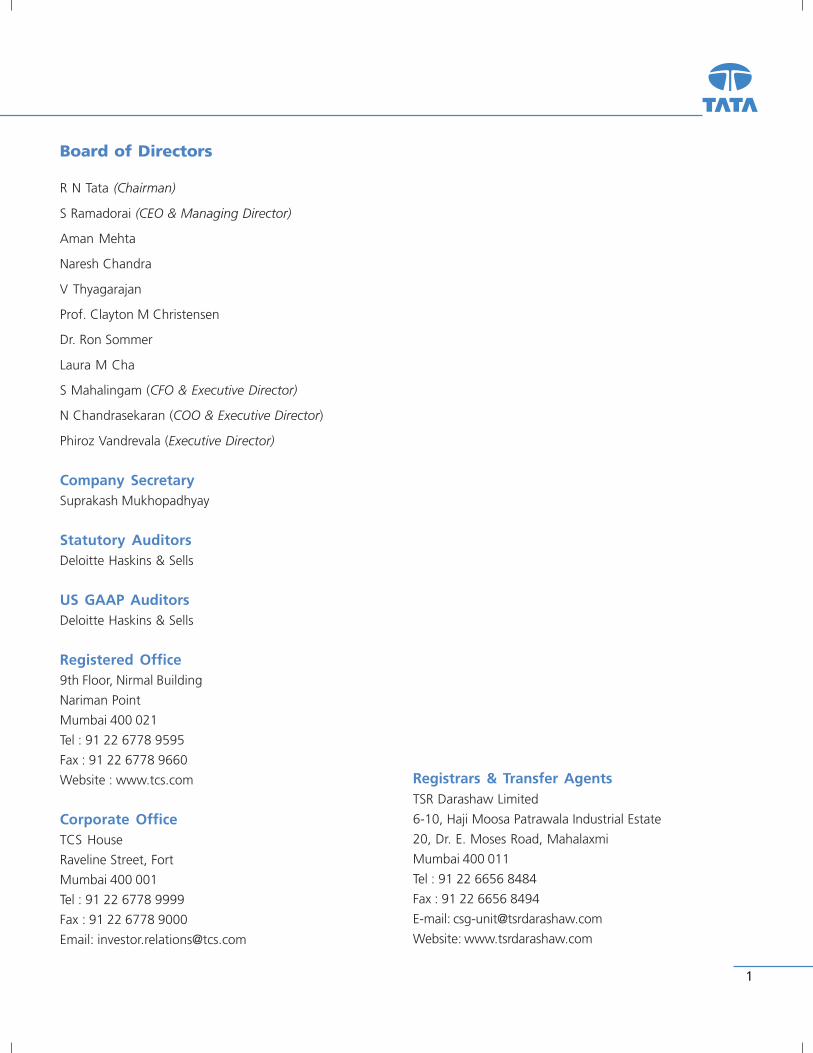
R N Tata (Chairman)
S Ramadorai (CEO & Managing Director)
Aman Mehta
Naresh Chandra
V Thyagarajan
Prof. Clayton M Christensen
Dr. Ron Sommer
Laura M Cha
S Mahalingam (CFO & Executive Director)
N Chandrasekaran (COO & Executive Director)
Phiroz Vandrevala (Executive Director)
Company SecretarySuprakash Mukhopadhyay
Statutory AuditorsDeloitte Haskins & Sells
US GAAP AuditorsDeloitte Haskins & Sells
Registered Office9th Floor, Nirmal Building
Nariman Point
Mumbai 400 021
Tel : 91 22 6778 9595
Fax : 91 22 6778 9660
Website : www.tcs.com
Corporate OfficeTCS House
Raveline Street, Fort
Mumbai 400 001
Tel : 91 22 6778 9999
Fax : 91 22 6778 9000
Email: [email protected]
Registrars & Transfer AgentsTSR Darashaw Limited
6-10, Haji Moosa Patrawala Industrial Estate
20, Dr. E. Moses Road, Mahalaxmi
Mumbai 400 011
Tel : 91 22 6656 8484
Fax : 91 22 6656 8494
E-mail: [email protected]
Website: www.tsrdarashaw.com
Board of Directors

2
Annual Report 2008-09
Management Team
Function Name
Corporate
CEO S RamadoraiCFO S MahalingamCOO N ChandrasekaranCorporate Affairs Phiroz VandrevalaGlobal Human Resources Ajoyendra Mukherjee
Geography Heads
Major Markets
North America Surya KantEurope A S Lakshminarayanan
Girish RamachandranNew Growth Markets
APAC Girija PandeJohnson LamMasahiko KajiVarun Kapur
Emerging Markets(Latin America, MEA and Eastern Europe) Gabriel Rozman
India S VenkatramaniSrinivasa G Raghavan
Governance Functions
Marketing J V PendharkarKeith SharpJohn LenzenHarish Menon
Corporate Communication Pradipta Bagchi
R&D K Ananth KrishnanM VidyasagarGautam ShroffK PadmanabhanRajesh ManshramaniHarrick Vin
Human Resources Ritu AnandAshok MukherjeeK GanesanThomas SimonS Narasimhan
Legal Satya HegdeMadhav Anchan
Finance B SanyalVishwanathan IyerV RamakrishnanPauroos Karkaria
Company Secretary Suprakash Mukhopadhyay
Chief Compliance Officer Ravindra J Shah
Security R K Raghavan

3
Function Name
Management Team
Industry Service Units
Banking & Financial Services Ramanamurthy Magapu
K Krithivasan
Susheel Vasudevan
Tej Paul Bhatla
Sunil Chopra
Insurance Vijaya Deepti
Suresh Muthuswami
Telecom Ravi Viswanathan
N Sivasamban
Manufacturing Milind Lakkad
Hi Tech Nagaraj Ijari, Carol Wilson
Government Tanmoy Chakrabarty
Retail & Distribution Pratik Pal
Life Sciences & Healthcare Debashis Ghosh
Energy, Resources & Utilities Hasit Kaji
Media and Information Services Kamal Bhadada
Travel & Hospitality S Sukanya
Strategic Growth Units
TCS Financial Services N G Subramaniam
Small & Medium Business Venguswamy Ramaswamy
Platform BPO Raj Agrawal
Service Units
Global Consulting Practice J Rajagopal
Engineering & Industrial Services Regu Ayyaswamy
Infrastructure Services P R Krishnan
BPO Abid Ali NeemuchwalaV K RamanRahul Singh
Assurance Services Siva Ganesan
Alliances K Jayaramakrishnan
Organisational Infrastructure Units
Process Excellence Group Abid Ali Neemuchwala
Technology Excellence Group Santosh Mohanty
Resource Management Group Yogesh Thakoor
Internal IT Alok Kumar

4
Annual Report 2008-09
INDEPENDENT AUDITORS' REPORT
To the Board of Directors and Shareholders ofTata Consultancy Services Limited:
We have audited the accompanying consolidated balance sheets of Tata Consultancy Services Limited andits subsidiaries (collectively referred to as "TCS Limited" or the "Company") as of March 31, 2008 and 2009, and therelated consolidated statements of income, changes in shareholders' equity, and cash flows for each of the years inthe three-year period ended March 31, 2009, all expressed in US dollars. These consolidated financial statements arethe responsibility of the Company's management. Our responsibility is to express an opinion on these consolidatedfinancial statements based on our audits.
We conducted our audits in accordance with the auditing standards generally accepted in the UnitedStates of America. Those standards require that we plan and perform the audit to obtain reasonable assuranceabout whether the financial statements are free of material misstatement. An audit includes consideration ofinternal control over financial reporting as a basis for designing audit procedures that are appropriate in thecircumstances, but not for the purpose of expressing an opinion on the effectiveness of the Company's internalcontrol over financial reporting. Accordingly, we express no such opinion. An audit also includes examining, on a testbasis, evidence supporting the amounts and disclosures in the financial statements, assessing the accounting principlesused and significant estimates made by management, as well as evaluating the overall financial statement presentation.We believe that our audits provide a reasonable basis for our opinion.
In our opinion, such consolidated financial statements present fairly, in all material respects, the consolidatedfinancial position of TCS Limited as of March 31, 2008 and 2009, and the consolidated results of its operations and itscash flows for each of the years in the three-year period ended March 31, 2009, in conformity with accountingprinciples generally accepted in the United States of America.
As discussed in Note 2 (g), to the consolidated financial statements, the accompanying consolidatedfinancial statements have been retrospectively adjusted for fiscals 2007 and 2008 for the change in reportingcurrency in fiscal 2009.
/s/ Deloitte Haskins & Sells
CHARTERED ACCOUNTANTS
Mumbai, India
April 28, 2009

4
Consolidated Balance SheetsAs of March 31, 2008 and March 31, 2009
As of March 31, As of March 31,2008 2009
(In millions of USD, except shares andper share data)
ASSETS:Current assets:
Cash and cash equivalents $258.1 $292.5Accounts receivable (net of allowances of $28.0 million and$34.2 million, respectively) 1,343.9 1,191.0Unbilled revenues 337.2 291.9Inventories 10.6 7.1Prepaid expenses and other current assets (net of allowancesof $4.9 million and $5.9 million, respectively) 373.5 620.7
Total current assets 2,323.3 2,403.2Investments 660.1 340.1Equity method investment in affiliates 0.7 0.3Property, plant and equipment, net 753.3 738.9Intangible assets, net 90.6 163.2Goodwill 276.9 510.6Other non-current assets 258.9 331.2
Total assets $4,363.8 $4,487.5
LIABILITIES AND SHAREHOLDERS’ EQUITY:Liabilities:Current liabilities:
Accrued expenses and other current liabilities $846.4 $935.1Unearned and deferred revenues 177.0 174.1Short-term debt 9.3 101.5
Total current liabilities 1,032.7 1,210.7Long-term debt 142.8 34.7Mandatorily redeemable preference shares with Tata Sons Limited 24.9 19.7Other non-current liabilities 18.8 75.3
Total liabilities 1,219.2 1,340.4Minority interests 57.3 61.5
Commitments and contingencies (see note 27) - -Shareholders’ equity:
Equity shares: par value $0.02 (Re.1) per share; authorised1,200,000,000 equity shares; issued and fully paid-up978,610,498 equity shares 21.5 21.5Additional paid-in-capital 546.7 546.7Accumulated other comprehensive (loss)/income 223.3 (556.5)Retained earnings 2,295.8 3,073.9
Total shareholders’ equity 3,087.3 3,085.6Total liabilities and shareholders’ equity $4,363.8 $4,487.5
See accompanying notes to consolidated financial statements

6
Annual Report 2008-09
Consolidated Statements of IncomeFor the years ended March 31, 2007, 2008 and 2009
Year ended Year ended Year endedMarch 31, 2007 March 31, 2008 March 31, 2009
(In millions of USD, except shares and per share data)
Revenues:
Information technology and consultancy services $3,930.3 $5,339.5 $5,789.3
Sale of equipment and software licenses 194.5 294.9 226.4
Total revenues 4,124.8 5,634.4 6,015.7
Cost of revenues:
Cost of information technology and consultancy services 2,156.7 2,901.0 3,146.7
Cost of equipment and software licenses 150.0 242.4 196.3
Total cost of revenues 2,306.7 3,143.4 3,343.0
Gross profit 1,818.1 2,491.0 2,672.7
Operating expenses:
Selling, general and administrative expenses 782.9 1,200.9 1,237.5
Research and development expenses 9.6 14.1 10.3
Total operating expenses 792.5 1,215.0 1,247.8
Operating income 1,025.6 1,276.0 1,424.9
Other (expense) / income :
Interest income 4.6 14.1 22.4
Interest expense (5.2) (11.3) (11.5)
Other non-operating (expense) / income, net 48.1 168.4 (108.5)
Other income, net 47.5 171.2 (97.6)
Income before income taxes and minority interests 1,073.1 1,447.2 1,327.3
Income tax expense 149.2 187.5 190.4
Income before minority interests 923.9 1,259.7 1,136.9
Minority interests (9.3) (10.6) (12.9)
Equity in net earnings of affiliates 1.0 0.2 (0.2)
Net income $915.6 $1,249.3 $1,123.8
Weighted average number of shares used in computing basic and diluted earnings per share : 978,610,498 978,610,498 978,610,498
Basic and diluted earnings per share: $0.94 $1.28 $1.15
See accompanying notes to consolidated financial statements
6
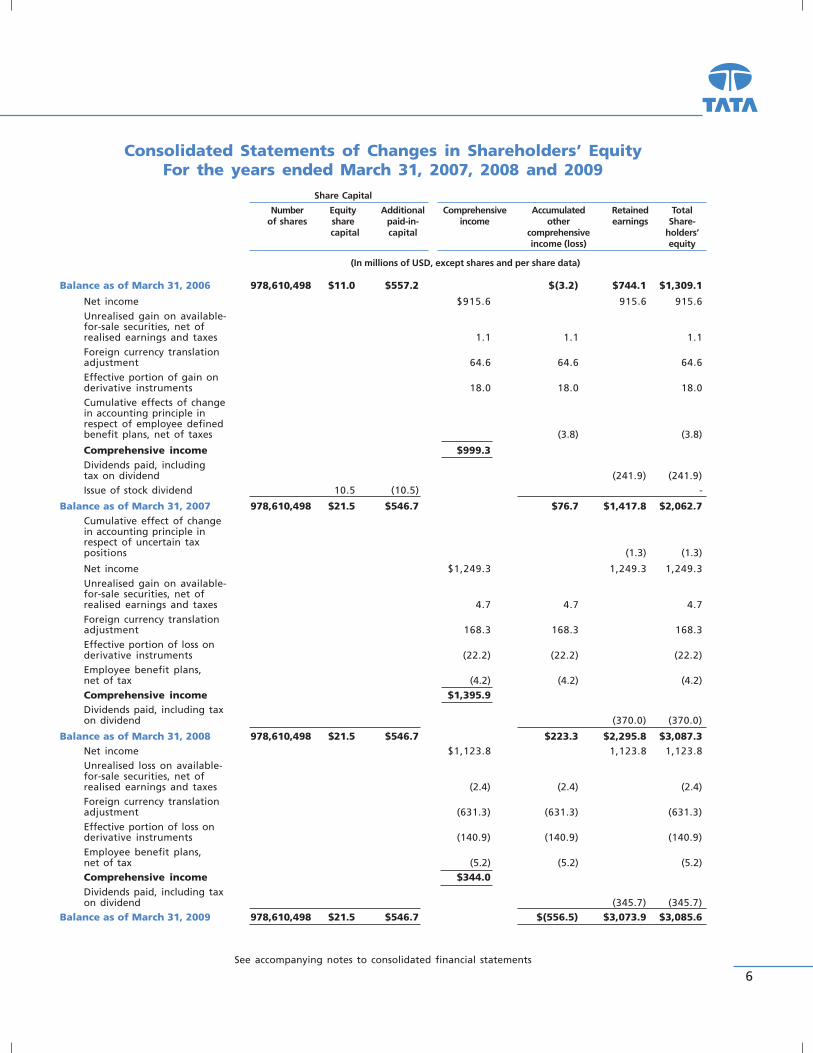
Consolidated Statements of Changes in Shareholders’ EquityFor the years ended March 31, 2007, 2008 and 2009
Share Capital
Number Equity Additional Comprehensive Accumulated Retained Totalof shares share paid-in- income other earnings Share-
capital capital comprehensive holders’income (loss) equity
(In millions of USD, except shares and per share data)
Balance as of March 31, 2006 978,610,498 $11.0 $557.2 $(3.2) $744.1 $1,309.1
Net income $915.6 915.6 915.6Unrealised gain on available-for-sale securities, net ofrealised earnings and taxes 1.1 1.1 1.1Foreign currency translationadjustment 64.6 64.6 64.6Effective portion of gain onderivative instruments 18.0 18.0 18.0Cumulative effects of changein accounting principle inrespect of employee definedbenefit plans, net of taxes (3.8) (3.8)
Comprehensive income $999.3Dividends paid, includingtax on dividend (241.9) (241.9)Issue of stock dividend 10.5 (10.5) -
Balance as of March 31, 2007 978,610,498 $21.5 $546.7 $76.7 $1,417.8 $2,062.7Cumulative effect of changein accounting principle inrespect of uncertain taxpositions (1.3) (1.3)
Net income $1,249.3 1,249.3 1,249.3Unrealised gain on available-for-sale securities, net ofrealised earnings and taxes 4.7 4.7 4.7Foreign currency translationadjustment 168.3 168.3 168.3Effective portion of loss onderivative instruments (22.2) (22.2) (22.2)Employee benefit plans,net of tax (4.2) (4.2) (4.2)Comprehensive income $1,395.9Dividends paid, including taxon dividend (370.0) (370.0)
Balance as of March 31, 2008 978,610,498 $21.5 $546.7 $223.3 $2,295.8 $3,087.3Net income $1,123.8 1,123.8 1,123.8Unrealised loss on available-for-sale securities, net ofrealised earnings and taxes (2.4) (2.4) (2.4)Foreign currency translationadjustment (631.3) (631.3) (631.3)Effective portion of loss onderivative instruments (140.9) (140.9) (140.9)Employee benefit plans,net of tax (5.2) (5.2) (5.2)Comprehensive income $344.0Dividends paid, including taxon dividend (345.7) (345.7)
Balance as of March 31, 2009 978,610,498 $21.5 $546.7 $(556.5) $3,073.9 $3,085.6
See accompanying notes to consolidated financial statements

8
Annual Report 2008-09
Consolidated Statements of Cash FlowsFor the years ended March 31, 2007, 2008 and 2009
Year ended Year ended Year endedMarch 31, 2007 March 31, 2008 March 31, 2009
(In millions of USD)
Cash flows from operating activities:Net income $915.6 $1,249.3 $1,123.8Adjustments to reconcile net income to net cashprovided by operating activities
Depreciation and amortisation 96.5 143.8 124.5(Gain) / loss on sale of property, plant andequipment 0.3 0.4 (3.2)Deferred income taxes 3.8 (83.3) (70.5)Equity in net earnings of affiliates (1.0) (0.2) 0.2Minority interests 9.3 10.6 12.9Gain on sale of available-for-sale investments (2.2) (3.9) (11.7)Gain on sale of equity accounted affiliates (13.3) (0.2) -Non-cash interest on put-call option liability 3.2 3.8 3.5Gain on sale of subsidiaries - (1.0) -Allowances for doubtful debts and advances - 4.6 16.1
Net change in:Accounts receivable (203.0) (266.0) (83.2)Unbilled revenues (68.5) (137.8) (13.5)Inventories 8.6 (0.3) 1.5Prepaid expenses and other current assets (25.7) (52.1) (78.9)Other non-current assets (14.6) (14.9) (45.1)Accrued expenses and other current liabilities 45.3 137.9 159.7Unearned and deferred revenues 33.7 1.6 40.6Other non-current liabilities (10.0) (6.7) 8.2Net cash provided by operating activities 778.0 985.6 1,184.9
Cash flows from investing activities:Purchase of available-for-sale investments (3,452.3) (7,112.0) (6,507.4)Purchase of property, plant and equipment (265.4) (302.9) (252.6)Government grant received - - 2.5Purchase of subsidiaries and business, net ofcash acquired (including additional consideration) (40.1) (38.6) (497.9)Acquisition of intangible assets (14.4) - (0.4)Proceeds from sale of subsidiary - 0.5 0.5Proceeds from sale of available-for-saleinvestments 3,335.2 6,779.7 6,719.2Proceeds from sale of investments in affiliates 17.7 0.9 -Proceeds from sale of property, plant andequipment 2.6 2.2 10.2Long term bank deposits (net) (28.1) (1.1) 9.1Short term bank deposits (net) (4.0) (4.3) (210.6)Inter-corporate deposits (net) 1.8 (5.0) (15.8)Net cash used in investing activities (447.0) (680.6) (743.2)

8
Consolidated Statements of Cash Flows (continued)For the years ended March 31, 2007, 2008 and 2009
Year ended Year ended Year endedMarch 31, 2007 March 31, 2008 March 31, 2009
(In millions of USD)
Cash flows from financing activities:
Proceeds from issuance of long-term debt 99.7 - 1.0
Repayment of long-term debt - - (0.2)
Net change in bank overdrafts and cash credits (8.8) (6.6) (11.5)
Proceeds from issuance of mandatorilyredeemable preference shares withTata Sons Limited, net of expenses - 24.5 -
Dividends paid to minority shareholders of asubsidiary (0.9) (1.7) (2.3)
Dividends paid (241.9) (370.0) (345.7)
Proceeds from issue of shares to minorityshareholders by subsidiaries 4.7 0.8 0.9
Net cash used in financing activities (147.2) (353.0) (357.8)
Net change in cash 183.8 (48.0) 83.9
Effect of foreign exchange on cash flows 10.1 23.3 (49.5)
Cash and cash equivalents, beginning of the year 88.9 282.8 258.1
Cash and cash equivalents, end of the year $282.8 $258.1 $292.5
Supplementary cash flow information:
Interest paid $1.9 $6.5 $6.9
Income taxes paid $137.3 $265.8 $246.1
Supplementary disclosure of cash flow non-cashinvesting activities:
Property, plant and equipment accrued $6.4 $13.8 $4.0
See accompanying notes to consolidated financial statements

10
Annual Report 2008-09
Notes to Consolidated Financial Statements
1. Background and Operations
Tata Consultancy Services Limited and its subsidiaries (collectively TCS Limited) provide a wide range ofinformation technology and consultancy services including systems hardware and software, communicationsand networking, hardware sizing and capacity planning, software project management solutions, technologyeducation services and business process outsourcing.
As of March 31, 2009, Tata Sons Limited owned 73.75% of Tata Consultancy Services Limited's equityshare capital and has the ability to control its operating and financial policies.
2. Summary of Significant Accounting Policies
a. Basis of presentation
These financial statements have been prepared in accordance with accounting principles generallyaccepted in the United States of America ("US GAAP").
Foreign exchange gains / losses on derivative instruments designated as cash flow hedges wasclassified under revenues till fiscal 2008. Consequent to the change in the reporting currency to US dollarsfrom Indian Rupees effective from April 1, 2008 all foreign exchange gains / losses on derivative instrumentshave been retrospectively reclassified under 'Other non-operating income / expense'.
b. Basis of consolidation
TCS Limited consolidates all entities in which it has a controlling financial interest. TCS Limited didnot have variable interests in any variable interest entities during the periods presented.
Inter-company transactions, balances and unrealised profits and losses are eliminated onconsolidation.
The results of entities with controlling interests acquired have been consolidated from the date ofacquisition, except for those entities that have been accounted for as business combinations under commoncontrol. Purchase consideration paid in excess of the fair value of net assets acquired has been recognisedas goodwill. The excess of fair value over purchase consideration has been first allocated to reduce theamounts otherwise assigned to the eligible acquired long-term assets and any excess remaining has beenrecognised as an extraordinary gain in the income statement in the period in which the business combinationwas consummated.
c. Equity method investment in affiliates
Entities where TCS Limited has the ability to exert significant influence, generally where TCS Limitedowns between 20% and 50% of the voting stock of the investee company are accounted for using theequity method. Inter-company unrealised profits and losses on transactions with these entities areeliminated.
TCS Limited's equity method affiliates are as follows:
Name of Affiliates Country of Year ended Year endedIncorporation March 31, 2008 March 31, 2009
Voting Power
% %
Exegenix Research Inc. Canada 49.9 49.9
Firstech Solution Co. Limited(affiliate till January 12, 2009) Thailand 20.0 15.4
National Power Exchange Limited(from December 11, 2008) India - 50.0

10
d. Use of estimates
The preparation of financial statements in conformity with US GAAP requires management tomake estimates and assumptions that affect the reported amounts of assets and liabilities, disclosures ofcontingent assets and liabilities at the date of these financial statements and the reported amounts ofrevenues and expenses for the years presented. Actual results could differ from these estimates. Materialestimates in these financial statements that are susceptible to change as more information becomesavailable include costs to complete for fixed price contracts, allowances for uncollectible accounts receivable,useful lives of intangible and tangible assets, impairment assessments of goodwill and long-lived assets,retirement benefits and income taxes.
e. Revenue recognition
TCS Limited earns revenues primarily from providing information technology and consultancy services,including services under contracts for software development, implementation and other related services,re-licensing of third party software products and sales, licensing and sale of its own software, businessprocess outsourcing and maintenance of equipment.
TCS Limited recognises revenue as follows:
Revenues from bundled contracts that involve supplying computer equipment, licensing softwareand providing services are recognised separately for each of the elements based on the nature of eachelement and their proportional fair values. The fair value of each element is determined by reference tothe price charged when the same element is sold separately.
Revenues from contracts priced on a time and materials basis are recognised as services are renderedand as related costs are incurred.
Revenues from software development contracts, which are generally time bound fixed price contracts,are recognised over the life of the contract using the percentage-of-completion method, with contractcosts determining the degree of completion. Revenue recognition using the percentage-of-completionmethod in conformity with American Institute of Certified Public Accountants' Statement of Position No.81-1, is based on the guidance in Statement of Position 97-2, Software Revenue Recognition, to accountfor revenues under fixed price arrangements for software development and related services. Losses onsuch contracts are recognised when probable. Revenues in excess of billings are recognised as unbilledrevenues in the balance sheet; to the extent billings are in excess of revenues recognised, the excess isreported as unearned and deferred revenue in the balance sheet.
Revenues from business process outsourcing contracts priced on the basis of time and material orunit of delivery are recognised as services are rendered or the related obligation is performed.
Revenues from the sale of computer equipment are recognised upon delivery, which is when titlepasses to the customer. TCS Limited acts as a reseller of third party computer equipment products; suchrevenues are reported gross as TCS Limited acts as a principal, as it has pricing authority and bearsinventory and credit risk.
Revenues from the sale of internally developed and manufactured systems and third party softwareproducts which do not require significant modification are recognised upon delivery of a license, which iswhen the absolute right to use passes to the customer and TCS Limited does not have any materialremaining service obligations. TCS Limited acts as a relicensor of third party software licenses. Revenuesfrom such products are reported gross as TCS Limited acts as a principal, has pricing authority and bearsinventory and credit risk.
Revenues from maintenance contracts and from finite period software licenses granted arerecognised on a pro-rata basis over the period of the contract.
TCS Limited recognises volume discount obligations as a reduction of revenue in proportion to therevenue recognised from the customer to the total expected revenue.
12
Annual Report 2008-09
TCS Limited reports billed out-of-pocket expenses as revenue.
All revenues are recognised only when collectability of the resulting receivable is reasonably assured,and are reported net of discounts and indirect and service taxes.
f. Cost recognition
Costs and expenses are recognised when incurred and have been classified according to their primaryfunctions in the following categories:
Cost of information technology and consultancy services
These costs primarily include employee compensation of personnel when engaged in providingconsultancy services, travel expenses, employee allowances, payroll related taxes, client specific trainingexpenses, depreciation and amortisation of production related equipment and software, rental expenses,losses incurred on fixed price contracts and communication costs.
Cost of equipment and software licenses
These costs consist of the cost of resold computer equipment and re-licensed software, and includeinward shipping and insurance costs.
Selling, general and administrative expenses
Selling costs primarily include employee compensation for sales and marketing personnel, travelcosts, advertising, business promotion expenses, allowances for delinquent receivables, outward shippingexpenses, rental expenses for sales and marketing offices and market research costs.
General and administrative costs primarily include employee compensation for administrative,supervisory, managerial and practice management personnel, depreciation and amortisation of non-production equipment and software, rental expenses for administrative offices, insurance, electricity,telecommunication costs, legal and professional fees, impairment of goodwill, long-lived assets andintangibles, valuation allowances and other general expenses.
Research and development expenses
Research and development (R&D) expenses include all costs relating to TCS Limited's research anddevelopment center and costs incurred for the development of software to be sold.
The R&D center's expenses primarily consist of employee compensation for research personnel,facilities expenses for the R&D center and the cost of software and equipment for which there is nofuture use within the enterprise. Property, plant and equipment that have an alternative future usewithin the enterprise are capitalised and depreciated over their estimated useful lives.
g. Foreign currency
The functional currency of Tata Consultancy Services Limited and its Indian subsidiaries is the Indianrupee, whereas the functional currency of foreign subsidiaries is the currency in their countries ofincorporation.
Foreign currency transactions are translated into the functional currency at exchange rates prevailingon the date of the transaction. Foreign currency denominated monetary assets and liabilities are translatedinto the functional currency using exchange rates prevailing on the balance sheet dates. Gains and lossesarising on conversion of foreign currency denominated monetary assets and liabilities are included in netincome.
Assets and liabilities of entities with functional currency other than reporting currency have beentranslated to the reporting currency using exchange rates prevailing on the balance sheet date. Income

12
statement items have been translated using the weighted average exchange rates for the year. Translationadjustments have been reported as a component of other comprehensive income in the statement ofchanges in shareholders' equity.
The consolidated financial statements have been presented in US Dollars as the reporting currency.Effective April 1, 2008 TCS Limited changed its reporting currency to US Dollars from Indian Rupees. Theconsolidated financial statements for fiscals 2007 and 2008 have been retrospectively revised to reflectUS dollar as the reporting currency. Change in reporting currency was to facilitate the investor's ability toevaluate TCS Limited's performance and financial position in comparison to similar companies domiciledin different foreign jurisdictions.
h. Income taxes
Income tax expense comprises current tax expense and the net change in the deferred tax asset orliability during the year.
Current income taxes:
The current income tax expense includes Indian income taxes payable for Tata Consultancy ServicesLimited's worldwide operations after taking credit for benefits available for operations in SoftwareTechnology Parks (or STPs) and Special Economic Zones (or SEZs) and export earnings, and after offsettingbenefits under tax avoidance treaties for foreign taxes payable in overseas jurisdictions.
The domestic operations are carried out through 36 "undertakings" established in STPs and 10"undertakings" established in SEZs, which are separate entities under Indian income tax laws entitled totax holidays and other undertakings.
Current income tax is payable in each of TCS Limited's overseas branches and is computed inaccordance with the tax laws applicable in the jurisdiction in which each of the branches operate. Theamounts paid are generally available for offset as tax credits in India towards the income tax liabilitycomputed on TCS Limited's worldwide income.
The current income tax expense for overseas subsidiaries has been computed based on the lawsapplicable to each entity in the jurisdiction in which that entity operates.
Payments of advance taxes and income taxes payable in the same tax jurisdictions are offset.
Deferred income taxes:
Deferred tax assets and liabilities are recognised for the future tax consequences of temporarydifferences between the carrying values of assets and liabilities and their respective tax bases, andunutilised business loss carry forwards. Deferred tax assets and liabilities are computed separately foreach taxable entity in the consolidated enterprise and for each taxable jurisdiction. Valuation allowancesare recorded to reduce deferred tax assets when it is more likely than not that a tax benefit will not berealised and are separately estimated at each such entity without offsetting.
Deferred tax assets and liabilities are measured using enacted tax rates expected to apply totaxable income in the years in which the temporary differences are expected to be received or settled.The effect on deferred tax assets and liabilities of a change in tax rates is recognised in the incomestatement in the period of enactment of the change.
For domestic operations carried out in STPs and SEZs, deferred tax liabilities, if any, have beenestablished for the tax consequences of those temporary differences between the carrying values ofassets and liabilities and their respective tax bases that reverse after the tax holiday ends. No deferredtax asset has been recognised for the reduction in taxes attributable to such tax holidays.
For taxable entities and undertakings that are not entitled to tax holidays, deferred tax assets andliabilities are recognised for the future tax consequences of temporary differences between the carrying
14
Annual Report 2008-09
values of assets and liabilities and their respective tax bases, and operating loss carry forwards. Valuationallowances are recorded to reduce deferred tax assets when it is more likely than not that a tax benefitwill not be realised.
Uncertain tax position are recognised using the more likely-than-not threshold determined solelybased on technical merits that the tax positions will sustain upon examination. Tax positions that meet therecognition threshold are measured as the largest amount of benefit that is greater than fifty percentlikely of being realised upon settlement with relevant taxing authority that has full knowledge of allrelevant information. Interest and penalties relating to uncertain tax positions are classified under accruedexpenses and other current liabilities.
i. Cash and cash equivalents
TCS Limited considers all highly liquid financial instruments including bank deposits, which are readilyconvertible into cash and have original maturities of three months or less from the date of purchase, to becash equivalents.
j. Concentrations of credit risk
Financial instruments that potentially subject TCS Limited to concentrations of credit risk principallyconsist of cash and cash equivalents, accounts receivable and unbilled revenues.
k. Inventories
Stores and spares inventories are stated at cost determined on a weighted average basis. Rawmaterials, sub-assemblies and components are valued at lower of cost and market value and their costsare determined on a weighted average basis.
Purchased goods in transit are stated at their cost.
Finished goods produced or purchased are stated at the lower of cost and market value. Cost isdetermined using the specific identification method and includes direct material and labour costs and aproportion of manufacturing overheads. Work-in-progress is stated at lower of cost or market value.
Obsolete or slow moving inventories are written down based on management's specific analysis offuture sales forecast and economic conditions.
l. Goodwill and other intangible assets
Purchased intangible assets, other than goodwill, consist of amounts allocated to customerrelationships on acquisition of a business, acquisition of intellectual property rights and acquired contractrights. The intangible assets are amortised on a straight-line basis. The following table summarises thenature of intangibles and the estimated useful lives.
Nature of intangibles Useful lives
Customer-related intangibles 3-10 years
Technology-related intangibles 3-10 years
Software licenses License period
Acquired contract rights 5-12 years
Goodwill is assessed for impairment annually on March 31 or when events or circumstances indicatethat the implied fair value of goodwill is less than its carrying amount. Goodwill impairment assessmentis a two-step test. The first step compares the fair value of the reporting unit with its carrying amount,including goodwill. If the fair value of the reporting unit exceeds its carrying amount, goodwill of thereporting unit is considered not impaired; however if the carrying amount of the reporting unit exceedsits fair value, the second step of the goodwill impairment test is performed to measure the impairment

14
loss, if any. TCS Limited uses an income-based approach to determine the fair value of the reporting unitby estimating the present value of the future cash flows after considering current economic conditionsand trends, estimated future operating results and growth rates, and anticipated future economic andregulatory conditions. When required to perform the second step, TCS Limited compares the implied fairvalue of reporting units with the carrying amount of that goodwill. If the carrying amount of goodwillexceeds the implied fair value, an impairment loss equal to that excess amount is recognised, not toexceed the goodwill carrying amount. TCS Limited determines the implied fair value of goodwill for areporting unit by assigning the fair value of the reporting unit to all of the assets and liabilities of that unit(including any unrecognised intangible assets) as if the reporting unit had been acquired in a businesscombination. The excess of the fair value of the reporting unit over the amounts assigned to its assets andliabilities is the implied fair value of goodwill. This assignment process is only for the purpose of testinggoodwill impairment and TCS Limited does not adjust the carrying amount of the recognised assets andliabilities (other than goodwill, if appropriate) or recognise previously unrecognised intangible assets inthe consolidated balance sheet as a result of this assignment process.
m. Investments
Equity securities and investments in mutual funds with readily determinable fair market values areclassified as available-for-sale securities and recorded at fair value. Unrealised gains and losses on suchsecurities, net of applicable taxes, are reported in accumulated other comprehensive income, a separatecomponent of shareholders' equity. Realised gains and losses on sale of securities are recorded on thetrade date and the costs of investments sold are determined using the weighted average method.
Equity securities that do not have readily determinable market values are accounted atoriginal cost.
Declines in the fair values of investments below cost that are other than temporary are reflected inearnings as realised losses. Fair values of equity securities carried at cost are estimated if there areidentified events or changes in circumstances that may have a significant adverse effect on the fair valueof the investment.
Debt securities for which management has the positive intent and ability to hold to maturity areclassified as held-to-maturity securities and are reported at amortised cost.
TCS Limited does not have any securities classified as trading.
n. Property, plant and equipment
Property, plant and equipment are stated at cost, less accumulated depreciation. Depreciation isprovided for property, plant and equipment so as to expense the cost over their estimated useful lives atthe following basis and rates:
Type of asset Method Rate
Buildings Declining balance method 2.5% - 5%
Computer equipment Straight line method 16% - 50%
Automobiles Declining balance method 25% - 40%
Plant and machinery Straight line method 33.3%
Furniture and fixtures Straight line method 10% - 100%
Office equipment Declining balance method 13.9%
Depreciation is not recorded on capital work in progress until construction and installation arecomplete and the asset is ready for its intended use.

16
Annual Report 2008-09
Property, plant and equipment exclude computers and other assets individually costing USD 1,000(Rs 50,000) or less which are not capitalised except when they are part of a larger capital investmentprogramme.
o. Impairment or disposal of long-lived assets
Whenever events or circumstances indicate that the carrying amount of long-lived assets may notbe recoverable, TCS Limited subjects such assets to a test of recoverability based on the undiscounted cashflows from use and disposition of the asset. If the asset is impaired, TCS Limited recognises an impairmentloss as the difference between the carrying value of the asset and fair value. As of March 31, 2008 and2009, none of TCS Limited's long-lived assets was considered impaired.
p. Compensated absences
TCS Limited provides for the cost of vacation earned but not taken based on the number of days ofcarry forward entitlement at each balance sheet date.
q. Long-term debt
TCS Limited reports long-term debt at the outstanding principal balance. Interest costs are accountedfor on accruals basis and charged to the statement of income using the effective interest method.
r. Earnings per share
Basic earnings per share is computed by dividing net income attributable to shareholders ofTata Consultancy Services Limited by the weighted average number of equity shares outstanding duringthe period. Diluted earnings per share is computed using the weighted average number of equity anddilutive equity equivalent shares outstanding during the period, using the treasury stock method foroptions, except where the results would be anti-dilutive.
s. Comprehensive income
Comprehensive income includes all changes in equity from transactions and other events andcircumstances from non-shareholder sources. TCS Limited's comprehensive income comprises unrealisedgains and losses on available-for-sale securities, translation adjustments arising on the translation offinancial statements from functional currency to reporting currency, effective portion of gain / loss onderivative instruments, defined benefit pension and other post-retirement plans and net income.
t. Segment information
TCS Limited operates in three identified geographic reportable segments, namely (1) the Americas,(2) Europe and (3) India. All other operating segments do not meet the quantitative thresholds fordisclosure. Segment-wise information has been provided in Note 26.
u. Derivative financial instruments
TCS Limited uses foreign currency option contracts as well as forward contracts to manage itsexposure to foreign exchange. TCS Limited recognises the outstanding contracts at fair value. The optionand forward contracts are designated and documented as hedges at the inception of the contract. Theeffectiveness of option and forward contracts to reduce the risk associated with the exposure beinghedged is assessed and measured at inception and on an ongoing basis. Any amounts excluded from theassessment of hedge effectiveness, as well as the ineffective portion of designated hedges are reportedin earnings immediately.
Changes in fair value of derivative instruments designated and qualifying as hedges are recognisedas a component of the accumulated other comprehensive income in the statement of changes inshareholders' equity and is reclassified into earnings when the related hedge items impact earnings.Changes in fair value of derivative financial instruments that are not designated as a hedge are recordedimmediately in earnings.

16
When the financial instrument is terminated or settled prior to the expected maturity or realisationof the underlying item, hedge accounting is discontinued prospectively. Gains or losses from changes infair value of discontinued derivative instruments are recognised in earnings when the hedged transactionoccurs. Fair value adjustments, recognised for cash flow hedges after settlement or termination, continueto be reported in accumulated other comprehensive income until the related hedged items impact earnings.For anticipated transactions that are no longer probable, recognised fair value adjustments withinaccumulated other comprehensive income are reported immediately in current earnings.
v. Newly issued accounting pronouncements
In September 2006, the FASB issued SFAS No. 157, Fair Value Measurements, (SFAS No. 157).SFAS No. 157 establishes a framework for measuring fair value and expands disclosures about fair valuemeasurements. The changes to current practice resulting from the application of this Statement relate tothe definition of fair value, the methods used to measure fair value, and the expanded disclosures aboutfair value measurements. The Statement is effective for fiscal years beginning after November 15, 2007and interim periods within those fiscal years. In February 2008, the FASB issued Staff PositionNo. SFAS 157-2 which defers the effective date of SFAS 157 for all non-financial assets and non-financialliabilities to fiscal years beginning after November 15, 2008 and interim periods within those fiscal years.Effective April 2008, TCS Limited adopted SFAS No. 157 and the adoption did not have a material impacton TCS Limited's consolidated financial statements. Disclosures in accordance with SFAS No. 157 havebeen presented in Note 24 to consolidated financial statements.
In December 2007, the FASB issued SFAS No. 160, Non controlling Interests in Consolidated FinancialStatements, an amendment of Accounting Research Bulletin No. 51 (SFAS No. 160). SFAS No. 160 establishesaccounting and reporting standards for ownership interests in subsidiaries held by parties other than theparent, the amount of consolidated net income attributable to the parent and to the non controllinginterest, changes in a parent's ownership interest, and the valuation of retained non controlling equityinvestments when a subsidiary is deconsolidated. SFAS No. 160 also establishes disclosure requirementsthat clearly identify and distinguish between the interests of the parent and the interests of the noncontrolling owners. This statement is effective for the fiscal year and interim periods within those fiscalyears on or after December 15, 2008. The requirements of SFAS No. 160 and its impact on TCS Limited'sfinancial statements are being evaluated.
In December 2007, the FASB issued SFAS No. 141(Revised 2007), Business Combinations(SFAS No. 141R) which replaces SFAS No. 141, Business Combinations. SFAS 141R requires that the assetsacquired, the liabilities assumed and non-controlling interests be measured at the fair value at theacquisition date. The statement also requires the entity to recognise contingent consideration at the fairvalue at the acquisition date. This statement is effective for the fiscal year on or after December 15, 2008.The requirements of SFAS No. 141R and its impact on TCS Limited's financial statements are beingevaluated.
In March 2008, the FASB issued SFAS No. 161, Disclosures about Derivative Instruments and HedgingActivities, an amendment to FASB Statement No. 133 (SFAS No. 161). SFAS 161 requires additionaldisclosures on derivative and hedging activities by describing the need and objectives to be disclosed interms of risks and the effects of such instruments on the financial statements. This statement is effectivefor the fiscal year on or after November 15, 2008. The requirements of SFAS No. 161 and its impact onTCS Limited's financial statements are being evaluated.
In April 2008, FASB issued FASB Staff Position (FSP) FAS 142-3, Determination of the Useful Life ofthe Intangible Assets . Through this FSP, amendments were made in the factors that should be consideredin developing renewal or extension assumptions used to determine the useful life of a recognised intangibleasset under FASB Statement No. 142, Goodwill and Other Intangible Assets. The FSP enhances the disclosuresrequired for a recognised intangible asset enabling the users of financial statements to assess the extentto which the expected future cash flows associated with the asset would be affected by the entity's intent

18
Annual Report 2008-09
and/or ability to renew or extend the arrangement. This FSP is effective for all assets acquired after April1, 2009. Early adoption is prohibited. The requirements of this FSP and its impact on TCS Limited's financialstatements are being evaluated.
In May 2008, the FASB issued SFAS No. 163, Accounting for Financial Guarantee Insurance Contracts,an interpretation of FASB Statement No. 60 (SFAS No. 163). SFAS 163 requires that an insurance enterpriserecognise a claim liability prior to an event of default (insured event) when there is evidence that creditdeterioration has occurred in an insured financial obligation. This Statement also clarifies how Statement60 applies to financial guarantee insurance contracts, including the recognition and measurement to beused to account for premium revenue and claim liabilities. This Statement is effective for financialstatements issued for fiscal years beginning after December 15, 2008, the adoption of SFAS No. 163 is notexpected to have any impact on the financial position or results of operations of TCS Limited.
In October 2008, the FASB issued FSP 157-3, Determining Fair Value of a Financial Asset in a MarketThat Is Not Active (FSP 157-3). FSP 157-3 clarified the application of SFAS No. 157 in an inactive market. Itdemonstrated how the fair value of a financial asset is determined when the market for that financialasset is inactive. FSP 157-3 was effective upon issuance, including prior periods for which financial statementshad not been issued. The adoption of SFAS No. 157-3 is not expected to have any impact on the financialposition or results of operations of TCS Limited.
In December 2008, FASB issued FASB Staff Position (FSP) FAS 132(R)-1, Disclosures about Employers'Plan Assets. Through this FSP, amendments were made in Statement 132 (R), Employers' Disclosuresabout Pensions and Other Postretirement Benefits. The FSP enhances the disclosures required aboutemployers' plan assets, including employers' investment strategies, major categories of plan assets,concentrations of risk within plan assets, and valuation techniques used to measure the fair value of planassets. This FSP is effective on December 30, 2008. An entity must provide the FSP's disclosures in financialstatements for fiscal years ending after December 15, 2009. The requirements of this FSP and its impacton TCS Limited's financial statements are being evaluated.
In April 2009, the FASB issued FSP No. FAS 141(R)-1, Accounting for Assets Acquired and LiabilitiesAssumed in a Business Combination That Arise from Contingencies (SFAS No. 141(R)). FSP FAS 141(R)-1amends the provisions in Statement 141R for the initial recognition and measurement, subsequentmeasurement and accounting and disclosures for assets and liabilities arising from contingencies in businesscombinations. The FSP is effective for contingent assets or contingent liabilities acquired in businesscombinations for which the acquisition date is on or after the beginning of the first annual reportingperiod beginning on or after December 15, 2008. The requirements of this FSP and its impact onTCS Limited's financial statements are being evaluated.
3. Acquisitions
Fiscal 2008 acquisitions
On May 25, 2007, Tata Consultancy Services Do Brasil Desenvolvimento De Servicos Limitada (TCS LTDA),indirectly through GT Participacoes S.A. (GT), acquired the remaining non-controlling interest of 49% for aconsideration of USD 33.7 million (Reais 65.1 million) in Tata Consultancy Services Do Brasil Ltda (TCS Do Brasil).Consequently, TCS Do Brasil is now a wholly owned subsidiary of TCS LTDA. The fair valuation of assets andliabilities based on purchase price allocation has identified Acquired Contract Rights and Customer Relationshipsas intangible assets that has been valued at USD 5.3 million, to be amortised over the estimated useful life of5 years. The excess of purchase consideration over net assets and identified intangible assets has been recognisedas goodwill of USD 24.2 million.
Considering TCS Do Brasil's contribution in building TCS Limited's business the aforesaid acquisition wastargeted to further expand TCS Do Brasil's presence in the Brazilian and US markets for IT services.

18
Purchase consideration paid for this acquisition has been allocated as follows:
(In millions of USD)
Net assets acquired, at fair value
Property, plant and equipment $1.2
Fair value of intangible assets 5.3
Net working capital 3.0
Fair value of net assets on date of acquisition 9.5
Goodwill 24.2
Purchase consideration $33.7
Fiscal 2009 acquisitions
On December 31, 2008 Tata Consultancy Services Limited acquired a 96.26 percent equity interest inTCS e-Serve Limited, (formerly known as Citigroup Global Services Limited), a business process outsourcing(BPO) provider within the banking and financial services (BFS) sector from Citigroup Inc.(Seller), forUSD 504.5 million including acquisition cost of USD 2.5 million. The fair valuation of assets and liabilities onpurchase price allocation has identified Acquired Contract Rights, an intangible asset that has been valued atUSD 114.4 million, to be amortised over the contractual period of 9.5 years. The excess of purchase considerationover net assets and the identified intangible asset has been recognised as goodwill of USD 305.0 million.
TCS e-Serve Limited is one of the largest BPO providers in India with a trained workforce, having strongdomain skills in the areas of its offerings. Through this acquisition, TCS Limited will be positioned to acquire newcustomers in addition to the existing client base and create substantial business in BPO services in the BFS sector.Tata Consultancy Services Limited is entitled to an indemnification of certain specified contingent claims onTCS e-Serve Limited and is liable to pay amounts equal to amounts refunded to TCS e-Serve Limited on thoseclaims from the Seller.
Purchase consideration paid for this acquisition has been allocated as follows:
(In millions of USD)
Net assets acquired, at fair value
Investments $16.5
Property, plant and equipment 20.6
Fair value of intangible assets 114.4
Net working capital 75.5
Other non-current liabilities (27.5)
Fair Value of net assets on date of acquisition 199.5
Goodwill 305.0
Purchase consideration $504.5
Proforma results for TCS e-Serve Limited acquisition
The following unaudited proforma financial information presents the combined results of operations ofTCS Limited and TCS e-Serve Limited as if the acquisition had occurred as of the beginning of each of the periodspresented. The unaudited proforma results for all periods presented include amortisation charges for identifiedintangible assets, eliminations of intercompany transactions and related tax effects.

20
Annual Report 2008-09
The unaudited proforma results were as follows for the fiscal years ended March 31, 2008 and 2009:
Year Ended Year EndedMarch 31, 2008 March 31, 2009
(In millions of USD, except per share data)
Revenue $5,868.5 $6,218.6
Net Income 1,295.5 1,112.1
Earnings per share 1.32 1.14
The proforma financial information is presented for informational purposes and is not indicative of theresults of operations that may have been achieved if the acquisition had taken place at the beginning of eachof the periods presented.
4. Cash and cash equivalents
Cash and cash equivalents consist of the following:
As of March 31, As of March 31,2008 2009
(In millions of USD)
Held within India $19.2 $44.8
Held outside India 238.9 247.7
Total $258.1 $292.5
5. Concentrations of credit risk
Concentrations of credit risk exist when changes in economic, industry or geographic factors similarlyaffect groups of counter parties whose aggregate credit exposure is material in relation to TCS Limited's totalcredit exposure.
TCS Limited has a customer concentration of risk, as illustrated in the table below showing the aggregatedaccounts receivable and unbilled revenues for five largest customers as of March 31, 2008 and 2009, respectively.
TCS Limited's exposure to other customers is diversified and no other single customer explains more than2.0% of outstanding accounts receivable and unbilled revenues as of March 31, 2008 and 2009.
As of March 31, 2008
(In millions of USD, except percentages)
Total accountsreceivable and
unbilled revenues Percentage
Customer P $110.5 6.6
Customer J 53.0 3.2
Customer C 44.7 2.7
Customer Q 43.5 2.6
Customer R 36.9 2.2
Others 1,392.5 82.7
Total $1,681.1 100.0

20
As of March 31, 2009
(In millions of USD, except percentages)
Total accountsreceivable and
unbilled revenues Percentage
Customer A $72.0 4.9
Customer B 54.6 3.7
Customer P 54.3 3.7
Customer D 36.2 2.4
Customer R 30.3 2.0
Others 1,235.5 83.3
Total $1,482.9 100.0
TCS Limited also has a geographic concentration of credit risk with exposure to customers based in theUnited States of America and in the United Kingdom comprising 37.8% and 18.2% of the balances as ofMarch 31, 2008 and 39.6 % and 16.5% of the balances as of March 31, 2009, respectively.
TCS Limited also has a geographic concentration of credit risk relating to cash and cash equivalents heldwith banks in South Africa, in the United Kingdom and in the United States of America comprising 14.4%,20.7% and 13.3% of the balances as of March 31, 2008 and 13.3%, 10.6% and 6.0% of the balances as ofMarch 31, 2009, respectively.
6. Inventories
Inventories consist of the following :
As of March 31, As of March 31,2008 2009
(In millions of USD)
Stores and spares $0.7 $0.3
Raw materials 3.1 2.7
Goods in transit 0.7 0.7
Computers and equipment held for resale 6.0 3.2
Work in progress 0.1 0.2
Total $10.6 $7.1
In fiscals 2008 and 2009 there was no impairment loss in respect of inventories.

22
Annual Report 2008-09
7. Prepaid expenses and others current assets
Prepaid expenses and other current assets consist of the following :
As of March 31, As of March 31,2008 2009
(In millions of USD)
Prepaid expenses $113.4 $95.8
Advance to suppliers 13.8 8.5
Employee loans and advance (net of allowances of $3.3 millionand $3.8 million, respectively) 41.8 25.2
Short-term bank deposits 12.3 222.7
Income taxes paid in advance 71.3 128.0
Deferred income taxes 30.7 26.1
Foreign currency derivative assets 15.5 3.5
Other current assets (net of allowances of $1.6 million and$2.1 million, respectively) 74.7 110.9
Total $373.5 $620.7
8. Investments
Investments consist of the following:
As of March 31, As of March 31,2008 2009
(In millions of USD)
Investments available-for-sale, at fair value $655.9 $320.2
Investments held-to-maturity, at amortised cost 3.3 18.3
Investments available-for-sale at cost, net 0.9 1.6
Total $660.1 $340.1
Information on unrealised gains and losses on available-for-sale investments at March 31, 2008 andMarch 31, 2009 is as follows:
Cost Gross Gross Fairunrealised unrealised Value
gains losses
(In millions of USD)
Available-for-sale securities :
As of March 31, 2008:
Investments in mutual funds $635.3 $11.4 $(0.3) $646.4
Investments in debt securities 9.6 - (0.1) 9.5
Total available-for-sale securities $644.9 $11.4 $(0.4) $655.9
As of March 31, 2009:
Investments in mutual funds $313.0 $6.5 $(0.9) $318.6
Investments in debt securities 1.6 - - 1.6
Total available-for-sale securities $314.6 $6.5 $(0.9) $320.2

22
Information on unrecognised gains and losses for held-to-maturity investments is as follows :
Fair Gross Gross Amortisedvalue unrecognised unrecognised cost
gains losses
(In millions of USD)
Held-to-maturity securities :
As of March 31, 2008 :
Investments in debt securities $1.1 $- $(0.1) $1.2
Investments in preference securities 2.0 - (0.1) 2.1
Total held-to-maturity securities : $3.1 $- $(0.2) $3.3
As of March 31, 2009 :
Investments in debt securities $16.6 $- $- $16.6
Investments in preference securities 1.6 - (0.1) 1.7
Total held-to-maturity securities : $18.2 $- $(0.1) $18.3
The contractual maturity of available-for-sale debt securities as of March 31, 2009 is as follows:
Year ending March 31, (In millions of USD)
2010 $0.1
2011 0.2
2012 0.1
2013 0.1
2014 0.2
2015 0.4
2021 0.2
2030 0.1
2036 0.2
Total $1.6
The contractual maturity of held-to-maturity securities as of March 31, 2009 is as follows:
Year ending March 31, Debt securities Preference securities
(In millions of USD)
2010 $15.9 $1.7
2012 - -
2014 0.4 -
2015 0.3 -
Total $16.6 $1.7
Dividends on investments for fiscals 2007, 2008 and 2009 were $8.6 million, $26.9 million and$27.8 million, respectively.
24
Annual Report 2008-09
The proceeds and gross realised gains from sale of available-for-sale securities for fiscal 2007 were$3,335.2 million and $2.2 million, respectively. Unrealised gain of $1.7 million was reclassified from accumulatedother comprehensive income to earnings on sale of these securities.
The proceeds and gross realised gains from sale of available-for-sale securities for fiscal 2008 were$6,779.7 million and $3.9 million, respectively. Unrealised gain of $3.6 million was reclassified from accumulatedother comprehensive income to earnings on sale of these securities.
The proceeds and gross realised gains from sale of available-for-sale securities for fiscal 2009 were$6,719.2 million and $11.7 million, respectively. Unrealised gain of $9.4 million was reclassified from accumulatedother comprehensive income to earnings on sale of these securities.
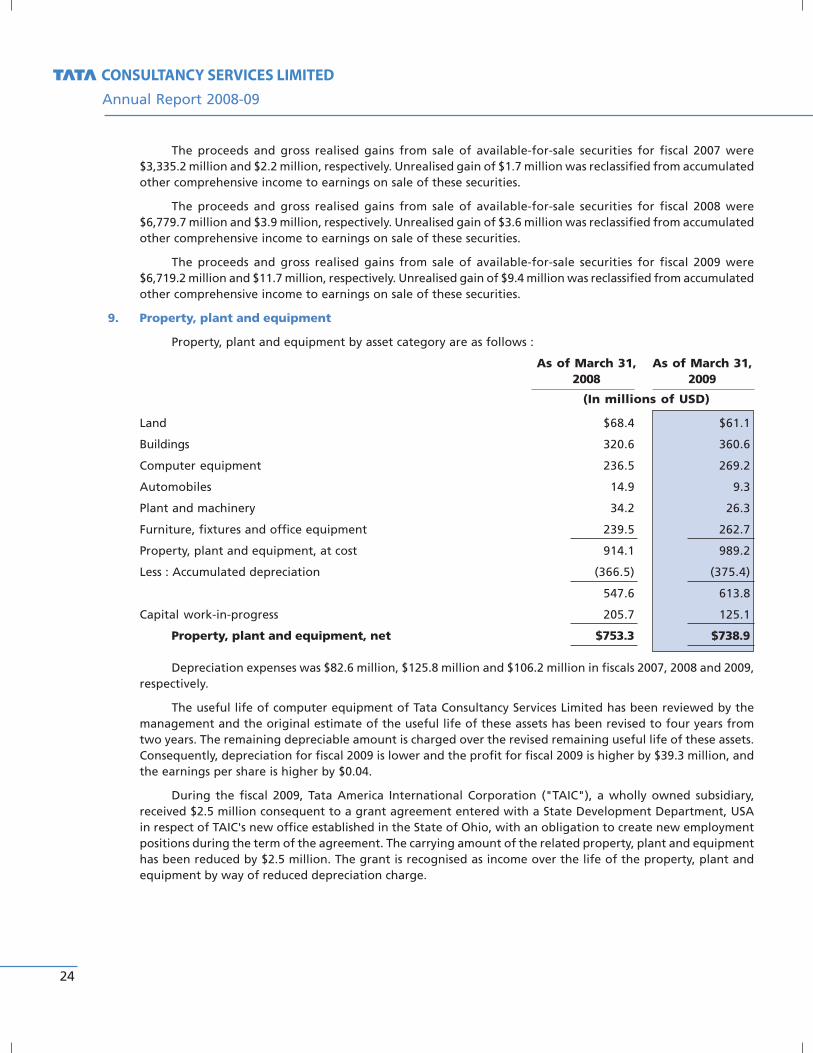
9. Property, plant and equipment
Property, plant and equipment by asset category are as follows :
As of March 31, As of March 31,2008 2009
(In millions of USD)
Land $68.4 $61.1
Buildings 320.6 360.6
Computer equipment 236.5 269.2
Automobiles 14.9 9.3
Plant and machinery 34.2 26.3
Furniture, fixtures and office equipment 239.5 262.7
Property, plant and equipment, at cost 914.1 989.2
Less : Accumulated depreciation (366.5) (375.4)
547.6 613.8
Capital work-in-progress 205.7 125.1
Property, plant and equipment, net $753.3 $738.9
Depreciation expenses was $82.6 million, $125.8 million and $106.2 million in fiscals 2007, 2008 and 2009,respectively.
The useful life of computer equipment of Tata Consultancy Services Limited has been reviewed by themanagement and the original estimate of the useful life of these assets has been revised to four years fromtwo years. The remaining depreciable amount is charged over the revised remaining useful life of these assets.Consequently, depreciation for fiscal 2009 is lower and the profit for fiscal 2009 is higher by $39.3 million, andthe earnings per share is higher by $0.04.
During the fiscal 2009, Tata America International Corporation ("TAIC"), a wholly owned subsidiary,received $2.5 million consequent to a grant agreement entered with a State Development Department, USAin respect of TAIC's new office established in the State of Ohio, with an obligation to create new employmentpositions during the term of the agreement. The carrying amount of the related property, plant and equipmenthas been reduced by $2.5 million. The grant is recognised as income over the life of the property, plant andequipment by way of reduced depreciation charge.
24
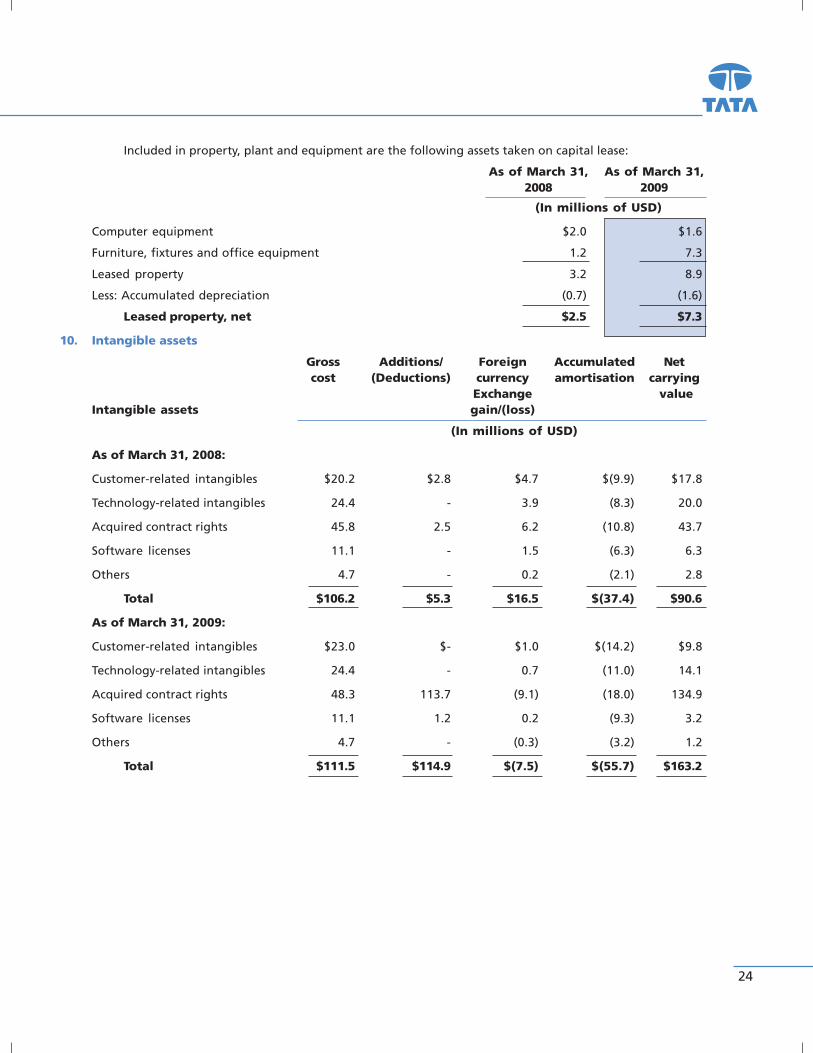
Included in property, plant and equipment are the following assets taken on capital lease:
As of March 31, As of March 31,2008 2009
(In millions of USD)
Computer equipment $2.0 $1.6
Furniture, fixtures and office equipment 1.2 7.3
Leased property 3.2 8.9
Less: Accumulated depreciation (0.7) (1.6)
Leased property, net $2.5 $7.3
10. Intangible assets
Gross Additions/ Foreign Accumulated Netcost (Deductions) currency amortisation carrying
Exchange valueIntangible assets gain/(loss)
(In millions of USD)
As of March 31, 2008:
Customer-related intangibles $20.2 $2.8 $4.7 $(9.9) $17.8
Technology-related intangibles 24.4 - 3.9 (8.3) 20.0
Acquired contract rights 45.8 2.5 6.2 (10.8) 43.7
Software licenses 11.1 - 1.5 (6.3) 6.3
Others 4.7 - 0.2 (2.1) 2.8
Total $106.2 $5.3 $16.5 $(37.4) $90.6
As of March 31, 2009:
Customer-related intangibles $23.0 $- $1.0 $(14.2) $9.8
Technology-related intangibles 24.4 - 0.7 (11.0) 14.1
Acquired contract rights 48.3 113.7 (9.1) (18.0) 134.9
Software licenses 11.1 1.2 0.2 (9.3) 3.2
Others 4.7 - (0.3) (3.2) 1.2
Total $111.5 $114.9 $(7.5) $(55.7) $163.2

26
Annual Report 2008-09
The estimated amortisation for each of the five fiscal years subsequent to March 31, 2009 is as follows:
Year ending March 31, Amortised Cost
(In millions of USD)
2010 $24.0
2011 21.3
2012 20.1
2013 19.2
2014 18.3
Thereafter 60.3
Total $163.2
Amortisation expense was $13.9 million, $18.0 million and $18.3 million in fiscals 2007, 2008 and 2009respectively.
11. GoodwillAs of March 31, As of March 31,
2008 2009
(In millions of USD)
Balance at the beginning of the year $224.1 $276.9
Addition during the year 32.5 305.6
Foreign currency translation adjustment 20.3 (71.9)
Balance at the end of the year $276.9 $510.6
TCS Limited performed its annual impairment test as of March 31, 2009. TCS Limited estimated the fairvalues of the reporting units using an income-based approach and estimated future cash flows after consideringcurrent economic conditions and trends, estimated future operating results and growth rate, and anticipatedfuture economic and regulatory conditions. The estimated cash flows were developed using internal forecasts.The discount rates used for the reporting units were based on the historical market returns of the comparablecompanies. As of March 31, 2009, the fair values of all reporting units exceed the carrying amounts and noimpairment loss was recognised in fiscal 2009.
As of March 31, 2009, goodwill amounting to $35.1 million is deductible for tax purposes.
12. Other non-current assets
Other non-current assets consist of the following:As of March 31, As of March 31,
2008 2009
(In millions of USD)
Non-current portion of employee loans $8.8 $8.1
Prepaid rent 37.9 25.2
Rent deposits 52.1 67.5
Deferred income taxes 95.7 161.2
Restricted cash 0.9 1.1
Long-term bank deposits 33.4 17.5
Others 30.1 50.6
Total $258.9 $331.2
26
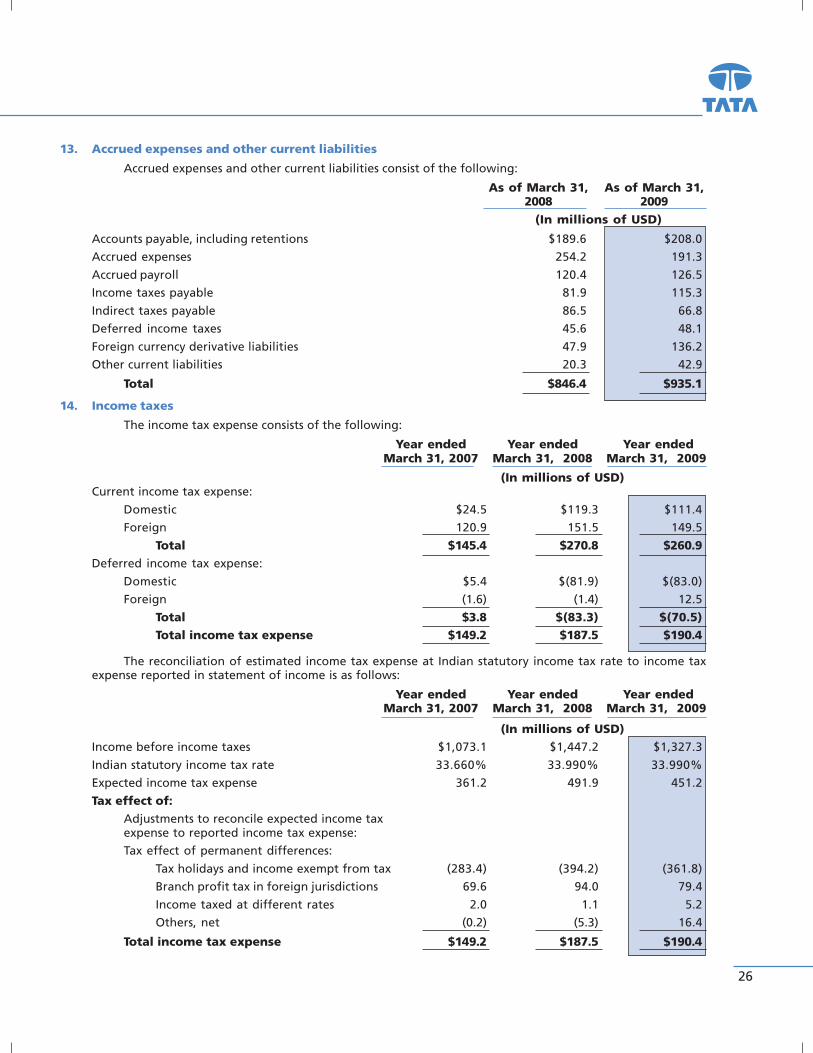
13. Accrued expenses and other current liabilities
Accrued expenses and other current liabilities consist of the following:
As of March 31, As of March 31,2008 2009
(In millions of USD)
Accounts payable, including retentions $189.6 $208.0
Accrued expenses 254.2 191.3
Accrued payroll 120.4 126.5
Income taxes payable 81.9 115.3
Indirect taxes payable 86.5 66.8
Deferred income taxes 45.6 48.1
Foreign currency derivative liabilities 47.9 136.2
Other current liabilities 20.3 42.9
Total $846.4 $935.1
14. Income taxes
The income tax expense consists of the following:
Year ended Year ended Year endedMarch 31, 2007 March 31, 2008 March 31, 2009
(In millions of USD)Current income tax expense:
Domestic $24.5 $119.3 $111.4
Foreign 120.9 151.5 149.5
Total $145.4 $270.8 $260.9Deferred income tax expense:
Domestic $5.4 $(81.9) $(83.0)
Foreign (1.6) (1.4) 12.5
Total $3.8 $(83.3) $(70.5)Total income tax expense $149.2 $187.5 $190.4
The reconciliation of estimated income tax expense at Indian statutory income tax rate to income taxexpense reported in statement of income is as follows:
Year ended Year ended Year endedMarch 31, 2007 March 31, 2008 March 31, 2009
(In millions of USD)Income before income taxes $1,073.1 $1,447.2 $1,327.3
Indian statutory income tax rate 33.660% 33.990% 33.990%
Expected income tax expense 361.2 491.9 451.2
Tax effect of:Adjustments to reconcile expected income taxexpense to reported income tax expense:
Tax effect of permanent differences:
Tax holidays and income exempt from tax (283.4) (394.2) (361.8)
Branch profit tax in foreign jurisdictions 69.6 94.0 79.4
Income taxed at different rates 2.0 1.1 5.2
Others, net (0.2) (5.3) 16.4
Total income tax expense $149.2 $187.5 $190.4

28
Annual Report 2008-09
Under Section 10A of the Indian Income Tax Act, 1961, TCS Limited is entitled to tax holidays for its variousSoftware Technology Park (STP) units located across India. These tax holidays are available for a period of tenfiscal years from the date of commencement of operations. These holidays expire in fiscal 2010.
In addition, TCS Limited benefits from the tax exemption available for units set up under the SpecialEconomic Zone Act, 2005 (SEZ). These tax holidays are available for a period of fifteen fiscal years from thedate of commencement of operations. Under the SEZ scheme, the unit which begins providing services on orafter April 1, 2005 will be eligible for deductions of 100% of profits or gains derived from export of services forthe first five years, 50% of such profit or gains for a further period of five years and 50% of such profit or gainsfor a further period of five years subject to fulfillment of certain conditions.
The per share (basic) effect of the tax holiday was $0.29, $0.39 and $0.35 for fiscals 2007, 2008 and 2009.
The tax effects of significant temporary differences are as follows:
As of March 31, As of March 31,2008 2009
(In millions of USD)Tax effect of:
Deductible temporary differences:
Retirement benefits and compensated absences $13.3 $12.9
Allowances for doubtful receivables, loans and advances 4.4 6.5
Allowances for diminution in value of investments 2.5 0.6
MAT credit entitlement 87.7 152.8
Operating loss carry forward 11.4 2.8
Intangibles and goodwill 4.3 8.0
Others 5.3 4.5
Deferred tax asset 128.9 188.1
Less: Valuation allowance 2.5 0.8
Net deferred tax asset $126.4 $187.3
Current $30.7 $26.1
Non-current 95.7 161.2
Total $126.4 $187.3
Taxable temporary differences:
Property, plant and equipment $2.4 $14.8
Branch profit tax 25.2 21.5
Undistributed earnings of subsidiaries and affiliates 15.6 23.6
Unrealised gain on available-for-sale securities 3.8 2.1
Others 9.1 44.9
Deferred tax liability $56.1 $106.9
Current $45.6 $48.1
Non-current 10.5 58.8
Total $56.1 $106.9
A valuation allowance has been recognised on deferred tax asset relating to impairment of certainsecurities carried at cost, which TCS Limited does not intend to sell in the foreseeable future and operatinglosses of certain subsidiaries and branches do not expect to return to tax profitability in near future.
Under the Indian Income Tax Act, 1961, unabsorbed business losses expire eight years after the year inwhich they originate. In respect of certain foreign subsidiaries, business losses can be carried forward indefinitelyunless there is a substantial change in the ownership.
28
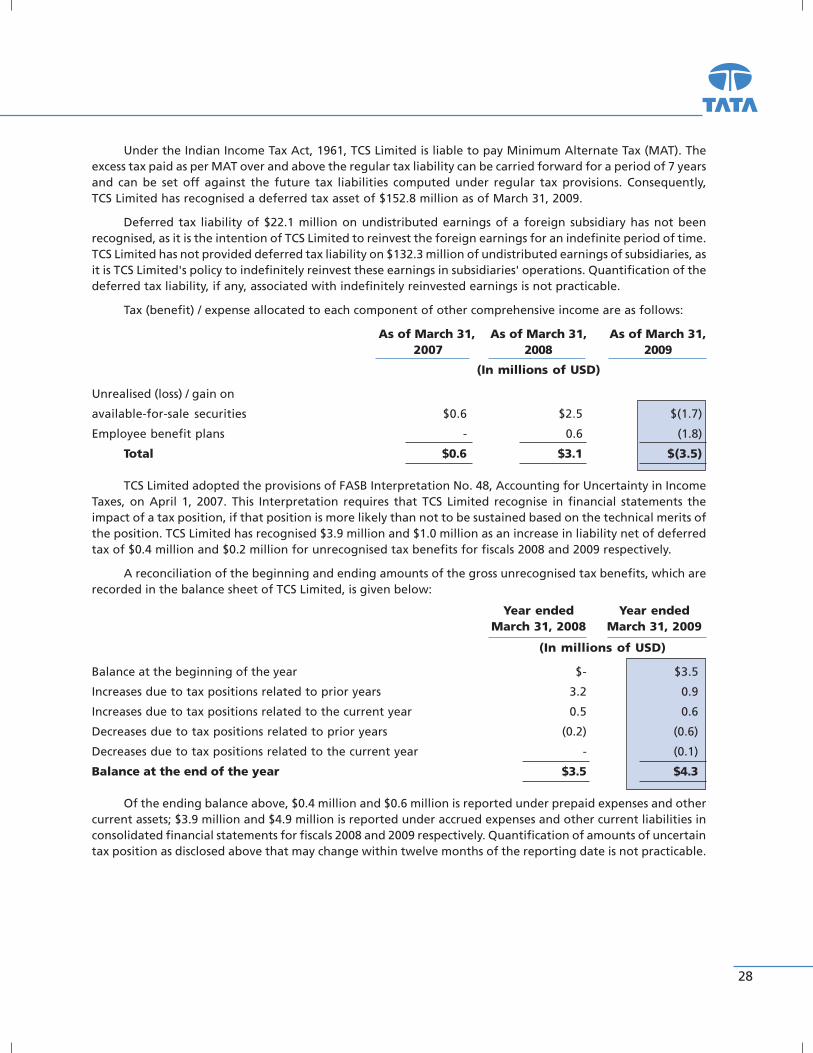
Under the Indian Income Tax Act, 1961, TCS Limited is liable to pay Minimum Alternate Tax (MAT). Theexcess tax paid as per MAT over and above the regular tax liability can be carried forward for a period of 7 yearsand can be set off against the future tax liabilities computed under regular tax provisions. Consequently,TCS Limited has recognised a deferred tax asset of $152.8 million as of March 31, 2009.
Deferred tax liability of $22.1 million on undistributed earnings of a foreign subsidiary has not beenrecognised, as it is the intention of TCS Limited to reinvest the foreign earnings for an indefinite period of time.TCS Limited has not provided deferred tax liability on $132.3 million of undistributed earnings of subsidiaries, asit is TCS Limited's policy to indefinitely reinvest these earnings in subsidiaries' operations. Quantification of thedeferred tax liability, if any, associated with indefinitely reinvested earnings is not practicable.
Tax (benefit) / expense allocated to each component of other comprehensive income are as follows:
As of March 31, As of March 31, As of March 31, 2007 2008 2009
(In millions of USD)
Unrealised (loss) / gain on
available-for-sale securities $0.6 $2.5 $(1.7)
Employee benefit plans - 0.6 (1.8)
Total $0.6 $3.1 $(3.5)
TCS Limited adopted the provisions of FASB Interpretation No. 48, Accounting for Uncertainty in IncomeTaxes, on April 1, 2007. This Interpretation requires that TCS Limited recognise in financial statements theimpact of a tax position, if that position is more likely than not to be sustained based on the technical merits ofthe position. TCS Limited has recognised $3.9 million and $1.0 million as an increase in liability net of deferredtax of $0.4 million and $0.2 million for unrecognised tax benefits for fiscals 2008 and 2009 respectively.
A reconciliation of the beginning and ending amounts of the gross unrecognised tax benefits, which arerecorded in the balance sheet of TCS Limited, is given below:
Year ended Year endedMarch 31, 2008 March 31, 2009
(In millions of USD)
Balance at the beginning of the year $- $3.5
Increases due to tax positions related to prior years 3.2 0.9
Increases due to tax positions related to the current year 0.5 0.6
Decreases due to tax positions related to prior years (0.2) (0.6)
Decreases due to tax positions related to the current year - (0.1)
Balance at the end of the year $3.5 $4.3
Of the ending balance above, $0.4 million and $0.6 million is reported under prepaid expenses and othercurrent assets; $3.9 million and $4.9 million is reported under accrued expenses and other current liabilities inconsolidated financial statements for fiscals 2008 and 2009 respectively. Quantification of amounts of uncertaintax position as disclosed above that may change within twelve months of the reporting date is not practicable.

30
Annual Report 2008-09
TCS Limited files numerous consolidated and separate income tax returns in India, United States federaland state jurisdictions, United Kingdom and in several other foreign jurisdictions. On an ongoing basisTCS Limited is routinely subject to examination by taxing authorities. While it is often difficult to predict thefinal outcome or the timing of resolution of any particular uncertain tax position, TCS Limited believes that itsunrecognised tax benefits reflect the outcome that is more likely than not to occur. TCS Limited adjusts theseunrecognised tax benefits, as well as the related interest and penalties, in light of changing facts andcircumstances. The resolution of a matter could be recognised as an adjustment to provision for income taxesand effective tax rate in the period of resolution, and may also require the outflow of cash.
TCS Limited has ongoing disputes with Indian Income tax authorities relating to tax treatment of certainitems. These mainly include disallowed expenses, tax treatment of certain expenses claimed by TCS Limited asdeductions, and computation of, or eligibility of, certain tax incentives or allowances. As of March 31, 2009,TCS Limited has demands from direct tax authorities in Indian jurisdiction, which are being contested byTCS Limited on appeal amounting to $96.6 million. Demands from direct tax authorities include $43.5 million inrespect of TCS e-Serve Limited. TCS e-Serve Limited has also paid advance taxes aggregating $32.0 millionagainst the disputed amounts for the relevant assessment years. TCS Limited is entitled to an indemnificationof the above referred contingent claims on TCS e-Serve Limited from Citigroup Inc. and would be required topay amounts equal to amounts refunded to TCS e-Serve Limited on those claims.
The number of years that are subject to tax assessments varies depending on tax jurisdiction. The majortax jurisdictions of TCS Limited include India, United States of America and United Kingdom. In India, tax filingsfrom fiscal 2006 are subject to examination by the taxing authorities. In United States of America, the federalstatute of limitation applies to fiscals 2005 and earlier and applicable state statutes of limitation vary by state.In United Kingdom, tax filings from fiscal 2007 are subject to examination by the taxing authorities.
15. Short-term debt
Short-term debt consists of the following:
As of March 31, As of March 31,2008 2009
(In millions of USD)
Foreign currency bank loans $- $101.0
Cash credits and overdrafts 7.6 0.3
Current portion of long-term debt 0.3 0.2
Other short-term debt 1.4 -
Total $9.3 $101.5
Available lines of credit $467.2 $313.9
Total debt outstanding
Maximum amount outstanding $65.3 $101.5
Average amount outstanding $17.0 $2.3
Weighted average interest rate 2.0% 1.8%
Cash credits and overdrafts are secured against accounts receivable and inventories. All other debts areunsecured.
30
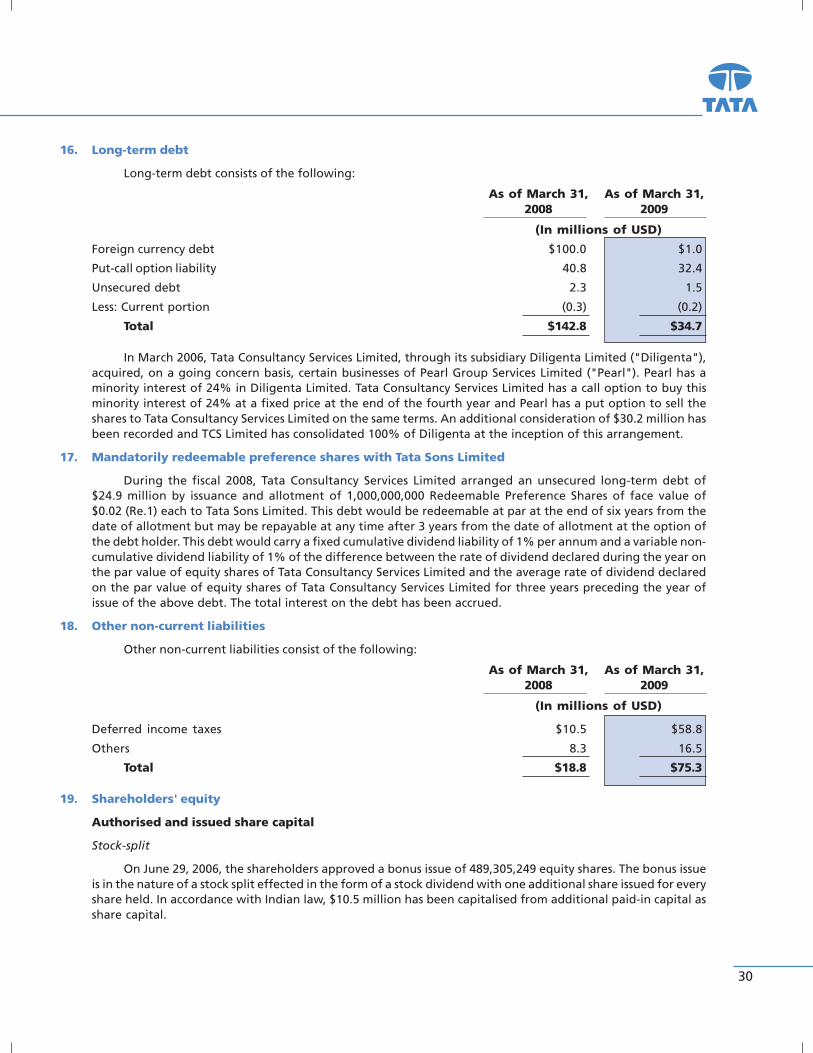
16. Long-term debt
Long-term debt consists of the following:
As of March 31, As of March 31,2008 2009
(In millions of USD)
Foreign currency debt $100.0 $1.0
Put-call option liability 40.8 32.4
Unsecured debt 2.3 1.5
Less: Current portion (0.3) (0.2)
Total $142.8 $34.7
In March 2006, Tata Consultancy Services Limited, through its subsidiary Diligenta Limited ("Diligenta"),acquired, on a going concern basis, certain businesses of Pearl Group Services Limited ("Pearl"). Pearl has aminority interest of 24% in Diligenta Limited. Tata Consultancy Services Limited has a call option to buy thisminority interest of 24% at a fixed price at the end of the fourth year and Pearl has a put option to sell theshares to Tata Consultancy Services Limited on the same terms. An additional consideration of $30.2 million hasbeen recorded and TCS Limited has consolidated 100% of Diligenta at the inception of this arrangement.
17. Mandatorily redeemable preference shares with Tata Sons Limited
During the fiscal 2008, Tata Consultancy Services Limited arranged an unsecured long-term debt of$24.9 million by issuance and allotment of 1,000,000,000 Redeemable Preference Shares of face value of$0.02 (Re.1) each to Tata Sons Limited. This debt would be redeemable at par at the end of six years from thedate of allotment but may be repayable at any time after 3 years from the date of allotment at the option ofthe debt holder. This debt would carry a fixed cumulative dividend liability of 1% per annum and a variable non-cumulative dividend liability of 1% of the difference between the rate of dividend declared during the year onthe par value of equity shares of Tata Consultancy Services Limited and the average rate of dividend declaredon the par value of equity shares of Tata Consultancy Services Limited for three years preceding the year ofissue of the above debt. The total interest on the debt has been accrued.
18. Other non-current liabilities
Other non-current liabilities consist of the following:
As of March 31, As of March 31,2008 2009
(In millions of USD)
Deferred income taxes $10.5 $58.8
Others 8.3 16.5
Total $18.8 $75.3
19. Shareholders' equity
Authorised and issued share capital
Stock-split
On June 29, 2006, the shareholders approved a bonus issue of 489,305,249 equity shares. The bonus issueis in the nature of a stock split effected in the form of a stock dividend with one additional share issued for everyshare held. In accordance with Indian law, $10.5 million has been capitalised from additional paid-in capital asshare capital.

32
Annual Report 2008-09
20. Retirement and post-retirement benefits
Defined benefit retirement plan
In accordance with Indian law, TCS Limited and its subsidiaries in India provide for gratuity, a definedbenefit retirement plan covering eligible employees in India. The plan provides for a lump sum payment tovested employees at retirement, death while in employment or on termination of employment in an amountequivalent to 15 to 30 days' salary payable for each completed year of service. Vesting occurs upon completionof five continuous years of service. The measurement date used for determining retirement benefits forgratuity is March 31. Certain overseas subsidiaries of TCS Limited also provide for retirement benefit pensionplans in accordance with the local laws.
The following table sets out the funded status of the defined benefit retirement plans and the amountsrecognised in the financial statements:
As of March 31, 2008 As of March 31, 2009
Domestic Foreign Total Domestic Foreign Totalplans plans plans plans
(In millions of USD)
Change in benefit obligations:
Benefit obligation, beginning ofthe year $58.7 $25.0 $83.7 $82.8 $29.7 $112.5
Exchange (gain) / loss 4.9 4.7 9.6 (19.1) (5.5) (24.6)
Plans assumed on acquisition ofsubsidiaries - - - 4.0 - 4.0
Plan participant's contribution - 1.6 1.6 - 1.1 1.1
Service cost 12.5 4.7 17.2 13.4 3.4 16.8
Interest cost 5.9 0.9 6.8 6.3 1.1 7.4
Actuarial loss / (gain) 6.7 (3.6) 3.1 1.5 3.2 4.7
Benefits paid (5.9) (3.6) (9.5) (5.1) (1.5) (6.6)
Benefit obligation, end ofthe year $82.8 $29.7 $112.5 $83.8 $31.5 $115.3
Change in plan assets:
Fair value of plan assets,
beginning of the year $56.2 $23.2 $79.4 $66.5 $31.0 $97.5
Exchange (gain) / loss 4.7 4.2 8.9 (14.5) (5.2) (19.7)
Actual return on plan assets 6.1 0.1 6.2 6.5 (3.2) 3.3
Employer contributions 5.4 5.5 10.9 16.3 4.9 21.2
Plan assets obtained on
acquisition of subsidiaries - - - 1.2 - 1.2
Plan participant's contribution - 1.6 1.6 - 1.1 1.1
Benefits paid (5.9) (3.6) (9.5) (5.1) (1.5) (6.6)
Fair value of plan assets, end ofthe year $66.5 $31.0 $97.5 $70.9 $27.1 $98.0
Funded status:
(Deficit) / excess of plan assetsover obligations $(16.3) $1.3 $(15.0) $(12.9) $(4.4) $(17.3)
(Accrued liability) / prepaid benefit $(16.3) $1.3 $(15.0) $(12.9) $(4.4) $(17.3)

32
As of March 31, 2008 As of March 31, 2009
Domestic Foreign Total Domestic Foreign Totalplans plans plans plans
(In millions of USD)Category of assets:
Corporate bonds $- $4.2 $4.2 $- $11.7 $11.7
Equity shares - 11.3 11.3 - 3.8 3.8
Special deposit scheme 0.5 3.8 4.3 0.3 - 0.3Index linked gilt - 4.8 4.8 - 4.5 4.5Insurer managed funds 65.9 - 65.9 70.6 - 70.6Cash and bank balances - 2.0 2.0 - 0.3 0.3Funds - 4.9 4.9 - - -Others 0.1 - 0.1 - 6.8 6.8
Total $66.5 $31.0 $97.5 $70.9 $27.1 $98.0
Net periodic gratuity cost consists of the following components:
Year ended Year ended Year endedMarch 31, 2007 March 31, 2008 March 31, 2009
Domestic Foreign Total Domestic Foreign Total Domestic Foreign Totalplans plans plans plans plans plans
(In millions of USD)
Service cost $8.7 $4.8 $13.5 $12.5 $4.7 $17.2 $13.4 $3.4 $16.8
Interest cost 4.2 0.4 4.6 5.9 0.9 6.8 6.3 1.1 7.4
Amortisation of netactuarial loss 0.2 - 0.2 - - - - - -
Expected return onplan assets (4.1) (0.4) (4.5) (5.1) (1.3) (6.4) (5.4) (1.5) (6.9)
Net periodic gratuitycost $9.0 $4.8 $13.8 $13.3 $4.3 $17.6 $14.3 $3.0 $17.3
The assumptions used in accounting for the gratuity plan are set out below:
Year ended Year ended Year endedMarch 31, 2007 March 31, 2008 March 31, 2009
Domestic Foreign Domestic Foreign Domestic Foreignplans plans plans plans plans plans
% % % % % %
Discount rate 7.0 - 9.8 3.0 - 5.3 8.0 3.5 - 6.9 7.5 - 8.0 3.5 - 6.3
Rate of increase in compensationlevels of covered employees 4.0 - 7.0 1.5 4.0 - 6.0 1.5 - 3.4 4.0 - 15.0 1.5 - 3.3
Rate of return on plan assets 7.0 - 8.0 4.7 - 4.9 7.0 - 8.9 4.5 - 5.7 8.0 - 9.2 4.5 - 5.6
TCS Limited's overall expected long-term rate of return on assets has been determined based on aconsideration of assessed risks of asset management, available market information, historical results of thereturn on plan assets and the provisions of Indian law which specify the instruments in which investments can bemade.
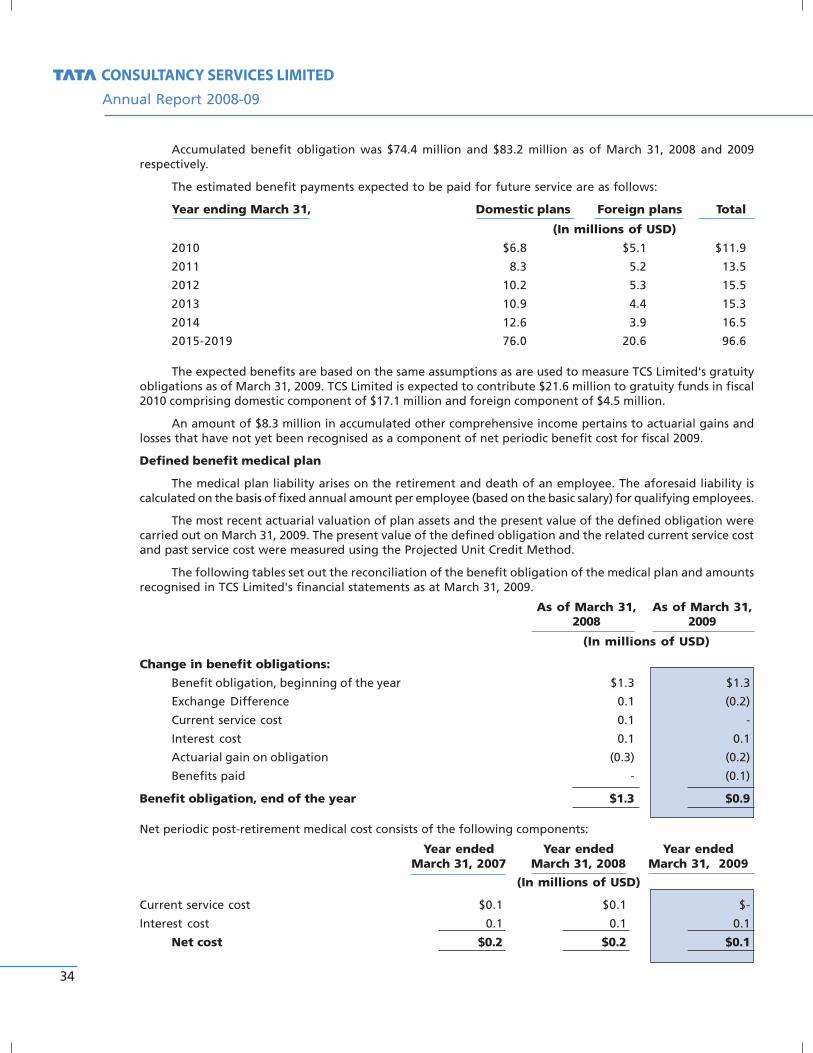
34
Annual Report 2008-09
Accumulated benefit obligation was $74.4 million and $83.2 million as of March 31, 2008 and 2009respectively.
The estimated benefit payments expected to be paid for future service are as follows:
Year ending March 31, Domestic plans Foreign plans Total
(In millions of USD)
2010 $6.8 $5.1 $11.9
2011 8.3 5.2 13.5
2012 10.2 5.3 15.5
2013 10.9 4.4 15.3
2014 12.6 3.9 16.5
2015-2019 76.0 20.6 96.6
The expected benefits are based on the same assumptions as are used to measure TCS Limited's gratuityobligations as of March 31, 2009. TCS Limited is expected to contribute $21.6 million to gratuity funds in fiscal2010 comprising domestic component of $17.1 million and foreign component of $4.5 million.
An amount of $8.3 million in accumulated other comprehensive income pertains to actuarial gains andlosses that have not yet been recognised as a component of net periodic benefit cost for fiscal 2009.
Defined benefit medical plan
The medical plan liability arises on the retirement and death of an employee. The aforesaid liability iscalculated on the basis of fixed annual amount per employee (based on the basic salary) for qualifying employees.
The most recent actuarial valuation of plan assets and the present value of the defined obligation werecarried out on March 31, 2009. The present value of the defined obligation and the related current service costand past service cost were measured using the Projected Unit Credit Method.
The following tables set out the reconciliation of the benefit obligation of the medical plan and amountsrecognised in TCS Limited's financial statements as at March 31, 2009.
As of March 31, As of March 31,2008 2009
(In millions of USD)
Change in benefit obligations:
Benefit obligation, beginning of the year $1.3 $1.3
Exchange Difference 0.1 (0.2)
Current service cost 0.1 -
Interest cost 0.1 0.1
Actuarial gain on obligation (0.3) (0.2)
Benefits paid - (0.1)
Benefit obligation, end of the year $1.3 $0.9
Net periodic post-retirement medical cost consists of the following components:
Year ended Year ended Year endedMarch 31, 2007 March 31, 2008 March 31, 2009
(In millions of USD)
Current service cost $0.1 $0.1 $-
Interest cost 0.1 0.1 0.1
Net cost $0.2 $0.2 $0.1
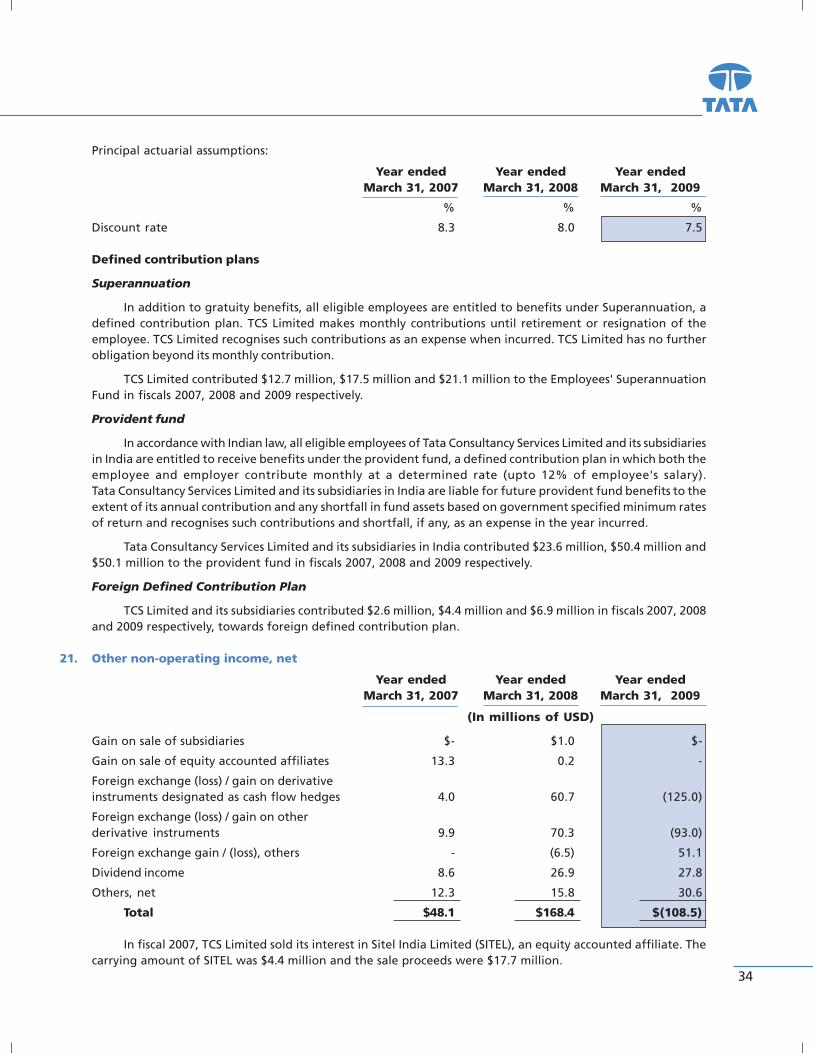
34
Principal actuarial assumptions:
Year ended Year ended Year endedMarch 31, 2007 March 31, 2008 March 31, 2009
% % %
Discount rate 8.3 8.0 7.5
Defined contribution plans
Superannuation
In addition to gratuity benefits, all eligible employees are entitled to benefits under Superannuation, adefined contribution plan. TCS Limited makes monthly contributions until retirement or resignation of theemployee. TCS Limited recognises such contributions as an expense when incurred. TCS Limited has no furtherobligation beyond its monthly contribution.
TCS Limited contributed $12.7 million, $17.5 million and $21.1 million to the Employees' SuperannuationFund in fiscals 2007, 2008 and 2009 respectively.
Provident fund
In accordance with Indian law, all eligible employees of Tata Consultancy Services Limited and its subsidiariesin India are entitled to receive benefits under the provident fund, a defined contribution plan in which both theemployee and employer contribute monthly at a determined rate (upto 12% of employee's salary).Tata Consultancy Services Limited and its subsidiaries in India are liable for future provident fund benefits to theextent of its annual contribution and any shortfall in fund assets based on government specified minimum ratesof return and recognises such contributions and shortfall, if any, as an expense in the year incurred.
Tata Consultancy Services Limited and its subsidiaries in India contributed $23.6 million, $50.4 million and$50.1 million to the provident fund in fiscals 2007, 2008 and 2009 respectively.
Foreign Defined Contribution Plan
TCS Limited and its subsidiaries contributed $2.6 million, $4.4 million and $6.9 million in fiscals 2007, 2008and 2009 respectively, towards foreign defined contribution plan.
21. Other non-operating income, net
Year ended Year ended Year endedMarch 31, 2007 March 31, 2008 March 31, 2009
(In millions of USD)
Gain on sale of subsidiaries $- $1.0 $-
Gain on sale of equity accounted affiliates 13.3 0.2 -
Foreign exchange (loss) / gain on derivativeinstruments designated as cash flow hedges 4.0 60.7 (125.0)
Foreign exchange (loss) / gain on otherderivative instruments 9.9 70.3 (93.0)
Foreign exchange gain / (loss), others - (6.5) 51.1
Dividend income 8.6 26.9 27.8
Others, net 12.3 15.8 30.6
Total $48.1 $168.4 $(108.5)
In fiscal 2007, TCS Limited sold its interest in Sitel India Limited (SITEL), an equity accounted affiliate. Thecarrying amount of SITEL was $4.4 million and the sale proceeds were $17.7 million.

36
Annual Report 2008-09
In fiscal 2008, TCS Limited through its wholly owned subsidiary, TCS Iberoamerica SA, sold its interest intwo of its subsidiaries Pentacrom S.A. and Pentacrom Servicios S.A. for a profit of $1.0 million. The sale proceedsof $1.5 million are receivable in three instalments upto December, 2009.
In fiscal 2008, TCS Limited sold its interest in Conscripti (Pty) Ltd, an equity accounted affiliate. Thecarrying amount of Conscripti (Pty) Ltd was $0.7 million and the sale proceeds were $0.9 million.
22. Shipping and handling costs
Selling, general and administrative expenses for fiscals 2007, 2008 and 2009, include shipping and handlingcosts of $1.0 million, $1.0 million and $0.7 million respectively.
23. Leases
TCS Limited has leased property, equipment and automobiles under operating lease arrangements.Operating lease rent expense was $58.5 million, $61.9 million and $65.1 million in fiscals 2007, 2008 and 2009respectively.
The following is a summary of future minimum lease rental commitments towards non-cancellableoperating leases and capital leases:
Year ending March 31, Operating lease Capital lease
(In millions of USD)
2010 $68.3 $2.3
2011 57.4 1.7
2012 49.5 1.4
2013 36.6 1.4
2014 30.9 1.4
Thereafter 84.8 4.3
Total minimum lease commitments $327.5 $12.5
Present value of minimum lease commitments of assets acquired under capital lease amounting to$7.2 million.
The capital lease arrangement is renewable at the option of the lessee.
24. Estimated fair value of financial instruments
Effective April 1, 2008, TCS Limited adopted SFAS No. 157 limited to financial assets and liabilities, whichprimarily relate to TCS Limited's investments and derivative contracts.
The fair value hierarchy is based on inputs to valuation techniques that are used to measure fair valuethat are either observable or unobservable and consists of the following three levels:
� Level 1- Inputs are quoted prices in active markets for identical assets or liabilities.
� Level 2- Inputs are quoted prices for similar assets or liabilities in an active market, quoted prices foridentical or similar assets or liabilities in markets that are not active, inputs other than quoted prices thatare observable and market-corroborated inputs which are derived principally from or corroborated byobservable market data.
� Level 3- Inputs which are unobservable reflecting internal assumptions are used in pricing assets orliabilities.

36
The following table summarises financial assets and liabilities measured at fair value on a recurring basisin accordance with SFAS No. 157 as of March 31, 2009:
Level 1 Level 2 Level 3 Total
(In millions of USD)
Investments - available-for-sale securities $320.2 $- $- $320.2
Derivative financial assets 1.7 1.8 - 3.5
Derivative financial liabilities 19.3 116.9 - 136.2
25. Derivative financial instruments
TCS Limited, in accordance with its risk management policies and procedures, enters into foreign currencyforward contracts and currency options to manage its exposure in foreign exchange rates. The counter party isgenerally a bank. These contracts are for a period between one day and eight years.
TCS Limited in respect of forecasted transactions and upon completion of the formal documentationincluding testing for effectiveness designates certain foreign currency forwards and options in respect offorecasted transactions, which meet the hedging criteria, as cash flow hedges.
The following are outstanding foreign exchange forward contracts, which have been designated as cashflow hedges:
As of March 31, 2008 As of March 31, 2009
Foreign Number of Notional Fair Value Number of Notional Fair ValueCurrency Contracts amount Gain/ (Loss) Contracts amount Gain/ (Loss)
of Forward of Forwardcontracts contracts
(In millions) (In millions (In millions) (In millionsof USD) of USD)
US Dollar 14 290.0 $(6.3) 14 153.5 $(18.1)
Euro 3 19.0 (2.9) - - -
Sterling Pound 3 15.0 (1.0) - - -
The following are outstanding Currency Option contracts, which have been designated as Cash FlowHedges:
As of March 31, 2008 As of March 31, 2009
Foreign Number of Notional Fair Value Number of Notional Fair ValueCurrency Contracts amount Gain/ (Loss) Contracts amount Gain/ (Loss)
of Option of Optioncontracts contracts
(In millions) (In millions (In millions) (In millionsof USD) of USD)
US Dollar 67 3,871.5 $(22.1) 56 1,081.7 $(117.3)
Euro 12 99.3 (9.7) 1 5.0 (1.1)
Sterling Pound 7 55.7 (0.6) 1 4.0 (0.2)
Net loss on derivative instruments of $92.8 million recognised in accumulated other comprehensive incomeas of March 31, 2009, is expected to be reclassified into earnings by March 31, 2010.

38
Annual Report 2008-09
The movement in accumulated other comprehensive income during fiscals 2008 and 2009 for derivativesdesignated as cash flow hedges is as follows:
Year ended Year endedMarch 31, 2008 March 31, 2009
(In millions of USD)
Balance at the beginning of the year $17.0 $(3.8)
Gains / (losses) transferred to income statement on occurrence offorecasted hedge transaction (16.2) 4.3
Changes in the fair value of effective portion of outstandingcash flow derivatives. (43.6) (125.9)
Net derivative (loss) / gain related to a discontinued cash flow hedge 37.6 (19.3)
Foreign currency translation adjustment 1.4 0.8
Balance at the end of the year $(3.8) $(143.9)
In addition to the above cash flow hedges, TCS Limited has outstanding foreign exchange forward contractsand currency option contracts aggregating $540.5 million and $832.2 million as on March 31, 2008 and 2009respectively, whose fair value showed a loss of $1.1 million and a gain of $1.5 million in fiscals 2008 and 2009respectively. Although these contracts are effective as hedges from an economic perspective, they do notqualify for hedge accounting and accordingly these are accounted as trading instruments. Exchange gains of$9.9 million, $70.3 million and an exchange loss of $93.0 on foreign currency forward exchange contracts andcurrency option contracts have been recognised in earnings in fiscals 2007, 2008 and 2009 respectively.
26. Segment information
Operating segments are defined as components of an enterprise for which discrete financial informationis available that is evaluated regularly by the chief operating decision maker, in deciding how to allocateresources and assessing performance. TCS Limited's chief operating decision maker is the Chief ExecutiveOfficer and Managing Director.
TCS Limited provides products and services to three reportable segments based on the geographicallocations in which customers are based. These segments are: Americas, Europe and India. All other operatingsegments fall below the quantitative thresholds for reporting purposes. The revenue and related expenserecognition policies for each segment are the same as for the consolidated enterprise, and are set out inNote 2.
Income and direct expenses directly identifiable to segments are reported under each reportable segment,while remaining expenses, principally corporate overheads, are allocated to each segment on the basis of theassociated revenues of each segment. Certain expenses, such as depreciation, are not specifically allocable tosegments and accordingly these expenses have been reported as unallocable.
Substantially all of TCS Limited's long-lived assets are located in India.
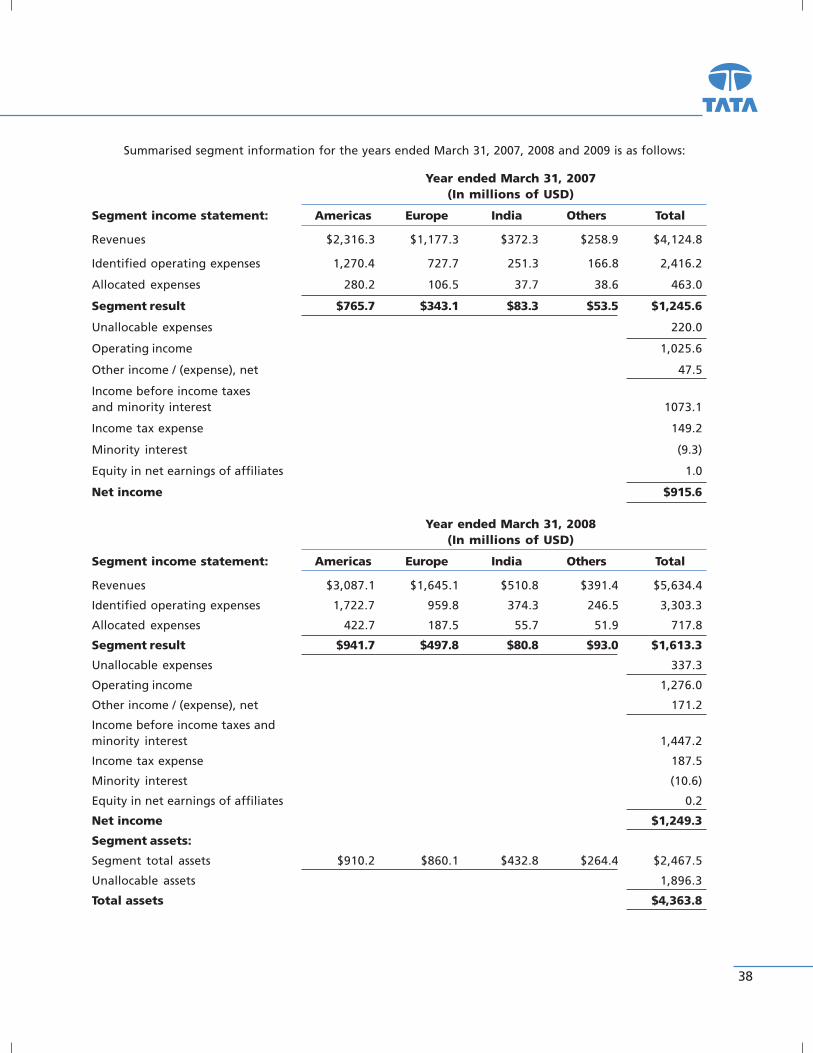
38
Summarised segment information for the years ended March 31, 2007, 2008 and 2009 is as follows:
Year ended March 31, 2007(In millions of USD)
Segment income statement: Americas Europe India Others Total
Revenues $2,316.3 $1,177.3 $372.3 $258.9 $4,124.8
Identified operating expenses 1,270.4 727.7 251.3 166.8 2,416.2
Allocated expenses 280.2 106.5 37.7 38.6 463.0
Segment result $765.7 $343.1 $83.3 $53.5 $1,245.6
Unallocable expenses 220.0
Operating income 1,025.6
Other income / (expense), net 47.5
Income before income taxesand minority interest 1073.1
Income tax expense 149.2
Minority interest (9.3)
Equity in net earnings of affiliates 1.0
Net income $915.6
Year ended March 31, 2008(In millions of USD)
Segment income statement: Americas Europe India Others Total
Revenues $3,087.1 $1,645.1 $510.8 $391.4 $5,634.4
Identified operating expenses 1,722.7 959.8 374.3 246.5 3,303.3
Allocated expenses 422.7 187.5 55.7 51.9 717.8
Segment result $941.7 $497.8 $80.8 $93.0 $1,613.3
Unallocable expenses 337.3
Operating income 1,276.0
Other income / (expense), net 171.2
Income before income taxes andminority interest 1,447.2
Income tax expense 187.5
Minority interest (10.6)
Equity in net earnings of affiliates 0.2
Net income $1,249.3
Segment assets:
Segment total assets $910.2 $860.1 $432.8 $264.4 $2,467.5
Unallocable assets 1,896.3
Total assets $4,363.8
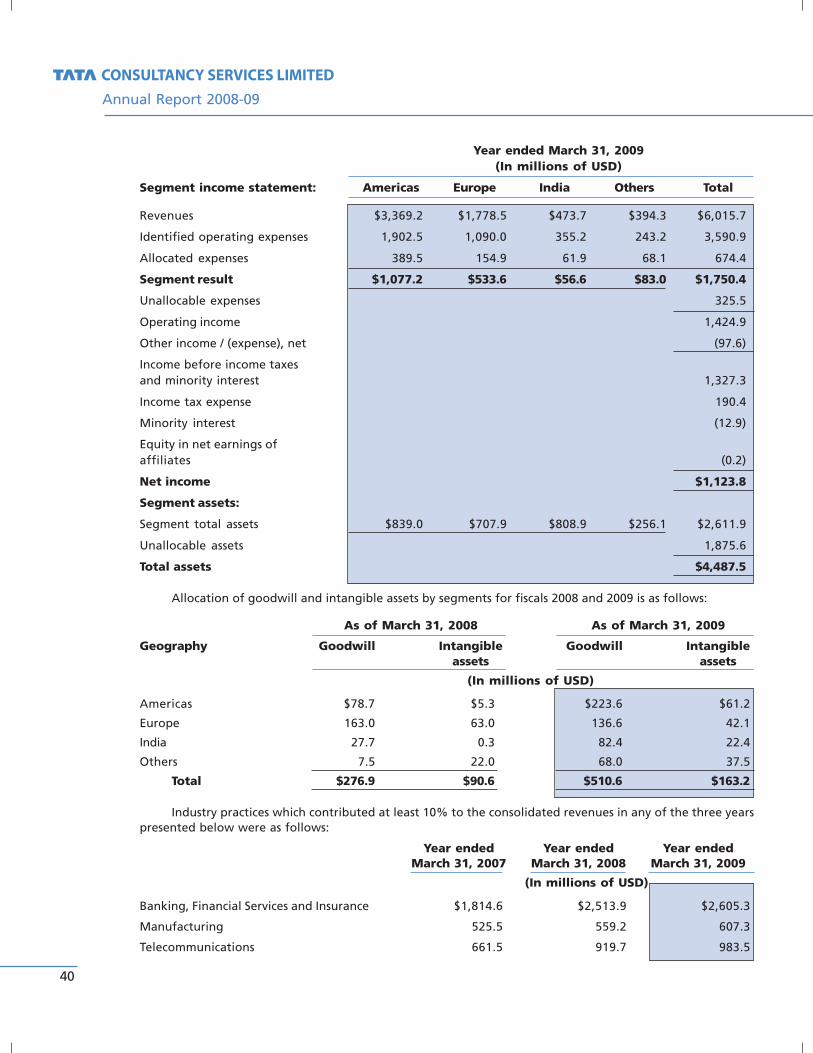
40
Annual Report 2008-09
Year ended March 31, 2009(In millions of USD)
Segment income statement: Americas Europe India Others Total
Revenues $3,369.2 $1,778.5 $473.7 $394.3 $6,015.7
Identified operating expenses 1,902.5 1,090.0 355.2 243.2 3,590.9
Allocated expenses 389.5 154.9 61.9 68.1 674.4
Segment result $1,077.2 $533.6 $56.6 $83.0 $1,750.4
Unallocable expenses 325.5
Operating income 1,424.9
Other income / (expense), net (97.6)
Income before income taxesand minority interest 1,327.3
Income tax expense 190.4
Minority interest (12.9)
Equity in net earnings ofaffiliates (0.2)
Net income $1,123.8
Segment assets:
Segment total assets $839.0 $707.9 $808.9 $256.1 $2,611.9
Unallocable assets 1,875.6
Total assets $4,487.5
Allocation of goodwill and intangible assets by segments for fiscals 2008 and 2009 is as follows:
As of March 31, 2008 As of March 31, 2009
Geography Goodwill Intangible Goodwill Intangibleassets assets
(In millions of USD)
Americas $78.7 $5.3 $223.6 $61.2
Europe 163.0 63.0 136.6 42.1
India 27.7 0.3 82.4 22.4
Others 7.5 22.0 68.0 37.5
Total $276.9 $90.6 $510.6 $163.2
Industry practices which contributed at least 10% to the consolidated revenues in any of the three yearspresented below were as follows:
Year ended Year ended Year endedMarch 31, 2007 March 31, 2008 March 31, 2009
(In millions of USD)
Banking, Financial Services and Insurance $1,814.6 $2,513.9 $2,605.3
Manufacturing 525.5 559.2 607.3
Telecommunications 661.5 919.7 983.5

40
27. Commitments and contingencies
Commitments and contingent liabilities are as follows:
Capital commitments
As of March 31, 2009, $131.0 million was contractually committed for purchase of property, plant andequipment.
Contingencies
Property matters
Lessors of certain properties leased under tenancy agreements have claimed additional rent and otherexpenses of $19.8 million. These claims are being contested in the courts by TCS Limited. Pending resolution ofthe matter, an amount of $13.3 million has been accrued based on management's estimate. Interest andpenalty, if any, has not been determined.
Guarantees and letters of credit
Tata Consultancy Services Limited has issued counter guarantees to Bank of America of $2.0 million and$1.2 million on behalf of TCS Asia Pacific Pte Ltd. and on behalf of Tata Information Technology (Shanghai)Company Limited, both 100% owned subsidiaries respectively, in consideration of Bank of America issuingcredit lines, guarantees and other financial facilities in various currencies to these subsidiaries.
Tata Consultancy Services Limited has issued counter guarantees for $8.4 million, valid tillOctober 23, 2010 on behalf of its 100% owned subsidiary TCS Iberoamerica SA and its subsidiaries ('Ibero'), inconsideration of the bank providing bank guarantee facilities to Ibero to assist in their bidding for contractswith some customers.
Tata Consultancy Services Limited has provided guarantees aggregating to $361.4 million(GBP 252.5 million) to third parties on behalf of its subsidiary Diligenta Limited.
Tata Consultancy Services Limited has provided counter guarantees for $9.0 million to third parties onbehalf of its 100% owned subsidiary TCS FNS Pty Limited.
Tata Consultancy Services Limited has provided guarantees aggregating to $0.1 million to third parties onbehalf of its subsidiary Tata Consultancy Services Morocco SARL AU.
TCS Limited has unexpired letters of credit of $10.8 million as at March 31, 2009.
Indirect tax matters
TCS Limited has ongoing disputes with Indian tax authorities mainly relating to treatment ofcharacterisation and classification of certain items. As of March 31, 2009, TCS Limited has demands fromvarious indirect tax authorities in Indian jurisdiction, which are being contested by the Company on appealamounting to $8.0 million.
Other claims
TCS Limited has examined the social security and tax aspects of contracts with legal entities which provideservices to an overseas subsidiary and, based on legal opinion, concludes that the subsidiary is in compliance withthe related statutory requirements.
28. Related party transactions
Tata Consultancy Services Limited's principal related parties consist of its holding companyTata Sons Limited and its subsidiaries, its own subsidiaries, affiliates and its key managerial personnel.TCS Limited routinely enters into transactions with its related parties in the ordinary course of business.Transactions and balances with its own subsidiaries and affiliates are eliminated on combination and consolidation.TCS Limited's related party balances and transactions are summarised as follows:

42
Annual Report 2008-09
Transactions with related parties are as follows:
Year ended Year ended Year endedMarch 31, 2007 March 31, 2008 March 31, 2009
(In millions of USD)Revenues from sale of services and licenses $55.1 $76.2 $62.8
Other income 0.1 0.5 2.3
Purchases of goods and services 65.0 119.2 121.9
Brand equity contribution 8.9 11.9 13.8
Dividend paid 167.5 240.7 221.8
Purchase of property, plant and equipment 0.9 0.3 0.9
Inter-corporate deposits - 5.0 17.3
Mandatorily redeemable preference shareswith Tata Sons Limited - 24.9 -
Interest - - 1.5
Allowances for doubtful debts and advances - 0.9 0.2
Purchase of investment in affiliates 0.2 - 0.5
Balances receivable from related parties are as follows:
As of March 31, As of March 31,2008 2009
(In millions of USD)Accounts receivable and unbilled revenues (net) $15.8 $20.0
Advances and deposits 5.6 29.3
Total $21.4 $49.3
Balances payable to related parties are as follows:
As of March 31, As of March 31,2008 2009
(In millions of USD)Payables $16.1 $29.2
Advances received and deposits 0.1 -
Mandatorily redeemable preference shares with Tata Sons Limited 24.9 19.7
Total $41.1 $48.9
29. Dividends
The dividends declared by Tata Consultancy Services Limited are in Indian Rupees and are based on theprofits available for distribution as reported in the unconsolidated statutory financial statements of TataConsultancy Services Limited prepared in accordance with Indian GAAP. Accordingly, the net income reported inthese financial statements may not be fully distributable. As of March 31, 2008 and 2009, incomes (net ofdividend tax) available for distribution were $1,847.2 million (Rs. 79,596.1 million) and $2,482.0 million(Rs. 105,966.0 million), respectively. Subsequent to March 31, 2009, Tata Consultancy Services Limited hasproposed dividend of $0.1 (Rs.5) per share in respect of fiscal 2009.
30. Subsequent event
On April 20, 2009, the Board of Directors, subject to the approval of shareholders, approved a bonus issueof equity shares in the ratio of one equity share of Tata Consultancy Services Limited of $0.02 (Re.1) each forevery one equity share of Tata Consultancy Services Limited held by the shareholders. In accordance with IndianLaw, $19.3 million will be transferred from additional paid-in-capital to share capital after obtaining theshareholders' approval. Consequent to the bonus issue earnings per share for fiscal 2009 would be $0.57.
42
Management Discussion and Analysis of
Financial Condition and Results of Operations
The following discussion and analysis should be read together with the consolidated US GAAP financial statements ofTata Consultancy Services Limited (hereinafter referred to as TCS Limited or TCS or TCS Ltd. or the Company) for thefinancial years ended March 31, 2009, 2008 and 2007.
The Company's financial year ends on March 31. All references to a particular financial year are to the twelve-monthperiod ended March 31 of that year.
Highlights
In fiscal 2009, revenues aggregated $6.0 billion. Revenues from information technology and consultancy serviceswere $5.8 billion, a growth of 8.42% over $5.4 billion in fiscal 2008.
On April 20, 2009, the Board of Directors, subject to the approval of shareholders, recommended issue of bonusshares in the ratio of 1:1. Consequently $19.3 million would be transferred from additional paid-in-capital to sharecapital in fiscal 2010.
The dividends declared by TCS are in Indian Rupee and are based on the profits available for distribution as reportedin the unconsolidated statutory financial statements of Tata Consultancy Services Limited prepared in accordancewith Indian GAAP. The Company has been paying dividend each quarter. It declared a total interim dividend of $0.19(Rs.9) per share for the nine months April 01, 2008 to December 31, 2008. Subsequent to March 31, 2009, a finaldividend of $0.1 (Rs.5) per share has been proposed. On approval of the same by the shareholders, the dividend forfiscal 2009 would amount to $0.29 (Rs.14) per share.
Overseas operations
The Company operates in India and in several other countries. Its operations outside India are conducted through itsbranches and subsidiaries in North America, Europe, South America, Asia Pacific region, South Africa and Middle East.
North America
In addition to its own branches in the region, the Company operates through its wholly-owned subsidiary,Tata America International Corporation (TAIC) in the United States of America (USA).
Iberoamerica
The Company's operations in Central America and South America are conducted through branches and subsidiariesset up in Uruguay, Mexico, Chile, Argentina, Columbia, Ecuador and Brazil. Operations in Portugal and Spain also formpart of this segment.
Europe
The Company operates in Europe through subsidiaries in the Netherlands, Germany, Switzerland, Sweden, Belgium,France, Italy and Luxembourg. In Hungary, the UK and Ireland, the Company operates through its branches.
Asia Pacific
The business of the Company in the Asia Pacific region is conducted through its branches and subsidiaries in Singapore,China, Japan, Indonesia, Malaysia, Hong Kong and Macau.
Australia
The Company operates in Australia and New Zealand through its branches and subsidiaries.
Middle East and South Africa
The Company operates in Middle East and South Africa through its branches and subsidiaries.
Significant accounting policies
Item 2 of the notes to consolidated financial statements provides details of the significant accounting policies usedfor the preparation and presentation of the financial statements.

44
Annual Report 2008-09
These financial statements have been prepared in accordance with accounting principles generally accepted in theUnited States of America ("US GAAP").
Certain prior-year amounts have been reclassified to conform to current year presentation.
The functional currency of Tata Consultancy Services Limited and its Indian subsidiaries is the Indian Rupee, whereasthe functional currency of foreign subsidiaries is the currency in their countries of incorporation. The accompanyingfinancial statements are reported in US Dollars.
Estimates and assumptions used in the preparation of the consolidated US GAAP financial statements
The preparation of financial statements in conformity with US GAAP requires the management to make estimatesand assumptions that affect the reported amounts of assets and liabilities, disclosures of contingent assets andliabilities at the date of these financial statements and the reported amounts of revenues and expenses for the yearspresented.
Areas in which significant judgments and estimates are used include, but are not limited to:
� estimated costs for completion of fixed price contracts
� allowances for uncollectible accounts receivable
� useful lives of intangible and tangible assets
� impairment assessment of goodwill, other intangible assets and long-lived assets
� purchase price allocation on acquisition of business
� retirement benefits and
� income taxes.
Actual results could differ from the estimates.
Acquisitions in fiscal 2009
During fiscal 2009, the Company's major acquisition was the purchase of 96.26% shareholding of Citigroup GlobalServices Limited for a consideration of USD 504.5 million. This entity has been renamed TCS e-Serve Limited. With thisacquisition, TCS is well positioned to meet end-to-end IT-BPO requirements of its financial services customers.
Details of investments in fiscal 2009 are shown below:
Investments Details
Acquisition of TCS e-Serve Limited During the fiscal 2009 TCS acquired 1,19,36,313 shares (96.26 percent equity(formerly Citigroup Global interest) for a consideration of USD 504.5 million.Services Limited)
Investment in Tata Consultancy Subscription to 100 percent share capital of Tata Consultancy ServicesServices (Thailand) Limited (Thailand) Limited by Tata Consultancy Services Asia Pacific Pte Ltd.
Investment in Tata Consultancy Subscription to 100 percent share capital of Tata Consultancy ServicesServices (Philippines) Inc. (Philippines) Inc. by Tata Consultancy Services Asia Pacific Pte Ltd.
Merger of Tata Infotech During the year Tata Infotech Deutschland GmbH has merged with TataDeutschland GmbH Consultancy Services, Deutschland GmbH. The merged entity is a wholly
owned subsidiary of Tata Consultancy Services Limited.
Subscription to 100% share TCS e-Serve International Limited, the Indian subsidiary of TCS e-Servecapital of TCS e-Serve America, Inc. Limited, subscribed to 100% share capital of TCS e-Serve America, Inc.
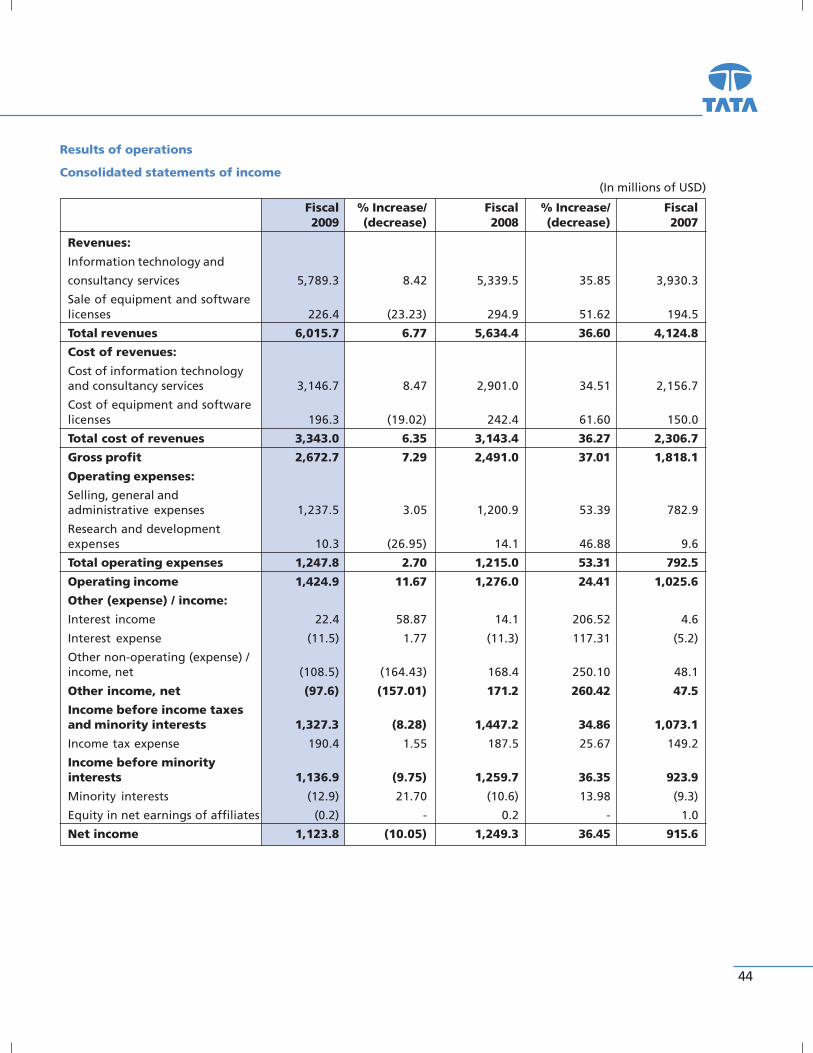
44
Results of operations
Consolidated statements of income(In millions of USD)
Fiscal % Increase/ Fiscal % Increase/ Fiscal2009 (decrease) 2008 (decrease) 2007
Revenues:
Information technology and
consultancy services 5,789.3 8.42 5,339.5 35.85 3,930.3
Sale of equipment and softwarelicenses 226.4 (23.23) 294.9 51.62 194.5
Total revenues 6,015.7 6.77 5,634.4 36.60 4,124.8
Cost of revenues:
Cost of information technologyand consultancy services 3,146.7 8.47 2,901.0 34.51 2,156.7
Cost of equipment and softwarelicenses 196.3 (19.02) 242.4 61.60 150.0
Total cost of revenues 3,343.0 6.35 3,143.4 36.27 2,306.7
Gross profit 2,672.7 7.29 2,491.0 37.01 1,818.1
Operating expenses:
Selling, general andadministrative expenses 1,237.5 3.05 1,200.9 53.39 782.9
Research and developmentexpenses 10.3 (26.95) 14.1 46.88 9.6
Total operating expenses 1,247.8 2.70 1,215.0 53.31 792.5
Operating income 1,424.9 11.67 1,276.0 24.41 1,025.6
Other (expense) / income:
Interest income 22.4 58.87 14.1 206.52 4.6
Interest expense (11.5) 1.77 (11.3) 117.31 (5.2)
Other non-operating (expense) /income, net (108.5) (164.43) 168.4 250.10 48.1
Other income, net (97.6) (157.01) 171.2 260.42 47.5
Income before income taxesand minority interests 1,327.3 (8.28) 1,447.2 34.86 1,073.1
Income tax expense 190.4 1.55 187.5 25.67 149.2
Income before minorityinterests 1,136.9 (9.75) 1,259.7 36.35 923.9
Minority interests (12.9) 21.70 (10.6) 13.98 (9.3)
Equity in net earnings of affiliates (0.2) - 0.2 - 1.0
Net income 1,123.8 (10.05) 1,249.3 36.45 915.6
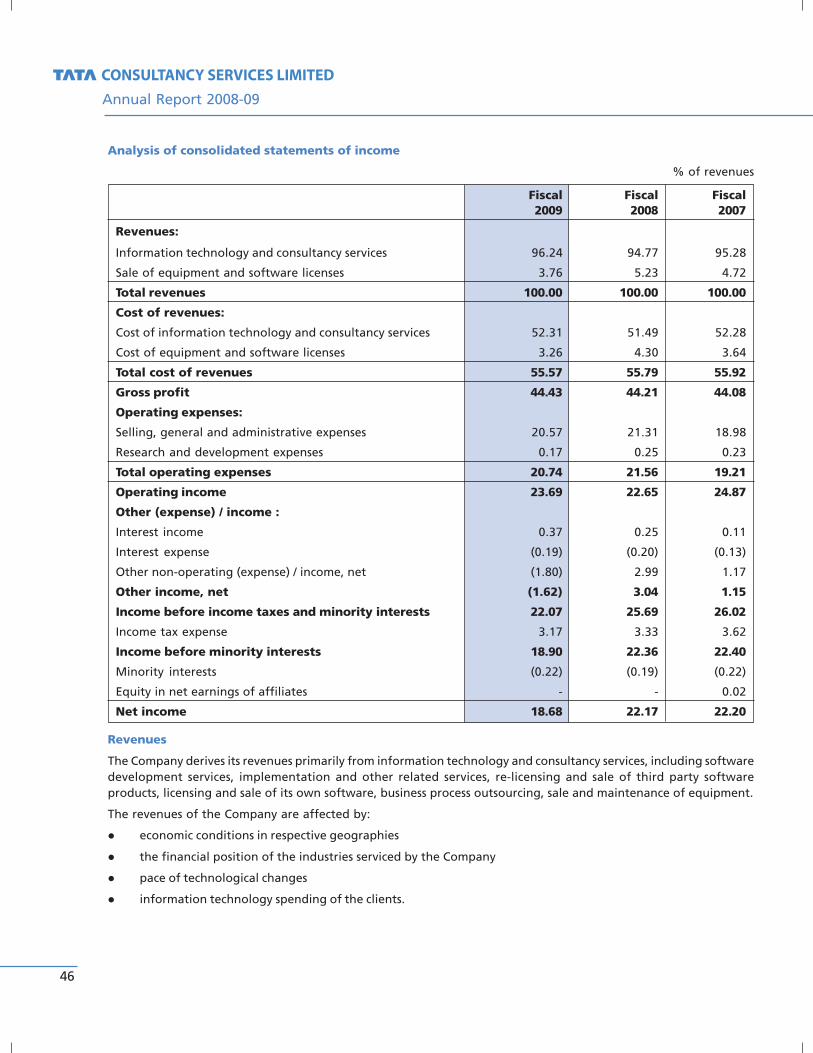
46
Annual Report 2008-09
Analysis of consolidated statements of income
% of revenues
Fiscal Fiscal Fiscal2009 2008 2007
Revenues:
Information technology and consultancy services 96.24 94.77 95.28
Sale of equipment and software licenses 3.76 5.23 4.72
Total revenues 100.00 100.00 100.00
Cost of revenues:
Cost of information technology and consultancy services 52.31 51.49 52.28
Cost of equipment and software licenses 3.26 4.30 3.64
Total cost of revenues 55.57 55.79 55.92
Gross profit 44.43 44.21 44.08
Operating expenses:
Selling, general and administrative expenses 20.57 21.31 18.98
Research and development expenses 0.17 0.25 0.23
Total operating expenses 20.74 21.56 19.21
Operating income 23.69 22.65 24.87
Other (expense) / income :
Interest income 0.37 0.25 0.11
Interest expense (0.19) (0.20) (0.13)
Other non-operating (expense) / income, net (1.80) 2.99 1.17
Other income, net (1.62) 3.04 1.15
Income before income taxes and minority interests 22.07 25.69 26.02
Income tax expense 3.17 3.33 3.62
Income before minority interests 18.90 22.36 22.40
Minority interests (0.22) (0.19) (0.22)
Equity in net earnings of affiliates - - 0.02
Net income 18.68 22.17 22.20
Revenues
The Company derives its revenues primarily from information technology and consultancy services, including softwaredevelopment services, implementation and other related services, re-licensing and sale of third party softwareproducts, licensing and sale of its own software, business process outsourcing, sale and maintenance of equipment.
The revenues of the Company are affected by:
� economic conditions in respective geographies
� the financial position of the industries serviced by the Company
� pace of technological changes
� information technology spending of the clients.

46
The revenues of the Company also depend on:
� the ability of the Company to secure business from existing and new clients
� delivery of products and services that meet the changing IT needs of these clients
� the proportion of work performed at overseas locations ('on-site') and the work performed at its facilities inIndia ('off-shore').
The Company provides its consultancy services on fixed-price-fixed-time basis and time & material basis. Whilebidding for fixed-price engagements, the Company endeavours to accurately estimate the costs and timing ofcompletion of the projects, based on the processes it plans to use, the employees it plans to deploy and past projectexperience. For such contracts, the Company bears the risk of cost and time overruns including delays caused byfactors beyond its control.
In fiscal 2009, continued volatility in foreign currency exchange rates affected the Company's business in general andits revenues in particular. TCS earns most of its revenues in US Dollar (USD), Sterling Pound (GBP), EURO and otherforeign currencies.
The table below shows the average rates and depreciation/(appreciation) of Indian Rupee vis-à-vis the major currencies.
Currency Fiscal Depreciation/ Fiscal Depreciation/2009 (appreciation) 2008 (appreciation)
of Indian Rupee of Indian Rupee
US Dollar 46.30 15.35% 40.14 (11.10)%Sterling Pound 78.33 (2.85)% 80.63 (6.30)%EURO 65.52 14.02% 57.46 (1.49)%
The composition of TCS revenues by major currencies is shown below:
% of revenues
Currency Fiscal 2009 Fiscal 2008
US Dollar 58.21 57.05Sterling Pound 15.58 16.65EURO 8.30 7.72Australian Dollar 1.74 2.58Canadian Dollar 1.19 1.05Others 5.79 5.11Total revenues in foreign currency 90.81 90.16Indian Rupee 9.19 9.84
Total 100.00 100.00
The Company has been earning more than 90% of its revenues in foreign currency. In fiscal 2009, TCS has incurred53.04% of its expenditure in foreign currency (49.40% in fiscal 2008).

48
Annual Report 2008-09
Composition and growth of Company’s revenues:(In millions of USD)
Fiscal % of Fiscal % of Fiscal % of2009 revenues 2008 revenues 2007 revenues
Information technology andconsultancy services 5,789.3 96.24 5,339.5 94.77 3,930.3 95.28
% increase/(decrease) 8.42 - 35.85 - - -
Sale of equipment and softwarelicenses 226.4 3.76 294.9 5.23 194.5 4.72
% increase/(decrease) (23.23) - 51.62 - - -
Total 6,015.7 100.00 5,634.4 100.00 4,124.8 100.00
% increase/(decrease) 6.77 - 36.60 - - -
Revenues from information technology and consultancy services constituted 96.24% of total revenues in fiscal 2009(94.77% in fiscal 2008).
Revenues from sale of equipment and licenses were 3.76% of the total revenues in fiscal 2009 (5.23% in fiscal 2008).
The growth in total revenues in fiscal 2009 has been mainly driven by the growth in information technology andconsultancy services.
The growth of 8.42% in IT services revenues has come through an increased demand in growing markets and multiplegeographies. The revenues from sale of equipment and software licenses decreased from $294.9 million in fiscal2008 to $226.4 million in fiscal 2009. The decrease is mainly due to reduction in the systems integration business inIndia during fiscal 2009. Revenues from existing clients constituted 97.10% of international revenues in fiscal 2009(96.40% of international revenues in fiscal 2008).
Revenues by segment
Geography-wise analysis of revenues% of revenues
Fiscal Fiscal Fiscal2009 2008 2007
Americas 51.32 50.34 52.28UK 19.05 19.88 20.32Europe 10.52 9.32 8.22India 7.87 9.07 9.03Asia Pacific 4.77 5.26 4.81Iberoamerica 4.68 4.45 3.87Middle East and Africa 1.79 1.68 1.47
Total 100.00 100.00 100.00
Industry practice-wise analysis of revenues% of revenues
Fiscal Fiscal Fiscal2009 2008 2007
Banking, financial services and insurance (BFSI) 43.31 44.62 43.99
Telecom 16.35 16.32 16.04
Manufacturing 10.10 9.92 12.74
Retail and distribution 8.82 6.52 5.88
Others 21.42 22.62 21.35
Total 100.00 100.00 100.00
Banking, financial services and insurance (BFSI) continues to be the Company’s largest industry practice.

48
Service practice-wise analysis of revenues% of revenues
Fiscal Fiscal Fiscal2009 2008 2007
Application development and maintenance (ADM) 48.46 48.34 52.23
Enterprise solutions 12.60 13.10 12.20
Business intelligence (BI) 8.13 9.66 9.46
Infrastructure services 8.04 6.54 6.04
Business process outsourcing (BPO) 6.89 6.23 5.81
Engineering and industrial services (EIS) 6.01 5.35 5.76
Assurance services 4.26 3.83 2.29
Asset leverage solutions 2.93 3.59 2.77
Global consulting 2.68 3.36 3.44
Total 100.00 100.00 100.00
The Company's relatively new service offerings such as infrastructure services, assurance services and business processoutsourcing have been showing significant growth. Engineering and industrial services (EIS) business is also growing.
Service location analysis of international revenues% of international revenues
Fiscal Fiscal Fiscal2009 2008 2007
On-site 51.19 53.87 55.66
Off-shore 44.22 41.92 40.54
Global Delivery Center (GDC) 4.59 4.21 3.80
Contract analysis of international revenues
% of international revenues
Fiscal Fiscal Fiscal2009 2008 2007
Time and material contracts 55.21 55.94 58.66
Fixed-price-fixed-time contracts 44.79 44.06 41.34
Expenditure
Cost of revenues (COR)
Cost of revenues of the Company consists of cost of information technology and consultancy services and cost ofequipment and software licenses.
Cost of information technology and consultancy services consists primarily of compensation of personnel engaged inproviding consultancy services, employee allowances, payroll related taxes, client specific training expenses, travelexpenses, amortisation of equipment and software used, rental expenses, losses incurred on fixed price contracts andcommunication expenses in relation to delivery of equipment and development of IT services. Cost of services alsoincludes payments to subcontractors, who are consultants hired on temporary basis in order to address specific skillrequirements.
Employee cost includes salaries, which comprise fixed component of employee compensation, variable compensationbased on the Economic Value Addition (EVA), foreign allowances, staff welfare cost and cost of contribution toretirement funds such as provident fund, social security benefits and other employee benefit funds.

50
Annual Report 2008-09
The Company engages in extensive training of new hires as well as periodic training of existing employees to upgradetheir skills. Training costs for existing employees are categorized as cost of services if training is related to a particularproject; otherwise, such costs are considered as selling, general and administrative expenses.
The Company's cost of revenues is shown below:(In millions of USD)
Fiscal % of Fiscal % of Fiscal % of2009 revenues 2008 revenues 2007 revenues
Cost of information technologyand consultancy services 3,146.7 52.31 2,901.0 51.49 2,156.7 52.28% increase/(decrease) 8.47 - 34.51 - - -Cost of equipment and softwarelicenses 196.3 3.26 242.4 4.30 150.0 3.64% increase/(decrease) (19.02) - 61.60 - - -
Total 3,343.0 55.57 3,143.4 55.79 2,306.7 55.92
% increase/(decrease) 6.35 - 36.27 - - -
Total cost of revenues increased from $3,143.4 million in fiscal 2008 to $3,343.0 million in fiscal 2009. Total cost ofrevenues as a percentage of total revenues has decreased from 55.79% in fiscal 2008 to 55.57% in fiscal 2009. Themain reason for the decrease in the cost of revenues as a percentage of total revenues in fiscal 2009 was a reductionin the cost of equipment and software licenses.
Cost of equipment and third party licenses
Cost of equipment and software licenses also includes inward shipping and insurance costs. Expenditure on account ofcost of equipment and software licenses has decreased to $196.3 million in fiscal 2009 (3.26% of revenues) from$242.4 million in fiscal 2008 (4.30% of total revenues). The decrease is on account of fewer systems integrationprojects executed by the Company during fiscal 2009.
Cost of services for information technology and consultancy services(In millions of USD)
Fiscal % of Fiscal % of Fiscal % of2009 revenues 2008 revenues 2007 revenues
Employee costs 2,692.4 44.76 2,456.5 43.60 1,830.7 44.38Depreciation 78.3 1.30 95.9 1.70 64.7 1.57Foreign travel 70.6 1.17 70.6 1.25 56.2 1.36Communication 57.0 0.95 51.0 0.91 33.7 0.82Other expenses 248.4 4.13 227.0 4.03 171.4 4.15Total 3,146.7 52.31 2,901.0 51.49 2,156.7 52.28
The total cost of services as a percentage of total revenues increased from 51.49% in fiscal 2008 to 52.31% infiscal 2009. This increase was mainly due to increase in employee costs (43.60% in fiscal 2008; 44.76% in fiscal 2009).
Details of the components of employee cost and the reasons for the increase are discussed below:
Employee cost(In millions of USD)
Fiscal % of Fiscal % of Fiscal % of2009 revenues 2008 revenues 2007 revenues
Salaries 1,257.9 20.91 1,180.3 20.95 1,249.8 30.30Foreign allowances 900.9 14.98 823.3 14.61 213.7 5.18Subcontractors 291.1 4.84 232.3 4.12 191.6 4.65Provident and other funds 92.8 1.54 81.6 1.45 79.7 1.93Staff welfare 87.5 1.45 75.9 1.35 50.9 1.23Legal expenses 62.2 1.04 63.1 1.12 45.0 1.09Total 2,692.4 44.76 2,456.5 43.60 1,830.7 44.38

50
Increase in employee costs is primarily attributable to:
� increase in headcount in fiscal 2009 (gross headcount additions were 48,595; net headcount additions were32,354)
� increase in foreign allowances paid out as a percentage of revenues (14.98% in fiscal 2009; 14.61% infiscal 2008)
� higher cost of subcontractors as a percentage of revenues (4.84% in fiscal 2009; 4.12% in fiscal 2008)
� increase in contribution to retirement funds as a percentage of revenues (1.54% in fiscal 2009; 1.45% infiscal 2008)
� increase in staff welfare costs as a percentage of revenues (1.45% in fiscal 2009; 1.35% in fiscal 2008).
Non-employee related costs
Since the Company increased its use of videoconferencing and teleconferencing facilities, communication expenses asa percentage of revenues increased to 0.95% in fiscal 2009 from 0.91% in fiscal 2008.
Depreciation expenses at 1.30% of revenues were lower in fiscal 2009 as compared to 1.70% in fiscal 2008. Thedecrease in depreciation of 0.40% as a percentage of revenues is primarily attributable to lower depreciation forcomputers in the current fiscal.
Other expenses as a percentage of revenues were at 4.13% in fiscal 2009 as compared to 4.03% in fiscal 2008.The increase is primarily attributable to:
� higher rent expenses in fiscal 2009 (1.66% in fiscal 2009; 1.22% in fiscal 2008)
� higher rates and taxes (0.12% in fiscal 2009; 0.09% in fiscal 2008)
� higher printing and stationery expenses (0.05% in fiscal 2009 ; 0.03% in fiscal 2008)
� lower software expenses for internal use (0.74% in fiscal 2009; 0.97% in fiscal 2008)
� lower travel and conveyance, freight costs, recruitment & training costs and other expenses (1.51% infiscal 2009; 1.68% in fiscal 2008).
Gross profit
(In millions of USD)
Fiscal % of Fiscal % of Fiscal % of2009 revenues 2008 revenues 2007 revenues
Gross profit 2,672.7 44.43 2,491.0 44.21 1,818.1 44.08
% increase/(decrease) 7.29 - 37.01 - - -
Gross profit increased to $2,672.7 million in fiscal 2009 (44.43% of revenues in fiscal 2009) from $2,491.0 million infiscal 2008 (44.21% of revenues in fiscal 2008). The increase in gross profit margin in fiscal 2009 compared to fiscal2008 is attributable to relatively higher growth in the IT and consultancy services.
Operating expenses
The Company's operating expenses include selling, general and administrative (SG&A) expenses and research anddevelopment (R&D) expenses.
The Company's SG&A expenses primarily comprise compensation for employees in sales, administration and otherfunctions not directly engaged in the delivery process. Also included are expenditure on depreciation and amortisationof client-related intangibles and software, insurance, utilities and rental expenses for administrative offices, businesspromotion expenses, allowances for uncollectible receivables, travel expenses, legal and professional fees and othergeneral expenses.

52
Annual Report 2008-09
Compensation and other costs relating to employees not allocated to client projects are included in SG&A expenses.Training costs for new hires are considered as SG&A expenses.
The Company's operating expenses are shown below:(In millions of USD)
Fiscal % of Fiscal % of Fiscal % of2009 revenues 2008 revenues 2007 revenues
Selling, general and administrative(SG&A) expenses 1,237.5 20.57 1,200.9 21.31 782.9 18.98
% Increase/(decrease) 3.05 - 53.39 - - -
Research and development (R&D)expenses 10.3 0.17 14.1 0.25 9.6 0.23
% Increase/(decrease) (26.95) - 46.88 - - -
Total 1,247.8 20.74 1,215.0 21.56 792.5 19.21
% Increase/(decrease) 2.70 - 53.31 - - -
Operating expenses have increased to $1,247.8 million in fiscal 2009 as compared to $1,215.0 million in fiscal 2008. Asa percentage of revenues operating expenses have decreased from 21.56% in fiscal 2008 to 20.74% in fiscal 2009.The decrease is attributable to a reduction in both R&D expenses and SG&A expenses as a percentage of revenues.SG&A expenses as a percentage of revenues decreased from 21.31% in fiscal 2008 to 20.57% in fiscal 2009. R&Dexpenses as a percentage of revenues decreased from 0.25% in fiscal 2008 to 0.17% in fiscal 2009.
Selling, general and administrative (SG&A) expenses
The main items of SG&A expenses are given in the table below:
(In millions of USD)
Fiscal % of Fiscal % of Fiscal % of2009 revenues 2008 revenues 2007 revenues
Employee costs 754.2 12.54 678.5 12.04 422.1 10.23
Rent and electricity 98.1 1.63 88.2 1.56 62.6 1.52
Travel and conveyance 60.0 1.00 81.0 1.44 56.8 1.38
Professional fees 42.0 0.70 36.2 0.64 31.4 0.76
Communication 31.7 0.53 32.0 0.57 23.6 0.57
Marketing and sales promotion 20.1 0.33 26.2 0.47 18.8 0.46
Other expenses 231.4 3.84 258.8 4.59 167.6 4.06
Total 1,237.5 20.57 1,200.9 21.31 782.9 18.98
SG&A expenses other than employeecosts 483.3 8.03 522.4 9.27 360.8 8.75
SG&A expenses other than employee costs, have decreased to 8.03% of revenues in fiscal 2009 from 9.27% infiscal 2008.
The decrease primarily consists of:
� lower travel and conveyance costs, 1.00% in fiscal 2009 (1.44% in fiscal 2008)
� lower marketing and promotion expenses, 0.33% in fiscal 2009 (0.47% in fiscal 2008)

52
� lower other expenses, 3.84% in fiscal 2009 (4.59% in fiscal 2008). Such decrease in other expenses is primarilyon account of:
� lower advertisement for the 'Experience certainty' campaign 0.15% in fiscal 2009 (0.33% in fiscal 2008)
� lower depreciation for computers in the current fiscal
� lower training and recruitment expenses, 0.45% in fiscal 2009 (0.77% of fiscal 2008) attributable tohigher utilisation of e-learning and increased use of in-house training
� higher rent and electricity costs, 1.63% in fiscal 2009 (1.56% in fiscal 2008) due to increase in the rent attributableto additional leased facilities taken during the year.
Employee costs
Employee costs as a percentage of total revenues increased to 12.54% in fiscal 2009 (12.04% in fiscal 2008). Expenditureon employees not allocated to projects is recognised as SG&A expense. Since the Company is scaling up operations forits current and future growth, the cost of employees currently unallocated as a percentage of total revenues hasshown an increase. Increase in payments (commissions) linked to volume of sales to certain categories of employeeshas shown a decrease. The details of employee costs in SG&A are shown in the table below:
(In millions of USD)
Fiscal % of Fiscal % of Fiscal % of2009 revenues 2008 revenues 2007 revenues
Salaries 529.9 8.82 503.3 8.92 325.2 7.88
Foreign allowances 137.4 2.28 99.0 1.76 37.7 0.91
Staff welfare 44.7 0.74 41.0 0.73 35.1 0.85
Provident and other funds 36.5 0.61 28.5 0.51 20.1 0.49
Commissions 5.7 0.09 6.7 0.12 4.0 0.10
Total 754.2 12.54 678.5 12.04 422.1 10.23
Research and development (R&D) expenses
The Company's R&D expenses include all expenditure incurred in various research and development centers in Indiawhich includes employee cost of research personnel, infrastructure maintenance costs and all other expenditurerequired to carry on the research and development activities.
R&D expenses in fiscal 2009 were $10.3 million ($14.1 million in fiscal 2008). This decline in R&D expenses in fiscal2009 is the effect of volatility in exchange rates explained earlier. A substantial portion of the R&D expenses isincurred by the Company in Indian Rupee. R&D expenses as a percentage of revenues were 0.17% in fiscal 2009(0.25% in fiscal 2008).
Operating income
The Company's operating income in fiscal 2009 was higher by 11.67% at $1,424.9 million as compared to$1,276.0 million in fiscal 2008. As a percentage of total revenues, the Company's operating profit margin was 23.69%in fiscal 2009 (22.65% in fiscal 2008).
Derivatives and financial instruments
Details of derivative financial instruments as at March 31, 2008 and March 31, 2009 are disclosed in item 25 of thenotes to consolidated financial statements. The policy on derivative financial instruments has been brought out initem 2(u) of the notes to consolidated financial statements.
Other (expense)/income
Other income includes interest and dividend income, foreign currency exchange gains and losses, profit/loss on sale ofinvestment, income from rent and income from miscellaneous sales and services. Other expense includes interestexpense on bank overdraft and debt.
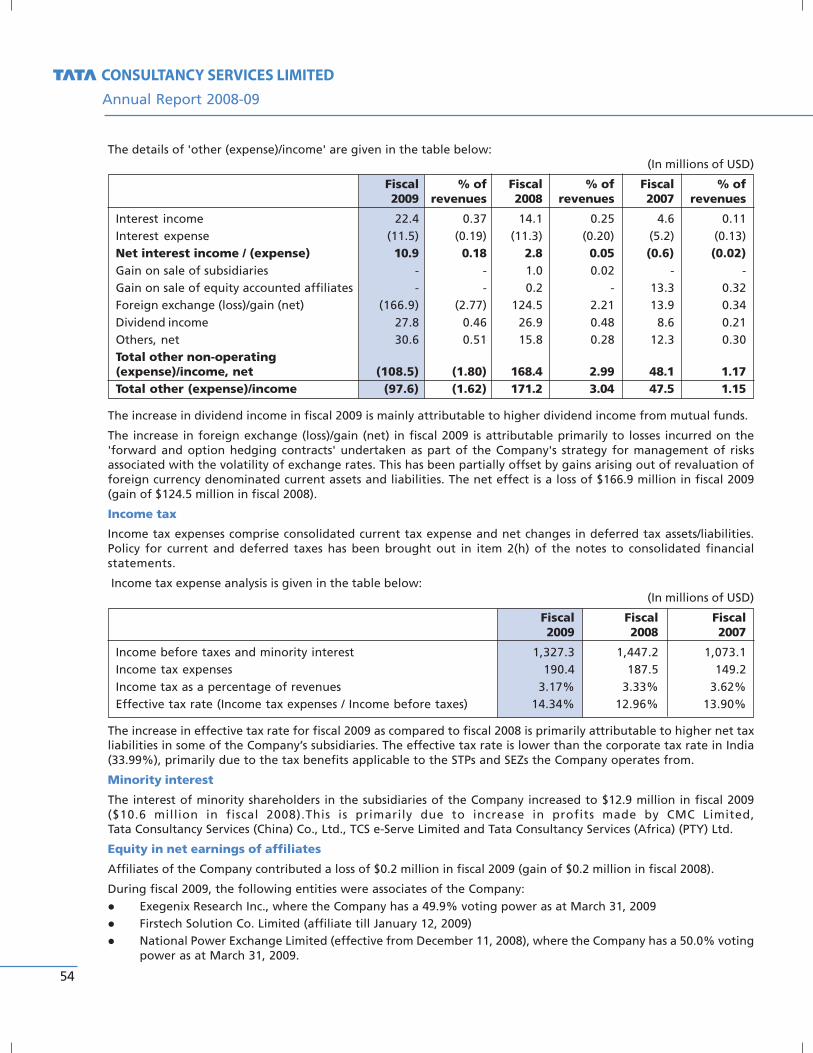
54
Annual Report 2008-09
The details of 'other (expense)/income' are given in the table below:(In millions of USD)
Fiscal % of Fiscal % of Fiscal % of2009 revenues 2008 revenues 2007 revenues
Interest income 22.4 0.37 14.1 0.25 4.6 0.11Interest expense (11.5) (0.19) (11.3) (0.20) (5.2) (0.13)Net interest income / (expense) 10.9 0.18 2.8 0.05 (0.6) (0.02)Gain on sale of subsidiaries - - 1.0 0.02 - -Gain on sale of equity accounted affiliates - - 0.2 - 13.3 0.32Foreign exchange (loss)/gain (net) (166.9) (2.77) 124.5 2.21 13.9 0.34Dividend income 27.8 0.46 26.9 0.48 8.6 0.21Others, net 30.6 0.51 15.8 0.28 12.3 0.30Total other non-operating(expense)/income, net (108.5) (1.80) 168.4 2.99 48.1 1.17Total other (expense)/income (97.6) (1.62) 171.2 3.04 47.5 1.15
The increase in dividend income in fiscal 2009 is mainly attributable to higher dividend income from mutual funds.
The increase in foreign exchange (loss)/gain (net) in fiscal 2009 is attributable primarily to losses incurred on the'forward and option hedging contracts' undertaken as part of the Company's strategy for management of risksassociated with the volatility of exchange rates. This has been partially offset by gains arising out of revaluation offoreign currency denominated current assets and liabilities. The net effect is a loss of $166.9 million in fiscal 2009(gain of $124.5 million in fiscal 2008).
Income tax
Income tax expenses comprise consolidated current tax expense and net changes in deferred tax assets/liabilities.Policy for current and deferred taxes has been brought out in item 2(h) of the notes to consolidated financialstatements.
Income tax expense analysis is given in the table below:(In millions of USD)
Fiscal Fiscal Fiscal2009 2008 2007
Income before taxes and minority interest 1,327.3 1,447.2 1,073.1Income tax expenses 190.4 187.5 149.2Income tax as a percentage of revenues 3.17% 3.33% 3.62%Effective tax rate (Income tax expenses / Income before taxes) 14.34% 12.96% 13.90%
The increase in effective tax rate for fiscal 2009 as compared to fiscal 2008 is primarily attributable to higher net taxliabilities in some of the Company’s subsidiaries. The effective tax rate is lower than the corporate tax rate in India(33.99%), primarily due to the tax benefits applicable to the STPs and SEZs the Company operates from.
Minority interest
The interest of minority shareholders in the subsidiaries of the Company increased to $12.9 million in fiscal 2009($10.6 million in fiscal 2008).This is primarily due to increase in profits made by CMC Limited,Tata Consultancy Services (China) Co., Ltd., TCS e-Serve Limited and Tata Consultancy Services (Africa) (PTY) Ltd.
Equity in net earnings of affiliates
Affiliates of the Company contributed a loss of $0.2 million in fiscal 2009 (gain of $0.2 million in fiscal 2008).
During fiscal 2009, the following entities were associates of the Company:� Exegenix Research Inc., where the Company has a 49.9% voting power as at March 31, 2009� Firstech Solution Co. Limited (affiliate till January 12, 2009)� National Power Exchange Limited (effective from December 11, 2008), where the Company has a 50.0% voting
power as at March 31, 2009.

54
The loss in fiscal 2009 of $0.2 million as well as the gain of $0.2 million in fiscal 2008 are primarily attributable to theoperations of Exegenix Research Inc., Canada.
Net income
The net income of the Company for fiscal 2009 was $1,123.8 million.
Financial position
Translation rates
The table below shows the exchange rates used for the translation of assets and liabilities from Indian Rupee to thereporting currency (US Dollar):
Currency As at As at CurrencyMarch 31, 2009 March 31, 2008 Change
US Dollar 50.74 40.11 26.50%
Sterling Pound 72.63 79.48 (8.62%)
EURO 67.57 63.33 6.70%
Australian Dollar 35.16 36.60 (3.93%)
Canadian Dollar 40.46 39.18 3.27%
Company’s debt
Short-term debt
Short-term debts are obligations that would be settled within one year under the terms of the underlying agreement.Cash credits and overdrafts are secured against accounts receivable and inventories. All other debts are unsecured.
The changes in short-term debt as at March 31 for the years ended 2009 and 2008 are shown below:
(In millions of USD)
As at As at Increase/March 31, 2009 March 31, 2008 (decrease)
Foreign currency bank loans 101.0 - 101.0
Cash credits and overdrafts 0.3 7.6 (7.3)
Current portion of long-term debt 0.2 0.3 (0.1)
Other short-term debt - 1.4 (1.4)
Total 101.5 9.3 92.2
The foreign currency loan of $100 million was an unsecured loan taken by the Company's subsidiary Tata AmericaInternational Corporation (TAIC) and is repayable on March 24, 2010. The increase in short-term debt is primarily onaccount of the reclassification of this foreign currency bank loan from long-term to short-term debt. The securedshort term debt as at March 31, 2009 for cash credits and overdraft is $0.3 million ($7.6 million as at March 31, 2008).
Long-term debt
Long-term debts are borrowings that will be paid or otherwise settled over a period of more than one year, or iflonger, more than one operating cycle.
The Company's long-term debt as at March 31, 2009 was $34.7 million ($142.8 million as at March 31, 2008).
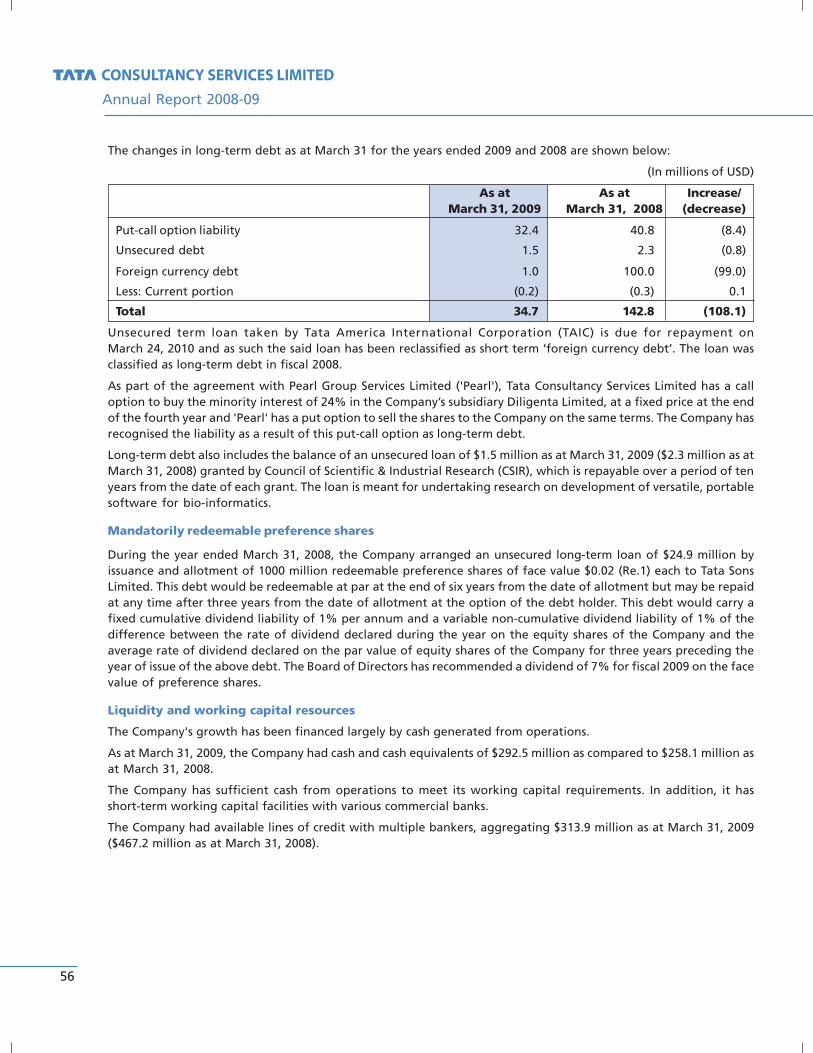
56
Annual Report 2008-09
The changes in long-term debt as at March 31 for the years ended 2009 and 2008 are shown below:
(In millions of USD)
As at As at Increase/March 31, 2009 March 31, 2008 (decrease)
Put-call option liability 32.4 40.8 (8.4)
Unsecured debt 1.5 2.3 (0.8)
Foreign currency debt 1.0 100.0 (99.0)
Less: Current portion (0.2) (0.3) 0.1
Total 34.7 142.8 (108.1)
Unsecured term loan taken by Tata America International Corporation (TAIC) is due for repayment onMarch 24, 2010 and as such the said loan has been reclassified as short term ‘foreign currency debt’. The loan wasclassified as long-term debt in fiscal 2008.
As part of the agreement with Pearl Group Services Limited ('Pearl'), Tata Consultancy Services Limited has a calloption to buy the minority interest of 24% in the Company’s subsidiary Diligenta Limited, at a fixed price at the endof the fourth year and 'Pearl' has a put option to sell the shares to the Company on the same terms. The Company hasrecognised the liability as a result of this put-call option as long-term debt.
Long-term debt also includes the balance of an unsecured loan of $1.5 million as at March 31, 2009 ($2.3 million as atMarch 31, 2008) granted by Council of Scientific & Industrial Research (CSIR), which is repayable over a period of tenyears from the date of each grant. The loan is meant for undertaking research on development of versatile, portablesoftware for bio-informatics.
Mandatorily redeemable preference shares
During the year ended March 31, 2008, the Company arranged an unsecured long-term loan of $24.9 million byissuance and allotment of 1000 million redeemable preference shares of face value $0.02 (Re.1) each to Tata SonsLimited. This debt would be redeemable at par at the end of six years from the date of allotment but may be repaidat any time after three years from the date of allotment at the option of the debt holder. This debt would carry afixed cumulative dividend liability of 1% per annum and a variable non-cumulative dividend liability of 1% of thedifference between the rate of dividend declared during the year on the equity shares of the Company and theaverage rate of dividend declared on the par value of equity shares of the Company for three years preceding theyear of issue of the above debt. The Board of Directors has recommended a dividend of 7% for fiscal 2009 on the facevalue of preference shares.
Liquidity and working capital resources
The Company's growth has been financed largely by cash generated from operations.
As at March 31, 2009, the Company had cash and cash equivalents of $292.5 million as compared to $258.1 million asat March 31, 2008.
The Company has sufficient cash from operations to meet its working capital requirements. In addition, it hasshort-term working capital facilities with various commercial banks.
The Company had available lines of credit with multiple bankers, aggregating $313.9 million as at March 31, 2009($467.2 million as at March 31, 2008).

56
Working capital
As at March 31, 2009, the Company had $1,192.5 million in working capital as compared to $1,290.6 million as atMarch 31, 2008.
The components of working capital are given below:(In millions of USD)
As at As at Increase/March 31, 2009 March 31, 2008 (decrease)
Current assets
Accounts receivable (net of allowances of$34.2 million and $28.0 million, respectively) 1,191.0 1,343.9 (152.9)
Prepaid expenses and other current assets(net of allowances of $5.9 million and $4.9 millionrespectively) 620.7 373.5 247.2
Cash and cash equivalents 292.5 258.1 34.4
Unbilled revenues 291.9 337.2 (45.3)
Inventories 7.1 10.6 (3.5)
Total 2,403.2 2,323.3 79.9
Current liabilities
Accrued expenses and other current liabilities 935.1 846.4 88.7
Unearned and deferred revenues 174.1 177.0 (2.9)
Short-term debt 101.5 9.3 92.2
Total 1,210.7 1,032.7 178.0
Excess of current assets over current liabilities 1,192.5 1,290.6 (98.1)
The current ratio was 1.98 as at March 31, 2009 (2.25 as at March 31, 2008).
Cash flows
The Company's cash flows from operating, investing and financing activities as reflected in the consolidated statementof cash flows are summarised below:
Cash flows summary
(In millions of USD)
Fiscal Fiscal Fiscal2009 2008 2007
Cash and cash equivalents at the beginning of the year 258.1 282.8 88.9
Net cash provided by operating activities 1184.9 985.6 778.0
Net cash used in investing activities (743.2) (680.6) (447.0)
Net cash used in financing activities (357.8) (353.0) (147.2)
Net increase / (decrease) in cash and cash equivalents 83.9 (48.0) 183.8
Exchange difference on translation of foreign currency cash andcash equivalents (49.5) 23.3 10.1
Cash and cash equivalents at the end of the year 292.5 258.1 282.8

58
Annual Report 2008-09
Cash flows from operating activities
(In millions of USD)
Fiscal Increase/ Fiscal Increase/ Fiscal2009 (decrease) 2008 (decrease) 2007
Net Income 1,123.8 (125.5) 1,249.3 333.7 915.6
Adjustments:
Depreciation and amortisation 124.5 (19.3) 143.8 47.3 96.5
Gain on account of equity accountedaffiliates/sale of subsidiary - 1.2 (1.2) 12.1 (13.3)
Other adjustments (52.7) 15.3 (68.0) (81.4) 13.4
Operating profit before working capitalchanges 1,195.6 (128.3) 1,323.9 311.7 1,012.2
Effect of working capital changes (10.7) 327.6 (338.3) (104.1) (234.2)
Cash generation from operations 1,184.9 199.3 985.6 207.6 778.0
Net cash provided by operating activities was $1,184.9 million in fiscal 2009 ($985.6 million in fiscal 2008) whichincluded net income of $1,123.8 million in fiscal 2009 ($1,249.3 million in fiscal 2008). Net cash provided by operatingactivities reflects adjustments for depreciation and amortisation of assets of $124.5 million in fiscal 2009($143.8 million in fiscal 2008).
Other adjustments include:
� deferred income taxes of $70.5 million in fiscal 2009 ($83.3 million in fiscal 2008)
� gain on sale of available-for-sale investments of $11.7 million in fiscal 2009 ($3.9 million in fiscal 2008)
� minority interests of $12.9 million in fiscal 2009 ($10.6 million in fiscal 2008)
� allowances for doubtful debts and advances of $16.1 million in fiscal 2009 ($4.6 million in fiscal 2008).
The details of the effect on cash flows as a result of changes in working capital are shown in the table below:
(In millions of USD)
Fiscal Fiscal Fiscal2009 2008 2007
Inventories 1.5 (0.3) 8.6
Unbilled revenues (13.5) (137.8) (68.5)
Accounts receivable (83.2) (266.0) (203.0)
Prepaid expenses and other current assets (78.9) (52.1) (25.7)
Other non-current assets (45.1) (14.9) (14.6)
Accrued expenses and other currentliabilities 159.7 137.9 45.3
Unearned and deferred revenues 40.6 1.6 33.7
Other non-current liabilities 8.2 (6.7) (10.0)
Effect of working capital changes (10.7) (338.3) (234.2)

58
Cash flows from investing activities
(In millions of USD)
Fiscal Increase/ Fiscal Increase/ Fiscal2009 (decrease) 2008 (decrease) 2007
Net sale/(purchase) of available-for-saleinvestments 211.8 544.1 (332.3) (215.2) (117.1)
Net purchase of property, plant andequipment (242.4) 58.3 (300.7) (37.9) (262.8)
Purchase of subsidiaries and business, netof cash acquired (including additionalconsideration) (497.9) (459.3) (38.6) 1.5 (40.1)
Proceeds from sale of investments inaffiliates - (0.9) 0.9 (16.8) 17.7
Bank deposits (net) (201.5) (196.1) (5.4) 26.7 (32.1)
Others (13.2) (8.7) (4.5) 8.1 (12.6)
Net cash used in investing activities (743.2) (62.6) (680.6) (233.6) (447.0)
Net cash used in investing activities primarily consists of:
� net purchase of properties of $242.4 million in fiscal 2009 ($300.7 million in fiscal 2008)
� purchase of subsidiaries and business (net of cash acquired) of $497.9 million primarily for the acquisition of thecaptive BPO unit of Citigroup Global Services Limited now renamed as TCS e-Serve Limited in fiscal 2009($38.6 million in fiscal 2008 primarily for the acquisition of remaining stake in 'TCS Do Brasil')
� reduction of investment in available-for-sale securities, net of disposals of $211.8 million in fiscal 2009 (increaseof investment in available-for-sale securities, net of disposals of $332.3 million in fiscal 2008)
� investments in bank fixed deposits, mostly short-term in nature, of $201.5 million in fiscal 2009 ($5.4 million infiscal 2008).
Cash flows from financing activities(In millions of USD)
Fiscal Increase/ Fiscal Increase/ Fiscal2009 (decrease) 2008 (decrease) 2007
Proceeds from issuance of long-term debt 1.0 1.0 - (99.7) 99.7
Net change in bank overdrafts and cash
credits (11.5) (4.9) (6.6) 2.2 (8.8)
Proceeds from issuance of mandatorilyredeemable preference shares withTata Sons Limited, net of expenses - (24.5) 24.5 24.5 -
Dividends paid (345.7) 24.3 (370.0) (128.1) (241.9)
Others (1.6) (0.7) (0.9) (4.7) 3.8
Net cash used in financing activities (357.8) (4.8) (353.0) (205.8) (147.2)
Net cash used in financing activities was $357.8 million in fiscal 2009 ($353.0 million in fiscal 2008).
This primarily consists of distribution of dividend of $345.7 million in fiscal 2009 ($370.0 million in fiscal 2008).
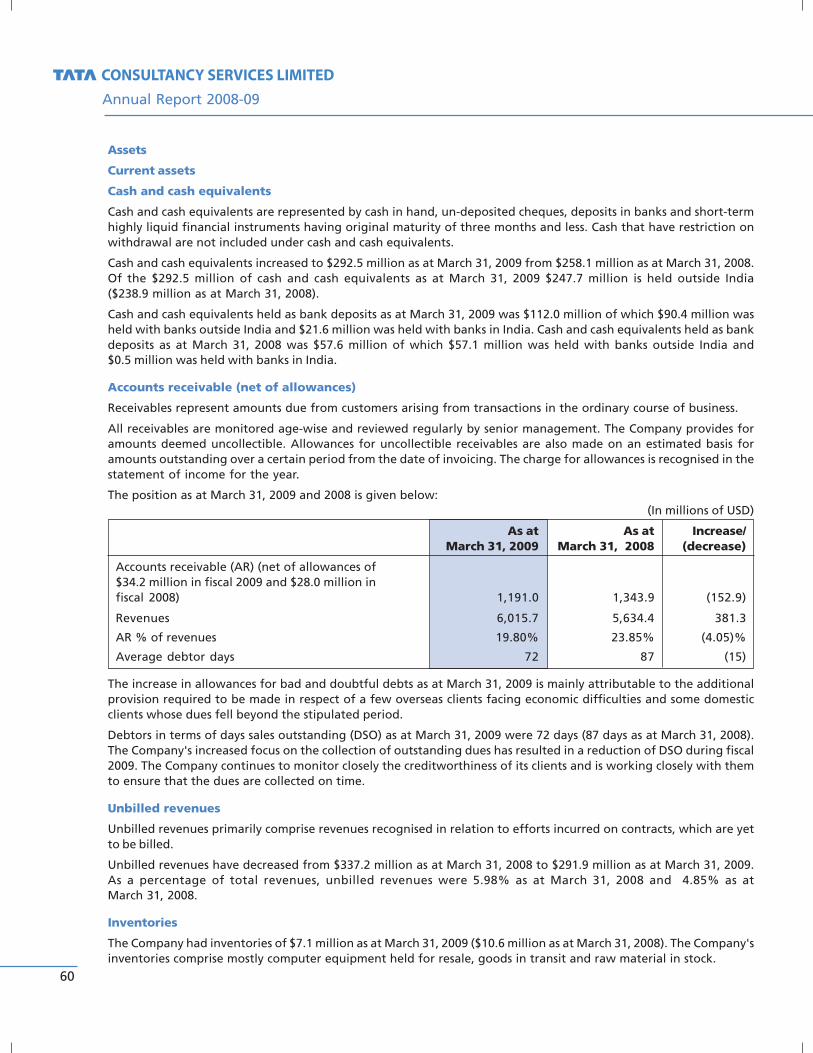
60
Annual Report 2008-09
Assets
Current assets
Cash and cash equivalents
Cash and cash equivalents are represented by cash in hand, un-deposited cheques, deposits in banks and short-termhighly liquid financial instruments having original maturity of three months and less. Cash that have restriction onwithdrawal are not included under cash and cash equivalents.
Cash and cash equivalents increased to $292.5 million as at March 31, 2009 from $258.1 million as at March 31, 2008.Of the $292.5 million of cash and cash equivalents as at March 31, 2009 $247.7 million is held outside India($238.9 million as at March 31, 2008).
Cash and cash equivalents held as bank deposits as at March 31, 2009 was $112.0 million of which $90.4 million washeld with banks outside India and $21.6 million was held with banks in India. Cash and cash equivalents held as bankdeposits as at March 31, 2008 was $57.6 million of which $57.1 million was held with banks outside India and$0.5 million was held with banks in India.
Accounts receivable (net of allowances)
Receivables represent amounts due from customers arising from transactions in the ordinary course of business.
All receivables are monitored age-wise and reviewed regularly by senior management. The Company provides foramounts deemed uncollectible. Allowances for uncollectible receivables are also made on an estimated basis foramounts outstanding over a certain period from the date of invoicing. The charge for allowances is recognised in thestatement of income for the year.
The position as at March 31, 2009 and 2008 is given below:(In millions of USD)
As at As at Increase/March 31, 2009 March 31, 2008 (decrease)
Accounts receivable (AR) (net of allowances of$34.2 million in fiscal 2009 and $28.0 million infiscal 2008) 1,191.0 1,343.9 (152.9)
Revenues 6,015.7 5,634.4 381.3
AR % of revenues 19.80% 23.85% (4.05)%
Average debtor days 72 87 (15)
The increase in allowances for bad and doubtful debts as at March 31, 2009 is mainly attributable to the additionalprovision required to be made in respect of a few overseas clients facing economic difficulties and some domesticclients whose dues fell beyond the stipulated period.
Debtors in terms of days sales outstanding (DSO) as at March 31, 2009 were 72 days (87 days as at March 31, 2008).The Company's increased focus on the collection of outstanding dues has resulted in a reduction of DSO during fiscal2009. The Company continues to monitor closely the creditworthiness of its clients and is working closely with themto ensure that the dues are collected on time.
Unbilled revenues
Unbilled revenues primarily comprise revenues recognised in relation to efforts incurred on contracts, which are yetto be billed.
Unbilled revenues have decreased from $337.2 million as at March 31, 2008 to $291.9 million as at March 31, 2009.As a percentage of total revenues, unbilled revenues were 5.98% as at March 31, 2008 and 4.85% as atMarch 31, 2008.
Inventories
The Company had inventories of $7.1 million as at March 31, 2009 ($10.6 million as at March 31, 2008). The Company'sinventories comprise mostly computer equipment held for resale, goods in transit and raw material in stock.

60
Prepaid expenses and other current assets
Prepaid expenses are prepayments made to secure the use of assets or receipt of services at a future date.
(In millions of USD)
As at As at Increase/March 31, 2009 March 31, 2008 (decrease)
Short-term bank deposits 222.7 12.3 210.4
Income taxes paid in advance 128.0 71.3 56.7
Prepaid expenses 95.8 113.4 (17.6)
Employee loans and advances (net of allowances of$3.8 million and $3.3 million respectively) 25.2 41.8 (16.6)
Others 149.0 134.7 14.3
Total 620.7 373.5 247.2
Prepaid and other current assets were higher at $620.7 million as at March 31, 2009 ($373.5 million as atMarch 31, 2008). The increase in fiscal 2009 is primarily attributable to short-term bank deposits $222.7 million as atMarch 31, 2009 ($12.3 million as at March 31, 2008).
Other changes in prepaid expenses and other current assets are:
� higher advance income taxes paid ($128.0 million as at March 31, 2009; $71.3 million as at March 31, 2008)
� lower prepaid expenses ($95.8 million as at March 31, 2009; $113.4 million as at March 31, 2008)
� lower employee advances ($25.2 million as at March 31, 2009 ; $41.8 million as at March 31, 2008)
� higher other current assets ($149.0 million as at March 31, 2009; $134.7 million as at March 31, 2008).
Investments
Investments stood at $340.1 million as at March 31, 2009 ($660.1 million as at March 31, 2008). Investments weremade primarily in various mutual funds. Investments available-for-sale, at fair value were $320.2 million as atMarch 31, 2009 ($655.9 million as at March 31, 2008). Other categories of investments held by the Company were'investments held-to-maturity, at amortised cost', $18.3 million as at March 31, 2009 ($3.3 million as atMarch 31, 2008) and 'investments available-for-sale at cost, net', $1.6 million as at March 31, 2009 ($0.9 million as atMarch 31, 2008).
Equity in affiliates
Equity in affiliates represents the Company's investments in other companies in which it has significant influence byvirtue of ownership of 20% to 50% in the equity capital. The Company recognises its percentage share of income orloss, dividend and any change in the investment percentage, as per the principles of equity method of accounting.
Equity in affiliates decreased to $0.3 million as at March 31, 2009 from $0.7 million as at March 31, 2008 due to theCompany's holding in Firstech Solution Co. Limited falling below the 20% threshold for equity accounting. The existingholding in Firstech Solution Co. Limited is now being accounted under investments.
Property, plant and equipment, net
Property, plant and equipment, net has decreased to $738.9 million as at March 31, 2009 from $753.3 million as atMarch 31, 2008. This includes capital work-in-progress of $125.1 million as at March 31, 2009 ($205.7 million as atMarch 31, 2008).
Significant increases are:
� land and buildings of $421.7 million as at March 31, 2009 ($389.0 million as at March 31, 2008)
� computer equipment of $269.2 million as at March 31, 2009 ($236.5 million as at March 31, 2008)
� furniture, fixtures and office equipment of $262.7 million as at March 31, 2009 ($239.5 million as atMarch 31, 2008).

62
Annual Report 2008-09
The Company determines the estimated useful life and related depreciation charge for property, plant and equipmentand these are expensed over such useful life. The useful life of computer equipment of the parent company has beenreviewed by the management and the original estimate of the useful life of these assets has been revised to fouryears from two years. The remaining depreciable amount is charged over the revised remaining useful life of theseassets.
Intangible assets
Intangible assets are defined as both current and non-current assets that lack physical substance and specificallyexclude financial instruments and deferred income tax assets. The Company's intangible assets constitutecustomer-related intangible assets, technology-related intangible assets, acquired contract rights and intellectualproperty rights.
Intangible assets are amortised over their respective estimated useful lives on a straight-line basis. The estimateduseful life of an identifiable intangible asset is based on a number of factors including the effects of obsolescence,demand, competition and other economic factors such as the stability of the industry, known technological advancesand the level of maintenance expenditure required to obtain the expected future cash flows from the asset.
Whenever events or circumstances indicate that the carrying amount of an asset with long life may not be recoverable,the Company subjects such an asset to a test of recoverability. If the asset is impaired, the Company recognises animpairment loss as the difference between the carrying value of the asset and its fair value, less cost to sell.
Intangible assets were $163.2 million as at March 31, 2009 ($90.6 million as at March 31, 2008). The increase inintangible assets primarily arose out of contract rights as a result of acquisition of Citigroup Global Services Limited.
The details of net carrying value of intangible assets as of March 31, 2009 and March 31, 2008 are given in the tablebelow:
(In millions of USD)
As at As at Increase/March 31, 2009 March 31, 2008 (decrease)
TCS e-Serve Limited (w.e.f. 31.12.2008) 107.1 - 107.1
Diligenta Limited 30.1 50.0 (19.9)
TCS FNS Pty Limited 14.5 22.0 (7.5)
Tata Consultancy Services Netherlands BV 7.9 11.6 (3.7)
Tata Consultancy Services Sverige AB - 1.3 (1.3)
TCS Iberoamerica SA 3.4 4.4 (1.0)
Others 0.2 1.3 (1.1)
Total 163.2 90.6 72.6

62
Goodwill
Goodwill is recognised as the excess of the cost of an acquired entity over the net amounts assigned to identifiableassets acquired (including identifiable intangibles) and liabilities assumed. Goodwill is tested for impairment periodically.
Goodwill was $510.6 million as at March 31, 2009 ($276.9 million as at March 31, 2008). During fiscal 2009$305.0 million has been added to goodwill arising out of the acquisition of equity interest in Citgroup Global ServicesLimited.
Details of changes in goodwill in fiscal 2009 and fiscal 2008 are given in the table below:
(In millions of USD)
As at As at Increase/March 31, 2009 March 31, 2008 (decrease)
TCS e-Serve Limited (w.e.f. 31.12.2008) 305.0 - 305.0
Diligenta Limited 71.3 98.7 (27.4)
Tata Consultancy Services Netherlands BV 51.8 61.4 (9.6)
TCS Iberoamerica SA 49.9 57.3 (7.4)
TCS FNS Pty Limited 2.8 3.9 (1.1)
Others 29.8 55.6 (25.8)
Total 510.6 276.9 233.7
As per the policy of the Company, impairment test has been carried out in respect of goodwill and it was not requiredto recognise any impairment loss in fiscal 2009.
Other non-current assets
Other non-current assets are assets that will not be realised in cash within a period of twelve months or the operatingcycle, if longer.
(In millions of USD)
As at As at Increase/March 31, 2009 March 31, 2008 (decrease)
Deferred income taxes 161.2 95.7 65.5
Prepaid rent and rent deposits 92.7 90.0 2.7
Long-term bank deposits 17.5 33.4 (15.9)
Non-current portion of employee costs 8.1 8.8 (0.7)
Others 51.7 31.0 20.7
Total 331.2 258.9 72.3
Other non-current assets have increased from $258.9 million as at March 31, 2008 to $331.2 million as atMarch 31, 2009. The increase is primarily attributable to:
� higher deferred taxes of $161.2 million as at March 31, 2009 ($95.7 million as at March 31, 2008)
� higher rent deposits of $67.5 million as at March 31, 2009 ($52.1 million as at March 31, 2008).

64
Annual Report 2008-09
Liabilities and shareholder’s equity
Liabilities
Current liabilities
Accrued expenses and other current liabilities
Accrued liabilities have their origin in the end-of-period adjustment process required by accrual accounting. Theseinclude amounts payable to suppliers, accrued expenses, salaries and incentives payable, benefits payable, interestpayable and taxes payable.
(In millions of USD)
As at As at Increase/March 31, 2009 March 31, 2008 (decrease)
Accounts payable including retentions and accruedexpenses 399.3 443.8 (44.5)
Taxes payable 230.2 214.0 16.2
Foreign currency derivative liabilities 136.2 47.9 88.3
Accrued payroll 126.5 120.4 6.1
Others 42.9 20.3 22.6
Total 935.1 846.4 88.7
The increase in fiscal 2009 is primarily attributable to the increase in foreign currency derivative liabilitiesof $136.2 million as at March 31, 2009 ($47.9 million as at March 31, 2008). Other changes in accrued expenses andother current liabilities were:
� lower accounts payable including retentions and accrued expenses of $399.3 million as at March 31, 2009($443.8 million as at March 31, 2008)
� higher income taxes payable of $115.3 million as at March 31, 2009 ($81.9 million as at March 31, 2008)
� lower indirect taxes payable of $66.8 million as at March 31, 2009 ($86.5 million as at March 31, 2008)
� higher deferred income taxes of $48.1 million as at March 31, 2009 ($45.6 million as at March 31, 2008)
� higher accrued payroll of $126.5 million as at March 31, 2009 ($120.4 million as at March 31, 2008)
� higher other current liabilities of $42.9 million as at March 31, 2009 ($20.3 million as at March 31, 2008).
Unearned and deferred revenues
Unearned and deferred revenues result from advance billing, customer prepayment and deferred maintenancerevenues in connection with the performance of services or the delivery of products.
Unearned and deferred revenues have decreased from $177.0 million as at March 31, 2008 to $174.1 million as atMarch 31, 2009.
Other non-current liabilities
Non-current liabilities represent obligations that are not expected to be liquidated within a period of twelve monthsor the current operating cycle, if longer.
Other non-current liabilities have increased from $18.8 million as at March 31, 2008 to $75.3 million as atMarch 31, 2009. The increase is primarily attributable to the increase in deferred income taxes.
Minority interests
The net worth of minority shareholders has increased from $57.3 million as at March 31, 2008 to $61.5 million as atMarch 31, 2009. This increase is primarily attributable to the higher profits of CMC Limited, Tata Consultancy Services(China) Co., Ltd., TCS e-Serve Limited and Tata Consultancy Services (Africa) (PTY) Ltd. for fiscal 2009.
64
Shareholders’ equity
Equity shares
Equity shares: par value $0.02 (Re.1) per share; authorized 1,200,000,000 equity shares; issued and fully paid-up978,610,498 equity shares. The issued and fully paid-up share capital remained unchanged at $21.5 million as atMarch 31, 2009.
Additional paid-in-capital
The additional paid-in-capital remained unchanged at $546.7 million as at March 31, 2009.
Accumulated other comprehensive (loss)/income (AOCI)
AOCI represents unrealised gains/losses that are included in accumulated comprehensive income but excluded fromthe income statement and not available for distribution.
Comprehensive income is reported in accordance with Statement of Financial Accounting Standard (SFAS) No. 130,Reporting Comprehensive Income. It includes unrealised gains and losses on available-for-sale securities, translationadjustments arising on consolidation of foreign subsidiaries, unrecognised actuarial gains/losses, effective portion ofloss/gain on derivative instruments and net income. Comprehensive income is reported in the statement ofshareholders' equity.
Balance in AOCI, as at March 31, 2008 was a net gain of $223.3 million, which has changed to a net loss of$556.5 million as at March 31, 2009.
Significant reasons for the change are:
� net foreign currency translation loss of $631.3 million arising out of revaluation of items in the income statementas well as the monetary assets and liabilities
� net loss of $140.9 million arising out of mark to market valuation of cash flow hedges taken for projectedrevenues.
Retained earnings
Retained earnings represent the cumulative earnings from the date of inception to the date of the financial statementless cumulative distribution to shareholders.
Retained earnings were $2,295.8 million as at March 31, 2008 and have increased to $3,073.9 million as atMarch 31, 2009. This increase is due to the addition of a net income of $1,123.8 million for fiscal 2009 and dividendpayouts of $345.7 million (including tax on dividend) during fiscal 2009.
Risks
Vulnerability from concentration occurs when entities fail to diversify in order to mitigate risks. The financial risks theCompany is exposed to, among others, are in the areas of
(a) credit concentration for credits extended to clients
(b) geographic concentration of credit risks
(c) concentration of cash and cash equivalents in geographies
(d) foreign exchange risks.
Concentration of credit risk
The Company is exposed to customer credit concentration risk, as detailed in item 5 of the notes to consolidatedfinancial statements.

66
Annual Report 2008-09
Client concentration analysis of international revenues
International revenues of the Company by client concentration are summarised below:
% of international revenues
Fiscal Fiscal Fiscal2009 2008 2007
Top client 4.67 6.53 6.62
Top 5 clients 18.57 18.86 18.52
Top 10 clients 26.86 29.13 28.44
TCS Limited aggregated credit exposure
Credit concentration with the Company's largest client has decreased to 4.90% as at March 31, 2009 from 6.60% asat March 31, 2008. The credit concentration with the Company's top five clients has also decreased to 16.70% as atMarch 31, 2009, from 17.30% as at March 31, 2008.
The Company's exposure to other clients is diversified and no other single client accounts for more than 2.00% ofoutstanding accounts receivable and unbilled revenues as at March 31, 2009 (2.00% as at March 31, 2008).
Geographic concentration of credit risk
The Company’s geographic concentration of credit risk with exposure to clients based in the United States of Americaas at March 31, 2009 was 39.60% of the total dues (37.80% of the total dues as at March 31, 2008) and in the UnitedKingdom as at March 31, 2009 was 16.5% of the total dues (18.20% of the total dues as at March 31, 2008).
Concentration of cash and cash equivalents in geographies
The Company has a geographic concentration of risk with respect to cash and cash equivalents held with banks inSouth Africa, the United Kingdom and the United States of America. The cash and cash equivalents held with banksin South Africa as at March 31, 2009 was 13.30% (14.40% as at March 31, 2008), in the United Kingdom as atMarch 31, 2009 was 10.60% (20.70% as at March 31, 2008) and in the United States of America as at March 31, 2009was 6.0% of the total balance (13.30% as at March 31, 2008).
Foreign exchange risk
The Company's revenues are largely denominated in foreign currency, predominantly US Dollar, Sterling Pound andEuro. In addition to these currencies the Company also does business in Australian Dollar, Canadian Dollar, SouthAfrican Rand, and Swiss Franc. Given the nature of the business a large proportion of the costs are denominated inIndian Rupee. This exposes the Company to profit/loss on currency fluctuations. To mitigate this risk, the Companyfollows a proactive hedging policy for all the above mentioned currencies. Net exposure is calculated for each currencyby deducting expected costs from revenues in that currency. The exposure is hedged as per the process laid down bythe Company.
As at March 31, 2009, the Company had hedge positions in various currencies, details of which have been brought outin item 25 of the notes to consolidated financial statements.
CAUTIONARY STATEMENT
Certain statements made in the Management Discussion and Analysis Report relating to the Company'sobjectives, projections, outlook, expectations, estimates, etc. may constitute 'forward looking statements'within the meaning of applicable laws and regulations. Actual results may differ from such expectations,projections, etc., whether express or implied. Several factors could make a significant difference to theCompany's operations. These include climatic conditions and economic conditions affecting demandand supply, government regulations and taxation, natural calamities, etc. over which the Company doesnot have any direct control.
66
This page has been intentionally left blank

68
Annual Report 2008-09
This page has been intentionally left blank


