39
Financial System in Poland 2018
Financial System in Poland 2018

Warsaw, 2019
Financial System in Poland 2018

This document contains the summary and the first chapter of a comprehensive report Rozwój systemu finansowego w Polsce w 2018 r. [Financial system development in Poland 2018], prepared by the Financial Stability Department. The report is available in Polish, together with its previous editions, on the NBP website: www.nbp.pl/systemfinansowy/rozwoj
Narodowy Bank Polski 00-919 Warszawa ul. Świętokrzyska 11/21 Tel.: +48 22 185 10 00 Fax.: +48 22 185 10 10 www.nbp.pl
© Copyright Narodowy Bank Polski, 2019
3Financial System in Poland 2018
Summary
Summary
3 Financial System in Poland 2018
Summary
At the end of 2018, the ratio of domestic financial system assets to GDP amounted to 128.7% and declined from the end of 2017 on the back of faster GDP growth. Compared with most economically developed countries, the Polish financial system, including the banking sector, is moderately developed. It comprises all types of financial institutions and markets, characteristic of well-developed market economies, as well as institutions that make up its infrastructure. However, the level of development of the individual segments of the financial system varies. Financial institutions, including the banking sector, are much better developed. On the other hand, financial markets are relatively less developed than markets in other countries. The assessments of both domestic and international institutions according to which there is room for continued sustainable development of the financial system that will support stable economic growth still remain. The pace of this growth should remain moderate and take place as the importance of financial markets grows.
The analyses of the individual segments of Poland’s financial system and of changes in its regulation and infrastructure presented in this study lead us to the following conclusions concerning the development of domestic financial institutions and markets.
Financial institutions
▪ In Poland, as in other countries of the region, the banking sector remained the largest part of the financial system. In 2018, the sector was developing at a pace comparable with the nominal pace of growth of the whole economy. Consequently, the ratio of bank assets to GDP remained at the level close to 90%.
▪ Banks active in Poland focused on the provision of traditional banking services, mainly to residents. This model was reflected in the balance-sheet structure of the banking sector, where operations with non-financial entities prevailed, and the structure of its net income from banking activity, in which net interest income prevailed. As in previous years, loans, including loans to households in particular, were the major item of banks’ assets. Treasury securities were also of great importance as they allowed banks to meet the liquidity standards as well as to reduce the tax base with the tax on certain financial institutions. Deposits of the non-financial sector were the major source of funding of domestic banks as their valued grew steadily despite relatively low interest rates. The relevance of the second largest funding source, i.e. funds raised in the financial sector, mainly a foreign financial sector, were diminishing due to the gradual repayment of FX housing loans and the related lower demand for foreign currency funding. The role of debt instruments in banks’ funding structure in Poland remained low because the availability of deposits was high and the cost of raising them was low.
▪ Banks in Poland run their business using low leverage. The year 2018 was another period in which the capital endowment of the banking sector improved. In addition to supervisory
This document contains the summary and the first chapter of a comprehensive report Rozwój systemu finansowego w Polsce w 2018 r. [Financial system development in Poland 2018], prepared by the Financial Stability Department. The report is available in Polish, together with its previous editions, on the NBP website: www.nbp.pl/systemfinansowy/rozwoj
Narodowy Bank Polski 00-919 Warszawa ul. Świętokrzyska 11/21 Tel.: +48 22 185 10 00 Fax.: +48 22 185 10 10 www.nbp.pl
© Copyright Narodowy Bank Polski, 2019
Summary
Narodowy Bank Polski4
SummarySummary
4 Narodowy Bank Polski
standards provided for in law, banks were also required to hold capital buffers, including the capital buffer for systemic risk as well as additional capital surcharges at banks with substantial exposures to FX housing loans.
▪ Despite the continued increase in the level of banking activity, the banking sector’s earnings in the last few years have remained below the 2011-2014 levels. This is shown in the falling profitability of the banking sector, which, however, remained higher than the EU average. Nevertheless, unlike in the period prior to 2014, banks posted, on average, lower rates of return on equity than domestic non-financial enterprises and other financial institutions.
▪ The trends indicated above were shaped by commercial banks, which accounted for over 90% of assets of the banking sector. The role of branches of credit institutions and cooperative banks was much lower. The latter were a particularly numerous and fragmented group of entities. Although the current condition of the cooperative banking sector was satisfactory, certain unfavourable trends can be identified, pointing to the needs to alter the sector’s organizational and business model.
▪ The first phase of establishing the institutional protection schemes (IPSs) was completed in 2018 and they took over the stabilising and control functions from the affiliating banks, which should support growth in the security of the cooperative banking sector and stimulate business change. At the end of 2018, two active IPSs – System Ochrony Zrzeszenia (Affiliation Protection Scheme) BPS and Spółdzielczy System Ochrony (Cooperative Protection Scheme) SGB, included 92% of cooperative banks, whose share in assets of the whole cooperative banking sector amounted to 87%.
▪ Banks’ consolidation activity on the Polish market has grown for several years. In 2018, the process of consolidation related to small and medium-sized banks and it did not lead to a substantial increase in asset concentration. Poland is still one of the EU countries with the lowest concentration of the banking sector.
▪ The size of the credit union sector has been gradually declining for several years, which leads to a decrease in the sector’s share in assets of the Polish financial sector. The fall in credit unions’ assets in 2018 was mainly driven by the dwindling number of credit unions and also curtailment of activity by credit unions which carried on business.
▪ The asset structure of the credit union sector remained substantially unchanged. Receivables due to loans and credits, mainly consumer loans, from credit union members remained the prevailing item of their assets. The quality of the loan portfolio of credit unions improved, nevertheless it is substantially lower than the banking sector average. Lending activity was fully funded with credit union members’ deposits and the surplus of funds were primarily deposited on accounts with the National Association of Credit Unions. At the same time, the liquidity position of the sector continued to be stable.
▪ As in 2017, credit unions posted a positive result for 2018, underpinned by net interest income. Low cost efficiency was the main factor negatively influencing the sector’s result. The credit union sector continued to have a deficit of capital despite its increase in 2018. As a result, the capital adequacy ratio at the end of the year was below the regulatory minimum of 5%. The
5Financial System in Poland 2018
SummarySummary
5 Financial System in Poland 2018
capital position of credit unions varied, and the sector’s capital adequacy ratio was primarily affected by the largest credit unions.
▪ In 2018, for the first time since 2011, the value of net assets of the investment funds sector declined and amounted to PLN 293.4 billion at the end of the year. The decrease followed a fall in the value of assets of closed-end funds. Households made the most withdrawals, in net terms, from the funds, but they were still the main investors in the institutions. The number of entities active in the domestic sector of investment funds decreased again in 2018. This mostly concerned closed-end funds. Closed-end funds continued to prevail in the sector in terms of the volume of funds. On the other hand, open-ended funds dominated in terms of the value of accumulated assets. Domestic Treasury securities had the highest share among investments of open-ended funds as shares not listed on organized markets – in the portfolio of closed-end funds. Towards the end of 2018, the portfolio fund was established for the first time in the history of the domestic sector of investment funds.
▪ Eighty companies were entered into the register of alternative investment fund managers at the end of December 2018, compared with four at the end of December 2017. No manager received a Polish Financial Supervision Authority (KNF) authorization to conduct business. As the number of registered managing entities rose, the number of alternative investment companies they manage also increased. At the end of the period under analysis, their number was higher than 90. The considerable portion of the sector of alternative investment companies was made up of new companies, often originating in the venture capital sector.
▪ Alternative investment company managers (being alternative investment companies) are only a fraction of the private equity sector, which in Poland is characterized by the diversity of structure and business models used to run business. According to Invest Europe, in 2018 the value of investments made by private equity sector entities in the domestic market amounted to approx. PLN 3.6 billion, i.e. the level reached 2-3 years ago. No transactions of such substantial values at the 2017 level were carried out in the period under analysis.
▪ At the end of 2018, the net value of assets of open pension funds (OFE) was PLN 157.3 billion, which means it was 12.5% lower. The value of contributions received by open pension funds slightly increased compared with 2017, but the value of transfer of funds under the security slider mechanism increased to a larger extent, mainly due to the lowering of the retirement age. The year 2018 saw one acquisition, therefore the number of active funds decreased to 10. Domestic equities continued to prevail in the structure of OFE investments, and the OFE stock portfolio largely reflected the structure of the WIG index. The financial results of the sector of open pension funds was negative in 2018 and stood at PLN 17 billion compared with a profit of PLN 28.4 billion in 2017. The average weighted rate of return was one of the lowest in the history of the sector. The increase of the financial result of the pension fund management companies (PTE) by 21.0% compared with 2017 amid a 3.1% rise in regulatory capital translated into better profitability of the companies.
▪ The value of assets accruing as part of contributions to the pension sector on a voluntary basis in 2018 grew insignificantly and amounted to PLN 23.8 billion at the end of the year. In relation
Summary
4 Narodowy Bank Polski
standards provided for in law, banks were also required to hold capital buffers, including the capital buffer for systemic risk as well as additional capital surcharges at banks with substantial exposures to FX housing loans.
▪ Despite the continued increase in the level of banking activity, the banking sector’s earnings in the last few years have remained below the 2011-2014 levels. This is shown in the falling profitability of the banking sector, which, however, remained higher than the EU average. Nevertheless, unlike in the period prior to 2014, banks posted, on average, lower rates of return on equity than domestic non-financial enterprises and other financial institutions.
▪ The trends indicated above were shaped by commercial banks, which accounted for over 90% of assets of the banking sector. The role of branches of credit institutions and cooperative banks was much lower. The latter were a particularly numerous and fragmented group of entities. Although the current condition of the cooperative banking sector was satisfactory, certain unfavourable trends can be identified, pointing to the needs to alter the sector’s organizational and business model.
▪ The first phase of establishing the institutional protection schemes (IPSs) was completed in 2018 and they took over the stabilising and control functions from the affiliating banks, which should support growth in the security of the cooperative banking sector and stimulate business change. At the end of 2018, two active IPSs – System Ochrony Zrzeszenia (Affiliation Protection Scheme) BPS and Spółdzielczy System Ochrony (Cooperative Protection Scheme) SGB, included 92% of cooperative banks, whose share in assets of the whole cooperative banking sector amounted to 87%.
▪ Banks’ consolidation activity on the Polish market has grown for several years. In 2018, the process of consolidation related to small and medium-sized banks and it did not lead to a substantial increase in asset concentration. Poland is still one of the EU countries with the lowest concentration of the banking sector.
▪ The size of the credit union sector has been gradually declining for several years, which leads to a decrease in the sector’s share in assets of the Polish financial sector. The fall in credit unions’ assets in 2018 was mainly driven by the dwindling number of credit unions and also curtailment of activity by credit unions which carried on business.
▪ The asset structure of the credit union sector remained substantially unchanged. Receivables due to loans and credits, mainly consumer loans, from credit union members remained the prevailing item of their assets. The quality of the loan portfolio of credit unions improved, nevertheless it is substantially lower than the banking sector average. Lending activity was fully funded with credit union members’ deposits and the surplus of funds were primarily deposited on accounts with the National Association of Credit Unions. At the same time, the liquidity position of the sector continued to be stable.
▪ As in 2017, credit unions posted a positive result for 2018, underpinned by net interest income. Low cost efficiency was the main factor negatively influencing the sector’s result. The credit union sector continued to have a deficit of capital despite its increase in 2018. As a result, the capital adequacy ratio at the end of the year was below the regulatory minimum of 5%. The
Narodowy Bank Polski6
SummarySummary
6 Narodowy Bank Polski
to household financial assets, they accounted for merely approx. 1.8%. Financial products available under Pillar III were, therefore, still not a very popular form of savings for future pensions among Poles. The percentage of persons saving for pension purposes in occupational pension schemes, on individual retirement accounts and on individual retirement security accounts in the population of professionally active persons remained at a low level of around 13%. In terms of value, the occupational pension schemes continued to be the most popular form of additional saving for retirement in 2018, and the amount of capital gathered was PLN 12.8 billion. The amount of PLN 8.7 billion was deposited on individual retirement accounts and PLN 2.3 billion – on individual retirement security accounts. In 2018, the value of all contributions made to all forms of accumulating savings on a voluntary basis amounted to PLN 3.5 billion. The largest inflow to Pillar III was reported for occupational pension schemes and individual retirement accounts (PLN 1.4 billion each). Among all entities managing voluntary savings for retirement purposes, investment funds received over half of the funds.
▪ The year 2018 saw a decline in the value of assets of the insurance sector by PLN 6.6 billion to PLN 191.8 billion. The value of assets of life insurance companies decreased, while assets of non-life insurance companies increased somewhat. As a result, the value of assets of life insurance was for the first time ever lower than the value of non-life insurance companies. The gross written premium of the whole sector decreased slightly, which resulted from a drop in the revenue in life insurance. Non-life insurance premium grew, mainly in compulsory third party liability motor insurance and comprehensive auto insurance.
▪ The technical result and financial result of the insurance sector improved in 2018, especially in non-life insurance. The domestic insurance sector reported a surplus in own funds over the capital requirements arising from the Solvency II Directive, i.e. the SCR ratio of own funds of life insurance was over three times and of non-life insurance – over three times higher than the minimum capital requirements.
▪ Leasing played a leading role among external non-bank corporate financing sources. In 2018, the value of funding from leasing companies was, at PLN 82.6 billion, 21.8% higher than a year earlier. This form of financing was mostly used by micro enterprises and small enterprises. Passenger car leasing grew at the fastest rate, and it developed especially in 2018 Q4. Th growth was related to the expected entry into force of regulatory changes aimed at limiting tax benefits for entrepreneurs, among others, due to leasing of this type of assets. At the end of the year, the value of active leasing agreements was PLN 146.6 billion (up PLN 27 billion on the 2017 figure), and the ratio of this value to loans granted to domestic enterprises was 43.6%.
▪ In 2018, the value of debt bought back by factoring services providers amounted to PLN 269.6 billion, i.e. it was by 21.6% higher than in 2017. The debt involved 15.5 million invoices. Enterprises continued to show big interest in non-recourse factoring, which means that they could use collateral against risk payment default by the counterparty. The turnover of factors in this market segment surged by 30.3%.
▪ According to Statistics Poland (GUS) data, the value of loans granted by lending companies in 2018 was PLN 13 billion (up 9.9% on the 2017 figure), of which the value of loan agreements
7Financial System in Poland 2018
SummarySummary
7 Financial System in Poland 2018
entered with natural persons was PLN 10 billion. The value of loans and advances granted in cooperation with credit intermediaries amounted to PLN 37.8 billion and was by 23.7% higher than in 2017. Mortgage loans were the most popular products offered by the intermediaries.
▪ Domestic investment firms carry on business primarily on the regulated markets and alternative trading systems organised by the WSE and BondSpot. Operating conditions for investment firms exacerbated in 2018 – the value of trading in shares on the WSE Main Market dropped substantially as enterprises were less interested in organising IPOs or debt securities issues. As a result, the provision of core investment services such as offering financial instruments and accepting, conveying and executing orders for the purchase or sale of such instruments was unprofitable. This made some service providers increase their involvement in operations in financial instruments on own account, including dealing in transactions initiated by detail clients via forex platforms. Taking into consideration the need to protect such clients, the European Securities and Markets Authority (ESMA) took the decision on product intervention; the application of the decision restricted the possibility of taking risks related to CFDs by retail clients. Moreover, in early 2018 investment firms were required to comply with the MiFID II/MiFIR requirements relating to handling retail clients and developing financial products.
▪ In 2018, debt collection agencies accepted for processing debt with the nominal value of PLN 29.8 billion (which represented a 21.4% increase on the 2017 figure) and processed other than own debts of securitisation funds of the value of PLN 17.6 billion (46.7% more than in 2017). Consumer debts and outsourced debts prevailed in the structure of debts processed.
Financial markets and their infrastructure
▪ In 2018, the liquidity of all segments of the domestic market for interbank deposits transactions diminished. Unsecured interbank deposits still played an important role in managing liquidity at domestic banks.
▪ The value and term structure of turnover on the market for unsecured interbank deposits was determined by, among others, a small number of entities with excess liquidity and low credit limits imposed by banks on a reciprocal basis. O/N transactions accounted for over 90% of the market turnover value. Operations with maturities over seven days were concluded occasionally, which was associated with, among others, the prudential liquidity requirements arising from the CRD IV/CRR and the manner of calculating the tax on certain financial institutions. In 2018, the number of participants in WIBOR and WIBID reference rate fixing declined. At the end of the year, quotes for WIBOR and WIBID reference rate calculation were submitted by only ten banks. The number of participants in POLONIA rate fixing dropped to 19.
▪ In 2018, the average daily value of transactions in the domestic FX swap market of the zloty grew to PLN 14.6 billion, with the operations accounting for merely around 17% of the turnover in the global FX swap market. The rise in activity on this market was supported by, among others, global institutions’ investors searching for high yield assets as part of implementing their investment strategies such as carry trade. Transactions with non-residents prevailed in the
Summary
6 Narodowy Bank Polski
to household financial assets, they accounted for merely approx. 1.8%. Financial products available under Pillar III were, therefore, still not a very popular form of savings for future pensions among Poles. The percentage of persons saving for pension purposes in occupational pension schemes, on individual retirement accounts and on individual retirement security accounts in the population of professionally active persons remained at a low level of around 13%. In terms of value, the occupational pension schemes continued to be the most popular form of additional saving for retirement in 2018, and the amount of capital gathered was PLN 12.8 billion. The amount of PLN 8.7 billion was deposited on individual retirement accounts and PLN 2.3 billion – on individual retirement security accounts. In 2018, the value of all contributions made to all forms of accumulating savings on a voluntary basis amounted to PLN 3.5 billion. The largest inflow to Pillar III was reported for occupational pension schemes and individual retirement accounts (PLN 1.4 billion each). Among all entities managing voluntary savings for retirement purposes, investment funds received over half of the funds.
▪ The year 2018 saw a decline in the value of assets of the insurance sector by PLN 6.6 billion to PLN 191.8 billion. The value of assets of life insurance companies decreased, while assets of non-life insurance companies increased somewhat. As a result, the value of assets of life insurance was for the first time ever lower than the value of non-life insurance companies. The gross written premium of the whole sector decreased slightly, which resulted from a drop in the revenue in life insurance. Non-life insurance premium grew, mainly in compulsory third party liability motor insurance and comprehensive auto insurance.
▪ The technical result and financial result of the insurance sector improved in 2018, especially in non-life insurance. The domestic insurance sector reported a surplus in own funds over the capital requirements arising from the Solvency II Directive, i.e. the SCR ratio of own funds of life insurance was over three times and of non-life insurance – over three times higher than the minimum capital requirements.
▪ Leasing played a leading role among external non-bank corporate financing sources. In 2018, the value of funding from leasing companies was, at PLN 82.6 billion, 21.8% higher than a year earlier. This form of financing was mostly used by micro enterprises and small enterprises. Passenger car leasing grew at the fastest rate, and it developed especially in 2018 Q4. Th growth was related to the expected entry into force of regulatory changes aimed at limiting tax benefits for entrepreneurs, among others, due to leasing of this type of assets. At the end of the year, the value of active leasing agreements was PLN 146.6 billion (up PLN 27 billion on the 2017 figure), and the ratio of this value to loans granted to domestic enterprises was 43.6%.
▪ In 2018, the value of debt bought back by factoring services providers amounted to PLN 269.6 billion, i.e. it was by 21.6% higher than in 2017. The debt involved 15.5 million invoices. Enterprises continued to show big interest in non-recourse factoring, which means that they could use collateral against risk payment default by the counterparty. The turnover of factors in this market segment surged by 30.3%.
▪ According to Statistics Poland (GUS) data, the value of loans granted by lending companies in 2018 was PLN 13 billion (up 9.9% on the 2017 figure), of which the value of loan agreements

Narodowy Bank Polski8
SummarySummary
8 Narodowy Bank Polski
interbank market, accounting for over 90% of net turnover. An increase in the share of EUR/PLN operations was observed in the currency structure of FX swaps of the zloty, which could have been affected by the costs of obtaining euro which were lower than the cost of obtaining the US dollar.
▪ In 2018, the average daily turnover on the domestic market for conditional transactions rose to PLN 15.6 billion from 2017. Activity in the domestic market of repo transactions rose substantially. Conditional transactions were collateralised by Treasury bonds, and most such transactions were concluded for less than a week, which stemmed from the use of repo/SBB transactions mainly for managing liquidity on a daily basis. The fact that the domestic market for conditional transactions is highly fragmented poses a big problem.
▪ In 2018, the average annual value of outstanding NBP bills, which reflected the scale of excess liquidity of the domestic banking sector, was PLN 88 billion and was 21% higher than in 2017. No Treasury bills were issued by the Ministry of Finance in 2018. The debt of domestic enterprises due to short-term debt securities dropped to PLN 8.3 billion at the end of 2018, which was mainly related to the redemption of the instruments by one of the companies from a capital group member.
▪ Treasury bonds continued to prevail on the domestic market for long-term debt instruments. The value of marketable outstanding Treasury bonds denominated in the zloty increased by PLN 21.5 billion and amounted to PLN 627.2 billion at the end of 2018. Domestic banks were dominant in the structure of buyers of zloty-denominated Treasury bonds as the value of the bonds they held amounted to PLN 264.1 billion at the end of the year. The liquidity of the secondary market for domestic Treasury bonds was high – the average daily value of transactions on the market in 2018 amounted to PLN 27.4 billion, including for conditions transactions – PLN 11.5 billion.
▪ Corporate bonds were the main segment of the domestic long-term non-Treasury debt securities – long-term securities debt increased to PLN 85.9 billion at the end of 2018. However, the increase primarily stemmed from the PLN 10 billion bond issues of a capital group. In 2018, the value of the remaining issues of long-term corporate debt securities was less than PLN 11 billion and was half as much as in 2017. The operation of the market was heavily affected by the fact that GetBack SA ceased to meet its obligations towards its bondholders in the second half of 2018, which led, among others, to a rise in investors’ aversion to the instruments and to a reduction in the value of new issues of long-term corporate debt securities. The transparency of the corporate bond market was limited, and it was also highly segmented. Industry-wise, the issuer diversification was low, as was its liquidity. A substantial portion of the instruments was non-marketable: it was neither registered with KDPW nor was it assigned LEI codes, and issues of the instruments were used for transferring funds within a capital group.
▪ Towards the end of 2018, in order to enhance transparency and restore confidence in the corporate bond market, the legislator introduced mandatory dematerialisation and registration of non-Treasury bonds issued after 30 June 2019 with the depository managed by KDPW. The mandate also includes the obligation to create a database with profiles of non-Treasury bonds

9Financial System in Poland 2018
SummarySummary
9 Financial System in Poland 2018
issued by the end of June 2019. KDPW is also required to make publicly available information on the value of outstanding non-redeemed bonds issued by an issuer. Moreover, under the new law, the issuer is required to sign an agreement with an issue agent (a custodian bank or an investment firm which operates securities accounts). The solutions may reduce the ability of some enterprises to use non-marketable bonds for liquidity management within a capital group.
▪ The value of outstanding municipal bonds grew by PLN 3 billion to PLN 23.1 billion at the end of December 2018. The growth in interest into municipal bond issues was driven by the local government units seeking to complete investments before the local government elections, amid good economic conditions and with the utilisation of EU funding. The municipal bond market was highly fragmented (which stemmed from the insignificant borrowing needs of small local government units and the fact that bond issues were split into a number of series) and exhibited low liquidity and a dominant share of banks in the structure of municipal bond buyers. They often bought the instruments as an alternative to providing a loan to local government units.
▪ At the end of 2018, the Polish stock market capitalisation declined to PLN 1,135.9 billion. The decrease was primarily driven by falling equity instruments – the WIG Index shrank by 9.5%, which was in line with the trends in the global markets. The promotion of Poland by the index provider FTSE Russell and Stoxx from Emerging Market to Developed Market status and the associated rebuilding of portfolios by global investors had a minor influence on the price volatility of shares listed on the WSE.
▪ In the period under consideration, a record number of companies (25) were delisted from the WSE Main Market, which led to a PLN 15.6 billion decline in the capitalisation value of this market. According to the main shareholders in the delisted companies, as there was no demand for raising capital, the costs arising from the public company status outnumbered the status-related benefits. The ratio of the capitalisation of domestic companies to Poland’s GDP decreased to 27.4% at the end of December 2018. Domestic stock market liquidity was low compared to stock exchanges in developed countries. This was, among others, due to the continued trading in securities of a relatively large number of companies with low capitalisation and low free float.
▪ The value of shares (of both old and new issues) sold in IPOs on the WSE Main Market was one of the lowest in the history of the market. On the other hand, the value of shares issued companies already present on the WSE Main Market rose markedly, and with the issue of one company accounting for nearly 40% of the amount. Non-residents were the most active investors as their share in the session turnover in shares and allotment certificates rose to a record high of 59%, which was accompanied by a fall to 12% of the share of individual investors.
▪ A strong fall in share prices in 2018 contributed to a significant drop in the capitalisation of NewConnect. The shares of 15 companies were floated on NewConnect, and a record high of 36 companies was delisted, mostly due to liquidation bankruptcy.
▪ In April 2018, the average daily turnover on the global spot market for the Polish zloty amounted to approx. USD 11 billion, which represented an 8% increase on the April 2017 figure. The vast majority (82%) of transactions were concluded in the offshore market. The EUR/PLN
Summary
8 Narodowy Bank Polski
interbank market, accounting for over 90% of net turnover. An increase in the share of EUR/PLN operations was observed in the currency structure of FX swaps of the zloty, which could have been affected by the costs of obtaining euro which were lower than the cost of obtaining the US dollar.
▪ In 2018, the average daily turnover on the domestic market for conditional transactions rose to PLN 15.6 billion from 2017. Activity in the domestic market of repo transactions rose substantially. Conditional transactions were collateralised by Treasury bonds, and most such transactions were concluded for less than a week, which stemmed from the use of repo/SBB transactions mainly for managing liquidity on a daily basis. The fact that the domestic market for conditional transactions is highly fragmented poses a big problem.
▪ In 2018, the average annual value of outstanding NBP bills, which reflected the scale of excess liquidity of the domestic banking sector, was PLN 88 billion and was 21% higher than in 2017. No Treasury bills were issued by the Ministry of Finance in 2018. The debt of domestic enterprises due to short-term debt securities dropped to PLN 8.3 billion at the end of 2018, which was mainly related to the redemption of the instruments by one of the companies from a capital group member.
▪ Treasury bonds continued to prevail on the domestic market for long-term debt instruments. The value of marketable outstanding Treasury bonds denominated in the zloty increased by PLN 21.5 billion and amounted to PLN 627.2 billion at the end of 2018. Domestic banks were dominant in the structure of buyers of zloty-denominated Treasury bonds as the value of the bonds they held amounted to PLN 264.1 billion at the end of the year. The liquidity of the secondary market for domestic Treasury bonds was high – the average daily value of transactions on the market in 2018 amounted to PLN 27.4 billion, including for conditions transactions – PLN 11.5 billion.
▪ Corporate bonds were the main segment of the domestic long-term non-Treasury debt securities – long-term securities debt increased to PLN 85.9 billion at the end of 2018. However, the increase primarily stemmed from the PLN 10 billion bond issues of a capital group. In 2018, the value of the remaining issues of long-term corporate debt securities was less than PLN 11 billion and was half as much as in 2017. The operation of the market was heavily affected by the fact that GetBack SA ceased to meet its obligations towards its bondholders in the second half of 2018, which led, among others, to a rise in investors’ aversion to the instruments and to a reduction in the value of new issues of long-term corporate debt securities. The transparency of the corporate bond market was limited, and it was also highly segmented. Industry-wise, the issuer diversification was low, as was its liquidity. A substantial portion of the instruments was non-marketable: it was neither registered with KDPW nor was it assigned LEI codes, and issues of the instruments were used for transferring funds within a capital group.
▪ Towards the end of 2018, in order to enhance transparency and restore confidence in the corporate bond market, the legislator introduced mandatory dematerialisation and registration of non-Treasury bonds issued after 30 June 2019 with the depository managed by KDPW. The mandate also includes the obligation to create a database with profiles of non-Treasury bonds
Narodowy Bank Polski10
SummarySummary
10 Narodowy Bank Polski
exchange rate was largely determined by developments in the global financial markets and, only to a small extent, reflected the flows arising from Poland’s trade exchange or non-resident investments in the domestic capital market.
▪ The value of transactions in zloty-denominated OTC derivatives in the offshore market was substantially higher than in the domestic market, which was primarily attributable to the high activity of London-based banks and foreign hedge funds. OTC interest rate derivatives prevailed in terms of turnover value in Poland. Investor activity on the market for exchange-traded derivatives continued to be significantly lower than on the OTC market and concentrated in the segment of WIG20 futures.
▪ Turnover in the domestic market of OTC interest rate derivatives rose substantially. The IRS market remained its most liquid segment, as turnover on this market amounted to PLN 2.8 billion (22% more than in 2017). In 2018, growing activity was also observed on the domestic FA market for the first time since 2013. Average daily turnover on the market rose by over 40% to PLN 1.7 billion.
▪ The domestic OIS market in the period under analysis basically ceased to operate – occasional transactions were concluded on the market in certain months of the year. The lack of a liquid OIS market may adversely impact other segments of the domestic financial market. The commonly applied standard on global OTC derivatives market is the use of OIS curves, which are the approximation of risk-free interest rates for discounting future cash flows and for pricing financial instruments. Moreover, in certain jurisdictions OIS rates tend to become the basic money market benchmarks, replacing the reference rates calculated on the basis of quotations of unsecured interbank deposits (so-called -IBOR rates).
▪ The vast majority of transactions in OTC interest rate derivatives were cleared by domestic banks at CCP, which was related to the gradual implementation in the EU of the central clearing obligation for selected classes of OTC derivatives. In 2018, over 80% of FRAs and almost 75% of zloty denominated IRSs concluded in the domestic market were submitted for clearing at CCP. In transactions between domestic banks, they mainly used the services of the domestic CCP, due, among others, to their direct access to the clearing system and the possibility to establish collateral in the form of cash in zloty and domestic government bonds. The house accepted for clearing 1,463 transactions in zloty denominated OTC interest rate derivatives of the nominal value of PLN 160 billion. The vast majority of zloty denominated FRAs and IRSs concluded with non-residents were submitted for clearing by a CCP in London.

11Financial System in Poland 2018
Directions of the evolution of Poland’s financial systemDirections of the evolution of Poland’s financial system
11 Financial System in Poland 2018
1. Directions of the evolution of Poland’s financial system
In 2018, the economic situation in the world, like in 2018, was favourable. The growth rate of the global economy, measured by GDP growth, declined somewhat from 3.2% in 2017 to 3.0% in 2018. In euro area countries, the slowdown in GDP growth was bigger (from 2.5% in 2017 to 1.9% in 2018). However, in the United States the upward trend continued, and GDP growth grew from 2.1% in 2017 to 2.9% in 2018.1
Poland’s GDP growth amounted to 5.1% compared with 4.9% in 2017, as consumer demand was the main driver of economic growth. Household consumption continued to show robust dynamics and increased, like in 2017, by 4.5%. The growth in investment outlays was also favourable, and almost doubled (12.2% in 2018) on the 2017 figure (6.5%).2
The rate at which prices were growing in 2018 was lower than a year ago. The annual CPI index for 2018 was 1.6% y/y (in 2017 it was 2.0%) and, like in 2017, the level of CPI was mainly determined by changes in energy and food prices.3
In 2018, the earnings of enterprises were lower than in 2017. Their basic economic and financial indicators also declined. Corporate investment activity improved (investment outlays rose by 11.8%).4
The financial situation of households improved in 2018, although the extent of changes was lower than in 2017. Household income was higher and average monthly disposable income per capital was 4.3% higher in real terms than in 2017.5 Poland’s registered unemployment rate shrank to 5.8% from 6.6% in 2017. In 2018, the total employment rate rose by 1.3 percentage points to 67.4%.6 Household financial assets also increased (by 5.8%) and the savings (bank deposits) growth rate stood at 10%.
The monetary policy of central banks varied in the period under consideration. In Poland, in view of current inflation and inflation forecasts, the rate-setting Monetary Policy Council (MPC) kept
1 https://data.worldbank.org/indicator/NY.GDP.MKTP.KD.ZG and
https://ec.europa.eu/eurostat/databrowser/view/tec00115/default/table?lang=en. 2 Annual macroeconomic indicators, Warsaw, GUS, data as of 23 September 2019 https://bdm.stat.gov.pl/. 3 Report on monetary policy in 2018, Warsaw, May 2019, NBP, pp. 23-25. 4 Financial results of economic entities I-XII 2018, Warsaw 2019, GUS, p. 12. 5 Sytuacja gospodarstw domowych w 2018 r. w świetle wyników badania budżetów gospodarstw domowych [The situation
of households in 2018 as evidenced by the results of the household budget survey]. Informacja Sygnalna, Warsaw, 30 May 2019, GUS, p. 1.
6 Annual macroeconomic indicators, Warsaw, GUS, data as of 23 September 2019. The employment rate is based on the result of the Labour Force Survey (LFS) by GUS. According to the LFS, the unemployment rate was lower than the registered unemployment rate and stood at 3.8% in 2018.
Summary
10 Narodowy Bank Polski
exchange rate was largely determined by developments in the global financial markets and, only to a small extent, reflected the flows arising from Poland’s trade exchange or non-resident investments in the domestic capital market.
▪ The value of transactions in zloty-denominated OTC derivatives in the offshore market was substantially higher than in the domestic market, which was primarily attributable to the high activity of London-based banks and foreign hedge funds. OTC interest rate derivatives prevailed in terms of turnover value in Poland. Investor activity on the market for exchange-traded derivatives continued to be significantly lower than on the OTC market and concentrated in the segment of WIG20 futures.
▪ Turnover in the domestic market of OTC interest rate derivatives rose substantially. The IRS market remained its most liquid segment, as turnover on this market amounted to PLN 2.8 billion (22% more than in 2017). In 2018, growing activity was also observed on the domestic FA market for the first time since 2013. Average daily turnover on the market rose by over 40% to PLN 1.7 billion.
▪ The domestic OIS market in the period under analysis basically ceased to operate – occasional transactions were concluded on the market in certain months of the year. The lack of a liquid OIS market may adversely impact other segments of the domestic financial market. The commonly applied standard on global OTC derivatives market is the use of OIS curves, which are the approximation of risk-free interest rates for discounting future cash flows and for pricing financial instruments. Moreover, in certain jurisdictions OIS rates tend to become the basic money market benchmarks, replacing the reference rates calculated on the basis of quotations of unsecured interbank deposits (so-called -IBOR rates).
▪ The vast majority of transactions in OTC interest rate derivatives were cleared by domestic banks at CCP, which was related to the gradual implementation in the EU of the central clearing obligation for selected classes of OTC derivatives. In 2018, over 80% of FRAs and almost 75% of zloty denominated IRSs concluded in the domestic market were submitted for clearing at CCP. In transactions between domestic banks, they mainly used the services of the domestic CCP, due, among others, to their direct access to the clearing system and the possibility to establish collateral in the form of cash in zloty and domestic government bonds. The house accepted for clearing 1,463 transactions in zloty denominated OTC interest rate derivatives of the nominal value of PLN 160 billion. The vast majority of zloty denominated FRAs and IRSs concluded with non-residents were submitted for clearing by a CCP in London.
Directions of the evolution of Poland’s financial system

Narodowy Bank Polski12
Directions of the evolution of Poland’s financial systemDirections of the evolution of Poland’s financial system
12 Narodowy Bank Polski
the NBP interest rates unchanged. The European Central Bank (ECB) kept its interest rates close to zero, including the interest rate on deposit facility below zero, and continued its asset purchase programme, albeit on a smaller scale than in the past. The US Federal Reserve (Fed) took a different approach by gradually tightening its monetary policy. The Fed raised four times its target range for the fed funds rate by 0.25 percentage points to 2.25-2.50% and steadily reduced its balance-sheet by limiting the reinvestment of assets purchased under the quantitative easing programmes in the past. Sentiment on the global financial markets worsened in 2018. Stock prices fell in developed economies. The tightening of monetary policy by the Fed led to a hike in yields on the country’s Treasury bonds. The yields on government bonds in the largest euro area countries (except Italy) declined.7
The ratio of domestic financial system assets to GDP at the end of 2018 amounted to 128.7%, and, due to a faster pace of GDP growth than that of household financial assets, was lower than the end-of-the-2017 figure (Table 1.1). In Poland, like in other Central and Eastern European (CEE) countries, the development of financial intermediation, measured by the value of financial system assets to GDP ratio, continued to exhibit a relatively low level compared with the ratio’s average value in euro area countries (Figure 1.1).
Table 1.1. Assets of the financial system as a percentage of GDP in selected CEE countries and in the euro area, 2015-2018 (%)
2015 2016 2017 2018
Poland 128.6 133.0 132.1 128.7 Czech Republic 153.7 161.7 168.0 171.8 Slovakia 120.3 124.3 126.8 125.8 Hungary 131.4 130.9 128.4 132.3 Euro area 482.7 487.2 478.2 466.0
Notes: Due to the change of the source of data, inclusion of a broader category of non-bank institutions’ (leasing companies, factoring firms and lending companies) assets, assets of money market funds in financial system assets and adjustments sent by central banks, the data are not comparable with data released in previous editions of the report.
Source: For the euro area ‒ ECB Statistical Data Warehouse and Eurostat; for other countries ‒ data are provided by national central banks (NCBs) and GUS.
7 Report on monetary policy in 2018, Warsaw, May 2019, NBP, p. 19.
13Financial System in Poland 2018
Directions of the evolution of Poland’s financial systemDirections of the evolution of Poland’s financial system
13 Financial System in Poland 2018
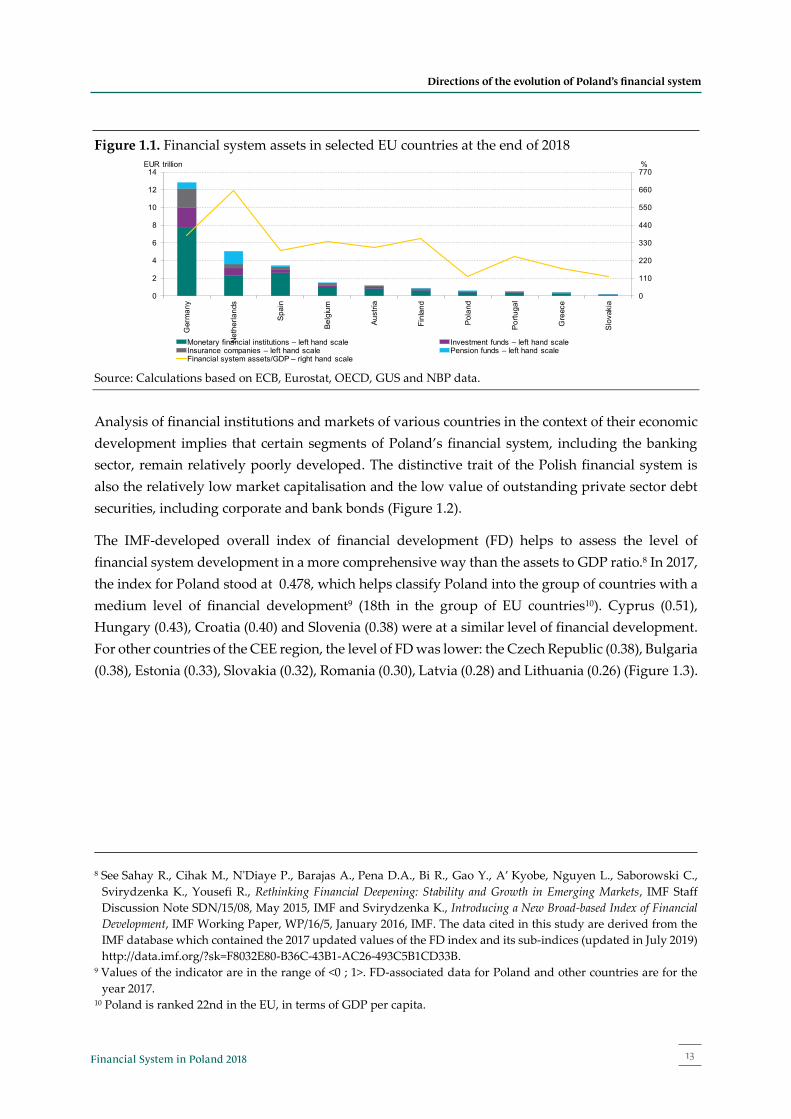
Figure 1.1. Financial system assets in selected EU countries at the end of 2018
Source: Calculations based on ECB, Eurostat, OECD, GUS and NBP data.
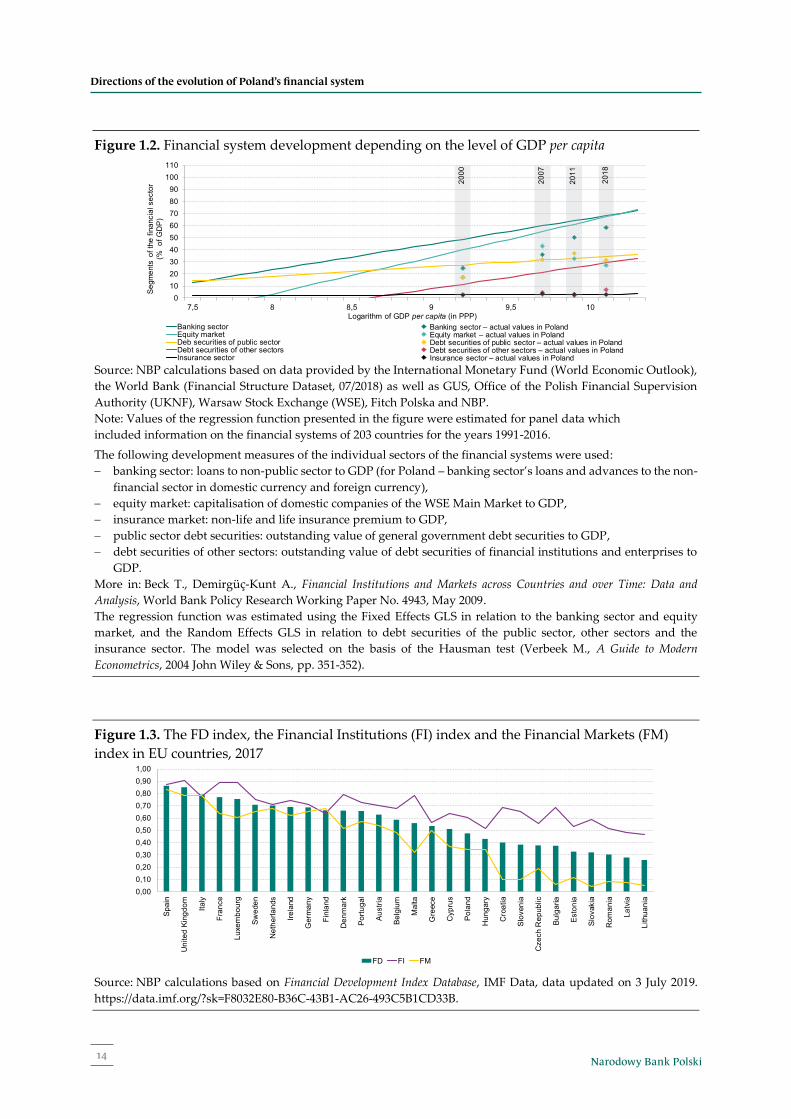
Analysis of financial institutions and markets of various countries in the context of their economic development implies that certain segments of Poland’s financial system, including the banking sector, remain relatively poorly developed. The distinctive trait of the Polish financial system is also the relatively low market capitalisation and the low value of outstanding private sector debt securities, including corporate and bank bonds (Figure 1.2).
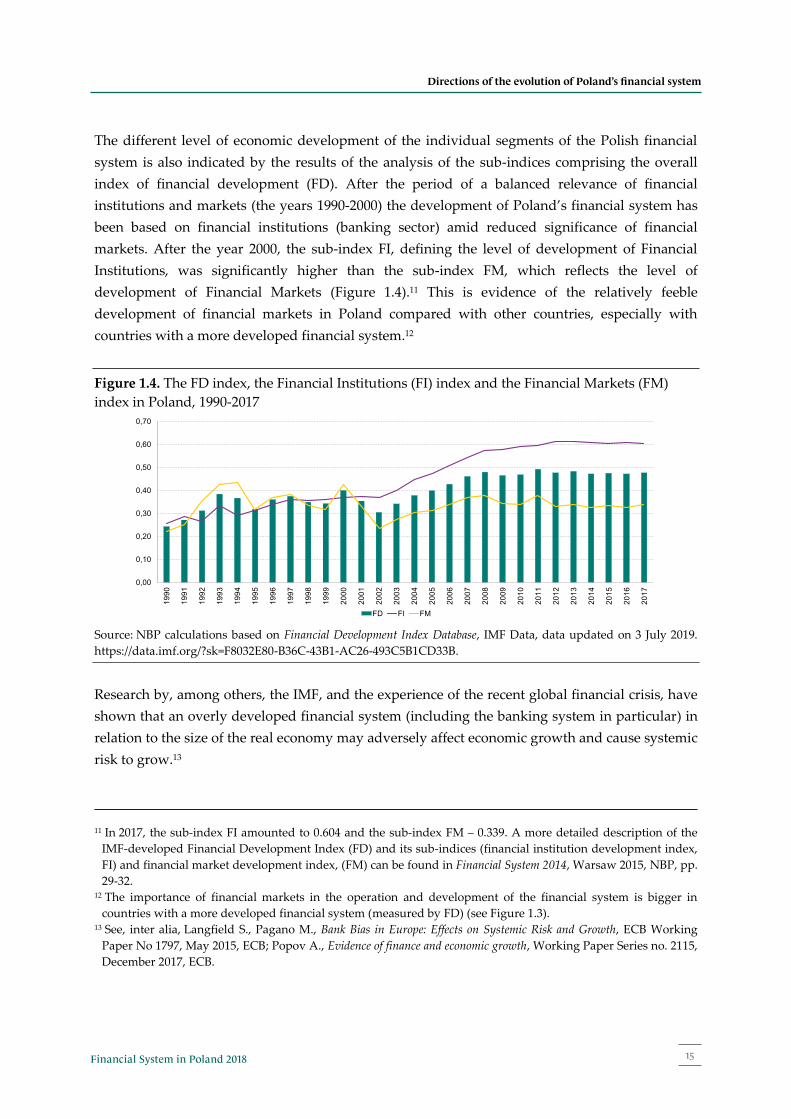
The IMF-developed overall index of financial development (FD) helps to assess the level of financial system development in a more comprehensive way than the assets to GDP ratio.8 In 2017, the index for Poland stood at 0.478, which helps classify Poland into the group of countries with a medium level of financial development9 (18th in the group of EU countries10). Cyprus (0.51), Hungary (0.43), Croatia (0.40) and Slovenia (0.38) were at a similar level of financial development. For other countries of the CEE region, the level of FD was lower: the Czech Republic (0.38), Bulgaria (0.38), Estonia (0.33), Slovakia (0.32), Romania (0.30), Latvia (0.28) and Lithuania (0.26) (Figure 1.3).
8 See Sahay R., Cihak M., N'Diaye P., Barajas A., Pena D.A., Bi R., Gao Y., A’ Kyobe, Nguyen L., Saborowski C.,
Svirydzenka K., Yousefi R., Rethinking Financial Deepening: Stability and Growth in Emerging Markets, IMF Staff Discussion Note SDN/15/08, May 2015, IMF and Svirydzenka K., Introducing a New Broad-based Index of Financial Development, IMF Working Paper, WP/16/5, January 2016, IMF. The data cited in this study are derived from the IMF database which contained the 2017 updated values of the FD index and its sub-indices (updated in July 2019) http://data.imf.org/?sk=F8032E80-B36C-43B1-AC26-493C5B1CD33B.
9 Values of the indicator are in the range of <0 ; 1>. FD-associated data for Poland and other countries are for the year 2017.
10 Poland is ranked 22nd in the EU, in terms of GDP per capita.
0
110
220
330
440
550
660
770
0
2
4
6
8
10
12
14
Ger
man
y
Net
herla
nds
Spa
in
Bel
gium
Aus
tria
Finl
and
Pol
and
Por
tuga
l
Gre
ece
Slo
vaki
a
Monetary financial institutions ‒ left hand scale Investment funds ‒ left hand scaleInsurance companies ‒ left hand scale Pension funds ‒ left hand scaleFinancial system assets/GDP ‒ right hand scale
%EUR trillion
Directions of the evolution of Poland’s financial system
12 Narodowy Bank Polski
the NBP interest rates unchanged. The European Central Bank (ECB) kept its interest rates close to zero, including the interest rate on deposit facility below zero, and continued its asset purchase programme, albeit on a smaller scale than in the past. The US Federal Reserve (Fed) took a different approach by gradually tightening its monetary policy. The Fed raised four times its target range for the fed funds rate by 0.25 percentage points to 2.25-2.50% and steadily reduced its balance-sheet by limiting the reinvestment of assets purchased under the quantitative easing programmes in the past. Sentiment on the global financial markets worsened in 2018. Stock prices fell in developed economies. The tightening of monetary policy by the Fed led to a hike in yields on the country’s Treasury bonds. The yields on government bonds in the largest euro area countries (except Italy) declined.7
The ratio of domestic financial system assets to GDP at the end of 2018 amounted to 128.7%, and, due to a faster pace of GDP growth than that of household financial assets, was lower than the end-of-the-2017 figure (Table 1.1). In Poland, like in other Central and Eastern European (CEE) countries, the development of financial intermediation, measured by the value of financial system assets to GDP ratio, continued to exhibit a relatively low level compared with the ratio’s average value in euro area countries (Figure 1.1).
Table 1.1. Assets of the financial system as a percentage of GDP in selected CEE countries and in the euro area, 2015-2018 (%)
2015 2016 2017 2018
Poland 128.6 133.0 132.1 128.7 Czech Republic 153.7 161.7 168.0 171.8 Slovakia 120.3 124.3 126.8 125.8 Hungary 131.4 130.9 128.4 132.3 Euro area 482.7 487.2 478.2 466.0
Notes: Due to the change of the source of data, inclusion of a broader category of non-bank institutions’ (leasing companies, factoring firms and lending companies) assets, assets of money market funds in financial system assets and adjustments sent by central banks, the data are not comparable with data released in previous editions of the report.
Source: For the euro area ‒ ECB Statistical Data Warehouse and Eurostat; for other countries ‒ data are provided by national central banks (NCBs) and GUS.
7 Report on monetary policy in 2018, Warsaw, May 2019, NBP, p. 19.
Narodowy Bank Polski14
Directions of the evolution of Poland’s financial systemDirections of the evolution of Poland’s financial system
14 Narodowy Bank Polski
Figure 1.2. Financial system development depending on the level of GDP per capita
Source: NBP calculations based on data provided by the International Monetary Fund (World Economic Outlook), the World Bank (Financial Structure Dataset, 07/2018) as well as GUS, Office of the Polish Financial Supervision Authority (UKNF), Warsaw Stock Exchange (WSE), Fitch Polska and NBP. Note: Values of the regression function presented in the figure were estimated for panel data which included information on the financial systems of 203 countries for the years 1991-2016.
The following development measures of the individual sectors of the financial systems were used: − banking sector: loans to non-public sector to GDP (for Poland ‒ banking sector’s loans and advances to the non-
financial sector in domestic currency and foreign currency), − equity market: capitalisation of domestic companies of the WSE Main Market to GDP, − insurance market: non-life and life insurance premium to GDP, − public sector debt securities: outstanding value of general government debt securities to GDP, − debt securities of other sectors: outstanding value of debt securities of financial institutions and enterprises to
GDP. More in: Beck T., Demirgüç-Kunt A., Financial Institutions and Markets across Countries and over Time: Data and Analysis, World Bank Policy Research Working Paper No. 4943, May 2009. The regression function was estimated using the Fixed Effects GLS in relation to the banking sector and equity market, and the Random Effects GLS in relation to debt securities of the public sector, other sectors and the insurance sector. The model was selected on the basis of the Hausman test (Verbeek M., A Guide to Modern Econometrics, 2004 John Wiley & Sons, pp. 351-352).
Figure 1.3. The FD index, the Financial Institutions (FI) index and the Financial Markets (FM) index in EU countries, 2017
Source: NBP calculations based on Financial Development Index Database, IMF Data, data updated on 3 July 2019. https://data.imf.org/?sk=F8032E80-B36C-43B1-AC26-493C5B1CD33B.
0102030405060708090
100110
7,5 8 8,5 9 9,5 10
Seg
men
ts o
f the
fina
ncia
l sec
tor
(%
of G
DP
)
Logarithm of GDP per capita (in PPP)Banking sector Banking sector ‒ actual values in PolandEquity market Equity market ‒ actual values in PolandDeb securities of public sector Debt securities of public sector ‒ actual values in PolandDebt securities of other sectors Debt securities of other sectors ‒ actual values in PolandInsurance sector Insurance sector ‒ actual values in Poland
2000
2018
2011
2007
0,000,100,200,300,400,500,600,700,800,901,00
Spa
in
Uni
ted
Kin
gdom Ita
ly
Fran
ce
Luxe
mbo
urg
Sw
eden
Net
herla
nds
Irela
nd
Ger
man
y
Finl
and
Den
mar
k
Por
tuga
l
Aus
tria
Bel
gium
Mal
ta
Gre
ece
Cyp
rus
Pol
and
Hun
gary
Cro
atia
Slo
veni
a
Cze
ch R
epub
lic
Bul
garia
Est
onia
Slo
vaki
a
Rom
ania
Latv
ia
Lith
uani
a
FD FI FM
15Financial System in Poland 2018
Directions of the evolution of Poland’s financial systemDirections of the evolution of Poland’s financial system
15 Financial System in Poland 2018
The different level of economic development of the individual segments of the Polish financial system is also indicated by the results of the analysis of the sub-indices comprising the overall index of financial development (FD). After the period of a balanced relevance of financial institutions and markets (the years 1990-2000) the development of Poland’s financial system has been based on financial institutions (banking sector) amid reduced significance of financial markets. After the year 2000, the sub-index FI, defining the level of development of Financial Institutions, was significantly higher than the sub-index FM, which reflects the level of development of Financial Markets (Figure 1.4).11 This is evidence of the relatively feeble development of financial markets in Poland compared with other countries, especially with countries with a more developed financial system.12
Figure 1.4. The FD index, the Financial Institutions (FI) index and the Financial Markets (FM) index in Poland, 1990-2017
Source: NBP calculations based on Financial Development Index Database, IMF Data, data updated on 3 July 2019. https://data.imf.org/?sk=F8032E80-B36C-43B1-AC26-493C5B1CD33B.
Research by, among others, the IMF, and the experience of the recent global financial crisis, have shown that an overly developed financial system (including the banking system in particular) in relation to the size of the real economy may adversely affect economic growth and cause systemic risk to grow.13
11 In 2017, the sub-index FI amounted to 0.604 and the sub-index FM – 0.339. A more detailed description of the
IMF-developed Financial Development Index (FD) and its sub-indices (financial institution development index, FI) and financial market development index, (FM) can be found in Financial System 2014, Warsaw 2015, NBP, pp. 29-32.
12 The importance of financial markets in the operation and development of the financial system is bigger in countries with a more developed financial system (measured by FD) (see Figure 1.3).
13 See, inter alia, Langfield S., Pagano M., Bank Bias in Europe: Effects on Systemic Risk and Growth, ECB Working Paper No 1797, May 2015, ECB; Popov A., Evidence of finance and economic growth, Working Paper Series no. 2115, December 2017, ECB.
0,00
0,10
0,20
0,30
0,40
0,50
0,60
0,70
1990
1991
1992
1993
1994
1995
1996
1997
1998
1999
2000
2001
2002
2003
2004
2005
2006
2007
2008
2009
2010
2011
2012
2013
2014
2015
2016
2017
FD FI FM
Directions of the evolution of Poland’s financial system
14 Narodowy Bank Polski
Figure 1.2. Financial system development depending on the level of GDP per capita
Source: NBP calculations based on data provided by the International Monetary Fund (World Economic Outlook), the World Bank (Financial Structure Dataset, 07/2018) as well as GUS, Office of the Polish Financial Supervision Authority (UKNF), Warsaw Stock Exchange (WSE), Fitch Polska and NBP. Note: Values of the regression function presented in the figure were estimated for panel data which included information on the financial systems of 203 countries for the years 1991-2016.
The following development measures of the individual sectors of the financial systems were used: − banking sector: loans to non-public sector to GDP (for Poland ‒ banking sector’s loans and advances to the non-
financial sector in domestic currency and foreign currency), − equity market: capitalisation of domestic companies of the WSE Main Market to GDP, − insurance market: non-life and life insurance premium to GDP, − public sector debt securities: outstanding value of general government debt securities to GDP, − debt securities of other sectors: outstanding value of debt securities of financial institutions and enterprises to
GDP. More in: Beck T., Demirgüç-Kunt A., Financial Institutions and Markets across Countries and over Time: Data and Analysis, World Bank Policy Research Working Paper No. 4943, May 2009. The regression function was estimated using the Fixed Effects GLS in relation to the banking sector and equity market, and the Random Effects GLS in relation to debt securities of the public sector, other sectors and the insurance sector. The model was selected on the basis of the Hausman test (Verbeek M., A Guide to Modern Econometrics, 2004 John Wiley & Sons, pp. 351-352).
Figure 1.3. The FD index, the Financial Institutions (FI) index and the Financial Markets (FM) index in EU countries, 2017
Source: NBP calculations based on Financial Development Index Database, IMF Data, data updated on 3 July 2019. https://data.imf.org/?sk=F8032E80-B36C-43B1-AC26-493C5B1CD33B.
0102030405060708090
100110
7,5 8 8,5 9 9,5 10
Seg
men
ts o
f the
fina
ncia
l sec
tor
(%
of G
DP
)
Logarithm of GDP per capita (in PPP)Banking sector Banking sector ‒ actual values in PolandEquity market Equity market ‒ actual values in PolandDeb securities of public sector Debt securities of public sector ‒ actual values in PolandDebt securities of other sectors Debt securities of other sectors ‒ actual values in PolandInsurance sector Insurance sector ‒ actual values in Poland
2000
2018
2011
2007
0,000,100,200,300,400,500,600,700,800,901,00
Spa
in
Uni
ted
Kin
gdom Ita
ly
Fran
ce
Luxe
mbo
urg
Sw
eden
Net
herla
nds
Irela
nd
Ger
man
y
Finl
and
Den
mar
k
Por
tuga
l
Aus
tria
Bel
gium
Mal
ta
Gre
ece
Cyp
rus
Pol
and
Hun
gary
Cro
atia
Slo
veni
a
Cze
ch R
epub
lic
Bul
garia
Est
onia
Slo
vaki
a
Rom
ania
Latv
ia
Lith
uani
a
FD FI FM
Narodowy Bank Polski16
Directions of the evolution of Poland’s financial systemDirections of the evolution of Poland’s financial system
16 Narodowy Bank Polski
In the case of Poland, given its development level, the financial system has a positive impact on economic growth. Assessments of both Polish and international institutions that there is room for its further sustainable development that will support economic growth are still valid. Development should remain moderate and take place as the importance of financial markets grows because they are relatively poorly developed.14
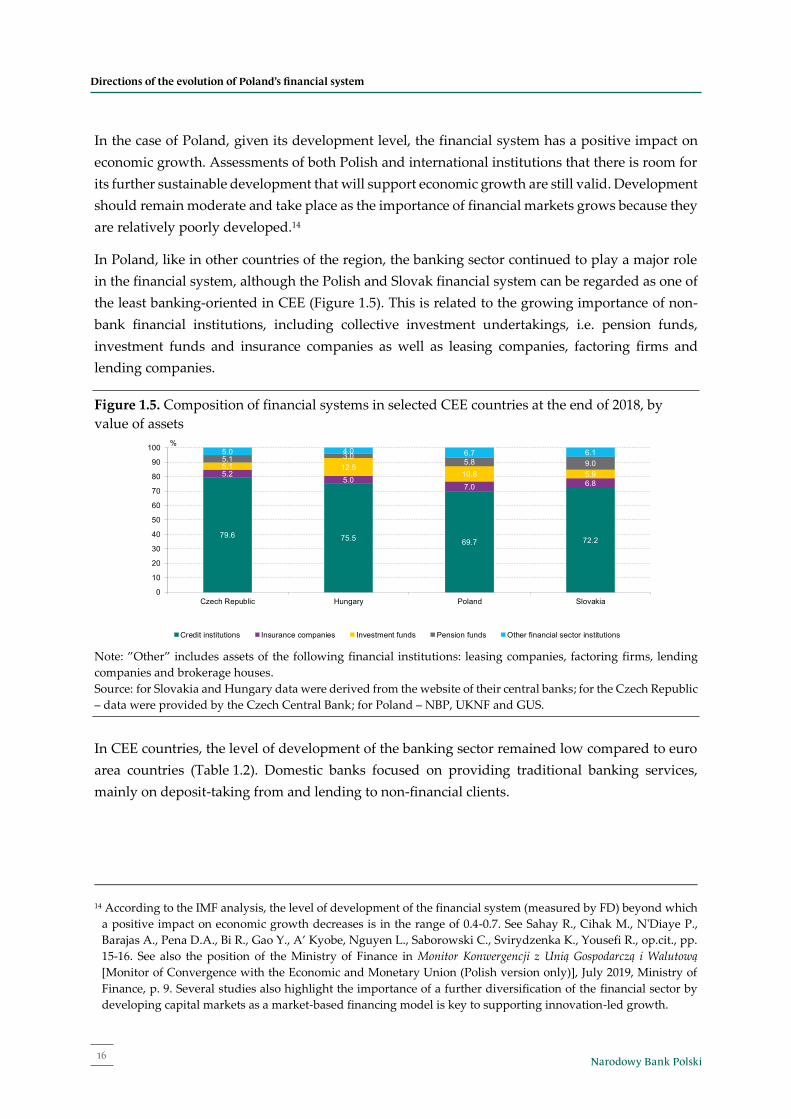
In Poland, like in other countries of the region, the banking sector continued to play a major role in the financial system, although the Polish and Slovak financial system can be regarded as one of the least banking-oriented in CEE (Figure 1.5). This is related to the growing importance of non-bank financial institutions, including collective investment undertakings, i.e. pension funds, investment funds and insurance companies as well as leasing companies, factoring firms and lending companies.
Figure 1.5. Composition of financial systems in selected CEE countries at the end of 2018, by value of assets
Note: ”Other” includes assets of the following financial institutions: leasing companies, factoring firms, lending companies and brokerage houses. Source: for Slovakia and Hungary data were derived from the website of their central banks; for the Czech Republic ‒ data were provided by the Czech Central Bank; for Poland ‒ NBP, UKNF and GUS.
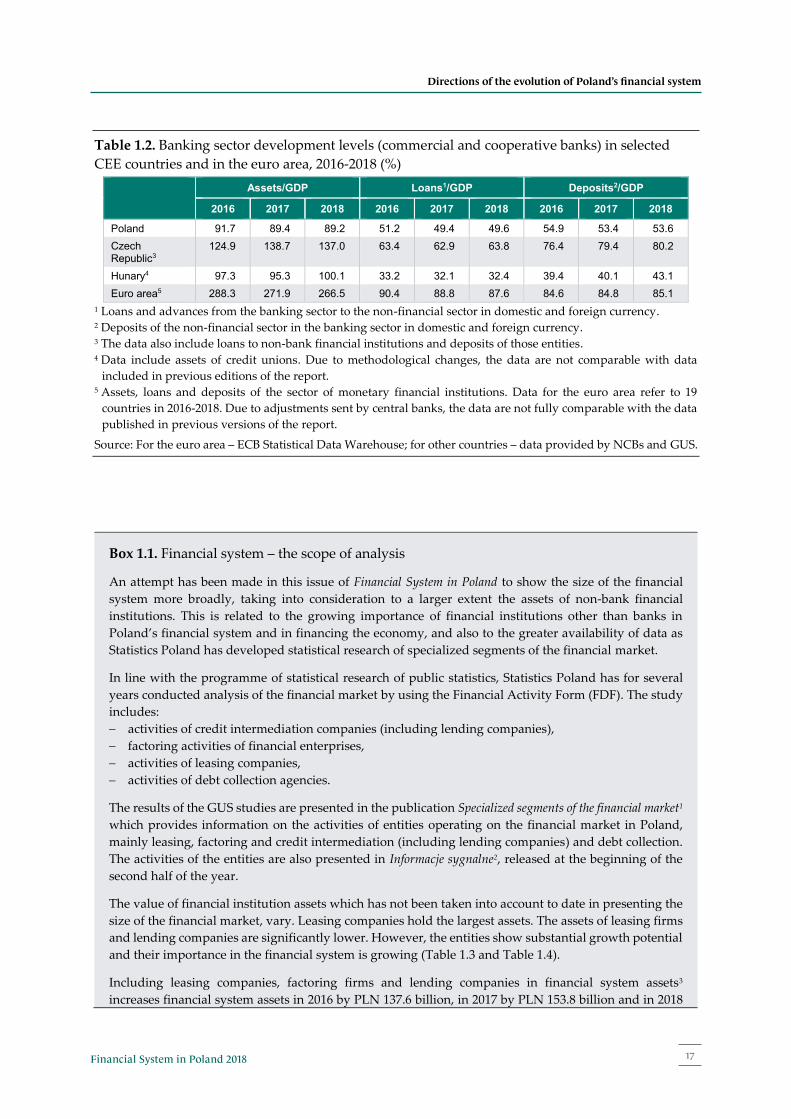
In CEE countries, the level of development of the banking sector remained low compared to euro area countries (Table 1.2). Domestic banks focused on providing traditional banking services, mainly on deposit-taking from and lending to non-financial clients.
14 According to the IMF analysis, the level of development of the financial system (measured by FD) beyond which
a positive impact on economic growth decreases is in the range of 0.4-0.7. See Sahay R., Cihak M., N'Diaye P., Barajas A., Pena D.A., Bi R., Gao Y., A’ Kyobe, Nguyen L., Saborowski C., Svirydzenka K., Yousefi R., op.cit., pp. 15-16. See also the position of the Ministry of Finance in Monitor Konwergencji z Unią Gospodarczą i Walutową [Monitor of Convergence with the Economic and Monetary Union (Polish version only)], July 2019, Ministry of Finance, p. 9. Several studies also highlight the importance of a further diversification of the financial sector by developing capital markets as a market-based financing model is key to supporting innovation-led growth.
79.6 75.5 69.7 72.2
5.25.0
7.0 6.8
5.1 12.510.8 5.9
5.1 3.05.8 9.0
5.0 4.0 6.7 6.1
0
10
20
30
40
50
60
70
80
90
100
Czech Republic Hungary Poland Slovakia
Credit institutions Insurance companies Investment funds Pension funds Other financial sector institutions
%
17Financial System in Poland 2018
Directions of the evolution of Poland’s financial systemDirections of the evolution of Poland’s financial system
17 Financial System in Poland 2018
Table 1.2. Banking sector development levels (commercial and cooperative banks) in selected CEE countries and in the euro area, 2016-2018 (%)
Assets/GDP Loans1/GDP Deposits2/GDP
2016 2017 2018 2016 2017 2018 2016 2017 2018
Poland 91.7 89.4 89.2 51.2 49.4 49.6 54.9 53.4 53.6 Czech Republic3
124.9 138.7 137.0 63.4 62.9 63.8 76.4 79.4 80.2
Hunary4 97.3 95.3 100.1 33.2 32.1 32.4 39.4 40.1 43.1 Euro area5 288.3 271.9 266.5 90.4 88.8 87.6 84.6 84.8 85.1
1 Loans and advances from the banking sector to the non-financial sector in domestic and foreign currency. 2 Deposits of the non-financial sector in the banking sector in domestic and foreign currency. 3 The data also include loans to non-bank financial institutions and deposits of those entities. 4 Data include assets of credit unions. Due to methodological changes, the data are not comparable with data
included in previous editions of the report. 5 Assets, loans and deposits of the sector of monetary financial institutions. Data for the euro area refer to 19
countries in 2016-2018. Due to adjustments sent by central banks, the data are not fully comparable with the data published in previous versions of the report.
Source: For the euro area ‒ ECB Statistical Data Warehouse; for other countries ‒ data provided by NCBs and GUS.
Box 1.1. Financial system – the scope of analysis
An attempt has been made in this issue of Financial System in Poland to show the size of the financial system more broadly, taking into consideration to a larger extent the assets of non-bank financial institutions. This is related to the growing importance of financial institutions other than banks in Poland’s financial system and in financing the economy, and also to the greater availability of data as Statistics Poland has developed statistical research of specialized segments of the financial market.
In line with the programme of statistical research of public statistics, Statistics Poland has for several years conducted analysis of the financial market by using the Financial Activity Form (FDF). The study includes: − activities of credit intermediation companies (including lending companies), − factoring activities of financial enterprises, − activities of leasing companies, − activities of debt collection agencies.
The results of the GUS studies are presented in the publication Specialized segments of the financial market1 which provides information on the activities of entities operating on the financial market in Poland, mainly leasing, factoring and credit intermediation (including lending companies) and debt collection. The activities of the entities are also presented in Informacje sygnalne2, released at the beginning of the second half of the year.
The value of financial institution assets which has not been taken into account to date in presenting the size of the financial market, vary. Leasing companies hold the largest assets. The assets of leasing firms and lending companies are significantly lower. However, the entities show substantial growth potential and their importance in the financial system is growing (Table 1.3 and Table 1.4).
Including leasing companies, factoring firms and lending companies in financial system assets3 increases financial system assets in 2016 by PLN 137.6 billion, in 2017 by PLN 153.8 billion and in 2018
Directions of the evolution of Poland’s financial system
16 Narodowy Bank Polski
In the case of Poland, given its development level, the financial system has a positive impact on economic growth. Assessments of both Polish and international institutions that there is room for its further sustainable development that will support economic growth are still valid. Development should remain moderate and take place as the importance of financial markets grows because they are relatively poorly developed.14
In Poland, like in other countries of the region, the banking sector continued to play a major role in the financial system, although the Polish and Slovak financial system can be regarded as one of the least banking-oriented in CEE (Figure 1.5). This is related to the growing importance of non-bank financial institutions, including collective investment undertakings, i.e. pension funds, investment funds and insurance companies as well as leasing companies, factoring firms and lending companies.
Figure 1.5. Composition of financial systems in selected CEE countries at the end of 2018, by value of assets
Note: ”Other” includes assets of the following financial institutions: leasing companies, factoring firms, lending companies and brokerage houses. Source: for Slovakia and Hungary data were derived from the website of their central banks; for the Czech Republic ‒ data were provided by the Czech Central Bank; for Poland ‒ NBP, UKNF and GUS.
In CEE countries, the level of development of the banking sector remained low compared to euro area countries (Table 1.2). Domestic banks focused on providing traditional banking services, mainly on deposit-taking from and lending to non-financial clients.
14 According to the IMF analysis, the level of development of the financial system (measured by FD) beyond which
a positive impact on economic growth decreases is in the range of 0.4-0.7. See Sahay R., Cihak M., N'Diaye P., Barajas A., Pena D.A., Bi R., Gao Y., A’ Kyobe, Nguyen L., Saborowski C., Svirydzenka K., Yousefi R., op.cit., pp. 15-16. See also the position of the Ministry of Finance in Monitor Konwergencji z Unią Gospodarczą i Walutową [Monitor of Convergence with the Economic and Monetary Union (Polish version only)], July 2019, Ministry of Finance, p. 9. Several studies also highlight the importance of a further diversification of the financial sector by developing capital markets as a market-based financing model is key to supporting innovation-led growth.
79.6 75.5 69.7 72.2
5.25.0
7.0 6.8
5.1 12.510.8 5.9
5.1 3.05.8 9.0
5.0 4.0 6.7 6.1
0
10
20
30
40
50
60
70
80
90
100
Czech Republic Hungary Poland Slovakia
Credit institutions Insurance companies Investment funds Pension funds Other financial sector institutions
%
Narodowy Bank Polski18
Directions of the evolution of Poland’s financial systemDirections of the evolution of Poland’s financial system
18 Narodowy Bank Polski
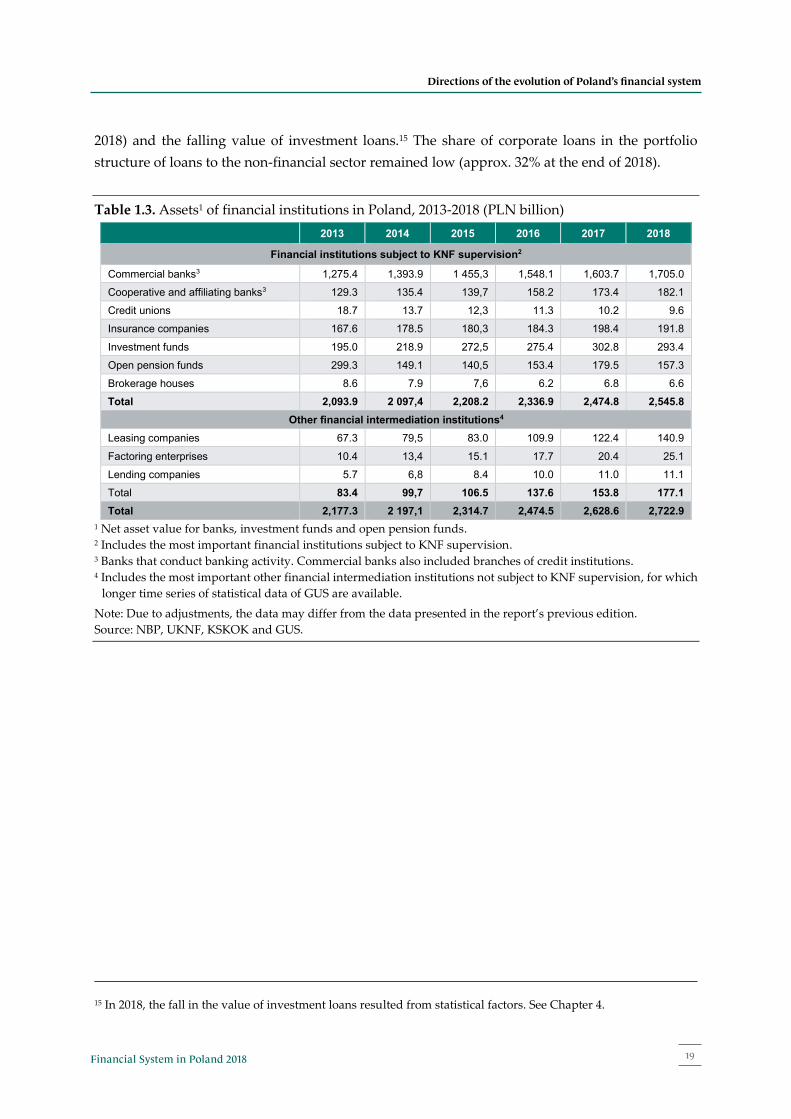
At the end of 2018, assets of institutions comprising the Polish financial sector stood at PLN 2.72 trillion, i.e. they were 3.6% higher than a year earlier. The growth in assets was primarily driven by a rise in the value of banking sector assets and assets of such non-bank financial institutions as factoring enterprises and leasing companies. On the other hand, the assets of open pension funds, credit unions, investment funds, insurance undertakings and brokerage houses decreased (Table 1.3 and Table 1.4).
At the end of 2018, the rate of growth of loans to the non-financial sector was approx. 5.9% y/y and varied in the market’s individual segments. The annual rate of growth of housing loans, the category with the highest share in the loan portfolio, grew to 4.9% y/y at the end of 2018 compared with 3.4% y/y at the end of 2017. This was because the pace of zloty loan growth was high (over 11% y/y at the end of 2018) and foreign currency loans were repaid on a regular basis. The percentage of foreign currency loans in the portfolio of housing loans decreased to approx. 31%. Recovery continued in the segment of consumer loans. As the loans are highly profitable and capital requirements are relatively low, banks are eager to develop this segment. The year 2018 saw corporate lending growth at a slightly lower level than in 2017 (6.5% y/y at the end of the year). The drop can be attributed to the fast pace of growth of current loans (over 13% y/y at the end of
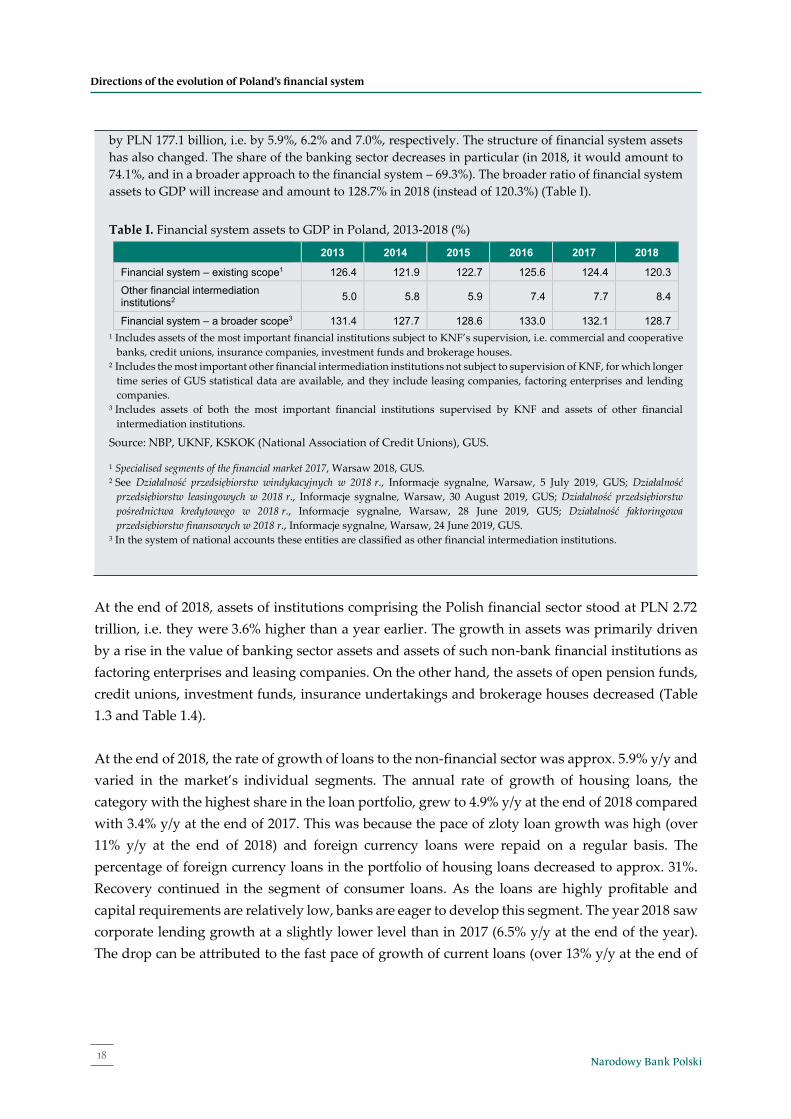
by PLN 177.1 billion, i.e. by 5.9%, 6.2% and 7.0%, respectively. The structure of financial system assets has also changed. The share of the banking sector decreases in particular (in 2018, it would amount to 74.1%, and in a broader approach to the financial system – 69.3%). The broader ratio of financial system assets to GDP will increase and amount to 128.7% in 2018 (instead of 120.3%) (Table I).
Table I. Financial system assets to GDP in Poland, 2013-2018 (%)
2013 2014 2015 2016 2017 2018
Financial system – existing scope1 126.4 121.9 122.7 125.6 124.4 120.3
Other financial intermediation institutions2 5.0 5.8 5.9 7.4 7.7 8.4
Financial system – a broader scope3 131.4 127.7 128.6 133.0 132.1 128.7 1 Includes assets of the most important financial institutions subject to KNF’s supervision, i.e. commercial and cooperative
banks, credit unions, insurance companies, investment funds and brokerage houses. 2 Includes the most important other financial intermediation institutions not subject to supervision of KNF, for which longer
time series of GUS statistical data are available, and they include leasing companies, factoring enterprises and lending companies.
3 Includes assets of both the most important financial institutions supervised by KNF and assets of other financial intermediation institutions.
Source: NBP, UKNF, KSKOK (National Association of Credit Unions), GUS.
1 Specialised segments of the financial market 2017, Warsaw 2018, GUS. 2 See Działalność przedsiębiorstw windykacyjnych w 2018 r., Informacje sygnalne, Warsaw, 5 July 2019, GUS; Działalność
przedsiębiorstw leasingowych w 2018 r., Informacje sygnalne, Warsaw, 30 August 2019, GUS; Działalność przedsiębiorstw pośrednictwa kredytowego w 2018 r., Informacje sygnalne, Warsaw, 28 June 2019, GUS; Działalność faktoringowa przedsiębiorstw finansowych w 2018 r., Informacje sygnalne, Warsaw, 24 June 2019, GUS.
3 In the system of national accounts these entities are classified as other financial intermediation institutions.
19Financial System in Poland 2018
Directions of the evolution of Poland’s financial systemDirections of the evolution of Poland’s financial system
19 Financial System in Poland 2018
2018) and the falling value of investment loans.15 The share of corporate loans in the portfolio structure of loans to the non-financial sector remained low (approx. 32% at the end of 2018).
Table 1.3. Assets1 of financial institutions in Poland, 2013-2018 (PLN billion) 2013 2014 2015 2016 2017 2018
Financial institutions subject to KNF supervision2
Commercial banks3 1,275.4 1,393.9 1 455,3 1,548.1 1,603.7 1,705.0
Cooperative and affiliating banks3 129.3 135.4 139,7 158.2 173.4 182.1
Credit unions 18.7 13.7 12,3 11.3 10.2 9.6
Insurance companies 167.6 178.5 180,3 184.3 198.4 191.8
Investment funds 195.0 218.9 272,5 275.4 302.8 293.4
Open pension funds 299.3 149.1 140,5 153.4 179.5 157.3
Brokerage houses 8.6 7.9 7,6 6.2 6.8 6.6
Total 2,093.9 2 097,4 2,208.2 2,336.9 2,474.8 2,545.8 Other financial intermediation institutions4 Leasing companies 67.3 79,5 83.0 109.9 122.4 140.9
Factoring enterprises 10.4 13,4 15.1 17.7 20.4 25.1
Lending companies 5.7 6,8 8.4 10.0 11.0 11.1
Total 83.4 99,7 106.5 137.6 153.8 177.1 Total 2,177.3 2 197,1 2,314.7 2,474.5 2,628.6 2,722.9
1 Net asset value for banks, investment funds and open pension funds. 2 Includes the most important financial institutions subject to KNF supervision. 3 Banks that conduct banking activity. Commercial banks also included branches of credit institutions. 4 Includes the most important other financial intermediation institutions not subject to KNF supervision, for which
longer time series of statistical data of GUS are available.
Note: Due to adjustments, the data may differ from the data presented in the report’s previous edition. Source: NBP, UKNF, KSKOK and GUS.
15 In 2018, the fall in the value of investment loans resulted from statistical factors. See Chapter 4.
Directions of the evolution of Poland’s financial system
18 Narodowy Bank Polski
At the end of 2018, assets of institutions comprising the Polish financial sector stood at PLN 2.72 trillion, i.e. they were 3.6% higher than a year earlier. The growth in assets was primarily driven by a rise in the value of banking sector assets and assets of such non-bank financial institutions as factoring enterprises and leasing companies. On the other hand, the assets of open pension funds, credit unions, investment funds, insurance undertakings and brokerage houses decreased (Table 1.3 and Table 1.4).
At the end of 2018, the rate of growth of loans to the non-financial sector was approx. 5.9% y/y and varied in the market’s individual segments. The annual rate of growth of housing loans, the category with the highest share in the loan portfolio, grew to 4.9% y/y at the end of 2018 compared with 3.4% y/y at the end of 2017. This was because the pace of zloty loan growth was high (over 11% y/y at the end of 2018) and foreign currency loans were repaid on a regular basis. The percentage of foreign currency loans in the portfolio of housing loans decreased to approx. 31%. Recovery continued in the segment of consumer loans. As the loans are highly profitable and capital requirements are relatively low, banks are eager to develop this segment. The year 2018 saw corporate lending growth at a slightly lower level than in 2017 (6.5% y/y at the end of the year). The drop can be attributed to the fast pace of growth of current loans (over 13% y/y at the end of
by PLN 177.1 billion, i.e. by 5.9%, 6.2% and 7.0%, respectively. The structure of financial system assets has also changed. The share of the banking sector decreases in particular (in 2018, it would amount to 74.1%, and in a broader approach to the financial system – 69.3%). The broader ratio of financial system assets to GDP will increase and amount to 128.7% in 2018 (instead of 120.3%) (Table I).
Table I. Financial system assets to GDP in Poland, 2013-2018 (%)
2013 2014 2015 2016 2017 2018
Financial system – existing scope1 126.4 121.9 122.7 125.6 124.4 120.3
Other financial intermediation institutions2 5.0 5.8 5.9 7.4 7.7 8.4
Financial system – a broader scope3 131.4 127.7 128.6 133.0 132.1 128.7 1 Includes assets of the most important financial institutions subject to KNF’s supervision, i.e. commercial and cooperative
banks, credit unions, insurance companies, investment funds and brokerage houses. 2 Includes the most important other financial intermediation institutions not subject to supervision of KNF, for which longer
time series of GUS statistical data are available, and they include leasing companies, factoring enterprises and lending companies.
3 Includes assets of both the most important financial institutions supervised by KNF and assets of other financial intermediation institutions.
Source: NBP, UKNF, KSKOK (National Association of Credit Unions), GUS.
1 Specialised segments of the financial market 2017, Warsaw 2018, GUS. 2 See Działalność przedsiębiorstw windykacyjnych w 2018 r., Informacje sygnalne, Warsaw, 5 July 2019, GUS; Działalność
przedsiębiorstw leasingowych w 2018 r., Informacje sygnalne, Warsaw, 30 August 2019, GUS; Działalność przedsiębiorstw pośrednictwa kredytowego w 2018 r., Informacje sygnalne, Warsaw, 28 June 2019, GUS; Działalność faktoringowa przedsiębiorstw finansowych w 2018 r., Informacje sygnalne, Warsaw, 24 June 2019, GUS.
3 In the system of national accounts these entities are classified as other financial intermediation institutions.
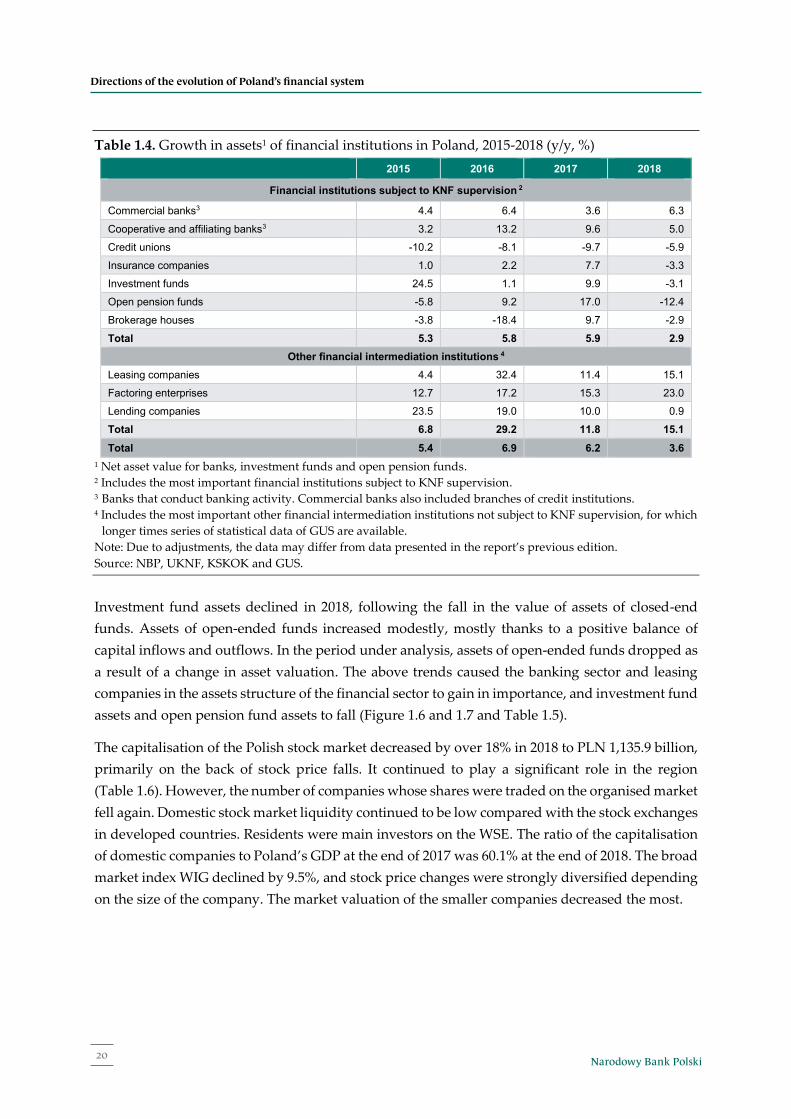
Narodowy Bank Polski20
Directions of the evolution of Poland’s financial systemDirections of the evolution of Poland’s financial system
20 Narodowy Bank Polski
Table 1.4. Growth in assets1 of financial institutions in Poland, 2015-2018 (y/y, %) 2015 2016 2017 2018
Financial institutions subject to KNF supervision 2
Commercial banks3 4.4 6.4 3.6 6.3
Cooperative and affiliating banks3 3.2 13.2 9.6 5.0
Credit unions -10.2 -8.1 -9.7 -5.9
Insurance companies 1.0 2.2 7.7 -3.3
Investment funds 24.5 1.1 9.9 -3.1
Open pension funds -5.8 9.2 17.0 -12.4
Brokerage houses -3.8 -18.4 9.7 -2.9
Total 5.3 5.8 5.9 2.9 Other financial intermediation institutions 4
Leasing companies 4.4 32.4 11.4 15.1
Factoring enterprises 12.7 17.2 15.3 23.0
Lending companies 23.5 19.0 10.0 0.9
Total 6.8 29.2 11.8 15.1
Total 5.4 6.9 6.2 3.6 1 Net asset value for banks, investment funds and open pension funds. 2 Includes the most important financial institutions subject to KNF supervision. 3 Banks that conduct banking activity. Commercial banks also included branches of credit institutions. 4 Includes the most important other financial intermediation institutions not subject to KNF supervision, for which
longer times series of statistical data of GUS are available. Note: Due to adjustments, the data may differ from data presented in the report’s previous edition. Source: NBP, UKNF, KSKOK and GUS.
Investment fund assets declined in 2018, following the fall in the value of assets of closed-end funds. Assets of open-ended funds increased modestly, mostly thanks to a positive balance of capital inflows and outflows. In the period under analysis, assets of open-ended funds dropped as a result of a change in asset valuation. The above trends caused the banking sector and leasing companies in the assets structure of the financial sector to gain in importance, and investment fund assets and open pension fund assets to fall (Figure 1.6 and 1.7 and Table 1.5).
The capitalisation of the Polish stock market decreased by over 18% in 2018 to PLN 1,135.9 billion, primarily on the back of stock price falls. It continued to play a significant role in the region (Table 1.6). However, the number of companies whose shares were traded on the organised market fell again. Domestic stock market liquidity continued to be low compared with the stock exchanges in developed countries. Residents were main investors on the WSE. The ratio of the capitalisation of domestic companies to Poland’s GDP at the end of 2017 was 60.1% at the end of 2018. The broad market index WIG declined by 9.5%, and stock price changes were strongly diversified depending on the size of the company. The market valuation of the smaller companies decreased the most.
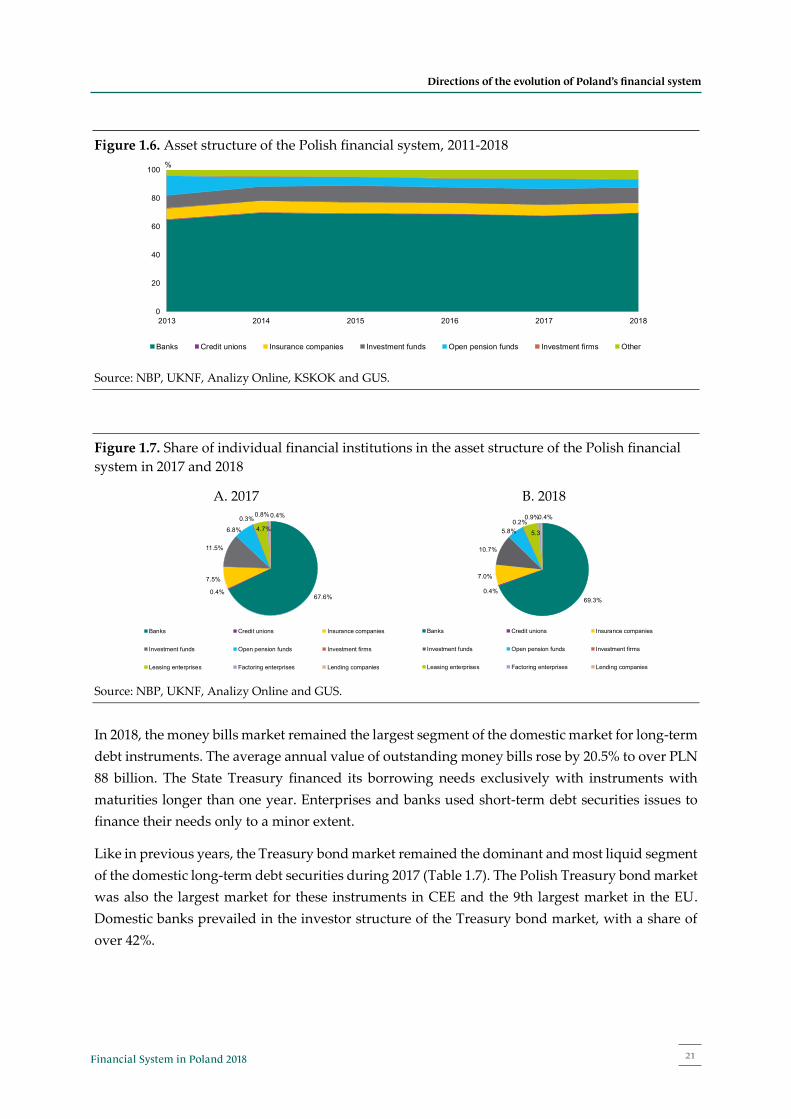
21Financial System in Poland 2018
Directions of the evolution of Poland’s financial systemDirections of the evolution of Poland’s financial system
21 Financial System in Poland 2018
Figure 1.6. Asset structure of the Polish financial system, 2011-2018
Source: NBP, UKNF, Analizy Online, KSKOK and GUS.
Figure 1.7. Share of individual financial institutions in the asset structure of the Polish financial system in 2017 and 2018
A. 2017 B. 2018
Source: NBP, UKNF, Analizy Online and GUS.
In 2018, the money bills market remained the largest segment of the domestic market for long-term debt instruments. The average annual value of outstanding money bills rose by 20.5% to over PLN 88 billion. The State Treasury financed its borrowing needs exclusively with instruments with maturities longer than one year. Enterprises and banks used short-term debt securities issues to finance their needs only to a minor extent.
Like in previous years, the Treasury bond market remained the dominant and most liquid segment of the domestic long-term debt securities during 2017 (Table 1.7). The Polish Treasury bond market was also the largest market for these instruments in CEE and the 9th largest market in the EU. Domestic banks prevailed in the investor structure of the Treasury bond market, with a share of over 42%.
2013 2014 2015 2016 2017 20180
20
40
60
80
100
Banks Credit unions Insurance companies Investment funds Open pension funds Investment firms Other
%
67.6%0.4%
7.5%
11.5%
6.8%
0.3%4.7%
0.8% 0.4%
Banks Credit unions Insurance companies
Investment funds Open pension funds Investment firms
Leasing enterprises Factoring enterprises Lending companies
69.3%0.4%
7.0%
10.7%
5.8%0.2%
5.3
0.9%0.4%
Banks Credit unions Insurance companies
Investment funds Open pension funds Investment firms
Leasing enterprises Factoring enterprises Lending companies
Directions of the evolution of Poland’s financial system
20 Narodowy Bank Polski
Table 1.4. Growth in assets1 of financial institutions in Poland, 2015-2018 (y/y, %) 2015 2016 2017 2018
Financial institutions subject to KNF supervision 2
Commercial banks3 4.4 6.4 3.6 6.3
Cooperative and affiliating banks3 3.2 13.2 9.6 5.0
Credit unions -10.2 -8.1 -9.7 -5.9
Insurance companies 1.0 2.2 7.7 -3.3
Investment funds 24.5 1.1 9.9 -3.1
Open pension funds -5.8 9.2 17.0 -12.4
Brokerage houses -3.8 -18.4 9.7 -2.9
Total 5.3 5.8 5.9 2.9 Other financial intermediation institutions 4
Leasing companies 4.4 32.4 11.4 15.1
Factoring enterprises 12.7 17.2 15.3 23.0
Lending companies 23.5 19.0 10.0 0.9
Total 6.8 29.2 11.8 15.1
Total 5.4 6.9 6.2 3.6 1 Net asset value for banks, investment funds and open pension funds. 2 Includes the most important financial institutions subject to KNF supervision. 3 Banks that conduct banking activity. Commercial banks also included branches of credit institutions. 4 Includes the most important other financial intermediation institutions not subject to KNF supervision, for which
longer times series of statistical data of GUS are available. Note: Due to adjustments, the data may differ from data presented in the report’s previous edition. Source: NBP, UKNF, KSKOK and GUS.
Investment fund assets declined in 2018, following the fall in the value of assets of closed-end funds. Assets of open-ended funds increased modestly, mostly thanks to a positive balance of capital inflows and outflows. In the period under analysis, assets of open-ended funds dropped as a result of a change in asset valuation. The above trends caused the banking sector and leasing companies in the assets structure of the financial sector to gain in importance, and investment fund assets and open pension fund assets to fall (Figure 1.6 and 1.7 and Table 1.5).
The capitalisation of the Polish stock market decreased by over 18% in 2018 to PLN 1,135.9 billion, primarily on the back of stock price falls. It continued to play a significant role in the region (Table 1.6). However, the number of companies whose shares were traded on the organised market fell again. Domestic stock market liquidity continued to be low compared with the stock exchanges in developed countries. Residents were main investors on the WSE. The ratio of the capitalisation of domestic companies to Poland’s GDP at the end of 2017 was 60.1% at the end of 2018. The broad market index WIG declined by 9.5%, and stock price changes were strongly diversified depending on the size of the company. The market valuation of the smaller companies decreased the most.
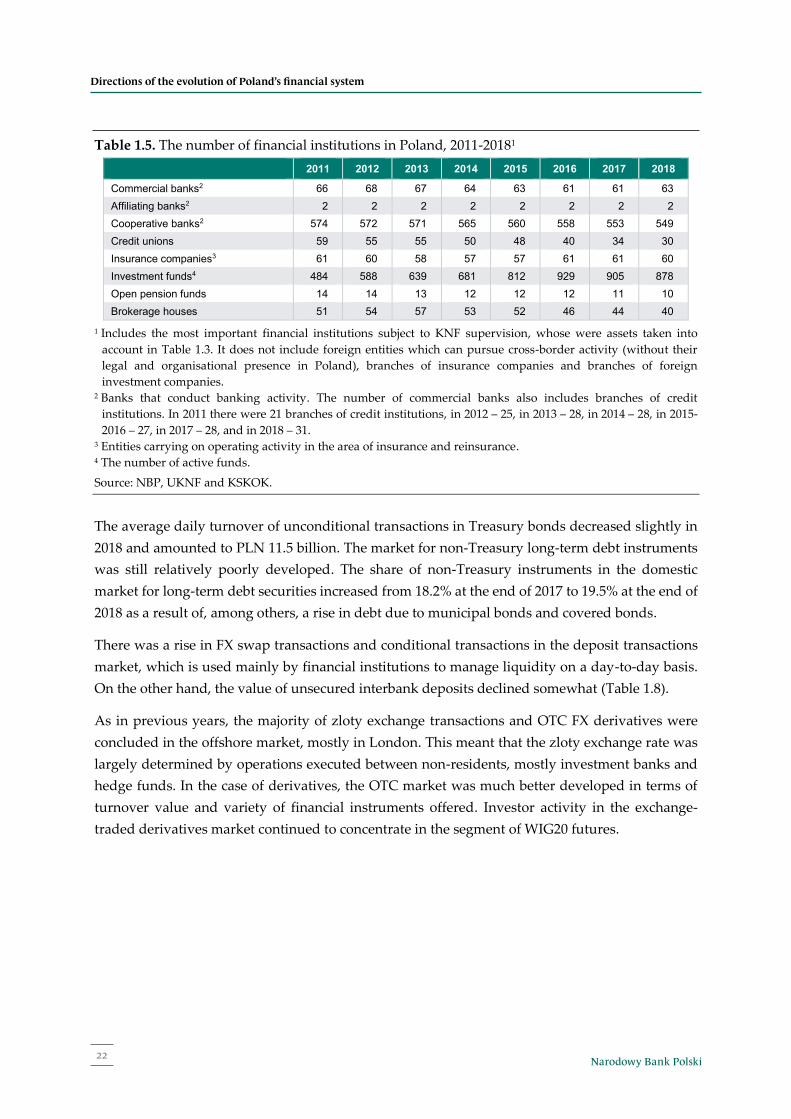
Narodowy Bank Polski22
Directions of the evolution of Poland’s financial systemDirections of the evolution of Poland’s financial system
22 Narodowy Bank Polski
Table 1.5. The number of financial institutions in Poland, 2011-20181 2011 2012 2013 2014 2015 2016 2017 2018
Commercial banks2 66 68 67 64 63 61 61 63 Affiliating banks2 2 2 2 2 2 2 2 2 Cooperative banks2 574 572 571 565 560 558 553 549 Credit unions 59 55 55 50 48 40 34 30 Insurance companies3 61 60 58 57 57 61 61 60 Investment funds4 484 588 639 681 812 929 905 878 Open pension funds 14 14 13 12 12 12 11 10 Brokerage houses 51 54 57 53 52 46 44 40
1 Includes the most important financial institutions subject to KNF supervision, whose were assets taken into account in Table 1.3. It does not include foreign entities which can pursue cross-border activity (without their legal and organisational presence in Poland), branches of insurance companies and branches of foreign investment companies.
2 Banks that conduct banking activity. The number of commercial banks also includes branches of credit institutions. In 2011 there were 21 branches of credit institutions, in 2012 – 25, in 2013 – 28, in 2014 – 28, in 2015-2016 – 27, in 2017 – 28, and in 2018 – 31.
3 Entities carrying on operating activity in the area of insurance and reinsurance. 4 The number of active funds.
Source: NBP, UKNF and KSKOK.
The average daily turnover of unconditional transactions in Treasury bonds decreased slightly in 2018 and amounted to PLN 11.5 billion. The market for non-Treasury long-term debt instruments was still relatively poorly developed. The share of non-Treasury instruments in the domestic market for long-term debt securities increased from 18.2% at the end of 2017 to 19.5% at the end of 2018 as a result of, among others, a rise in debt due to municipal bonds and covered bonds.
There was a rise in FX swap transactions and conditional transactions in the deposit transactions market, which is used mainly by financial institutions to manage liquidity on a day-to-day basis. On the other hand, the value of unsecured interbank deposits declined somewhat (Table 1.8).
As in previous years, the majority of zloty exchange transactions and OTC FX derivatives were concluded in the offshore market, mostly in London. This meant that the zloty exchange rate was largely determined by operations executed between non-residents, mostly investment banks and hedge funds. In the case of derivatives, the OTC market was much better developed in terms of turnover value and variety of financial instruments offered. Investor activity in the exchange-traded derivatives market continued to concentrate in the segment of WIG20 futures.
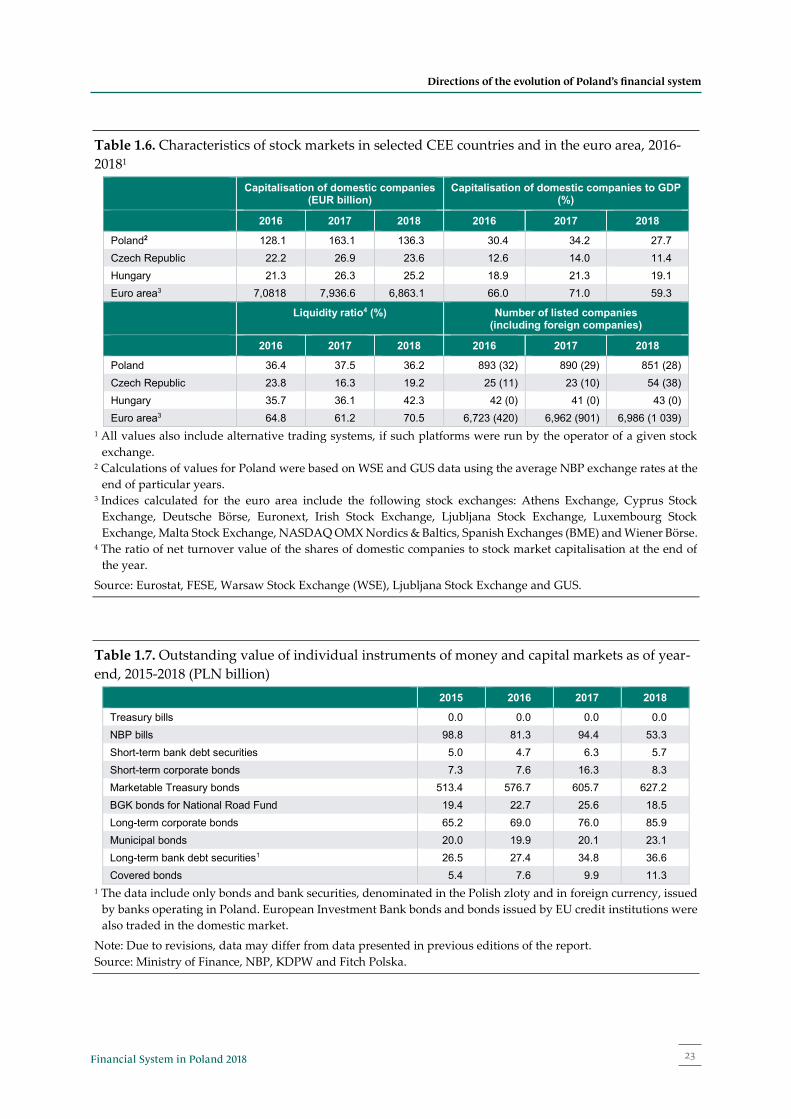
23Financial System in Poland 2018
Directions of the evolution of Poland’s financial systemDirections of the evolution of Poland’s financial system
23 Financial System in Poland 2018
Table 1.6. Characteristics of stock markets in selected CEE countries and in the euro area, 2016-20181
Capitalisation of domestic companies (EUR billion)
Capitalisation of domestic companies to GDP (%)
2016 2017 2018 2016 2017 2018
Poland2 128.1 163.1 136.3 30.4 34.2 27.7 Czech Republic 22.2 26.9 23.6 12.6 14.0 11.4 Hungary 21.3 26.3 25.2 18.9 21.3 19.1 Euro area3 7,0818 7,936.6 6,863.1 66.0 71.0 59.3
Liquidity ratio4 (%) Number of listed companies (including foreign companies)
2016 2017 2018 2016 2017 2018
Poland 36.4 37.5 36.2 893 (32) 890 (29) 851 (28) Czech Republic 23.8 16.3 19.2 25 (11) 23 (10) 54 (38) Hungary 35.7 36.1 42.3 42 (0) 41 (0) 43 (0) Euro area3 64.8 61.2 70.5 6,723 (420) 6,962 (901) 6,986 (1 039)
1 All values also include alternative trading systems, if such platforms were run by the operator of a given stock exchange.
2 Calculations of values for Poland were based on WSE and GUS data using the average NBP exchange rates at the end of particular years.
3 Indices calculated for the euro area include the following stock exchanges: Athens Exchange, Cyprus Stock Exchange, Deutsche Börse, Euronext, Irish Stock Exchange, Ljubljana Stock Exchange, Luxembourg Stock Exchange, Malta Stock Exchange, NASDAQ OMX Nordics & Baltics, Spanish Exchanges (BME) and Wiener Börse.
4 The ratio of net turnover value of the shares of domestic companies to stock market capitalisation at the end of the year.
Source: Eurostat, FESE, Warsaw Stock Exchange (WSE), Ljubljana Stock Exchange and GUS.
Table 1.7. Outstanding value of individual instruments of money and capital markets as of year-end, 2015-2018 (PLN billion)
2015 2016 2017 2018
Treasury bills 0.0 0.0 0.0 0.0 NBP bills 98.8 81.3 94.4 53.3 Short-term bank debt securities 5.0 4.7 6.3 5.7 Short-term corporate bonds 7.3 7.6 16.3 8.3 Marketable Treasury bonds 513.4 576.7 605.7 627.2 BGK bonds for National Road Fund 19.4 22.7 25.6 18.5 Long-term corporate bonds 65.2 69.0 76.0 85.9 Municipal bonds 20.0 19.9 20.1 23.1 Long-term bank debt securities1 26.5 27.4 34.8 36.6 Covered bonds 5.4 7.6 9.9 11.3
1 The data include only bonds and bank securities, denominated in the Polish zloty and in foreign currency, issued by banks operating in Poland. European Investment Bank bonds and bonds issued by EU credit institutions were also traded in the domestic market.
Note: Due to revisions, data may differ from data presented in previous editions of the report. Source: Ministry of Finance, NBP, KDPW and Fitch Polska.
Directions of the evolution of Poland’s financial system
22 Narodowy Bank Polski
Table 1.5. The number of financial institutions in Poland, 2011-20181 2011 2012 2013 2014 2015 2016 2017 2018
Commercial banks2 66 68 67 64 63 61 61 63 Affiliating banks2 2 2 2 2 2 2 2 2 Cooperative banks2 574 572 571 565 560 558 553 549 Credit unions 59 55 55 50 48 40 34 30 Insurance companies3 61 60 58 57 57 61 61 60 Investment funds4 484 588 639 681 812 929 905 878 Open pension funds 14 14 13 12 12 12 11 10 Brokerage houses 51 54 57 53 52 46 44 40
1 Includes the most important financial institutions subject to KNF supervision, whose were assets taken into account in Table 1.3. It does not include foreign entities which can pursue cross-border activity (without their legal and organisational presence in Poland), branches of insurance companies and branches of foreign investment companies.
2 Banks that conduct banking activity. The number of commercial banks also includes branches of credit institutions. In 2011 there were 21 branches of credit institutions, in 2012 – 25, in 2013 – 28, in 2014 – 28, in 2015-2016 – 27, in 2017 – 28, and in 2018 – 31.
3 Entities carrying on operating activity in the area of insurance and reinsurance. 4 The number of active funds.
Source: NBP, UKNF and KSKOK.
The average daily turnover of unconditional transactions in Treasury bonds decreased slightly in 2018 and amounted to PLN 11.5 billion. The market for non-Treasury long-term debt instruments was still relatively poorly developed. The share of non-Treasury instruments in the domestic market for long-term debt securities increased from 18.2% at the end of 2017 to 19.5% at the end of 2018 as a result of, among others, a rise in debt due to municipal bonds and covered bonds.
There was a rise in FX swap transactions and conditional transactions in the deposit transactions market, which is used mainly by financial institutions to manage liquidity on a day-to-day basis. On the other hand, the value of unsecured interbank deposits declined somewhat (Table 1.8).
As in previous years, the majority of zloty exchange transactions and OTC FX derivatives were concluded in the offshore market, mostly in London. This meant that the zloty exchange rate was largely determined by operations executed between non-residents, mostly investment banks and hedge funds. In the case of derivatives, the OTC market was much better developed in terms of turnover value and variety of financial instruments offered. Investor activity in the exchange-traded derivatives market continued to concentrate in the segment of WIG20 futures.

Narodowy Bank Polski24
Directions of the evolution of Poland’s financial systemDirections of the evolution of Poland’s financial system
24 Narodowy Bank Polski
Table 1.8. Average daily net turnover in the domestic financial market, 2015–2018 (PLN million) 2015 2016 2017 2018
Equity and debt instruments market Shares and allotment certificates 905.3 811.4 1,049.8 864.4 Treasury bonds 24, 325.3 27,167.1 28,178.6 27,352.3 Treasury bills 0.0 101.3 127.8 0.0
Deposit transactions market
FX swap transactions 11,779.2 13,729.2 13,734.8 14,580.1
Repo/SBB transactions 14,454.3 13,781.2 13,758.7 15,605.3
Unsecured interbank deposits 3,923.1 3,806.6 3,760.4 3,654.2 Derivatives transactions market
FX forwards 1,653.0 1,793.8 2,014.1 2,016.0 CIRS transactions 136.6 173.6 150.5 140.7 Currency options 331.7 350.1 347.6 394.1 FRAs 3,435.4 2,608.0 1,212.4 1,724.1 IRSs 2,361.0 2,533.4 2,291.4 2,801.9 OISs 236.5 125.1 75.1 9.8 WIG20 futures 781.5 676.1 778.0 786.1
Spot FX market 6,290.8 6,727.1 6,781.0 7,184.2
Notes: 1. Average daily net turnover means the value of transactions (turnover calculated individually). In the case of the FX swap market, turnover value was calculated for only one currency of the transaction.
2. The value of turnover in the Treasury bond and bills market takes into account unconditional and conditional transactions (repo and sell-buy-back), including transactions between non-residents. In 2015, the average daily value of unconditional transactions in the Treasury bond market amounted to PLN 9.3 billion, in 2016 ‒ PLN 12.5 billion, in 2017 ‒ PLN 13.4 billion and in 2018 ‒ PLN 11.5 billion. In the case of Treasury bills, the average daily value of unconditional transactions in 2016 was less than PLN 60 million and in 2017 almost PLN 50 million (in 2015 and 2018, Treasury bills were not traded).
3. The value of conditional transactions (repo and sell-buy-back) was calculated according to the initial exchange value. For FX swap transactions, the net turnover value was calculated according to the initial exchange value.
4. For the following markets: FX swap, FX, FX forwards, currency options and interest rate derivatives, the value represents the value of an exchange transaction involving the Polish zloty or PLN-denominated instruments. The impact of changes in the population of Money Market Dealers was eliminated.
5. Due to data revisions from banks, values for 2017 may differ from data published in the previous edition of this report.
6. The turnover in shares includes the value of session and block transactions.
7. The turnover in WIG20 futures was calculated according to settlement values, taking into account session and block transactions.
8. The turnover in the FX market and the OTC derivatives market includes domestic transactions only. It does not include the offshore market.
9. The turnover in the markets for interest rate derivatives refers to domestic money market rate instruments. Source: NBP study based on data from WSE, Ministry of Finance and NBP.
25Financial System in Poland 2018
Housholds and enterprises in the financial market in PolandHouseholds and enterprises in the financial market in Poland
25 Financial System in Poland 2018
2. Households and enterprises in the financial market in Poland
The financial system plays an important role in the circulation of capital between entities holding surplus funds an those in need of funds. The flow of funds in the financial system takes place via banks or the financial market, where businesses issue securities (shares or bonds). Investors, including households, can acquire securities either directly in the financial market or via financial institutions (i.e. investment funds).
2.1. Financial assets of households
The way in which households save is determined by both microeconomic factors (e.g. their financial standing, size and demographic structure) and macroeconomic ones (e.g. the economic situation of the country, level of interest rates). Depending on the impact of individual determinants, households decide about the amount of savings and choose specific savings and investment products. The savings of domestic households, the value of savings and the form of saving are of great importance from the point of view of financing investments, the impact of economic growth and financial system development.
Poles' attitudes towards saving have changed in recent years.16 The percentage of persons saving on an irregular basis has doubled in ten years, from 7% in 2008 to 14% in 2018. Surveys have also pointed to little interest in saving (only 9% of survey-responding Poles invest). The low percentage (9%) of persons saving for retirement may be worrying.17
The financial situation of households improved in 2018. They reported higher incomes, but spending remained at a level similar to the 2017 figure. Consequently, the surplus of disposable
16 The surveys have been carried out for 11 years by the Kronenberg Foundation. The reports on Poles’ Attitudes
Towards Saving were published in 2008-2014 and reports on Poles’ Attitudes Towards Finance were published in 2015-2018.
17 See Poles’ Attitudes Towards Saving, a survey by Kronenberg Foundation at Citi Handlowy and Think! Foundation, October 2017, pp. 3-5.
Directions of the evolution of Poland’s financial system
24 Narodowy Bank Polski
Table 1.8. Average daily net turnover in the domestic financial market, 2015–2018 (PLN million) 2015 2016 2017 2018
Equity and debt instruments market Shares and allotment certificates 905.3 811.4 1,049.8 864.4 Treasury bonds 24, 325.3 27,167.1 28,178.6 27,352.3 Treasury bills 0.0 101.3 127.8 0.0
Deposit transactions market
FX swap transactions 11,779.2 13,729.2 13,734.8 14,580.1
Repo/SBB transactions 14,454.3 13,781.2 13,758.7 15,605.3
Unsecured interbank deposits 3,923.1 3,806.6 3,760.4 3,654.2 Derivatives transactions market
FX forwards 1,653.0 1,793.8 2,014.1 2,016.0 CIRS transactions 136.6 173.6 150.5 140.7 Currency options 331.7 350.1 347.6 394.1 FRAs 3,435.4 2,608.0 1,212.4 1,724.1 IRSs 2,361.0 2,533.4 2,291.4 2,801.9 OISs 236.5 125.1 75.1 9.8 WIG20 futures 781.5 676.1 778.0 786.1
Spot FX market 6,290.8 6,727.1 6,781.0 7,184.2
Notes: 1. Average daily net turnover means the value of transactions (turnover calculated individually). In the case of the FX swap market, turnover value was calculated for only one currency of the transaction.
2. The value of turnover in the Treasury bond and bills market takes into account unconditional and conditional transactions (repo and sell-buy-back), including transactions between non-residents. In 2015, the average daily value of unconditional transactions in the Treasury bond market amounted to PLN 9.3 billion, in 2016 ‒ PLN 12.5 billion, in 2017 ‒ PLN 13.4 billion and in 2018 ‒ PLN 11.5 billion. In the case of Treasury bills, the average daily value of unconditional transactions in 2016 was less than PLN 60 million and in 2017 almost PLN 50 million (in 2015 and 2018, Treasury bills were not traded).
3. The value of conditional transactions (repo and sell-buy-back) was calculated according to the initial exchange value. For FX swap transactions, the net turnover value was calculated according to the initial exchange value.
4. For the following markets: FX swap, FX, FX forwards, currency options and interest rate derivatives, the value represents the value of an exchange transaction involving the Polish zloty or PLN-denominated instruments. The impact of changes in the population of Money Market Dealers was eliminated.
5. Due to data revisions from banks, values for 2017 may differ from data published in the previous edition of this report.
6. The turnover in shares includes the value of session and block transactions.
7. The turnover in WIG20 futures was calculated according to settlement values, taking into account session and block transactions.
8. The turnover in the FX market and the OTC derivatives market includes domestic transactions only. It does not include the offshore market.
9. The turnover in the markets for interest rate derivatives refers to domestic money market rate instruments. Source: NBP study based on data from WSE, Ministry of Finance and NBP.
Housholds and enterprises in the financial market in Poland

Narodowy Bank Polski26
Housholds and enterprises in the financial market in PolandHouseholds and enterprises in the financial market in Poland
26 Narodowy Bank Polski
income over expenditure rose, which should boost savings’ growth.18 The average monthly disposable income per capita in households grew, in real terms, by 4.3% (to PLN 1,693).19
Households’ subjective opinions on their financial situation has improved over the last few years. In 2018, 44% of households rated their financial situation as very good or rather good (in 2017, the percentage was 37.2%). The percentage of households which rated their financial situation as bad or rather bad declined (to 8.1% in 2018 from 11.2% in 2017).20 The trend of improving consumer sentiment continued, both with regard to the current financial position and projected saving expectations (Figure 2.1).
Figure 2.1. Public sentiment surveys on savings and growth rate of disposable income, 2011-2018
Notes: Quarterly values of disposable income were deflated by the quarterly CPI. The quarterly growth rate is calculated with reference to the corresponding quarter of the previous year. A positive average of household assessment balances means the preponderance of consumers who take a positive view of the changes over consumers who take a negative view of the changes. Source: The calculations are based on GUS data from Non-financial quarterly accounts by institutional sectors for the period from the 1st quarter of 2010 to the 1st quarter of 2019, at current prices, and the results of the GUS/NBP Consumer Tendency survey (2011-2018 editions), available on the website www.stat.gov.pl.
In 2018, household financial assets that can be used relatively freely grew by 5.8% and amounted to PLN 1,289.5 billion at the end of December.21 Despite their substantial growth, due to high GDP
18 "Households' available income is defined as the sum of households’ current incomes from various sources
reduced by prepayments on personal income tax made on behalf of tax payers by the tax-remitters (…), by tax on income from property, taxes paid by self-employed persons, including those in free professions and individual farmers, and by social security and health insurance premiums. (…) Available income is allocated to expenditure and savings increase". Methodological notes on household budget surveying, Warsaw, 2011, GUS, pp. 30-31.
19 Sytuacja gospodarstw domowych w 2017 r. w świetle wyników badania budżetów gospodarstw domowych [The situation of households in 2017 as evidenced by the results of the household budget survey], Informacja Sygnalna, Warsaw 30 May 2019, GUS.
20 Ibidem, p. 15. 21 The following financial assets that households can freely use were considered in this analysis: deposits at banks
and credit unions, investment fund units purchased by households, life insurance assets (including unit-linked
-55
-45
-35
-25
-15
-5
5
I II III IV I II III IV I II III IV I II III IV I II III IV I II III IV I II III IV I II III IV
2011 2012 2013 2014 2015 2016 2017 2018
95
100
105
110
115
120
125
Growth rate of quarterly disposable income – right-hand scaleAssessment of changes in financial standing of households in last 12 months – left-hand scaleAssessment of changes in money saving trends over next 12 months – left-hand scale
Average of net household assessment Growth rate
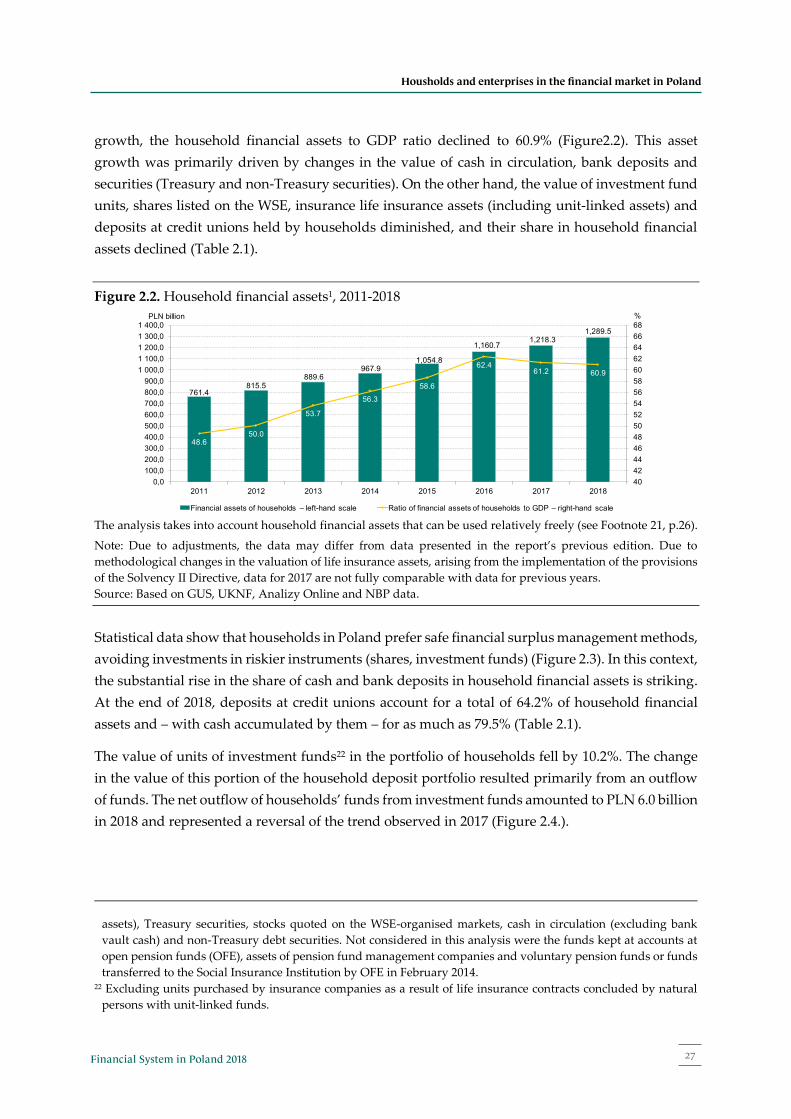
27Financial System in Poland 2018
Housholds and enterprises in the financial market in PolandHouseholds and enterprises in the financial market in Poland
27 Financial System in Poland 2018
growth, the household financial assets to GDP ratio declined to 60.9% (Figure2.2). This asset growth was primarily driven by changes in the value of cash in circulation, bank deposits and securities (Treasury and non-Treasury securities). On the other hand, the value of investment fund units, shares listed on the WSE, insurance life insurance assets (including unit-linked assets) and deposits at credit unions held by households diminished, and their share in household financial assets declined (Table 2.1).
Figure 2.2. Household financial assets1, 2011-2018
The analysis takes into account household financial assets that can be used relatively freely (see Footnote 21, p.26).
Note: Due to adjustments, the data may differ from data presented in the report’s previous edition. Due to methodological changes in the valuation of life insurance assets, arising from the implementation of the provisions of the Solvency II Directive, data for 2017 are not fully comparable with data for previous years. Source: Based on GUS, UKNF, Analizy Online and NBP data.
Statistical data show that households in Poland prefer safe financial surplus management methods, avoiding investments in riskier instruments (shares, investment funds) (Figure 2.3). In this context, the substantial rise in the share of cash and bank deposits in household financial assets is striking. At the end of 2018, deposits at credit unions account for a total of 64.2% of household financial assets and – with cash accumulated by them – for as much as 79.5% (Table 2.1).
The value of units of investment funds22 in the portfolio of households fell by 10.2%. The change in the value of this portion of the household deposit portfolio resulted primarily from an outflow of funds. The net outflow of households’ funds from investment funds amounted to PLN 6.0 billion in 2018 and represented a reversal of the trend observed in 2017 (Figure 2.4.).
assets), Treasury securities, stocks quoted on the WSE-organised markets, cash in circulation (excluding bank vault cash) and non-Treasury debt securities. Not considered in this analysis were the funds kept at accounts at open pension funds (OFE), assets of pension fund management companies and voluntary pension funds or funds transferred to the Social Insurance Institution by OFE in February 2014.
22 Excluding units purchased by insurance companies as a result of life insurance contracts concluded by natural persons with unit-linked funds.
761.4815.5
889.6967.9
1,054.8
1,160.71,218.3
1,289.5
48.650.0
53.7
56.3
58.6
62.461.2 60.9
404244464850525456586062646668
0,0 100,0 200,0 300,0 400,0 500,0 600,0 700,0 800,0 900,0
1 000,01 100,01 200,01 300,01 400,0
2011 2012 2013 2014 2015 2016 2017 2018
Financial assets of households – left-hand scale Ratio of financial assets of households to GDP – right-hand scale
PLN billion %
Households and enterprises in the financial market in Poland
26 Narodowy Bank Polski
income over expenditure rose, which should boost savings’ growth.18 The average monthly disposable income per capita in households grew, in real terms, by 4.3% (to PLN 1,693).19
Households’ subjective opinions on their financial situation has improved over the last few years. In 2018, 44% of households rated their financial situation as very good or rather good (in 2017, the percentage was 37.2%). The percentage of households which rated their financial situation as bad or rather bad declined (to 8.1% in 2018 from 11.2% in 2017).20 The trend of improving consumer sentiment continued, both with regard to the current financial position and projected saving expectations (Figure 2.1).
Figure 2.1. Public sentiment surveys on savings and growth rate of disposable income, 2011-2018
Notes: Quarterly values of disposable income were deflated by the quarterly CPI. The quarterly growth rate is calculated with reference to the corresponding quarter of the previous year. A positive average of household assessment balances means the preponderance of consumers who take a positive view of the changes over consumers who take a negative view of the changes. Source: The calculations are based on GUS data from Non-financial quarterly accounts by institutional sectors for the period from the 1st quarter of 2010 to the 1st quarter of 2019, at current prices, and the results of the GUS/NBP Consumer Tendency survey (2011-2018 editions), available on the website www.stat.gov.pl.
In 2018, household financial assets that can be used relatively freely grew by 5.8% and amounted to PLN 1,289.5 billion at the end of December.21 Despite their substantial growth, due to high GDP
18 "Households' available income is defined as the sum of households’ current incomes from various sources
reduced by prepayments on personal income tax made on behalf of tax payers by the tax-remitters (…), by tax on income from property, taxes paid by self-employed persons, including those in free professions and individual farmers, and by social security and health insurance premiums. (…) Available income is allocated to expenditure and savings increase". Methodological notes on household budget surveying, Warsaw, 2011, GUS, pp. 30-31.
19 Sytuacja gospodarstw domowych w 2017 r. w świetle wyników badania budżetów gospodarstw domowych [The situation of households in 2017 as evidenced by the results of the household budget survey], Informacja Sygnalna, Warsaw 30 May 2019, GUS.
20 Ibidem, p. 15. 21 The following financial assets that households can freely use were considered in this analysis: deposits at banks
and credit unions, investment fund units purchased by households, life insurance assets (including unit-linked
-55
-45
-35
-25
-15
-5
5
I II III IV I II III IV I II III IV I II III IV I II III IV I II III IV I II III IV I II III IV
2011 2012 2013 2014 2015 2016 2017 2018
95
100
105
110
115
120
125
Growth rate of quarterly disposable income – right-hand scaleAssessment of changes in financial standing of households in last 12 months – left-hand scaleAssessment of changes in money saving trends over next 12 months – left-hand scale
Average of net household assessment Growth rate

Narodowy Bank Polski28
Housholds and enterprises in the financial market in PolandHouseholds and enterprises in the financial market in Poland
28 Narodowy Bank Polski
Figure 2.3. Structure of household financial assets1, 2011-2018, as at period-ends
1 The analysis takes into account household financial assets that can be used relatively freely (see Footnote 21, p.26).
Notes: For the years 2010-2016, ”Unit-linked funds” is presented jointly with life insurance saving premiums. Since 2017, life insurance assets (including unit-linked assets). Due to the asset valuation based on the provisions of the Solvency II Directive, data since 2017 have not been fully comparable with data for previous years. Source: Study based on UKNF, Analizy Online and NBP data.
In 2018, the value of life insurance assets (including unit-linked assets) in the household portfolio decreased by PLN 7.5 billion, i.e. by 10.9%.23 The decrease came primarily as a result of lower interest in unit-linked funds, which resulted in a large net outflow of funds.
Figure 2.4. Net inflow of funds from households to investment funds and the change in value of household bank deposits in PLN, 2017-2018
Note: ”Households” also includes non-commercial institutions offering services to households. Source: Calculations based on NBP data.
23 Since 2017, the amounts have been calculated in accordance with the provisions of the Solvency II Directive, i.e.
Directive 2009/138/EC of the European Parliament and of the Council of 25 November 2009 on the taking-up and pursuit of the business of Insurance and Reinsurance (Official Journal of the European Union L335, p. 1). The directive introduced changes in the rule of valuation of assets and liabilities of insurance undertakings, which significantly impacted the value of technical provisions, causing them to decline substantially in the new system. Consequently, the shown value of the assets of households declined. See Box 4.8.1 New Solvency Rules in the Insurance Sector in Financial System in Poland 2016, Warsaw 2017, NBP, pp. 211-212.
2013 2014 2015 2016 2017 2018 VI 20190
100200300400500600700800900
1 0001 1001 2001 3001 400
Bank deposits Deposits at credit unionsUnits of investment funds Units of unit-linked fundsTreasury securities Shares listed on WSENon-Treasury securities Cash in circulation (excluding bank vault cash)
PLN billion
3.1 4.0 4.1 5.3 5.5
-7.8
-1.0 -2.7
9
-0.3
2.2
19.2
13.3 12.4 13
36.2
-10
-5
0
5
10
15
20
25
30
35
40
I II III IV I II III IV
2017 2018
Inflow of funds to investment funds Change in the value of household deposits (banking sector)
mld złPLN billion
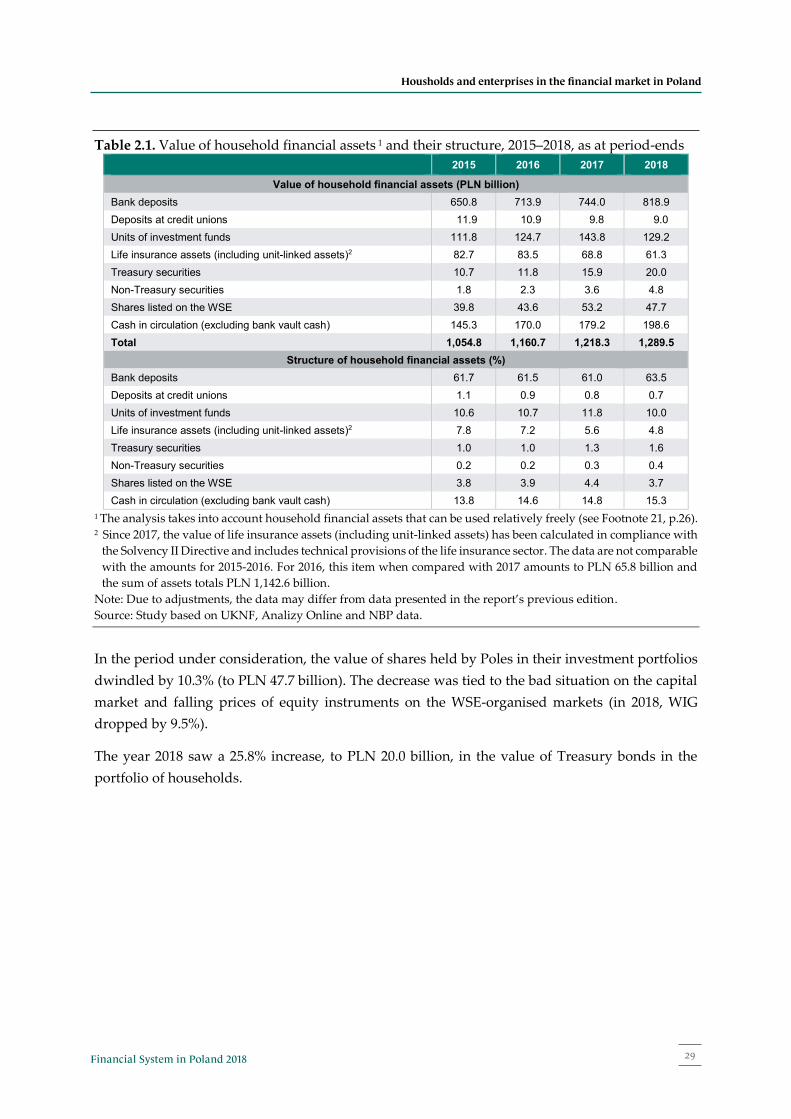
29Financial System in Poland 2018
Housholds and enterprises in the financial market in PolandHouseholds and enterprises in the financial market in Poland
29 Financial System in Poland 2018
Table 2.1. Value of household financial assets 1 and their structure, 2015–2018, as at period-ends 2015 2016 2017 2018
Value of household financial assets (PLN billion) Bank deposits 650.8 713.9 744.0 818.9 Deposits at credit unions 11.9 10.9 9.8 9.0 Units of investment funds 111.8 124.7 143.8 129.2 Life insurance assets (including unit-linked assets)2 82.7 83.5 68.8 61.3 Treasury securities 10.7 11.8 15.9 20.0 Non-Treasury securities 1.8 2.3 3.6 4.8 Shares listed on the WSE 39.8 43.6 53.2 47.7 Cash in circulation (excluding bank vault cash) 145.3 170.0 179.2 198.6 Total 1,054.8 1,160.7 1,218.3 1,289.5
Structure of household financial assets (%) Bank deposits 61.7 61.5 61.0 63.5 Deposits at credit unions 1.1 0.9 0.8 0.7 Units of investment funds 10.6 10.7 11.8 10.0 Life insurance assets (including unit-linked assets)2 7.8 7.2 5.6 4.8 Treasury securities 1.0 1.0 1.3 1.6 Non-Treasury securities 0.2 0.2 0.3 0.4 Shares listed on the WSE 3.8 3.9 4.4 3.7 Cash in circulation (excluding bank vault cash) 13.8 14.6 14.8 15.3
1 The analysis takes into account household financial assets that can be used relatively freely (see Footnote 21, p.26). 2 Since 2017, the value of life insurance assets (including unit-linked assets) has been calculated in compliance with
the Solvency II Directive and includes technical provisions of the life insurance sector. The data are not comparable with the amounts for 2015-2016. For 2016, this item when compared with 2017 amounts to PLN 65.8 billion and the sum of assets totals PLN 1,142.6 billion.
Note: Due to adjustments, the data may differ from data presented in the report’s previous edition. Source: Study based on UKNF, Analizy Online and NBP data.
In the period under consideration, the value of shares held by Poles in their investment portfolios dwindled by 10.3% (to PLN 47.7 billion). The decrease was tied to the bad situation on the capital market and falling prices of equity instruments on the WSE-organised markets (in 2018, WIG dropped by 9.5%).
The year 2018 saw a 25.8% increase, to PLN 20.0 billion, in the value of Treasury bonds in the portfolio of households.
Households and enterprises in the financial market in Poland
28 Narodowy Bank Polski
Figure 2.3. Structure of household financial assets1, 2011-2018, as at period-ends
1 The analysis takes into account household financial assets that can be used relatively freely (see Footnote 21, p.26).
Notes: For the years 2010-2016, ”Unit-linked funds” is presented jointly with life insurance saving premiums. Since 2017, life insurance assets (including unit-linked assets). Due to the asset valuation based on the provisions of the Solvency II Directive, data since 2017 have not been fully comparable with data for previous years. Source: Study based on UKNF, Analizy Online and NBP data.
In 2018, the value of life insurance assets (including unit-linked assets) in the household portfolio decreased by PLN 7.5 billion, i.e. by 10.9%.23 The decrease came primarily as a result of lower interest in unit-linked funds, which resulted in a large net outflow of funds.
Figure 2.4. Net inflow of funds from households to investment funds and the change in value of household bank deposits in PLN, 2017-2018
Note: ”Households” also includes non-commercial institutions offering services to households. Source: Calculations based on NBP data.
23 Since 2017, the amounts have been calculated in accordance with the provisions of the Solvency II Directive, i.e.
Directive 2009/138/EC of the European Parliament and of the Council of 25 November 2009 on the taking-up and pursuit of the business of Insurance and Reinsurance (Official Journal of the European Union L335, p. 1). The directive introduced changes in the rule of valuation of assets and liabilities of insurance undertakings, which significantly impacted the value of technical provisions, causing them to decline substantially in the new system. Consequently, the shown value of the assets of households declined. See Box 4.8.1 New Solvency Rules in the Insurance Sector in Financial System in Poland 2016, Warsaw 2017, NBP, pp. 211-212.
2013 2014 2015 2016 2017 2018 VI 20190
100200300400500600700800900
1 0001 1001 2001 3001 400
Bank deposits Deposits at credit unionsUnits of investment funds Units of unit-linked fundsTreasury securities Shares listed on WSENon-Treasury securities Cash in circulation (excluding bank vault cash)
PLN billion
3.1 4.0 4.1 5.3 5.5
-7.8
-1.0 -2.7
9
-0.3
2.2
19.2
13.3 12.4 13
36.2
-10
-5
0
5
10
15
20
25
30
35
40
I II III IV I II III IV
2017 2018
Inflow of funds to investment funds Change in the value of household deposits (banking sector)
mld złPLN billion
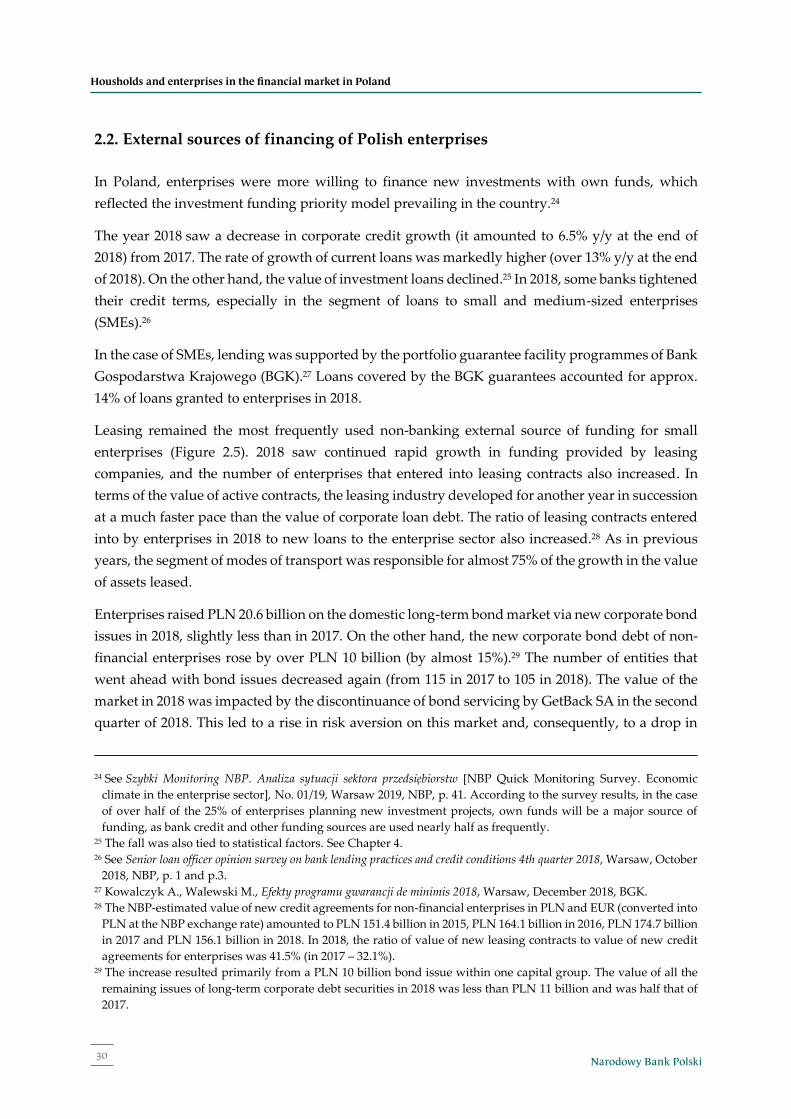
Narodowy Bank Polski30
Housholds and enterprises in the financial market in PolandHouseholds and enterprises in the financial market in Poland
30 Narodowy Bank Polski
2.2. External sources of financing of Polish enterprises
In Poland, enterprises were more willing to finance new investments with own funds, which reflected the investment funding priority model prevailing in the country.24
The year 2018 saw a decrease in corporate credit growth (it amounted to 6.5% y/y at the end of 2018) from 2017. The rate of growth of current loans was markedly higher (over 13% y/y at the end of 2018). On the other hand, the value of investment loans declined.25 In 2018, some banks tightened their credit terms, especially in the segment of loans to small and medium-sized enterprises (SMEs).26
In the case of SMEs, lending was supported by the portfolio guarantee facility programmes of Bank Gospodarstwa Krajowego (BGK).27 Loans covered by the BGK guarantees accounted for approx. 14% of loans granted to enterprises in 2018.
Leasing remained the most frequently used non-banking external source of funding for small enterprises (Figure 2.5). 2018 saw continued rapid growth in funding provided by leasing companies, and the number of enterprises that entered into leasing contracts also increased. In terms of the value of active contracts, the leasing industry developed for another year in succession at a much faster pace than the value of corporate loan debt. The ratio of leasing contracts entered into by enterprises in 2018 to new loans to the enterprise sector also increased.28 As in previous years, the segment of modes of transport was responsible for almost 75% of the growth in the value of assets leased.
Enterprises raised PLN 20.6 billion on the domestic long-term bond market via new corporate bond issues in 2018, slightly less than in 2017. On the other hand, the new corporate bond debt of non-financial enterprises rose by over PLN 10 billion (by almost 15%).29 The number of entities that went ahead with bond issues decreased again (from 115 in 2017 to 105 in 2018). The value of the market in 2018 was impacted by the discontinuance of bond servicing by GetBack SA in the second quarter of 2018. This led to a rise in risk aversion on this market and, consequently, to a drop in
24 See Szybki Monitoring NBP. Analiza sytuacji sektora przedsiębiorstw [NBP Quick Monitoring Survey. Economic
climate in the enterprise sector], No. 01/19, Warsaw 2019, NBP, p. 41. According to the survey results, in the case of over half of the 25% of enterprises planning new investment projects, own funds will be a major source of funding, as bank credit and other funding sources are used nearly half as frequently.
25 The fall was also tied to statistical factors. See Chapter 4. 26 See Senior loan officer opinion survey on bank lending practices and credit conditions 4th quarter 2018, Warsaw, October
2018, NBP, p. 1 and p.3. 27 Kowalczyk A., Walewski M., Efekty programu gwarancji de minimis 2018, Warsaw, December 2018, BGK. 28 The NBP-estimated value of new credit agreements for non-financial enterprises in PLN and EUR (converted into
PLN at the NBP exchange rate) amounted to PLN 151.4 billion in 2015, PLN 164.1 billion in 2016, PLN 174.7 billion in 2017 and PLN 156.1 billion in 2018. In 2018, the ratio of value of new leasing contracts to value of new credit agreements for enterprises was 41.5% (in 2017 – 32.1%).
29 The increase resulted primarily from a PLN 10 billion bond issue within one capital group. The value of all the remaining issues of long-term corporate debt securities in 2018 was less than PLN 11 billion and was half that of 2017.
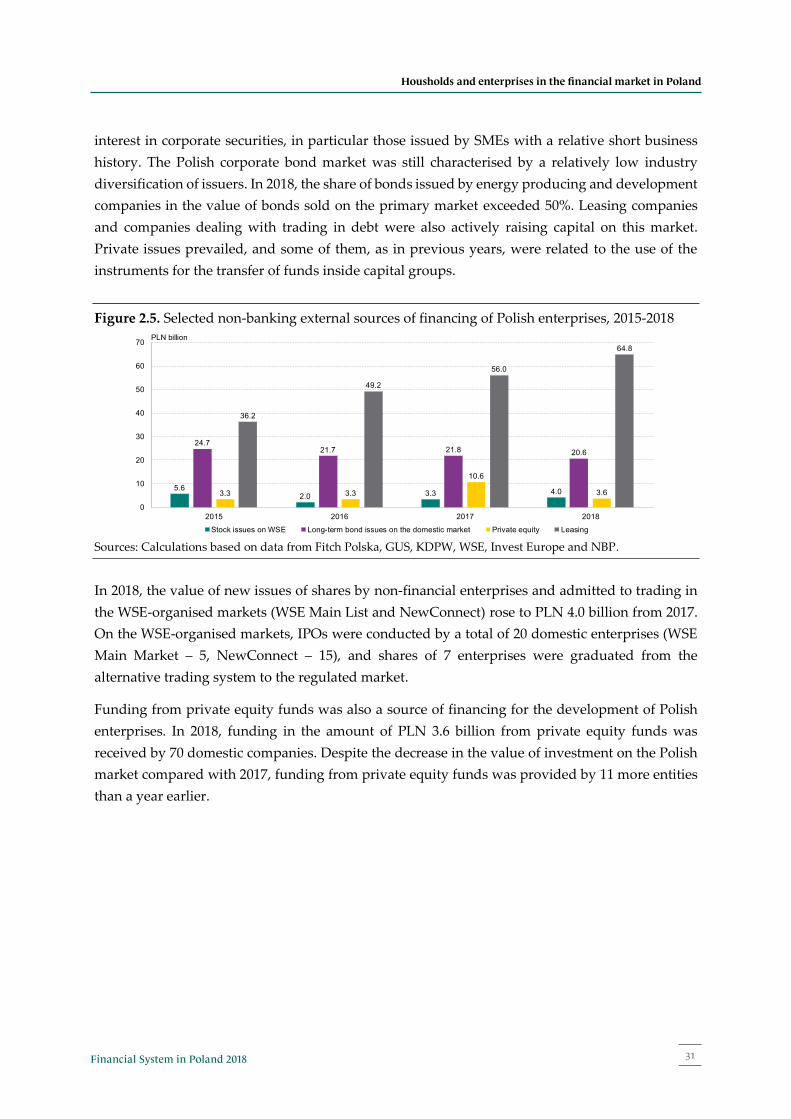
31Financial System in Poland 2018
Housholds and enterprises in the financial market in PolandHouseholds and enterprises in the financial market in Poland
31 Financial System in Poland 2018
interest in corporate securities, in particular those issued by SMEs with a relative short business history. The Polish corporate bond market was still characterised by a relatively low industry diversification of issuers. In 2018, the share of bonds issued by energy producing and development companies in the value of bonds sold on the primary market exceeded 50%. Leasing companies and companies dealing with trading in debt were also actively raising capital on this market. Private issues prevailed, and some of them, as in previous years, were related to the use of the instruments for the transfer of funds inside capital groups.
Figure 2.5. Selected non-banking external sources of financing of Polish enterprises, 2015-2018
Sources: Calculations based on data from Fitch Polska, GUS, KDPW, WSE, Invest Europe and NBP.
In 2018, the value of new issues of shares by non-financial enterprises and admitted to trading in the WSE-organised markets (WSE Main List and NewConnect) rose to PLN 4.0 billion from 2017. On the WSE-organised markets, IPOs were conducted by a total of 20 domestic enterprises (WSE Main Market – 5, NewConnect – 15), and shares of 7 enterprises were graduated from the alternative trading system to the regulated market.
Funding from private equity funds was also a source of financing for the development of Polish enterprises. In 2018, funding in the amount of PLN 3.6 billion from private equity funds was received by 70 domestic companies. Despite the decrease in the value of investment on the Polish market compared with 2017, funding from private equity funds was provided by 11 more entities than a year earlier.
5.62.0 3.3 4.0
24.721.7 21.8 20.6
3.3 3.3
10.6
3.6
36.2
49.2
56.0
64.8
0
10
20
30
40
50
60
70
2015 2016 2017 2018
Stock issues on WSE Long-term bond issues on the domestic market Private equity Leasing
PLN billion
Households and enterprises in the financial market in Poland
30 Narodowy Bank Polski
2.2. External sources of financing of Polish enterprises
In Poland, enterprises were more willing to finance new investments with own funds, which reflected the investment funding priority model prevailing in the country.24
The year 2018 saw a decrease in corporate credit growth (it amounted to 6.5% y/y at the end of 2018) from 2017. The rate of growth of current loans was markedly higher (over 13% y/y at the end of 2018). On the other hand, the value of investment loans declined.25 In 2018, some banks tightened their credit terms, especially in the segment of loans to small and medium-sized enterprises (SMEs).26
In the case of SMEs, lending was supported by the portfolio guarantee facility programmes of Bank Gospodarstwa Krajowego (BGK).27 Loans covered by the BGK guarantees accounted for approx. 14% of loans granted to enterprises in 2018.
Leasing remained the most frequently used non-banking external source of funding for small enterprises (Figure 2.5). 2018 saw continued rapid growth in funding provided by leasing companies, and the number of enterprises that entered into leasing contracts also increased. In terms of the value of active contracts, the leasing industry developed for another year in succession at a much faster pace than the value of corporate loan debt. The ratio of leasing contracts entered into by enterprises in 2018 to new loans to the enterprise sector also increased.28 As in previous years, the segment of modes of transport was responsible for almost 75% of the growth in the value of assets leased.
Enterprises raised PLN 20.6 billion on the domestic long-term bond market via new corporate bond issues in 2018, slightly less than in 2017. On the other hand, the new corporate bond debt of non-financial enterprises rose by over PLN 10 billion (by almost 15%).29 The number of entities that went ahead with bond issues decreased again (from 115 in 2017 to 105 in 2018). The value of the market in 2018 was impacted by the discontinuance of bond servicing by GetBack SA in the second quarter of 2018. This led to a rise in risk aversion on this market and, consequently, to a drop in
24 See Szybki Monitoring NBP. Analiza sytuacji sektora przedsiębiorstw [NBP Quick Monitoring Survey. Economic
climate in the enterprise sector], No. 01/19, Warsaw 2019, NBP, p. 41. According to the survey results, in the case of over half of the 25% of enterprises planning new investment projects, own funds will be a major source of funding, as bank credit and other funding sources are used nearly half as frequently.
25 The fall was also tied to statistical factors. See Chapter 4. 26 See Senior loan officer opinion survey on bank lending practices and credit conditions 4th quarter 2018, Warsaw, October
2018, NBP, p. 1 and p.3. 27 Kowalczyk A., Walewski M., Efekty programu gwarancji de minimis 2018, Warsaw, December 2018, BGK. 28 The NBP-estimated value of new credit agreements for non-financial enterprises in PLN and EUR (converted into
PLN at the NBP exchange rate) amounted to PLN 151.4 billion in 2015, PLN 164.1 billion in 2016, PLN 174.7 billion in 2017 and PLN 156.1 billion in 2018. In 2018, the ratio of value of new leasing contracts to value of new credit agreements for enterprises was 41.5% (in 2017 – 32.1%).
29 The increase resulted primarily from a PLN 10 billion bond issue within one capital group. The value of all the remaining issues of long-term corporate debt securities in 2018 was less than PLN 11 billion and was half that of 2017.

Narodowy Bank Polski32
Housholds and enterprises in the financial market in Poland
Households and enterprises in the financial market in Poland
32 Narodowy Bank Polski
Box 2.1. Use of financial services via the internet. Poland compared with EU countries
The internet and digital technologies have a significant impact on the functioning and development of the financial system. Many of the innovative solutions used by financial institutions nowadays are based on them.
Studies conducted by Eurostat and the European Commission provide valuable insight into the level and directions of the development of the digital economy and the extent of the use of modern digital technologies. They also enable a comparative analysis on an international scale, showing the position of Poland against the background of other EU countries.
The Digital Economy and Society Index (DESI)1, published by the European Commission since 2015, is a synthetic indicator that allows to monitor the level of digital development of a given country. This index includes a number of indicators characterising five areas related to the digitisation of society and the economy, i.e. connectivity, human capital, use of internet services (including use of internet banking), integration of digital technology, and digital public services.2 The DESI is an indicator that, among others, evaluates the potential of a given economy, supporting the development of digital services and the preparedness of society to make use of the services offered in this way, including financial services.
In the ranking of the Digital Economy and Society Index (DESI 20193, based on data from 2018), prepared by the European Commission, Poland was in 25th place (the DESI for Poland was 41.6). The highest result, reaching 70, was achieved by Finland, followed by Sweden, Netherlands and Denmark (Figure I, left-hand panel). Despite a significant increase in the index for Poland in successive editions of the DESI (from 2014 to 2019), the gap to the EU has only been reduced slightly and Poland has failed to move up the general rankings (Figure I, right-hand panel).
Figure I. Digital Economy and Society Index (DESI) 2019 for EU countries (left-hand panel) and DESI for EU28 and Poland for 2014-2019 (right-hand panel)
Note: The index for individual years has been created from indicators from the calendar year preceding the publication date of the index (if data from that calendar year were not available, the latest data from previous years were taken into account). So, for example, the DESI 2019 was created from indicators from the calendar year 2018 (in the case of a lack of data for that year, the latest data from before 2018 were used). Source: European Commission (https://digital-agenda-data.eu/).
As part of the European Commission study into take-up of information and communications technology by households and individuals in EU countries, some of the questions concerned financial services, i.e. internet banking and the use of selected financial services via the internet.4
Internet banking includes electronic transactions with a bank, such as payments, transfers etc., and also checking the balance of one’s account via the internet.5 Therefore this concerns the basic activities related to holding and servicing a bank account. The extent of the use of internet banking by EU residents in
0
10
20
30
40
50
60
70
80
Finl
and
Sw
eden
Net
herla
nds
Den
mar
kU
nite
d K
ingd
omLu
xem
bour
gIre
land
Est
onia
Bel
gium
Mal
taS
pain
Ger
man
yA
ustri
aE
U28
Lith
uani
aFr
ance
Slo
veni
aLa
tvia
Cze
ch R
epub
licP
ortu
gal
Cro
atia
Slo
vaki
aC
ypru
sH
unga
ryIta
lyP
olan
dG
reec
eR
oman
iaB
ulga
ria
0
10
20
30
40
50
60
2014 2015 2016 2017 2018 2019
EU28 Poland
33Financial System in Poland 2018
Housholds and enterprises in the financial market in PolandHouseholds and enterprises in the financial market in Poland
33 Financial System in Poland 2018
2018 varied greatly.6 In the five countries with the highest DESI, this indicator reached at least 90% (the Netherlands, Finland, Denmark, Sweden and Estonia). Poland, with a 57% share, occupied 19th place in the EU. The lowest indicator was in Bulgaria (11%) and Romania (10%) (Figure II, left-hand panel).
There is a strong linear dependence between the level of the DESI and the share of people using internet banking, as evidenced by the high level of the Pearson linear correlation coefficient, which amounted to 0.87 (for data from 2018). This meant that the level of development of internet banking, and also the use of financial services via the internet, which will be discussed next, was determined by, among others, the general level of development of the digital economy and digital society, in the given country.
Figure II. People who use internet banking1 in EU countries (%) (left-hand panel) and in Poland (by age structure, %) (right-hand panel), 2018
1 Percentage share of people aged 16-74 using internet banking among people using the internet during the last three months. Source: Eurostat and NBP calculations based on GUS data.
In the years 2011-2018, the share of people using internet banking increased in Poland from 44% to 57%. However, this did not close the distance between Poland and the average for EU countries.
The age structure of people using internet banking in Poland reflected the well-known rule of greater interest in services available via the internet among the younger generation. The share of people using internet banking among the age groups 25-34 and 35-44 was 59%, and was much higher than the share of these people in the demographic structure (40.5%) or compared to the age structure of people using the internet (49.8%) (Figure II, right-hand panel). This difference in the share was even greater (share above 65%) in the case of access to internet banking via a mobile application (i.e. with the use of a smartphone), particularly by people aged 25-34.
Internet banking covers a relatively simple set of banking services related, above all, with settlements and making available information about the bank account. Since 2016, Eurostat has also studied the level of use of a broader range of financial services via the internet by individuals.7
Compared to internet banking, a smaller percentage of EU residents used other financial services via the internet in 2018. In this case too, the situation of individual countries varied greatly. The most advanced countries in terms of development of the digital economy (with the highest DESI) – the United Kingdom, Estonia, Sweden, the Netherlands and Finland – were characterised by the highest ratio of people using financial services via the internet. On the other hand, the lowest share of people using financial services via the internet was in countries with low DESI, such as Romania, Bulgaria, Cyprus and Greece. Poland, with a share of 6%, occupied 23rd place among EU countries (Figure III, left-hand panel).
As in the case of internet banking, so too in the case of the use of financial services via the internet a marked prevalence of clients from two age groups – 25-34 and 35-44 – can be clearly seen in Poland. The share of people in this age group purchasing financial services via the internet is much higher than their share in the demographic structure of people aged 16-74. Importantly, the difference in the share of age groups in the 16 to 44 category compared to their share in the demographic structure was higher than in
0102030405060708090
100
Net
herla
nds
Finl
and
Den
mar
kS
wed
enE
ston
iaLa
tvia
Bel
gium
Uni
ted
Kin
gdom
Lith
uani
aC
zech
Rep
ublic
Fran
ceIre
land
Luxe
mbo
urg
Aus
tria
EU
28G
erm
any
Mal
taS
lova
kia
Spa
inP
olan
dC
roat
iaH
unga
ryS
love
nia
Por
tuga
lIta
lyC
ypru
sG
reec
eB
ulga
riaR
oman
ia
%
0
5
10
15
20
25
30
35
40
16-24 25-34 35-44 45-54 55-64 66-74
%
People who use internet banking People who use internat banking via mobile applicationDemographic structure – a percentage of a given age group Age structure of internet users over last 3M
Households and enterprises in the financial market in Poland
32 Narodowy Bank Polski
Box 2.1. Use of financial services via the internet. Poland compared with EU countries
The internet and digital technologies have a significant impact on the functioning and development of the financial system. Many of the innovative solutions used by financial institutions nowadays are based on them.
Studies conducted by Eurostat and the European Commission provide valuable insight into the level and directions of the development of the digital economy and the extent of the use of modern digital technologies. They also enable a comparative analysis on an international scale, showing the position of Poland against the background of other EU countries.
The Digital Economy and Society Index (DESI)1, published by the European Commission since 2015, is a synthetic indicator that allows to monitor the level of digital development of a given country. This index includes a number of indicators characterising five areas related to the digitisation of society and the economy, i.e. connectivity, human capital, use of internet services (including use of internet banking), integration of digital technology, and digital public services.2 The DESI is an indicator that, among others, evaluates the potential of a given economy, supporting the development of digital services and the preparedness of society to make use of the services offered in this way, including financial services.
In the ranking of the Digital Economy and Society Index (DESI 20193, based on data from 2018), prepared by the European Commission, Poland was in 25th place (the DESI for Poland was 41.6). The highest result, reaching 70, was achieved by Finland, followed by Sweden, Netherlands and Denmark (Figure I, left-hand panel). Despite a significant increase in the index for Poland in successive editions of the DESI (from 2014 to 2019), the gap to the EU has only been reduced slightly and Poland has failed to move up the general rankings (Figure I, right-hand panel).
Figure I. Digital Economy and Society Index (DESI) 2019 for EU countries (left-hand panel) and DESI for EU28 and Poland for 2014-2019 (right-hand panel)
Note: The index for individual years has been created from indicators from the calendar year preceding the publication date of the index (if data from that calendar year were not available, the latest data from previous years were taken into account). So, for example, the DESI 2019 was created from indicators from the calendar year 2018 (in the case of a lack of data for that year, the latest data from before 2018 were used). Source: European Commission (https://digital-agenda-data.eu/).
As part of the European Commission study into take-up of information and communications technology by households and individuals in EU countries, some of the questions concerned financial services, i.e. internet banking and the use of selected financial services via the internet.4
Internet banking includes electronic transactions with a bank, such as payments, transfers etc., and also checking the balance of one’s account via the internet.5 Therefore this concerns the basic activities related to holding and servicing a bank account. The extent of the use of internet banking by EU residents in
0
10
20
30
40
50
60
70
80
Finl
and
Sw
eden
Net
herla
nds
Den
mar
kU
nite
d K
ingd
omLu
xem
bour
gIre
land
Est
onia
Bel
gium
Mal
taS
pain
Ger
man
yA
ustri
aE
U28
Lith
uani
aFr
ance
Slo
veni
aLa
tvia
Cze
ch R
epub
licP
ortu
gal
Cro
atia
Slo
vaki
aC
ypru
sH
unga
ryIta
lyP
olan
dG
reec
eR
oman
iaB
ulga
ria
0
10
20
30
40
50
60
2014 2015 2016 2017 2018 2019
EU28 Poland

Narodowy Bank Polski34
Housholds and enterprises in the financial market in PolandHouseholds and enterprises in the financial market in Poland
34 Narodowy Bank Polski
the case of users of internet banking. This is a result of the specific needs and financial possibilities of clients, which change depending on age (Figure III, right-hand panel).
Figure III. People who use at least one financial service over the internet1 in EU (%) (left-hand panel) and in Poland2 (by age structure, %) (right-hand panel), 2018
1 Share of people aged 16-74 using at least one financial service via the internet during the last 12 months in the same age
group of people using the internet in the last 12 months. 2 Structure according to age group of people using the internet during the last 12 months and using at least one financial
service via the internet during the last 12 months. The demographic structure presents the share of individual age groups in the total population aged 16-74.
Note: Due to the low reliability of data for Latvia indicated by Eurostat in the study for 2018, the results of the study for 2017 have been included for Latvia. Source: Eurostat and NBP calculations based on GUS data.
The presented results of the Eurostat and European Commission studies show that the development and extent of the use of financial services via the internet is dependent on, among others, the general level of development of the digital economy and digital society in the given country. The relation of the DESI to the share of people using internet banking was practically linear. The higher the DESI, the higher the share of people using internet banking (Figure IV – left-hand panel). In the case of the share of people using financial services via the internet, this dependence has the shape of an exponential function (Figure IV – right-hand panel).
Figure IV. DESI 20191 and the percentage of people who use internet banking2 (left-hand panel) and percentage of people who use financial services over the internet3 (right-hand panel) for EU countries, 2018
1 The DESI 2019 was created from indicators from the calendar year 2018 (in the case of lack of data for this year, the latest
data before 2018 was used). 2 Percentage share of people aged 16-74 using internet banking via the internet among people in using the internet in the last
3 months. 3 Share of people aged 16-74 using at least one financial service via the internet during the last 12 months in the same age
group of people using the internet in the last 12 months. Due to the low reliability of data for Latvia indicated by Eurostat in the study for 2018, the results of the study for 2017 have been included for Latvia.
Source: NBP calculations based on European Commission and Eurostat data.
05
101520253035404550
Uni
ted
Kin
gdom
Est
onia
Sw
eden
Net
herla
nds
Finl
and
Den
mar
kLa
tvia
Irela
ndE
U28
Lith
uani
aC
zech
Rep
ublic
Ger
man
yM
alta
Luxe
mbo
urg
Spa
inP
ortu
gal
Slo
vaki
aS
love
nia
Bel
gium
Fran
ceIta
lyH
unga
ryA
ustri
aP
olan
dG
reec
eC
roat
iaC
ypru
sB
ulga
riaR
oman
ia
%
0
5
10
15
20
25
30
35
40
16-24 25-34 35-44 45-54 55-64 66-74
%
At least one financial activityDemographic structure – a percentage of a given age group
R² = 0,7529
0
10
20
30
40
50
60
70
80
90
100
35 40 45 50 55 60 65 70
The
perc
enta
ge o
f peo
ple
who
use
d in
tern
et
bank
ing
in 2
018
(%)
DESI 2019
R² = 0,6855
0
5
10
15
20
25
30
35
40
45
50
35 40 45 50 55 60 65 70 75
The
perc
enta
ge o
f peo
ple
who
use
d at
leas
t one
of
finan
cial
ser
vice
s ov
er th
e in
tern
et in
201
8 (%
)
DESI 2019

35Financial System in Poland 2018
Housholds and enterprises in the financial market in PolandHouseholds and enterprises in the financial market in Poland
35 Financial System in Poland 2018
This leads to the conclusion that without action aimed at raising the level of development of the digital economy and increasing the digital maturity of society, it will be difficult to achieve a significant increase in the share of clients using financial services via the internet. This is regardless of the level of technological advancement of financial institutions and the innovative solutions they offer to access their services.
The preferred method of access to financial services, depending on age, will be an important stimulus in changing the way of functioning of financial institutions. The significant prevalence of interest of younger clients in internet channels of access (as well as mobile access) will lead to a rise in the importance of remote channels of access to financial services, and as a result, to a reduction in the role and changes in the function of traditional channels of distributing financial services, including, in particular, bank branches.
The tendency to reduce the number of bank branches is observed in all the EU countries. For example, in 2018 compared to 2014 the number of bank branches in the euro area decreased by over 24,000 (by 15.2%) to 135,139 branches. In Poland, in the same period the number of bank branches decreased by 10.4% (by 1,472) to 12,645.9
An interesting supplement to the studies conducted by Eurostat is the study conducted by the consulting firm Deloitte into digital maturity of financial institutions EMEA Digital Banking Maturity 2018.10 This study covered 38 countries in Europe (including 24 countries in the EU) and the Middle East, 238 banks (including 15 in Poland) and 10 FinTechs offering banking services.
The assessment of financial institutions covered three areas: − a review of the functionality of products and services offered by 248 financial institutions, with the
use of the technique of “mystery shoppers”, who opened bank accounts and evaluated the internet banking and mobile banking channels for 826 functionalities, taking into account six stages of interactions of the bank with the client (gathering information about the bank, opening an account, onboarding the client, day-to-day banking, expanding the relationship, and ending the relationship of the client with the bank);
− a survey of over 8,000 clients of banks with the aim of understanding the needs and preferences of customers in every market and comparing the functionality of every bank with the expectations of consumers in a given market;
− an evaluation of “consumer experiences” made by customers of mobile banking.
Taking into account the functionality review, the compared markets were divided into four groups in terms of digital maturity, distinguishing the “digital champions”, the group of “digital smart followers”, the “digital adopters” and the “digital latecomers”.11 Poland and Spain were classified to the group of digital champions in terms of digital maturity.12 Finland and France were in the digital smart followers” group. However, the majority of EU countries were classified as “digital adopters” (Table 1).
The digital champions group included banks that offered a wide range of digital functionalities that are important for customers, satisfied or even exceeded the preferences of customers in their market, and offered an attractive user interface. Although Poland was recognised as a digital champion, the results for Polish banks varied greatly. Out of 15 Polish banks in the study, three were recognised as “digital champions” and were classified in the top twenty out of 248 institutions studied. Three banks were classified in the “digital smart followers” group, six in the “digital adopters” group, and three in the “digital latecomers” group (the worst Polish bank was classified in 242nd place).
Households and enterprises in the financial market in Poland
34 Narodowy Bank Polski
the case of users of internet banking. This is a result of the specific needs and financial possibilities of clients, which change depending on age (Figure III, right-hand panel).
Figure III. People who use at least one financial service over the internet1 in EU (%) (left-hand panel) and in Poland2 (by age structure, %) (right-hand panel), 2018
1 Share of people aged 16-74 using at least one financial service via the internet during the last 12 months in the same age
group of people using the internet in the last 12 months. 2 Structure according to age group of people using the internet during the last 12 months and using at least one financial
service via the internet during the last 12 months. The demographic structure presents the share of individual age groups in the total population aged 16-74.
Note: Due to the low reliability of data for Latvia indicated by Eurostat in the study for 2018, the results of the study for 2017 have been included for Latvia. Source: Eurostat and NBP calculations based on GUS data.
The presented results of the Eurostat and European Commission studies show that the development and extent of the use of financial services via the internet is dependent on, among others, the general level of development of the digital economy and digital society in the given country. The relation of the DESI to the share of people using internet banking was practically linear. The higher the DESI, the higher the share of people using internet banking (Figure IV – left-hand panel). In the case of the share of people using financial services via the internet, this dependence has the shape of an exponential function (Figure IV – right-hand panel).
Figure IV. DESI 20191 and the percentage of people who use internet banking2 (left-hand panel) and percentage of people who use financial services over the internet3 (right-hand panel) for EU countries, 2018
1 The DESI 2019 was created from indicators from the calendar year 2018 (in the case of lack of data for this year, the latest
data before 2018 was used). 2 Percentage share of people aged 16-74 using internet banking via the internet among people in using the internet in the last
3 months. 3 Share of people aged 16-74 using at least one financial service via the internet during the last 12 months in the same age
group of people using the internet in the last 12 months. Due to the low reliability of data for Latvia indicated by Eurostat in the study for 2018, the results of the study for 2017 have been included for Latvia.
Source: NBP calculations based on European Commission and Eurostat data.
05
101520253035404550
Uni
ted
Kin
gdom
Est
onia
Sw
eden
Net
herla
nds
Finl
and
Den
mar
kLa
tvia
Irela
ndE
U28
Lith
uani
aC
zech
Rep
ublic
Ger
man
yM
alta
Luxe
mbo
urg
Spa
inP
ortu
gal
Slo
vaki
aS
love
nia
Bel
gium
Fran
ceIta
lyH
unga
ryA
ustri
aP
olan
dG
reec
eC
roat
iaC
ypru
sB
ulga
riaR
oman
ia
%
0
5
10
15
20
25
30
35
40
16-24 25-34 35-44 45-54 55-64 66-74
%
At least one financial activityDemographic structure – a percentage of a given age group
R² = 0,7529
0
10
20
30
40
50
60
70
80
90
100
35 40 45 50 55 60 65 70
The
perc
enta
ge o
f peo
ple
who
use
d in
tern
et
bank
ing
in 2
018
(%)
DESI 2019
R² = 0,6855
0
5
10
15
20
25
30
35
40
45
50
35 40 45 50 55 60 65 70 75
The
perc
enta
ge o
f peo
ple
who
use
d at
leas
t one
of
finan
cial
ser
vice
s ov
er th
e in
tern
et in
201
8 (%
)
DESI 2019
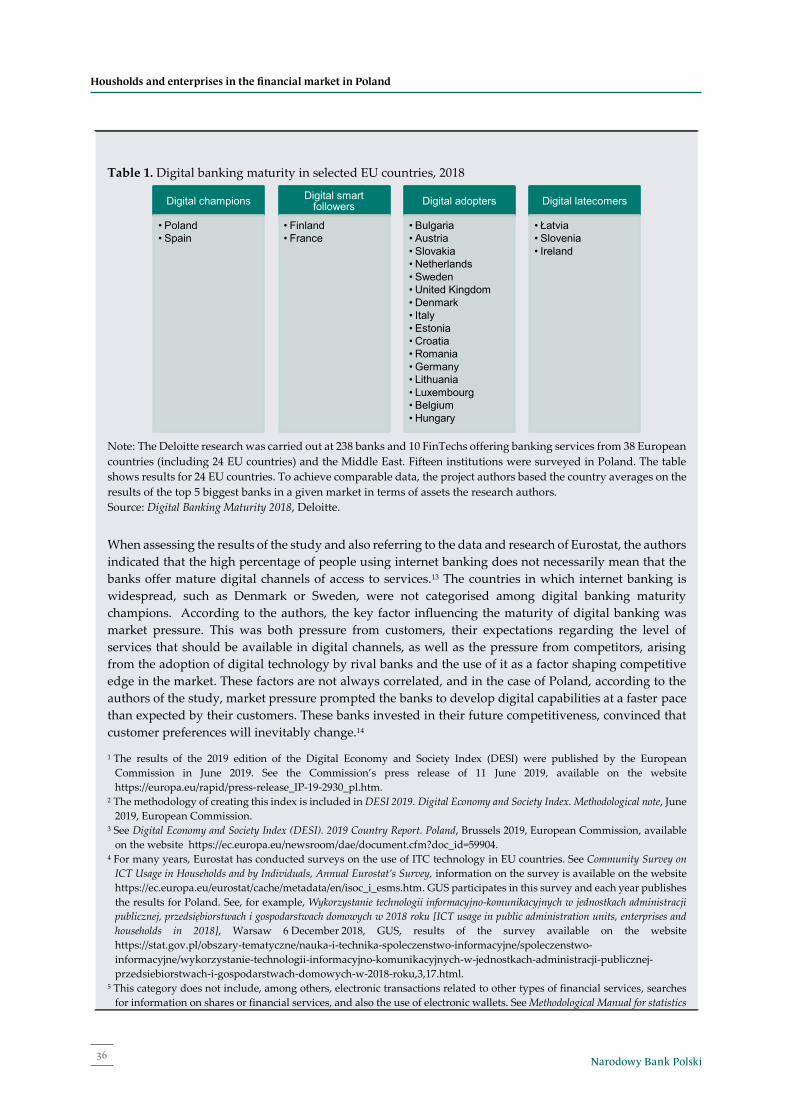
Narodowy Bank Polski36
Housholds and enterprises in the financial market in PolandHouseholds and enterprises in the financial market in Poland
36 Narodowy Bank Polski
Table 1. Digital banking maturity in selected EU countries, 2018
Note: The Deloitte research was carried out at 238 banks and 10 FinTechs offering banking services from 38 European countries (including 24 EU countries) and the Middle East. Fifteen institutions were surveyed in Poland. The table shows results for 24 EU countries. To achieve comparable data, the project authors based the country averages on the results of the top 5 biggest banks in a given market in terms of assets the research authors. Source: Digital Banking Maturity 2018, Deloitte.
When assessing the results of the study and also referring to the data and research of Eurostat, the authors indicated that the high percentage of people using internet banking does not necessarily mean that the banks offer mature digital channels of access to services.13 The countries in which internet banking is widespread, such as Denmark or Sweden, were not categorised among digital banking maturity champions. According to the authors, the key factor influencing the maturity of digital banking was market pressure. This was both pressure from customers, their expectations regarding the level of services that should be available in digital channels, as well as the pressure from competitors, arising from the adoption of digital technology by rival banks and the use of it as a factor shaping competitive edge in the market. These factors are not always correlated, and in the case of Poland, according to the authors of the study, market pressure prompted the banks to develop digital capabilities at a faster pace than expected by their customers. These banks invested in their future competitiveness, convinced that customer preferences will inevitably change.14
1 The results of the 2019 edition of the Digital Economy and Society Index (DESI) were published by the European Commission in June 2019. See the Commission’s press release of 11 June 2019, available on the website https://europa.eu/rapid/press-release_IP-19-2930_pl.htm.
2 The methodology of creating this index is included in DESI 2019. Digital Economy and Society Index. Methodological note, June 2019, European Commission.
3 See Digital Economy and Society Index (DESI). 2019 Country Report. Poland, Brussels 2019, European Commission, available on the website https://ec.europa.eu/newsroom/dae/document.cfm?doc_id=59904.
4 For many years, Eurostat has conducted surveys on the use of ITC technology in EU countries. See Community Survey on ICT Usage in Households and by Individuals, Annual Eurostat’s Survey, information on the survey is available on the website https://ec.europa.eu/eurostat/cache/metadata/en/isoc_i_esms.htm. GUS participates in this survey and each year publishes the results for Poland. See, for example, Wykorzystanie technologii informacyjno-komunikacyjnych w jednostkach administracji publicznej, przedsiębiorstwach i gospodarstwach domowych w 2018 roku [ICT usage in public administration units, enterprises and households in 2018], Warsaw 6 December 2018, GUS, results of the survey available on the website https://stat.gov.pl/obszary-tematyczne/nauka-i-technika-spoleczenstwo-informacyjne/spoleczenstwo-informacyjne/wykorzystanie-technologii-informacyjno-komunikacyjnych-w-jednostkach-administracji-publicznej-przedsiebiorstwach-i-gospodarstwach-domowych-w-2018-roku,3,17.html.
5 This category does not include, among others, electronic transactions related to other types of financial services, searches for information on shares or financial services, and also the use of electronic wallets. See Methodological Manual for statistics
Digital champions
• Poland• Spain
Digital smart followers
• Finland• France
Digital adopters
• Bulgaria• Austria• Slovakia• Netherlands• Sweden• United Kingdom• Denmark• Italy• Estonia• Croatia• Romania• Germany• Lithuania• Luxembourg• Belgium• Hungary
Digital latecomers
• Łatvia• Slovenia• Ireland

37Financial System in Poland 2018
Housholds and enterprises in the financial market in PolandHouseholds and enterprises in the financial market in Poland
37 Financial System in Poland 2018
on the Information Society ICT usage in households and by individuals. Survey year 2018. Eurostat. Document available on the website https://circabc.europa.eu/d/a/workspace/SpacesStore/7314c476-12c2-4e4d-a0ef-bbae10250747/MM2018_Part_II_Household%20survey.zip.
6 Data relate to people aged 16-74 who used the internet in the last three months. 7 See Methodological Manual for statistics on the Information Society ICT usage in households and by individuals. Survey year 2018.
Eurostat. Material available on the website https://circabc.europa.eu/d/a/workspace/SpacesStore/7314c476-12c2-4e4d-a0ef-bbae10250747/MM2018_Part_II_Household%20survey.zip.
8 According to ECB data. See Structural Indicators for the EU Banking Sector, June 2019, ECB available on the website https://www.ecb.europa.eu/pub/pdf/annex/ecb~10913d25c1.pr190604_ssi_table.pdf.
9 See Digital Banking Maturity 2018, Deloitte. This study is available on the website https://www2.deloitte.com/DigitalBankingMaturity.
10 See the results of the study for Poland. Digital Banking Maturity 2018. Jak zostać cyfrowym liderem i dlaczego tak niewielu się to udaje? [Report. Digital Banking Maturity 2018. How to become a Digital Champion and why only few succeed?], April 2018, Deloitte. The report is available on the website https://www2.deloitte.com/content/dam/Deloitte/pl/Documents/Reports/pl_DBM_2018_Prezentacja_na_sniadanie_24_04_2018.pdf. In the edition of the report for Switzerland, the authors used different names for the individual markets, dividing the markets into (1) extensive, (2) substantial, (3) moderate and (4) limited functionalities. See EMEA Digital Banking Maturity Study 2018. Key takeaways for Switzerland, July 2018, Deloitte. Report available on the website https://www2.deloitte.com/content/dam/Deloitte/ch/Documents/financial-services/ch-en-deloitte-banking-maturity.pdf.
11 The countries outside the EU that are covered by the study and included among the digital champions are Russia, Switzerland and Turkey.
12 Comparing the results of the Deloitte study with the DESI produces a very complex picture. The group of “digital champions” and “digital smart followers” includes both Finland, the country with the highest DESI in the EU, and Poland, which occupies 25th place in the ranking of this index, and also Spain, whose DESI is higher than the EU average and France and the Czech Republic, with a DESI slightly lower than the EU average.
13 See Cimochowski G., Elst R.V., Majewski D.A, Martino O., Turquin X., Are EMEA banks prepared for the new world of banking? Benchmarking of 248 financial institutions, Inside, issue 18, June 2018, Deloitte, pp. 20-25.
Households and enterprises in the financial market in Poland
36 Narodowy Bank Polski
Table 1. Digital banking maturity in selected EU countries, 2018
Note: The Deloitte research was carried out at 238 banks and 10 FinTechs offering banking services from 38 European countries (including 24 EU countries) and the Middle East. Fifteen institutions were surveyed in Poland. The table shows results for 24 EU countries. To achieve comparable data, the project authors based the country averages on the results of the top 5 biggest banks in a given market in terms of assets the research authors. Source: Digital Banking Maturity 2018, Deloitte.
When assessing the results of the study and also referring to the data and research of Eurostat, the authors indicated that the high percentage of people using internet banking does not necessarily mean that the banks offer mature digital channels of access to services.13 The countries in which internet banking is widespread, such as Denmark or Sweden, were not categorised among digital banking maturity champions. According to the authors, the key factor influencing the maturity of digital banking was market pressure. This was both pressure from customers, their expectations regarding the level of services that should be available in digital channels, as well as the pressure from competitors, arising from the adoption of digital technology by rival banks and the use of it as a factor shaping competitive edge in the market. These factors are not always correlated, and in the case of Poland, according to the authors of the study, market pressure prompted the banks to develop digital capabilities at a faster pace than expected by their customers. These banks invested in their future competitiveness, convinced that customer preferences will inevitably change.14
1 The results of the 2019 edition of the Digital Economy and Society Index (DESI) were published by the European Commission in June 2019. See the Commission’s press release of 11 June 2019, available on the website https://europa.eu/rapid/press-release_IP-19-2930_pl.htm.
2 The methodology of creating this index is included in DESI 2019. Digital Economy and Society Index. Methodological note, June 2019, European Commission.
3 See Digital Economy and Society Index (DESI). 2019 Country Report. Poland, Brussels 2019, European Commission, available on the website https://ec.europa.eu/newsroom/dae/document.cfm?doc_id=59904.
4 For many years, Eurostat has conducted surveys on the use of ITC technology in EU countries. See Community Survey on ICT Usage in Households and by Individuals, Annual Eurostat’s Survey, information on the survey is available on the website https://ec.europa.eu/eurostat/cache/metadata/en/isoc_i_esms.htm. GUS participates in this survey and each year publishes the results for Poland. See, for example, Wykorzystanie technologii informacyjno-komunikacyjnych w jednostkach administracji publicznej, przedsiębiorstwach i gospodarstwach domowych w 2018 roku [ICT usage in public administration units, enterprises and households in 2018], Warsaw 6 December 2018, GUS, results of the survey available on the website https://stat.gov.pl/obszary-tematyczne/nauka-i-technika-spoleczenstwo-informacyjne/spoleczenstwo-informacyjne/wykorzystanie-technologii-informacyjno-komunikacyjnych-w-jednostkach-administracji-publicznej-przedsiebiorstwach-i-gospodarstwach-domowych-w-2018-roku,3,17.html.
5 This category does not include, among others, electronic transactions related to other types of financial services, searches for information on shares or financial services, and also the use of electronic wallets. See Methodological Manual for statistics
Digital champions
• Poland• Spain
Digital smart followers
• Finland• France
Digital adopters
• Bulgaria• Austria• Slovakia• Netherlands• Sweden• United Kingdom• Denmark• Italy• Estonia• Croatia• Romania• Germany• Lithuania• Luxembourg• Belgium• Hungary
Digital latecomers
• Łatvia• Slovenia• Ireland
www.nbp.pl


