40
1 15.390 New Enterprises 15.390 New Enterprises Financial Plan Howard Anderson Bill Aulet Matt Marx
1
15.3
90 N
ew E
nter
pris
es
15.390 New Enterprises
Financial Plan
Howard Anderson
Bill Aulet
Matt Marx

2
15.3
90 N
ew E
nter
pris
es
15.390
Financials
or
What do I need to know to make a
great financial section of a
business plan?
3
15.3
90 N
ew E
nter
pris
es
Why Do a Financial Plan?
• “The numbers are meaningless”
• “It will all change anyway”
• “They all look the same”
• “The investors are just going to basically
ignore it and redo it so what is the
point?”
4
15.3
90 N
ew E
nter
pris
es
Your Co. Business
Plan Financials
Financials are Holy Grail of B-Plan
• Demonstrates “proof”
that the B-plan will make
$$$$ - puts numbers to
your business model
theory
• Makes your B-plan come
alive for the you and the
investor – translates to a
financial story
• Demonstrates YOU know
your milestones, YOU
know your market, and
YOU know how to make
$$$$$$

5
15.3
90 N
ew E
nter
pris
es
B-Plan Financials – Nuts & Bolts
• The financials determine whether your business plan is viable
• Key components Income Statement (Profit & Loss)
Cashflow
Balance Sheet
Assumptions Summary
Sensitivity Analysis – high, medium, low probability of key assumptions
Selective market metrics – average revenue per customer, inventory turn, etc.
6
15.3
90 N
ew E
nter
pris
es
B-Plan Financials – Nuts & Bolts
• In the written plan, discuss business model, not just $$ - try to get reader to relate to the business by associating with everyday reference points When and how much do you get paid?
What is the Avg rev per customer and average cost to acquire a customer?
What is your cost structure? Fixed or variable?
Is bus model well established or ground breaking?
Cash burn, time to breakeven, cash needed for breakeven
7
15.3
90 N
ew E
nter
pris
es
Financials Should Reflect Milestones
• Align financing needs with milestones –
raise enough capital to get you beyond
each milestone
• Show what you need to raise to meet
each milestone, what it will be used for
and how far will it take you

8
15.3
90 N
ew E
nter
pris
es
Financing Milestones
Time
Un
its
Product
Development
Introduction Growth Maturity Decline
+$
-$
Product
(Units)
Profits
Expenditures
Courtesy of Paul Sullivan
University of Michigan
Prod Dev
Alpha
Beta I
Beta II
Pilots
IP
Fundable Team
Friends
Family
Angel
Early Stage
Angel
Early Stage
Pilots
Reg. Launch
Nat. Launch
Fundable Team
IP
Early Stage
Later Stage
Repeatable Biz Model
Enhancements
New Products
Later Stage
M&A
IPO
Operating
Efficiencies
M&A
9
15.3
90 N
ew E
nter
pris
es
Financials Must Relate to Market Assumptions
• Sales Growth should track with Addressable Market
• Market share should make sense with competitors’
share
• Pricing should be relevant to market
• Costs should compare with market
• Economics should be compelling
10
15.3
90 N
ew E
nter
pris
es
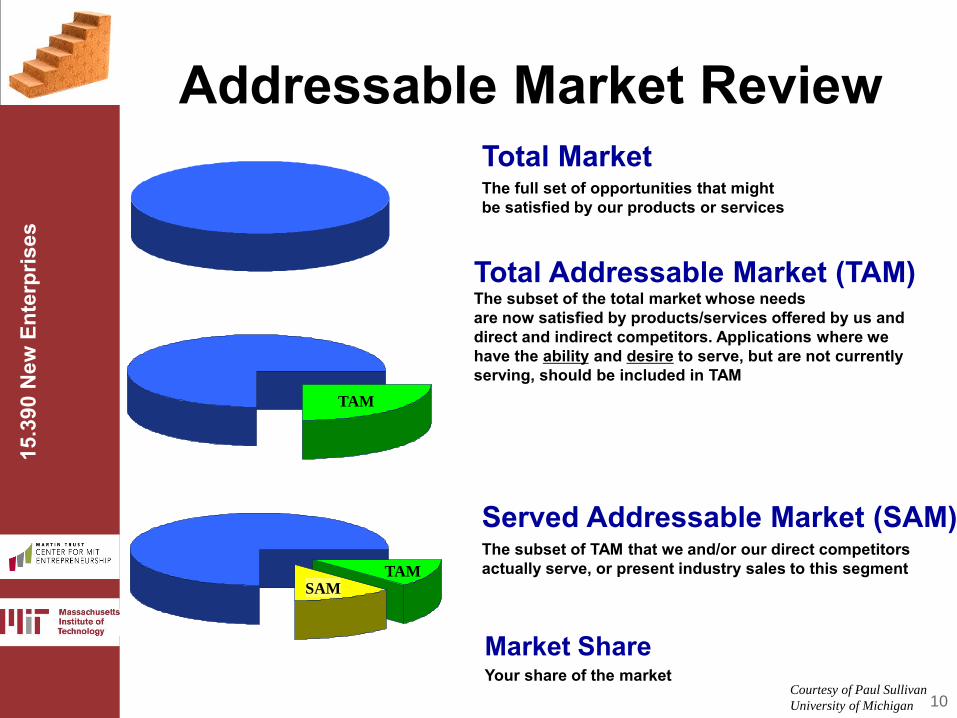
Served Addressable Market (SAM) The subset of TAM that we and/or our direct competitors actually serve, or present industry sales to this segment
Total Addressable Market (TAM) The subset of the total market whose needs are now satisfied by products/services offered by us and direct and indirect competitors. Applications where we have the ability and desire to serve, but are not currently serving, should be included in TAM
Total Market The full set of opportunities that might be satisfied by our products or services
TAM
TAM SAM
Market Share Your share of the market
Courtesy of Paul Sullivan
University of Michigan
Addressable Market Review
11
15.3
90 N
ew E
nter
pris
es
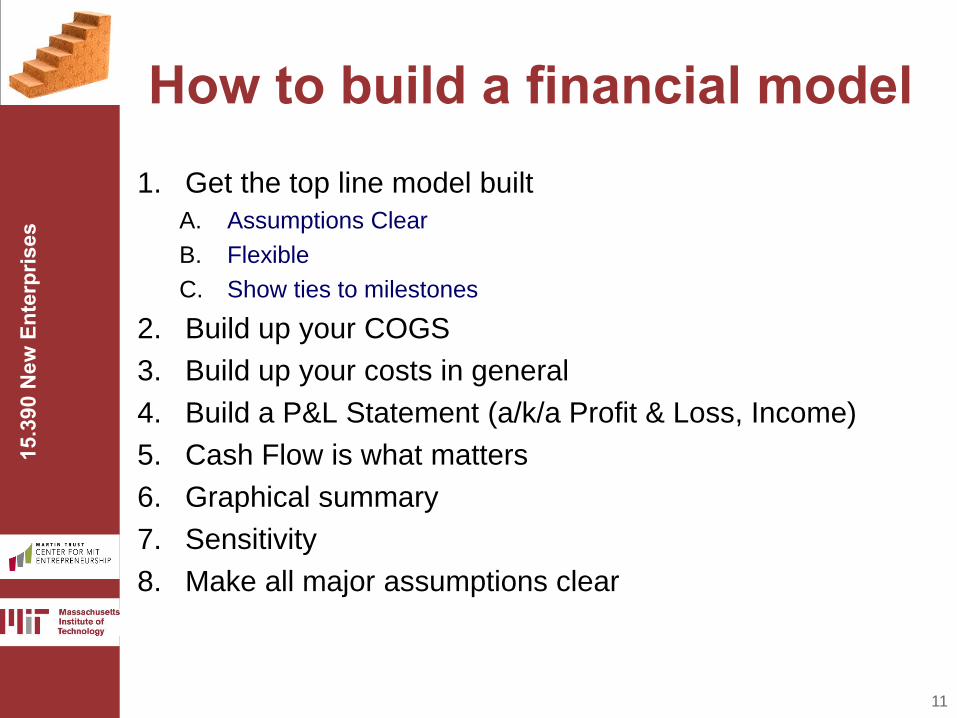
How to build a financial model 1. Get the top line model built
A. Assumptions Clear
B. Flexible
C. Show ties to milestones
2. Build up your COGS
3. Build up your costs in general
4. Build a P&L Statement (a/k/a Profit & Loss, Income)
5. Cash Flow is what matters
6. Graphical summary
7. Sensitivity
8. Make all major assumptions clear

12
15.3
90 N
ew E
nter
pris
es
Explain the Top Line
Year 1 Year 2 Year 3 Year 4 Year 5 Year 6 Year 7
Total Rev $410K $4.35M $9.2M $23M $54M $90M $250MUnits 40 305 610 1,500 4,500 9,000 35,000
Average Price $10K $12.5K $12.5K $12.5K $10K $8K $6K
Rec Rev Stream $10K $534K $1.6M $4.2M $9.3M $17.5M $40.5M
Gross Margin 70% 78% 79% 80% 75% 69% 58%
Net Cash Flow -$2.8M -$3.7M -$3.7M +$3.5M +$13.7M +$20.1M +$73M
Product Plan Version 1 Ver 2 & 3 Ver 4 & 5 Ver 6 & 7
Ver 8 &
Lite
Ver 9 &
Lite 2
Ver 10 &
Lite 3
13
15.3
90 N
ew E
nter
pris
es
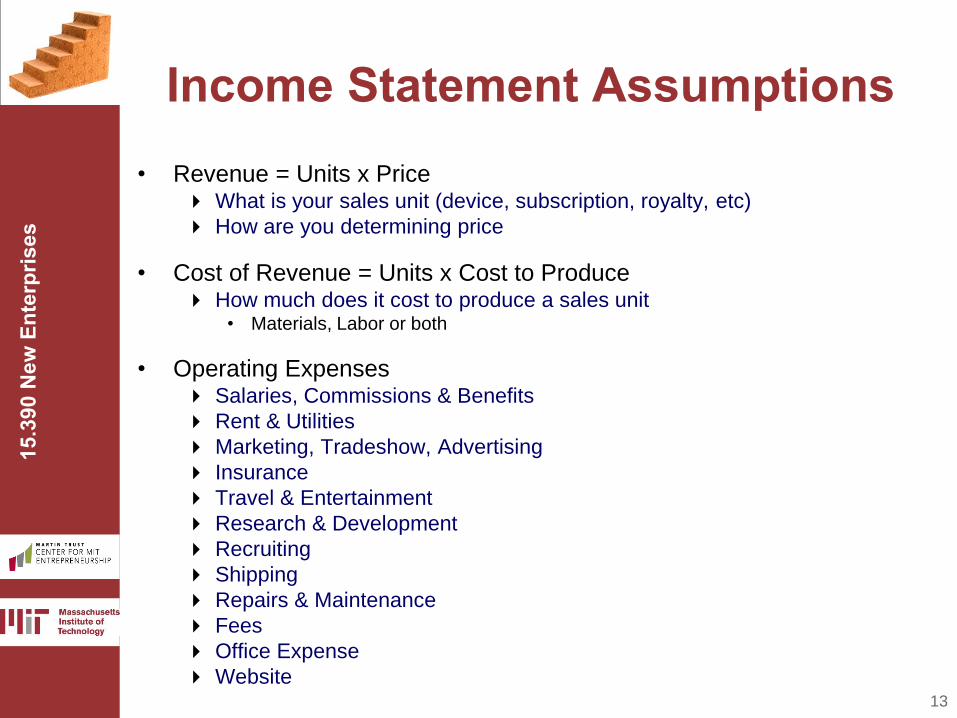
Income Statement Assumptions • Revenue = Units x Price
What is your sales unit (device, subscription, royalty, etc)
How are you determining price
• Cost of Revenue = Units x Cost to Produce How much does it cost to produce a sales unit
• Materials, Labor or both
• Operating Expenses Salaries, Commissions & Benefits
Rent & Utilities
Marketing, Tradeshow, Advertising
Insurance
Travel & Entertainment
Research & Development
Recruiting
Shipping
Repairs & Maintenance
Fees
Office Expense
Website
14
15.3
90 N
ew E
nter
pris
es
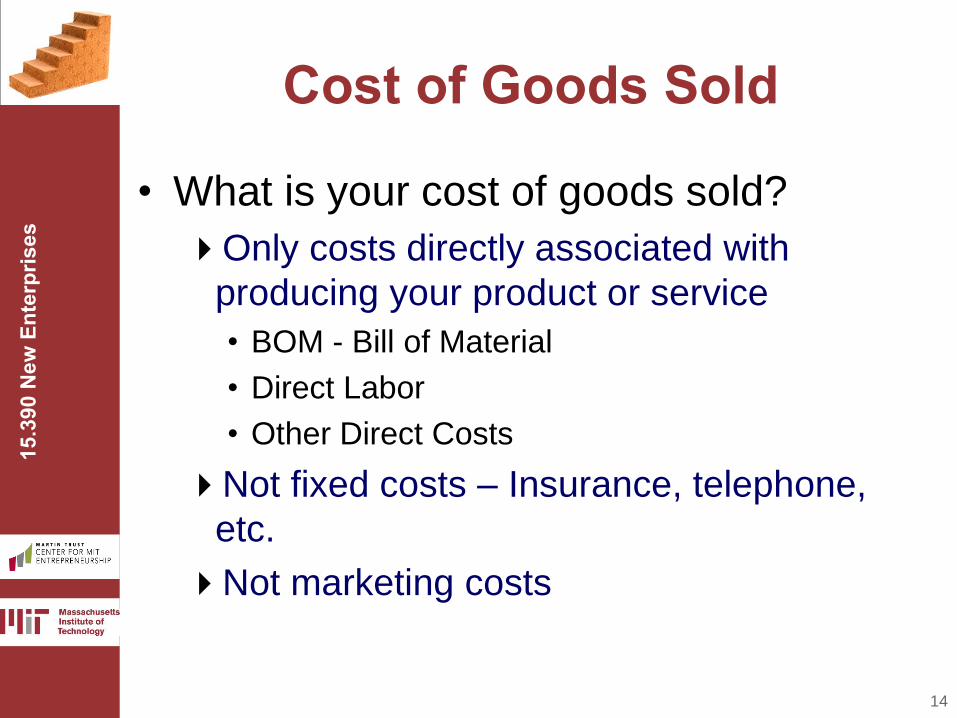
Cost of Goods Sold
• What is your cost of goods sold?
Only costs directly associated with
producing your product or service
• BOM - Bill of Material
• Direct Labor
• Other Direct Costs
Not fixed costs – Insurance, telephone,
etc.
Not marketing costs
15
15.3
90 N
ew E
nter
pris
es
Cash is King
• Cash (not Accounting) P&L is what
matters
• Track and Project Monthly < 2 years
• Project Quarterly > 2 years
16
15.3
90 N
ew E
nter
pris
es
Cash Flow Statement
Table 17.5 Two year cash flow statement removed due to copyright restrictions.
17
15.3
90 N
ew E
nter
pris
es
Key Info for Financial Summary
• Cash in Bank
• Monthly Burn Rate
• Top Line Growth
• Gross Margin and Operation Margin %’s
• As a % of Sales: M&S, R&D, G&A
• Bookings
• Headcount

18
15.3
90 N
ew E
nter
pris
es
Breakeven Analysis
• “Breakeven is defined when total sales
equal the total costs”
• Is that what really matters?
• Cash flow breakeven is what really
matters!

19
15.3
90 N
ew E
nter
pris
es
Sensitivity Analysis
• Probable
• Worst Case
• Best Case
• Don’t necessarily have to show this but
have them ready and do them for your
own sanity
20
15.3
90 N
ew E
nter
pris
es
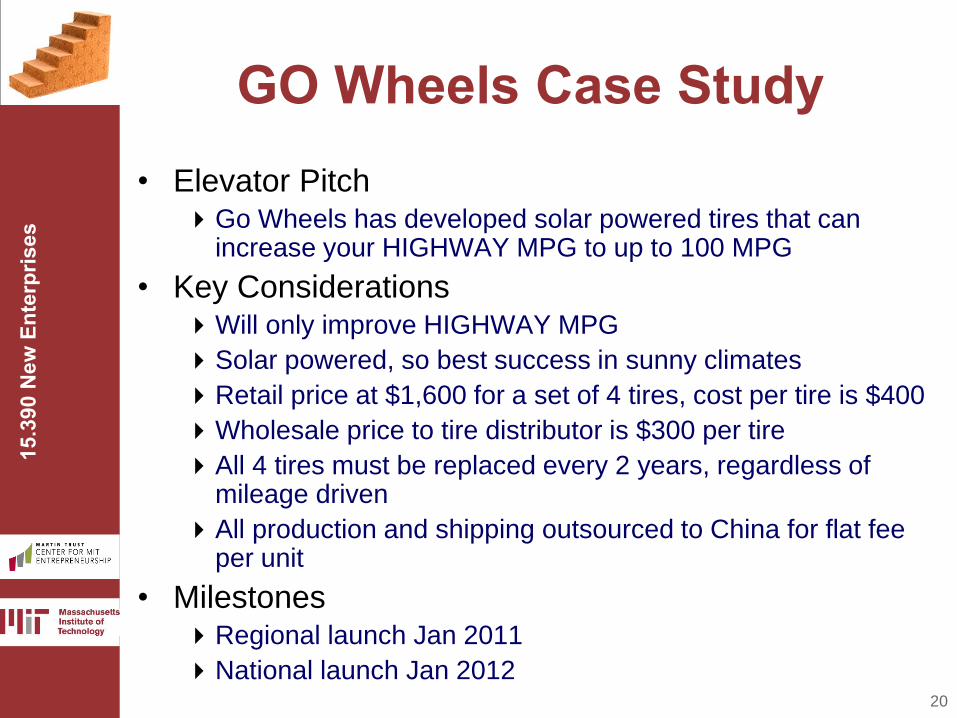
GO Wheels Case Study • Elevator Pitch
Go Wheels has developed solar powered tires that can increase your HIGHWAY MPG to up to 100 MPG
• Key Considerations Will only improve HIGHWAY MPG
Solar powered, so best success in sunny climates
Retail price at $1,600 for a set of 4 tires, cost per tire is $400
Wholesale price to tire distributor is $300 per tire
All 4 tires must be replaced every 2 years, regardless of mileage driven
All production and shipping outsourced to China for flat fee per unit
• Milestones Regional launch Jan 2011
National launch Jan 2012
21
15.3
90 N
ew E
nter
pris
es
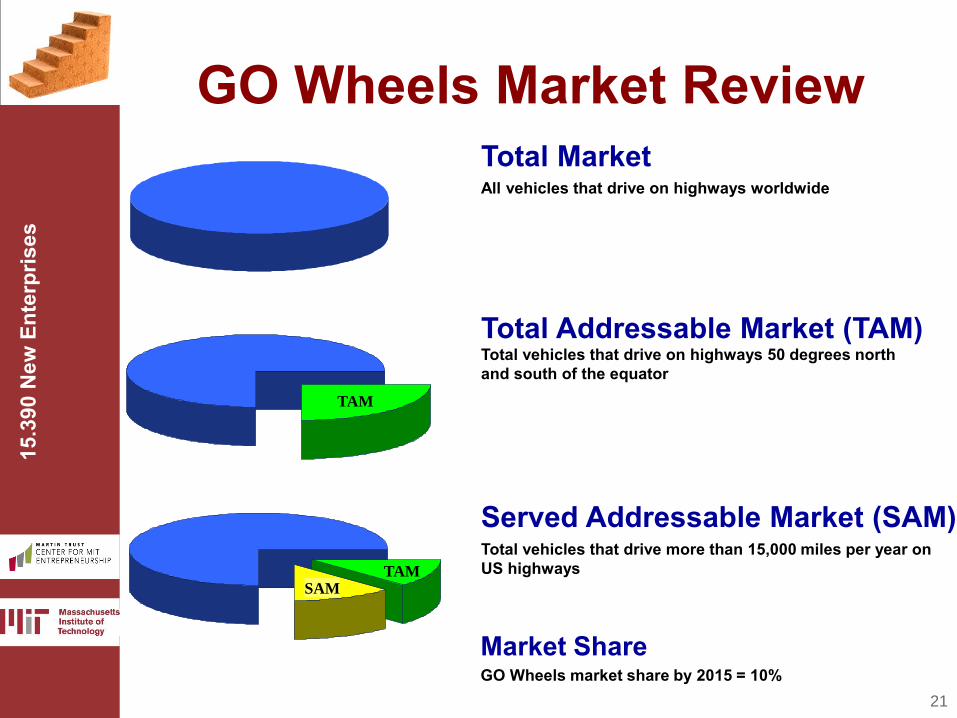
Served Addressable Market (SAM) Total vehicles that drive more than 15,000 miles per year on US highways
Total Addressable Market (TAM) Total vehicles that drive on highways 50 degrees north and south of the equator
Total Market All vehicles that drive on highways worldwide
TAM
TAM SAM
Market Share GO Wheels market share by 2015 = 10%
GO Wheels Market Review
22
15.3
90 N
ew E
nter
pris
es
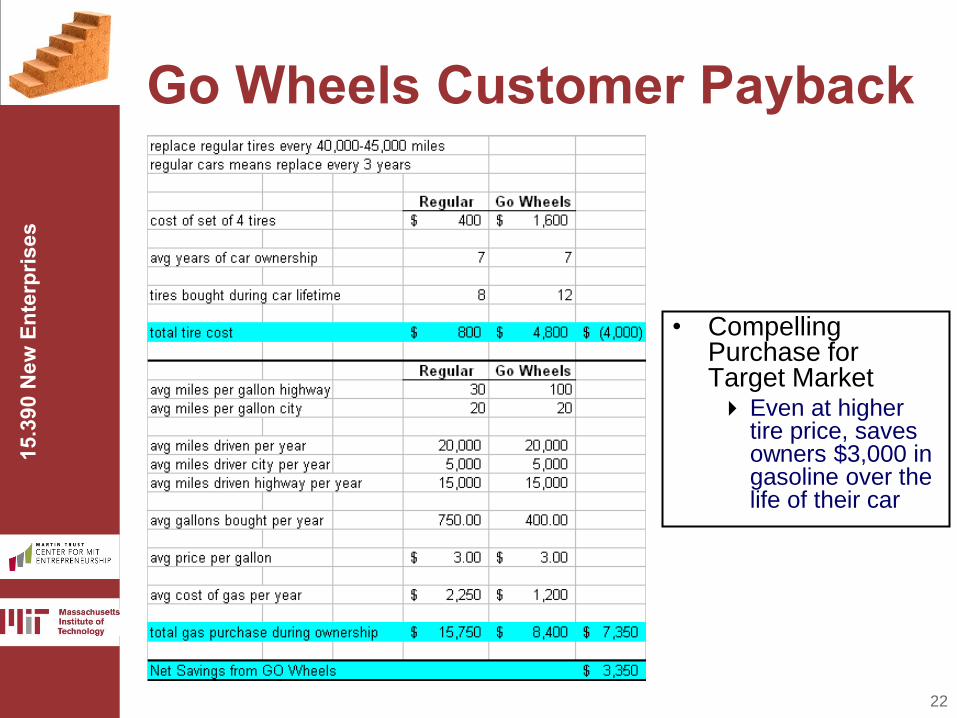
Go Wheels Customer Payback
• Compelling Purchase for Target Market Even at higher
tire price, saves owners $3,000 in gasoline over the life of their car
23
15.3
90 N
ew E
nter
pris
es
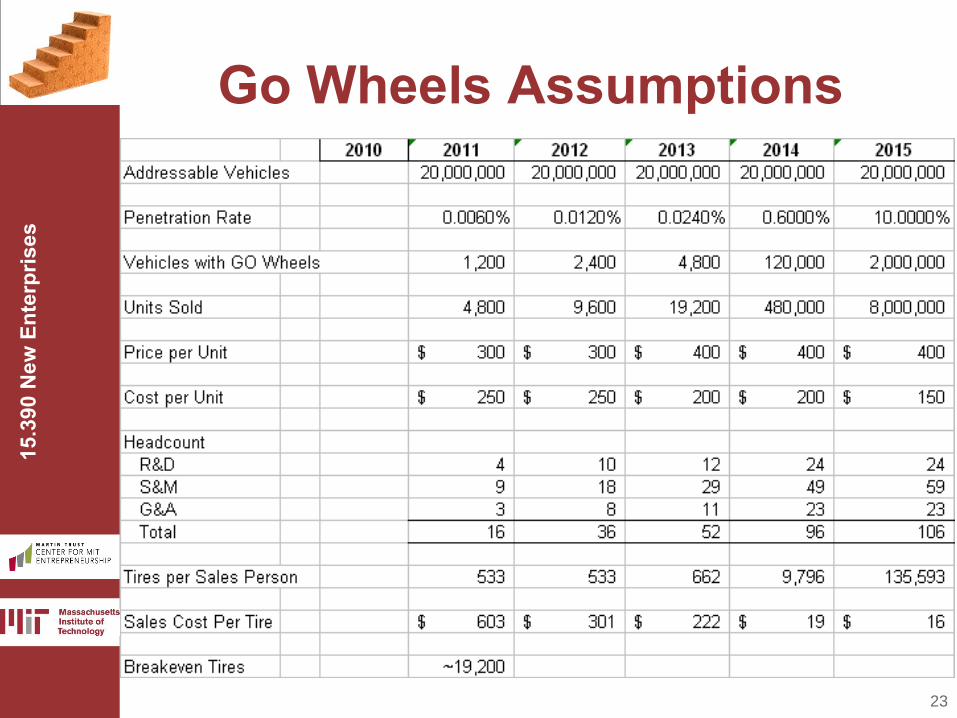
Go Wheels Assumptions
24
15.3
90 N
ew E
nter
pris
es
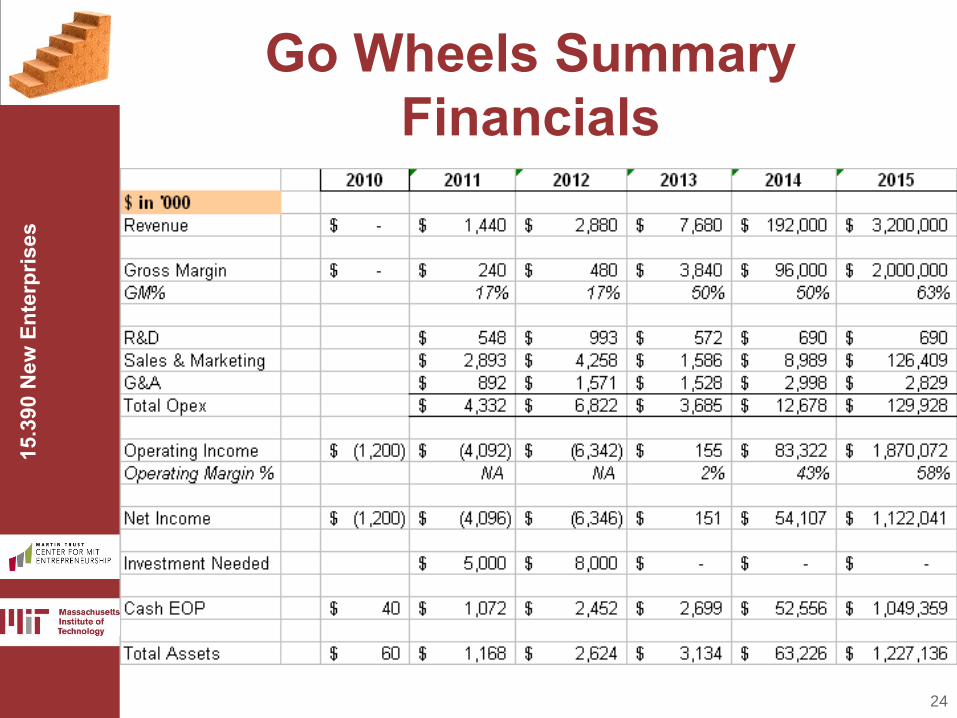
Go Wheels Summary Financials
25
15.3
90 N
ew E
nter
pris
es
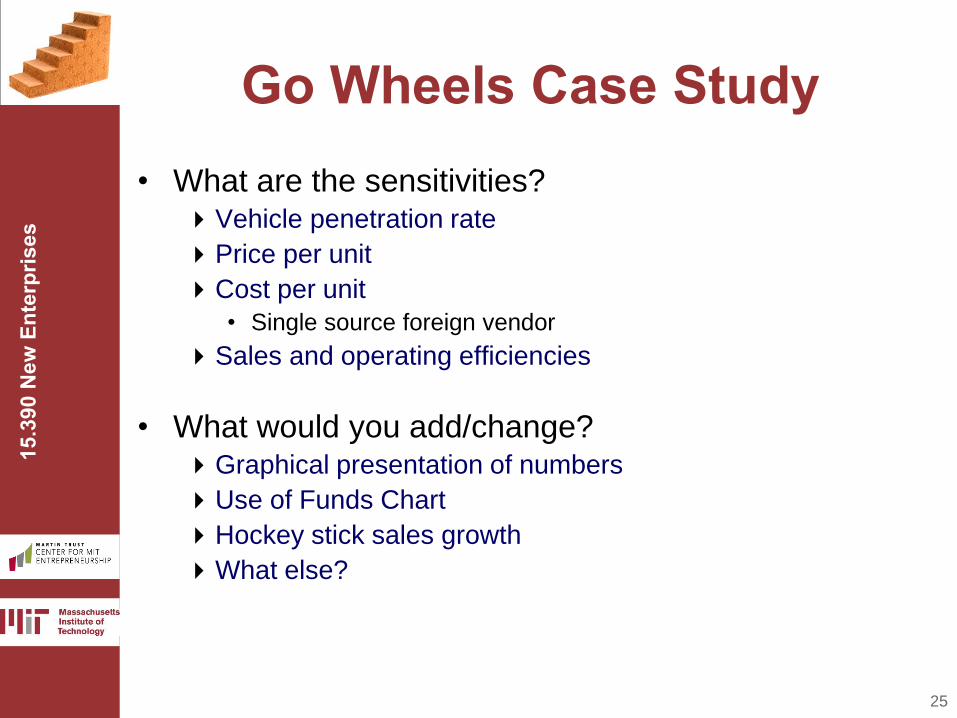
Go Wheels Case Study • What are the sensitivities?
Vehicle penetration rate
Price per unit
Cost per unit
• Single source foreign vendor
Sales and operating efficiencies
• What would you add/change? Graphical presentation of numbers
Use of Funds Chart
Hockey stick sales growth
What else?

26
15.3
90 N
ew E
nter
pris
es
B-Plan Financials - Red Flags Financial model doesn’t support B-Plan
assertions
Revenue & Cost Models Lack Detail
Contradicts total servable market assumptions
Time to profitability unrealistic
Assumptions, Gross & Operating Margins in outer
years not in line with industry standards
Growth is hockey stick on steroids
Not based on industry trends but on gut instinct
Growth does not support follow on rounds
Seasonality not reflected
Financial Metrics Not Relevant

27
15.3
90 N
ew E
nter
pris
es
B-Plan Financials - Red Flags Financial statements don’t link
i.e. Balance Sheet doesn’t balance or tie to cashflow
Salaries are out of line
Capital expenditures understated
Payables, Receivables and Inventory turnover
stats unrealistic
Financing needs not linked to milestones
Valuation is primary focus of financial discussion
Presenting “old” versions of models
Presenting overly conservative numbers
28
15.3
90 N
ew E
nter
pris
es
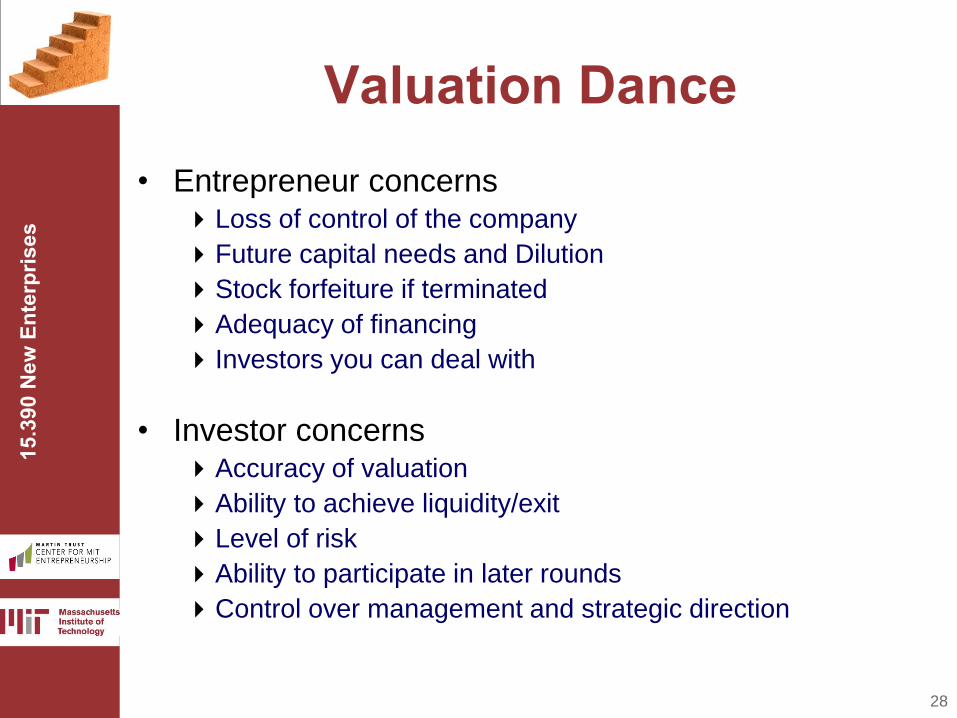
Valuation Dance • Entrepreneur concerns
Loss of control of the company
Future capital needs and Dilution
Stock forfeiture if terminated
Adequacy of financing
Investors you can deal with
• Investor concerns Accuracy of valuation
Ability to achieve liquidity/exit
Level of risk
Ability to participate in later rounds
Control over management and strategic direction

29
15.3
90 N
ew E
nter
pris
es
Ownership Discussion/Section for Class Project
• This is not a legal document but rather
an academic exercise
• We want you to go through the exercise
even if you make up the numbers to
start
• Learn how dilution happens and
ownership gets split up
• Remember, this is just an learing
exercise and is in no way binding
30
15.3
90 N
ew E
nter
pris
es
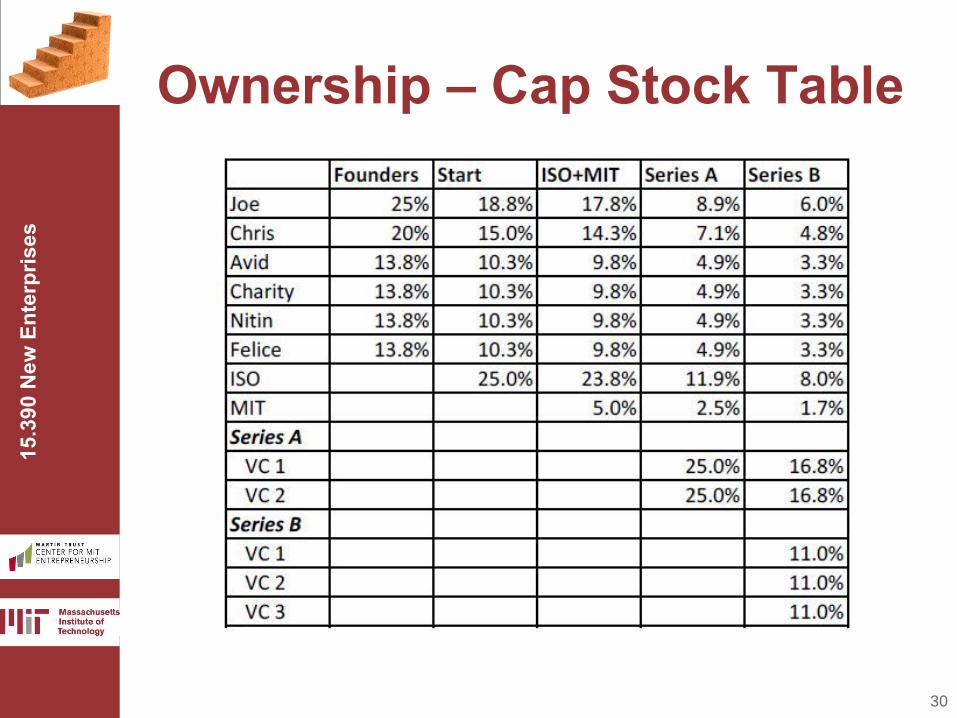
Ownership – Cap Stock Table

31
15.3
90 N
ew E
nter
pris
es
Ownership Pie

32
15.3
90 N
ew E
nter
pris
es
What is Your Venture Worth? Year 0 Year 1 Year 2 Year 3 Year 4
Cash from Sales 349 3,759 8,483 21,047
Cash Out for COGS 111 874 1,835 4,333
Gross Margin 238 2,885 6,649 16,714
Cash Out for M&S 217 1,263 2,824 6,052
Cash Out for R&D 800 1,800 3,150 4,950
Cash Out for G&A 150 450 1,025 1,645
Total Cash Out for OpEx 1,167 3,513 6,999 12,647
(includes capital expeditures)
Cash Flow from Operations (930) (628) (350) 4,067
Interest - - -
Tax (@ 40%)* - - - 864
Cash Flow (930) (628) (350) 3,203
Net Present Value of C-Flow 131$
Discount Rate 20%
?
33
15.3
90 N
ew E
nter
pris
es
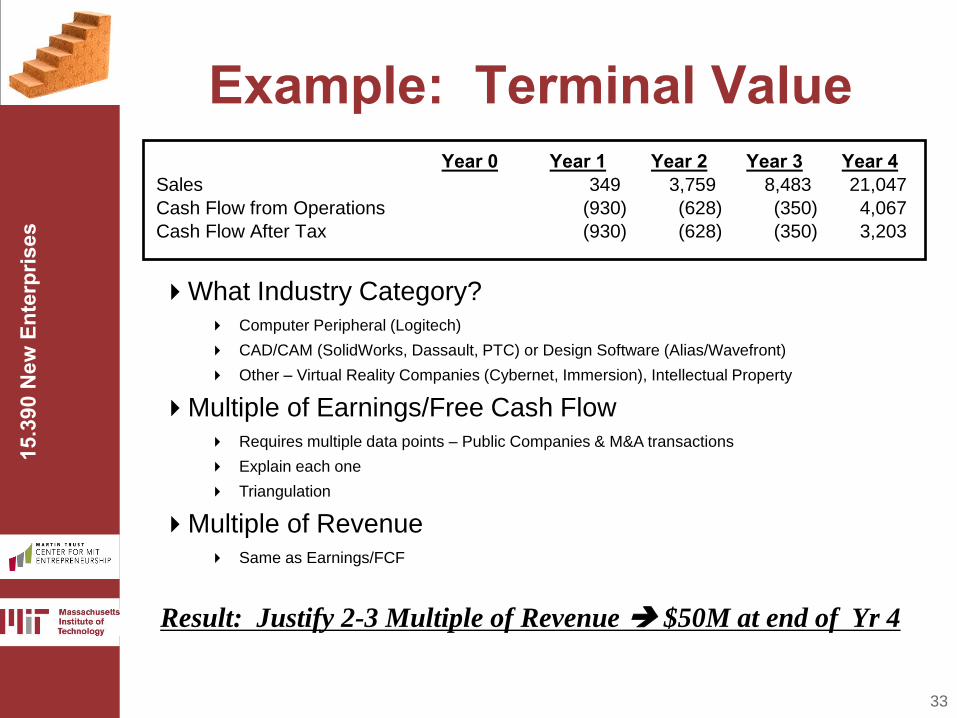
Example: Terminal Value
What Industry Category? Computer Peripheral (Logitech)
CAD/CAM (SolidWorks, Dassault, PTC) or Design Software (Alias/Wavefront)
Other – Virtual Reality Companies (Cybernet, Immersion), Intellectual Property
Multiple of Earnings/Free Cash Flow Requires multiple data points – Public Companies & M&A transactions
Explain each one
Triangulation
Multiple of Revenue Same as Earnings/FCF
Year 0 Year 1 Year 2 Year 3 Year 4Sales 349 3,759 8,483 21,047
Cash Flow from Operations (930) (628) (350) 4,067
Cash Flow After Tax (930) (628) (350) 3,203
Result: Justify 2-3 Multiple of Revenue $50M at end of Yr 4

34
15.3
90 N
ew E
nter
pris
es
More on Terminal Value Can be other important metrics
Install base – e.g. eyeballs
Intellectual Property
Strategic Partnerships
Growth is extremely important consideration
Gross Margin is extremely important
Most common as company gets bigger is EBITDA
EBITDA or FCF Multiple 6-12x but usually 8-10x
Forward looking not trailing
When big company is looking at you, they will redo financials eliminating G&A to calculate new Operating Contribution and then use their multiples to value

35
15.3
90 N
ew E
nter
pris
es
Rate of Return (or IRR) Calculation Assumptions:
$50M Terminal Value (V)
Discount Rate Used by Investors = 50% (r)
Timeframe of 4 Years (t)
Post Money Valuation at Year 0 Formula V/(1+r)t
$50M/(1.5*1.5*1.5*1.5)=$50K/5.625=$9.876M
Definition: Post Money Valuation – Pre Money Valuation plus Investment
Ownership Assumed $3M in Financials
% Ownership for Investors = $3m/$9.876M = 30.38%
Assume 5 million shares approx. 1.519 m shares to investors

36
15.3
90 N
ew E
nter
pris
es
Additional Notes on Valuation It is a lot simpler:
Valuations are rounded to millions
Investor has a % in mind they want to own
Venture Capital investor has in mind an amount of money they want to put to work
Recognition that valuation is an imprecise science
It a lot more complicated There is much more than valuation
Type of stock – Terms and Conditions
Multiple rounds of fundraising need to be forecasted
Don’t get obsessed on valuation Need a holistic view
Address in a rational way

37
15.3
90 N
ew E
nter
pris
es
Financing – 10,000 Foot View • Financial slides must be readable & logical
• Don’t BS on numbers
• Be upfront with problems, issues Saying “I don’t know” is better than digging
yourself in a hole
• Align cash burn to milestones Try to raise at least one year’s worth of cash burn
• Anticipate each round will take 6-12 months to close
• Don’t obsess on pre-money valuation
38
15.3
90 N
ew E
nter
pris
es
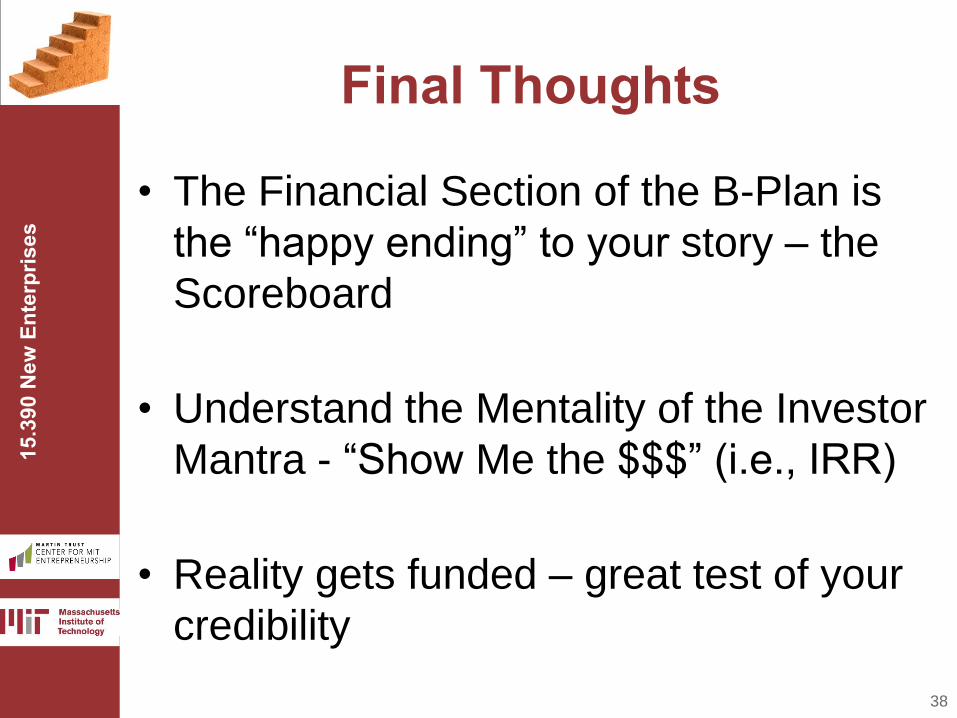
Final Thoughts
• The Financial Section of the B-Plan is
the “happy ending” to your story – the
Scoreboard
• Understand the Mentality of the Investor
Mantra - “Show Me the $$$” (i.e., IRR)
• Reality gets funded – great test of your
credibility
MIT OpenCourseWarehttp://ocw.mit.edu
15.390 New EnterprisesSpring 2013
For information about citing these materials or our Terms of Use, visit: http://ocw.mit.edu/terms.

MIT OpenCourseWarehttp://ocw.mit.edu
15.390 New EnterprisesSpring 2013
For information about citing these materials or our Terms of Use, visit: http://ocw.mit.edu/terms.


