65 Notice THE HUNDRED AND FIFTH ANNUAL GENERAL MEETING OF TATA STEEL LIMITED will be held at the Birla Matushri Sabhagar, 19, Sir Vithaldas Thackersey Marg, Mumbai-400 020, on Tuesday, the 14th August, 2012, at 3.00 p.m., to transact the following business: 1. To receive, consider and adopt the Audited Statement of Profit and Loss for the year ended 31st March, 2012 and the Balance Sheet as at that date together with the Report of the Board of Directors and the Auditors thereon. 2. To declare Dividend on Ordinary Shares. 3. To appoint a Director in the place of Mr. B. Muthuraman, who retires by rotation and is eligible for re-appointment. 4. To appoint a Director in the place of Mr. Ishaat Hussain, who retires by rotation and is eligible for re-appointment. 5. To appoint a Director in the place of Mr. Andrew Robb, who retires by rotation and is eligible for re-appointment. 6. To appoint auditors and fix their remuneration. 7. To appoint a Director in the place of Mr. Cyrus Pallonji Mistry, who was appointed an Additional Director of the Company by the Board of Directors with effect from 21st May, 2012 under Section 260 of the Companies Act, 1956, (the Act) and who holds office upto the date of the forthcoming Annual General Meeting but who is eligible for appointment and in respect of whom the Company has received a notice in writing from a Member proposing his candidature for the office of Director under the provisions of Section 257 of the Act. 8. To appoint a Director in the place of Mrs. Mallika Srinivasan, who was appointed an Additional Director of the Company by the Board of Directors with effect from 21st May, 2012 under Section 260 of the Companies Act, 1956, (the Act) and who holds office upto the date of the forthcoming Annual General Meeting but who is eligible for appointment and in respect of whom the Company has received a notice in writing from a Member proposing her candidature for the office of Director under the provisions of Section 257 of the Act. NOTES: (a) The relative Explanatory Statements, pursuant to Section 173 of the Companies Act, 1956, in respect of the business under Item Nos. 7 and 8 above, are annexed hereto. The relevant details of directors seeking appointments/ re-appointment under Item Nos. 3 to 5, 7 and 8 above, as required by Clause 49 of the Listing Agreements entered into with the Stock Exchanges are also annexed.
Transcript
65
NoticeTHE HUNDRED AND FIFTH ANNUAL GENERAL MEETING OF TATA STEEL LIMITED will be held at the Birla Matushri
Sabhagar, 19, Sir Vithaldas Thackersey Marg, Mumbai-400 020, on Tuesday, the 14th August, 2012, at 3.00 p.m., to
transact the following business:
1. To receive, consider and adopt the Audited Statement of Profit and Loss for the year ended 31st March, 2012 and
the Balance Sheet as at that date together with the Report of the Board of Directors and the Auditors thereon.
2. To declare Dividend on Ordinary Shares.
3. To appoint a Director in the place of Mr. B. Muthuraman, who retires by rotation and is eligible for
re-appointment.
4. To appoint a Director in the place of Mr. Ishaat Hussain, who retires by rotation and is eligible for
re-appointment.
5. To appoint a Director in the place of Mr. Andrew Robb, who retires by rotation and is eligible for re-appointment.
6. To appoint auditors and fix their remuneration.
7. To appoint a Director in the place of Mr. Cyrus Pallonji Mistry, who was appointed an Additional Director of the
Company by the Board of Directors with effect from 21st May, 2012 under Section 260 of the Companies Act, 1956,
(the Act) and who holds office upto the date of the forthcoming Annual General Meeting but who is eligible for
appointment and in respect of whom the Company has received a notice in writing from a Member proposing his
candidature for the office of Director under the provisions of Section 257 of the Act.
8. To appoint a Director in the place of Mrs. Mallika Srinivasan, who was appointed an Additional Director of the
Company by the Board of Directors with effect from 21st May, 2012 under Section 260 of the Companies Act, 1956,
(the Act) and who holds office upto the date of the forthcoming Annual General Meeting but who is eligible for
appointment and in respect of whom the Company has received a notice in writing from a Member proposing
her candidature for the office of Director under the provisions of Section 257 of the Act.
NOTES:
(a) The relative Explanatory Statements, pursuant to Section 173 of the Companies Act, 1956, in respect of the business
under Item Nos. 7 and 8 above, are annexed hereto. The relevant details of directors seeking appointments/
re-appointment under Item Nos. 3 to 5, 7 and 8 above, as required by Clause 49 of the Listing Agreements entered
into with the Stock Exchanges are also annexed.
Hundred and fifth annual report 2011-12
66
(b) A MEMBER ENTITLED TO ATTEND AND VOTE IS ENTITLED TO APPOINT A PROXY TO ATTEND AND VOTE INSTEAD
OF HIMSELF AND THE PROXY NEED NOT BE A MEMBER. Proxies, in order to be effective, must be received at the
Company’s Registered Office not less than 48 hours before the meeting.
(c) The Register of Members and Transfer Books of the Company will be closed from Wednesday, 18th July, 2012 to
Tuesday, 24th July, 2012 (both days inclusive).
(d) If dividend on Ordinary Shares as recommended by the Board of Directors is passed at the meeting, payment of
such dividend will be made on and from 17th August, 2012 to those members whose names are on the Company’s
Register of Members on Wednesday, 18th July, 2012. In respect of Ordinary Shares held in electronic form, the
dividend will be paid to the beneficial owners of shares as at the end of business hours on 17th July, 2012, as per
details furnished by the Depositories for this purpose.
(e) Shareholders desiring any information as regards the Accounts are requested to write to the Company at an early
date so as to enable the Management to keep the information ready at the meeting.
(f ) As per the provisions of the Companies Act, 1956, facility for making nominations is available to the shareholders
in respect of the shares held by them. Nomination forms can be obtained from the Share Registrars of the
Company.
(g) Pursuant to Section 205A of the Companies Act, 1956, all unclaimed/unpaid dividends upto the financial year
ended 31st March, 1995 have been transferred to the General Revenue Account of the Central Government.
Shareholders, who have not yet encashed their dividend warrant(s) for the said period, are requested to forward
their claims in prescribed Form No. II to The Companies Unpaid Dividend (Transfer to General Revenue Account
of the Central Government) Rules, 1978 to
Office of Registrar of Companies
Central Government Office Bldg., ‘A’ Wing,
2nd Floor, Next to Reserve Bank of India,
CBD, Belapur-400 614.
Consequent upon amendment to Section 205A of the Companies Act, 1956 and introduction of Section 205C by the
Companies (Amendment) Act, 1999, the amount of dividend for the subsequent years remaining unpaid or unclaimed
for a period of seven years from the date of transfer to Unpaid Dividend Account of the Company shall be transferred
to the Investor Education and Protection Fund (IEPF) set up by the Government of India and no payments shall be
made in respect of any such claims by the IEPF.
67
Accordingly, the Company has transferred to the IEPF all unclaimed/unpaid dividends in respect of the financial years
1995-96 to 2003-04. Members who have not yet encashed their dividend warrant(s) for the financial years ended
31st March, 2005 onwards, are requested to make their claims to the Company accordingly, without any delay. It may
be noted that the unclaimed dividend for the financial year 2004-05 declared on 27th July, 2005 can be claimed by
the shareholders by 26th July, 2012.
By Order of the Board of Directors
A. ANjENEyAN
Company Secretary &
Chief of Compliance
Mumbai, 22nd May, 2012.
Registered Office:
Bombay House,
24, Homi Mody Street,
Mumbai-400 001.
Hundred and fifth annual report 2011-12
68
Annexure to NoticeAs required by Section 173 of the Companies Act, 1956, (hereinafter referred to as “the Act”) the following Explanatory Statements set out all material facts relating to the business mentioned under Item Nos. 7 and 8 of the accompanying Notice dated 22nd May, 2012.
2. Item Nos. 7 and 8: Mr. Cyrus Pallonji Mistry and Mrs. Mallika Srinivasan, were appointed as additional directors by the Board with effect from 21st May, 2012. In terms of Section 260 of the Act and Article 121 of the Company’s Articles of Association, Mr. Cyrus Pallonji Mistry and Mrs. Mallika Srinivasan hold office as Directors only till the date of the forthcoming Annual General Meeting, but are eligible for appointment. Notices have been received from members as required by Section 257 of the Act, signifying their intention to propose the candidatures of Mr. Cyrus Pallonji Mistry and Mrs. Mallika Srinivasan for the office of Director.
3. Mr. Cyrus Pallonji Mistry is a graduate of Civil Engineering from Imperial College, UK and has an M.Sc. in Management from London Business School. He has been associated with the Shapoorji Pallonji Group since 1994. Under Mr. Mistry’s guidance, Shapoorji Pallonji’s construction business has grown from a turnover of USD 20 million to approximately USD 1.5 billion, with presence in over 10 countries. He joined the Board of Tata Sons Limited in 2006 and is presently the Executive Deputy Chairman. He is also Director of Tata Industries Limited, The Tata Power Company Limited, Tata Teleservices Limited and Tata Consultancy Services Limited.
4. Mrs. Mallika Srinivasan, holds degrees of Master of Business Management from Wharton School of Business, University of Pennsylvania, USA and Master of Arts in Econometrics from the University of Madras, Chennai. She has been associated with Tractors and Farm Equipment Limited since 1985 and presently is the Chairman & Chief Executive Officer. She is also on the Boards of TAFE Motors and Tractors Limited and Tata Global Beverages Limited. Mrs. Mallika Srinivasan is recognised for her professionalism, commitment to excellence and contributions to Indian industry and Academia.
5. The Board considers it desirable that the Company should continue to avail itself of the services of Mr. Cyrus Pallonji Mistry and Mrs. Mallika Srinivasan as Directors and accordingly commend the Resolutions at Item Nos. 7 and 8 for approval by the Members.
6. None of the Directors other than Mr. Cyrus Pallonji Mistry and Mrs. Mallika Srinivasan is interested in the Resolutions at Item Nos. 7 and 8.
By Order of the Board of Directors
A. ANjENEyAN
Company Secretary &
Chief of Compliance
Mumbai, 22nd May, 2012.
Registered Office:
Bombay House,
24, Homi Mody Street,
Mumbai-400 001.
69
Details of the Directors seeking appointment/re-appointment in the forthcoming Annual General Meeting
(in pursuance of Clause 49 of the Listing Agreement)
Name of Director Mr. B. Muthuraman Mr. Ishaat Husain Mr. Andrew Robb
Date of Birth 26.09.1944 02.09.1947 02.09.1942
Date of Appointment 01.10.2009 17.07.1999 22.11.2007
coal) and in Phase2 production is expected to increase to 10.6
mtpa ROM (3mtpa coking coal and 1.8 mtpa thermal coal).
The Benga coal project has commenced production from
March 2012 and the first shipment of coal is expected to be
dispatched in June 2012.
Coal Mining Project in Australia, Carborough Downs joint
Venture:
The existing Carborough Downs Joint Venture in Australia is
operating at 1.8 mtpa capacity. The Company has 5% equity
stake with 20% off-take rights.
Hundred and fifth annual report 2011-12
76
Iron Ore Projects in Canada:
In September 2008, the Company entered into a Heads of
Agreement with New Millennium Iron Corporation, Canada
(NML), a Canadian listed mining company, to develop iron ore
projects in northern Quebec and Newfoundland and Labrador
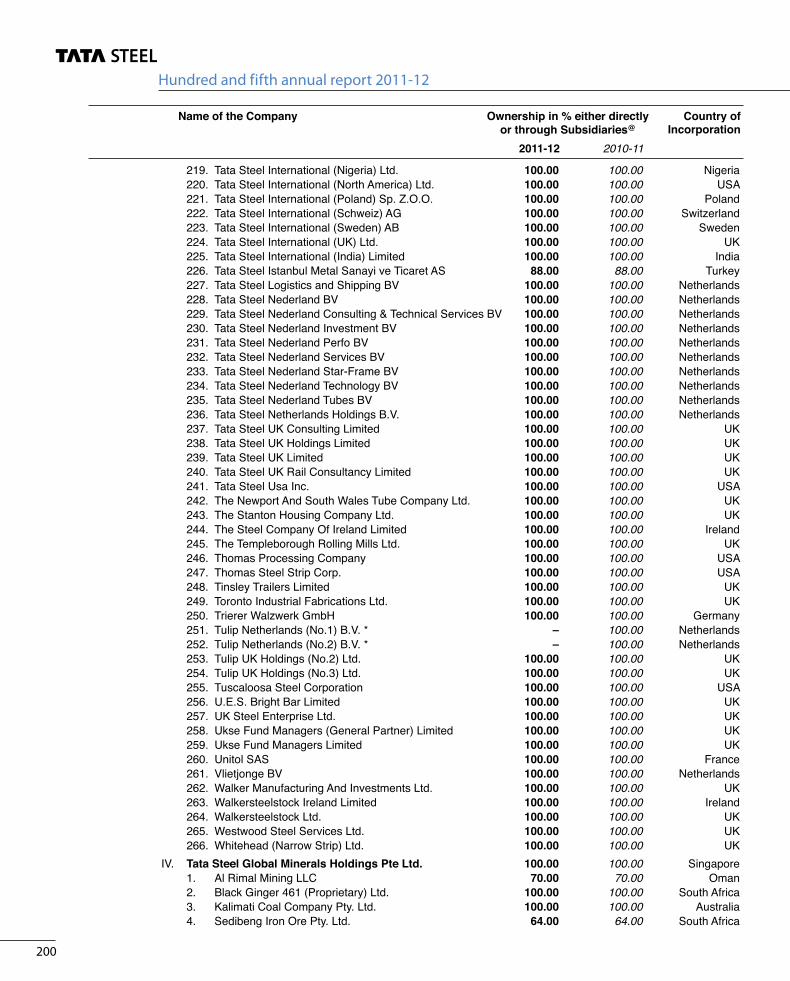
and gradually acquired 27.16% stake in NML through its
wholly-owned subsidiary Tata Steel Global Minerals Holdings
Pte. Ltd. NML owns Direct Shipping Ore (DSO) project, having
estimated proven and probable reserves of 64.1 million tonnes
and Taconite projects, namely Labmag and Kemag with a
combined resource size of 5.65 billion tonnes. Subsequently, a
joint venture company, Tata Steel Minerals Canada (TSMC), was
formed in October 2010 for development of DSO project. The
Company holds 80% equity stake in TSMC and the balance 20%
equity stake is held by NML.
TSMC has obtained the required permits for camp, site levelling
and construction. The Camp in Schefferville was inaugurated in
January 2012. Site levelling is underway and frame supported
Dome is under construction to house the beneficiation facility.
Orders have been placed for major part of the processing facility
and civil work at the site has commenced. Production from the
mine is expected to commence by Q3 Financial Year 2012-13.
On 6 March, 2011, the Company signed a binding Heads of
Agreement with NML to develop iron ore deposits under
Taconite projects. Feasibility study of the project is currently
under progress and is expected to be completed by the end of
calendar year 2012.
HEALTH AND SAFETy
The Company’s safety and occupational health responsibilities
are expressed in its policy and is driven by an absolute
commitment to ensure zero harm to employees, contract
workforce and society at large and are integral to the way the
business is carried out. The group vision has a target of 0.4 Lost
Time Injury Frequency Rate (LTIFR) and zero fatality by end CY
2012. In pursuance of this policy, the management is committed
to continue with their efforts to strengthen safety excellence
journey in the Company. Over the last three years, extensive
efforts in order to address premature mortality on account of
occupational health and medical illness have been undertaken.
An initiative named ‘Wellness @ Workplace’ was launched in
2010 to control lifestyle-related diseases. Workplace hazards
were minimised through the implementation of the Industrial
Hygiene Programme and workplace ergonomics issues were
addressed through Industrial Ergonomics.
In 2011-12, Tata Steel Europe and NatSteel received the World
Steel Association's recognition awards for their improvements
in health and safety. Tata Steel group companies have won an
award every year for the last four years. Tata Steel India was
awarded the best SHE (Safety, Health and Environment) award
for the first time by CII, Eastern Region.
‘Health and Safety’ is reviewed at all Board meetings of the
Company with a Safety, Health and Environment Committee
established to carry out more detailed reviews. The integrated
and systemic Health and Safety Management System,
introduced in Tata Steel Europe in 2008 with a governance
process for improvement actions and regular safety tours by
the Board and executive members, has been developed for
Tata Steel Group-wide application in the current year.
During the year, Tata Steel Group operations recorded a LTIFR
of 0.68 against 0.78 in 2010-11, a 13% improvement over the
last year. However, during the year there were 8 fatalities across
the Group. Each of these has been thoroughly investigated, the
lessons communicated and corrective actions taken across the
group. The Board expresses its sincere regret at these tragic
fatalities.
The implementation of process safety management, to reduce
the occurrence of high consequence but very low frequency
events has continued across the group. This will help the
sustainability of the operations by assuring safety to the
community and achievement of operational excellence.
77
ENVIRONMENT
Overall, the Tata Steel Group continues to lay emphasis on
minimising the environmental impact of its operations and its
products through the adoption of sustainable practices and
continuous improvements in environmental performance.
Furthermore, the Company aims to contribute positively to
the communities around or near its operations, participating
actively in community initiatives, encouraging biodiversity and
nature conservation.
Tata Steel products are part of the solution to climate change as
steel has inherent environmental advantages by being durable,
adaptable, reusable and recyclable. As a result, CO2 emissions
in steel production are offset by reductions in emissions
through the life cycle of steel products, achieved through
effective product design and through end of life recycling. One
of the key corporate objectives for your company is to reduce
CO2 emissions per tonne of crude steel (tcs) produced. The
current targets are provisional and are under review pending
regulatory developments in both Europe and India.
The Group continues to invest substantially in short to
medium term CO2 emissions reduction and energy efficiency
programmes. In addition to these improvements, Tata Steel
Europe is also working with other steelmakers in Europe
on a longer term major research and development project,
ULCOS (ultra low CO2 steelmaking), which aims to develop
breakthrough technologies to significantly reduce CO2
emissions per tonne of steel produced.
Tata Steel maintains proactive approach towards environment
management and has adopted ISO 14001 for mining and
manufacturing operations. Tata Steel is examining means to
reduce energy consumption and CO2 emissions to retain its
position as the Indian benchmark in steelmaking through Blast
Furnace-Basic Oxygen Furnace (BF-BOF) route by increasing
process efficiency, scrap utilisation, reduction of Alumina in
Iron Ore and Ash in Coal through beneficiation.
In Jamshedpur Steel Works CO2 emissions during Financial
Year 2011-12 were 2.5 tCO2/tcs, similar to emission levels in
Financial Year 2010-11. Specific make-up water consumption
in Financial Year 2011-12 at 5.84 m3/tcs was lower by 3.3% than
6.04 m3/tcs recorded in Financial Year 2010-11 due to more
than normal rainfall and increased recycling of effluents. The
recycling of treated effluent increased to 4.3 MGD1 in Financial
Year 2011-12 from 3.4 MGD in Financial Year 2010-11. Solid
waste utilisation2 was 75% in Financial Year 2011-12 compared
to 78% in Financial Year 2010-11.
In Tata Steel Europe, CO2 emissions during Financial Year
2011-12 were at 1.9 tCO2/tcs. Compliance with environmental
permit conditions continued to be at a very high level across
TSE during the financial year.
Tata Steel Europe met its environmental obligations in Phase
1 (2005 to 2007) of the EU ETS and expects to do the same in
Phase 2 (2008 to 2012). As a result of generally lower production
levels since October 2008, TSE now expects to be in surplus
carbon credits in Phase 2. Excess rights can either be sold in the
market or retained for future compliance purposes. Whilst TSE
continues to invest to reduce CO2 emissions, current proposals
by the EU Commission for Phase 3 (2013 to 2020) of the
scheme could, as they currently stand, have a negative impact
on production levels post 2012 for European steelmakers in
general. However, these proposals are continuing to evolve and
no final decisions have been made at this stage.
TSE currently participates in a voluntary agreement with the
Dutch government regarding energy efficiency improvements
over the period 2009 to 2012. The primary requirement of the
agreement is an energy efficiency improvement of 2% per
annum, covering both energy used within the manufacturing
process and energy saved across the product life cycle. The
total energy efficiency improvement in 2011 was 3.4%.
The UK government announced in the 2011 budget their
intention to introduce a ‘carbon price floor’ with effect from
1 MGD - Million Gallons per Day2 As per revised Utilisation concept & calculation
Hundred and fifth annual report 2011-12
78
2013-14. This is an additional UK-only tax on electricity
generation related to the carbon intensity of the generation
fuel used, which would come into effect if the price of
carbon in the EU ETS does not reach certain thresholds.
The impact of the tax for consumers, if triggered, will be to
raise the wholesale price of electricity in the UK. European
steelmakers already face significantly higher emission costs
under Phase 3 of the EU ETS and the carbon price floor will
impose additional cost specifically on the UK steel industry.
However, in response to concerns being raised in relation to
the effects that this and other policy decisions would have on
international competitiveness, a compensation package for
energy intensive industries has been announced in principle
by the UK Government, although the scope and extent of the
package are still being determined.
SUBSIDIARIESThe consolidated financial statements presented by the
Company include financial information of its subsidiaries
prepared in compliance with applicable Accounting Standards.
The Ministry of Corporate Affairs, Government of India vide
its Circular No. 5/12/2007-CL-III dated 8th February, 2011
has granted general exemption under Section 212(8) of the
Companies Act, 1956, from attaching the balance sheet, profit
and loss account and other documents of the subsidiary
companies to the balance sheet of the Company, provided
certain conditions are fulfilled. Accordingly, annual accounts of
the subsidiary companies and the related detailed information
will be made available to the holding and subsidiary companies’
investors seeking such information at any point of time. The
annual accounts of the subsidiary companies will also be kept
for inspection by any investor at its Head Office in Mumbai and
that of the subsidiary companies concerned.
Details of major subsidiaries of the Company are covered in
this Annual Report.
DIRECTORSMr. Suresh Krishna stepped down as a Director of the Company
on 24th December, 2011 on reaching the age of 75 years.
The Directors would like to place on record their sincere
appreciation of the contributions made by Mr. Suresh Krishna
during his tenure on the Board since 1994.
In April 2012, Mr. B. Muthuraman, Vice Chairman of the Company
was conferred with the prestigious Padma Bhushan Award by
the Honourable President of India, in the trade and industry
category.
In accordance with the provisions of the Companies Act, 1956,
and the Company’s Articles of Association, Mr. B. Muthuraman,
Mr. Ishaat Hussain and Mr. Andrew Robb retire by rotation and
are eligible for re-appointment.
Mr. Cyrus Pallonji Mistry, Executive Deputy Chairman of Tata
Sons Limited and Mrs. Mallika Srinivasan, Chairman & Chief
Executive Officer of Tractors and Farm Equipment Limited were
appointed as Additional Directors by the Board with effect
from 21st May, 2012.
Mr. Cyrus Pallonji Mistry and Mrs. Mallika Srinivasan will hold
office till the date of the forthcoming Annual General Meeting
and notices have been received from a Member proposing
the candidatures of Mr. Mistry and Mrs. Srinivasan for being
appointed as Directors of the Company.
ENERGy, TECHNOLOGy AND FOREIGN EXCHANGEDetails of energy conservation and research and development
activities undertaken by the Company along with the
information in accordance with the provisions of Section
217(1)(e) of the Companies Act, 1956, read with the Companies
(Disclosure of Particulars in the Report of Board of Directors)
Rules, 1988, are given in Annexure ‘A’ to the Directors’ Report.
79
PARTICULARS OF EMPLOyEESThe information required under Section 217(2A) of the
Companies Act, 1956 and the Rules there under, in respect of
the employees of the Company, is provided in the Annexure
forming part of this Report. In terms of Section 219(1)(b)(iv)
of the Act, the Report and Accounts are being sent to the
Members, excluding the aforesaid Annexure. The Annexure is
available for inspection by Members at the Registered Office
of the Company during business hours on working days up to
the date of the ensuing AGM, and if any Member is interested
in obtaining a copy thereof such Member may write to the
Company Secretary, whereupon a copy would be sent.
COPORATE GOVERNANCEPursuant to Clause 49 of the Listing Agreement executed with
the Stock Exchanges, a Management Discussion and Analysis,
Corporate Governance Report, Managing Director’s and
Auditors’ Certificate regarding compliance of conditions of
Corporate Governance are made a part of the Annual Report.
A Business Responsibility Report on the Company’s corporate
sustainability initiatives is also included.
DIRECTORS’ RESPONSIBILITy STATEMENTPursuant to Section 217 (2AA) of the Companies Act, 1956,
the Directors, based on the representations received from the
Operating Management, confirm that :
1. in the preparation of the annual accounts, the applicable
accounting standards have been followed and that there
are no material departures;
2. they have, in the selection of the Accounting Policies,
consulted the Statutory Auditors and have applied them
consistently and made judgements and estimates that are
reasonable and prudent so as to give a true and fair view
of the state of affairs of the Company at the end of the
financial year and of the profit of the Company for that
period;
3. they have taken proper and sufficient care to the best
of their knowledge and ability for the maintenance of
adequate accounting records in accordance with the
provisions of the Companies Act, 1956, for safeguarding the
assets of the Company and for preventing and detecting
fraud and other irregularities;
4. they have prepared the annual accounts on a going
concern basis.
On behalf of the Board of Directors
RATAN N. TATA
Chairman
Mumbai, 22nd May, 2012
Hundred and fifth annual report 2011-12
80
Declaration Regarding Compliance by Board Members and Senior Management Personnel with the Code of Conduct
This is to confirm that the Company has adopted Tata Code of Conduct for its employees including the Managing Director and
Whole-time Directors. In addition, the Company has adopted the Tata Code of Conduct for Non-Executive Directors. Both these
Codes are posted on the Company’s website.
I confirm that the Company has in respect of the financial year ended 31st March, 2012, received from the senior management team
of the Company and the Members of the Board a declaration of compliance with the Code of Conduct as applicable to them.
For the purpose of this declaration, Senior Management Team means the Members of the Management one level below the
Managing Director as on 31st March, 2012.
H. M. NERURKAR
Mumbai, 22nd May, 2012 Managing Director
81
Annexure ‘A’ to the Directors’ Report:
Particulars for Tata Steel Limited, the standalone entity, required under the Companies (Disclosure of Particulars in the Report of
the Board of Directors) Rules, 1988:
Conservation of Energy
a. Energy Conservation measures taken:
i. Coke dry quenching at Battery 5, 6, & 7 in Coke Plant.
ii. Reduction in auxiliary power consumption at Power House # 3 & 5.
iii. Dynamic modeling of oxygen offtake to reduce oxygen delay in Steel Making Shops.
iv. Efficient use of by-product gases for Power Generation – Highest ever power generation through by-product gases.
v. Application of V/F drives to reduce Specific power consumption.
b. Additional investments and proposal for reduction of consumption of energy:
i. Installation and commissioning of new L.D. Gas Holder (cap:100000 cum.) and its export system.
ii. Recovery of sensible heat of coke by installation of Coke Dry Quenching system in Batteries of 10 & 11 at Coke Plant.
iii. Installation and commissioning of ‘I’ Blast Furnace with Top Recovery Turbine.
iv. Combined Cycle Power Plant on by-product gases.
v. Use of Pellets and shift on alternate fuel (i.e. gas mixing) for utilizing clean by-product gases.
c. Impact of the above Measures:
Energy Conservation measures during 2011-2012 has resulted in achieving:
i. Plant specific energy consumption – 6.097 Gcal/tcs.
ii. Achieved World bench mark level of lowest BF gas venting 3.47% of generation (benchmark 5 % of generation, WSA).
iii. Best ever LD gas yield of 91.50 Nm3/tcs (daily) as against previous best of 89.52 Nm3/tcs (daily).
iv. Highest ever power generation through by product gases – 200 MW.
v. Lowest ever Plant Power Rate – 351 kWh/tss.
vi. Highest ever combined boiler efficiency – 85.22 %.
vii. Lowest ever Fuel rate at Hot Strip Mill – 0.269 Gcal/t.
viii. Achieved zero oxygen delay at Steel Melting Shops.
Hundred and fifth annual report 2011-12
82
Form - AForm for disclosure of particulars with respect to Conservation of energy : 2011 - 12 Particulars 2011-12 2010-11 Difference Reasons for variationA . POWER & FUEL CONSUMPTION 1. Electricity (a) Purchased Units (M. KWH) 2,545.63 2,354.76 190.87 Increase in demand due to higher production. Total Amount (` Lakhs) # 98,653.43 70,459.98 28,193.46 Average Rate/Unit (`/KWH) 3.88 2.99 0.88 Introduction of renewable energy purchase obligation from FY12 & higher power rate of IEL. (b) Own Generation (i) Through Diesel Generator Units (M. KWH) 4.09 15.45 (11.36) Lower use of DG Set. Units per litre of Diesel Oil (KWH) 3.73 3.92 (0.19) Average Cost/Unit (`/KWH) 37.49 19.92 17.56 Increase in Diesel Price. (ii) Through Steam Turbine/Generator Units (M. KWH) 995.83 952.66 43.17 Units per tonne of Coal (KWH) 9,107 9,103 3.56 Average Cost/Unit (`/KWH) 2.41 2.17 0.24 (* This includes generation of PH4 242.62 204.78 in M Kwh which is operated on by-product gases upto 95%) (iii) Through TRT Units (M. KWH) 105.24 140.28 (35.04) Lower In-house power generation by Top recovery turbine. Average Cost/Unit (`/KWH) 2.00 2.00 (0.00) 2. Coal (i) Coking Coal and Cokeries Quantity (Million Tonnes) 5.39 5.17 0.21 Increase in coke production and increase in coal prices. Total cost (` Lakhs) 469,866.54 323,002.24 146,864.30 Average Rate (`/Tonne) 8,721.82 6,244.20 2,477.62 (ii) Blast Furnace Injection Coal Quantity (Million Tonnes) 0.87 0.84 0.03 Total cost (` Lakhs) 116,867.14 82,557.59 34,309.54 Average Rate (`/Tonne) 13,412.19 9,862.08 3,550.12 Increase in imported coal price. (iii) Middling Coal and ROM Quantity (Million Tonnes) 0.10 0.10 0.00 Total cost (` Lakhs) 1,679.89 1,066.19 613.71 Average Rate (`/Tonne) 1,602.43 1,062.04 540.39 Increase in Middling Cost At West Bokaro. 3. Furnace Oil Quantity (Kilo litres) 15,424.23 16,225.92 (801.69) Total Amount (` Lakhs) 5,637.40 4,306.58 1,330.82 Average Rate (`/KL) 36,548.98 26,541.36 10,007.62 4. Others L.D.O. Quantity (Kilo litres) 2,390.15 4,853.14 (2,462.98) Lower use of Diesel in DG due to lower generation. Total cost (` Lakhs) 1,264.22 2,262.67 (998.45) Average Rate (`/KL) 52,892.98 46,622.93 6,270.06 Increase in Diesel price. 5. Others L.P.G. Quantity (Tonnes) 7,623.76 6,576.22 1,047.54 Total cost (` Lakhs) 3,933.98 2,720.59 1,213.39 Average Rate (`/Tonnes) 51,601.57 41,370.11 10,231.47 6. Others HSD. Oil Quantity (Kilo Litres) 49.69 58.85 (9.16) Decrease is mainly due to lower production and Total cost (` Lakhs) 22.40 23.78 (1.38) also partly due to manual soap settlement Average Rate (`/Tonnes) 45,079.49 40,411.94 4,667.55 tank being added to the existing filtration circuit # Excludes electricity duty paid on purchases.B. CONSUMPTION PER UNIT OF PRODUCTION Particulars Steel Tubes Bearings F.A.M.D. Growth Shop CRC West Wire Div. (per tonne) (per tonne) (per no.) (per tonne) (per tonne) (per tonne) (per tonne) Electricity (KWH) 351.00 105.00 0.33 3728.05 531.67 81.88 216.14 356.00 113.00 0.41 3614.14 570.74 113.00 222.14 Furnace Oil (Litres) — 10.09 4.55 25.50 — (11.31) (6.37) (29.40) Coking Coal (Tonnes)* 0.59 (0.61) Others: Light Diesel Oil (Litres) 0.26 2.04 (0.63) (2.84) High Speed Diesel Oil (Litres) 0.20 (0.28) L.P.G. (kg) 9.99 20.01 (13.50) (20.67)
* Coal Consumed in HMC for producing Coke has not been considered for this calculation.
83
Form - BForm for disclosure of particulars with respect of Technology Absorption 2011-12.
Research and Development
1. Specific Areas in which R&D was carried out by the Company:
• RawMaterials
• Costandproductivity
• Marketandnewproducts
• EnergyandEnvironment
2. Benefits derived
Pilot trials of organo-refining to produce 4% ash clean coal with 80% combustible recovery
During 2011, the Raw Materials and Coke Making Research Group successfully piloted a novel technology for chemical beneficiation of coal with a capacity of processing 20 kg coal per batch. The objective was to reduce the ash content from 25% ash captive coal to 4%, while maintaining yield. The pilot plant results have shown that this patented technology is capable of 90% de-ashing of high ash Indian coal.
This investigation focused on coal beneficiation through a chemical processing route and has been established at bench scale level for the first time. The innovative technique was able to obtain high levels of coal enrichment, from as high as 30% ash content to less than 4% ash, while maintaining almost 80% combustible recovery. The innovation is based on solvent extraction technique which involves dissolving the coal in a solvent and the extract so produced contains mostly organic material derived from coal, with little mineral matter.
The current steel making practice uses 40% of beneficiated captive coal, a large proportion of which gets rejected due to the high ash content. The limitations of physical beneficiation process necessitated venturing into physicochemical approaches in order to obtain a breakthrough in ash level. However, a chemical treatment process is generally cost intensive, the reasons for which are inefficient and costly regeneration processes (like distillation, evaporation etc.), stringent environmental norms and loss of expensive chemicals. Cost of the process was substantially reduced through various innovative approaches in energy and chemistry optimisation and more work is planned to further improve. Solvent loss was reduced by controlling the solvent ratio and various further studies are planned for reaching towards a ‘zero loss’ target.
Table 1 revealed that the plant values for ash content of run of mine coal was significantly higher than the lab results. Similarly for floatation clean coal, a substantial increase in yield was observed maintaining the same product quality. This established a successful up-scaling of the process to bench scale level.
This innovation has the potential of bringing down the overall ash in West Bokaro clean coal from 15% to 8%. Apart from coal processing for coke making, the process can also be used as a resource for value added carbon products like carbon foam, carbon composite and for green fuel which reduces the environmental burden. Bench scale plant results have been very encouraging and the next target is to establish the process performance at a higher scale of 500 kg/batch. The up-scaled plant will be continuous and equipped with several tailor made machines and automation.
Table 1: Comparative results between lab scale and bench scale plant
WB R.O.M Coal (Feed ash 26%)
Lab Result Plant Result
Yield 45% Yield 60%
Clean Coal Ash <=4% Clean Coal Ash <=4%
Reject Ash >43% Reject Ash >57%
Flotation Clean Coal (Feed ash 14%)
Lab Result Plant Result
Yield 65% Yield 70%
Clean Coal Ash <=3.5% Clean Coal Ash <=3%
Reject Ash >=23% Reject Ash >=31%
A novel scheme to increase the in-house electrical power generation by 50 MW
The in-house power stations of Tata Steel, Jamshedpur use a Rankine cycle for power generation and a part of the total steam produced in the steam plants is utilised to meet the requirements of process steam too. This adversely affects the efficiency of power generation. Together with Chief, Power Systems, the Steel Making and Casting Research Group evaluated options to improve the thermal efficiency and generate additional power using combined cycle power plants.
Energy and thermo-dynamic calculations were carried out which revealed that the overall thermal efficiency of power generation at Power Houses 3, 4 & 5 (combined) was ~23% and ~33% at Power House 6. The combined cycle power generation is more efficient alternative and is being adopted worldwide. The potential of implementation was evaluated and accordingly a scheme of ‘combined-cycle co-generation and power system’ was recommended to the operations. In line with the plant requirements, it was suggested that there should be five identical gas turbines in the proposed plant. Suitable specifications for the gas turbine cycle were also worked out.
In changing over to the combined cycle system, there are two options. The first option is to use a combined cycle co-generation and power system, where the whole of the available by-product gases is used to run gas turbines and generate electrical power in the topping cycle. A part of the steam produced in the Heat Recovery Steam Generator (HRSG) is used as process steam and the balance is used for generating power through steam turbines in the bottoming cycle. The second option is to use a part of the available by-product gases to raise process steam in fired boilers and the balance is used separately to generate electrical power in combined cycle mode.
This pre-feasibility study analysed the first option. The proposed unit for co-generation system would require five identical gas turbines, the existing steam turbines of Power House 4 & 5 along with HRSGs and the combustion chambers In a gas turbine and steam turbine combined cycle power plant, a gas turbine is used to generate electricity and the heat of the exhaust gases of the turbine is utilised to produce steam in a HRSG. The steam produced drives a steam turbine and generates power.
The above scheme, if implemented, will generate an estimated 51 MW more power and also meet the requirement of process steam. Other benefits include reduction in cooling water requirement, CO2
emission, space requirement etc. The Power Engineering Division will now continue its detailed analysis including Option 2, and will work out a scheme if this technology is deemed feasible and suitable for Jamshedpur.
3. Future plan of action
Tata Steel's R&D recognises clean environment as one of the biggest challenge and are determined to provide the solutions aimed at reducing CO
2 emissions through the above mentioned programs.
As part of the company's vision, the reduction in the emissions of Carbon-di-oxide is attracting significant importance as a corporate strategy.
Hundred and fifth annual report 2011-12
84
4. Expenditure on R&D (` in crores)
(a) Capital 0.68 (b) Recurring 52.30 (c) Total 52.98 (d) Total R&D expenditure as a % of Total Turnover 0.16%
Technology Absorption, Adaptation and Innovation
Efforts madeOn the Process Front:Raw Materials & Iron Making
production – 5 grades changed in Financial Year 2011-12.
Process Improvement:• Best ever overall skin panel strike rate of 33.8%:The overall skin
panel strike rate (CRCA category) has consistently improved over the last 3 years In Financial Year 2011-12 it stands at 33.8% which is 7% improvement over Financial Year 2010-11.
• Theoverallstrikerateforlast3yearsisgivenbelow:
FY 12 FY 11 FY 10
33.8 26.9 23.8
Long Product
Product Development:
• Designed and developed superior earthquake resistant rebarthrough Micro alloying-first time in India (Section: 6, 8, 12 mm) with UTS/YS ratio >1.25. Good customer response received on trial supplies.
• Rationalization of chemistry for rebar successfully done leadingto Ferro alloy savings of worth ` 2.04 crore/month for total LD1 production effected from Dec-2011.
• ReducedScaleLossinHighcarbonwirerodsinTSWDfrom0.6%to0.3% by process modification.
• SuccessfullaboratorytrialsinthedevelopmentofnextgenerationCRS rebar with superior corrosion resistance property.
• Plasma coated rebar was marketed on trial basis and the marketfeedback was excellent.
Process Improvement:
• Joint projects with selected customers to improve drawability ofWR3M/ER70S6 wire rods successfully implemented. Customers appreciated the benefits that they could achieve in wire drawing.
• Customercomplaint:TheProductcomplaintwasatthelevelof257PPM as against the target of 280 PPM. The decrease in customer rejections was due to the Improvement in production processes.
o Internal rejections reduced from 10% to 2.5% (of Bara Output).
o Approval obtained for HRPO/HRSPO from M/s Ford, Wheels India, SSWL, Bajaj & Tata Motors
o Approval awaited from – Toyota, Nissan and Hyundai.
National Metallurgical Laboratory (NML) – TATA STEEL Projects
About 40 projects were taken up as collaborative Research Projects between NML and TATA STEEL. About 20 projects were completed during
85
the last year. The results of the successful projects were deployed in the steel manufacturing process.
• The process developed to manufacture bricks from Steel slag, flyash and Iron making slag has been commercialised.
• Ultrasonic testing method developed to check the High SpeedRolls in HSM resulted in the loss of roll due to spall.
Bearings Division:
• Solution provided to Maruti Suzuki India Limited (MSIL) for newversion of Gear Box – Gear Box was modeled in advanced design software and simulated in extreme operating conditions – 32004 and 33005 Taper Roller Bearings designed with optimized internal geometry and carbo-nitrided Inner Race and Outer Race to suit this application.
• AlternatesolutionprovidedtoToyotaKirloskarMotorsLtd.(TKML)Wheel Bearing of Innova – Wheel Bearing (SP802135) modeled in Advanced design software.
• 6304 EL Bearing designed to substitute a non-standard bearingrequired by Tata Motors Ltd. for Nano Europa Gear Box.
• ModifiedBearingdesignforbettersealingability&higherfatiguelife bearing has been developed for TML- Nano, with double lip rubber seal and internal dimensional characteristics for Front wheel application.
• Carbo-nitriding process for Ball Bearing (e.g. 6202 NC) andTaperRoller Bearing (e.g. 30205 NC) have been established – carbo-nitrided bearings have been tested and found to have 3 to 5 times more fatigue life compared to normally through hardened bearings.
Particulars of technology imported during last five years
Steel Division Absorption
Status of
Implementation
a) Variable Frequency Drive for Descaling Pump Motor at Hot Strip Mill (ABB, India) 2007 Commissioned
b) Sinter Plant No. 4, having a bed area of 204 sq mtr with ESP having lesser emission of 50 mg/ Nm3 2007 Commissioned
c) Double Jaw Eye Vertical Tong For Batch Annealing Furnace at CRM 2007 Commissioned
d) SCADA System for Water Utilities 2007 Commissioned
e) Quantitative Estimation of Minerals by SEM (Scanning Electron Microscope) 2007 Commissioned
f) XRD (X-Ray Defraction) for quantitative phase and texture analysis 2007 Commissioned
g) Electric Blowers for 'H' Blast Furnace 2009 Commissioned
h) Top Gas Recovery Turbine for 'H' Blast Furnaces 2009 Commissioned
I) Flat Cast House Design for 'H' Blast Furnace 2009 Commissioned
j) Internal Stoves for 'H' Blast Furnace 2009 Commissioned
k) Use of mixed gas in place for CO gas, for firing in 7th Lime Kiln 2009 Commissioned
l) New Billet Caster having all the latest facilities and having 9 m casting radius installed in an existing
building suitable for 6 m casting radius, by going underground and taking the pass line to (-)3.3 m level
2009 Commissioned
m) Use of hydraulic mould occilator and hydraulically operated turn over cooling bed at CC 3 at LD Shop 1 2009 Commissioned
n) Robotised Sample Testing Laboratory at LD Shop No 1 2009 Commissioned
o) Top Gas Recovery Turbine for 'G' Blast Furnace 2010 Commissioned
p) 4th Stove for 'G' Blast Furnace to facilitate relining of other stoves, without hampering hot metal
production
2010 Commissioned
q) Continuous Emission Monitoring stations at 4 locations inside Tata Steel Works 2010 Commissioned
r) Installation of Roll Coating & Drying System at Continuous Galvanising Line at Cold Rolling Mill 2011 Commissioned
s) Use of Blast Furnace Gas at New Reheating Furnace using regerative burners at Hot Strip Mill 2011 Commissioned
t) Installation of Chiller system for maintaining temperature of cooling medium for ‘H’ Bl. Fce Blower Drives
at Blower House No. 5
2011 Commissioned
u) Installation of 6.0 mtpa Pellet Plant for making pellets using iron ore fines, for use in Blast Furnaces 2012 Commissioned
v) Installation of New Steel Melting Shop (LD3), and one strand of Thin Slab Casting & Rolling (TSCR) facility 2012 Commissioned
w) Installation of Pipe Conveyor in the Lime handling circuit 2012 Commissioned
x) Installation of Rapid Loading Station at Dispatch Yard of Noamundi Iron Ore Mines, including Extromat
Silo Extractor in the fines circuit
2012 Commissioned
y) Installation of Barrel Reclaimer at Noamundi Iron Mines 2012 Commissioned
z) Installation of 0.25 mtpa FHCR (Full Hard Cold Rolling) Mill at Bara in Jamshedpur 2012 Commissioned
aa) Installation of Coke Dry Quenching facilities at Coke Oven Battery Nos 5, 6 & 7 2012 Commissioned
ab) Installation of Compactor at Wire Rod Mill 2012 Commissioned
Hundred and fifth annual report 2011-12
86
a. Export performance:
1. Activities relating to exports:
Tata Steel sells its key products like HR, CR, Galvanised,
Rebar, Wires, Ferro Alloys & Minerals (FAM) in international
market of strategic importance viz., Middle East, South
Africa, Japan, China, Korea, South East Asia, Europe
and SAARC countries. The key focus is to serve a wide
range of industries and to end customers. Considering
the limited availability of Flat and Long products
material for exports due to robust domestic demand
during the year, the focus was to keep our presence in
Nepal, Sri Lanka and Bhutan. Ferro Alloys Division was
honoured with the CAPEXIL (Chemical and Allied Export
Promotion Council of India) and EEPC (Engineering
Export Promotion Council) awards in Financial Year
2011-12 for its export performance in the recent years.
This Division also won the coveted TBEM Award (Tata
Business Excellence Award) in 2011.
2. Initiatives taken to increase exports during 2011-12:
• Increased presence in the ship building market of
Bangladesh which resulted in higher revenue over
commercial HRC exports.
• IncreasedthesalesofTataSteeliuminNepalmarkets
through distribution.
• IncreasedsalesvolumeofWiresin2011-12byabout
15%. Expanded sales of binding Wires in Nepal.
3. Development of new export markets for products and
services:
• Flat Products: The major focus is towards meeting
our long-term objectives for export of Flat Products
from TSCR (Thin Slab Caster).
• Long Products: Near term plan is to maintain our
presence with some key relationship customers.
• Wires: Developed new customers and re-entered the
duct wire market in USA with significant volumes.
• Ferro Alloys and Minerals: Growth in Financial Year
2011-12 was subdued in most parts of the world,
especially in H2 due to the impact of the European
crisis, strong appreciation of the Yen and liquidity
crunch in India and China. Global Stainless Steel
production grew 3.5% in 2011 at 33.4 million tonnes
(against a 24% growth in 2010 at 32.3 million tonnes),
impacting demand for Ferro Alloys.
4. Export plans:
• Flat Products: After the commissioning and
stabilisation of TSCR, the company plans to increase
exports of HRC from H2 2012-13 to around 30k tonnes
per month. This will be done across geographies in
South East Asia, Far East and Middle East.
• Long Products: Near term plan is to maintain our
presence with some key relationship customers.
Increase in exports is expected as and when planned
new capacities come up for production in India.
• Wires: In Financial Year 2012-13 the focus is to increase
sales volumes by 30-35% on YoY basis by targeting
new unexplored geographies.
• FAM Division: Increase in infrastructural spending
in India & China, strong steel demand in US from a
buoyant auto sector and a likely recovery in the
Euro zone, is expected to increase the demand for
Ferro Alloys by 5-6%. The Company plans to increase
its production capacity in Ferro Chrome and Silico
Manganese in Financial Year 2012-13.
b. Total foreign exchange used and earned: This has been
covered as a part of the notes to the financial statements
in this Annual Report.
Foreign Exchange earnings and outgo:
87
Management Discussion and Analysis 2011-12
INDUSTRy STRUCTURE:
Global Steel Industry:
Overall the global steel industry witnessed steady growth
during 2011. The growth in global steel demand was driven by
increased demand from key steel end-user industries including
infrastructure, construction and automotive, especially in
the emerging markets; in spite of financial turbulence in the
Eurozone, weak private demand in the United States and events
in Japan and the Middle East.
In 2011, the global steel demand is estimated to have increased
by 6% to reach a new high of 1,373 million tonnes, 13% above
the pre crisis levels in 2007. Growth was led by the emerging
economies, notably China (6% up) and India (4% up), where new
demand records were set. In the developed economies, demand
levels remained 15-25% below 2007 levels. Europe saw steel
demand increase by 5% and North America by 9% in 2011, but
steel demand in Japan fell by 3%, as the impact of the earthquake
and subsequent tsunami was felt on the manufacturing activity.
The growth in 2011 can be segregated in two halves. In the first
half of 2011, global steel consumption grew relatively faster,
underpinned by infrastructure construction and manufacturing
activity. In the second half of 2011, steel consumption was lower
than in the first half due to moderate economic growth in China,
the United States and Europe.
In 2011, global steel output reached 1.5 billion tonnes, an
increase of 7% compared to 2010 and a new record for world
crude steel production. All major steel producing countries
apart from Japan and Spain showed growth in 2011. Growth was
particularly strong in Turkey, South Korea and Italy.
Looking ahead, global steel market developments are likely
to remain generally positive, but with lower growth in 2012
compared to 2011. In the first few months of 2012, apparent steel
demand remained muted due to the uncertain economic climate.
For 2012 as a whole, global steel demand is forecast to grow by a
further 4% to reach 1,422 million tonnes. China, India and other
emerging markets will continue to drive demand but recent
market developments suggest likely slackening of demand.
This is primarily due to the recent changes in the monetary
policy in China to reduce bank credit and improve asset quality
as well as lower growth forecast in India. While USA and Japan
is expected to continue it's recovery, steel demand in Europe is
expected to fall by 1%.
The following table shows the crude steel production volume of
the top ten steel producing nations:
Figures in million tonnes
Rank Country 2011 2010 Change %
1 China 695.5 638.7 8.9%
2 Japan 107.6 109.6 (1.8%)
3 United States 86.2 80.5 7.1%
4 India 72.2 68.3 5.7%
5 Russia 68.7 66.9 2.7%
6 South Korea 68.5 58.9 16.3%
7 Germany 44.3 43.8 1.1%
8 Ukraine 35.3 33.4 5.7%
9 Brazil 35.2 32.9 7.0%
10 Turkey 34.1 29.1 17.2%
Source: World Steel Association
Steel Industry in India: India improved its ranking to become
the 4th largest producer of crude steel in the world during
2011 after China, Japan and the USA. The country’s production
grew by around 6% in 2011 over 2010.
The trend of crude steel production in India is shown in the
following chart:
Source: World Steel Association
0
10
20
30
40
50
60
70
80
2011201020092008200720062005
Indian Crude Steel Production (million tonnes)
45.849.5
53.157.8
62.868.3
72.2
Hundred and fifth annual report 2011-12
88
There has been a diversification in the product mix of the
steel industry in India towards sophisticated value added
steel used in the automotive sector, heavy machinery and
physical infrastructure. In 2011, the industry was faced with stiff
challenges due to rising inflationary pressures and deteriorating
global growth conditions. The multiple hikes in interest rates
by the central bank also impacted the industry’s growth in rate
sensitive key user industries. The production of flat products and
long products of major Indian companies is estimated to have
grown by around 7.5% and 4.5% respectively during Financial
Year 2011-12 when compared with the previous financial year.
Steel consumption of Flat products and Long products in
Financial Year 2011-12 grew by 2.3% and 5.8% respectively.
Flat product exports grew by 23% and Long product exports
increased to 279k tonnes in Financial Year 2011-12 compared
to 155k tonnes in Financial Year 2010-11. There was a reduction
in the import of Flat and Long Products by 5% and 8%
respectively. The steel prices during Financial Year 2011-12
have increased from the average prices prevailing in the
previous financial year driven by increase in the input costs and
improvement in demand.
UK and European Steel Industry: The recovery of the UK
economy as was witnessed in Financial Year 2010-11 slowed down
to 0.5% GDP growth in Financial Year 2011-12. Real disposable
income increased only marginally and private consumption
fell by 0.8% as personal savings have started to rise. Industrial
production during the year fell by 2.2%, while unemployment
increased to 5%. The UK government continued with the
execution of its fiscal austerity package to bring the budget to
a balanced position by 2015-16 and to protect its credit rating.
The estimated UK demand for carbon steel products in Financial
Year 2011-12 amounted to 9.7 mt. Estimated UK demand for the
Group’s main carbon steel products at 7.5 mt, remained broadly
unchanged compared to 2010-11, reflecting the weak economic
conditions in the UK. Imports from outside Europe peaked at
21% in the first half, declining subsequently, as importers focused
on higher priced regions and buyers reduced purchases of long-
lead time imports due to uncertainty In underlying demand.
Apparent steel consumption in the EU increased strongly
during the first half of 2011 as underlying demand improved
and prices increased. Customers increased stock levels and
purchases of imports to secure supply. However, the pace
of underlying growth slowed from mid-2011 mainly due to
the European sovereign debt crisis. As a result, customers
became unwilling to hold too much stock and focused
buying on immediate needs only. This cautious buying
behaviour continued throughout the second half of 2011,
reflecting both the ongoing cash and credit constraints faced
by businesses, and the continuing high degree of uncertainty
in the general business climate. For 2011 as a whole, apparent
steel consumption in the EU is estimated to have increased
by 5% year-on-year. In the first months of 2012, although
underlying demand remained below 2011 levels, apparent
steel demand increased as customers replenished stock levels
from the low levels reached in December 2011. Steel imports
into the EU rose sharply during the first half of 2011 before
moderating in the second half, though the absolute volumes
were still higher by approximately 25% over 2010 levels at
almost 20 mt.
South-East Asian Steel industry: Preliminary numbers
compiled by South East Asia Iron and Steel Institute (SEAISI)
suggest that apparent steel consumption in the Association of
South East Asian Nations (ASEAN) at 50.5 million tonnes in 2011
grew by 4% over 2010. Overall demand in the area grew by 4%
over 2010 for both Flat products as well as Long products. Flat
products demand of 27 million tonnes was largely met through
imports of 25 million tonnes whereas Long products demand
of 24 million tonnes was mostly catered through domestic
production of 18.5 million tonnes.
In Thailand, demand for Flat steel increased moderately by
3.5%, which was met by higher imports as domestic output
declined significantly by 14%. The Flat steel consumption in
89
Indonesia was up by 12% at 6 million tonnes, met largely by
imports as domestic output was only 2.6 million tonnes. In
Philippines, Flat steel demand was met mostly by domestic
output with stagnation in the imports and a significant
decline in exports. A similar situation was witnessed in
Malaysia’s Flat steel market with a substantial increase in
domestic output while imports declined by 6%. Vietnam’s
Flat steel demand declined by 2.7% whereas exports
increased significantly by 40% to 1.4 million tonnes and
also the increase in imports was to the tune of 5.8% to reach
5.6 million tonnes. In Singapore, Flat steel consumption
increased by 23% to 1.5 million tonnes, met by increase in
imports. Long steel demand in Singapore also witnessed
a significant increase this year by almost a million tonnes.
NatSteel Holdings, the only Long steel producer, expanded
its production by 4.7% which, however, was not sufficient
to meet the local demand. As a result, import showed a
significant increase of 38% during the year.
TATA STEEL GROUP OPERATIONS:
Gross steel deliveries were at par with the previous year due
to the economic situation in Europe and severe floods in
Thailand. Deliveries of Tata Steel India were higher by 3%
while Tata Steel Europe and Tata Steel Thailand deliveries
declined by 5% and 12% respectively. Deliveries of NatSteel
were at par with the previous year. The turnover for the
Group at ` 1,32,900 crores during Financial Year 2011-12
was 12% higher than the turnover in Financial Year 2010-11
(` 1,18,753 crores). This increase was primarily driven by higher
prices across the Group due to higher input costs. EBITDA for
the Group in Financial Year 2011-12 was ` 13,533 crores as
compared to ̀ 17,116 crores of Financial Year 2010-11 primarily
due to market conditions in Europe.
The Group reported a consolidated profit after taxes (after
minority interest and share of profit of associates) of ` 5,390
crores during Financial Year 2011-12 (` 8,983 crores in Financial
Year 2010-11).
Production and Sales of Steel Division (’000 tonnes)
0
2000
4000
6000
8000
FY 12FY 11FY 10FY 09FY 08
Production Sales
4858 47825375 5232
6439 61696691 6416
69706632
Tata Steel India:
Figures in ` Crores
2011-12 2010-11
Turnover 33,933 29,396
Profit before tax (PBT) 9,857 9,777
Profit after tax (PAT) 6,696 6,866
1. Steel division:
The production and sales figures of the steel division of the
Company are shown in the following table:
Figures in million tonnes
Fy 12 Fy 11 Change %
Hot Metal 7.75 7.50 3.33%
Crude Steel 7.13 6.86 3.94%
Saleable Steel 6.97 6.69 4.19%
Sales 6.63 6.42 3.27%
The trend of steel production and sales is shown below:
The major production and sales highlights for Financial Year
2011-12 are shown below:
Production: Key highlights of the production performances of
various units in the Steel Works are shown below:
Figures in million tonnes
Best ever Fy 12 Previous best
G Blast Furnace Hot metal production 2.13 2.11 – FY 11
LD shop #2 & Slab Caster
Slab production 4.00 3.80 – FY 11
LD shop #1 Billet production 3.12 3.05 – FY 11
Hot Strip Mill Production 3.94 3.73 – FY 11
New Bar Mill Production 0.78 0.72 – FY 11
Wire Rolling Mill Production 0.42 0.40 – FY 10
Lime Plant Production 0.70 0.69 – FY 11
West Bokaro (clean coal)
Production 2.30 2.20 – FY 11
Hundred and fifth annual report 2011-12
90
The production from the larger furnaces was maximised
with better productivity and lower coke consumption while
increased vessel life in the steel melting area enhanced crude
steel production to 7.13 million tonnes, crossing the 7 million
tonnes milestone for the first time.
Sales
• Overall sales at 6.63 million tonnes grew by 3% over last
year (6.42 million tonnes in Financial Year 2010-11).
• Due date performance (which measures delivery
compliance) was sustained at 96% in Flat Products and
improved significantly from 91% to 96% in Long Products.
Flat Products
• The sales of Flat products at 3.74 million tonnes
increased by 6% in Financial Year 2011-12 (3.54 million
tonnes in Financial Year 2010-11).
• The division achieved the best ever sales performance in
Net worth per Share as at year end 566.69 533.97 467.57 409.02
Earnings per Share:
Basic 67.84 75.63 54.28 99.03
Diluted 66.62 70.99 53.63 92.86
Dividend per Share 12.00 12.00 12.00 12.00
Employees (Numbers) 35,793 34,912 81,622 81,251
Shareholders (Numbers) 10,37,209 9,69,987
Hundred and fifth annual report 2011-12
134
Tata Steel Standalone Tata Steel Group
2011-12 2010-11 2011-12 2010-11
1. EBITDA/Turnover 34.06% 39.55% 10.18% 14.41%2. PBT/Turnover 27.54% 31.05% 4.26% 7.73%3. Return on Average Capital Employed 13.07% 14.87% 8.62% 14.14%4. Return on Average Net worth 13.01% 16.04% 13.14% 29.88%5. Asset Turnover 76.28% 79.88% 93.06% 93.04%6. Inventory Turnover (in days) 45 42 68 667. Debtors Turnover (in days) 7 5 41 408. Gross Block to Net Block 1.44 1.63 2.15 2.239. Net Debt to Equity 0.41 0.49 1.16 1.5510. Current Ratio 0.96 1.63 1.68 1.8311. Interest Cover ratio 9.80 7.76 2.69 3.6112. Net worth per share (`) 566.69 533.97 467.57 409.0213. Basic Earnings per share (`) 67.84 75.63 54.28 99.0314. Dividend Payout 20.00% 19.00% 25.00% 15.00%15. P/E Ratio 6.93 8.20 8.67 6.27
1. EBITDA/Turnover (EBITDA: PAT after minority and share of associates + Tax +/(-) Exceptional Items + Net Finance Charges + Depreciation and
amortisation) (Net Finance Charges: Finance costs – Interest income – Dividend income from current investments – Net gain/(loss) on sale of
current investments) (Turnover: Revenue from Operations less Excise Duty)2. PBT/Turnover (PBT: PAT after minority and share of associates + Tax +/(-) Exceptional Items)3. Return on Average Capital Employed: EBIT/Average Capital Employed (Capital Employed: Net worth + Minority interest + Long-term Borrowings + Current maturities of long-term borrowings + Short-
term Borrowings + Deferred tax liabilities) (EBIT: PAT after minority and share of associates + Tax +/(-) Exceptional Items + Net Finance Charges)4. Return on Average Net worth: PAT after minority and share of associates/Average Net worth (Net worth: Shareholders’ funds + Preference Shares issued by subsidiary companies + Warrants issued by a subsidiary
Difference Account)6. Inventory Turnover: Average Inventory/Sale of Products in days7. Debtors Turnover: Average Debtors/Turnover in days8. Gross Block to Net Block: Gross Block/Net Block (Gross Block: Cost of tangible assets + Capital work in progress + Cost of intangible assets + Intangible assets under
development) (Net Block: Gross Block - Accumulated depreciation and amortisation - Accumulated impairment)9. Net Debt to Equity: Net Debt/Average Net Worth (Net Debt: Long-term borrowings + Current maturities of long-term borrowings + Short-term borrowings - Current Investments -
Non-current balances with banks - Cash and Bank Balances)10. Current Ratio: Current Assets (excluding current investments)/Current Liabilities (Current liabilities: Trade Payables + Other current liabilities + Short-term provisions - Current maturities of long-term borrowings)11. Interest Cover Ratio: EBIT/Net Finance Charges12. Net worth per share: Net Worth/Average Number of Equity Shares13. Basic Earnings per share: Profit attributable to Ordinary Shareholders/Weighted average number of Ordinary Shares14. Dividend Payout: Dividend/Profit after tax15. P/E Ratio: Market Price/Basic Earnings per share
Financial Ratios
135
Production Statistics(’000 Tonnes)
Year Iron Coal Iron Crude Rolled/ Plates Sheets Hot Rolled Cold Rolled Railway Semi- Total Ore Steel Forged Coils/ Coils Materials Finished Saleable Bars and Strips for Sale Steel Structurals
Additional information:Figures of total saleable steel are adjusted for:(a) From 1985-86 and onwards - steel transferred to and produced at the Company’s Tubes Division.(b) Total saleable steel for 2003-04 includes production of the erstwhile Tata SSL Ltd., pursuant to its merger with the Company.
Hundred and fifth annual report 2011-12
136
Financial Statistics(` crores)
CAPITAL ACCOuNTS REvENuE ACCOuNTS Capital Reser- Borrow- Gross Net Invest- Income Expen- Depre- Profit Tax Profit Net Divi-Year ves and ings Block Block ments diture ciation before after Transfer dend Surplus Tax Tax to Reserves
+ Excluding Preference Shares which have been cancelled with effect from 1-4-1983 and Non-Convertible Bonds issued in lieu thereof.@ Including ` 15.05 crores additional depreciation for 1983-84.# Including tax on dividend. Gross block is net of impairment, if any. Expenditure includes excise duty recovered on sales.
137
Dividend Statistics First Preference Second Preference Ordinary Year (` 150) (` 100) (` 100 upto 1988-89 and ` 10 from 1989-90) c
Rate Dividend Rate Dividend @ Tax on dividend Rate Dividend @ Tax on dividend Total ` ` lakhs ` ` lakhs ` lakhs ` ` lakhs ` lakhs ` lakhs
a Including on Bonus Shares issued during the year.b On the Capital as increased by Rights Issue of Ordinary Shares during 1987-88.c The Ordinary Shares of ` 100 each have been sub-divided into Ordinary Shares of ` 10 each during 1989-90 and the rate of Dividend is per Ordinary
Share of ` 10 each.d On the Capital as increased by shares allotted on Conversion of Convertible Debentures.e On the Capital as increased by Rights Issue of Ordinary Shares during 1992-93.f On the Capital as increased by Ordinary Shares issued during 1993-94 against Detachable Warrants.g On the Capital as increased by Ordinary Shares issued during 1994-95 against Detachable Warrants and Foreign Currency Convertible Bonds.h On the Capital as increased by Ordinary Shares issued during 1995-96 against Detachable Warrants, Foreign Currency Convertible Bonds and Naked
Warrants.i Includes Dividend of ` 22.30 lakhs on 9.25% Cumulative Redeemable Preference Shares for the period 1st April, 2000 to 27th June, 2000.j Includes Dividend of ` 1,198.40 lakhs on 8.42% Cumulative Redeemable Preference Shares for the period 1st June, 2000 to 31st March, 2001.k Dividend paid for 74 days.@ Includes tax on dividend.
Hundred and fifth annual report 2011-12
138
Auditors’ Report
TO THE MEMBERS OF TATA STEEL LIMITED1. We have audited the attached Balance Sheet of TATA STEEL LIMITED (“the Company”) as at 31 March, 2012, the
Statement of Profit and Loss and the Cash Flow Statement of the Company for the year ended on that date, both annexed thereto. These financial statements are the responsibility of the Company’s Management. Our responsibility is to express an opinion on these financial statements based on our audit.
2. We conducted our audit in accordance with the auditing standards generally accepted in India. Those Standards require that we plan and perform the audit to obtain reasonable assurance about whether the financial statements are free of material misstatement. An audit includes examining, on a test basis, evidence supporting the amounts and the disclosures in the financial statements. An audit also includes assessing the accounting principles used and the significant estimates made by the Management, as well as evaluating the overall financial statement presentation. We believe that our audit provides a reasonable basis for our opinion.
3. As required by the Companies (Auditor’s Report) Order, 2003 (CARO) issued by the Central Government in terms of Section 227(4A) of the Companies Act, 1956, we enclose in the Annexure a statement on the matters specified in paragraphs 4 and 5 of the said Order.
4. Further to our comments in the Annexure referred to in paragraph 3 above, we report that: (a) we have obtained all the information and explanations which to the best of our knowledge and belief were necessary
for the purposes of our audit; (b) in our opinion, proper books of account as required by law have been kept by the Company so far as it appears
from our examination of those books; (c) the Balance Sheet, the Statement of Profit and Loss and the Cash Flow Statement dealt with by this report are in
agreement with the books of account; (d) in our opinion, the Balance Sheet, the Statement of Profit and Loss and the Cash Flow Statement dealt with by
this report are in compliance with the Accounting Standards referred to in Section 211(3C) of the Companies Act, 1956;
(e) in our opinion and to the best of our information and according to the explanations given to us, the said financial statements give the information required by the Companies Act, 1956 in the manner so required and give a true and fair view in conformity with the accounting principles generally accepted in India:
(i) in the case of the Balance Sheet, of the state of affairs of the Company as at 31 March, 2012; (ii) in the case of the Statement of Profit and Loss, of the profit of the Company for the year ended on that date
and (iii) in the case of the Cash Flow Statement, of the cash flows of the Company for the year ended on that date.5. On the basis of the written representations received from the Directors and taken on record by the Board of Directors,
none of the Directors is disqualified as on 31 March, 2012 from being appointed as a director in terms of Section 274(1)(g) of the Companies Act, 1956.
For DELOITTE HASKINS & SELLSChartered Accountants(Registration No.117366W)
N. vENKATRAMPartner(Membership No. 71387)
MuMBAI, 18 May, 2012
139
Annexure to the Auditors’ Report
[Referred to in paragraph (3) of our report of even date]
(i) Having regard to the nature of the Company’s business/activities/result, clauses (x), (xii), (xiii) and (xiv) of CARO are not applicable.
(ii) In respect of its fixed assets:
(a) The Company has maintained proper records showing full particulars, including quantitative details and situation of the fixed assets.
(b) Some of the fixed assets were physically verified during the year by the Management in accordance with a regular programme of verification which, in our opinion, provides for physical verification of all the fixed assets at reasonable intervals. According to the information and explanations given to us, no material discrepancies were noticed on such verification.
(c) The fixed assets disposed off during the year, in our opinion, do not constitute a substantial part of the fixed assets of the Company and such disposal has, in our opinion, not affected the going concern status of the Company.
(iii) In respect of its inventory:
(a) As explained to us, the inventories of finished and semi-finished goods and raw materials at Works, Mines and Collieries were physically verified during the year by the Management. In respect to stores and spare parts and stocks at stockyards and with consignment/conversion agents, the Company has a programme of verification of stocks over a three year period. In our opinion, having regard to the nature and location of the stocks, the frequency of verification is reasonable. In case of materials lying with third parties, certificates confirming stocks have been received for stocks held.
(b) In our opinion and according to the information and explanation given to us, the procedures of physical verification of inventories followed by the Management were reasonable and adequate in relation to the size of the Company and the nature of its business.
(c) In our opinion and according to the information and explanations given to us, the Company has maintained proper records of its inventories and no material discrepancies were noticed on physical verification.
(iv) In respect of loans, secured or unsecured, granted by the Company to companies, firms or other parties covered in the Register under Section 301 of the Companies Act, 1956, according to the information and explanations given to us:
(a) The Company has granted loans aggregating Rs.167.22 crores to one party during the year. At the year-end, there is no balance outstanding and the maximum amount involved during the year was Rs. 3,720.38 crores.
(b) The rate of interest and other terms and conditions of such loans are, in our opinion, prima facie not prejudicial to the interests of the Company.
(c) The receipts of principal amounts and interest have been regular/as per stipulations.
(d) There were no loans outstanding as at the year-end, and therefore clause (iii) (d) of paragraph 4 of CARO is not applicable.
The Company has not taken any loans, secured or unsecured, from companies, firms or other parties covered in the Register maintained under Section 301 of the Companies Act, 1956. Accordingly, clauses (iii) (e) to (iii) (g) of paragraph 4 of CARO are not applicable.
(v) In our opinion and according to the information and explanations given to us, having regard to the explanations that some of the items purchased are of special nature and suitable alternative sources are not readily available for obtaining comparable quotations, there is an adequate internal control system commensurate with the size of the Company and the nature of its business with regard to purchases of inventory and fixed assets and the sale of goods and services. During the course of our audit, we have not observed any major weakness in such internal control system.
Hundred and fifth annual report 2011-12
140
(vi) In respect of contracts or arrangements entered in the Register maintained in pursuance of Section 301 of the Companies Act, 1956, to the best of our knowledge and belief and according to the information and explanations given to us:
(a) The particulars of contracts or arrangements referred to Section 301 that needed to be entered in the Register maintained under the said Section have been so entered.
(b) Where each of such transaction is in excess of Rs.5 lakhs in respect of any party, the transactions have been made at prices which are prima facie reasonable having regard to the prevailing market prices at the relevant time.
(vii) In our opinion and according to the information and explanations given to us, the Company has complied with the provisions of Sections 58A and 58AA or any other relevant provisions of the Companies Act, 1956 and the Companies (Acceptance of Deposits) Rules, 1975 with regard to the deposits accepted from the public. According to the information and explanations given to us, no order has been passed by the Company Law Board or the National Company Law Tribunal or the Reserve Bank of India or any Court or any other Tribunal.
(viii) In our opinion, the Company has an adequate internal audit system commensurate with the size and the nature of its business.
(ix) We have broadly reviewed the cost records maintained by the Company pursuant to the Companies (Cost Accounting Records) Rules, 2011 prescribed by the Central Government under Section 209(1)(d) of the Companies Act, 1956 and are of the opinion that prima facie the prescribed cost records have been maintained. We have, however, not made a detailed examination of the records with a view to determining whether they are accurate or complete.
(x) According to the information and explanations given to us in respect of statutory dues: (a) The Company has generally been regular in depositing undisputed dues, including Provident Fund, Investor
Education and Protection Fund, Income-tax, Sales Tax, Wealth Tax, Service Tax, Custom Duty, Excise Duty, Cess and other material statutory dues applicable to it with the appropriate authorities. We are informed that the Company intends to obtain exemption from operations of Employees’ State Insurance Act at all locations and necessary steps have been taken by the Company. We are also informed that actions taken by the authorities at some locations to bring the employees of the Company under the Employees’ State Insurance Scheme has been contested by the Company and full payment has not been made of the contributions demanded.
(b) There were no undisputed amounts payable in respect of Income-tax, Wealth Tax, Custom Duty, Excise Duty, Cess and other material statutory dues in arrears as at 31 March, 2012 for a period of more than six months from the date they became payable, except for collection of sales tax which we are informed are refundable to customers because they have been collected in excess or which have been collected pending receipt of necessary certificates from the customers.
(c) Details of dues of Income-tax, Sales Tax, Wealth Tax, Service Tax, Custom Duty, Excise Duty and Cess which have not been deposited as on 31 March, 2012 on account of disputes are given below:
Name of the Statute(Nature of dues)
Forum where Dispute is pending
Period to which the amount relates Amount involved
Deputy Commissioner 1975-76, 1977-80, 1981-86, 1995-96 to 2008-09 62.83
Assistant Commissioner 1973-74,1980-81,1983-84 to 1997-99, 2000-01 to 2009-12 52.22
Cess on Royalty, education, welfare etc. High Court 1956-94, 1999-2002, 2003-06, 2007-2011 7.66
(xi) In our opinion and according to the information and explanations given to us, the Company has not defaulted in the repayment of dues to banks, financial institutions and debenture holders.
(xii) In our opinion and according to the information and explanations given to us, the terms and conditions of the guarantees given by the Company for loans taken by others from banks and financial institutions are not prima facie prejudicial to the interests of the Company.
(xiii) In our opinion and according to the information and explanations given to us, the term loans have been applied for the purposes for which they were obtained, other than temporary deployment pending application.
(xiv) In our opinion and according to the information and explanations given to us and on an overall examination of the Balance Sheet, we report that funds raised on short-term basis have not been used during the year for long- term investment.
(xv) According to the information and explanations given to us, the Company has not made preferential allotment of shares to parties and companies covered in the Register maintained under Section 301 of the Companies Act, 1956.
(xvi) According to the information and explanations given to us, during the period covered by our audit report, the Company had issued unsecured debentures which did not require creation of any charge or security.
(xvii) The Management has disclosed the end use of money raised by public issue during the previous year, in Note 2 to the financial statements and we have verified the same.
(xviii) To the best of our knowledge and according to the information and explanations given to us, no fraud by the Company and no material fraud on the Company has been noticed or reported during the year.
For DELOITTE HASKINS & SELLSChartered Accountants(Registration No. 117366W)
N. vENKATRAMPartner(Membership No. 71387)
MuMBAI, 18 May, 2012
Hundred and fifth annual report 2011-12
142
Balance Sheet as at 31st March, 2012 As at 31.03.2011 Note Page ` crores ` crores EquiTy AND LiAbiLiTiES (1) SHAREHOLDERS' FuNDS 2 148 (a) Share Capital 971.41 959.41 3 151 (b) Reserves and Surplus 51,649.95 45,807.02 (c) Money received against share warrants – 178.20 52,621.36 46,944.63 4 152 (2) HYBRID PERPETuAL SECuRITIES 2,275.00 1,500.00 (3) NON-CuRRENT LIABILITIES 5 152 (a) Long-term borrowings 21,353.20 24,499.05 6 154 (b) Deferred tax liabilities (net) 970.51 936.80 7 154 (c) Other long-term liabilities 216.05 373.88 8 155 (d) Long-term provisions 1,851.30 2,201.47 24,391.06 28,011.20 (4) CuRRENT LIABILITIES 5 152 (a) Short-term borrowings 65.62 149.13 9 155 (b) Trade payables 5,973.23 4,464.81 10 155 (c) Other current liabilities 8,798.55 6,262.10 8 155 (d) Short-term provisions 2,066.24 2,219.85 16,903.64 13,095.89 96,191.06 89,551.72 ASSETS (5) NON-CuRRENT ASSETS (a) Fixed Assets 11 156 (i) Tangible assets 11,142.36 11,532.58 (ii) Capital work-in-progress 16,058.49 5,612.28 12 157 (iii) Intangible assets 223.90 272.52 27,424.75 17,417.38 13 158 (b) Non-current investments 49,078.35 43,565.15 14 162 (c) Foreign currency monetary item translation difference account 404.90 – 15 162 (d) Long-term loans and advances 6,415.80 10,453.41 16 163 (e) Other non-current assets 2.76 2.76 83,326.56 71,438.70 (6) CuRRENT ASSETS 17 163 (a) Current investments 1,204.17 2,999.79 18 164 (b) Inventories 4,858.99 3,953.76 19 164 (c) Trade receivables 904.08 424.02 20 164 (d) Cash and bank balances 3,946.99 4,138.78 15 162 (e) Short-term loans and advances 1,828.09 6,458.94 21 165 (f) Other current assets 122.18 137.73 12,864.50 18,113.02 96,191.06 89,551.72 1-48 146 Notes to Balance Sheet and Statement of Profit and Loss
Tata Steel Limited
A ANJENEYANCompany Secretary
In terms of our report attachedFor DELOITTE HASKINS & SELLS
Chartered Accountants,
N vENKATRAMPartner
Mumbai, 18th May, 2012
For and on behalf of the BoardRATAN N TATA ChairmanB MuTHuRAMAN Vice ChairmanS M PALIA ISHAAT HuSSAINSuBODH BHARGAvA DirectorsJACOBuS SCHRAvENANDREW ROBBKARL-uLRICH KOEHLERH M NERuRKAR Managing Director
}
143
A ANJENEYANCompany Secretary
In terms of our report attachedFor DELOITTE HASKINS & SELLS
Chartered Accountants,
N vENKATRAMPartner
Mumbai, 18th May, 2012
For and on behalf of the BoardRATAN N TATA ChairmanB MuTHuRAMAN Vice ChairmanS M PALIA ISHAAT HuSSAINSuBODH BHARGAvA DirectorsJACOBuS SCHRAvENANDREW ROBBKARL-uLRICH KOEHLERH M NERuRKAR Managing Director
}
Previous Year Note Page ` crores ` crores (1) REvENuE 22 165 (a) Revenue from operations 37,005.71 31,902.14 Less: Excise duty 3,072.25 2,505.79 33,933.46 29,396.35 23 166 (b) Other Income 886.43 528.36 ToTAL REvENuE 34,819.89 29,924.71 (2) ExPENSES 24 166 (a) Raw materials consumed 8,014.37 6,244.01 25 166 (b) Purchase of finished, semi-finished and other products 209.52 180.20 26 167 (c) Changes in inventories of finished goods, work-in-progress and stock-in-trade (220.72) (173.65) 27 167 (d) Employee benefits expense 3,047.26 2,837.46 28 168 (e) Depreciation and amortisation expense 1,151.44 1,146.19 29 168 (f) Finance costs 1,925.42 1,735.70 30 168 (g) Other expenses 11,824.49 9,024.82 25,951.78 20,994.73 (h) Less: Expenditure (other than interest) transferred to capital and other accounts 478.23 198.78 ToTAL ExPENSES 25,473.55 20,795.95 (3) PRoFiT bEFoRE TAx AND ExCEPTioNAL iTEMS 9,346.34 9,128.76 31 169 (4) ExCEPTioNAL iTEM (a) Profit on sale of non-current investments 511.01 648.09
(5) PRoFiT bEFoRE TAx 9,857.35 9,776.85
(6) TAx ExPENSE (a) Current tax 3,115.11 2,857.00 (b) Deferred tax (Note 6, Page 154) 45.82 54.16 3,160.93 2,911.16 (7) PRoFiT AFTER TAx 6,696.42 6,865.69 32 169 (8) bASiC EARNiNGS PER ShARE (`) 67.84 75.63 32 169 (9) DiLuTED EARNiNGS PER ShARE (`) 66.62 70.99 1-48 146 Notes to Balance Sheet and Statement of Profit and Loss
Statement of Profit and Loss for the year ended 31st March, 2012
Hundred and fifth annual report 2011-12
144
Year Ended 31.03.2011 ` crores ` croresA. Cash Flow from operating Activities: Net Profit before tax 9,857.35 9,776.85 Adjustments for: Depreciation and amortisation expense 1,151.44 1,146.19 Impairment of fixed assets 6.90 20.23 (Profit)/Loss on sale of assets/discarded assets written off 52.98 0.62 Profit on sale of non-current investments (511.01) (648.09) (Gain)/Loss on cancellation of forwards, swaps and options 41.92 (50.54) Interest and income from current investments (863.83) (385.78) Income from other investments (117.50) (92.66) Finance costs 1,925.42 1,735.70 Provision for wealth tax 1.70 1.28 Exchange (Gain)/Loss on revaluation of foreign currency loans and swaps 283.59 (263.70) 1,971.61 1,463.25 Operating Profit before Working Capital Changes 11,828.96 11,240.10 Adjustments for: Trade and other receivables 1,425.86 (103.01) Inventories (905.23) (876.01) Trade payables and other liabilities 1,205.36 948.20 1,725.99 (30.82) Cash Generated from operations 13,554.95 11,209.28 Direct tax paid (3,298.48) (2,870.28) Net Cash Flow from operating Activities 10,256.47 8,339.00
b. Cash Flow from investing Activities: Purchase of fixed assets (2) (7,059.20) (4,118.58) Sale of fixed assets 9.19 387.42 Purchase of non-current investments (55.36) (180.30) Purchase of investments in subsidiaries (3) (2,541.97) (5,312.05) Sale of non-current investments – 719.55 Sale of investments in subsidiaries 576.10 – (Purchase)/Sale of current investments (net) 2,226.19 (1,129.75) Inter-corporate deposits/Shareholder loan given (585.93) (7,667.09) Refund of inter-corporate deposits/shareholders' loan 4,006.87 3,959.70 Interest and income from current investments received 447.50 163.58 Dividend received 117.50 92.66
Net Cash used in investing Activities (2,859.11) (13,084.86)
Cash Flow Statement for the year ended 31st March, 2012
145
Cash Flow Statement for the year ended 31st March, 2012
Year Ended 31.03.2011 ` crores ` crores
C. Cash Flow from Financing Activities: Issue of Equity Share Capital 534.60 4,368.01 Issue of Share Warrants – 178.20 Capital contributions received 1.52 0.33 Proceeds from Hybrid Perpetual Securities 775.00 1,500.00 Proceeds from borrowings 2,317.43 6,412.04 Repayment of borrowings (8,212.56) (4,257.64) Amount received/(paid) on cancellation of forwards, swaps and options (31.82) 34.61 Expenses on issue of equity instruments (16.79) (98.52) Distribution on Hybrid Perpetual Securities (222.47) — Interest paid (2) (1,593.20) (1,776.27) Dividend paid (1,151.06) (709.77) Net Cash from Financing Activities (7,599.35) 5,650.99 Net increase/(decrease) in Cash and Cash equivalents (A + b + C) (201.99) 905.13 opening Cash and Cash equivalents (4) 4,102.52 3,191.29 [Note 20, Page 164] Closing Cash and Cash equivalents 3,900.53 4,096.42 [Note 20, Page 164]
Additional information: (1) Figures in brackets represent outflows. (2) Interest paid is exclusive of and purchase of fixed assets is inclusive of interest capitalised ` 284.49 crores (2010-11: ` 81.77
crores). (3) Investment in subsidiaries represents the portion of purchase consideration discharged in cash during the year and includes
application money on investments ` 981.18 crores (2010-11: ` 5,307.34 crores). (4) Includes ` 6.10 crores of Centennial Steel Company Ltd. on amalgamation with the Company (Note 38, Page 173). (5) Previous year figures have been recast/restated where necessary.
A ANJENEYANCompany Secretary
In terms of our report attachedFor DELOITTE HASKINS & SELLS
Chartered Accountants,
N vENKATRAMPartner
Mumbai, 18th May, 2012
For and on behalf of the BoardRATAN N TATA ChairmanB MuTHuRAMAN Vice ChairmanNuSLI N WADIAJAMSHED J IRANIS M PALIA ISHAAT HuSSAINSuBODH BHARGAvA Directors
JACOBuS SCHRAvENANDREW ROBBKIRBY ADAMSH M NERuRKAR Managing Director
}A ANJENEYANCompany Secretary
In terms of our report attachedFor DELOITTE HASKINS & SELLS
Chartered Accountants,
N vENKATRAMPartner
Mumbai, 18th May, 2012
For and on behalf of the BoardRATAN N TATA ChairmanB MuTHuRAMAN Vice ChairmanS M PALIA ISHAAT HuSSAINSuBODH BHARGAvA DirectorsJACOBuS SCHRAvENANDREW ROBBKARL-uLRICH KOEHLERH M NERuRKAR Managing Director
}
Hundred and fifth annual report 2011-12
146
1. ACCouNTiNG PoLiCiES(a) basis for Accounting The financial statements are prepared under the historical cost convention on an accrual basis of accounting in accordance
with the Generally Accepted Accounting Principles, Accounting Standards notified under Section 211(3C) of the Companies Act, 1956 and the relevant provisions thereof.
During the year, Revised Schedule vI notified under the Companies Act, 1956 has become applicable to the Company for preparation and presentation of its financial statements. The Company has reclassified the previous year figures in accordance with the requirements applicable in the current year.
(b) Revenue Recognition (i) Revenue from sale of goods is recognised net of rebates and discounts on transfer of significant risks and rewards of
ownership to the buyer. Sale of goods is recognised gross of excise duty but net of sales tax and value added tax. (ii) Revenue from services rendered is recognised on pro-rata basis in proportion to the stage of completion of the related
transaction. (iii) Export incentive under various schemes notified by the Government has been recognised on the basis of credits afforded
in the pass book/amount received.(c) Employee Benefits (i) Short-term employee benefits are recognised as an expense at the undiscounted amount in the Statement of Profit and
Loss of the year in which the employee has rendered services. (ii) Post employment benefits are recognised as an expense in the Statement of Profit and Loss for the year in which
the employee has rendered services. The expense is recognised at the present value of the amount payable towards contributions. The present value is determined using the market yields of government bonds, at the balance sheet date, as the discounting rate.
(iii) Other long-term employee benefits are recognised as an expense in the Statement of Profit and Loss for the year in which the employee has rendered services. Estimated liability on account of long-term benefits is discounted to the present value, using the market yield on government bonds, as on the date of balance sheet.
(iv) Actuarial gains and losses in respect of post employment and other long-term benefits are charged to the Statement of Profit and Loss.
(v) In respect of the Employee Separation Scheme, the increase in the net present value of the future liability for pension payable to employees, who have opted for retirement under the Employee Separation Scheme of the Company, is charged to the Statement of Profit and Loss.
(d) Tangible Assets Tangible assets are stated at cost less accumulated depreciation and net of impairment, if any. Pre-operation expenses
including trial run expenses (net of revenue) are capitalised. Borrowing costs during the period of construction is added to the cost of eligible tangible assets.
Blast Furnace relining is capitalised. The written down value of the asset consisting of lining/relining expenditure embedded in the cost of the furnace is written off in the year of fresh relining.
(e) Intangible Assets Intangible assets are stated at cost less accumulated amortisation and net of impairments, if any. An intangible asset is
recognised if it is probable that the expected future economic benefits that are attributable to the asset will flow to the Company and its cost can be measured reliably. Intangible assets having finite useful lives are amortised on a straight-line basis over their estimated useful lives.
(f) Depreciation and Amortisation (i) Capital assets whose ownership does not vest with the Company are depreciated over their estimated useful life or five
years, whichever is less. (ii) In respect of other assets, depreciation is provided on a straight line basis applying the rates specified in Schedule XIv to
the Companies Act, 1956 or rates based on estimated useful life whichever is higher. However, asset value upto ` 25,000 is fully depreciated in the year of acquisition. The details of estimated life for each category of asset are as under:
(a) Buildings and Roads — 30 to 62 years (b) Plant and Machinery — 3 to 30 years (c) Railway Sidings — 21 years (d) vehicles and Aircraft — 5 to 18 years
Notes to BalaNce sheet aNd statemeNt of Profit aNd loss
147
(e) Furniture, Fixtures and Office Equipments — 5 years (f) Intangibles (Computer Softwares) — 5 to 10 years (g) Development of property for development of mines and collieries are depreciated over the useful life of the mine or
lease period whichever is less, subject to maximum of 10 years. (h) Blast Furnace relining is depreciated over a period of 10 years (average expected life). (i) Freehold land is not depreciated. (j) Leasehold land and other leasehold assets are amortised over the life of the lease.(g) impairment Fixed assets are reviewed for impairment whenever events or changes in circumstances indicate that their carrying amount
may not be recoverable. An impairment loss is recognised in the Statement of Profit and Loss if the carrying amount of an asset exceeds its recoverable
amount.(h) Foreign Currency Transactions Foreign Currency Transactions (FCT) and forward exchange contracts entered into to hedge FCT are initially recognised
at the spot rate on the date of the transaction/contract. Monetary assets and liabilities denominated in foreign currency and forward exchange contracts remaining unsettled at the end of the year are translated at year end rates.
The Company has elected to account for exchange differences arising on reporting of long-term foreign currency monetary items in accordance with Companies (Accounting Standards) Amendment Rules, 2009 pertaining to Accounting Standard 11 (AS-11) notified by Government of India on 31st March, 2009 (as amended on 29th December, 2011). Accordingly, the effect of exchange differences on foreign currency loans of the Company is accounted by addition or deduction to the cost of the assets so far it relates to depreciable capital assets and in other cases by transfer to "Foreign Currency Monetary Item Translation Difference Account" to be amortised over the balance period of the long-term monetary items.
The differences in translation and settlement of FCT and forward exchange contracts used to hedge FCT (excluding the long-term foreign currency monetary items accounted in line with Companies (Accounting Standards) Amendment Rules 2009 on Accounting Standard 11 notified by Government of India on 31st March, 2009 as amended on 29th December, 2011) are recognised in the Statement of Profit and Loss. The outstanding derivative contracts at the balance sheet date other than forward exchange contracts used to hedge FCT are valued by marking them to market and losses, if any, are recognised in the Statement of Profit and Loss.
Exchange differences relating to monetary items that are in substance forming part of the Company’s net investment in non integral foreign operations are accumulated in Foreign Exchange Fluctuation Reserve Account.
(i) investments Long-term investments are carried at cost less provision for diminution other than temporary, if any, in value of such investments.
Current investments are carried at lower of cost and fair value. (j) inventories Finished and semi-finished products produced and purchased by the Company are carried at lower of cost and net realisable
value. Work-in-progress is carried at lower of cost and net realisable value. Coal, iron ore and other raw materials produced and purchased by the Company are carried at lower of cost and net realisable
value. Stores and spare parts are carried at cost. Necessary provision is made and charged to revenue in case of identified obsolete
and non-moving items. Cost of inventories is generally ascertained on the ‘weighted average’ basis. Work-in-progress and finished and semi-finished
products are valued on full absorption cost basis.(k) Relining Expenses Relining expenses other than expenses on blast furnace relining are charged as an expense in the Statement of Profit and Loss
in the year in which they are incurred.(l) Research and Development Research and Development costs (other than cost of fixed assets acquired) are charged as an expense in the Statement of
Profit and Loss in the year in which they are incurred.(m) Deferred Tax Deferred Tax is accounted for by computing the tax effect of timing differences which arise during the year and reverse in
subsequent periods.
Notes to BalaNce sheet aNd statemeNt of Profit aNd loss
Hundred and fifth annual report 2011-12
148
2. ShARE CAPiTAL(Item No. 1(a), Page 142)
As at 31.03.2011 ` crores ` crores Authorised: 1,75,00,00,000 Ordinary Shares of ` 10 each 1,750.00 1,750.00 (31.03.2011: 1,75,00,00,000 Ordinary Shares of ` 10 each) 35,00,00,000 "A" Ordinary Shares of ` 10 each 350.00 350.00 (31.03.2011: 35,00,00,000 "A" Ordinary Shares of ` 10 each) 2,50,00,000 Cumulative Redeemable Preference Shares of ` 100 each 250.00 250.00 (31.03.2011: 2,50,00,000 Shares of ` 100 each) 60,00,00,000 Cumulative Convertible Preference Shares of ` 100 each 6,000.00 6,000.00 (31.03.2011: 60,00,00,000 Shares of ` 100 each) 8,350.00 8,350.00 issued: 97,21,26,020 Ordinary Shares of ` 10 each 972.13 960.13 (31.03.2011: 96,01,26,020 Ordinary Shares of ` 10 each) Subscribed and Paid up: 97,12,14,450 Ordinary Shares of ` 10 each fully paid up 971.21 959.21 (31.03.2011: 95,92,14,450 Ordinary Shares of ` 10 each) Add: Amount paid up on 3,89,516 Ordinary Shares forfeited 0.20 0.20 (31.03.2011: 3,89,516 Ordinary Shares of ` 10 each) 971.41 959.41 Additional information:(1) The movement in subscribed and paid up share capital is set out below:
As at 31.03.2011 ordinary Shares of ` 10 each No. of shares ` crores No. of shares ` crores At beginning of the year 95,92,14,450 959.21 88,72,14,196 887.21 Shares allotted during the year 1,20,00,000(a) 12.00 7,20,00,254(b) 72.00
97,12,14,450 971.21 95,92,14,450 959.21
(a) 1,20,00,000 Ordinary Shares of face value of ` 10 per share were allotted on 20th January, 2012 to Tata Sons Limited on preferential basis on conversion of warrants at a price of ` 594 per share.
(b) (i) 1,50,00,000 Ordinary Shares of face value ` 10 per share were allotted on 23rd July, 2010 to Tata Sons Limited on preferential basis at price of ` 594 per share.
149
(ii) 5,70,00,000 Ordinary Shares of face value of ` 10 per share were allotted on 29th January, 2011 in the Follow-on Public Offer vide prospectus dated 25th January, 2011 at a price of ` 610 per share. The proceeds of the issue have been utilised as under:
Actual
Object of the issue As at 31.03.2011 ` crores ` crores ` crores
Gross Proceeds of the issue 3,477.00 3,477.00 utilisation of funds Part finance the capital expenditure for expansion of the Company's existing works at Jamshedpur 1,875.00 1,875.00 – Payment of redemption amounts on maturity of certain redeemable non-convertible debentures issued by the Company on a private placement basis 1,090.00 1,090.00 – General corporate purposes 390.30 – – Issue related expenses 121.70 102.26 57.12 3,477.00 3,067.26 57.12 Unutilised amount represented by: Investments in Mutual Funds 409.74 1,014.27 Deposits with banks – 2,400.00 Bank balance – 5.61 3,477.00 3,477.00
(iii) 146 Ordinary Shares of face value of ` 10 per share allotted on 3rd March, 2011 at a premium of ` 290 per share to shareholders whose shares were kept in abeyance in the Rights issue made in 2007.
(iv) 108 Ordinary Shares of face value of ` 10 per share allotted on 3rd March, 2011 at a premium of ` 590 per share to holders of CCPS in the ratio of 6:1 on conversion whose shares were kept in abeyance in the Rights issue made in 2007.
(c) The balance Ordinary Shares kept in abeyance are 3,07,807 (31.03.2011: 3,07,807) in respect of rights issue of 2007.
(2) Shareholders holding more than 5 percent shares in the Company:
As at 31.03.2011 No. of No. of Name of shareholders ordinary Shares % Ordinary Shares %
(a) Tata Sons Limited 28,88,98,245 29.75 27,34,22,790 28.51 (b) Life Insurance Corporation of India Limited 14,57,09,733 15.00 13,06,13,514 13.62
(3) Particulars of securities convertible into Ordinary Shares: (a) In November 2009, the Company had issued 5,469.35 numbers of 4.5% Foreign Currency Covertible Bonds (FCCBs)
aggregating to uSD 546.935 million. These represent 4,21,12,300 (31.03.2011: 4,19,60,304) underlying shares and are convertible at any time on or after 31st December, 2009 and upto 11th November, 2014 by the holders of such FCCBs at a conversion price of ` 602.1022 per share (31.03.2011: ` 604.2832 per share) and at a fixed uSD/INR conversion rate of 46.36.
(b) In September 2007, the Company had issued 3,820 numbers of 1% Convertible Alternative Reference Securities (CARS) aggregating to uSD 382 million. These represent 2,10,47,371 (31.03.2011: 2,10,15,711) underlying shares and are convertible at any time on or after 4th September, 2011 and upto 3.00 p.m. on 6th August, 2012 at the option of the holders at a conversion price of ` 730.5188 per share (31.03.2011: ` 731.6193 per share) and at a fixed uSD/INR conversion rate of 40.25.
Changes to premium payable on account of exchange fluctuation is transferred to "Foreign Currency Monetary Item Translation Difference Account" in accordance with Companies (Accounting Standards) Amendment Rules 2009 pertaining to Accounting Standard 11 (AS-11) notified by the Government of India on 31st March, 2009 (as amended on 29th December, 2011). Such exchange fluctuation on the premium payable is amotised over the balance period
Hundred and fifth annual report 2011-12
150
of CARS, by adjusting the same to securities premium reserve. Accordingly, an amount of ` 25.22 crores (net of deferred tax ` 12.11 crores) [2010-11: ` 2.07 crores (net of deferred tax ` 3.57 crores)] has been adjusted against securities premium reserve on account of amortisation.
(4) (a) 3,867 Shares (31.03.2011: 3,867) of face value of ` 10 per share represent the shares underlying GDRs which were issued during 1994. Each GDR represents one underlying Ordinary Share.
(b) 1,80,87,222 Shares (31.03.2011: 2,39,13,921) of face value of ` 10 per share represent the shares underlying GDRs which were issued during 2010. Each GDR represents one underlying Ordinary Share.
(5) The rights, powers and preferences relating to each class of share capital and the qualifications, limitations and restrictions thereof are contained in the Memorandum and Articles of Association of the Company. The principle rights are as follows:
A. ordinary Shares of ` 10 each The Company has only one class of share capital namely Ordinary Shares having a face value of ` 10 per share. (a) In respect of every Ordinary Share (whether fully paid or partly paid), voting right shall be in the same proportion
as the capital paid up on such Ordinary Share bears to the total paid up ordinary capital of the Company. (b) The dividend proposed by the Board of Directors is subject to the approval of the shareholders in the ensuing
Annual General Meeting, except in case of interim dividend. (c) In the event of liquidation, the shareholders of Ordinary Shares are eligible to receive the remaining assets of the
Company after distribution of all preferential amounts, in proportion to their shareholdings. b. 'A' ordinary Shares of ` 10 each (a) (i) The holders of ‘A’ Ordinary Shares shall be entitled to such rights of voting and/or dividend and such other
rights as per the terms of the issue of such shares, provided always that: − in the case where a resolution is put to vote on a poll, such differential voting entitlement (excluding
fractions, if any) will be applicable to holders of ‘A’ Ordinary Shares. − in the case where a resolution is put to vote in the meeting and is to be decided on a show of hands, the
holders of ‘A’ Ordinary Shares shall be entitled to the same number of votes as available to holders of Ordinary Shares.
(ii) The holders of Ordinary Shares and the holders of ‘A’ Ordinary Shares shall vote as a single class with respect to all matters submitted for voting by shareholders of the Company and shall exercise such votes in proportion to the voting rights attached to such Shares including in relation to any scheme under Sections 391 to 394 of the Act.
(b) The holders of ‘A’ Ordinary Shares shall be entitled to dividend on each ‘A’ Ordinary Share which may be equal to or higher than the amount per Ordinary Share declared by the Board for each Ordinary Share, and as may be specified at the time of the issue. Different series of ‘A’ Ordinary Shares may carry different entitlements to dividend to the extent permitted under applicable law and as prescribed under the terms applicable to such issue.
C. Preference Shares The Company has two classes of preference shares i.e. Cumulative Redeemable Preference Shares (CRPS) of ̀ 100 per
share and Cumulative Convertible Preference Shares (CCPS) of ` 100 per share. (a) Such Shares shall confer on the holders thereof, the right to a fixed preferential dividend from the date of allotment,
at a rate as may be determined by the Board at the time of the issue, on the capital for the time being paid up or credited as paid up thereon.
(b) Such Shares shall rank for capital and dividend (including all dividend undeclared upto the commencement of winding up) and for repayment of capital in a winding up, pari passu inter se and in priority to the Ordinary Shares of the Company, but shall not confer any further or other right to participate either in profits or assets. However, in case of CCPS, such preferential rights shall automatically cease on conversion of these shares into Ordinary Shares.
(c) The holders of such Shares shall have the right to receive all notices of general meetings of the Company but shall not confer on the holders thereof the right to vote at any meetings of the Company save to the extent and in the manner provided in the Companies Act, 1956, or any re-enactment thereof.
(d) CCPS shall be converted into Ordinary Shares as per the terms, determined by the Board at the time of issue; as and when converted, such Ordinary Shares shall rank pari pasu with the then existing Ordinary Shares of the Company in all respects.
151
3. RESERvES AND SuRPLuS(Item No. 1(b), Page 142) As at 31.03.2011 ` crores ` crores(a) Capital Reserve Balance as per last account 1.49 1.49 (b) Capital Redemption Reserve Balance as per last account 0.83 0.83(c) Securities Premium Reserve Balance as per last account 18,211.72 14,032.80 Amount received on conversion of CCPS – 0.01 Amount received on follow on public issue of equity shares – 3,420.00 Amount received on preferential issue of equity shares – 876.00 Amount received on conversion of Warrants 700.80 – Expenses related to CARS/NCD/GDR/Hybrid Securities/ preferential and public issue of equity shares (9.39) (115.02) Exchange difference on redemption premium of CARS (25.22) (2.07) 18,877.91 18,211.72 (d) Debenture Redemption Reserve Balance as per last account 2,046.00 1,046.00 Amount transferred from Statement of Profit and Loss – 1,000.00 2,046.00 2,046.00 (e) Amalgamation Reserve Balance as per last account 0.43 0.43 (f) Export Profits Reserve Balance as per last account 1.25 1.25 (g) Foreign Exchange Fluctuation Reserve Balance as per last account 14.00 14.00 (h) Contributions for Capital Expenditure Balance as per last account 44.74 44.41 Received during the year 1.52 0.33 46.26 44.74 (i) Contingency Reserve Balance as per last account 100.00 100.00 (j) Debenture Forfeiture Reserve Balance as per last account 0.04 0.04 (k) General Reserve Balance as per last account 8,747.06 8,060.49 Amount transferred from Statement of Profit and Loss 669.64 686.57 9,416.70 8,747.06 (l) Surplus in the Statement of Profit and Loss Balance as per last account 16,639.46 12,772.65 Balance of Centennial Steel Company Limited on amalgamation (Note 38, Page 173) (0.87) – Profit for the year 6,696.42 6,865.69 Distribution on Hybrid Perpetual Securities [net of tax of ` 83.24 crores (2010-11: ` 2.25 crores)] (173.30) (4.54) Proposed dividend (Note 46, Page 187) (1,165.46) (1,151.06) Tax on dividend (181.57) (156.71) Transfer to General Reserve (669.64) (686.57) Transfer to Debenture Redemption Reserve – (1,000.00) 21,145.04 16,639.46 51,649.95 45,807.02
Hundred and fifth annual report 2011-12
152
4. hybRiD PERPETuAL SECuRiTiES(Item No. 2, Page 142) As at 31.03.2011 ` crores ` crores Hybrid Perpetual Securities 2,275.00 1,500.00 2,275.00 1,500.00Additional information:(1) The Company has issued Hybrid Perpetual Securities of ` 775 crores and ` 1,500 crores in May 2011 and March 2011
respectively. These securities are perpetual in nature with no maturity or redemption and are callable only at the option of the Company. The distribution on the securities, which may be deferred at the option of the Company if in the six months preceding the relevant distribution payment date, the Company has not made payment on, or repurchased or redeemed, any securities ranking pari pasu with, or junior to the instrument, are 11.50% p.a. and 11.80% p.a. respectively, with a step up provision if the securities are not called after 10 years. As these securities are perpetual in nature and the Company does not have any redemption obligation, these are not classified as ‘debt’.
5. BORROWIngS(Item No. 3(a) and 4(a), Page 142) As at 31.03.2011 ` crores ` crores Long Short Long Short Term Term Total Term Term Total A. Secured borrowings (a) Term loans (i) From financial institutions and others (1)(a) 1,915.47 – 1,915.47 1,860.05 – 1,860.05 (b) Repayable on demand (i) From banks (1)(b) – – – – 149.13 149.13 1,915.47 – 1,915.47 1,860.05 149.13 2,009.18 b. unsecured borrowings (a) Bonds/Debentures (2)(a)
(i) Non-convertible debentures 7,328.40 – 7,328.40 7,094.62 – 7,094.62 (ii) 1% Convertible Alternative Reference Securities – – – 2,101.16 – 2,101.16 (iii) 4.5% Foreign Currency Convertible Bonds 2,782.81 – 2,782.81 2,439.06 – 2,439.06 (b) Term loans (i) From banks (2)(b) 8,473.72 – 8,473.72 10,151.36 – 10,151.36 (ii) From financial institutions and others (2)(c) 849.00 – 849.00 849.00 – 849.00 (c) Deferred payment liabilities (2)(d) 3.80 – 3.80 3.80 – 3.80 (d) Other loans – 65.62 65.62 – – – 19,437.73 65.62 19,503.35 22,639.00 – 22,639.00 21,353.20 65.62 21,418.82 24,499.05 149.13 24,648.18Additional information:(1) Details of outstanding secured borrowings are as follows: (a) Represents loan from Joint Plant Committee – Steel Development Fund which includes funded interest ` 316.13 crores
(31.03.2011: ` 280.06 crores). It is repayable in 16 equal semi-annual installments after completion of 4 years from the date of receipt of the last tranche.
It is secured by mortgages, ranking pari passu inter se, on all present and future fixed assets, excluding land and buildings mortgaged in favour of Government of India for constructing a hostel for trainees at Jamshedpur and setting up a dispensary and a clinic at collieries, land and buildings, plant and machinery and movables of the Tubes division and the Bearings division mortgaged in favour of the financial institutions and banks, assets of the Ferro Alloys Plant at Bamnipal mortgaged
153
in favour of State Bank of India and assets of Cold Rolling Complex (West) at Tarapur and a floating charge on other properties and assets (excluding investments) of the Company, subject to the prior floating charge in favour of banks under item A (b).
The Company has filed a writ petition before the High Court at Kolkata in February 2006 claiming waiver of the outstanding loan and interest and refund of the balance lying with Steel Development Fund and the matter is sub-judice.
Loan from the Joint Plant Committee-Steel Development Fund includes ` 1,411.84 crores (31.03.2011: ` 1,317.49 crores) representing repayments and interest on earlier loans for which applications of funding are awaiting sanction is not secured by charge on movable assets of the Company.
(b) Loan from banks repayable on demand are secured by hypothecation of stocks, stores and book debts, ranking in priority to the floating charge under item A (a).
(2) Terms of repayment of outstanding unsecured borrowings are as follows: (a) Bonds/Debentures (i) 10.25% p.a. interest bearing 25,000 debentures of face value ` 10,00,000 each are redeemable at par in 3 equal
annual installments commencing from 6th January, 2029. (ii) 10.25% p.a. interest bearing 5,000 debentures of face value ` 10,00,000 each are redeemable at par in 3 equal
annual installments commencing from 22nd November, 2028. (iii) 11.00% p.a. interest bearing 15,000 debentures of face value ` 10,00,000 each are redeemable at par on 19th May,
2019. (iv) 10.40% p.a. interest bearing 6,509 debentures of face value ` 10,00,000 each are redeemable at par on 15th May,
2019. (v) 10.20% p.a. interest bearing 6,200 debentures of face value ` 10,00,000 each are redeemable on 7th May, 2015. (vi) 12.50% p.a. interest bearing 12,500 debentures of face value ` 10,00,000 each are redeemable in 3 equal annual
installments commencing from 19th November, 2014. (b) Term loans from banks (i) GBP 100 million equivalent to ` 815.05 crores (31.03.2011: GBP 100 million equivalent to ` 717.02 crores) loan is
repayable on 4th April, 2015. (ii) uSD 335 million equivalent to ` 1,704.48 crores (31.03.2011: USD 335 million equivalent to ` 1,493.93 crores) loan
is repayable on 10th June, 2015. (iii) Euro 5.82 million equivalent to ` 39.52 crores (31.03.2011: Euro 6.30 million equivalent to ` 43.02 crores) loan is
repayable in 12 equal semi-annual installments; the next installment is due on 2nd May, 2012. (iv) Euro 32.85 million equivalent to ` 223.11 crores (31.03.2011: Euro 35.20 million equivalent to ` 237.92 crores) loan
is repayable in 14 equal semi-annual installments; the next installment is due on 2nd July, 2012. (v) Euro 54.04 million equivalent to ` 367.03 crores (31.03.2011: Euro 10.58 million equivalent to ` 67.08 crores) loan
is repayable in 20 equal semi-annual installments commencing from 6th July, 2012. (vi) Euro 183.01 million equivalent to ` 1,243.03 crores (31.03.2011: Euro Nil million equivalent to ` Nil crores) loan is
repayable in 20 equal semi-annual installments commencing from 31st October, 2012. (vii) JPY 71,598 million equivalent to ` 4,437.64 crores (31.03.2011: JPY 89,497.50 million equivalent to ` 4,819.44
crores) syndicated loan is repayable in 4 equal semi-annual installments; the next installment is due on 11th April, 2012.
(viii) Indian rupee loan amounting ` 1,500.00 crores (31.03.2011: ` 2,500.00 crores) is repayable on 28th July, 2013. (ix) Indian rupee loan amounting ` 500.00 crores (31.03.2011: ` Nil) is repayable in 9 semi-annual installments
commencing from 30th April, 2013. (c) Term loans from financial institutions and others (i) Indian rupee loan amounting ` 650.00 crores (31.03.2011: ` 650.00 crores) is repayable on 16th June, 2019. (ii) Indian rupee loan amounting ` 199.00 crores (31.03.2011: ` 199.00 crores) is repayable on 30th June, 2016. (d) Deferred payment liabilities amounting ` 3.80 crores (31.03.2011: ` 3.80 crores) is payable in 10 annual installments
(first 5 installments are of ` 0.09 crores each and next 5 installments are of ` 0.67 crores each) commencing from 29th December, 2014.
Hundred and fifth annual report 2011-12
154
6. DEFERRED TAx LiAbiLiTiES (NET)(Item No. 3(b), Page 142) Deferred tax Current year Deferred tax (asset)/liability charge/ (asset)/liability as at (credit) as at 01.04.2011 31.03.2012 ` crores ` crores ` crores Deferred Tax Liabilities (a) Differences in depreciation and amortisation for accounting and income tax purposes 1,955.71 (45.66) 1,910.05 (b) Prepaid expenses 106.16 (28.43) 77.73 2,061.87 (74.09) 1,987.78 Deferred Tax Assets (a) Employee separation compensation (441.82) 44.95 (396.87) (b) Wage provision (124.59) 124.59 – (c) Provision for doubtful debts and advances (31.80) 1.76 (30.04) (d) Disallowance under Section 43B of IT Act (161.27) (20.80) (182.07) (e) Provision for leave salary (136.84) (20.16) (157.00) (f) Provision for employee benefits (67.31) – (67.31) (g) Loan prepayment charges – (4.88) (4.88) (h) Others (32.43) (5.55) (37.98) (996.06) 119.91 (876.15) 1,065.81 45.82 1,111.63
Net amount charged to Statement of Profit and Loss 45.82 (Item 6(b), Page 143) Deferred tax asset on the redemption premium on CARS adjusted against securities premium reserve (129.01) (12.11) (141.12)
Deferred tax liabilities (net) 936.80 970.51
7. oThER LoNG-TERM LiAbiLiTiES(Item No. 3(c), Page 142) As at 31.03.2011 ` crores ` crores
(a) Creditors for capital supplies/services 210.11 373.88 (b) Others 5.94 – 216.05 373.88
155
8. PRoviSioNS(Item No. 3(d) and 4(d), Page 142) As at 31.03.2011 ` crores ` crores Long Short Long Short Term Term Total Term Term Total (a) Provision for employee benefits (1) 1,254.40 76.58 1,330.98 1,509.68 92.07 1,601.75 (b) Provision for employee separation compensation (2) 596.90 167.83 764.73 691.79 181.55 873.34 (c) Provision for taxation – 651.64 651.64 – 791.29 791.29 (d) Provision for fringe benefit tax – 4.73 4.73 – 3.88 3.88 (e) Proposed dividend – 1,165.46 1,165.46 – 1,151.06 1,151.06 1,851.30 2,066.24 3,917.54 2,201.47 2,219.85 4,421.32
Additional information: (1) Includes provision for leave salaries ` 495.00 crores (31.03.2011: ` 464.72 crores). (2) Provision for employee separation compensation has been calculated on the basis of net present value of
the future monthly payments of pension and lump sum benefits under the scheme including ` 18.23 crores (2010-11: ` 27.53 crores) in respect of schemes introduced during the year.
9. TRADE PAyAbLES(Item No. 4(b), Page 142) As at 31.03.2011 ` crores ` crores
(a) Creditors for supplies/services 5,111.07 3,920.21 (b) Creditors for accrued wages and salaries 862.16 544.60 5,973.23 4,464.81
10. oThER CuRRENT LiAbiLiTiES(Item No. 4(c), Page 142) As at 31.03.2011 ` crores ` crores
(a) Current maturities of long-term borrowings 4,753.43 3,652.94 (b) Interest accrued but not due on borrowings 683.49 679.31 (c) unpaid dividend 45.81 41.26 (d) Application money received due for refund and interest accrued thereon 0.17 0.61 (e) unpaid matured deposits and interest accrued thereon 0.33 0.67 (f) Advances received from customers 333.47 293.90 (g) Creditors for other liabilities (1) 2,981.85 1,593.41 8,798.55 6,262.10 Additional information: (1) Includes liability for employee family benefit scheme ` 76.54 crores (31.03.2011: ` 64.62 crores)
Tangible Assets Freehold Land Leasehold Freehold Leasehold Plant and Furniture Office Railway and Roads Land Buildings(3) Buildings Machinery and Fixtures Equipments vehicles Sidings Total
Gross Block as at 01.04.2011 440.02 191.65 1,175.11 0.90 19,900.69 36.13 96.72 193.75 190.34 22,225.31 345.07 189.95 1,168.03 0.90 19,725.07 34.46 87.13 136.13 169.70 21,856.44 Additions during the year (1) 28.10 – 89.88 – 520.81 3.31 19.93 11.09 12.98 686.10 94.95 1.70 8.01 – 468.33 2.53 10.80 63.22 20.64 670.18 Deductions during the year (2) 0.33 – 2.91 – 69.64 0.68 3.47 9.46 – 86.49 – – 0.93 – 293.77 0.86 1.21 5.60 – 302.37 Exchange fluctuations capitalised during the year – – – – 32.76 – – – – 32.76 – – – – 1.06 – – – – 1.06
Total accumulated depreciation and 161.78 13.27 415.04 0.72 10,813.36 36.30 86.28 93.58 94.99 11,715.32 impairment as at 31.03.2012 150.52 11.09 381.13 0.69 9,862.82 33.22 79.49 87.61 86.16 10,692.73
Net book value as at 31.03.2012 306.01 178.38 847.04 0.18 9,571.26 2.46 26.90 101.80 108.33 11,142.36 289.50 180.56 793.98 0.21 10,037.87 2.91 17.23 106.14 104.18 11,532.58
Additional information:(1) Additions and depreciation on assets written off during the year include adjustments for inter se transfers.(2) Deductions include cost of assets scrapped/surrendered during the year.(3) Freehold Buildings include ` 2.32 crores (31.03.2011: ` 2.32 crores) being cost of shares in Co-operative Housing Societies
and Limited Companies.(4) Rupee liability has increased by ` 32.76 crores (net) (2010-11: ` 1.06 crores) arising out of realignment of the value of foreign
currency loans for procurement of fixed assets. This increase has been adjusted in the carrying cost of respective fixed assets and has been depreciated over their remaining depreciable life. The depreciation for the current year has increased by ` 2.04 crores (2010-11: ` 0.06 crores) arising on account of this adjustment.
Intangible Assets Software Development Costs of property(3) Total
Gross Block as at 01.04.2011 80.09 540.86 620.95 79.05 370.58 449.63 Additions during the year (1) 1.47 5.57 7.04 1.24 170.28 171.52 Deductions during the year (2) 0.04 – 0.04 0.20 – 0.20
Gross Block as at 31.03.2012 81.52 546.43 627.95 80.09 540.86 620.95
Accumulated amortisation as at 01.04.2011 64.46 283.97 348.43 57.35 233.94 291.29 Amortisation during the year 6.61 49.00 55.61 7.31 50.03 57.34 Amortisation on assets written off during the year (1) (0.01) – (0.01) 0.20 – 0.20
Accumulated amortisation as at 31.03.2012 71.08 332.97 404.05 64.46 283.97 348.43
Net book value as at 31.03.2012 10.44 213.46 223.90 15.63 256.89 272.52
(5) Tangible assets schedule includes the capital cost of in-house research recognised facility as under: ` crores
Tangible Assets Freehold Land Leasehold Freehold Leasehold Plant and Furniture Office Railway and Roads Land Buildings Buildings Machinery and fixtures Equipments vehicles Sidings Total
Gross Block as at 01.04.2011 – – 0.02 – 38.29 1.83 – 0.03 – 40.17 – – 0.02 – 38.10 1.68 – 0.03 – 39.83Additions during the year – – – – 4.18 0.06 0.07 – – 4.31 – – – – 0.22 0.16 – – – 0.38Deductions during the year – – – – 0.10 0.02 – – – 0.12 – – – – 0.03 0.01 – – – 0.04
Additional information:(1) Additions and amortisation on assets written off during the year include adjustments for inter se transfers.(2) Deductions include cost of assets scrapped/surrendered during the year.(3) Development of property represents expenditure incurred on development of mines/collieries.
Hundred and fifth annual report 2011-12
158
13. NoN-CuRRENT iNvESTMENTS(Item No. 5(b), Page 142) No. of equity As at shares of 31.03.2011 face value of ` crores ` crores ` 10 each fully paid-up unless otherwise specified Trade investments (i) investments in Equity instruments (a) Investments in Subsidiary Companies (i) quoted (1) Indian Steel & Wire Products Ltd.* 54,74,030 – – (2) Tata Metaliks Ltd. 1,17,99,992 11.80 11.80 (3) Tayo Rolls Limited 55,87,372 48.57 48.57 (4) The Tinplate Company of India Ltd. 6,22,19,222 301.09 – (Became subsidiary during the year) (1,72,46,968 fully convertible debentures converted to 3,13,58,123 equity shares) 361.46 60.37
(ii) unquoted (1) Adityapur Toll Bridge Company Limited 1,50,00,000 14.44 14.44 (2) Centennial Steel Company Limited (merged with the Company) – – 0.05 (3) Gopalpur Special Economic Zone Limited 10,00,000 1.00 1.00 (4) Jamshedpur Continous Annealing & Processing Co. Private Limited (50,000 shares subscribed during the year) 50,000 0.05 – (5) Jamshedpur utilities & Services Company Limited 2,03,50,000 20.35 20.35 (6) Kalimati Investment Company Ltd. 1,63,87,469 86.68 86.68 (7) Lanka Special Steel Ltd. (Face value of LKR 10 each) 25,00,000 1.16 1.16 (8) NatSteel Asia Pte Ltd. (Face value of SGD 1 each) 28,14,37,128 773.86 768.41 (14,37,128 shares subscribed during the year) (9) Sila Eastern Ltd. (Face value of THB 100 each) 9,800 0.10 0.10 (10) T M International Logistics Limited 91,80,000 9.18 9.18 (11) T M Mining Company Limited 74,000 0.07 0.03 (37,000 shares subscribed during the year) (12) Tata Incorporated N.Y (Face value of uSD 1,000 each) 1,500 1.64 1.64 (13) Tata Korf Engineering Services Ltd.* 2,40,386 – – (14) Tata Steel (KZN) (Pty) Ltd. (Face value of ZAR 1 each) 12,96,00,000 84.70 84.70 (15) Tata Steel Holdings Pte Ltd. (Face value of GBP 1 each) 5,65,90,52,090 45,588.50 40,205.94 (74,74,19,492 shares subscribed during the year) (16) Tata Steel Processing and Distribution Limited 6,82,50,000 274.45 274.45 (17) The Tata Pigments Limited (Face value of ` 100 each) 75,000 0.70 0.70 (18) TRL Krosaki Refractories Limited (Became an associate during the year) – – 90.97 (1,06,59,000 shares sold during the year) (19) TS Alloys Ltd. 4,33,09,271 56.24 56.24 46,913.12 41,616.04
47,274.58 41,676.41
Carried forward 47,274.58 41,676.41
159
(b) Investments in Joint Ventures (i) unquoted (1) Bhubaneshwar Power Pvt. Ltd. 56,90,800 5.69 5.69 (2) Himalaya Steel Mill Services Private Limited 36,19,945 3.61 – (36,16,431 shares subscribed during the year) (3) mjunction services limited 40,00,000 4.00 4.00 (4) S & T Mining Company Private Ltd. 59,46,400 5.95 3.13 (28,21,400 shares subscribed during the year) (5) Tata BlueScope Steel Limited 32,80,00,000 328.00 328.00 (6) Tata NYK Shipping Pte Ltd. (Face value of uSD 1 each) 2,85,00,000 127.28 119.56 (15,00,000 shares subscribed during the year) (7) The Dhamra Port Company Limited 32,40,00,000 324.00 324.00 798.53 784.38 (c) investments in Associate Companies (i) quoted (1) Indian Steel Rolling Mills Ltd.* 3,30,115 – – (2) Kumardhubi Fireclay and Silica Works Ltd.* 1,50,001 – – (3) Tata Construction and Projects Ltd.* 5,61,335 – – (4) Tata Sponge Iron Limited 61,19,960 7.20 7.20 (5) The Tinplate Company of India Ltd. (Became subsidiary during the year) – – 128.61 (6) TRF Limited 35,85,428 4.38 4.38 11.58 140.19 (ii) unquoted (1) Industrial Energy Ltd. 8,65,80,000 86.58 86.58 (2) Jamipol Limited 31,75,000 3.18 3.18 (3) Kalinga Aquatics Ltd.* 10,49,920 – – (4) Kumardhubi Metal Casting and Engineering Ltd.* 10,70,000 – – (5) Nicco Jubliee Park Limited * 3,40,000 – – (6) Strategic Energy Technology Systems Pvt. Ltd. 2,21,59,000 22.16 16.96 (52,02,000 shares subscribed during the year) (7) TRL Krosaki Refractories Limited (Became an associate during the year) 42,39,360 25.88 – (1,06,59,000 shares sold during the year) 137.80 106.72 149.38 246.91
13. NoN-CuRRENT iNvESTMENTS (continued)(Item No. 5(b), Page 142) No. of equity As at shares of 31.03.2011 face value of ` crores ` crores ` 10 each fully paid-up unless otherwise specified
Brought forward 47,274.58 41,676.41
Carried forward 48,222.49 42,707.70
Hundred and fifth annual report 2011-12
160
(d) investments in others (i) quoted (1) Housing Development Finance Corporation Ltd. (Face value of ` 2 each) 7,900 0.01 0.01 (2) Tata Motors Ltd. (Face value of ` 2 each) 14,78,10,695 261.43 261.43 (3) The Tata Power Company Ltd. (Face value of ` 1 each) 1,73,18,180 30.48 30.48 (4) Others ` 40,275 (31.03.2011: ` 40,275) (3) 0.01 0.01 291.93 291.93 (ii) unquoted (1) IFCI venture Capital Funds Ltd. 1,00,000 0.10 0.10 (2) Panatone Finvest Ltd. 45,000 0.05 0.05 (3) Steelscape Consultancy Pvt. Ltd. 50,000 0.05 0.05 (4) Tarapur Environment Protection Society 30,424 0.31 0.16 (14,698 shares subscribed during the year) (5) Tata Industries Ltd. (Face value of ` 100 each) 84,42,582 149.62 149.62 (6) Tata International Ltd. (Face value of ` 1,000 each) 9,480 6.23 0.49 (5,740 shares subscribed during the year) (7) Tata Projects Ltd. (Face value of ` 100 each) 90,000 0.18 0.18 (8) Tata Services Ltd. (Face value of ` 1,000 each) 1,621 0.16 0.16 (9) Tata Teleservices Ltd. 6,31,53,638 134.06 134.06 (10) Others ` 32,496 (31.03.2011: ` 32,495) (4) – – 290.76 284.87 582.69 576.80 48,805.18 43,284.50 (ii) investments in Preference Shares(a) Investments in Subsidiary Companies (i) unquoted (1) Tata Metaliks Ltd. 1,00,00,000 100.00 – 8.50% non-cumulative redeemable preference shares (Face value of ` 100 each) (1,00,00,000 shares subscribed during the year) (2) Tayo Rolls Limited 65,00,000 65.00 – 8.50% non-cumulative redeemable preference shares (Face value of ` 100 each) (65,00,000 shares subscribed during the year) (3) The Tinplate Company of India Ltd.# 1,09,90,000 108.17 – 8.50% optionally convertible redeemable non-cumulative preference shares (Face value of ` 100 each) (Became subsidiary during the year) 273.17 –(b) Investments in Associates Companies (i) unquoted (1) The Tinplate Company of India Ltd.# – – 108.17 8.50% optionally convertible redeemable non-cumulative preference shares (Face value of ` 100 each) (Became subsidiary during the year) 273.17 108.17
13. NoN-CuRRENT iNvESTMENTS (continued)(Item No. 5(b), Page 142) No. of equity As at shares of 31.03.2011 face value of ` crores ` crores ` 10 each fully paid-up unless otherwise specifiedBrought forward 48,222.49 42,707.70
Carried forward 49,078.35 43,392.67
161
(III) Investments in Debentures/Bonds (a) Investments in Subsidiary Companies (i) quoted (1) The Tinplate Company of India Ltd. – – 172.48 Fully Convertible Debentures (Converted to equity shares) (b) Investments in Associate Companies (i) unquoted (1) Tata Construction and Projects Ltd.* 10% Convertible debentures of ` 100 each 43,000 – – – 172.48 49,078.35 43,565.15* These investments are carried at a book value of ` 1.00# includes ` 0.03 crore incurred towards stamp duty.Additional information: No. of equity As at shares of 31.03.2011 face value of ` crores ` crores ` 10 each fully paid-up unless otherwise specified
(1) Carrying value of Quoted Investments 664.97 664.97 Market value as at 31st March, 2012 ` 4,911.43 crores (31.03.2011: ` 4,914.95 crores)(2) Carrying value of unquoted Investments 48,413.38 42,900.18 49,078.35 43,565.15 ` ` (3) Equity instruments (Others) - Quoted - Others include: (a) Reliance Firebrick and Pottery. Co. Ltd. (Partly paid-up) 16,800 1 1 (b) Reliance Firebrick and Pottery. Co. Ltd. 2,400 1 1 (c) Sanderson Industries Ltd. 2,27,642 1 1 (d) Sijua (Jherriah) Electric Supply Co. Ltd. 4,144 40,260 40,260 (e) Standard Chrome Ltd. 5,58,000 1 1 (f) Timken India Ltd. 1 10 10 (g) Wellman Incandescent India Ltd. 8,99,100 1 1 40,275 40,275 (4) Equity instruments (Others) - unquoted - Others include: (a) Barajamda Iron Ore Mine Workers’ Central Co-operative Stores Ltd. 200 5,000 5,000 (Face value of ` 25 each) (b) Bokaro and Ramgarh Ltd. 100 16,225 16,225 (c) Ferro Manganese Plant Employees’ Consumer Co-operative Society Ltd. 100 2,500 2,500 (Face value of ` 25 each) (d) Jamshedpur Co-operative House Building Society Ltd. (Face value of ` 100 each) 10 1,000 1,000 (e) Jamshedpur Co-operative Stores Ltd. (Face value of ` 5 each) 50 250 250 (f) Jamshedpur Educational and Culture Co-operative Society Ltd. 50 5,000 5,000 (Face value of ` 100 each) (g) Joda East Iron Mine Employees’ Consumer Co-operative Society Ltd. 100 2,500 2,500 (Face value of ` 25 each) (h) Malusha Travels Pvt. Ltd. 2 20 20 (i) Woodland Multispeciality Hospital Ltd. (1,25,000 shares subscribed during the year) 1,25,000 1 – 32,496 32,495
13. NoN-CuRRENT iNvESTMENTS (continued)(Item No. 5(b), Page 142) No. of equity As at shares of 31.03.2011 face value of ` crores ` crores ` 10 each fully paid-up unless otherwise specifiedBrought forward 49,078.35 43,392.67
Additional information:(1) The Company has elected to account for exchange differences arising on reporting of long-term foreign currency monetary
item in accordance with Companies (Accounting Standards) Amendment Rules 2009 pertaining to Accounting Standard 11 (AS-11) notified by Government of India on 31st March, 2009 (as amended on 29th December, 2011) which allows foreign exchange differences on long-term monetary items arising on or after 1st April, 2011 to be capitalised to the extent they relate to acquisition of depreciable assets and in other cases to amortise over the balance period of the respective monetary items.
As on 31st March, 2012, a debit of ̀ 404.90 crores (31.03.2011: Nil) remains to be amortised in the "Foreign Currency Monetary Item Translation Difference Account" after taking debit of ̀ 243.21 crores (2010-11: credit of ̀ 261.44 crores) in the Statement of Profit and Loss and ̀ 25.22 crores (net of deferred tax ̀ 12.11 crores) [2010-11: ̀ 2.07 crores (net of deferred tax ̀ 3.57 crores)] have been adjusted against Securities Premium Reserve on account of amortisation. The depreciation for the year ended 31st March, 2012 is higher by ` 2.52 crores (2010-11: ` 0.48 crores) and Profit before tax for the year ended 31st March, 2012 is higher by ` 425.77 crores (2010-11: higher by ` 208.99 crores).
15. LoANS AND ADvANCES(Item No. 5(d) and 6(e), Page 142) As at 31.03.2011 ` crores ` crores Long Short Long Short Term Term Total Term Term Total
(a) Capital advances (1) unsecured and considered good 2,448.14 – 2,448.14 1,357.10 – 1,357.10 (b) Security deposits unsecured and considered good 83.72 – 83.72 71.70 – 71.70 unsecured and considered doubtful 1.45 – 1.45 0.88 – 0.88 Less: Provision for bad & doubtful loans and advances 1.45 – 1.45 0.88 – 0.88 83.72 – 83.72 71.70 – 71.70 (c) Advance with public bodies unsecured and considered good 313.20 589.06 902.26 196.04 330.19 526.23 unsecured and considered doubtful 16.45 1.87 18.32 – 20.45 20.45 Less: Provision for bad & doubtful loans and advances 16.45 1.87 18.32 – 20.45 20.45 313.20 589.06 902.26 196.04 330.19 526.23 (d) Loans and advances to related parties (2) unsecured and considered good 1,907.28 77.76 1,985.04 6,684.86 4,363.41 11,048.27 (e) Advance payment against taxes unsecured and considered good 173.05 – 173.05 228.98 – 228.98 (f) Other loans and advances (3) unsecured and considered good 1,490.41 1,161.27 2,651.68 1,914.73 1,765.34 3,680.07 unsecured and considered doubtful 0.39 27.61 28.00 0.43 30.04 30.47 Less: Provision for bad & doubtful loans and advances 0.39 27.61 28.00 0.43 30.04 30.47 1,490.41 1,161.27 2,651.68 1,914.73 1,765.34 3,680.07 6,415.80 1,828.09 8,243.89 10,453.41 6,458.94 16,912.35
163
16. oThER NoN-CuRRENT ASSETS(Item No. 5(e), Page 142) As at 31.03.2011 ` crores ` crores Balances with banks (1) 2.76 2.76 2.76 2.76Additional information:(1) Represents bank deposits not due for realisation within 12 months of the balance sheet date.
17. CuRRENT iNvESTMENTS(Item No. 6(a), Page 142) As at 31.03.2011 ` crores ` crores investments in Mutual Funds – unquoted Liquid Funds 1,204.17 2,999.79 1,204.17 2,999.79
Additional information:(1) Includes capital advance in respect of research and development activities of ` 0.09 crore (31.03.2011: ` 1.61 crores).(2) Loans and advances to related parties include: (a) Advances against equity for purchase of shares in subsidiary companies and associate. (b) Loans and advances in the nature of loans given to subsidiaries ` 571.07 crores (31.03.2011: ` 4,214.58 crores).
Disclosure as per clause 32 of the listing agreement:
Maximum balance Investment by the outstanding during loanee in the As at the year shares of parent Name of the Company Relationship 31.03.2012 company ` crores ` crores No. of Shares
(c) Intercorporate deposits ` 422.00 crores (31.03.2011: ` 46.00 crores)(3) Other loans and advances include: (a) Loan due by an officer of the Company ` 1,11,250 (31.03.2011: ` 1,26,250) (b) Intercorporate deposits ` 2.00 crores (31.03.2011: ` 2.00 crores)
Hundred and fifth annual report 2011-12
164
18. iNvENToRiES(At lower of cost and net realisable value)(Item No. 6(b), Page 142) As at 31.03.2011 ` crores ` crores (a) Raw materials 2,241.96 1,763.88 (b) Work-in-progress 53.83 81.19 (c) Finished and semi-finished goods 1,639.83 1,391.91 (d) Stock-in-trade of goods acquired for trading 0.76 0.60 (e) Stores and spares 922.61 716.18 4,858.99 3,953.76 Included above, goods-in-transit: (i) Raw materials 462.40 386.88 (ii) Finished and semi-finished goods 1.55 – (iii) Stores and spares 98.19 46.93 562.14 433.81
19. TRADE RECEivAbLES(Item No. 6(c), Page 142) As at 31.03.2011 ` crores ` crores (a) More than six months 34.51 42.28 (b) Others 880.91 396.29 915.42 438.57 Less: Provision for bad and doubtful debts 11.34 14.55 904.08 424.02
unsecured and considered good 904.08 424.02 Doubtful 11.34 14.55 915.42 438.57
20. CASh AND bANK bALANCES (Item No. 6(d), Page 142) As at 31.03.2011 ` crores ` crores (a) Cash in hand 0.36 0.40 (b) Cheques, drafts on hand 22.76 107.91 (c) Remittances in-transit 7.70 50.65 (d) Balances with banks 3,869.71 3,937.46 Total cash and cash equivalents 3,900.53 4,096.42 (e) Other bank balances (1) 46.46 42.36 3,946.99 4,138.78Additional information:(1) Represents ` 0.17 crore (31.03.2011: ` 0.61 crore) refund orders issued on account of oversubscription of rights issue and
follow on public offer of equity shares not encashed, ` 0.48 crore (31.03.2011: ` 0.49 crore) in pre-funded accounts for bonus and CCPS related payments and ` 45.81 crores (31.03.2011; ` 41.26 crores) in pre-funded dividend accounts.
(2) Balances with banks held as security against guarantees ` 28.46 crores (31.03.2011: ` 28.46 crores).
165
21. oThER CuRRENT ASSETS (Item No. 6(f), Page 142) As at 31.03.2011 ` crores ` crores Interest accrued on deposits, loans and advances 122.18 137.73 122.18 137.73 22. REvENuE FRoM oPERATioNS (Item No. 1(a), Page 143) Previous Year ` crores ` crores (a) Sale of products (1) 35,655.99 30,747.57 (b) Sale of power and water 980.44 795.90 (c) Income from town, medical and other services 50.70 35.82 (d) Other operating income (2) 318.58 322.85 37,005.71 31,902.14 Additional information:(1) Details of products sold:
Previous Year ` crores ` crores Class of Products (i) Saleable Steel (Finished) 27,587.53 23,042.97 (ii) Agrico Products 156.14 159.66 (iii) Semi-finished Steel and Scrap 1,332.86 1,531.12 (iv) Welded Steel Tubes 1,399.70 1,281.97 (v) By-products, etc. 316.39 251.41 (vi) Raw Materials: – Ferro Manganese 140.69 155.46 – Charge Chrome/Ferro Chrome 1,157.61 898.06 – Other Raw Materials 2,744.03 2,499.04 (vii) Other Products [includes tubular steel structures ` 495.58 crores (2010-11: ` 429.13 crores)] 554.45 489.58 (viii) Bearings 193.90 183.84 (ix) Metallurgical Machinery 67.55 249.39 (x) Sale of Purchased Materials: – Saleable Steel (finished/converted) – 0.02 – Raw Materials/Scrap/Other Materials 5.14 5.05
35,655.99 30,747.57
(2) Includes lease rentals of ` 0.20 crores (2010-11: ` 0.20 crores) on wagons leased to railways under Own Your Wagon Scheme.
Hundred and fifth annual report 2011-12
166
23. Other IncOme (Item No. 1(b), Page 143) Previous Year ` crores ` crores (a) Dividend income (i) Investment in subsidiaries 46.18 9.68 (ii) Investment in joint ventures and associates 9.11 26.96 (iii) Other non-current investments 62.21 56.02 (iv) Current investments – 0.08 (b) Interest income 433.26 234.97 (c) Net gain/(loss) on sale of current investments 430.57 150.73 (d) Profitonsaleofcapitalassets(netoflossonassetssold/writtenoff) (52.98) (0.62) (e) Gain/(Loss)oncancellationofforwards,swapsandoptions (41.92) 50.54
886.43 528.36
24. raw materIals cOnsumed (Item No. 2(a), Page 143) Previous Year ` crores ` crores (a) Iron ore 1,203.83 896.84 (b) Coal [excluding ` 4,698.67 crores (2010-11: ` 3,230.02 crores) used for manufacturing coke] 1,382.27 1,134.07 (c) Coke 5,234.48 3,553.89 (d) Limestone and Dolomite 510.63 495.67 (e) Ferro Manganese 109.28 103.82 (f) Zinc and Zinc Alloys 251.35 234.31 (g) Spelter,sulphurandothermaterials 1,409.45 1,246.55
26. ChAngES In InVEnTORIES Of fInIShED gOODS, WORk-In-PROgRESS AnD STOCk-In-TRADE(Item No. 2(c), Page 143) Previous Year ` crores ` crores inventories at the end of the year (a) Work-in-progress 53.83 81.19 (b) Finished and semi-finished goods 1,639.83 1,391.91 (c) Stock-in-trade of goods acquired for trading 0.76 0.60
1,694.42 1,473.70 Inventories at the beginning of the year (a) Work-in-progress 81.19 158.65 (b) Finished and semi-finished goods 1,391.91 1,140.73 (c) Stock-in-trade of goods acquired for trading 0.60 0.67 1,473.70 1,300.05 220.72 173.65Additional information:(1) Details of finished and semi-finished goods, stock-in-trade of goods acquired for trading:
(a) Salaries and wages, including bonus 2,646.21 2,106.52 (b) Contribution to provident and other funds 299.29 491.94 (c) Staff welfare expenses(1) 101.76 239.00
3,047.26 2,837.46
Additional information:(1) Staff welfare expenses excludes payment on account of salaries and wages ` 116.77 crores (2010-11: ` 90.62 crores).
Hundred and fifth annual report 2011-12
168
28. DEPRECiATioN AND AMoRTiSATioN ExPENSE(Item No. 2(e), Page 143) Previous Year ` crores ` crores (a) Depreciation on tangible assets (1) 1,095.83 1,088.85 (b) Amortisation of intangible assets 55.61 57.34
1,151.44 1,146.19Additional information:(1) Includes ` 1.08 crores (2010-11: ` 2.79 crores) in respect of research and development activities undertaken during the year.
1,925.42 1,735.70Additional information:(1) Includes interest on income tax assessment for earlier years ` 41.70 crores (31.03.2011: Nil)
30. oThER ExPENSES(Item No. 2(g), Page 143) Previous Year ` crores ` crores (a) Consumption of stores and spares 1,693.48 1,417.26 (b) Repairs to buildings 61.08 39.84 (c) Repairs to machinery 1,162.95 1,064.26 (d) Relining expenses 28.87 30.89 (e) Fuel oil consumed 186.44 153.63 (f) Purchase of power 1,803.72 1,404.86 (g) Conversion charges 1,513.97 1,192.89 (h) Freight and handling charges 1,703.98 1,540.82 (i) Rent 30.88 16.76 (j) Royalty 912.43 615.01 (k) Rates and taxes 371.71 290.73 (l) Insurance 36.48 31.76 (m) Commission, discounts and rebates 128.42 109.36 (n) Provision for wealth tax 1.70 1.28 (o) Provision for doubtful debts and advances (5.41) 8.23 (p) Excise duty 94.95 88.80 (q) Others (1) 2,098.84 1,018.44
11,824.49 9,024.82
169
Additional information: Previous Year ` crores ` crores(1) Others include: (a) Provision for impairment losses on fixed assets 6.90 20.23 (b) Net loss/(gain) on foreign currency transactions 467.12 (259.14) (c) Auditors remuneration and out-of-pocket expenses (i) As Auditors 4.00 3.35 (ii) For taxation matters 0.37 0.35 (iii) For other services (excluding ` 0.10 crores being expenses related 0.50 0.23 to issue of Hybrid Perpetual Securities adjusted against the Securities Premium Reserve) (iv) Auditors out-of-pocket expenses 0.04 0.01 (d) Cost audit fees [including expenses ` 79,462 (2010-11: ` 41,248)] 0.07 0.01
(2) Other expenses includes ` 51.22 crores (2010-11: ` 72.90 crores) in respect of research and development activities undertaken during the year.
31. ExCEPTioNAL iTEM(Item No. 4(a), Page 143)
During the year, the Company has sold part of its investment in TRL Krosaki Refractories Limited (formerly Tata Refractories Limited) (TRL) to Krosaki Harima Corporation for ̀ 576.10 crores. Consequently, the company’s holding in TRL have reduced to 26.46%. Accordingly, it has ceased to be a subsidiary and became an associate. ‘Profit on sale of non-current investment’ of ` 511.01 crores represents gain on sale of these shares. In the previous year, the Company had made profit on sale of part of its investments in Tata Motors Ltd., The Tata Power Company Ltd. and TRF Limited of ` 648.09 crores.
32. EARNiNGS PER ShARE (EPS)(Item No. 8 and 9, Page 143) Previous Year ` crores ` crores (a) Profit after tax 6,696.42 6,865.69 Less: Distribution on Hybrid Perpetual Securities (net of tax) 173.30 4.54 Profit attributable to Ordinary Shareholders – for Basic EPS 6,523.12 6,861.15 Add: Adjustment for 3,820 (31.03.2011: 3,820) 1% Convertible Alternative Reference Securities – 46.14 Adjustment for 5,469.35 (31.03.2011: 5,469.35) 4.5% Foreign Currency Convertible Bonds 162.97 (17.28) Profit attributable to Ordinary Shareholders – for Diluted EPS 6,686.09 6,890.01
Nos. Nos. (b) Weighted average no. of Ordinary Shares for Basic EPS 96,15,75,106 90,72,52,572 Add: Adjustment for 3,820 (31.03.2011: 3820) 1% Convertible Alternative Reference Securities – 2,10,15,711 Adjustment for 5,469.35 (31.03.2011: 5,469.35) 4.5% Foreign Currency Convertible Bonds 4,21,12,297 4,19,60,304 Adjustment for Options relating to 1,20,00,000 (31.03.2011: 1,20,00,000) Detachable Warrants – 3,53,829
Weighted average no. of Ordinary Shares for Diluted EPS 1,00,36,87,403 97,05,82,416
(c) Nominal value of Ordinary Shares ` 10 ` 10 (d) Basic Earnings per Ordinary Share ` 67.84 ` 75.63 (e) Diluted Earnings per Ordinary Share ` 66.62 ` 70.99
Hundred and fifth annual report 2011-12
170
33. CoNTiNGENT LiAbiLiTiES AND CoMMiTMENTS A. Contingent Liabilities (a) Claims not acknowledged by the Company ` crores
As at 31.03.2011 (i) Excise 320.81 313.26 (ii) Customs 13.69 13.68 (iii) Sales Tax and vAT 539.99 494.54 (iv) State Levies 202.13 187.28 (v) Suppliers and Service Contract 74.31 72.21 (vi) Labour Related 41.69 38.84 (vii) Income Tax 17.92 119.79 (viii) Royalty (Iron ore) 80.35 –
(b) The Company has given guarantees aggregating ` 391.58 crores (31.03.2011: ` 991.11 crores) to banks and financial institutions on behalf of others. As at 31st March, 2012, the contingent liabilities under these guarantees amounts to ` 391.58 crores (31.03.2011: ` 991.11 crores).
(c) Claim by a party arising out of conversion arrangement - ` 195.82 crores (31.03.2011: ` 195.82 crores). The Company has not acknowledged this claim and has instead filed a claim of ` 139.65 crores (31.03.2011: ` 139.65 crores) on the party. The matter is pending before the Calcutta High Court.
(d) The Excise Department has raised a demand of ` 235.48 crores (31.03.2011: ` 235.48 crores) denying the benefit of Notification No. 13/2000 which provides for exemption to the integrated steel plant from payment of excise duty on the freight amount incurred for transporting material from plant to stock yard and consignment agents. The Company filed an appeal with CESTAT, Kolkata and the order of the department was set aside. The department has filed an appeal in Supreme Court where the matter is pending.
(e) TMT bars and rods in coil form were sent to an external processing agent (EPA), on payment of duty at Jamshedpur (ex-works) price, for decoiling and cutting into specified lengths and then dispatch, at assessable value to various stock yards and depots of the Company for further sale. Differential duty was paid by the Company after the month was over. Excise department contested this activity as ‘manufacturing’ and demanded duty from the EPA ignoring the payment of duty made by the Company. An appeal against the order of the Commissioner of Central Excise, Jamshedpur was filed in CESTAT, Kolkata and was allowed in favour of the EPA. Subsequently, the department challenged the same in Jharkhand High Court, Ranchi, which is still pending for hearing. Subsequent demand in this regard has not been adjudicated. Meanwhile, since September 2010, the decoiling and cutting activity with the EPA has been discontinued. The potential liability as of 31st March, 2012, will be approximately ̀ 298.87 crores (31.03.2011: ̀ 298.87 crores). However, the Company has already paid duty amounting to ` 196.48 crores (31.03.2011: ` 196.48 crores) till date based on the final sale price of the material.
(f) The State Government of Odisha introduced "Orissa Rural Infrastructure and Socio Economic Development Act 2004" with effect from February 2005 levying tax on mineral bearing land computed on the basis of value of minerals produced from the mineral bearing land. The Company had filed a Writ Petition in the High Court of Odisha challenging the validity of the Act. Odisha High Court held in November 2005 that State does not have authority to levy tax on minerals. The State Government of Odisha moved to the Supreme Court against the order of Odisha High Court and the case is pending with Supreme Court. The potential liability, as of 31st March, 2012 would be approximately ` 2,085.88 crores (31.03.2011: ` 1,562.72 crores).
(g) In terms of the agreements entered into between Tata Teleservices Ltd. (TTSL), Tata Sons Ltd. (TSL) and NTT DoCoMo, Inc. of Japan (Strategic Partner-SP), the Company was given by Tata Sons an option to sell 52,46,590 equity shares in TTSL to the SP.
Pursuant to the rights issue made in 2010-11, SP’s shareholding in TTSL has increased from 1,17,26,17,866 equity shares of ` 10 each to 1,24,89,74,378 equity shares of ` 10 each as on 31st March, 2012. The shareholding of SP represents 26.50% of the paid up equity share capital of TTSL on a fully diluted basis as against 26.27% prior to the issuance and allotment of rights shares to them.
If certain performance parameters and other conditions are not met by TTSL by 31st March, 2014 and should the SP decide to divest its entire shareholding in TTSL, acquired under the primary issue and the secondary sale, and should TSL be unable to find a buyer for such shares, the Company is obligated to acquire the shareholding of the SP, at the higher of fair value or 50 percent of the subscription purchase price subject to compliance with applicable exchange control regulations, in proportion of the number of shares sold by the company to the aggregate of the secondary shares sold to the SP, or if the SP divests the shares at a lower price pay a compensation representing the difference between such lower sale price and the price referred to above.
Further, in the event of breach of the representations and warranties (other than title and tax) and covenants not capable of specific performance, the Company is liable to reimburse TSL, on a pro rata basis, upto a maximum sum of ` 78.75 crores. The exercise of the option by SP being contingent on several variables the liability, if any, is remote and indeterminable.
171
(h) The Company has been paying royalty on coal extracted from its quarries pursuant to the judgement and order dated 23rd July, 2002 passed by the Jharkhand High Court. However, the State Government demanded royalty at rates applicable to processed coal. Though the Company has contested the above demand, it has started paying, under protest, royalty on processed coal from November 2008. The incremental amount (including interest), if payable, for the period till October 2008 works out to ` 384.64 crores (31.03.2011: ` 355.83 crores) and has been considered as a contingent liability.
(i) Bills discounted ` 174.78 crores (31.03.2011: ` 212.38 crores). b. Commitments (a) Estimated amount of contracts remaining to be executed on Capital Account and not provided for: ` 13,178.11
crores (31.03.2011: ` 9,605.46 crores). (b) uncalled liability on partly paid shares and debentures ` 0.01 crores (31.03.2011: ` 0.01 crores).34. The Company has given undertakings to: (a) ICICI Bank Ltd. (formerly ICICI), IFCI and IIBI not to dispose of its investment
in the Indian Steel Rolling Mills Ltd. (ISRM). The ISRM is under liquidation, (b) IDBI not to dispose of its investment in Wellman Incandescent India Ltd., (c) IDBI and ICICI Bank Ltd. (formerly ICICI) not to dispose of its investment in Standard Chrome Ltd., (d) Standard Chartered Bank, Hong Kong Shanghai Banking Corporation Limited not to dispose of majority stake in Tata Steel (KZN) (Pty) Ltd., (e) Mizuho Corporate Bank Limited and Japan Bank of International Co-operation, not to dispose of its investments in Tata NYK Shipping Pte. Limited, (minimal stake required to be able to provide a corporate guarantee towards long-term debt), (f) State Bank of India not to dispose of the management control (indirectly held) in Tata Steel uK Holdings Ltd. and Tata Steel Netherlands Holding B v and other companies (the borrower group), (g) Bank of America N.A. Singapore, Hong Kong Shanghai Banking Corporation Limited and The Royal Bank of Scotland N.v. not to dispose of the management control (indirectly held) in Tata Steel Global Procurement Company Pte. Limited, (h) Standard Chartered Bank, Singapore not to dispose of the management control (directly held) in NatSteel Asia Pte. Limited, without the prior consent of the respective financial institutions/banks so long as any part of the loans/facilities sanctioned by the institutions/banks to these companies remains outstanding.
The Company has furnished a security bond in respect of its immovable property to the extent of ` 20 crores in favour of the Registrar of the Delhi High Court and has given an undertaking not to sell or otherwise dispose of the said property.
The Promoters of Tata BlueScope Limited (TBSL) (i.e. BlueScope Steel Limited, Australia and Tata Steel Ltd.) have given an undertaking to IDBI Trusteeship Services Ltd., Debenture Trustees, not to dispose of the management control in TBSL.
The Promoters’ (i.e. L & T Infrastructure Development Projects Ltd. and Tata Steel Ltd.) combined investments in The Dhamra Port Company Ltd., (DPCL) representing 51% of DPCL’s paid-up equity share capital are pledged with IDBI Trusteeship Services Ltd.
The Promoters’ (i.e. The Tata Power Company Limited and Tata Steel Ltd.) combined investments in Industrial Energy Limited, (IEL) representing 51% of IEL’s paid-up equity share capital are pledged with Infrastructure Development Finance Corporation Limited (IDFC).
The Company has agreed, if requested by Tata Steel uK Holdings Ltd.(TSuKH), an indirect wholly owned subsidiary of Tata Steel Limited, to procure an injection of funds to reduce the outstanding net debt in TSuKH and its subsidiaries, to a mutually accepted level.
35. The Company had, on 20th August, 2005, signed an agreement with the Government of Jharkhand to participate in a special health insurance scheme to be formulated by the Government of Jharkhand for the purpose of providing medical facilities to the families of the people below poverty line. The state government would develop a suitable scheme and the Company has agreed to contribute to such scheme, when operational, a sum of ` 25 crores annually for a period of 30 years or upto the year of operation of the scheme whichever is lower. In the current financial year the Government initiated discussion and the Company provided a draft trust deed to the Government for formation of the scheme and trust. The matter is still under discussion. However no contribution has been made till 31st March, 2012.
36. The Board of Industrial and Financial Reconstruction (BIFR) sanctioned a scheme for rehabilitation of Indian Steel & Wire Products Ltd. (ISWP), a Sick Company in FY 2003-04. In terms of the scheme, the Company –
(a) took management control of ISWP; (b) acquired 4,74,130 Equity Shares from the existing promoters at ` 1/- per share; (c) converted ` 5 crores of dues into 50,00,000 fully paid Equity Shares at ` 10 each and ` 10.88 crores into unsecured loan to be repaid by ISWP in 8 annual installments starting from FY 2004-05; (d) has an advance of ` 8.09 crores as at 31st March, 2012 (31.03.2011: ` 11.50 crores) with ISWP towards one time settlement with financial institutions for capital expenditure and margin for working capital.
37. STATEMENT oF PRoFiT AND LoSS (a) value of direct imports (C.i.F. value): ` crores Previous Year (i) Raw materials 5,912.14 4,369.54 (ii) Semi-finished products 35.85 23.55 (iii) Components, stores and spare parts 466.34 353.48 (iv) Capital Goods 1,425.23 712.45 7,839.56 5,459.02
Hundred and fifth annual report 2011-12
172
(b) The value of consumption of directly imported and indigenously obtained raw materials, stores and spare parts and the percentage of each to the total consumption:
Previous Year ` crores % ` crores % (i) Raw materials – Directly imported 6,116.87 60.56% 4,672.63 60.96% – Indigenously obtained 3,984.42 39.44% 2,992.52 39.04% 10,101.29 100.00% 7,665.15 100.00% (ii) Components, stores and spare parts – Directly imported 497.36 15.33% 492.92 17.17% – Indigenously obtained 2,746.17 84.67% 2,377.91 82.83% 3,243.53 100.00% 2,870.83 100.00% Less: Consumption charged to other revenue accounts 1,234.19 1,127.19 2,009.34 1,743.64
Additional information: (1) The consumption figures shown above are after adjusting excess and shortages ascertained on physical count,
unserviceable items, etc. (2) In respect of items which are purchased both from indigenous and imported sources, the identity of individual items
consumed cannot be established but segregation of consumption between imported and indigenous sources has been made on a reasonable approximation determined from the Company’s records.
(3) Raw materials consumed includes ` 2,086.92 crores (2010-11: ` 1,421.14 crores) charged to wages and salaries and other revenue accounts
(4) Stores and spares consumed (including write-off of obsolete spares, if any) includes ` 129.42 crores (2010-11: ` 172.75 crores) being cost of stores manufactured departmentally and charged to wages and salaries and other revenue accounts.
(c) Expenditure in foreign currency: ` crores
Previous Year (i) Technical know-how and technical consultant's fees (net of taxes) [including ` 205.02 crores (2010-11: ` 106.05 crores) on capital account] 206.49 111.71 (ii) Interest, commitment and bank charges 708.86 633.04 (iii) Commission 39.35 28.48 (iv) Payable on other accounts 12.49 182.88 (d) Remittance in foreign currencies for dividend: The Company has not remitted any amount in foreign currencies on account of dividend during the year and does
not have information as to the extent to which remittances, if any, in foreign currencies on account of dividend have been made by/on behalf of non-resident shareholders. The particulars of dividend payable to non-resident shareholders (including non-resident Indian shareholders) which were declared during the year are as under:
Previous Year (i) Number of non-resident shareholders 11,863 10,644 (ii) Number of Ordinary Shares held by them 19,63,74,449 15,70,60,911 (iii) Gross amount of dividend ` 235.64 crores ` 125.64 crores
Gross amount of dividend declared in current and previous year pertain to FY 2010-11 and FY 2009-10 respectively.
(e) Earnings in foreign exchange: ` crores
Previous Year (i) Export of steel and other materials (F.O.B.) 1,804.87 2,252.37 (including value of exports through export houses) (ii) Interest received 75.55 57.90 (iii) Others (29.95) 63.70
173
38. Pursuant to the sanction of the Honourable High Court of Bombay to the Scheme of Amalgamation, the assets and liabilities of the erstwhile Centennial Steel Company Limited (CSCL) whose principal business was manufacture, sale and purchase of iron and steel and related products have been merged with the Company with effect from 1st April, 2011 in accordance with the Scheme so sanctioned. The effect of the merger has been given in the accounts as per the scheme sanctioned.
The amalgamation has been accounted for under the "Pooling of Interests method" as prescribed by Accounting Standard 14 (AS-14) as notified by the Government of India. Accordingly, the assets (including capital work-in-progress ` 3,689.32 crores and capital advance ` 877.18 crores), liabilities (including loans of ` 1,438.22 crores) and other reserves of the erstwhile CSCL as at 1st April, 2011 have been taken over at their book values. As a result, debit balance of Statement of Profit and Loss of the erstwhile CSCL aggregating to ` 0.87 crores have been adjusted against the reserves of the Company.
39. The amount due to Micro and Small Enterprises as defined in the "The Micro, Small and Medium Enterprises Development Act, 2006" has been determined to the extent such parties have been identified on the basis of information available with the Company. The disclosures relating to Micro and Small Enterprises as at 31st March, 2012 are as under:
` crores
2010-11 Description (i) The principal amount remaining unpaid to supplier as at the end of the year 7.46 0.86 (ii) The interest due thereon remaining unpaid to supplier as at the end of the year 0.09 * (iii) The amount of interest due and payable for the period of delay in making payment (which have been paid but beyond the appointed day during the year) but without adding the interest specified under this Act 0.41 0.15 (iv) The amount of interest accrued during the year and remaining unpaid at the end of the year 0.51 0.16 * ` 70,261.84
40. No amount is paid/payable by the Company under Section 441A of the Companies Act, 1956 (cess on turnover) since the rules specifying the manner in which the cess shall be paid has not been notified yet by the Central Government.
41. EMPLoyEE bENEFiTS (a) The Company has recognised, in the Statement of Profit and Loss for the year ended 31st March, 2012, an amount of
` 217.79 crores (2010-11: ` 185.54 crores) as expenses under the following defined contribution plans.
The Company’s Provident Fund is exempted under Section 17 of Employees’ Provident Fund Act, 1952. (b) The Company operates post retirement defined benefit plans as follows: Funded - Post Retirement Gratuity unfunded - Post Retirement Medical Benefits - Pensions to Directors - Farewell Gifts - Packing and Transportation Costs on Retirement
Hundred and fifth annual report 2011-12
174
(c) Details of the post retirement gratuity plan are as follows:` crores
2010-11 Description (i) Reconciliation of opening and closing balances of obligation Obligation as at 01.04.2011 1,536.69 1,173.34 Current service cost 72.12 54.71 Interest cost 118.66 90.20 Actuarial (gain)/loss 15.00 310.10 Benefits paid (106.90) (91.66) Obligation as at 31.03.2012 1,635.57 1,536.69 (ii) Reconciliation of opening and closing balances of plan assets Fair value of plan assets as at 01.04.2011 1,173.86 1,044.59 Expected return on plan assets 104.15 85.06 Actuarial gain/(loss) 20.65 6.94 Contributions 362.85 128.93 Benefits paid (106.90) (91.66) Fair value of plan assets as at 31.03.2012 1,554.61 1,173.86 (iii) Reconciliation of fair value of assets and obligations Fair value of plan assets as at 31.03.2012 1,554.61 1,173.86 Present value of obligation as at 31.03.2012 1,635.57 1,536.69 Net obligation/(asset) recognised in the balance sheet 80.96 362.83 (iv) Expenses recognised during the year Current service cost 72.12 54.71 Interest cost 118.66 90.20 Expected return on plan assets (104.15) (85.06) Actuarial (gain)/loss (5.65) 303.16* Expense recognised during the year (included in the line item - 80.98 363.01 employee benefits expense) *Includes impact on account of wage settlement, provision for which was earlier included under salaries and wages, including bonus. 31.03.2012 31.03.2011 (v) investment details % % GOI securities 14.97 9.67 Public sector unit bonds 15.18 27.89 Central/State guaranteed securities 6.11 5.30 Private sector unit bonds 10.47 7.03 Deposit with LIC 49.97 47.93 Others (including bank balances) 3.30 2.18 100.00 100.00 (vi) Assumptions Discount rate (per annum) 8.50% 8.00% Expected return on plan assets (per annum) 8.00% 8.00% Rate of escalation in salary (per annum) 7.5 to 10% 7.5 to 10%
The long-term estimate of the expected rate of return on the plan assets have been arrived at based on the asset allocation and prevailing yield rates on such assets. The major portions of the assets are invested in PSu bonds and LIC. Assumed rate of return on assets is expected to vary from year to year reflecting the returns on matching Government Bonds.
175
(d) Details of the unfunded post retirement defined benefit obligation are as follows:
` crores
2010-11 Description Medical others Medical Others (i) Reconciliation of opening and closing balances of obligation Obligation as at 01.04.2011 718.26 49.53 600.72 45.02 Current service cost 8.03 1.51 6.44 1.15 Interest cost 56.20 3.82 46.11 3.49 Actuarial (gain)/loss (55.07) 2.86 113.68 2.67 Benefits paid (31.62) (3.59) (48.69) (2.80) Obligation as at 31.03.2012 695.80 54.13 718.26 49.53 (ii) Expenses recognised during the year Current service cost 8.03 1.51 6.44 1.15 Interest cost 56.20 3.82 46.11 3.49 Actuarial (gain)/loss (55.07) 2.86 113.68 2.67 Expense recognised during the year (included in the line item - 9.16 8.19 166.23 7.31 employee benefits expense) (iii) Assumptions Discount rate (per annum) as at the beginning of the year 8.00% 8.00% 8.00% 8.00% Discount rate (per annum) as at the end of the year 8.50% 8.50% 8.00% 8.00% Medical costs inflation rate 8.00% 5.00% Effect of a 1% change in health care cost on Increase 9% p.a. 6% p.a. – aggregate current service and interest cost 7.98 7.54 – closing balance of obligation 109.01 87.48 Decrease 7% p.a. 4% p.a. – aggregate current service and interest cost (0.84) (6.24) – closing balance of obligation (88.06) (75.42)
(e) The estimate of future salary increases take into account inflation, seniority, promotion and other relevant factors. (f) Other disclosures: ` crores
Benefits 2011-12 2010-11 2009-10 2008-09 2007-08 Retiring Gratuity Defined benefit obligation 1,635.57 1,536.69 1,173.34 1,053.62 761.17 Plan assets 1,554.61 1,173.86 1,044.59 809.93 709.14 Surplus/(Deficit) (80.96) (362.83) (128.75) (243.69) (52.03) Experience adjustment on obligation - (gain)/loss 78.04 183.67 98.15 192.98 27.15 Experience adjustment on plan assets - gain/(loss) 20.65 6.94 5.61 33.35 (6.02) Expected adjustments (best estimate) to funded plans in subsequent finance year 80.96 362.83 128.75 243.69 52.03 Medical Defined benefit obligation 695.80 718.26 600.72 541.68 507.42 Experience adjustment on obligation - (gain)/loss 104.39 113.68 70.27 6.78 26.47 Others Defined benefit obligation 54.13 49.53 45.02 37.02 37.73 Experience adjustment on obligation - (gain)/loss 5.32 2.67 7.70 3.70 1.13
Hundred and fifth annual report 2011-12
176
42. SEGMENT REPoRTiNG Primary Segment information (business Segment)
` crores Ferro Alloys and Particulars Steel Minerals Others Unallocable Eliminations Total Segment revenue
Secondary Segment information (Geographical Segment) ` crores
2010-11 Segment Revenue – Within India 32,117.83 27,135.71 – Outside India 1,815.63 2,260.64 33,933.46 29,396.35 Capital Expenditure – Within India 7,496.68 4,008.08 – Outside India – – 7,496.68 4,008.08 As at 31.03.2011 Segment Assets – Within India 44,482.54 36,799.20 – Outside India – – 44,482.54 36,799.20
Additional information: (1) The Company has disclosed Business Segment as the primary segment. Segments have been identified taking into
account the nature of the products, the differing risks and returns, the organisational structure and internal reporting system. The Company’s operations predominantly relate to manufacture of Steel and Ferro Alloys and Minerals business. Other business segments comprise Tubes and Bearings.
(2) Segment Revenue, Segment Results, Segment Assets and Segment Liabilities include the respective amounts identifiable to each of the segments as also amounts allocated on a reasonable basis. The expenses, which are not directly relatable to the business segment, are shown as unallocated corporate cost. Assets and liabilities that cannot be allocated between the segments are shown as unallocated corporate assets and liabilities respectively.
(3) unallocable Assets and Liabilities exclude: ` crores
As at 31.03.2011 Assets: Non-current investments 49,078.35 43,565.15 Current investments 1,204.17 2,999.79 Advance against equity 1,021.10 6,187.58 Foreign Currency Monetary Item Translation Difference Account 404.90 – 51,708.52 52,752.52 Liabilities: Long-term borrowings 21,353.20 24,499.05 Short-term borrowings 65.62 149.13 Current maturities of long-term borrowings 4,753.43 3,652.94 Hybrid perpetual securities 2,275.00 1,500.00 Provision for employee separation compensation 764.73 873.34 Deferred tax liabilities (net) 970.51 936.80 30,182.49 31,611.26
(4) Transactions between segments are primarily for materials which are transferred at market determined prices and common costs are apportioned on a reasonable basis.
Hundred and fifth annual report 2011-12
178
43. RELATED PARTy TRANSACTioNS (a) List of Related Parties and relationships
Name of the Party Country
A. Subsidiaries:i) Adityapur Toll bridge Company Limited Indiaii) Centennial Steel Company Ltd. * Indiaiii) Gopalpur Special Economic Zone Limited Indiaiv) Jamshedpur Utilities & Services Company Limited India 1. Haldia Water Management Limited India 2. Naba Diganta Water Management Limited India 3. SEZ Adityapur Limited Indiav) Kalimati investment Company Ltd. India 1. Bangla Steel & Mining Co. Ltd. Bangladeshvi) Lanka Special Steels Ltd. Sri Lankavii) NatSteel Asia Pte. Ltd. Singapore 1. Tata Steel Asia (Hong Kong) Ltd. Hongkong S.A.R. 2. Tata Steel Resources Australia Pty. Ltd. Australiaviii) Sila Eastern Ltd. Thailandix) T S Alloys Limited Indiax) Tata incorporated uSAxi) Tata Korf Engineering Services Ltd. Indiaxii) Tata Metaliks Ltd. India 1. Tata Metaliks Kubota Pipes Limited Indiaxiii) TRL krosaki Refractories Limited India 1. TRL Asia Private Ltd. * Singapore 2. TRL China Ltd. * Chinaxiv) Tayo Rolls Limited Indiaxv) Tata Steel (KZN) (Pty) Ltd. South Africaxvi) Tata Steel holdings Pte. Ltd. Singapore 1. Tata Steel global holdings Pte Ltd. Singapore I. orchid Netherlands (No.1) b.v. Netherlands
II. NatSteel holdings Pte. Ltd. Singapore 1. Best Bar Pty. Ltd. Australia 2. Best Bar (vIC) Pte. Ltd. Australia 3. Burwill Trading Pte. Ltd. Singapore 4. Easteel Construction Services Pte. Ltd. Singapore 5. Easteel Services (M) Sdn. Bhd. Malaysia 6. Eastern Steel Fabricators Phillipines, Inc. Phillipines 7. Eastern Steel Services Pte. Ltd. Singapore 8. Eastern Wire Pte. Ltd. Singapore 9. Materials Recycling Pte. Ltd. * Singapore 10. NatSteel (Xiamen) Ltd. China 11. NatSteel Asia (S) Pte. Ltd. Singapore 12. NatSteel Australia Pty. Ltd. Australia 13. NatSteel Equity Iv Pte. Ltd. Singapore 14. Natsteel Recycling Pte Ltd. Singapore 15. NatSteel Trade International (Shanghai) Company Ltd. China 16. NatSteel Trade International Pte. Ltd. Singapore 17. NatSteel vina Co. Ltd. vietnam 18. PT Materials Recycling Indonesia Indonesia 19. The Siam Industrial Wire Company Ltd. Thailand 20. Wuxi Jinyang Metal Products Co. Ltd. China
III. Tata Steel international (Singapore) holdings Pte. Ltd. Singapore 1. TSIA Holdings (Thailand) Limited Thailand 2. Tata Steel International (Guangzhou) Ltd. China 3. Tata Steel International (Shanghai) Ltd. China 4. Tata Steel International (Malaysia) Sdn. Bhd. Malaysia 5. Tata Steel International (Thailand) Limited Thailand 6. Tata Steel International (Singapore) Pte. Ltd. Singapore 7. Tata Steel international (Asia) Limited Hongkong S.A.R. 8. Tata Steel International (Hongkong) Hongkong S.A.R. Limited Iv. Tata Steel Europe Limited uK 1. Almana Steel Dubai (Jersey) Limited Jersey 2. Apollo Metals Ltd. uSA 3. Ashorne Hill Management College uK 4. Augusta Grundstucks GmbH Germany 5. Automotive Laser Technologies Limited uK 6. B S Pension Fund Trustee Ltd. uK 7. Bailey Steels Limited uK 8. Beheermaatschappij Industriele Produkten B.v. Netherlands 9. Belfin Beheermaatschappij B.v. Netherlands 10. Bell & Harwood Limited uK 11. Blastmega Limited uK 12. Blume Stahlservice GmbH Germany 13. Blume Stahlservice Polska Sp.Z.O.O Poland 14. Bore Samson Group Ltd uK 15. Bore Steel Ltd. uK 16. British Guide Rails Ltd. uK 17. British Steel Corporation Ltd uK 18. British Steel De Mexico S.A. de C.v. Mexico 19. British Steel Directors (Nominees) Limited uK 20. British Steel Employee Share Ownership Trustees Ltd. uK 21. British Steel Engineering Steels (Exports) Limited uK 22. British Steel Holdings B.v. * Netherlands 23. British Steel International B.v. * Netherlands 24. British Steel Nederland International B.v. Netherlands 25. British Steel Samson Limited uK 26. British Steel Service Centres Ltd. uK 27. British Steel Tubes Exports Ltd. uK 28. British Transformer Cores Ltd. * uK 29. British Tubes Stockholding Ltd. uK 30. Bs Quest Trustee Limited uK 31. Bskh Corporate Services (uK) Limited * uK 32. Burgdorfer Grundstuecks GmbH Germany 33. C v Benine Netherlands 34. C Walker & Sons Ltd. uK 35. Catnic GmbH Germany
Name of the Party Country
179
36. Catnic Limited uK 37. Cbs Investissements SAS France 38. Cladding & Decking (uK) Limited uK 39. Cogent Power Inc. Canada 40. Cogent Power Inc. Mexico 41. Cogent Power Inc. uSA 42. Cogent Power Limited uK 43. Cold drawn Tubes Ltd. uK 44. Color Steels Limited uK 45. Corbeil Les Rives SCI France 46. Corby (Northants) & District Water Co. uK 47. Cordor (C& B) Limited uK 48. Corus Aerospace Service Centre Suzhou Co Ltd. China 49. Corus Aluminium Limited * uK 50. Corus Aluminium verwaltungsgesellschaft Mbh Germany 51. Corus Beteiligungs GmbH Germany 52. Corus Brokers Limited * uK 53. Corus Building Systems Bulgaria AD Bulgaria 54. Corus Building Systems N.v. Belgium 55. Corus Building Systems SAS France 56. Corus Byggesystemer A/S Denmark 57. Corus Byggsystem AB Sweden 58. Corus Byggsystemer A/S Norway 59. Corus CNBv Investments uK 60. Corus Coatings usa Inc. uSA 61. Corus Cold drawn Tubes Limited uK 62. Corus Consulting B.v. Netherlands 63. Corus Electrical Limited * uK 64. Corus Engineering Limited * uK 65. Corus Engineering Steels (uK) Limited uK 66. Corus Engineering Steels Holdings Limited uK 67. Corus Engineering Steels Limited uK 68. Corus Engineering Steels Overseas Holdings Limited uK 69. Corus Finance Limited uK 70. Corus Group Limited uK 71. Corus Holdings Ltd. uK 72. Corus Holdings SA * France 73. Corus India Ltd. India 74. Corus International (Overseas Holdings) Limited uK 75. Corus International Bulgaria Limited Bulgaria 76. Corus International Limited uK 77. Corus International Representacoes Do Brasil Ltda. Brazil 78. Corus International Romania SRL. Romania 79. Corus Investments Ltd. uK 80. Corus Ireland Ltd. Ireland 81. Corus Large Diameter Pipes Limited uK 82. Corus Liaison Services (India) Limited uK 83. Corus Management Limited uK
84. Corus Metal Iberica S.A Spain 85. Corus Metals Limited * uK 86. Corus Multi-Metals Limited * uK 87. Corus Norge A/S Norway 88. Corus Packaging Plus Norway AS Norway 89. Corus Primary Aluminium B.v. Netherlands 90. Corus Properties (Germany) Limited uK 91. Corus Property uK 92. Corus Quest Trustee Limited * uK 93. Corus Rail Limited * uK 94. Corus Republic Of Ireland Subsidiaries Pension Scheme Trustee Limited Ireland 95. Corus Service Center Milano Spa Italy 96. Corus Service Centre Limited N Ireland 97. Corus Sheet & Tube Inc. uSA 98. Corus Stainless Limited * uK 99. Corus Stainless uK Ltd. * uK 100. Corus Steel Limited * uK 101. Corus Steel Service STP LLC Russia 102. Corus Trico Holdings Inc. uSA 103. Corus Tubes Poland Spolka Z.O.O Poland 104. Corus uK Healthcare Trustee Limited uK 105. Corus ukraine LLC ukraine 106. Cpn (85) Limited uK 107. Crucible Insurance Company Ltd. I of Man 108. Degels GmbH Germany 109. Demka B.v. Netherlands 110. Dsrm Group Plc. uK 111. Ees Group Services Limited uK 112. EES Nederland B.v. * Netherlands 113. Eric Olsson & Soner Forvaltnings AB Sweden 114. Esmil B.v. Netherlands 115. Euro-Laminations Limited uK 116. European Electrical Steels Limited * uK 117. Europressings Limited uK 118. Firsteel Group Limited uK 119. Firsteel Holdings Limited uK 120. Firsteel Strip Mill Products Limited uK 121. Fischer Profielen Nv * Belgium 122. Fischer Profil GmbH Germany 123. Gamble Simms Metals Ltd. Ireland 124. Grant Lyon Eagre Ltd. uK 125. H E Samson Ltd. uK 126. Hadfields Holdings Ltd. uK 127. Hammermega Limited uK 128. Harrowmills Properties Ltd. uK 129. Hille & Muller GmbH Germany 130. Hille & Muller usa Inc. uSA 131. Holorib GmbH * Germany 132. Hoogovens (uK) Limited uK 133. Hoogovens Aluminium uK Limited uK 134. Hoogovens Finance B.v. Netherlands 135. Hoogovens Technical Services Mexico De S. De R.L. De C.v. Mexico
Name of the Party Country Name of the Party Country
Hundred and fifth annual report 2011-12
180
136. Hoogovens usa Inc. uSA 137. Huizenbezit “Breesaap” B.v. Netherlands 138. Ickles Cottage Trust uK 139. Immobilliere De Construction De Maubeuge Et Louvroil SAS France 140. Industrial Steels Limited uK 141. Inter Metal Distribution SAS France 142. Kalzip Asia Pte Limited Singapore 143. Kalzip GmbH Germany 144. Kalzip GmbH Austria 145. Kalzip Guanhzou Limited China 146. Kalzip Inc uSA 147. Kalzip Italy SRL Italy 148. Kalzip Limited uK 149. Kalzip Spain S.L.u. Spain 150. Layde Steel S.L. Spain 151. Lister Tubes Ltd. Ireland 152. London Works Steel Company Ltd. uK 153. Midland Steel Supplies Ltd. uK 154. Mistbury Investments Limited uK 155. Montana Bausysteme AG Switzerlnd 156. Myriad Deutschland GmbH Germany 157. Myriad Espana Sl Spain 158. Myriad Nederland B.v. Netherlands 159. Myriad SA France 160. Myriad united Kingdom Limited * uK 161. Namascor B.v. Netherlands 162. Nationwide Steelstock Limited uK 163. Oostflank B.v. Netherlands 164. Orb Electrical Steels Limited uK 165. Ore Carriers Ltd. uK 166. Oremco Inc. uSA 167. Plated Strip International Limited uK 168. Precoat International Limited uK 169. Precoat Limited uK 170. Rafferty-Brown Steel Co Inc Of Conn. uSA 171. Richard Thomas And Baldwins 1978. Limited New Zealand 172. Round Oak Steelworks Ltd. uK 173. Runblast Limited uK 174. Runmega Limited uK 175. S A B Profiel B.v. Netherlands 176. S A B Profil GmbH Germany 177. Sacra-Nord SAS France 178. Scrap Processing Holding B.v. Netherlands 179. Seamless Tubes Ltd. uK 180. Service Center Gelsenkirchen GmbH Germany 181. Service Centre Maastricht B.v. Netherlands 182. SIA Corus Building Systems Latvia 183. Simiop Investments Ltd. uK 184. Simiop Ltd. uK 185. Skruv Erik AB Sweden
186. Societe Europeenne De Galvanisation (Segal) Sa Belgium 187. Staalverwerking En Handel B.v. Netherlands 188. Stainless velsen-Noord Bv Netherlands 189. Steel StockHoldings Ltd. uK 190. Steelstock Ltd. uK 191. Stewarts & Lloyds Of Ireland Ltd. Ireland 192. Stewarts And Lloyds (Overseas) Ltd. uK 193. Stocksbridge Works Cottage Trust Limited uK 194. Stuwadoorsbedrijf velserkom B.v. Netherlands 195. Surahammar Bruks AB Sweden 196. Swinden Housing Association uK 197. Tata Steel Belgium Packaging Steels N.v. Belgium 198. Tata Steel Belgium Services N.v. Belgium 199. Tata Steel Europe Distribution Bv Netherlands 200. Tata Steel Europe Metals Trading Bv Netherlands 201. Tata Steel France Batiment et Systemes SAS France 202. Tata Steel France Rail SA France 203. Tata Steel Germany GmbH Germany 204. Tata Steel Hungary LLC Hungary 205. Tata Steel Ijmuiden Bv Netherlands 206. Tata Steel International (Americas) Holdings Inc uSA 207. Tata Steel International (Americas) Inc uSA 208. Tata Steel International (Australasia) Limited New Zealand 209. Tata Steel International (Benelux) Bv Netherlands 210. Tata Steel International (Canada) Holdings Inc Canada 211. Tata Steel International Czech (Czech Republic) S.R.O Republic 212. Tata Steel International (Denmark) A/S Denmark 213. Tata Steel International (Finland) OY Finland 214. Tata Steel International (France) SAS France 215. Tata Steel International (Germany) GmbH Germany 216. Tata Steel International Hellas SA Greece 217. Tata Steel International (Italia) SRL Italy 218. Tata Steel International (Middle East) FZE uAE 219. Tata Steel International (Nigeria) Ltd. Nigeria 220. Tata Steel International (North America) Ltd. uSA 221. Tata Steel International (Poland) sp Z.O.O. Poland 222. Tata Steel International (Schweiz) AG Switzerland 223. Tata Steel International (Sweden) AB Sweden 224. Tata Steel International (uK) Ltd. uK 225. Tata Steel International (India) Limited India 226. Tata Steel Istanbul Metal Sanayi ve Ticaret AS Turkey 227. Tata Steel Logistics and Shipping Bv Netherlands 228. Tata Steel Nederland Bv Netherlands 229. Tata Steel Nederland Consulting & Technical Services Bv Netherlands
Name of the Party Country Name of the Party Country
181
230. Tata Steel Nederland Investment Bv Netherlands 231. Tata Steel Nederland Perfo Bv Netherlands 232. Tata Steel Nederland Services Bv Netherlands 233. Tata Steel Nederland Star-Frame Bv Netherlands 234. Tata Steel Nederland Technology Bv Netherlands 235. Tata Steel Nederland Tubes Bv Netherlands 236. Tata Steel Netherlands Holdings B.v. Netherlands 237. Tata Steel uK Consulting Limited uK 238. Tata Steel uK Holdings Limited uK 239. Tata Steel uK Limited uK 240. Tata Steel uK Rail Consultancy Limited uK 241. Tata Steel usa Inc. uSA 242. The Newport And South Wales Tube Company Ltd. uK 243. The Stanton Housing Company Ltd. uK 244. The Steel Company Of Ireland Limited Ireland 245. The Templeborough Rolling Mills Ltd. uK 246. Thomas Processing Company uSA 247. Thomas Steel Strip Corp. uSA 248. Tinsley Trailers Limited uK 249. Toronto Industrial Fabrications Ltd. uK 250. Trierer Walzwerk GmbH Germany 251. Tulip Netherlands (No.1) B.v. * Netherlands 252. Tulip Netherlands (No.2) B.v. * Netherlands 253. Tulip uK Holdings (No.2) Ltd. uK 254. Tulip uK Holdings (No.3) Ltd. uK 255. Tuscaloosa Steel Corporation uSA 256. u.E.S. Bright Bar Limited uK 257. uK Steel Enterprise Ltd. uK 258. ukse Fund Managers (General Partner) Limited uK 259. ukse Fund Managers Limited uK 260. unitol SAS France 261. vlietjonge Bv Netherlands 262. Walker Manufacturing And Investments Ltd. uK 263. Walkersteelstock Ireland Limited Ireland 264. Walkersteelstock Ltd. uK 265. Westwood Steel Services Ltd. uK 266. Whitehead (Narrow Strip) Ltd. uK
v. Tata Steel global Minerals holdings Pte Ltd. Singapore 1. Al Rimal Mining LLC Oman 2. Black Ginger 461 (Proprietary) Ltd. South Africa 3. Kalimati Coal Company Pty. Ltd. Australia 4. Sedibeng Iron Ore Pty. Ltd. South Africa 5. Tata Steel Cote D’ Ivoire S.A Ivory Coast 6. Tata Steel Minerals uK Limited uK 7. Tata Steel Minerals Canada Limited Canada
vI. Tata Steel (Thailand) Public Company Ltd. Thailand 1. N.T.S. Steel Group Plc. Thailand 2. The Siam Construction Steel Co. Ltd. Thailand 3. The Siam Iron And Steel (2001) Co. Ltd. Thailand
vII. Tata Steel global Procurement Company Pte. Ltd. Singapore 1. ProCo Issuer Pte. Ltd. Singaporexvii) Tata Steel Processing And Distribution Limited Indiaxviii) TM international Logistics Limited India 1. International Shipping Logistics FZE uAE 2. TKM Global China Ltd. China 3. TKM Global GmbH Germany 4. TKM Global Logistics Limited India 5. TM Harbour Services Private Limited Indiaxix) Indian Steel & Wire Products Ltd. Indiaxx) The Tata Pigments Limited Indiaxxi) T M Mining Company Limited Indiaxxii) Jamshedpur Continuous Annealing & Processing Company Private Limited Indiaxxiii) The Tinplate Company of india Ltd. India
B. Joint Ventures of:i) Tata Steel Ltd. 1. Bhubaneshwar Power Private Limited India 2. Himalaya Steel Mill Services Private Limited India
3. mjunction services limited India 4. S & T Mining Company Private Limited India 5. Tata BlueScope Steel Limited India 6. Tata NYK Shipping Pte Ltd. Singapore 7. The Dhamra Port Company Limited India
ii) Tata Steel holdings Pte. Ltd. a) Tata Steel global holdings Pte Ltd. I. Tata Steel Europe Limited 1. Afon Tinplate Company Limited uK 2. Air Products Llanwern Limited uK 3. B v Ijzerleew Netherlands 4. Bsr Pipeline Services Limited uK 5. Caparo Merchant Bar Plc uK 6. Corus Cogifer Switches And Crossings Limited uK 7. Corus Kalpinis Simos Rom SRL. * Romania 8. Danieli Corus Technical Services B.v. Netherlands 9. Hks Scrap Metals B.v. Netherlands 10. Ijzerhandel Geertsema Staal B.v. Netherlands 11. Industrial Rail Services Ijmond B.v. Netherlands 12. Laura Metaal Holding B.v. Netherlands 13. Norsk Stal AS Norway 14. Norsk Stal Tynnplater AS Norway 15. Ravenscraig Limited uK 16. Tata Elastron SA Greece 17. Tata Elastron Steel Service Center SA Greece 18. Tata Steel Ticaret AS Turkey 19. Texturing Technology Limited uK 20. Redcar Bulk Terminal Limited uK
II. Tata Steel global Minerals holdings Pte. Ltd. 1. Rio Tinto Benga (Mauritius) Limited Mauritius
Name of the Party Country Name of the Party Country
Hundred and fifth annual report 2011-12
182
C. Associate through:i) Kalimati investment Company Ltd. India 1. Rujuvalika Investments Limitedii) NatSteel Asia Pte. Ltd. 1. Steel Asia Development and Management Corp. Philippines 2. Steel Asia Industries Inc. Philippines 3. Steel Asia Manufacturing Corporation Philippinesiii) Tata incorporated 1. TKM Overseas Limited India
v) Tata Steel Ltd. 1. Indian Steel Rolling Mills Ltd. India 2. Industrial Energy Limited India 3. Jamipol Limited India 4. Kalinga Aquatics Ltd. India 5. Kumardhubi Fireclay & Silica Works Ltd. India 6. Kumardhubi Metal Casting & Engineering Ltd. India 7. Nicco Jubilee Park Limited India 8. Strategic Energy Technology Systems Pvt. Limited India 9. Tata Construction & Projects Ltd. India 10. Tata Sponge Iron Limited India 11. TRL Krosaki Refractories Ltd. India 12. The Tinplate Company of India Ltd. India 13. TRF Limited India
vi) Tata Steel holdings Pte. Ltd. a) Tata Steel global holdings Pte Ltd. I. Tata Steel international (Singapore) holdings Pte. Ltd. 1. European Profiles Malaysia (M) Sdn.Bhd. Malaysia ii. Tata Steel Europe Limited 1. Ab Norskstal AS Norway 2. Albi Profils SRL France 3. Appleby Frodingham Cottage Trust Limited uK 4. Combulex B.v. Netherlands 5. Cv Gasexpansie Ijmond Netherlands 6. Danieli Corus Canada Inc. Canada 7. Danieli Corus Asia B.v. Netherlands 8. Danieli Corus B.v. Netherlands
Name of the Party Country Name of the Party Country
9. Danieli Corus Braseq Ltda. Brazil 10. Danieli Corus Construction Services B.v. Netherlands 11. Danieli Corus Construction Services usa Inc. uSA 12. Danieli Corus Do Brasil Ltda. Brazil 13. Danieli Corus Inc. uSA 14. Danieli Corus Services usa Inc. uSA 15. Danieli India (Pvt.) Ltd. India 16. European Profiles (Marketing) Sdn.Bhd. Malaysia 17. Galvpro LP. uSA 18. Gietwalsonderhoudcombinatie B.v. Netherlands 19. Hoogovens Court Roll Service Technologies vof: Netherlands 20. Hoogovens Gan Multimedia S.A. De C.v. Mexico 21. Isolation Du Sud SA France 22. Issb Limited uK 23. MDC Sublance Probe Technology Shanghai 24. Regionale Ontwikkelingsmaatschappij voor Het Noordzeekanaalgebied N.v. * Netherlands 25. Richard Lees Steel Decking Asia Snd. Bhd. Malaysia 26. Rsp Holding B.v. Netherlands 27. Schreiner Fleischer AS Norway 28. Shanghai Bao Yi Beverage Can Making Co. Ltd. China 29. SMS Mevac uK Limited * uK 30. Thoresen & Thorvaldsen AS Norway 31. Trico LLC uSA 32. Weirton/Hoogovens GP uSA 33. Wupperman Staal Nederland B.v. Netherlands III. Tata Steel global Minerals holdings Pte Ltd. 1. Riversdale Mining Ltd. * Australia 2. New Millennium Iron Corporation Canada
vii) The Indian Steel and Wire Products Ltd. 1. Metal Corporation of India Limited India
D. Promoters holding together with its subsidiary is more than 20% Tata Sons Ltd.
E. key Management Personnel – Whole-time director Mr. H. M. Nerurkar
* Part of the year. Earlier an associate, became subsidiary during the year. Earlier subsidiary, became an associate during the year. By virtue of management control.
183
` crores Transactions Subsidiaries Associates Key Relatives of Key Promoter Grand Total and Jvs Management Management Personnel Personnel
44. The Company has the following Joint ventures as on 31st March, 2012 and its proportionate share in the Assets, Liabilities, Income and Expenditure of the Joint venture Companies is given below:
` crores
As at 31.03.2012 2011-12
name of the Joint Venture Company Country of Percentage Contingent Capital Incorporation of holding Assets Liabilities Liabilities Commitment Income Expenditure
45. DERivATivE iNSTRuMENTS (a) The Company has entered into the following derivative instruments. All the swaps and forward contracts are accounted
for as per Accounting Policies stated in Note 1 annexed to Balance Sheet and Statement of Profit and Loss. (i) The Company uses foreign currency forward contracts to hedge its risks associated with foreign currency
fluctuations. The use of foreign currency forward contracts is governed by the Company’s strategy approved by the Board of Directors, which provide principles on the use of such forward contracts consistent with the Company’s Risk Management Policy. The Company does not use forward contracts for speculative purposes.
Outstanding Short-term Forward Exchange Contracts entered into by the Company on account of payables including forecast payables:
As at 31.03.2011 No. of contracts 64 57 uS Dollar equivalent (million) 527.15 297.23 INR equivalent (` crores) 2,682.12 1,325.52
(Forward exchange contracts outstanding include Forward Purchase of united States Dollars against Indian National Rupee for contracted imports).
Outstanding Short-term Forward Exchange Contracts entered into by the Company on account of receivables:
As at 31.03.2011 No. of contracts 3 22 uS Dollar equivalent (million) 3.96 830.93 INR equivalent (` crores) 20.14 3,704.70
Outstanding long-term forward exchange contracts entered into by the Company:
As at 31.03.2011 No. of contracts 27 29 5* 2* uS Dollar equivalent (million) 1,207.18 1,696.07 INR equivalent (` crores) 6,142.12 7,563.64
187
* represents outstanding long-term forward exchange contracts used to hedge currency risk of Euro and GBP against uSD. The corresponding uSD exposure has been disclosed under unhedged loans payable.
(Long-term Forward Exchange Contracts outstanding as on 31st March, 2012 have been used to hedge the foreign currency risk on repayment of External Commercial Borrowings and Export Credit Agency Borrowings of the Company).
(ii) The Company also uses derivative contracts other than forward contracts to hedge the interest rate and currency risk on its capital account. Such transactions are governed by the strategy approved by the Board of Directors which provides principles on the use of these instruments, consistent with the Company’s Risk Management Policy. The Company does not use these contracts for speculative purposes.
Outstanding Interest Rate Swaps to hedge against fluctuations in interest rate changes:
As at 31.03.2011 No. of contracts 8* 4 uS Dollar equivalent (million) 335.00 244.48 INR equivalent (` crores) 1,704.48 1,090.00
(* The above interest rate swap is part of full currency swap and the number of contract is also reflected in the outstanding long-term forward exchange contract as part of hedging the exchange risk).
(b) The year end foreign currency exposures that have not been hedged by a derivative instrument or otherwise are given below:
As at 31.03.2011 uS Dollar iNR US Dollar INR equivalent equivalent equivalent equivalent (million) (` crores) (million) (` crores) Amounts receivable in foreign currency on account of the following: (i) Loans receivable 96.52 490.98 101.28 451.54 (ii) Interest receivable 19.16 97.45 20.63 91.99 (iii) Bill Discounted and debtors outstanding 1.28 6.52 31.02 138.30 Amounts payable in foreign currency on account of the following: (i) Import of goods and services 119.77 609.41 67.64 301.62 (ii) Capital imports 105.68 537.70 35.92 160.20 (iii) Interest and commitment charges payable 23.78 121.01 20.04 89.35 (iv) Loans payable 1,543.84 7,855.08 1,593.75 7,107.33
46. The Board recommended dividend of ` 12 per Ordinary Share (2010-11: ` 12 per Ordinary Share) for the year ended 31st March, 2012. The dividend is subject to the approvals of the shareholders at the Annual General Meeting. The total dividend payout (including tax on dividend) works out to ` 1,347.03 crores (2010-11: ` 1,307.77 crores) for the company.
47. Previous year’s figures have been recast/restated where necessary.48. Figures in italics are in respect of the previous year.
A ANJENEYANCompany SecretaryMumbai, 18th May, 2012
For and on behalf of the BoardRATAN N TATA ChairmanB MuTHuRAMAN Vice ChairmanS M PALIA ISHAAT HuSSAINSuBODH BHARGAvA DirectorsJACOBuS SCHRAvENANDREW ROBBKARL-uLRICH KOEHLERH M NERuRKAR Managing Director
}
Hundred and fifth annual report 2011-12
188
Auditors’ Report on Consolidated Financial Statements
TO THE BOARD OF DIRECTORS OF TATA STEEL LIMITED
1. We have audited the attached Consolidated Balance Sheet of TATA STEEL LIMITED (“the Company”), its subsidiaries and jointly controlled entities (the Company, its subsidiaries and jointly controlled entities constitute “the Group”) as at 31 March, 2012, the Consolidated Statement of Profit and Loss and the Consolidated Cash Flow Statement of the Group for the year ended on that date, both annexed thereto. The Consolidated Financial Statements include investments in associates accounted on the equity method in accordance with Accounting Standard 23 (Accounting for Investments in Associates in Consolidated Financial Statements) and the jointly controlled entities accounted in accordance with Accounting Standard 27 (Financial Reporting of Interests in Joint Ventures) as notified under the Companies (Accounting Standards) Rules, 2006. These financial statements are the responsibility of the Company’s Management and have been prepared on the basis of the separate financial statements and other information regarding components. Our responsibility is to express an opinion on these Consolidated Financial Statements based on our audit.
2. We conducted our audit in accordance with the auditing standards generally accepted in India. Those Standards require that we plan and perform the audit to obtain reasonable assurance about whether the financial statements are free of material misstatement. An audit includes examining, on a test basis, evidence supporting the amounts and the disclosures in the financial statements. An audit also includes assessing the accounting principles used and the significant estimates made by the Management, as well as evaluating the overall financial statement presentation. We believe that our audit provides a reasonable basis for our opinion.
3. (a) Attention is invited to the Note 40(1) to the financial statements regarding accounting policy for recognition of actuarial valuation change of Rs. 2,372.26 crores (net of taxes) [Gross: Rs. 2,292.72 crores] in the pension and other post retirement benefit plans of Tata Steel Europe Limited, a subsidiary, for reasons specified therein. Had the Company followed the practice of recognizing actuarial valuation changes in the Statement of Profit and Loss, the deferred tax expenses would have been higher by Rs. 79.54 crores and the profit after taxes, minority interest and share of profits of associates would have been lower by Rs. 2,372.26 crores.
(b) i) The financial statements of overseas subsidiaries and of a jointly controlled entity whose financial statements reflect total assets of Rs. 43,700.95 crores as at 31 March, 2012, total revenue of Rs. 97,197.14 crores and net cash outflows amounting to Rs. 1,093.78 crores for the year ended on that date have been audited by auditors in the respective countries.
ii) The financial statements of certain subsidiaries and of a jointly controlled entity in India, whose financial statements reflect total assets of Rs. 610.26 crores as at 31 March, 2012, total revenue of Rs. 386.97 crores and net cash out flows amounting to Rs. 3.78 crores for the year ended on that date and in case of an associate in India having a carrying value of Rs. 72.44 crores as at 31 March, 2012 after accounting for the Company’s share of profit after tax of Rs. 1.37 crores for the year ended on that date, have been audited by other auditors.
The reports of those auditors have been furnished to us and our opinion in so far as it relates to the amounts included in respect of these subsidiaries and joint ventures is based solely on the reports of those auditors.
Tata Steel Limited and its Subsidiaries
189
(c) As stated in Note 1 to the financial statements, in the case of one associate having a carrying value of Rs. 3.19 crores as at 31 March, 2012 after accounting for the Company’s share of loss after tax of Rs. 3.35 crores for the year ended on that date, the figures used for the consolidation are based on the management’s estimates and are not audited by their auditors.
(d) As stated in Note 1 to the financial statements, in the case of one foreign associate, having a carrying value of Rs. 353.03 crores after accounting for the Company’s share of profit after tax of Rs. 15.19 crores, the financial statements as on 31 March, 2012 are not available and the figures used for consolidation are based on the financial statements up to 31 December, 2011 audited by their auditors. Further, in respect of investments in certain associates valued at Re. 1 each in the Financial Statements of the Company no adjustment have been made in the Consolidated Financial Statements as at 31 March, 2012 as the financial statements from these associates were not available.
4. We report that the Consolidated Financial Statements have been prepared by the Company in accordance with the requirements of Accounting Standard 21 (Consolidated Financial Statements), Accounting Standard 23 (Accounting for Investment in Associates in Consolidated Financial Statements) and Accounting Standard 27 (Financial Reporting of Interests in Joint Ventures) as notified under the Companies (Accounting Standards) Rules, 2006.
5. Based on our audit and on consideration of the separate audit reports on individual financial statements of the Company and the aforesaid subsidiaries, joint ventures and associates and to the best of our information and according to the explanations given to us and read with our comments in paragraph 3(a) to 3(d), in our opinion, the Consolidated Financial Statements give a true and fair view in conformity with the accounting principles generally accepted in India:
(i) in the case of the Consolidated Balance Sheet, of the state of affairs of the Group as at 31 March, 2012;
(ii) in the case of the Consolidated Statement of Profit and Loss, of the profit of the Group for the year ended on that date and
(iii) in the case of the Consolidated Cash Flow Statement, of the cash flows of the Group for the year ended on that date.
For DELOITTE HASkInS & SELLS Chartered Accountants (Registration No. 117366W)
N. VENkATRAMPartner(Membership No. 71387)
MuMBAI, 18 May, 2012
Hundred and fifth annual report 2011-12
190
As at 31.03.2011 Note Page ` crores ` crores Equity ANd LiAbiLitiEs (1) SHAREHOLDERS’ FuNDS 3 206 (a) Share Capital 971.41 958.74 4 207 (b) Reserves and surplus 42,049.71 34,426.97 (c) Money received against share warrants – 178.20 43,021.12 35,563.91 5 208 (2) PREFEREnCE SHARES ISSuED By SuBSIDIARy COMPAnIES 22.43 – (3) WARRAnTS ISSuED By A SuBSIDIARy COMPAny 17.46 17.46 6 209 (4) HyBRID PERPETuAL SECuRITIES 2,275.00 1,500.00 (5) MInORITy InTEREST 1,091.15 888.90 (6) nOn-CuRREnT LIABILITIES 7 209 (a) Long-term borrowings 45,238.24 49,250.69 8 210 (b) Deferred tax liabilities 2,503.85 2,188.18 9 210 (c) Other long-term liabilities 807.88 845.65 10 211 (d) Long-term provisions 4,715.05 4,585.05 53,265.02 56,869.57 (7) CuRRENT LIABILITIES 7 209 (a) Short-term borrowings 4,699.08 3,794.44 11 211 (b) Trade payables 20,617.86 18,457.48 12 211 (c) Other current liabilities 18,860.99 15,001.22 10 211 (d) Short-term provisions 3,370.05 3,395.25 47,547.98 40,648.39 1,47,240.16 1,35,488.23 AssEts (8) NON-CuRRENT ASSETS (a) Fixed assets 13 212 (i) Tangible assets 39,080.93 34,778.13 (ii) Capital work-in-progress 20,039.71 13,550.83 14 213 (iii) Intangible assets 2,851.33 1,789.50 (iv) Intangible assets under development 168.06 0.88 62,140.03 50,119.34 (b) Goodwill on consolidation 17,354.61 15,298.20 15 214 (c) Non-current investments 2,622.88 4,688.06 8 210 (d) Deferred tax assets 61.44 175.56 16 216 (e) Foreign currency monetary item translation difference account 404.90 – 17 216 (f) Long-term loans and advances 8,039.01 8,684.56 18 217 (g) Other non-current assets 39.39 33.55 90,662.26 78,999.27 (9) CuRRENT ASSETS 15 214 (a) Current investments 1,398.37 3,159.28 19 217 (b) Inventories 25,598.00 24,055.24 20 217 (c) Trade receivables 14,878.48 14,811.92 21 217 (d) Cash and bank balances 10,801.58 10,859.05 17 216 (e) Short-term loans and advances 3,868.73 3,547.18 22 218 (f) Other current assets 32.74 56.29 56,577.90 56,488.96 1,47,240.16 1,35,488.23 1-45 194 Notes to Consolidated Balance Sheet and Statement of Profit and Loss
Consolidated Balance Sheet as at 31st March, 2012
Tata Steel Limited and its Subsidiaries
A ANJENEYANCompany Secretary
In terms of our report attachedFor DELOITTE HASkInS & SELLS
Chartered Accountants,
N VENkATRAMPartner
Mumbai, 18th May, 2012
For and on behalf of the BoardRATAn n TATA ChairmanB MuTHuRAMAn Vice ChairmanS M PALIA ISHAAT HuSSAInSuBODH BHARGAVA DirectorsJACOBuS SCHRAVENAnDREW ROBBkARL-uLRICH kOEHLERH M nERuRkAR Managing Director
}
191
Previous Year Note Page ` crores ` crores (1) REvENuE 23 218 (a) Revenue from operations 1,35,975.56 1,21,345.75 Less: Excise duty 3,075.86 2,592.63 1,32,899.70 1,18,753.12 24 218 (b) Other Income 1,573.03 679.98 totAL REvENuE 1,34,472.73 1,19,433.10
(2) ExPENsEs (a) Raw materials consumed 45,457.54 38,748.58 (b) Purchase of finished, semi-finished and other products 21,073.43 15,890.40 (c) Changes in inventories of finished goods, work-in-progress and stock-in-trade (785.93) (1,355.98) 25 218 (d) Employee benefits expense 17,228.64 15,840.20 26 219 (e) Depreciation and amortisation expense 4,516.65 4,414.82 27 219 (f) Finance costs 4,250.11 3,955.78 28 219 (g) Other expenses 38,366.86 33,571.61 130,107.30 1,11,065.41 (h) Less: Expenditure (other than interest) transferred to capital and other accounts 857.63 688.36 totAL ExPENsEs 1,29,249.67 1,10,377.05 (3) PRofit bEfoRE tAx ANd ExcEPtioNAL itEms 5,223.06 9,056.05 29 220 (4) ExcEPtioNAL itEms (a) Profit on sale of non-current investments 3,361.92 735.69 (b) Restructuring, impairment and disposals – 2,310.21
3,361.92 3,045.90
(5) PRofit bEfoRE tAx 8,584.98 12,101.95 (6) tAx ExPENsE (a) Current tax 3,512.24 2,910.34 (b) Deferred tax 124.22 335.56 3,636.46 3,245.90 (7) PRofit AftER tAx 4,948.52 8,856.05 (8) miNoRity iNtEREst 173.14 60.28 (9) shARE of PRofits of AssociAtEs 268.11 66.36 (10) PRofit AftER tAx, miNoRity iNtEREst ANd shARE of PRofits of AssociAtEs 5,389.77 8,982.69
30 220 (11) bAsic EARNiNgs PER shARE (`) 54.28 99.03 30 220 (12) diLutEd EARNiNgs PER shARE (`) 53.63 92.86 1-45 194 Notes to Consolidated Balance Sheet and Statement of Profit and Loss
Consolidated Statement of Profit and Loss for the year ended 31st March, 2012
A ANJENEYANCompany Secretary
In terms of our report attachedFor DELOITTE HASkInS & SELLS
Chartered Accountants,
N VENkATRAMPartner
Mumbai, 18th May, 2012
For and on behalf of the BoardRATAn n TATA ChairmanB MuTHuRAMAn Vice ChairmanS M PALIA ISHAAT HuSSAInSuBODH BHARGAVA DirectorsJACOBuS SCHRAVENAnDREW ROBBkARL-uLRICH kOEHLERH M nERuRkAR Managing Director
}
Hundred and fifth annual report 2011-12
192
Year Ended 31.03.2011 ` crores ` croresA. cash flow from operating Activities: Profit before Tax, Minority Interest and Share of Profits of Associates 8,584.98 12,101.95 Adjustments for: Depreciation and amortisation expense 4,516.65 4,414.82 Income from non-current investments (90.89) (87.30) (Profit)/Loss on sale of non-current investments (3,368.44) (736.44) (Profit)/Loss on sale of assets/discarded assets written off 7.41 (100.38) Restructuring, impairment and disposal – (2,310.21) Interest and income from current investments (898.10) (437.00) Finance costs 4,250.11 3,955.78 (Gain)/Loss on cancellation of forwards, swaps and options 43.06 (54.55) Exchange (gain)/loss on revaluation of foreign currency loans and swaps 625.61 (277.44) Provision for wealth tax 1.80 1.36 Other non-cash expenditure 104.95 27.73 5,192.16 4,396.37Operating Profit before Working Capital Changes 13,777.14 16,498.32 Adjustments for: Trade and other receivables 888.71 (4,473.69) Inventories 407.72 (4,888.51) Trade payables and other liabilities (137.42) 1,611.42 1,159.01 (7,750.78)Cash Generated from Operations 14,936.15 8,747.54 Direct tax paid (3,652.37) (3,235.07) (3,652.37) (3,235.07)Net cash flow from operating Activities 11,283.78 5,512.47
b. cash flow from investing Activities: Purchase of fixed assets (2) (12,136.03) (9,588.39) Sale of fixed assets 177.39 252.43 Purchase of non-current investments (203.65) (1,393.14) Acquisition of subsidiaries/joint ventures/undertakings – (64.67) Disposal of subsidiaries/joint ventures/undertakings 721.47 2,878.01 Sale of non-current investments 5,136.75 1,049.95 (Purchase)/sale of current investments (net) 2,193.38 (1,069.89) Inter-corporate deposits (net) (175.00) – Interest/Income from current investments received 492.13 245.56 Dividend received 127.26 106.20Net cash flow from investing Activities (3,666.30) (7,583.94)
Consolidated Cash Flow Statement for the year ended 31st March, 2012
193
c. cash flow from financing Activities: Issue of equity share capital 534.60 4,368.01 Proceeds from sale of cross holdings 31.22 – Issue of Preference Shares 20.00 – Issue of Share Warrants – 178.20 Capital contributions received 35.43 10.60 Proceeds from issue of Hybrid Perpetual Securities 775.00 1,500.00 Proceeds from borrowings 18,826.75 39,429.75 Repayment of borrowings (23,549.04) (34,138.84) Amount received/(paid) on cancellation of forward, swaps and options (32.96) 38.62 Distribution on Hybrid Perpetual Securities (222.47) – Expenses on issue of equity instruments (16.79) (98.52) Interest paid (2) (3,542.12) (4,598.52) Dividend paid (1,163.94) (716.21)Net cash flow from financing Activities (8,304.32) 5,973.09Net Increase/(decrease) in cash and cash equivalents (A + B + C) (686.84) 3,901.62Opening Cash and Cash equivalents (3) 10,805.77 6,769.73 (As per Note 21, Page 217)Effect of exchange rate on translation of foreign currency cash and bank balances 633.87 142.92Closing Cash and Cash equivalents 10,752.80 10,814.27(As per Note 21, Page 217)
Additional information:(1) Figures in brackets represent outflows.(2) Interest paid is exclusive of and purchase of fixed assets is inclusive of interest capitalised ` 336.22 crores (2010-11: ` 219.63 crores).(3) Includes ̀ 2.59 crores of opening cash and cash equivalents in the books of The Tinplate Company of India Ltd. which became a subsidiary
during the year and excludes ` 11.09 crores in the books of TRL krosaki Refractories Ltd. which became an associate during the year.(4) Previous years figures have been recast/restated where necessary.
Year Ended 31.03.2011 ` crores ` crores
A ANJENEYANCompany Secretary
In terms of our report attachedFor DELOITTE HASkInS & SELLS
Chartered Accountants,
N VENkATRAMPartner
Mumbai, 18th May, 2012
For and on behalf of the BoardRATAn n TATA ChairmanB MuTHuRAMAn Vice ChairmannuSLI n WADIAJAMSHED J IRANIS M PALIA ISHAAT HuSSAInSuBODH BHARGAVA Directors
JACOBuS SCHRAVENAnDREW ROBBkIRBy ADAMSH M nERuRkAR Managing Director
}
Consolidated Cash Flow Statement for the year ended 31st March, 2012
A ANJENEYANCompany Secretary
In terms of our report attachedFor DELOITTE HASkInS & SELLS
Chartered Accountants,
N VENkATRAMPartner
Mumbai, 18th May, 2012
For and on behalf of the BoardRATAn n TATA ChairmanB MuTHuRAMAn Vice ChairmanS M PALIA ISHAAT HuSSAInSuBODH BHARGAVA DirectorsJACOBuS SCHRAVENAnDREW ROBBkARL-uLRICH kOEHLERH M nERuRkAR Managing Director
}
Hundred and fifth annual report 2011-12
194
1. PRiNciPLEs of coNsoLidAtioN: The Consolidated Financial Statements consist of Tata Steel Limited (“the Company”) and its subsidiary companies. The
Consolidated Financial Statements have been prepared on the following basis: — The financial statements of the Company and its subsidiary companies have been combined on a line-by-line basis by
adding together the book values of like items of assets, liabilities, income and expenses, after fully eliminating intra-group balances and intra-group transactions resulting in unrealised profits or losses as per Accounting Standard 21 – "Consolidated Financial Statements" notified by Companies (Accounting Standards) Rules, 2006.
— In case of foreign subsidiaries, being non-integral operations, revenue items are consolidated at the average rate prevailing during the year. All assets and liabilities are converted at the rates prevailing at the end of the year. Any exchange difference arising on consolidation is recognised in the foreign currency translation reserve.
— The difference between the cost of investment in the subsidiaries and joint ventures, and the Company's share of net assets at the time of acquisition of shares in the subsidiaries and joint ventures is recoginised in the financial statements as Goodwill or Capital Reserve as the case may be.
— Minority Interest in the net assets of consolidated subsidiaries is identified and presented in the consolidated balance sheet separately from liabilities and equity of the Company's shareholders.
Minority interest in the net assets of consolidated subsidiaries consists of: a) The amount of equity attributable to minority at the date on which investment in a subsidiary is made; and b) The minority share of movements in equity since the date the parent subsidiary relationship came into existence. — Minority interest’s share of net profit for the year of consolidated subsidiaries is identified and adjusted against the profit after
tax of the group. — Investment in associates where the Company directly or indirectly through subsidiaries holds more than 20% of equity, are
accounted for using equity method as per Accounting Standard 23 – "Accounting for Investments in Associates in Consolidated Financial Statements" notified by Companies (Accounting Standards) Rules, 2006.
— The Company accounts for its share of post acquisition changes in net assets of associates, after eliminating unrealised profits and losses resulting from transactions between the Company and its associates to the extent of its share, through its Statement of Profit and Loss, to the extent such change is attributable to the associates' Statement of Profit and Loss and through its reserves for the balance based on available information.
— The difference between the cost of investment in the associates and the Company's share of net assets at the time of acquisition of share in the associates is identified in the financial statements as Goodwill or Capital Reserve as the case may be.
— Interests in Joint Ventures have been accounted by using the proportionate consolidation method as per Accounting Standard 27 – "Financial Reporting of Interests in Joint Ventures" notified by Companies (Accounting Standards) Rules, 2006.
— The financial statements of the subsidiaries, associates and joint ventures used in the consolidation are drawn up to the same reporting date as that of the Company i.e. 31st March, 2012, except for certain associates (indicated as $ below) for which financial statements as on reporting date are not available. These have been consolidated based on latest available financial statements.
— In the absence of financial statements as on the reporting date for certain associates (indicated as # below), no adjustment has been made in the consolidated financial statements. These investments are carried at ` 1 in the financial statements.
— unaudited financial statement of Orchid Netherlands (No. 1) B.V. being a subsidiary and Strategic Energy Technology Systems Pvt. Limited, being an associate have been considered for consolidation.
The list of subsidiary companies, joint ventures and associates which are included in the consolidation and the Company’s holdings therein are as under:
Name of the Company Ownership in % either directly Country of or through Subsidiaries@ incorporation 2011-12 2010-11 A. Subsidiaries: i) Adityapur Toll Bridge Company Limited 73.63 73.63 India ii) Centennial Steel Company Ltd.* – 100.00 India iii) Gopalpur Special Economic Zone Limited 100.00 100.00 India iv) Jamshedpur Utilities & Services Company Limited 100.00 100.00 India 1. Haldia Water Management Limited 60.00 60.00 India 2. Naba Diganta Water Management Limited 74.00 74.00 India 3. SEZ Adityapur Limited 51.00 51.00 India
Notes to CoNsolidated BalaNCe sheet aNd statemeNt of Profit aNd loss
195
v) Kalimati Investment Company Ltd. 100.00 100.00 India 1. Bangla Steel & Mining Co. Ltd. 100.00 100.00 Bangladesh vi) Lanka Special Steels Ltd. 100.00 100.00 Sri Lanka vii) NatSteel Asia Pte. Ltd. 100.00 100.00 Singapore 1. Tata Steel Asia (Hong kong) Ltd. 100.00 100.00 Hongkong S.A.R 2. Tata Steel Resources Australia Pty. Ltd. 100.00 100.00 Australia viii) Sila Eastern Ltd. 49.00 49.00 Thailand ix) T S Alloys Limited 100.00 100.00 India x) Tata Incorporated 100.00 100.00 uSA xi) Tata Korf Engineering Services Ltd. 100.00 100.00 India xii) Tata Metaliks Ltd. 50.09 50.04 India 1. Tata Metaliks kubota Pipes Limited 51.17 51.00 India xiii) TRL Krosaki Refractories Limited – 77.46 India 1. TRL Asia Private Ltd. * – 88.00 Singapore 2. TRL China Ltd. * – 100.00 China xiv) Tayo Rolls Limited 54.45 54.45 India xv) Tata Steel (KZN) (Pty) Ltd. 90.00 90.00 South Africa xvi) Tata Steel Holdings Pte. Ltd. 100.00 100.00 Singapore 1. Tata Steel Global Holdings Pte. Ltd. 100.00 100.00 Singapore I. Orchid Netherlands (No.1) B.V. 100.00 100.00 netherlands II. NatSteel Holdings Pte. Ltd. 100.00 100.00 Singapore 1. Best Bar Pty. Ltd. 71.00 71.00 Australia 2. Best Bar (VIC) Pte. Ltd. 71.00 71.00 Australia 3. Burwill Trading Pte. Ltd. 100.00 100.00 Singapore 4. Easteel Construction Services Pte. Ltd. 100.00 100.00 Singapore 5. Easteel Services (M) Sdn. Bhd. 100.00 100.00 Malaysia 6. Eastern Steel Fabricators Phillipines, Inc. 67.00 67.00 Phillipines 7. Eastern Steel Services Pte. Ltd. 100.00 100.00 Singapore 8. Eastern Wire Pte. Ltd. 100.00 100.00 Singapore 9. Materials Recycling Pte. Ltd. * – 100.00 Singapore 10. natSteel (Xiamen) Ltd. 100.00 100.00 China 11. natSteel Asia (S) Pte. Ltd. 100.00 100.00 Singapore 12. natSteel Australia Pty. Ltd. 100.00 100.00 Australia 13. NatSteel Equity IV Pte. Ltd. 100.00 100.00 Singapore 14. NatSteel Recycling Pte Ltd. 100.00 100.00 Singapore 15. NatSteel Trade International (Shanghai) Company Ltd. 100.00 100.00 China 16. NatSteel Trade International Pte. Ltd. 100.00 100.00 Singapore 17. NatSteel Vina Co. Ltd. 56.50 56.50 Vietnam 18. PT Materials Recycling Indonesia 100.00 100.00 Indonesia 19. The Siam Industrial Wire Company Ltd. 100.00 100.00 Thailand 20. Wuxi Jinyang Metal Products Co. Ltd. 95.00 95.00 China III. Tata Steel Europe Limited 100.00 100.00 uk 1. Almana Steel Dubai (Jersey) Limited 100.00 100.00 Jersey 2. Apollo Metals Ltd. 100.00 100.00 uSA 3. Ashorne Hill Management College 100.00 100.00 uk 4. Augusta Grundstucks GmbH 100.00 100.00 Germany 5. Automotive Laser Technologies Limited 100.00 100.00 uk 6. B S Pension Fund Trustee Ltd. 100.00 100.00 uk
Name of the Company Ownership in % either directly Country of or through Subsidiaries@ incorporation 2011-12 2010-11
Hundred and fifth annual report 2011-12
196
7. Bailey Steels Limited 100.00 100.00 uk 8. Beheermaatschappij Industriele Produkten B.V. 100.00 100.00 netherlands 9. Belfin Beheermaatschappij B.V. 100.00 100.00 netherlands 10. Bell & Harwood Limited 100.00 100.00 uk 11. Blastmega Limited 100.00 100.00 uk 12. Blume Stahlservice GmbH 100.00 100.00 Germany 13. Blume Stahlservice Polska Sp.Z.O.O 100.00 100.00 Poland 14. Bore Samson Group Ltd. 100.00 100.00 uk 15. Bore Steel Ltd. 100.00 100.00 uk 16. British Guide Rails Ltd. 100.00 100.00 uk 17. British Steel Corporation Ltd. 100.00 100.00 uk 18. British Steel De Mexico S.A. de C.V. 100.00 100.00 Mexico 19. British Steel Directors (Nominees) Limited 100.00 100.00 uk 20. British Steel Employee Share Ownership Trustees Ltd. 100.00 100.00 uk 21. British Steel Engineering Steels (Exports) Limited 100.00 100.00 uk 22. British Steel Holdings B.V. * – 100.00 netherlands 23. British Steel International B.V. * – 100.00 netherlands 24. British Steel Nederland International B.V. 100.00 100.00 netherlands 25. British Steel Samson Limited 100.00 100.00 uk 26. British Steel Service Centres Ltd. 100.00 100.00 uk 27. British Steel Tubes Exports Ltd. 100.00 100.00 uk 28. British Transformer Cores Ltd. * – 100.00 uk 29. British Tubes Stockholding Ltd. 100.00 100.00 uk 30. Bs Quest Trustee Limited 100.00 100.00 uk 31. Bskh Corporate Services (uk) Limited * – 100.00 uk 32. Burgdorfer Grundstuecks GmbH 100.00 100.00 Germany 33. C V Benine 76.92 76.92 netherlands 34. C Walker & Sons Ltd. 100.00 100.00 uk 35. Catnic GmbH 100.00 100.00 Germany 36. Catnic Limited 100.00 100.00 uk 37. Cbs Investissements SAS 100.00 100.00 France 38. Cladding & Decking (uk) Limited 100.00 100.00 uk 39. Cogent Power Inc. 100.00 100.00 Canada 40. Cogent Power Inc. 100.00 100.00 Mexico 41. Cogent Power Inc. 100.00 100.00 uSA 42. Cogent Power Limited 100.00 100.00 uk 43. Cold drawn Tubes Ltd. 100.00 100.00 uk 44. Color Steels Limited 100.00 100.00 uk 45. Corbeil Les Rives SCI 67.30 67.30 France 46. Corby (Northants) & District Water Co. 100.00 100.00 uk 47. Cordor (C& B) Limited 100.00 100.00 uk 48. Corus Aerospace Service Centre Suzhou Co Ltd. 100.00 100.00 China 49. Corus Aluminium Limited * – 100.00 uk 50. Corus Aluminium Verwaltungsgesellschaft Mbh 100.00 100.00 Germany 51. Corus Beteiligungs GmbH 100.00 100.00 Germany 52. Corus Brokers Limited * – 100.00 uk 53. Corus Building Systems Bulgaria AD 100.00 100.00 Bulgaria 54. Corus Building Systems N.V. 100.00 100.00 Belgium 55 Corus Building Systems SAS 100.00 100.00 France 56. Corus Byggesystemer A/S 100.00 100.00 Denmark 57. Corus Byggsystem AB 100.00 100.00 Sweden 58. Corus Byggsystemer A/S 100.00 100.00 Norway 59. Corus CNBV Investments 100.00 100.00 uk 60. Corus Coatings usa Inc. 100.00 100.00 uSA
Name of the Company Ownership in % either directly Country of or through Subsidiaries@ incorporation 2011-12 2010-11
197
61. Corus Cold drawn Tubes Limited 100.00 100.00 uk 62. Corus Consulting B.V. 100.00 100.00 netherlands 63. Corus Electrical Limited * – 100.00 uk 64. Corus Engineering Limited * – 100.00 uk 65. Corus Engineering Steels (uk) Limited 100.00 100.00 uk 66. Corus Engineering Steels Holdings Limited 100.00 100.00 uk 67. Corus Engineering Steels Limited 100.00 100.00 uk 68. Corus Engineering Steels Overseas Holdings Limited 100.00 100.00 uk 69. Corus Finance Limited 100.00 100.00 uk 70. Corus Group Limited 100.00 100.00 uk 71. Corus Holdings Ltd. 100.00 100.00 uk 72. Corus Holdings SA * – 100.00 France 73. Corus India Ltd. 100.00 100.00 India 74. Corus International (Overseas Holdings) Limited 100.00 100.00 uk 75. Corus International Bulgaria Limited 100.00 100.00 Bulgaria 76. Corus International Limited 100.00 100.00 uk 77. Corus International Representacoes Do Brasil Ltda. 100.00 100.00 Brazil 78. Corus International Romania SRL. 100.00 100.00 Romania 79. Corus Investments Ltd. 100.00 100.00 uk 80. Corus Ireland Ltd. 100.00 100.00 Ireland 81. Corus Large Diameter Pipes Limited 100.00 100.00 uk 82. Corus Liaison Services (India) Limited 100.00 100.00 uk 83. Corus Management Limited 100.00 100.00 uk 84. Corus Metal Iberica S.A 100.00 100.00 Spain 85. Corus Metals Limited * – 100.00 uk 86. Corus Multi-Metals Limited * – 100.00 uk 87. Corus Norge A/S 100.00 100.00 Norway 88. Corus Packaging Plus Norway AS 100.00 100.00 Norway 89. Corus Primary Aluminium B.V. 100.00 100.00 netherlands 90. Corus Properties (Germany) Limited 100.00 100.00 uk 91. Corus Property 100.00 100.00 uk 92. Corus Quest Trustee Limited * – 100.00 uk 93. Corus Rail Limited * – 100.00 uk 94. Corus Republic Of Ireland Subsidiaries Pension Scheme Trustee Limited 100.00 100.00 Ireland 95. Corus Service Center Milano Spa 100.00 100.00 Italy 96. Corus Service Centre Limited 100.00 100.00 n Ireland 97. Corus Sheet & Tube Inc. 100.00 100.00 uSA 98. Corus Stainless Limited * – 100.00 uk 99. Corus Stainless uk Ltd. * – 100.00 uk 100. Corus Steel Limited * – 100.00 uk 101. Corus Steel Service STP LLC 100.00 100.00 Russia 102. Corus Trico Holdings Inc. 100.00 100.00 uSA 103. Corus Tubes Poland Spolka Z.O.O 100.00 100.00 Poland 104. Corus uk Healthcare Trustee Limited 100.00 100.00 uk 105. Corus ukraine LLC 100.00 100.00 ukraine 106. Cpn (85) Limited 100.00 100.00 uk 107. Crucible Insurance Company Ltd. 100.00 100.00 I of Man 108. Degels GmbH 100.00 100.00 Germany 109. Demka B.V. 100.00 100.00 netherlands 110. Dsrm Group Plc. 100.00 100.00 uk 111. Ees Group Services Limited 100.00 100.00 uk 112. EES Nederland B.V. * – 100.00 netherlands 113. Eric Olsson & Soner Forvaltnings AB 100.00 100.00 Sweden
Name of the Company Ownership in % either directly Country of or through Subsidiaries@ incorporation 2011-12 2010-11
Hundred and fifth annual report 2011-12
198
114. Esmil B.V. 100.00 100.00 netherlands 115. Euro-Laminations Limited 100.00 100.00 uk 116. European Electrical Steels Limited * – 100.00 uk 117. Europressings Limited 100.00 100.00 uk 118. Firsteel Group Limited 100.00 100.00 uk 119. Firsteel Holdings Limited 100.00 100.00 uk 120. Firsteel Strip Mill Products Limited 100.00 100.00 uk 121. Fischer Profielen NV * – 100.00 Belgium 122. Fischer Profil GmbH 100.00 100.00 Germany 123. Gamble Simms Metals Ltd. 100.00 100.00 Ireland 124. Grant Lyon Eagre Ltd. 100.00 100.00 uk 125. H E Samson Ltd. 100.00 100.00 uk 126. Hadfields Holdings Ltd. 62.50 62.50 uk 127. Hammermega Limited 100.00 100.00 uk 128. Harrowmills Properties Ltd. 100.00 100.00 uk 129. Hille & Muller GmbH 100.00 100.00 Germany 130. Hille & Muller usa Inc. 100.00 100.00 uSA 131. Holorib GmbH * – 100.00 Germany 132. Hoogovens (uk) Limited 100.00 100.00 uk 133. Hoogovens Aluminium uk Limited 100.00 100.00 uk 134. Hoogovens Finance B.V. 100.00 100.00 netherlands 135. Hoogovens Technical Services Mexico De S. De R.L. De C.V. 100.00 100.00 Mexico 136. Hoogovens usa Inc. 100.00 100.00 uSA 137. Huizenbezit “Breesaap” B.V. 100.00 100.00 netherlands 138. Ickles Cottage Trust 100.00 100.00 uk 139. Immobilliere De Construction De Maubeuge Et Louvroil SAS 100.00 100.00 France 140. Industrial Steels Limited 100.00 100.00 uk 141. Inter Metal Distribution SAS 100.00 100.00 France 142. kalzip Asia Pte Limited 100.00 100.00 Singapore 143. kalzip GmbH 100.00 100.00 Germany 144. kalzip GmbH 100.00 100.00 Austria 145. kalzip Guanhzou Limited 100.00 100.00 China 146. kalzip Inc. 100.00 100.00 uSA 147. kalzip Italy SRL 100.00 100.00 Italy 148. kalzip Limited 100.00 100.00 uk 149. kalzip Spain S.L.u. 100.00 100.00 Spain 150. Layde Steel S.L. 100.00 100.00 Spain 151. Lister Tubes Ltd. 100.00 100.00 Ireland 152. London Works Steel Company Ltd. 100.00 100.00 uk 153. Midland Steel Supplies Ltd. 100.00 100.00 uk 154. Mistbury Investments Limited 100.00 100.00 uk 155. Montana Bausysteme AG 100.00 100.00 Switzerland 156. Myriad Deutschland GmbH 100.00 100.00 Germany 157. Myriad Espana Sl 100.00 100.00 Spain 158. Myriad Nederland B.V. 100.00 100.00 netherlands 159. Myriad SA 100.00 100.00 France 160. Myriad united kingdom Limited * – 100.00 uk 161. Namascor B.V. 100.00 100.00 netherlands 162. Nationwide Steelstock Limited 100.00 100.00 uk 163. Oostflank B.V. 100.00 100.00 netherlands 164. Orb Electrical Steels Limited 100.00 100.00 uk 165. Ore Carriers Ltd. 100.00 100.00 uk
Name of the Company Ownership in % either directly Country of or through Subsidiaries@ incorporation 2011-12 2010-11
199
166. Oremco Inc. 100.00 100.00 uSA 167. Plated Strip International Limited 100.00 100.00 uk 168. Precoat International Limited 100.00 100.00 uk 169. Precoat Limited 100.00 100.00 uk 170. Rafferty-Brown Steel Co Inc Of Conn. 100.00 100.00 uSA 171. Richard Thomas And Baldwins 1978 Limited 100.00 100.00 New Zealand 172. Round Oak Steelworks Ltd. 100.00 100.00 uk 173. Runblast Limited 100.00 100.00 uk 174. Runmega Limited 100.00 100.00 uk 175. S A B Profiel B.V. 100.00 100.00 netherlands 176. S A B Profil GmbH 100.00 100.00 Germany 177. Sacra-Nord SAS 100.00 100.00 France 178. Scrap Processing Holding B.V. 100.00 100.00 netherlands 179. Seamless Tubes Ltd. 100.00 100.00 uk 180. Service Center Gelsenkirchen GmbH 100.00 100.00 Germany 181. Service Centre Maastricht B.V. 100.00 100.00 netherlands 182. SIA Corus Building Systems 100.00 100.00 Latvia 183. Simiop Investments Ltd. 100.00 100.00 uk 184. Simiop Ltd. 100.00 100.00 uk 185. Skruv Erik AB 100.00 100.00 Sweden 186. Societe Europeenne De Galvanisation (Segal) Sa 100.00 100.00 Belgium 187. Staalverwerking En Handel B.V. 100.00 100.00 netherlands 188. Stainless Velsen-Noord BV 100.00 100.00 netherlands 189. Steel StockHoldings Ltd. 100.00 100.00 uk 190. Steelstock Ltd. 100.00 100.00 uk 191. Stewarts & Lloyds Of Ireland Ltd. 100.00 100.00 Ireland 192. Stewarts And Lloyds (Overseas) Ltd. 100.00 100.00 uk 193. Stocksbridge Works Cottage Trust Limited 100.00 100.00 uk 194. Stuwadoorsbedrijf Velserkom B.V. 100.00 100.00 netherlands 195. Surahammar Bruks AB 100.00 100.00 Sweden 196. Swinden Housing Association 100.00 100.00 uk 197. Tata Steel Belgium Packaging Steels N.V. 100.00 100.00 Belgium 198. Tata Steel Belgium Services N.V. 100.00 100.00 Belgium 199. Tata Steel Europe Distribution BV 100.00 100.00 netherlands 200. Tata Steel Europe Metals Trading BV 100.00 100.00 netherlands 201. Tata Steel France Batiment et Systemes SAS 100.00 100.00 France 202. Tata Steel France Rail SA 100.00 100.00 France 203. Tata Steel Germany GmbH 100.00 100.00 Germany 204. Tata Steel Hungary LLC 100.00 100.00 Hungary 205. Tata Steel Ijmuiden BV 100.00 100.00 netherlands 206. Tata Steel International (Americas) Holdings Inc 100.00 100.00 uSA 207. Tata Steel International (Americas) Inc 100.00 100.00 uSA 208. Tata Steel International (Australasia) Limited 100.00 100.00 New Zealand 209. Tata Steel International (Benelux) BV 100.00 100.00 netherlands 210. Tata Steel International (Canada) Holdings Inc 100.00 100.00 Canada 211. Tata Steel International (Czech Republic) S.R.O 100.00 100.00 Czech Republic 212. Tata Steel International (Denmark) A/S 100.00 100.00 Denmark 213. Tata Steel International (Finland) Oy 100.00 100.00 Finland 214. Tata Steel International (France) SAS 100.00 100.00 France 215. Tata Steel International (Germany) GmbH 100.00 100.00 Germany 216. Tata Steel International Hellas SA 100.00 100.00 Greece 217. Tata Steel International (Italia) SRL 100.00 100.00 Italy 218. Tata Steel International (Middle East) FZE 100.00 100.00 uAE
Name of the Company Ownership in % either directly Country of or through Subsidiaries@ incorporation 2011-12 2010-11
Hundred and fifth annual report 2011-12
200
219. Tata Steel International (Nigeria) Ltd. 100.00 100.00 Nigeria 220. Tata Steel International (north America) Ltd. 100.00 100.00 uSA 221. Tata Steel International (Poland) Sp. Z.O.O. 100.00 100.00 Poland 222. Tata Steel International (Schweiz) AG 100.00 100.00 Switzerland 223. Tata Steel International (Sweden) AB 100.00 100.00 Sweden 224. Tata Steel International (uk) Ltd. 100.00 100.00 uk 225. Tata Steel International (India) Limited 100.00 100.00 India 226. Tata Steel Istanbul Metal Sanayi ve Ticaret AS 88.00 88.00 Turkey 227. Tata Steel Logistics and Shipping BV 100.00 100.00 netherlands 228. Tata Steel Nederland BV 100.00 100.00 netherlands 229. Tata Steel Nederland Consulting & Technical Services BV 100.00 100.00 netherlands 230. Tata Steel Nederland Investment BV 100.00 100.00 netherlands 231. Tata Steel Nederland Perfo BV 100.00 100.00 netherlands 232. Tata Steel Nederland Services BV 100.00 100.00 netherlands 233. Tata Steel Nederland Star-Frame BV 100.00 100.00 netherlands 234. Tata Steel Nederland Technology BV 100.00 100.00 netherlands 235. Tata Steel Nederland Tubes BV 100.00 100.00 netherlands 236. Tata Steel Netherlands Holdings B.V. 100.00 100.00 netherlands 237. Tata Steel uk Consulting Limited 100.00 100.00 uk 238. Tata Steel uk Holdings Limited 100.00 100.00 uk 239. Tata Steel uk Limited 100.00 100.00 uk 240. Tata Steel uk Rail Consultancy Limited 100.00 100.00 uk 241. Tata Steel usa Inc. 100.00 100.00 uSA 242. The Newport And South Wales Tube Company Ltd. 100.00 100.00 uk 243. The Stanton Housing Company Ltd. 100.00 100.00 uk 244. The Steel Company Of Ireland Limited 100.00 100.00 Ireland 245. The Templeborough Rolling Mills Ltd. 100.00 100.00 uk 246. Thomas Processing Company 100.00 100.00 uSA 247. Thomas Steel Strip Corp. 100.00 100.00 uSA 248. Tinsley Trailers Limited 100.00 100.00 uk 249. Toronto Industrial Fabrications Ltd. 100.00 100.00 uk 250. Trierer Walzwerk GmbH 100.00 100.00 Germany 251. Tulip Netherlands (No.1) B.V. * – 100.00 netherlands 252. Tulip Netherlands (No.2) B.V. * – 100.00 netherlands 253. Tulip uk Holdings (No.2) Ltd. 100.00 100.00 uk 254. Tulip uk Holdings (No.3) Ltd. 100.00 100.00 uk 255. Tuscaloosa Steel Corporation 100.00 100.00 uSA 256. u.E.S. Bright Bar Limited 100.00 100.00 uk 257. uk Steel Enterprise Ltd. 100.00 100.00 uk 258. ukse Fund Managers (General Partner) Limited 100.00 100.00 uk 259. ukse Fund Managers Limited 100.00 100.00 uk 260. unitol SAS 100.00 100.00 France 261. Vlietjonge BV 100.00 100.00 netherlands 262. Walker Manufacturing And Investments Ltd. 100.00 100.00 uk 263. Walkersteelstock Ireland Limited 100.00 100.00 Ireland 264. Walkersteelstock Ltd. 100.00 100.00 uk 265. Westwood Steel Services Ltd. 100.00 100.00 uk 266. Whitehead (Narrow Strip) Ltd. 100.00 100.00 uk IV. Tata Steel Global Minerals Holdings Pte Ltd. 100.00 100.00 Singapore 1. Al Rimal Mining LLC 70.00 70.00 Oman 2. Black Ginger 461 (Proprietary) Ltd. 100.00 100.00 South Africa 3. kalimati Coal Company Pty. Ltd. 100.00 100.00 Australia 4. Sedibeng Iron Ore Pty. Ltd. 64.00 64.00 South Africa
Name of the Company Ownership in % either directly Country of or through Subsidiaries@ incorporation 2011-12 2010-11
201
5. Tata Steel Cote D’ Ivoire S.A 85.00 85.00 Ivory Coast 6. Tata Steel Minerals uk Limited 100.00 100.00 uk 7. Tata Steel Minerals Canada Limited 80.00 80.00 Canada V. Tata Steel International (Singapore) Holdings Pte. Ltd. 100.00 100.00 Singapore 1. TSIA Holdings (Thailand) Limited 49.55 49.55 Thailand 2. Tata Steel International (Guangzhou) Ltd. 100.00 100.00 China 3. Tata Steel International (Shanghai) Ltd. 100.00 100.00 China 4. Tata Steel International (Malaysia) Sdn. Bhd. 100.00 100.00 Malaysia 5. Tata Steel International (Thailand) Limited 74.27 74.27 Thailand 6. Tata Steel International (Singapore) Pte. Ltd. 100.00 100.00 Singapore 7. Tata Steel international (Asia) Limited 100.00 100.00 Hongkong S.A.R 8. Tata Steel International (Hongkong) Limited 100.00 100.00 Hongkong S.A.R VI. Tata Steel (Thailand) Public Company Ltd. 67.90 67.90 Thailand 1. n.T.S. Steel Group Plc. 99.66 99.66 Thailand 2. The Siam Construction Steel Co. Ltd. 99.99 99.99 Thailand 3. The Siam Iron And Steel (2001) Co. Ltd. 99.99 99.99 Thailand VII. Tata Steel Global Procurement Company Pte. Ltd. 100.00 100.00 Singapore 1. ProCo Issuer Pte. Ltd. 100.00 100.00 Singapore xvii) Tata Steel Processing and Distribution Limited 100.00 100.00 India xviii) TM International Logistics Limited 51.00 51.00 India 1. International Shipping Logistics FZE 100.00 100.00 uAE 2. TkM Global China Ltd. 100.00 100.00 China 3. TkM Global GmbH 100.00 100.00 Germany 4. TkM Global Logistics Limited 100.00 100.00 India 5. TM Harbour Services Private Limited 100.00 100.00 India xix) Indian Steel & Wire Products Ltd. 91.36 91.36 India xx) The Tata Pigments Limited 100.00 100.00 India xxi) T M Mining Company Limited 74.00 74.00 India xxii) Jamshedpur Continuous Annealing & Processing Company Private Limited 100.00 100.00 India xxiii) The Tinplate Company of India Ltd. 60.96 – India
B. Joint Ventures of: i) Tata Steel Ltd. 1. Bhubaneshwar Power Private Limited 26.00 26.00 India 2. mjunction services limited 50.00 50.00 India 3. S & T Mining Company Private Limited 50.00 50.00 India 4. Tata BlueScope Steel Limited 50.00 50.00 India 5. Tata NYk Shipping Pte Ltd. 50.00 50.00 Singapore 6. The Dhamra Port Company Limited 50.00 50.00 India 7. Himalaya Steel Mill Services Private Limited 26.00 26.00 India ii) Tata Steel Holdings Pte. Ltd. a) Tata Steel Global Holdings Pte Ltd. I. Tata Steel Europe Limited 1. Afon Tinplate Company Limited 64.00 64.00 uk 2. Air Products Llanwern Limited 50.00 50.00 uk 3. B V Ijzerleew 50.00 50.00 netherlands 4. Bsr Pipeline Services Limited 50.00 50.00 uk 5. Caparo Merchant Bar Plc 25.00 25.00 uk 6. Corus Cogifer Switches And Crossings Limited 50.00 50.00 uk 7. Corus kalpinis Simos Rom SRL. * – 50.00 Romania 8. Danieli Corus Technical Services B.V. 50.00 50.00 netherlands
Name of the Company Ownership in % either directly Country of or through Subsidiaries@ incorporation 2011-12 2010-11
Hundred and fifth annual report 2011-12
202
9. Hks Scrap Metals B.V. 50.00 50.00 netherlands 10. Ijzerhandel Geertsema Staal B.V. 50.00 50.00 netherlands 11. Industrial Rail Services Ijmond B.V. 50.00 50.00 netherlands 12. Laura Metaal Holding B.V. 49.00 49.00 netherlands 13. Norsk Stal AS 50.00 50.00 Norway 14. Norsk Stal Tynnplater AS 50.00 50.00 Norway 15. Ravenscraig Limited 33.33 33.33 uk 16. Redcar Bulk Terminal Limited 50.00 50.00 uk 17. Tata Elastron SA 50.00 50.00 Greece 18. Tata Elastron Steel Service Center SA 50.00 50.00 Greece 19. Tata Steel Ticaret AS 50.00 50.00 Turkey 20. Texturing Technology Limited 50.00 50.00 uk II. Tata Steel Global Minerals Holdings Pte. Ltd. 1. Rio Tinto Benga (Mauritius) Limited 35.00 35.00 Mauritius
Name of the Company Ownership in % either directly Country of or through Subsidiaries@ incorporation 2011-12 2010-11
c. Associate of: i) Kalimati Investment Company Ltd. 1. Rujuvalika Investments Ltd. 24.12 24.12 India ii) NatSteel Asia Pte. Ltd. 1. Steel Asia Development and Management Corp. 40.00 40.00 Philippines 2. Steel Asia Industries Inc. 50.00 50.00 Philippines 3. Steel Asia Manufacturing Corporation 40.00 40.00 Philippines iii) Tata Incorporated 1. TkM Overseas Ltd. 49.00 49.00 India iv) TRL Krosaki Refractories Limited 1. Almora Magnesite Ltd. * – 39.00 India v) Tata Steel Ltd. 1. Indian Steel Rolling Mills Ltd. # 20.56 20.56 India 2. Industrial Energy Ltd. 26.00 26.00 India 3. Jamipol Ltd. 32.67 31.78 India 4. kalinga Aquatics Ltd. # 30.00 30.00 India 5. kumardhubi Fireclay & Silica Works Ltd. # 27.78 27.78 India 6. kumardhubi Metal Casting & Engineering Ltd. # 49.31 49.31 India 7. Nicco Jubilee Park Ltd. # 23.46 23.46 India 8. Strategic Energy Technology Systems Limited 25.00 25.00 India 9. Tata Construction & Projects Ltd. # 29.66 29.66 India 10. Tata Sponge Iron Ltd. 43.24 43.24 India 11. TRL krosaki Refractories Ltd. 26.62 – India 12. The Tinplate Company of India Limited – 44.40 India 13. TRF Ltd. 34.29 34.29 India vi) Tata Steel Holdings Pte. Ltd. a) Tata Steel Global Holdings Pte Ltd. I. Tata Steel International (Singapore) Holdings Pte. Ltd. 1. European Profiles Malaysia (M) Sdn.Bhd. 20.00 20.00 Malaysia II. Tata Steel Europe Limited 1. Ab Norskstal AS 50.00 50.00 Norway 2. Albi Profils SRL 30.00 30.00 France 3. Appleby Frodingham Cottage Trust Limited 33.30 33.30 uk 4. Combulex B.V. 50.00 50.00 netherlands 5. Cv Gasexpansie Ijmond 50.00 50.00 netherlands
203
Name of the Company Ownership in % either directly Country of or through Subsidiaries@ incorporation 2011-12 2010-11
6. Danieli Corus Canada Inc. 50.00 50.00 Canada 7. Danieli Corus Asia B.V. 50.00 50.00 netherlands 8. Danieli Corus B.V. 50.00 50.00 netherlands 9. Danieli Corus Braseq Ltda. 50.00 50.00 Brazil 10. Danieli Corus Construction Services B.V. 50.00 50.00 netherlands 11. Danieli Corus Construction Services usa Inc. 50.00 50.00 uSA 12. Danieli Corus Do Brasil Ltda. 50.00 50.00 Brazil 13. Danieli Corus Inc. 50.00 50.00 uSA 14. Danieli Corus Services usa Inc. 50.00 50.00 uSA 15. Danieli India (Pvt.) Ltd. 50.00 50.00 India 16. European Profiles (Marketing) Sdn.Bhd. 10.20 10.20 Malaysia 17. Galvpro LP. 45.50 45.50 uSA 18. Gietwalsonderhoudcombinatie B.V. 50.00 50.00 netherlands 19. Hoogovens Court Roll Service Technologies Vof: 50.00 50.00 netherlands 20. Hoogovens Gan Multimedia S.A. De C.V. 50.00 50.00 Mexico 21. Isolation Du Sud SA 0.33 0.33 France 22. Issb Limited 50.00 50.00 uk 23. MDC Sublance Probe Technology 50.00 50.00 Shanghai 24. Regionale Ontwikkelingsmaatschappij Voor Het Noordzeekanaalgebied N.V. * – 6.67 netherlands 25. Richard Lees Steel Decking Asia Snd. Bhd. 10.00 10.00 Malaysia 26. Rsp Holding B.V. 13.19 13.19 netherlands 27. Schreiner Fleischer AS 50.00 50.00 Norway 28. Shanghai Bao Yi Beverage Can Making Co. Ltd. 12.50 12.50 China 29. Sms Mevac uk Limited * – 45.00 uk 30. Thoresen & Thorvaldsen AS 50.00 50.00 Norway 31. Trico LLC 25.00 25.00 uSA 32. Weirton/Hoogovens GP 50.00 50.00 uSA 33. Wupperman Staal Nederland B.V. 30.00 30.00 netherlands III. Tata Steel Global Minerals Holdings Pte Ltd. 1. Riversdale Mining Ltd. * $ – 27.14 Australia 2. New Millennium Iron Corporation $ 26.62 27.10 Canada vii) The Indian Steel and Wire Products Ltd. 1. Metal Corporation of India Limited # 42.05 42.05 India
@ Represents the holding percentage of the respective companies and does not indicate the effective percentage holding of the Group.
* Part of the year. By virtue of management control. Investments in these associates are reported at nil value in the consolidated financial statements. Earlier a subsidiary, became an associate during the year. Earlier an associate, became a subsidiary during the year.
Hundred and fifth annual report 2011-12
204
2. ACCounTing PoLiCieS(a) Basis for Accounting The financial statements are prepared under the historical cost convention on an accrual basis of accounting in accordance with
the Generally Accepted Accounting Principles, Accounting Standards notified under Section 211(3C) of the Companies Act, 1956 and the relevant provisions thereof.
During the year, Revised Schedule VI notified under the Companies Act, 1956 has become applicable to the Company for preparation and presentation of its financial statements. The Company has reclassified the previous year figures in accordance with the requirements applicable in the current year.
(b) Revenue Recognition (i) Revenue from sale of goods is recognised net of rebates and discounts on transfer of significant risks and rewards of
ownership to the buyer. Sale of goods is recognised gross of excise duty but net of sales tax and value added tax. (ii) Revenue from services rendered is recognised on pro-rata basis in proportion to the stage of completion of the related
transaction. (iii) Export incentive under various schemes notified by the Government has been recognised on the basis of credits afforded
in the pass book/amount received. (iv) In one of the subsidiaries, income from services are recognised upon completion of the relevant shipping activities and
related services. Income and expenses relating to incomplete voyages are carried forward as voyages-in-progress. Despatch earnings are accounted for on receipt basis.
(c) Employee Benefits (i) Short-term employee benefits are recognised as an expense at the undiscounted amount in the Statement of Profit and
Loss of the year in which the related service is rendered. (ii) Post employment benefits are recognised as an expense in the Statement of Profit and Loss for the year in which
the employee has rendered services. The expense is recognised at the present value of the amount payable towards contributions. The present value is determined using the market yields of government bonds at the balance sheet date as the discounting rate. In some of the foreign subsidiaries, the present value is determined using the AA rated corporate bonds.
(iii) Other long-term employee benefits are recognised as an expense in the Statement of Profit and Loss for the year in which the employee has rendered services. Estimated liability on account of long-term benefits is discounted to the present value, using the market yield on government bonds, as on the date of balance sheet, as the discounting rate. In some of the foreign subsidiaries, the present value is determined using the AA rated corporate bonds.
(iv) Actuarial gains and losses in respect of post employment and other long-term benefits are recognised in the Statement of Profit and Loss. However, in one of the subsidiary (Tata Steel Europe Limited) because of potential volatility caused by periodic changes in the assumptions underlying the computation of the pension and other post retirement benefit liabilities, it is not considered practicable to adopt a common accounting policy for accounting for these liabilities of the company and Tata Steel Europe Limited. The actuarial gains and losses for these liabilities of Tata Steel Europe Limited have been accounted in Reserves and Surplus.
(v) In respect of the Employee Separation Scheme (ESS), the increase in the net present value of the future liability for pension payable to employees, who have opted for retirement under the Employee Separation Scheme of the Company, is charged to the Statement of Profit and Loss.
(d) Tangible Assets Tangible assets are stated at cost less accumulated depreciation and net of impairments, if any. Pre-operation expenses
including trial run expenses (net of revenue) are capitalised. Borrowing costs during the period of construction is added to the cost of eligible tangible assets.
Blast Furnace relining is capitalised. The written down value of the asset consisting of lining/relining expenditure embedded in the cost of the furnace is written off in the year of fresh relining.
(e) Intangible Assets Intangible assets are stated at cost less accumulated amortisation and net of impairments, if any. An intangible asset is
recognised if it is probable that the expected future economic benefits that are attributable to the asset will flow to the Company and its cost can be measured reliably. Intangible assets having finite useful lives are amortised on a straight-line basis over their estimated useful lives.
(f) Depreciation and Amortisation (i) Capital assets whose ownership does not vest with the Company are depreciated over their estimated useful life or five
years, whichever is less.
205
(ii) In respect of other assets, depreciation is provided on a straight line basis applying the rates specified in Schedule XIV to the Companies Act, 1956 or rates based on estimated useful life whichever is higher. The details of estimated life for each category of asset are as under:
(a) Buildings and Roads — 30 to 62 years (b) Plant and Machinery — 3 to 30 years (c) Railway Sidings/Lines — 21 years (d) Vehicles and Aircraft — 5 to 18 years (e) Furniture, Fixtures and Office Equipments — 5 years (f) Intangibles (Computer Software) — 5 to 10 years (g) Development of property for development of mines and collieries are depreciated over the useful life of the mine or
lease period whichever is less, subject to maximum of 10 years. (h) Blast Furnace relining is depreciated over a period of 10 years (average expected life). (i) Freehold land is not depreciated. (j) Leasehold land and other leasehold assets are amortised over the life of the lease. In some of the subsidiaries, joint ventures and associates depreciation is calculated on written down value basis and intangible
assets are amortised over the period for which the rights are obtained. The depreciation charge in respect of these entities is not significant in the context of the consolidated financial statements.
(g) impairment For the purpose of impairment testing, goodwill is allocated to each of the Group’s cash-generating units that are expected
to benefit from the synergies of the combination. Cash-generating units to which goodwill has been allocated are tested for impairment annually, or more frequently when there
is an indication that the unit’s value may be impaired. If the recoverable amount of the cash-generating unit is less than the carrying amount of the unit, the impairment loss is allocated first to reduce the carrying amount of any goodwill allocated to the unit and then to the other assets of the unit in proportion to the carrying amount of each asset in the unit. An impairment loss recognised for goodwill is not reversed in a subsequent period.
Fixed assets are reviewed for impairment whenever events or changes in circumstances indicate that their carrying amount may not be recoverable.
An impairment loss is recognised in the Statement of Profit and Loss if the carrying amount of an asset exceeds its recoverable amount.
(h) Foreign Currency Transactions Foreign Currency Transactions (FCT) and forward exchange contracts entered into to hedge FCT are initially recognised
at the spot rate on the date of the transaction/contract. Monetary assets and liabilities denominated in foreign currency and forward exchange contracts remaining unsettled at the end of the year are translated at year end rates.
The Company and some of its Indian subsidiaries have elected to account for exchange differences arising on reporting of long-term foreign currency monetary items in accordance with Companies (Accounting Standards) Amendment Rules, 2009 relating to Accounting Standard 11 (AS-11) notified by Government of India on 31st March, 2009 (as amended on 29th December, 2011). Accordingly, the effect of exchange differences on foreign currency loans of the company is accounted by addition or deduction to the cost of the assets so far it relates to depreciable capital assets and in other cases by transfer to “Foreign Currency Monetary Item Translation Difference Account” to be amortised over the balance period of the long-term monetary items.
The differences in translation and settlement of FCT and forward exchange contracts used to hedge FCT (excluding the long-term foreign currency monetary items accounted in line with Companies (Accounting Standards) Amendment Rules 2009 on Accounting Standard 11 notified by Government of India on 31st March, 2009 as amended on 29th December, 2011) are recognised in the Statement of Profit and Loss. The outstanding derivative contracts at the balance sheet date other than forward exchange contracts used to hedge FCT are valued by marking them to market and losses, if any, are recognised in the Statement of Profit and Loss.
Exchange differences relating to monetary items that are in substance forming part of the Company’s net investment in non integral foreign operations are accumulated in Foreign Exchange Fluctuation Reserve Account.
Hedging instruments are initially measured at fair value, and are remeasured at subsequent reporting dates. Changes in the fair value of these derivatives that are designated and effective as hedges of future cash flows are recognised directly in shareholders’ funds and the ineffective portion is recognised immediately in the Statement of Profit and Loss.
Changes in the fair value of derivative financial instruments that do not qualify for hedge accounting are recognised in Statement of Profit and Loss as they arise.
Hedge accounting is discontinued when the hedging instrument expires or is sold, terminated, or exercised, or no longer qualifies for hedge accounting.
(i) investments Long-term investments are carried at cost less provision for diminution other than temporary, if any, in value of such investments.
Current investments are carried at lower of cost and fair value. Stock-in-trade in case of one of the subsidiaries, being an investment company, has been valued at cost or at market quotation whichever is lower scrip wise.
(j) inventories Finished and semi-finished products produced and purchased by the Company are carried at lower of cost and net realisable
value.
Hundred and fifth annual report 2011-12
206
3. shARE cAPitAL(Item No. 1(a), Page 190) As at 31.03.2011 ` crores ` croresAuthorised: 1,75,00,00,000 Ordinary Shares of ` 10 each 1,750.00 1,750.00 (31.03.2011: 1,75,00,00,000 Ordinary Shares of ` 10 each) 35,00,00,000 “A” Ordinary Shares of ` 10 each 350.00 350.00 (31.03.2011: 35,00,00,000 “A” Ordinary Shares of ` 10 each) 2,50,00,000 Cumulative Redeemable Preference Shares of ` 100 each 250.00 250.00 (31.03.2011: 2,50,00,000 Shares of ` 100 each) 60,00,00,000 Cumulative Convertible Preference Shares of ` 100 each 6,000.00 6,000.00 (31.03.2011: 60,00,00,000 Shares of ` 100 each) 8,350.00 8,350.00
Issued: 97,21,26,020 Ordinary Shares of ` 10 each 972.13 959.46 (31.03.2011: 95,94,54,565@ Ordinary Shares of ` 10 each)Subscribed: 97,12,14,450 Ordinary Shares of ` 10 each fully paid up 971.21 958.54 (31.03.2011: 95,85,42,995@ Ordinary Shares of ` 10 each) Add: Amount paid-up on 3,89,516 Ordinary Shares forfeited 0.20 0.20 (31.03.2011: 3,89,516 Ordinary Shares of ` 10 each) 971.41 958.74
@ excludes 6,71,455 Ordinary Shares held by a Subsidiary.
Work-in-progress is carried at lower of cost and net realisable value. Coal, iron ore and other raw materials produced and purchased by the Company are carried at lower of cost and net realisable
value. Stores and spare parts are carried at cost. Necessary provision is made and charged to revenue in case of identified obsolete
and non-moving items. Cost of inventories is generally ascertained on the ‘weighted average’ basis. Work-in-progress and finished and semi-finished
products are valued on full absorption cost basis.(k) Relining Expenses Relining expenses other than expenses on blast furnace relining are charged as an expense in the year in which they are
incurred.(l) Research and Development Research and development costs (other than cost of fixed assets acquired) are charged as an expense in the Statement of
Profit and Loss in the year in which they are incurred.(m) Deferred Tax Deferred tax is accounted for by computing the tax effect of timing differences which arise during the year and reverse in
subsequent periods.(n) Tax on Income Tax on income is determined on the basis of taxable income and tax credits computed in accordance with the provisions of
applicable tax laws of the respective countries. Foreign Companies recognise tax liabilities and assets in accordance with the applicable local laws.
207
4. REsERvEs ANd suRPLus(Item No. 1(b), Page 190) As at 31.03.2011 ` crores ` crores(a) Capital Reserve Balance as per last account 22.31 21.61 Adjustments on account of equity accounting for associates 9.45 – Received during the year 0.12 0.70 31.88 22.31 (b) Capital Redemption Reserve Balance as per last account 20.78 20.78 Amount transferred from Statement of Profit and Loss 6.55 – 27.33 20.78(c) Securities Premium Reserve Balance as per last account 18,210.42 14,031.50 Amount received on conversion of CCPS – 0.01 Amount received on follow on public issue of equity shares – 3,420.00 Amount received on preferential issue of equity shares – 876.00 Expenses related to CARS/NCD/GDR/Hybrid Securities/ Preferential and Public issue of equity shares (9.39) (115.02) Amount received on conversion of warrants 700.80 – Effect of change in cross holdings (0.21) – Exchange difference on redemption premium of CARS (25.22) (2.07) 18,876.40 18,210.42 (d) Debenture Redemption Reserve Balance as per last account 2,053.26 1,046.00 Amount transferred from Statement of Profit and Loss – 1,007.26 2,053.26 2,053.26(e) Amalgamation Reserve Balance as per last account 0.43 0.43 (f) Export Profits Reserve Balance as per last account 1.25 1.25(g) Foreign Exchange Fluctuation Reserve Balance as per last account 14.00 14.00(h) Contributions for Capital Expenditure Balance as per last account 80.00 72.88 Received during the year 16.97 8.65 Release to Statement of Profit and Loss (2.34) (1.53) 94.63 80.00(i) Contingency Reserve Balance as per last account 100.00 100.00(j) Debenture Forfeiture Reserve Balance as per last account 0.04 0.04(k) Capital Reserve on Consolidation Balance as per last account 19.30 20.23 Effect of changes in Group's interest (1.59) (0.93) 17.71 19.30 (l) Investment Allowance (utilised) Reserve Balance as per last account 0.23 0.23(m) Foreign Currency Translation Reserve Balance as per last account (4,658.80) (5,996.99) Adjustment for translation of Non Integral Foreign Operations 5,045.22 1,338.19 386.42 (4,658.80)
Carried forward 21,603.58 15,863.22
Hundred and fifth annual report 2011-12
208
(n) Special Reserve Balance as per last account 88.02 82.69 Transfer from Statement of Profit and Loss 11.77 5.33 99.79 88.02 (o) Statutory Reserve Balance as per last account 179.52 179.52
(p) Actuarial Gain/(Loss) Reserve Balance as per last account (3,533.78) (3,130.97) Actuarial loss (net of tax) recognised during the year (2,372.26) (402.81) (5,906.04) (3,533.78)(q) Cash Flow Hedge Reserve Balance as per last account (224.53) 61.53 Fair value changes recognised (net of tax) 365.34 (286.06) 140.81 (224.53)
(r) General Reserve Balance as per last account 9,095.36 8,391.94 Effect of change in cross holdings 30.76 – Amount transferred from Statement of Profit and Loss 680.51 703.42 9,806.63 9,095.36(s) Surplus in the Statement of Profit and Loss Balance as per last account 12,959.16 7,010.48 Profit for the year 5,389.77 8,982.69 Distribution on hybrid perpetual securities [net of tax of (173.30) (4.54) ` 83.24 crores (2010-11: ` 2.25 crores)] Dividend on preference shares (0.21) – Proposed dividend on Ordinary Shares (1,165.46) (1,150.25) Tax on dividend (185.71) (163.22) Transfers to Reserves General Reserve (680.51) (703.42) Debenture Redemption Reserve – (1,007.26) Special Reserve (11.77) (5.32) Capital Redemption Reserve (6.55) – 16,125.42 12,959.16
42,049.71 34,426.97
5. PREfERENcE shAREs issuEd by subsidiARy comPANiEs(Item No. 2, Page 190) As at 31.03.2011 ` crores ` crores Preference Shares issued by subsidiary companies 22.43 – 22.43 –Additional information:(1) 8.50% – 2,43,000 non-cumulative Optionally Convertible Preference Shares (OCPS) of ̀ 100 each were issued by The Tinplate
Company of India Ltd., the subsidiary of the Company in the financial year 1999-2000 and 2000-2001. The OCPS will be redeemed in accordance with the terms of the issue thereof, the provisions of the Companies Act, 1956 and other applicable laws between 2012-2015.
4. REsERvEs ANd suRPLus (continued)(Item No. 1(b), Page 190) As at 31.03.2011 ` crores ` croresBrought forward 21,603.58 15,863.22
209
(2) 8.50% – 20,00,000 non-cumulative Redeemable Preference Shares (RPS) were issued by Tayo Rolls Limited, a subsidiary of the Company in March 2012. These RPS are redeemable in 3 equal annual installments with all arrears of dividend, if any, commencing from 1st April, 2020. The subsidiary may exercise its call option by giving 30 days clear notice at the expiry of 36 months from the date of allotment thereof.
6. hybRid PERPEtuAL sEcuRitiEs(Item No. 4, Page 190) As at 31.03.2011 ` crores ` crores Hybrid Perpetual Securities 2,275.00 1,500.00 2,275.00 1,500.00Additional information:(1) The Company has issued Hybrid Perpetual Securities of ` 775 crores and ` 1,500 crores in May 2011 and March 2011
respectively. These securities are perpetual in nature with no maturity or redemption and are callable only at the option of the Company. The distribution on the securities may be deferred at the option of the Company, if in the six months preceding the relevant distribution payment date, the Company has not made payment on, or repurchased or redeemed, any securities ranking pari pasu with, or junior to the instrument. The distribution on these securities are 11.50% p.a and 11.80% p.a. respectively, with a step up provision if the securities are not called after 10 years. As these securities are perpetual in nature and the Company does not have any redemption obligation, these are not classified as ‘debt’.
7. BORROWINGS(Item No. 6(a) and 7(a), Page 190) As at 31.03.2011 ` crores ` crores Long short Long Short term term total Term Term Total A. Secured Borrowings (a) Bonds/Debentures (i) Non-convertible bonds/debentures 268.00 – 268.00 281.50 – 281.50 (b) Term loans (i) From banks 22,311.08 38.16 22,349.24 21,843.34 0.41 21,843.75 (ii) From financial institutions and others (1) 1,928.80 – 1,928.80 1,860.05 – 1,860.05 (c) Repayable on demand (i) From banks – 336.18 336.18 – 580.85 580.85 (d) Finance lease obligations 321.64 – 321.64 295.32 – 295.32 (e) Other loans 3.88 – 3.88 4.16 – 4.16 24,833.40 374.34 25,207.74 24,284.37 581.26 24,865.63 B. Unsecured Borrowings (a) Bonds/Debentures (i) Non-convertible bonds/debentures 7,328.40 – 7,328.40 7,094.62 – 7,094.62 (ii) 1% Convertible Alternative Reference Securities – – – 2,101.16 – 2,101.16 (iii) 4.5% Foreign Currency Convertible Bonds 2,782.81 – 2,782.81 2,439.06 – 2,439.06 (b) Term loans (i) From banks 8,657.29 4,246.25 12,903.54 11,752.32 3,175.35 14,927.67 (ii) From financial institutions and others 856.56 – 856.56 857.83 10.00 867.83 (c) Deferred payment liabilities 3.80 – 3.80 31.34 – 31.34 (d) Fixed deposits 1.91 – 1.91 7.35 – 7.35 (e) Finance lease obligations 545.41 – 545.41 547.09 – 547.09 (f) Other loans 228.66 78.49 307.15 135.55 27.83 163.38 20,404.84 4,324.74 24,729.58 24,966.32 3,213.18 28,179.50 45,238.24 4,699.08 49,937.32 49,250.69 3,794.44 53,045.13Additional information:(1) Includes loan from Joint Plant Committee – Steel Development Fund of ` 1,915.47 crores (31.03.2011: ` 1,860.05 crores) which also
includes funded interest ` 316.13 crores (31.03.2011: ` 280.06 crores).
Hundred and fifth annual report 2011-12
210
8. dEfERREd tAx LiAbiLitiEs (NEt)(Item No. 6(b) and 8(d), Page 190) As at 31.03.2011 ` crores ` crores Deferred Tax Liabilities (a) Differences in depreciation and amortisation for accounting and income tax purposes 3,278.78 3,399.55 (b) Prepaid expenses 77.68 106.08 (c) Actuarial gain/(loss) 308.19 595.36 (d) Others 1,316.72 1,176.93
4,981.37 5,277.92 Deferred Tax Assets (a) unabsorbed losses (1,327.99) (1,853.36) (b) Employee separation compensation (399.46) (442.40) (c) Provision for doubtful debts and advances (47.94) (46.41) (d) Disallowance under Section 43B of IT Act (183.61) (164.47) (e) Provision for employee benefits (249.00) (355.69) (f) Redemption premium on CARS (141.12) (129.01) (g) Other provisions (189.84) (273.96) (2,538.96) (3,265.30)
Deferred tax liabilities (net) 2,442.41 2,012.62
9. othER LoNg-tERm LiAbiLitiEs(Item No. 6(c), Page 190) As at 31.03.2011 ` crores ` crores
(a) Creditors for capital supplies/services 228.98 390.61 (b) Deferred income 181.33 177.48 (c) Creditors for other liabilities 397.57 277.56 807.88 845.65
211
10. PRovisioNs(Item No. 6(d) and 7(d), Page 190) As at 31.03.2011 ` crores ` crores Long short Long Short term term total Term Term Total (a) Provision for employee benefits 2,855.67 184.32 3,039.99 2,767.06 168.67 2,935.73 (b) Provision for employee separation compensation (1) 603.03 169.65 772.68 696.19 183.18 879.37 (c) Provision for taxation – 1,213.67 1,213.67 – 1,151.22 1,151.22 (d) Provision for fringe benefits tax – 7.84 7.84 – 3.93 3.93 (e) Proposed dividend – 1,165.67 1,165.67 – 1,150.25 1,150.25 (f) Other provisions 1,256.35 628.90 1,885.25 1,121.80 738.00 1,859.80 4,715.05 3,370.05 8,085.10 4,585.05 3,395.25 7,980.30Additional information:(1) Provision for employee separation compensation has been calculated on the basis of net present value of the future monthly
payments of pension and lump sum benefits under the scheme including ` 18.23 crores (31.03.2011: ` 27.53 crores) in respect of schemes introduced during the year.
11. tRAdE PAyAbLEs(Item No. 7(b), Page 190) As at 31.03.2011 ` crores ` crores (a) Creditors for supplies/services 15,500.35 14,696.76 (b) Creditors for accrued wages and salaries 2,908.91 2,419.41 (c) Acceptances 2,208.60 1,341.31 20,617.86 18,457.48
12. othER cuRRENt LiAbiLitiEs(Item No. 7(c), Page 190) As at 31.03.2011 ` crores ` crores (a) Current maturities of long-term borrowings 9,859.55 7,531.94 (b) Current maturities of finance lease obligations 99.90 101.73 (c) Interest accrued but not due on borrowings 785.61 771.92 (d) unpaid dividend 58.22 54.92 (e) Advances received from customers 511.91 528.19 (f) Creditors for other liabilities 7,545.80 6,012.52 18,860.99 15,001.22
Tangible Assets Freehold Leasehold Freehold Leasehold Plant and Leased Furniture Office Leased Railway Land Land Buildings(3) Buildings Machinery Plant and and Fixtures Equipments Vehicles FFOE and Sidings/ Total and Roads Machinery Vehicles Lines
Total accumulated depreciation 440.38 92.55 6,229.36 324.54 59,814.00 1,069.00 804.37 191.22 142.85 2.10 528.48 69,638.85 and impairment as at 31.03.2012 405.17 63.36 5,352.08 246.23 51,506.74 978.33 977.32 152.66 129.51 3.03 467.12 60,281.55
Net book value as at 31.03.2012 1,149.70 810.70 4,151.55 286.24 31,342.41 532.76 73.99 112.34 128.72 7.80 484.72 39,080.93 1,013.38 252.13 3,389.21 261.88 28,853.79 531.07 85.18 76.86 129.78 0.28 184.57 34,778.13
Additional information:(1) Additions and depreciation on assets written off during the year include adjustments for inter se transfers.(2) Deductions include cost of assets scrapped/surrendered during the year.(3) Freehold Buildings include ` 2.32 crores (31.03.2011: ` 2.32 crores) being cost of shares in Co-operative Housing Societies and Limited Companies.(4) Rupee liability has increased by a net amount of ` 43.17 crores (2010-11: by ` 1.11 crores) arising out of realignment of the value of foreign currency loans for procurement
of tangible assets. This increase has been adjusted in the carrying cost of respective tangible assets and has been depreciated over their remaining depreciable life. The depreciation for the current year has increased by ` 2.28 crores (2010-11: ` 0.06 crores) arising on account of this adjustment.
213
14. iNtANgibLE AssEts(Item No. 8(a)(iii), Page 190) ` crores other total Patents Development Software Mining Development Intangible IntangibleIntangible Assets Costs Costs Rights of Property(3) Assets Assets
Gross Block as at 01.04.2011 73.49 263.96 1,355.22 287.66 988.92 72.45 3,041.70 70.06 216.12 1,202.69 42.19 595.00 63.18 2,189.24Assets of new companies – – 1.14 – – – 1.14 – – – 231.95 10.32 – 242.27Additions during the year (1) 7.07 – 33.92 217.89 759.01 16.58 1,034.47 0.71 36.61 105.07 – 404.84 9.27 556.50 Deductions during the year (2) – – 20.71 – – 0.60 21.31 – – 7.50 – 2.93 – 10.43Disposal of group undertakings 1.48 – – – – – 1.48 – – – – – – –Exchange difference on consolidation 6.67 19.29 150.66 19.39 166.29 – 362.30 2.72 11.23 54.96 13.52 (18.31) – 64.12Gross Block as at 31.03.2012 85.75 283.25 1,520.23 524.94 1,914.22 88.43 4,416.82 73.49 263.96 1,355.22 287.66 988.92 72.45 3,041.70 Impairment as at 01.04.2011 – – 22.35 – – – 22.35 – – 21.31 – – – 21.31 Impairment on assets written off during the year – – – – – – – – – 0.04 – – – 0.04Exchange differences on consolidation – – 3.06 – – – 3.06 – – 1.08 – – – 1.08 Impairment as at 31.03.2012 – – 25.41 – – – 25.41 – – 22.35 – – – 22.35 Accumulated amortisation as at 01.04.2011 68.63 146.13 710.18 5.06 287.39 12.46 1,229.85 64.95 100.13 556.35 2.80 235.93 10.78 970.94 Amortisation of new companies – – 0.97 – – – 0.97 – – – – – – –Amortisation during the year 0.90 45.21 130.33 2.77 52.03 3.80 235.04 1.07 39.69 136.77 1.78 51.27 1.68 232.26Amortisation on assets written off during the year (1) – – 19.92 – – (0.36) 19.56 – – 7.57 – – – 7.57Disposal of group undertakings 1.48 – – – – – 1.48 – – – – – – –Exchange difference on consolidation 5.70 11.87 76.45 0.84 0.40 – 95.26 2.61 6.31 24.63 0.48 0.19 – 34.22 Accumulated amortisation as at 31.03.2012 73.75 203.21 898.01 8.67 339.82 16.62 1,540.08 68.63 146.13 710.18 5.06 287.39 12.46 1,229.85Total accumulated amortisation and 73.75 203.21 923.42 8.67 339.82 16.62 1,565.49 impairment as at 31.03.2012 68.63 146.13 732.53 5.06 287.39 12.46 1,252.20
Net book value as at 31.03.2012 12.00 80.04 596.81 516.27 1,574.40 71.81 2,851.33 4.86 117.83 622.69 282.60 701.53 59.99 1,789.50
Additional information:(1) Additions and amortisation on assets written off during the year include adjustments for inter se transfers.(2) Deductions include cost of assets scrapped/surrendered during the year.(3) Development of property represents expenditure incurred on development of mines/collieries.
Hundred and fifth annual report 2011-12
214
15. iNvEstmENts(Item No. 8(c) and 9(a), Page 190) As at 31.03.2011 ` crores ` crores Non-current Current Total Non-current Current Total (a) Investments in equity instruments 2,073.64 1.42 2,075.06 3,947.50 1.44 3,948.94 (b) Investments in preference shares – – – 108.17 – 108.17 (c) Investments in government or trust securities 0.02 – 0.02 0.02 – 0.02 (d) Investments in debentures and bonds 395.93 – 395.93 502.04 – 502.04 (e) Investments in partnership firms 16.36 – 16.36 21.83 – 21.83 (f) Investment properties 128.18 – 128.18 108.50 – 108.50 (g) Investments in mutual funds 8.75 1,396.95 1,405.70 – 3,157.84 3,157.84 2,622.88 1,398.37 4,021.25 4,688.06 3,159.28 7,847.34
Additional information: As at 31.03.2011 ` crores ` crores (1) Aggregate amount of quoted investments 1,520.73 4.96 1,525.69 3,812.52 4.99 3,817.51 (2) Aggregate amount of unquoted investments 973.97 1,393.41 2,367.38 767.04 3,154.29 3,921.33 2,494.70 1,398.37 3,893.07 4,579.56 3,159.28 7,738.84 (3) Equity Accounted Associates Cost of investment 649.74 2,717.93 [including ` 123.34 crores (31.03.2011: ` 1,277.40 crores) of goodwill (net of capital reserve) arising on consolidation] Add: Share of post acquisition profit (net of losses) 528.95 399.13 1,178.69 3,117.06
Name of the Company Original Goodwill/ Accumulated Carrying Cost of (Capital Profit/(Loss) amount of investment Reserve) as at investments (a) (a) 31.03.2012 as at 31.03.2012 (a) (b) (a) (b)
` crores ` crores ` crores ` crores
(4) Details of equity accounted associates are as follows:
(a) Includes impact of exchange rate changes on translation.(b) Includes other adjustments to carrying value routed through reserves.* Part of the year.◆ Earlier a subsidiary, became an associate during the year.▲ Earlier an associate, became a subsidiary during the year. Carrying value of investment on the date of becoming subsidiary ` 150.19 crores.
Name of the Company Original Goodwill/ Accumulated Carrying Cost of (Capital Profit/(Loss) amount of investment Reserve) as at investments (a) (a) 31.03.2012 as at 31.03.2012 (a) (b) (a) (b)
` crores ` crores ` crores ` crores
Hundred and fifth annual report 2011-12
216
16. foREigN cuRRENcy moNEtARy itEm tRANsLAtioN diffERENcE AccouNt(Item No. 8(e), Page 190) As at 31.03.2011 ` crores ` crores Foreign Currency Monetary Item Translation Difference Account 404.90 – 404.90 –Additional information:(1) The Company and some of its Indian subsidiaries have elected to account for exchange differences arising on reporting of long-
term foreign currency monetary items in accordance with Companies (Accounting Standards) Amendment Rules 2009 relating to Accounting Standard 11 (AS-11) notified by Government of India on 31st March, 2009 (as amended on 29th December, 2011) which allows foreign exchange differences on long-term monetary items arising on or after 1st April, 2011 to be capitalised to the extent they relate to acquisition of depreciable assets and in other cases to amortise over the balance period of the respective monetary items.
As on 31st March, 2012, a debit of ` 404.90 crores (31.03.2011: Nil) remains to be amortised in the “Foreign Currency Monetary Item Translation Difference Account” after taking debit of ` 243.21 crores (2010-11: credit of ` 261.44 crores) in the Statement of Profit and Loss and ` 25.22 crores (net of deferred tax ` 12.11 crores) [2010-11: ` 2.07 crores (net of deferred tax ` 3.57 crores)] have been adjusted against Securities Premium Reserve on account of amortisation. The depreciation for the year ended 31st March, 2012 is higher by ` 2.37 crores (2010-11: lower by ` 0.14 crore) and the Profit after tax, minority interest and share of profit of associates for the year ended 31st March, 2012 is higher by ` 436.41 crores (2010-11: higher by ` 209.66 crores).
17. LoANs ANd AdvANcEs(Item No. 8(f) and 9(e), Page 190) As at 31.03.2011 ` crores ` crores Long short total Long Short Total term term Term Term (a) Capital advances unsecured and considered good 2,535.61 – 2,535.61 2,273.99 – 2,273.99 unsecured and considered doubtful 0.99 – 0.99 0.39 – 0.39 Less: Provision for bad & doubtful loans and advances 0.99 – 0.99 0.39 – 0.39 2,535.61 – 2,535.61 2,273.99 – 2,273.99 (b) Security deposits unsecured and considered good 110.70 46.08 156.78 105.15 19.89 125.04 unsecured and considered doubtful 1.45 0.03 1.48 2.65 – 2.65 Less: Provision for bad & doubtful loans and advances 1.45 0.03 1.48 2.65 – 2.65 110.70 46.08 156.78 105.15 19.89 125.04 (c) Advance with public bodies unsecured and considered good 361.29 1,172.22 1,533.51 238.06 799.40 1,037.46 unsecured and considered doubtful 18.22 2.32 20.54 – 20.90 20.90 Less: Provision for bad & doubtful loans and advances 18.22 2.32 20.54 – 20.90 20.90 361.29 1,172.22 1,533.51 238.06 799.40 1,037.46 (d) Loans and advances to related parties unsecured and considered good 4.86 12.66 17.52 4.51 – 4.51 (e) Advance payment against taxes unsecured and considered good 323.59 112.43 436.02 279.50 85.06 364.56 (f) Other loans and advances unsecured and considered good 4,702.96 2,525.34 7,228.30 5,783.35 2,642.83 8,426.18 unsecured and considered doubtful 136.55 35.00 171.55 127.53 34.26 161.79 Less: Provision for bad & doubtful loans and advances 136.55 35.00 171.55 127.53 34.26 161.79 4,702.96 2,525.34 7,228.30 5,783.35 2,642.83 8,426.18
18. othER NoN-cuRRENt AssEts(Item No. 8(g), Page 190) As at 31.03.2011 ` crores ` crores Balances with banks (1) 39.39 33.55 39.39 33.55Additional information:(1) Represents bank deposits not due for realisation within 12 months of the balance sheet date.
19. iNvENtoRiEs(At lower of cost and net realisable value)(Item No. 9(b), Page 190) As at 31.03.2011 ` crores ` crores (a) Raw materials 8,995.63 10,030.87 (b) Work-in-progress 5,679.12 4,064.53 (c) Finished and semi-finished goods 8,262.84 7,760.22 (d) Stock-in-trade of goods acquired for trading 394.32 358.04 (e) Stores and spares 2,266.09 1,841.58 25,598.00 24,055.24 Included above, goods-in-transit: (i) Raw materials 1,085.73 1,496.58 (ii) Finished and semi-finished goods 174.13 194.80 (iii) Stores and spares 113.73 54.46 1,373.59 1,745.84 20. tRAdE REcEivAbLEs(Item No. 9(c), Page 190) As at 31.03.2011 ` crores ` crores (a) More than six months 684.05 730.87 (b) Others 14,778.72 14,696.72 15,462.77 15,427.59 Less: Provision for bad and doubtful debts 584.29 615.67 14,878.48 14,811.92
unsecured and considered good 14,878.48 14,811.92 Doubtful 584.29 615.67 15,462.77 15,427.5921. cAsh ANd bANK bALANcEs(Item No. 9(d), Page 190) As at 31.03.2011 ` crores ` crores (a) Cash in hand 1.22 5.61 (b) Cheques, drafts on hand 28.19 110.81 (c) Remittances in-transit 14.83 51.14 (d) Balances with banks 10,708.56 10,646.71 Total cash and cash equivalents 10,752.80 10,814.27 (e) Other bank balances (1) 48.78 44.78 10,801.58 10,859.05Additional information:(1) Represents ` 0.17 crore (31.03.2011: ` 0.61 crore) refund orders issued on account of oversubscription of rights issue and
follow on public offer of equity shares not encashed , ` 0.48 crore (31.03.2011: ` 0.49 crore) in pre-funded accounts for bonus and CCPS related payments and ` 48.13 crores (31.03.2011: ` 43.68 crores) in pre-funded dividend accounts.
Hundred and fifth annual report 2011-12
218
22. othER cuRRENt AssEts(Item No. 9(f), Page 190) As at 31.03.2011 ` crores ` crores (a) Interest accrued on investments 4.71 5.49 (b) Interest accrued on deposits, loans and advances 26.24 48.27 (c) Others 1.79 2.53 32.74 56.29
23. REvENuE fRom oPERAtioNs(Item No. 1(a), Page 191) Previous Year ` crores ` crores (a) Sale of products 1,33,024.72 1,17,611.41 (b) Sale of power and water 1,127.23 1,026.10 (c) Income from town, medical and other services 1,181.27 1,104.90 (d) Other operating income 642.34 1,603.34 1,35,975.56 1,21,345.75
24. othER iNcomE(Item No. 1(b), Page 191) Previous Year ` crores ` crores (a) Dividend Income (i) non-current investments 90.89 87.30 (ii) Current investments 10.36 4.65 (b) Interest Income 455.27 274.20 (c) Net gain/(loss) on sale of (i) Other non-current investments 6.52 0.75 (ii) Current investments 432.47 158.15 (d) Profit on sale of capital assets (net of loss on assets sold/written off) (7.41) 100.38 (e) Gain/(Loss) on cancellation of forwards, swaps and options (43.06) 54.55 (f) Other miscellaneous income 627.99 – 1,573.03 679.98
25. EmPLoyEE bENEfits ExPENsE(Item No. 2(d), Page 191) Previous Year ` crores ` crores (a) Salaries and wages, including bonus 14,453.38 13,010.59 (b) Contribution to provident and other funds 2,372.44 2,241.04 (c) Staff welfare expenses 402.82 588.57 17,228.64 15,840.20
219
26. dEPREciAtioN ANd AmoRtisAtioN ExPENsE(Item No. 2(e), Page 191) Previous Year ` crores ` crores (a) Depreciation on tangible assets 4,304.21 4,220.95 (b) Amortisation of intangible assets 235.04 232.26 4,539.25 4,453.21 Less: Amount released from specific grants 22.60 38.39 4,516.65 4,414.82
27. fiNANcE costs(Item No. 2(f), Page 191) Previous Year ` crores ` crores (a) Interest expense (i) Debentures/bonds and fixed loans 3,975.10 3,248.86 (ii) Others 181.35 113.75 (b) Finance charges on finance leases 64.37 64.06 (c) Other borrowing costs 365.51 748.74 4,586.33 4,175.41 Less: Interest capitalised 336.22 219.63 4,250.11 3,955.78
28. othER ExPENsEs(Item No. 2(g), Page 191) Previous Year ` crores ` crores (a) Consumption of stores and spares 8,024.05 6,541.10 (b) Repairs to buildings 486.03 415.36 (c) Repairs to machinery 5,244.06 4,858.01 (d) Relining expenses 116.44 87.25 (e) Fuel oil consumed 1,020.03 874.42 (f) Purchase of power 4,915.45 4,014.77 (g) Conversion charges 1,168.36 1,124.43 (h) Freight and handling charges 6,659.54 6,389.62 (i) Rent 3,377.08 2,833.30 (j) Royalty 927.74 621.52 (k) Rates and taxes 830.11 727.38 (l) Insurance 248.73 309.92 (m) Commission, discounts and rebates 257.12 229.09 (n) Provision for wealth tax 1.80 1.36 (o) Provision for doubtful debts and advances 81.63 190.95 (p) Excise duties 94.70 93.80 (q) Others (1) 4,913.99 4,259.33
38,366.86 33,571.61
Additional information:(1) Includes provision for impairment losses on fixed assets ` 104.95 crores (2010-11: ` 27.91 crores).(2) Other expenses include ̀ 505.99 crores (2010-11: ̀ 639.19 crores) in respect of research and development activities undertaken
during the year.
Hundred and fifth annual report 2011-12
220
29. ExcEPtioNAL itEms(Item No. 4, Page 191) During the year, the Company has sold part of its investment in TRL krosaki Refractories Limited (formerly Tata Refractories
Limited) (TRL) to krosaki Harima Corporation for ` 576.10 crores. Consequently, the Company and its subsidiary’s holding in TRL have reduced to 26.62%. Accordingly, it has ceased to be a subsidiary and became an associate. The Company has also tendered its entire 26.27% stake in Riversdale Mining Limited to Rio Tinto Jersey Holdings Limited. The Company continues to hold 35% stake in Rio Tinto Benga (Mauritius) Limited.
‘Profit on sale of non-current investments' includes ` 441.85 crores on account of sale of shares in TRL and ` 2,920.07 crores on disposal of Tata Steel Global Minerals Holdings investment in Riversdale Mining Limited. In the previous year, the Company had made profit on sale of part of its investments in Tata Motors Ltd., The Tata Power Company Ltd., TRF Limited and Southern Steel Berhad of ` 735.69 crores.
Restructuring, impairment and disposals relate to restructuring, impairment, profit on disposals of fixed assets and undertakings and includes profit of ` 2,503.19 crores on disposal of Teesside Cast Products to Sahaviriya Steel Industries, Thailand on 24th March, 2011.
30. EARNiNgs PER shARE (EPs)(Item No. 11 and 12, Page 191) Previous Year ` crores ` crores (a) Profit after tax, minority interest and share of profit of associates 5,389.77 8,982.69 Less: Dividend on Preference Shares 0.21 – Less: Distribution on Hybrid Perpetual Securities (net of tax) 173.30 4.54 Profit attributable to Ordinary Shareholders – for Basic EPS 5,216.26 8,978.15 Add: Adjustment for 3,820 (31.03.2011: 3,820) 1% Convertible Alternative Reference Securities – 46.14 Adjustment for 5,469.35 (31.03.2011: 5,469.35) 4.5% Foreign Currency Convertible Bonds 162.97 (17.28) Profit attributable to Ordinary Shareholders – for Diluted EPS 5,379.23 9,007.01
Nos. Nos. (b) Weighted average no. of Ordinary Shares for Basic EPS 96,09,56,853 90,65,81,117 Add: Adjustment for 3,820 (31.03.2011: 3,820) 1% Convertible Alternative Reference Securities – 2,10,15,711 Adjustment for 5,469.35 (31.03.2011: 5,469.35) 4.5% Foreign Currency Convertible Bonds 4,21,12,297 4,19,60,304 Adjustment for Options relating to 1,20,00,000 (31.03.2011: 1,20,00,000) Detachable Warrants – 3,53,829
Weighted average no. of Ordinary Shares for Diluted EPS 1,00,30,69,150 96,99,10,961
(c) nominal value of Ordinary Shares ` 10 ` 10 (d) Basic earnings per Ordinary Share ` 54.28 ` 99.03 (e) Diluted earnings per Ordinary Share ` 53.63 ` 92.86
221
31. coNtiNgENt LiAbiLitiEs ANd commitmENts A. Contingent Liabilities (a) Claims not acknowledged by the Company ` crores As at 31.03.2011 (i) Excise 521.52 439.44 (ii) Customs 16.51 13.68 (iii) Sales tax and VAT 583.52 513.61 (iv) State levies 219.32 202.18 (v) Suppliers and service contract 74.63 72.21 (vi) Labour related 42.66 39.77 (vii) Income tax 27.05 125.00 (viii) Royalty (Iron ore) 80.35 – (ix) Others 996.06 631.65
(b) The Company has given guarantees aggregating ` 758.57 crores (31.03.2011: ` 662.73 crores) to banks and financial institutions on behalf of others. As at 31st March, 2012, the contingent liabilities under these guarantees amounts to ` 758.57 crores (31.03.2011: ` 662.73 crores).
(c) Claim by a party arising out of conversion arrangement - ` 195.82 crores (31.03.2011: ` 195.82 crores). The Company has not acknowledged this claim and has instead filed a claim of ` 139.65 crores (31.03.2011: ` 139.65 crores) on the party. The matter is pending before the Calcutta High Court.
(d) The Excise Department has raised a demand of ` 235.48 crores (31.03.2011: ` 235.48 crores) denying the benefit of Notification No. 13/2000 which provides for exemption to the integrated steel plant from payment of excise duty on the freight amount incurred for transporting material from plant to stock yard and consignment agents. The Company filed an appeal with CESTAT, kolkata and the order of the department was set aside. The department has filed an appeal in Supreme Court where the matter is pending.
(e) TMT bars and rods in coil form were sent to an external processing agent (EPA), on payment of duty at Jamshedpur (ex-works) price, for decoiling and cutting into specified lengths and then dispatch, at assessable value to various stock yards and depots of the Company for further sale. Differential duty was paid by the Company after the month was over. Excise department contested this activity as ‘manufacturing’ and demanded duty from the EPA ignoring the payment of duty made by the Company. An appeal against the order of the Commissioner of Central Excise, Jamshedpur was filed in CESTAT, kolkata and was allowed in favour of the EPA. Subsequently, the department challenged the same in Jharkhand High Court, Ranchi which is still pending for hearing. Subsequent demand in this regard has not been adjudicated. Meanwhile, since September 2010, the decoiling and cutting activity with the EPA has been discontinued. The potential liability as of 31st March, 2012, will be approximately ` 298.87 crores (31.03.2011: ` 298.87 crores). However, the Company has already paid duty amounting to ` 196.48 crores (31.03.2011: ` 196.48 crores) till date based on the final sale price of the material.
(f) The State Government of Odisha introduced "Orissa Rural Infrastructure and Socio Economic Development Act 2004" with effect from February 2005 levying tax on mineral bearing land computed on the basis of value of minerals produced from the mineral bearing land. The Company had filed a Writ Petition in the High Court of Odisha challenging the validity of the Act. Odisha High Court held in November 2005 that State does not have authority to levy tax on minerals. The State Government of Odisha moved to the Supreme Court against the order of Odisha High Court and the case is pending with Supreme Court. The potential liability, as of 31st March, 2012 would be approximately ` 2,085.88 crores (31.03.2011: ` 1,562.72 crores).
(g) In terms of the agreements entered into between Tata Teleservices Ltd. (TTSL), Tata Sons Ltd. (TSL) and NTT DoCoMo, Inc. of Japan (Strategic Partner-SP), the Company was given by Tata Sons an option to sell 52,46,590 equity shares in TTSL to the SP.
Pursuant to the rights issue made in 2010-11, SP’s shareholding in TTSL has increased from 1,17,26,17,866 equity shares of ` 10 each to 1,24,89,74,378 equity shares of ` 10 each as on 31st March, 2012. The shareholding of SP represents 26.50% of the paid up equity share capital of TTSL on a fully diluted basis as against 26.27% prior to the issuance and allotment of rights shares to them.
If certain performance parameters and other conditions are not met by TTSL by 31st March, 2014 and should the SP decide to divest its entire shareholding in TTSL, acquired under the primary issue and the secondary sale, and should TSL be unable to find a buyer for such shares, the Company is obligated to acquire the shareholding of the SP, at the higher of fair value or 50 percent of the subscription purchase price subject to compliance with applicable exchange control regulations, in proportion of the number of shares sold by the company to the aggregate of the secondary shares sold to the SP, or if the SP divests the shares at a lower price pay a compensation representing the difference between such lower sale price and the price referred to above.
Hundred and fifth annual report 2011-12
222
Further, in the event of breach of the representations and warranties (other than title and tax) and covenants not capable of specific performance, the Company is liable to reimburse TSL, on a pro rata basis, upto a maximum sum of ̀ 78.75 crores. The exercise of the option by SP being contingent on several variables the liability, if any, is remote and indeterminable.
(h) The Company has been paying royalty on coal extracted from its quarries pursuant to the judgement and order dated 23rd July, 2002 passed by the Jharkhand High Court. However, the State Government demanded royalty at rates applicable to processed coal. Though the Company has contested the above demand, it has started paying, under protest, royalty on processed coal from November 2008. The incremental amount (including interest), if payable, for the period till October 2008 works out to ` 384.64 crores (31.03.2011: ` 355.83 crores) and has been considered as a contingent liability.
b. commitments (a) Estimated amount of contracts remaining to be executed on Capital Account and not provided for: ` 16,236.68 crores
(31.03.2011: ` 14,095.68 crores). (b) uncalled liability on partly paid shares and debentures ` 0.01 crore (31.03.2011: ` 0.01 crore).32. The Company has given undertakings to: (a) ICICI Bank Ltd. (formerly ICICI), IFCI and IIBI not to dispose of its investment
in the Indian Steel Rolling Mills Ltd. (ISRM). The ISRM is under liquidation, (b) IDBI not to dispose of its investment in Wellman Incandescent India Ltd., (c) IDBI and ICICI Bank Ltd. (formerly ICICI) not to dispose of its investment in Standard Chrome Ltd., (d) Standard Chartered Bank, Hong kong and Shanghai Banking Corporation Limited not to dispose of majority stake in Tata Steel (kZN) (Pty) Ltd., (e) Mizuho Corporate Bank Limited and Japan Bank of International Co-operation, not to dispose of its investments in Tata NYk Shipping Pte. Limited, (minimal stake required to be able to provide a corporate guarantee towards long-term debt), (f) State Bank of India not to dispose of the management control (indirectly held) in Tata Steel uk Holdings Ltd. and Tata Steel Netherlands Holding B.V. and other companies (the borrower group), (g) Bank of America N.A. Singapore, Hong kong and Shanghai Banking Corporation Limited and The Royal Bank of Scotland N.V. not to dispose of the management control (indirectly held) in Tata Steel Global Procurement Company Pte. Limited, (h) Standard Chartered Bank, Singapore not to dispose of the management control (directly held) in NatSteel Asia Pte. Limited, (i) IL&FS Trust Company Ltd., not to transfer, dispose off, assign, charge or lien or in any way encumber its holding in Taj Air Ltd., without the prior consent of the respective financial institutions/banks so long as any part of the loans/facilities sanctioned by the institutions/banks to these companies remains outstanding.
The Company has furnished a security bond in respect of its immovable property to the extent of ` 20 crores in favour of the Registrar of the Delhi High Court and has given an undertaking not to sell or otherwise dispose of the said property.
The Promoters of Tata BlueScope Limited (TBSL) (i.e. BlueScope Steel Limited, Australia and Tata Steel Ltd.) have given an undertaking to IDBI Trusteeship Services Ltd., Debenture Trustees, not to dispose of the management control in TBSL.
The Promoters’ (i.e. L & T Infrastructure Development Projects Ltd. and Tata Steel Ltd.) combined investments in The Dhamra Port Company Ltd., (DPCL) representing 51% of DPCL’s paid-up equity share capital are pledged with IDBI Trusteeship Services Ltd.
The Promoters’ (i.e. The Tata Power Company Limited and Tata Steel Ltd.) combined investments in Industrial Energy Limited, (IEL) representing 51% of IEL’s paid-up equity share capital are pledged with Infrastructure Development Finance Corporation Limited (IDFC).
Tata Steel Global Minerals Holdings Pte Ltd. (TSGMH), a subsidiary and Riversdale Mining Limited (RML), (erstwhile an associate of the Company) have executed a deed of cross charge in favour of each other to secure the performance of obligation under Joint Venture agreement and funding requirements of the Joint Venture Rio Tinto Benga (Mauritius) Ltd. (RTBML) (Formerly Riversdale Energy (Mauritius) Limited) upto a maximum amount of uS$ 100 mn on the shares of RTBML and all of its present and future benefits and rights under the Joint Venture agreement.
33. The Company had, on 20th August, 2005, signed an agreement with the Government of Jharkhand to participate in a special health insurance scheme to be formulated by the Government of Jharkhand for the purpose of providing medical facilities to the families of the people below poverty line. The State Government would develop a suitable scheme and the Company has agreed to contribute to such scheme, when operational, a sum of ̀ 25 crores annually for a period of 30 years or upto the year of operation of the scheme whichever is lower. In the current year, the Government initiated discussion and the Company provided a draft trust deed to the Government for formation of the scheme and trust. The matter is still under discussion. The scheme is yet to be formed and no contribution has been made till 31st March, 2012.
34. Indian Steel & Wire Products Ltd. (ISWPL), a subsidiary, was declared a sick industrial company within the meaning of Section 3(i)(o) of the Sick Industrial Companies (Special Provisions) Act, 1985 (hereinafter referred to as ‘SICA’). The Board for Industrial and Financial Reconstruction (BIFR) sanctioned a scheme vide its order dated 22nd October, 2003, 21st november, 2003 and 18th December, 2003 for rehabilitation of the ISWPL by takeover of its management by Tata Steel Limited.
The significant notes appearing in the accounts of Indian Steel & Wire Products Ltd. are given below: As per clause 6.12(xiii) of BIFR Order dated 21st November, 2003, all liabilities not disclosed in the audited balance sheet for
the year ended 31st March, 2002 including notes on accounts as then would be the personal responsibility of the erstwhile
223
promoters to discharge. In view of the above, the following liabilities, which were not disclosed in the said balance sheet including the notes on accounts, have not been provided for or recognised in the accounts for financial year 2003-04, 2004-05, 2005-06, 2006-07, 2007-08, 2008-09, 2009-10, 2010-11 as well as accounts for financial year 2011-12.
Particulars ` crores
Show cause notices/Demand raised by Central Excise Authorities (under Appeal) 0.29 Demands raised by Sales Tax Authorities (under Appeal) 4.72 Employee State Insurance demand (under Appeal) 1.49 Leave liability for ex-employees 0.33 Labour court cases 0.01 Income tax demand (under Appeal) – Railway dues 0.04 Power dues 6.21 Liability for loan for Learjet Aircraft purchase 1.49 Wealth tax 3.90 Liability for Security Services 0.32 During the year, the Company has received the final order from the Income Tax Authorities for the assessment year 1998-99 for
` 2.70 crores against the contingent liability of ` 3.05 crores. Accordingly, this amount has been charged to the Statement of Profit and Loss for the year ended 31st March, 2011 as provision for income tax for prior years. The claim has already been lodged with the erstwhile management for recovery.
The items indicated above are not exhaustive and any other liability, which may come to the notice of the present management also, would be the personal liability of the erstwhile promoters.
35. The notes to accounts of Tata korf Engineering Services Limited (TkES), a subsidiary, state that: The accumulated losses of the Company as at 31st March, 2012 exceed its paid-up Share Capital. The Company has practically closed its operations. Pending the preparation of a scheme, the financial statements have been prepared on a “going concern” basis. The report of the auditors to the members of TkES contains an audit qualification on this account.
Tata korf Engineering Services Ltd. has a negative net worth as on 31st March, 2012 of ` 9.12 crores (31.03.2011: ` 8.77 crores).
36. The effect of acquisition and disposal of subsidiaries on the financial position and results as included in the consolidated financial statements for the year ended 31st March, 2012 are given below:
` crores
Acquisition Disposal
Equity ANd LiAbiLitiEs Share capital 217.13 20.90 Reserves and surplus 389.46 239.88 Minority interest – 5.25 Borrowings 101.02 170.96 Deferred tax liability 64.70 15.52 Other non-current liabilities 24.55 13.50 Other current liabilities 201.71 210.02 AssEts Fixed assets 789.04 258.99 Investments 0.27 1.01 Loans and advances 121.23 48.84 Inventories 52.55 162.29 Trade receivables 34.10 193.83 Cash and bank balances 1.38 11.09 REvENuE Revenue from operations 641.18 150.70 Other income 4.83 0.17 ExPENsEs Manufacturing and other expenses 553.07 141.41 Depreciation and amortisation expense 48.19 4.95 Finance costs 16.83 2.88 PRofit bEfoRE tAx foR thE yEAR 27.92 1.63
Hundred and fifth annual report 2011-12
224
37. In one of the subsidiaries, in terms of the License Agreement dated 29th January, 2002 with Board of Trustees for the Port of kolkata, the subsidiary is required to invest in equipment and infrastructure as follows:
Phasing of investment (` crores)
Within 18 Within 24 Within 36 Total Purpose of Investment months months months
1. For procurement of equipment for ship to shore handling and vice versa and horizontal transfer of cargo 23.06 2.85 – 25.91 2. Storage of cargo – 1.74 1.20 2.94 3. Office building, workshop etc. – 0.75 0.25 1.00 4. utility Services – 0.22 – 0.22 23.06 5.56 1.45 30.07
As at 31st March, 2012 the subsidiary’s investments in equipments and infrastructure aggregate to ` 25.80 crores (31.03.2011: ` 25.80 crores). The management of the subsidiary company has requested the Port Trust Authorities for suitable modification to the investment obligation in view of the changes in the business and economic scenario. The Port Trust Authorities have, subject to sanction of Central Government approved the changes proposed by the subsidiary in the specifications of the equipments and other required infrastructure.
38. In respect of joint ventures directly owned by the Company, the contingent liabilities and capital commitments are as follows:
Name of the Joint Venture Company Country of Percentage of Contingent Capital Incorporation Holding Liabilities Commitment ` crores ` crores mjunction services limited India 50% 0.60 0.30 – – The Dhamra Port Company Limited India 50% – 24.18 – 76.18 Tata BlueScope Steel Limited India 50% 25.74 17.66 20.26 56.05 Tata NYk Shipping Pte. Ltd. Singapore 50% 219.85 185.81 – 171.91 Bhubaneshwar Power Private Limited India 26% 0.73 70.60 0.73 70.60 S & T Mining Company Private Limited India 50% – 0.13 – 0.04 Himalaya Steel Mill Services Private limited India 26% – – – –
39. LEAsEs The break-up of total minimum lease payments for operating lease due as on 31st March, 2012, entered into by the Company,
its subsidiaries and joint ventures are as follows: ` crores As at 31.03.2011 Period not later than one year 1,323.38 1,344.52 Later than one year but not later than five years 3,265.98 3,371.12 Later than five years 3,589.11 2,331.11 total 8,178.47 7,046.75
225
The total charge to the Statement of Profit and Loss for the year on account of operating lease is ` 1,099.52 crores (2010-11: ` 1,005.71 crores).
The Company, its subsidiaries and joint ventures have taken certain leaseholds on finance lease, having an aggregate cost of ` 1,601.76 crores (31.03.2011: ` 1,509.40 crores). The break-up of total minimum lease payments for finance lease due as on 31st March, 2012 and their corresponding present value are as follows:
` crores As at 31.03.2011 Period Minimum Minimum Lease Present Lease Present Payments Value Payments Value not later than one year 159.94 99.90 159.87 101.73 Later than one year but not later than five years 553.66 362.57 521.33 338.50 Later than five years 672.07 504.48 685.41 503.91 total 1,385.67 966.95 1,366.61 944.14
40. EmPLoyEE bENEfits (a) The Company has recognised, in the Statement of Profit and Loss for the current year, an amount of ̀ 349.28 crores (2010-11:
` 299.15 crores) as expenses under the following defined contribution plans.
` crores Benefit (Contribution to) 2010-11
Provident Fund 207.85 169.71 Superannuation Fund 55.61 45.30 Employees Pension Scheme/Coal Mines Pension Scheme 70.00 70.29 TISCO Employees Pension Scheme 15.27 13.37 Employees State Insurance 0.55 0.48 349.28 299.15
(b) The Company operates post retirement defined benefit plans as follows: Funded - Post Retirement Gratuity - Post Retirement Pension Plan unfunded - Post Retirement Medical Benefits - Pensions to Directors - Farewell Gifts - Packing and Transportation Expenses (c) Details of the post retirement gratuity plan are as follows: ` crores description 2010-11 (i) Reconciliation of opening and closing balances of obligation Obligation as at the beginning of the year 1,642.74 1,258.50 Current service cost 84.84 62.17 Interest cost 125.96 95.67 Plan Amendments 0.08 0.49 Obligation of new companies 23.74 – Actuarial (gain)/loss 24.45 325.22 Exchange rate difference 3.60 1.97 Obligation of companies sold (17.06) – Benefits paid (125.71) (101.28) Obligation as at the end of the year 1,762.64 1,642.74 The defined benefit obligation as at 31.03.2012 is funded except in the case of Tata BlueScope Steel Ltd., Bhubaneshwar Power Private Limited, NatSteel Asia Pte Ltd., S & T Mining Co. Private Ltd., NatSteel Holding Pte. Ltd., Tata Steel (Thailand) Public Company Ltd. and Lanka Special Steel Ltd.
Hundred and fifth annual report 2011-12
226
(ii) Reconciliation of opening and closing balances of plan assets Fair value of plan assets as at beginning of the year 1,228.95 1,092.87 Expected return on plan assets 109.63 89.35 Assets of new companies 22.46 – Actuarial gain/(loss) 20.78 6.90 Employers’ Contributions 385.52 137.94 Plan assets of companies sold (16.12) – Benefits paid (116.66) (98.11) Fair value of plan assets as at end of the year 1,634.56 1,228.95 (iii) Reconciliation of fair value of assets and obligations Fair value of plan assets as at end of the year 1,634.56 1,228.95 Present value of obligation as at the end of the year 1,762.64 1,642.74 unrecognised past service cost 0.07 0.13 Amount recognised in the balance sheet 128.01 413.66 - Provisions 128.67 413.82 - Loans and advances (0.66) (0.16) (iv) Expenses recognised in the year Current service cost 84.84 62.17 Interest cost 125.96 95.67 Expected return on plan assets (109.63) (89.35) Actuarial (gain)/loss 3.67 318.32 Past Service Cost – 0.28 Expense recognised during the year 104.84 387.09
31.03.2012 31.03.2011 (v) Investment details % % GOI securities 15 10 Public Sector unit bonds 16 28 Central/State Government Guaranteed securities 6 5 Private sector unit bonds 10 7 Others (including bank balances) 53 50 100 100 (vi) Assumptions Discount rate (per annum) 0.45-8.90% 0.91-8.50% Expected Return on Plan Assets (per annum) 7.50-9.25% 4.25-9.25% Rate of escalation in salary (per annum) 4.00-10.00% 4.00-10.00%
(vii) Other Disclosures Experience adjustment on plan liabilities - gain/(loss) (89.95) (194.77) Experience adjustment on plan assets - gain/(loss) 20.78 6.72
The basis used to determine overall expected rate of return on assets and the effect on major categories of plan assets is as follows:
The major portions of the assets are invested in PSu bonds and GOI securities. Based on the asset allocation and prevailing yield rates on these asset classes, the long-term estimate of the expected rate of return on the fund assets have been arrived at. Assumed rate of return on assets is expected to vary from year to year reflecting the returns on matching Government bonds.
` crores
description 2010-11
227
(d) Details of Post Retirement Pension plans are as follows:
` crores
description 2010-11 (i) Reconciliation of opening and closing balances of obligation Obligation as at the beginning of the year 1,13,762.22 1,07,476.89 Current service cost 1,309.58 1,223.72 Interest cost 6,310.50 5,614.71 Actuarial (gain)/loss 10,081.29 225.29 Exchange rate difference 13,911.50 5,184.75 Settlements and curtailments (76.58) (310.52) Benefits paid (6,279.87) (6,098.14) Employee contribution 490.14 445.52 Obligation as at the end of the year 1,39,508.78 1,13,762.22 (ii) Reconciliation of opening and closing balances of plan assets Fair value of plan assets as at beginning of the year 1,16,048.78 1,09,009.37 Expected return on plan assets 6,962.61 6,385.90 Actuarial gain/(loss) 7849.84 (331.77) Employees’ Contributions 490.14 445.52 Employers’ Contributions 1,508.70 1,372.12 Refund of scheme assets – (12.53) Benefits paid (6,279.87) (6,112.28) Exchange rate difference 14,107.96 5,292.45 net fair value of plan assets as at end of the year 1,40,688.16 1,16,048.78 (iii) Reconciliation of fair value of assets and obligations Fair value of plan assets as at end of the year 1,40,688.16 1,16,048.78 Present value of obligation as at the end of the year 1,39,508.78 1,13,762.22 Amount recognised in the balance sheet - Asset 1,179.38 2,286.56 - Provisions (418.44) (222.22) - Loans and advances 1,597.82 2,508.78 (iv) Expenses recognised in the year Current service cost 1,309.58 1,223.72 Interest cost 6,310.50 5,614.71 Expected return on plan assets (6,962.61) (6,385.90) Actuarial (gain)/loss (1) 2,231.45 557.06 Settlements and curtailments (76.58) (310.52) Expense recognised during the year 2,812.34 699.07
description 31.03.2012 31.03.2011 % % (v) Investment details Equities 27 29 Bonds 63 60 Property 7 7 Others (including bank balances) 3 4 100 100 (vi) Assumptions Discount rate (per annum) 2.50-4.80% 3.00-5.90% Expected Return on Plan Assets (per annum) 1.00-3.45% 2.00-9.60% Rate of escalation in salary (per annum) 1.00-4.20% 1.00-4.60% (vii) Other Disclosures Experience adjustment on plan liabilities - gain/(loss) 206.78 (106.07) Experience adjustment on plan assets - gain/(loss) 7,849.84 332.34
Hundred and fifth annual report 2011-12
228
(1) The consolidated Statement of Profit and Loss includes the consolidated results of Tata Steel Europe Limited and its subsidiaries whose income contributes 60% of the consolidated total revenue. The pension and other post retirement defined benefit liability of Tata Steel Europe Limited is computed and accounted for in accordance with International Financial Reporting Standards (IFRS). IFRS permits the impact of changes in the assets and liabilities, inter alia, due to assumption of variables like bond yield rates, inflation and demographic assumptions to be accounted for in “Reserves and Surplus”. This practice is consistently followed by Tata Steel Europe Limited. The Accounting Standard (AS-15) – Employee Benefits is different from the above and requires such changes to be accounted for in the Statement of Profit and Loss. Given the large share of Tata Steel Europe Limited in the consolidated Statement of Profit and Loss of the Company, and the potential volatility caused by periodic changes in the assumptions underlying the computation of the liabilities, it is not considered practicable to adopt a common accounting policy for accounting of the actuarial gains/losses in respect of the pension and other post retirement defined benefit liability of the Company and Tata Steel Europe Limited. Accordingly the actuarial loss of ` 2,372.26 crores (2010-11: ` 402.81 crores) (net of tax) recognised in Tata Steel Europe Limited has been accounted in Reserves and Surplus in the consolidated financial statements in accordance with IFRS principles and as permitted by Accounting Standard 21 – Consolidated Financial Statements. Had the Company followed the practice of recognising changes in actuarial valuations in respect of the pension and other post retirement benefit plans of Tata Steel Europe Limited, in the Statement of Profit and Loss, the profit after tax, minority interest and share of profit of associates would have been lower by ` 2,372.26 crores (2010-11: ` 402.81 crores).
(e) Details of the unfunded post retirement defined benefit obligation are as follows:
` crores
2010-11 description Medical Others Medical Others (i) Reconciliation of opening and closing balances of obligation Obligation as at the beginning of the year 731.62 599.54 612.61 595.71 Current/Employer service cost 8.41 17.30 6.84 8.84 Interest cost 57.78 27.60 47.05 25.48 Obligation of new companies 11.42 1.27 – – Actuarial (gain)/loss (52.61) 63.06 114.35 (32.95) Exchange rate difference – 53.82 – 20.01 Obligation of companies sold (5.83) (3.68) – – Benefits paid (33.24) (27.24) (49.23) (17.55) Obligation as at the end of the year 717.55 731.67 731.62 599.54 (ii) Expenses recognised in the year Current/Employer service cost 8.41 17.30 6.84 8.84 Interest cost 57.78 27.60 47.05 25.48 Actuarial (gain)/loss (52.61) 63.06(1) 114.35 (32.95)(1)
Expense recognised during the year 13.58 107.96 168.24 1.37 (iii) Assumptions Discount rate (per annum) as at the beginning of the year 8.00-8.40% 3.30-8.00% 7.00-8.40% 3.90-8.00% Discount rate (per annum) as at the end of the year 8.00-8.70% 4.20-8.70% 8.00-8.40% 3.30-8.00% Medical costs inflation rate 5.00-8.00% 5.00% Effect of a 1% change in health care cost on Increase - aggregate current service and interest cost 8.72 8.91 - closing balance of obligation 115.51 94.93 Decrease - aggregate current service and interest cost (0.35) (5.10) - closing balance of obligation (83.48) (69.49) (iv) Other Disclosures Experience adjustment on plan liabilities - gain/(loss) (106.26) (65.80) (114.35) (2.41)
229
41. sEgmENt REPoRtiNg Primary Segment Information (Business Segment)
Secondary Segment Information (Geographical Segment) ` crores 2010-11 Segment Revenue – Within India 35,156.08 30,815.20 – Outside India 97,743.62 87,937.92 1,32,899.70 1,18,753.12 Capital Expenditure – Within India 7,927.07 6,886.66 – Outside India 5,254.50 2,953.68 13,181.57 9,840.34 31.03.2011 ` crores Segment Assets – Within India 50,126.26 42,380.03 – Outside India 75,650.36 70,117.14 1,25,776.62 1,12,497.17
Business Segments
Hundred and fifth annual report 2011-12
230
Additional information:(1) The Company has disclosed Business Segment as the primary segment. Segments have been identified taking into account the
nature of the products, the differing risks and returns, the organisational structure and internal reporting system. The Company’s operations predominantly relate to manufacture of Steel. Other business segments comprise of Tubes, Bearings, Refractories, Pigments, Port operations, Town services and Investment activities.
(2) Segment Revenue, Segment Results, Segment Assets and Segment Liabilities include the respective amounts identifiable to each of the segments as also amounts allocated on a reasonable basis. The expenses, which are not directly relatable to the business segment, are shown as unallocated corporate cost. Assets and liabilities that cannot be allocated between the segments are shown as unallocated corporate assets and liabilities respectively.
(3) unallocable Assets and Liabilities exclude. ` crores As at 31.03.2011 Assets: non-current investments 2,259.98 4,379.75 Current investments 1,381.76 3,137.55 Advance against equity 0.85 – Goodwill on consolidation 17,354.61 15,298.20 Deferred tax assets 61.44 175.56 Foreign Currency Monetary Item Translation Difference Account 404.90 – 21,463.54 22,991.06 Liabilities: Long-term borrowings 45,238.24 49,250.69 Short-term borrowings 4,699.08 3,794.44 Current maturities of long-term borrowings 9,959.45 7,633.67 Hybrid perpetual securities 2,275.00 1,500.00 Provision for employee separation compensation 772.68 879.37 Deferred tax liabilities 2,503.85 2,188.18 Preference shares issued by subsidiary companies 22.43 – Share warrants issued by a subsidiary company 17.46 17.46 Minority interest 1,091.15 888.90 66,579.34 66,152.71
(4) Transactions between segments are primarily for materials which are transferred at market determined prices and common costs are apportioned on a reasonable basis.
42. RELAtEd PARty discLosuREsList of Related Parties and Relationships
Associate through:i) Kalimati Investment Company Ltd. 1. Rujuvalika Investments Limited
ii) NatSteel Asia Pte. Ltd. 1. Steel Asia Development and Management Corp. 2. Steel Asia Industries Inc. 3. Steel Asia Manufacturing Corporation
v) Tata Steel Ltd. 1. Indian Steel Rolling Mills Ltd. 2. Industrial Energy Limited 3. Jamipol Limited 4. kalinga Aquatics Ltd. 5. kumardhubi Fireclay & Silica Works Ltd. 6. kumardhubi Metal Casting & Engineering Ltd. 7. Nicco Jubilee Park Limited 8. Strategic Energy Technology Systems Pvt. Limited 9. Tata Construction & Projects Ltd. 10. Tata Sponge Iron Limited 11. TRL krosaki Refractories Limited * 12. The Tinplate Company of India Ltd. * 13. TRF Limited
231
vi) Tata Steel Holdings Pte. Ltd. a) Tata Steel Global Holdings Pte Ltd. I. Tata Steel International (Singapore) Holdings
Pte. Ltd. 1. European Profiles Malaysia (M) Sdn.Bhd. II. Tata Steel Europe Limited 1. Ab Norskstal AS 2. Albi Profils SRL 3. Appleby Frodingham Cottage Trust Limited 4. Combulex B.V. 5. Cv Gasexpansie Ijmond 6. Danieli Corus Canada Inc. 7. Danieli Corus Asia B.V. 8. Danieli Corus B.V. 9. Danieli Corus Braseq Ltda. 10. Danieli Corus Construction Services B.V. 11. Danieli Corus Construction Services usa Inc. 12. Danieli Corus Do Brasil Ltda. 13. Danieli Corus Inc. 14. Danieli Corus Services usa Inc. 15. Danieli India (Pvt.) Ltd. 16. European Profiles (Marketing) Sdn.Bhd. 17. Galvpro LP. 18. Gietwalsonderhoudcombinatie B.V. 19. Hoogovens Court Roll Service Technologies
Vof: 20. Hoogovens Gan Multimedia S.A. De C.V. 21. Isolation Du Sud SA 22. Issb Limited 23. MDC Sublance Probe Technology 24. Regionale Ontwikkelingsmaatschappij Voor
Het Noordzeekanaalgebied N.V. * 25. Richard Lees Steel Decking Asia Snd. Bhd. 26. Rsp Holding B.V. 27. Schreiner Fleischer AS 28. Shanghai Bao Yi Beverage Can Making Co.
Ltd. 29. Sms Mevac uk Limited * 30. Thoresen & Thorvaldsen AS 31. Trico LLC 32. Weirton/Hoogovens GP 33. Wupperman Staal Nederland B.V. III. Tata Steel Global Minerals Holdings Pte Ltd. 1. New Millennium Iron Corporation 2. Riversdale Mining Ltd. *
vii) The Indian Steel and Wire Products Ltd. 1. Metal Corporation of IndiaJoint Ventures of:i) Tata Steel Ltd. 1. Bhubaneshwar Power Private Limited 2. Himalaya Steel Mill Services Private Limited 3. mjunction services limited 4. S & T Mining Company Private Limited 5. Tata BlueScope Steel Limited 6. Tata NYk Shipping Pte Ltd. 7. The Dhamra Port Company Limitedii) Tata Steel Holdings Pte. Ltd. a) Tata Steel Global Holdings Pte Ltd. i. Tata Steel Europe Limited 1. Afon Tinplate Company Limited 2. Air Products Llanwern Limited 3. B V Ijzerleew 4. Bsr Pipeline Services Limited 5. Caparo Merchant Bar Plc 6. Tata Steel Ticaret AS 7. Corus Cogifer Switches And Crossings
Limited 8. Corus kalpinis Simos Rom SRL. * 9. Danieli Corus Technical Services B.V. 10. Hks Scrap Metals B.V. 11. Ijzerhandel Geertsema Staal B.V. 12. Industrial Rail Services Ijmond B.V. 13. Laura Metaal Holding B.V. 14. Norsk Stal AS 15. Norsk Stal Tynnplater AS 16. Ravenscraig Limited 17. Tata Elastron SA 18. Tata Elastron Steel Service Center SA 19. Texturing Technology Limited 20. Redcar Bulk Terminal Limited II. Tata Steel Global Minerals Holdings Pte. Ltd. 1. Rio Tinto Benga (Mauritius) Limited
Promoters’ holding together with its Subsidiaries is more than 20%(i) Tata Sons Ltd. Key Management Personnel (i) Mr. H. M. Nerurkar - Whole-time Director (ii) Dr. karl-ulrich koehler - Managing Director &
Chief Executive Officer, Tata Steel Europe Limited
* Part of the year.
Hundred and fifth annual report 2011-12
232
Related Party Transactions ` crores
Transactions Associates key Relatives of key Promoter Total and JVs Management Management # Personnel Personnel
43. Figures pertaining to the subsidiary companies and joint ventures have been reclassified where necessary to bring them in line with the Company’s financial statements.
44. Previous year’s figures have been recast/restated where necessary.45. Figures in italics are in respect of the previous year.
A ANJENEYANCompany SecretaryMumbai, 18th May, 2012
For and on behalf of the BoardRATAn n TATA ChairmanB MuTHuRAMAn Vice ChairmanS M PALIA ISHAAT HuSSAInSuBODH BHARGAVA DirectorsJACOBuS SCHRAVENAnDREW ROBBkARL-uLRICH kOEHLERH M nERuRkAR Managing Director