144
2015 ANNUAL REPORT FINANCING THE FUTURE OF ENERGY SM

2 0 1 5 A N N UA L R E P O RT
F I N A N C I N G T H E F U T U R E O F E N E R G Y SM

EFFICIENCY. WIND. SOLAR.HANNON ARMSTRONG IS FINANCING THE FUTURE OF ENERGY.

3
Hannon Armstrong (NYSE: HASI) provides debt and equity financing to the efficiency, wind and solar markets. We focus on providing preferred or senior level capital to established sponsors and high credit quality obligors for assets that generate long-term, recurring and predictable cash flows.
We are internally managed and our management team has extensive industry knowledge and experience, having completed its first renewable energy financing more than 25 years ago and its first energy efficiency financing over 15 years ago. Since our initial public offering in 2013, we have completed transactions worth more than $2.4 billion—including over $935 million in 2015—with leading service providers, including a number of Global 1000 corporations and private developers.
COMPANY OVERVIEW
Closed
transactionsin 2015
$935m
INVESTMENT PORTFOLIO
2014
$900m
2015
$1.35b
2013
$468m

DEAR STOCKHOLDERS:
As a leading provider of capital to the clean energy industry, Hannon Armstrong exists at the intersection of financial markets and energy markets, which experienced tremendous changes in 2015. Volatility in both markets increased in dramatic fashion in the second half of 2015, for different reasons, after a rather placid first half of the year. While the change was breathtaking, it was not unprecedented for Hannon Armstrong: we remember making money during the Great Recession, during the early 2000s encompassing the tech crash and Enron implosion, and even in the 1980s when clean energy really got started. From each of these difficult markets, we learned some things about how to build and grow our business in a way that will survive what the markets throw at us. We believe we have built the business to prosper in various interest rate and commodity market environments. A key component of this is growing a multi-dimensional portfolio originated from multiple clients that is diversified across size, technology, region and obligors. And, when tailwinds develop, like the 2015 Paris Climate Accord and the 5 year extension of the Investment Tax Credit (ITC) and Production Tax Credit (PTC) for solar and wind, respectively, we are well positioned to capitalize on the opportunities in front of us.
All the while, we are investing in assets that are making a meaningful and calculated difference in
reducing U.S. greenhouse gas (GHG) emissions. One of our goals when we went public was to set the ’gold standard’ for environmental, social and governance (ESG) factors. We are particularly pleased with the investor reception of our GHG accounting in our Sustainability Report Card and our use of CarbonCountTM on our Sustainable Yield® Bonds (SYBs).
We increased Core Earnings per share 12% for the year ended December 31, 2015, compared to 2014 . We also raised our dividend 15% and increased our Portfolio by approximately 50% to $1.35 billion. We were pleased to announce expansions of our historic energy efficiency platform to include commercial and industrial transactions with new energy service companies, channel partners and a large REIT. Our renewable energy land ownership business continues to grow and should benefit from the ITC/PTC extension as the best solar and wind owners enjoy better visibility for transactions over the next five years. Our wind portfolio continues to grow with increased investments for existing wind farms and with new-build distributed and utility scale wind alongside the leading tax equity investors and wind operators. As is our preference, we generally sit in the senior or preferred position in the capital stack, consistent with our view on where the best risk-adjusted yields reside.
4
STOCKHOLDER LETTER
*Core Earnings is a non-GAAP financial measure. See our Annual Report on Form 10-K for an explanation of core earnings and a reconciliation to our GAAP earnings.
*

5
2015 AND OUTLOOK FOR 2016
While the capital markets were quite volatile in late 2015 and into 2016, the market for our type of financing has grown nicely. Capital is getting priced more appropriately, reliability of capital providers is now considered by counter-parties rather than taken for granted and the fundamental economics of the efficiency, wind and solar assets are continuing to improve. We continue to fix out our interest rate exposure, achieving the high end of our target range at the end of 2015. Our Portfolio of $1.35 billion of assets, in over 105 separate transactions, ended the year with a blended December 31, 2015 yield of 6.2% and an average life of 10 years and provides a solid foundation from which we will grow earnings. We have established a target Core Earnings per share growth rate of 14% -19% for 2016 which we expect to achieve by adding more assets and increasing our financial and operating leverage. Our pipeline of more than $2.5 billion at year -end continues to be optimized for opportunities that offer the best risk-adjusted yields and which support the growth of our clients’ businesses.
CLIMATE CHANGE
Bloomberg New Energy Finance has estimated that approximately $500 billion of capital needs to be invested in clean energy assets in each of the next 25 years in order to ensure global temperatures rise no
more than 2° Celsius. I take some comfort that Hannon Armstrong, only public for 3 years, is already providing 1/500th of that amount now. Hannon Armstrong intends to be investing in clean energy assets for the long haul while continuing to learn from markets how to survive and prosper during periods of change. Our goal is to be the firm that rewards its investors with a sustainable yield, all the while, financing the future of energy.
CONCLUSION
Again, I want to thank the Hannon Armstrong team for an outstanding 2015. We are delighted to have added staff that is motivated by our purpose, guided by their excellent investment skills and committed to working as a team. We look forward to continuing to grow the business thoughtfully, with purpose and discipline for the benefit of our clients, our staff and, of course, our stockholders.
Thank you for investing in Hannon Armstrong.
Respectfully,
Jeffrey W. EckelChairman, President and CEO
Our Portfolio of $1.35 billion of assets, in over 105 separate transactions, with a blended December 31, 2015 yield of 6.2% and an average life of 10 years, provides a solid foundation from which we will grow earnings.

6
2015 ACHIEVEMENTS
Increase in dividend per share to $0.30
15 %
In Core Earnings per share, 12% Annual Core EPS Growth
1.04$
Transactions Closed in 2015
935m$
Leverage Achieved
2.1 : 1
HASI Sustainable Yield® Bond Completed in 2015
1$ 00m
Fixed Rate Debt Target Achieved
71%
BALANCE SHEET AT YEAR END
$0.57B
2013
$1.00B
2014
$1.47B
2015
COMMON EQUITY AT YEAR END
$151M
2013
$274M
2014
$432M
2015
CORE EARNINGS PER SHARE
$0.43
2013
$0.93
2014
$1.04
2015
CLOSED TRANSACTIONS
$632M
2013
$875M
2014
$935M
2015
FINANCIAL PROFILE HIGHLIGHTSINCREASING DIVIDENDS
$0.30
$0.23
$0.08
$0.00
$0.15
$0.06
$0.22
$0.14
$0.22 $0.22 $0.22
$0.26 $0.26 $0.26 $0.26
$0.30
2013 2014 2015

7
• Internally Managed Management is aligned with shareholders
• Increasing ESG Transparency Raising the bar on Environmental, Social and Governance best practices
• Diverse Market Particiption Multiple technologies, clients & obligors
• The Power of “N” Over 105 individual projects in Portfolio
• Diversified Shareholder Base Lessens market volatility; provides long - term stability
• Steady Growth Focus on reasonable, sustainable, accretive growth
HANNON ARMSTRONG IS DIFFERENT BY DESIGN
COMPARISON OF CUMULATIVE TOTAL RETURN*
$70
$200
$190
$180
$170
$160
$150
$140
$130
$120
$110
$100
$90
$80
4/18/2013 12/31/2013 12/31/2014 12/31/2015
Dow Jones Utility Average SNL Finance REITHASI S&P 500
*Assumes $100 invested at closing on April 18, 2013 (our first day of trading) and that all dividends were reinvested without the payment of any commissions. SNL Finance REIT index is an index created by S&P Global Market Intelligence. See Annual Report on Form 10-K for additional information.
HASI CumulativeTotal Return 94%

8
2015 SUSTAINABILITY REPORT CARD
Estimated carbon savings are calculated using the estimated kilowatt hours (“kWh”), gallons of fuel oil, million British thermal units (“MMBtus”) of natural gas and gallons of water saved as appropriate, for each project. The energy savings are converted into an estimate of metric tons of CO2 equivalent emissions based upon the project’s location and the corresponding emissions factor data from the U.S. Government and International Energy Administration. Portfolios of projects are represented on an aggregate basis.
TOTAL METRIC TONS OF CO2 SAVINGSPER $1,000 INVESTED
0.39
2014
0.52
2013
0.72
2015
331,000 341,000
651,000
2013 2014 2015
TOTAL METRIC TONS OF CO2 SAVINGS
0.53
Efficiency
0.23
Solar
1.48
Wind
2015 IMPACT BY ASSET CLASS
MT
of G
HC
/$1,
000
of In
vestm
ent
We define sustainability as positively impacting the environment while being neutral or negative on GHG emissions. As part of our investment evaluation process, projects are screened for GHG reductions and other environmental benefits, such as water use reduction.
We plan to report these metrics on an annual basis. If carbon counts and capital is scarce, we believe in evaluating investments not only for their financial returns, but also for their impactfulness in reducing GHG.
Metric Tons of CO2 per $1,000 Invested
0.72
Metric Tons of CO2
651,000
Gallons of Water
140 Million
EfficiencyEfficiencyWindEfficiencyEfficiencyEfficiencyEfficiencyWindEfficiencyOtherEfficiencyEfficiencyEfficiencyEfficiencyWindSolarWindSolarSolarSolarEfficiencyEfficiencyEfficiencyEfficiencySolarEfficiencyEfficiencyWindEfficiencyEfficiencySolar
3.152.992.602.402.362.252.232.062.001.691.581.511.170.960.920.760.740.640.640.620.600.580.580.540.530.510.490.470.460.410.38
MidwestMidwestMidwestMidwestMidwestMidwestMidwestMidwestMidwestSouthSouthMidwestMidwestSouthSouthSouthNationalSouthSouthSouthSouthSouthWestMidwestSouthWestSouthWestSouthSouthWest
SolarEfficiencyEfficiencySolarEfficiencySolarEfficiencyEfficiencySolarEfficiencyEfficiencyEfficiencySolarEfficiencyEfficiencySolarSolarEfficiencyEfficiencyEfficiencySolarSolarSolarSolarEfficiencyEfficiencyEfficiencyEfficiencySolarOtherEfficiency
0.380.360.330.320.290.290.260.260.250.250.210.210.190.180.180.170.160.130.130.130.130.120.120.100.070.050.050.050.050.000.00
WestWestWestWestSouthWestWestWestWestMidwestSouthAsia PacificWestWestWestWestWestAsia PacificWestEuropeWestWestNationalNationalSouthWestCentral AmericaSouthInternationalWestSouth
Region
MTs of CO2e offset annually
per $1000 investedTechnology Region
MTs of CO2e offset annually
per $1000 investedTechnology
2015 Totals


THIS PAGE IS INTENTIONALLY LEFT BL ANK

UNITED STATESSECURITIES AND EXCHANGE COMMISSION
WASHINGTON, D.C. 20549
FORM 10-K
È ANNUAL REPORT PURSUANT TO SECTION 13 OR 15(d) OF THE SECURITIES EXCHANGE ACT OF1934
For the fiscal year ended December 31, 2015OR
‘ TRANSITION REPORT PURSUANT TO SECTION 13 OR 15(d) OF THE SECURITIES EXCHANGE ACTOF 1934
For the transition period from to
Commission File Number: 001-35877
HANNON ARMSTRONG SUSTAINABLEINFRASTRUCTURE CAPITAL, INC.
(Exact name of registrant as specified in its charter)
Maryland 46-1347456(State or other jurisdiction of
incorporation or organization)(I.R.S. Employer
Identification No.)
1906 Towne Centre BlvdSuite 370
Annapolis, MD 21401(Address of principal executive offices) (Zip Code)
(410) 571-9860(Registrant’s telephone number, including area code)
Securities registered pursuant to Section 12(b) of the Act:Title of Each Class Name of Each Exchange on Which Registered
Common Stock, $0.01 par value New York Stock ExchangeSecurities registered pursuant to Section 12(g) of the Act:
None
Indicate by check mark if the registrant is a well-known seasoned issuer, as defined in Rule 405 of the Securities Act. Yes ‘ No È
Indicate by check mark if the registrant is not required to file reports pursuant to Section 13 or Section 15(d) of the ExchangeAct. Yes ‘ No È
Indicate by check mark whether the registrant (1) has filed all reports required to be filed by Section 13 or 15(d) of the Securities Exchange Actof 1934 during the preceding 12 months (or for such shorter period that the registrant was required to file such reports), and (2) has been subject tosuch filing requirements for the past 90 days. Yes È No ‘
Indicate by check mark whether the registrant has submitted electronically and posted on its corporate Web site, if any, every Interactive DataFile required to be submitted and posted pursuant to Rule 405 of Regulation S-T (§ 232.405 of this chapter) during the preceding 12 months (or forsuch shorter period that the registrant was required to submit and post such files). Yes È No ‘
Indicate by check mark if disclosure of delinquent filers pursuant to Item 405 of Regulation S-K (§ 229.405 of this chapter) is not containedherein, and will not be contained, to the best of registrant’s knowledge, in definitive proxy or information statements incorporated by reference inPart III of this Form 10-K or any amendment to this Form 10-K. È
Indicate by check mark whether the registrant is a large accelerated filer, an accelerated filer, a non-accelerated filer or a smaller reportingcompany. See the definitions of “large accelerated filer,” “accelerated filer” and “smaller reporting company” in Rule 12b-2 of the Exchange Act.
Large accelerated filer ‘ Accelerated filer È
Non-accelerated filer ‘ (Do not check if a smaller reporting company) Smaller reporting company ‘
Indicate by check mark whether the registrant is a shell company (as defined in Rule 12b-2 of the Exchange Act). Yes ‘ No È
As of June 30, 2015, the aggregate market value of the registrant’s common stock (includes unvested restricted stock) held by non-affiliates ofthe registrant was $609 million based on the closing sales price of the registrant’s common stock on June 30, 2015 as reported on the New YorkStock Exchange.
On February 26, 2016 the registrant had a total of 38,332,988 shares of common stock, $0.01 par value, outstanding (which includes 1,321,516shares of unvested restricted common stock).
DOCUMENTS INCORPORATED BY REFERENCEPortions of the registrant’s proxy statement for the 2016 annual meeting of stockholders are incorporated by reference into Part III of this
Annual Report on Form 10-K.

TABLE OF CONTENTS
Page
PART I 5Item 1. Business. 5Item 1A. Risk Factors. 13Item 1B. Unresolved Staff Comments. 50Item 2. Properties. 50Item 3. Legal Proceedings. 50Item 4. Mine Safety Disclosures. 50
PART II 51Item 5. Market for Registrant’s Common Equity, Related Stockholder Matters and Issuer
Purchases of Equity Securities. 51Item 6. Selected Financial Data. 54Item 7. Management’s Discussion and Analysis of Financial Condition and Results of Operations. 56Item 7A. Quantitative and Qualitative Disclosures About Market Risk. 87Item 8. Financial Statements and Supplementary Data. 90Item 9. Changes in and Disagreements with Accountants on Accounting and Financial Disclosure. 123Item 9A. Controls and Procedures. 123Item 9B. Other Information. 123
PART III 124Item 10. Directors, Executive Officers and Corporate Governance. 124Item 11. Executive Compensation. 124Item 12. Security Ownership of Certain Beneficial Owners and Management and Related
Stockholder Matters. 124Item 13. Certain Relationships and Related Transactions and Director Independence. 124Item 14. Principal Accountant Fees and Services. 124
PART IV 125Item 15. Exhibits and Financial Statement Schedules. 125
- 2 -

FORWARD-LOOKING STATEMENTS
We make forward-looking statements in this Annual Report on Form 10-K (“Form 10-K”) within themeaning of Section 27A of the Securities Act of 1933, as amended (the “Securities Act”), and Section 21E of theSecurities Exchange Act of 1934, as amended (the “Exchange Act”) that are subject to risks and uncertainties.For these statements, we claim the protections of the safe harbor for forward-looking statements contained insuch Sections. These forward-looking statements include information about possible or assumed future results ofour business, financial condition, liquidity, results of operations, plans and objectives. When we use the words“believe,” “expect,” “anticipate,” “estimate,” “plan,” “continue,” “intend,” “should,” “may” or similarexpressions, we intend to identify forward-looking statements.
Forward-looking statements are subject to significant risks and uncertainties. Investors are cautioned againstplacing undue reliance on such statements. Actual results may differ materially from those set forth in theforward-looking statements. Statements regarding the following subjects, among others, may be forward-looking:
• our expected returns and performance of our investments;
• the state of government legislation, regulation and policies that support energy efficiency, renewableenergy and sustainable infrastructure projects and that enhance the economic feasibility of energyefficiency, renewable energy and sustainable infrastructure projects and the general market demandsfor such projects;
• market trends in our industry, energy markets, commodity prices, interest rates, the debt and lendingmarkets or the general economy;
• our business and investment strategy;
• availability of opportunities to finance energy efficiency, renewable energy and sustainableinfrastructure projects and our ability to complete potential new opportunities in our pipeline;
• our relationships with originators, investors, market intermediaries and professional advisers;
• competition from other providers of financing;
• our or any other companies’ projected operating results;
• actions and initiatives of the U.S. federal, state and local governments and changes to U.S. federal,state and local government policies, regulations, tax laws and rates and the execution and impact ofthese actions, initiatives and policies;
• the state of the U.S. economy generally or in specific geographic regions, states or municipalities;economic trends and economic recoveries;
• our ability to obtain and maintain financing arrangements on favorable terms, including securitizations;
• general volatility of the securities markets in which we participate;
• changes in the value of our assets, our portfolio of assets and our investment and underwriting process;
• interest rate and maturity mismatches between our assets and any borrowings used to fund such assets;
• changes in interest rates and the market value of our assets and target assets;
• changes in commodity prices;
• effects of hedging instruments on our assets;
• rates of default or decreased recovery rates on our assets;
• the degree to which our hedging strategies may or may not protect us from interest rate volatility;
• impact of and changes in accounting guidance and similar matters;
- 3 -

• our ability to maintain our qualification, as a real estate investment trust for U.S. federal income taxpurposes (a “REIT”);
• our ability to maintain our exception from registration under the Investment Company Act of 1940, asamended (the “1940 Act”);
• availability of qualified personnel;
• estimates relating to our ability to make distributions to our stockholders in the future; and
• our understanding of our competition.
Forward-looking statements are based on beliefs, assumptions and expectations as of the date of this Form10-K. Any forward-looking statement speaks only as of the date on which it is made. New risks and uncertaintiesarise over time, and it is not possible for us to predict those events or how they may affect us. Except as requiredby law, we are not obligated to, and do not intend to, update or revise any forward-looking statements after thedate of this Form 10-K, whether as a result of new information, future events or otherwise.
The risks included here are not exhaustive. Other sections of this Form 10-K may include additional factorsthat could adversely affect our business and financial performance. Moreover, we operate in a very competitiveand rapidly changing environment. New risk factors emerge from time to time and it is not possible formanagement to predict all such risk factors, nor can it assess the impact of all such risk factors on our business orthe extent to which any factor, or combination of factors, may cause actual results to differ materially from thosecontained in any forward-looking statements. Given these risks and uncertainties, investors should not placeundue reliance on forward-looking statements as a prediction of actual results.
- 4 -

PART I
In this Form 10-K, unless specifically stated otherwise or the context otherwise indicates, references to“we,” “our,” “us” and “our company” refer to Hannon Armstrong Sustainable Infrastructure Capital, Inc., aMaryland corporation, Hannon Armstrong Sustainable Infrastructure, L.P., and any of our other subsidiaries.Hannon Armstrong Sustainable Infrastructure, L.P. is a Delaware limited partnership of which we are the solegeneral partner and to which we refer in this Form 10-K as our “Operating Partnership.”
Hannon Armstrong Capital, LLC, a Maryland limited liability company, the entity that operated ourhistorical business prior to the consummation of our initial public offering on April 23, 2013 (our “IPO”) andwhich we refer to as the “Predecessor,” became our subsidiary upon consummation of our IPO. To the extentany of the financial data included in this Form 10-K is as of a date or from a period prior to the consummation ofour IPO, such financial data is that of the Predecessor. The financial data for the Predecessor for such periodsdo not reflect the material changes to the business as a result of the capital raised in the IPO including thebroadened types of projects undertaken, the enhanced financial structuring flexibility and the ability to retain alarger share of the economics from the origination activities. Accordingly, the financial data for the Predecessoris not necessarily indicative of our company’s results of operations, cash flows or financial position following thecompletion of the IPO.
Item 1. Business.
GENERAL
We provide debt and equity financing to the energy efficiency and renewable energy markets. We focus onproviding preferred or senior level capital to established sponsors and high credit quality obligors for assets thatgenerate long-term, recurring and predictable cash flows.
We are internally managed and our management team has extensive industry knowledge and experiencehaving completed its first renewable energy financing over 25 years ago and its first energy efficiency financingover 15 years ago. We have deep and long-standing relationships in the markets we target with leading energyservice providers, manufacturers, project developers and owners. We originate many of our transactions throughprogrammatic finance relationships with global energy service companies (“ESCOs”), such as HoneywellInternational, Ingersoll Rand, Johnson Controls, Schneider Electric, Siemens and United Technologies. We alsooriginate transactions with renewable energy manufacturers, developers and operators such as EDF RenewableEnergy, EDP Renewables, E.ON, First Solar, Invenergy, SunPower and other companies who own and operaterenewable energy projects, including a number of U.S. utility companies. Additionally, we rely on relationshipswith a variety of key financial participants, including institutional investors, private equity funds, senior lenders,and investment and commercial banks, as well as leading intermediaries, to complement our origination andfinancing activities. We believe we are the leading provider of financing for energy efficiency projects for theU.S. federal government, the largest property owner and energy user in the United States.
We focus our investment activities primarily on:
• Energy Efficiency Projects: projects, typically undertaken by ESCOs, which reduce a building’s orfacility’s energy usage or cost by improving or installing various building components, includingheating, ventilation and air conditioning systems (“HVAC systems”), lighting, energy controls, roofs,windows, building shells, and/or combined heat and power systems; and
• Renewable Energy Projects: projects that deploy cleaner energy sources, such as solar and wind togenerate power production.
We may also provide financing solutions for other projects, such as water or communications infrastructure,that improve water or energy efficiency, increase energy system resiliency, positively impact the environment ormore efficiently use natural resources.
- 5 -

Our goal is to deliver attractive risk-adjusted returns to our stockholders by investing in projects thatgenerate long-term, recurring and predictable cash flows or cost savings. The cash flows or cost savings aregenerally generated from proven technologies that minimize performance uncertainty, enabling us to moreaccurately predict project cash flow over the term of the financing or investment. We provide capital throughdebt financings and a variety of preferred and common equity structures with a preference for structures in whichwe hold a senior or preferred position in the capital structure.
We completed approximately $935 million of transactions during 2015, compared to approximately $875million during 2014. Our strategy includes holding a large portion of these transactions on our balance sheet. Asof December 31, 2015, we held approximately $1.3 billion of our assets on our balance sheet, includingapproximately 75% of our 2015 transactions. We refer to the transactions we hold on our balance sheet as of agiven date as our “Portfolio.”
We also originate transactions for securitization trusts or similar vehicles that we manage or service inwhich institutional investors purchase all or a portion of the economics of the transaction and where we receiveupfront revenues and in some cases, ongoing fees for managing the assets. As of December 31, 2015, wemanaged approximately $1.8 billion in these trusts or vehicles that are not consolidated on our balance sheet.When combined with our Portfolio, as of December 31, 2015, we manage approximately $3.2 billion of assetswhich we refer to as our managed assets.
We have raised net proceeds of approximately $470 million including $181 million in two follow on publicofferings completed in 2015. Since April 2013, we have also completed approximately $610 million ofnonrecourse borrowings and have a credit facility with maximum capacity of $500 million. In 2015, wecompleted approximately $395 million of nonrecourse borrowings and had a $50 million increase in availablecapacity under our credit facility.
As of December 31, 2015, approximately 64% of our Portfolio consisted of loans, financing receivables,direct financing leases or debt securities with 59% structured with fixed rates and 5% structured with floatingrates. Approximately 12% of our Portfolio was real estate with long-term leases and approximately 24%represented equity ownership of wind projects. Excluding our equity investments, approximately 45% of ourPortfolio consisted of U.S. federal government or state or local government obligors, approximately 54%consisted of investment grade commercial obligations and 1% consisted of non-investment grade ratedcommercial obligations, in all cases rated either by an independent third party rating service or our internal creditrating system. Our Portfolio consisted of over 105 transactions and the weighted average remaining life of ourPortfolio as of December 31, 2015 (excluding match-funded transactions) was approximately ten years.
We have a large and active pipeline of potential new opportunities that are in various stages of ourunderwriting process. We refer to potential opportunities as being part of our pipeline if we have determined thatthe project fits within our investment strategy and exhibits the appropriate risk/reward characteristics through aninitial credit analysis, including a quantitative and qualitative assessment of the opportunity, as well as researchon the market and sponsor. Our pipeline of transactions that could potentially close in the next 12 monthsconsists of opportunities in which we will be the lead originator, as well as projects in which we may participatewith other institutional investors. As of December 31, 2015, our pipeline consisted of more than $2.5 billion innew debt and equity opportunities. There can, however, be no assurance that any or all of the transactions in ourpipeline will be completed.
We elected to be, and intend to continue to operate our business so as to qualify to be taxed as a REIT forU.S. federal income tax purposes, commencing with our taxable year ended December 31, 2013. We also intendto continue to operate our business in a manner that will permit us to maintain our exception from registration asan investment company under the 1940 Act.
- 6 -

INVESTMENT STRATEGY
We provide a range of equity and financing solutions to the energy efficiency and renewable energy market.Our goal is to invest in assets that generate long-term, recurring and predictable cash flows or cost savings thatwill be more than adequate to deliver attractive risk-adjusted returns to our stockholders.
We utilize a variety of investment structures, which may include:
• Financing Receivables, such as project loans, receivables and direct financing leases,
• Debt and equity securities,
• Real Estate, such as land or other physical assets and related intangible assets used in sustainableinfrastructure projects, and
• Equity Investments in unconsolidated affiliates, such as projects where we hold a non-consolidatedequity interest in a project.
Our financings typically benefit from contractually committed obligations of government entities or private,high credit quality obligors. The cash flows or cost savings are generally produced from proven technologies thatminimize performance uncertainty, enabling us to more accurately predict project cash flows over the term of thefinancing or investment.
We provide debt and equity financing for energy efficiency projects, which reduce the amount or cost ofenergy usage. We often work with ESCOs who achieve these savings by improving or installing various buildingcomponents, including HVAC systems, lighting, energy controls, roofs, windows, building shells, and/orcombined heat and power systems. We are assigned the payment stream and other contractual rights, often usingour pre-existing master purchase agreements with the ESCOs. Our financings are generally also secured by theinstalled improvements.
We also provide debt and equity financing, or own the land used, for projects that deploy renewable energysources such as solar or wind. We focus on financing renewable energy projects that use proven technology andthat often have contractually committed agreements, such as power purchase agreements (“PPAs”), with highcredit quality utilities or large electricity users under which the utility or user purchases the power produced bythe project at a minimum price with potential price escalators for a portion of the project’s estimated life. Theseprojects are building or facility specific and may be combined with other energy efficiency projects or arestandalone projects designed to sell power to electric utilities or large users.
We began leasing real property to renewable projects in May 2014, when we acquired all of the outstandingmember interests in American Wind Capital Company, LLC (“AWCC”) for approximately $107 million.Through this acquisition and a series of follow on transactions, we own more than 14,000 acres of land that areunder long-term lease agreements with over 25 solar projects, which we have recorded in our financialstatements as real estate, and rights to payments from land leases for a diversified portfolio of over 50 windprojects, which we have recorded in our financial statements as financing receivables. For further information onour real estate transactions, see Note 1 of the audited financial statements in this Form 10-K.
We have made several investments in wind projects through limited liability entities to purchase and holdinterests in wind projects operated by various wind energy companies. These transactions enable us to participatein the priority cash flows associated with these wind projects. For further information on these transactions, seeNotes 1 and 13 of the audited financial statements in this Form 10-K.
We may also provide financing for other sustainable infrastructure projects, such as water orcommunications infrastructure, that improve water or energy efficiency, increase energy system resiliency,positively impact the environment or more efficiently use natural resources.
- 7 -

We seek to manage the diversity of our Portfolio by, among other factors, project type, project operator,type of investment, type of technology, transaction size, geography, obligor and maturity. Our target mix of ourPortfolio is expected over time to range from approximately 25% to 45% energy efficiency projects, 45% to 70%renewable energy projects such as wind and solar projects and 5% to 10% other sustainable infrastructureprojects. As of December 31, 2015, approximately 31% of our Portfolio was invested in energy efficiencyprojects; approximately 37% was invested in wind projects; approximately 30% was invested in solar projectsand the remaining 2% was invested in other sustainable infrastructure projects.
Our target mix of our Portfolio is expected over time to range from 55% to 75% debt financings and 25% to45% land and equity financings. We will not invest more than 15% of our assets in any individual project withoutthe consent of a majority of our independent directors. We will adjust the mix and duration of our assets overtime in order to allow us to manage various aspects of our portfolio, including expected risk-adjusted returns,macroeconomic conditions, liquidity, availability of adequate financing for our assets, and to maintain our REITqualification and our exception from registration as an investment company under the 1940 Act.
We believe that our long history of energy efficiency and renewable energy investing, the experience,expertise and relationships of our management team, the anticipated credit strength of the obligors of ourfinancings and the size and growth potential of our market, position us well to capitalize on our strategy andprovide attractive risk-adjusted returns to our stockholders over the long term, through both distributions andcapital appreciation.
FINANCING STRATEGY
We use borrowings as part of our financing strategy to increase potential returns to our stockholders andhave available to us a broad range of financing sources. In July 2013, we entered into a $350 million seniorsecured revolving credit facility with maximum total advances of $700 million. Since that time, we have enteredinto a number of amendments intended to increase the flexibility and borrowing capability under the creditfacility and to extend the maturity date. As of December 31, 2015, the facility had been increased to $500 millionwith maximum total advances of $1.5 billion and the facility had been extended an additional year maturing inJuly 2019.
In addition, we have completed approximately $610 million of nonrecourse borrowings since April 2013,including approximately $395 million in 2015. We believe that our 2013 financing was one of the first asset-backed securitizations that provided details on the greenhouse gas (“GHG”) emissions saved by the technologiesthat secured the financing. We refer to the bonds issued as part of these financing transactions as HASISustainable Yield Bonds or (“HASI SYBs”). We believe that investors will increasingly be interested in debtinvestments that have a measurable GHG savings.
Prior to our IPO, we financed our business primarily through fixed rate nonrecourse debt where the debt wasmatch-funded with corresponding fixed rate yielding assets and through the use of non-consolidatedsecuritizations. In our securitization transactions, we transfer the loans or other assets we originate tosecuritization trusts or other bankruptcy remote special purpose funding vehicles. Large institutional investors,primarily insurance companies and commercial banks, have provided the financing needed for these assets bypurchasing the notes issued by the funding vehicle.
We continue to use these funding sources and, as of December 31, 2015, had outstanding approximately$101 million of this match funded debt, all of which was consolidated on our balance sheet. As of December 31,2015, the outstanding principal balance of our assets financed through the use of securitizations which are notconsolidated on our balance sheet was approximately $1.8 billion. For further information on the credit facility,asset backed nonrecourse notes, and our nonrecourse match funded debt, see Note 7 and Note 8 of our auditedfinancial statements included in this Form 10-K.
- 8 -

We plan to use other fixed and floating rate borrowings in the form of additional bank credit facilities(including term loans and revolving facilities), warehouse facilities, repurchase agreements and public andprivate equity and debt issuances, including match funded arrangements, as a means of financing our business.We also expect to use both on-balance sheet and non-consolidated securitizations and also believe we will beable to customize securitized tranches to meet investment preferences of different investors. We may alsoconsider the use of separately funded special purpose entities or funds to allow us to expand the investments thatwe make.
The decision on how we finance specific assets or groups of assets is largely driven by capital allocationsand risk and portfolio management considerations, as well as the overall interest rate environment, prevailingcredit spreads and the terms of available financing and market conditions. Over time, as market conditionschange, we may use other forms of leverage in addition to these financings arrangements.
Although we are not restricted by any regulatory requirements to maintain our leverage ratio at or below anyparticular level, the amount of leverage we may deploy for particular assets will depend upon the availability ofparticular types of financing and our assessment of the credit, liquidity, price volatility and other risks of thoseassets, the interest rate environment and the credit quality of our financing counterparties. In March 2015, weincreased our leverage target to 2.5 to 1 from less than 2.0 to 1. Our debt to equity ratio was approximately 2.1 to1 as of December 31, 2015. We also have increased the percentage of fixed rate debt from zero at the IPO toapproximately 71% as of December 31, 2015, or slightly above our targeted fixed rate debt percentage range ofapproximately 50% to 70%. In order to simplify these calculations, we have begun to use, in February 2016, thetotal debt on our balance sheet, including our credit facility, nonrecourse securitization debt and othernonrecourse match funded debt. Historically, we excluded the other nonrecourse match funded debt, which as ofDecember 31, 2015, was $101 million, and if such debt would have been excluded, the debt to equity ratio wouldhave been 1.9 to 1 and the fixed rate debt percentage was 68%. We continue to calculate both of these ratiosexclusive of securitizations that are not consolidated on our balance sheet (where the collateral is typicallyborrowings with U.S. government obligors) and for the purposes of the fixed rate debt target, we include as fixedrate debt, the present notional value hedged by interest rate swaps.
We intend to use leverage for the primary purpose of financing our portfolio and business activities and notfor the purpose of speculating on changes in interest rates. While we may temporarily exceed the leverage target,if our board of directors approves a material change to our leverage target, we anticipate advising ourstockholders of this change through disclosure in our periodic reports and other filings under the Exchange Act.
CORPORATE GOVERNANCE
We have structured our corporate governance in a manner we believe closely aligns our interests with thoseof our stockholders. Notable features of our corporate governance structure include the following:
• our board of directors is not staggered, with each of our directors subject to re-election annually;
• our board of directors has determined that five of our six directors are independent for purposes of theNew York Stock Exchange (“NYSE”) corporate governance listing standards and Rule 10A-3 underthe Exchange Act;
• two of our directors qualify as an “audit committee financial expert” as defined by the Securities andExchange Commission (the “SEC”);
• we have opted out of the control share acquisition statute in the Maryland General Corporations Law(the “MGCL”) and have exempted from the business combinations statute in the MGCL transactionsthat are approved by our board of directors; and
• we do not have a stockholder rights plan.
- 9 -

In order to foster the highest standards of ethics and conduct in all business relationships, we have adopted aCode of Business Conduct and Ethics policy. This policy, which covers a wide range of business practices andprocedures, applies to our officers, directors, employees and independent contractors. In addition, we haveimplemented Whistleblowing Procedures for Accounting and Auditing Matters (the “Whistleblower Policy”) thatsets forth procedures by which any Covered Persons (as defined in the Whistleblower Policy) may raise, on aconfidential basis, concerns regarding, among other things, any questionable or unethical accounting, internalaccounting controls or auditing matters and any potential violations of the Code of Business Conduct and Ethicswith our Audit Committee or our General Counsel.
We have adopted a Statement of Corporate Policy Regarding Equity Transactions that governs the processto be followed in the purchase or sale of our securities by any of our directors, officers, employees andconsultants and prohibits any such persons from buying or selling our securities on the basis of materialnonpublic information.
Our business is managed by our senior management team, subject to the supervision and oversight of ourboard of directors. Our directors stay informed about our business by attending meetings of our board of directorsand its committees and through supplemental reports and communications. Our independent directors, led by thelead independent director, meet regularly in executive sessions without the presence of our officers.
COMPETITION
We compete against a number of parties, including other specialty finance companies, banks, private equity,hedge or infrastructure investment funds, insurance companies, mutual funds, institutional investors, investmentbanking firms, financial institutions, utilities, independent power producers, project developers, pension funds,governmental bodies, public entities established to own infrastructure assets and other entities. We competeprimarily on the basis of service, price, structure and flexibility as well as the breadth and depth of our expertise.We may at times compete, and at other times partner or work as a participant, with alternative financing sources.
We also encounter competition in the form of potential customers or our origination partners electing to usetheir own capital rather than engaging an outside financing provider. In addition, we may also face competitionbased on technological developments that reduce demand for electricity, increase power supplies throughexisting infrastructure or that otherwise compete with our sustainable infrastructure projects.
Some of our competitors are significantly larger, have greater access to capital and other resources or enjoyother advantages in comparison to us. In addition, some of our competitors may have higher risk tolerances ordifferent risk assessments, which could allow them to consider a wider variety of opportunities and establishmore relationships than we can. These competitors may not be subject to the same regulatory constraints (such asREIT compliance or the need to maintain an exemption from registration as an investment company under the1940 Act) that we face.
We believe that a significant part of our competitive advantage is our management team’s experience andindustry expertise, and that the markets for investment opportunities in the areas that we focus on areunderserved by traditional commercial banks and other financial sources. However, we may not be able toachieve our business goals or expectations due to the competitive risks that we face. An increase in competitionamong competing providers of financing could adversely affect the availability and cost of financing, and therebyadversely affect the market price of our common stock. For additional information concerning these competitiverisks, see “Risk Factors—We operate in a competitive market and future competition may impact the terms of thefinancing we offer.”
- 10 -
EMPLOYEES; STAFFING
As of December 31, 2015, we employed 32 people. We intend to hire additional business professionals asneeded to assist in the implementation of our business strategy.
OUR EXECUTIVE OFFICERS
Our executive officers and other significant employees and their ages are as follows:
Jeffrey W. Eckel, 57, is one of our directors and was with the Predecessor as president and chief executiveofficer since 2000 and prior to that from 1985 to 1989 as a senior vice president. He serves as our president, chiefexecutive officer, and chairman of our board of directors. He previously held senior executive positions such aschief executive officer of EnergyWorks, LLC and Wärtsilä Power Development. Mr. Eckel is a member of theboard of directors of HA EnergySource Holdings LLC (“HA EnergySource”). In 2014, he was elected to theboard of directors of the Alliance To Save Energy. He also was appointed by the governor of Maryland to theboard of the Maryland Clean Energy Center in 2011 and served as its chairman from 2012 to 2014. He has servedas a member of the Johns Hopkins Environmental, Energy, Sustainability and Health Institute’s advisory councilsince 2013. Mr. Eckel has over 30 years of experience in financing, owning and operating infrastructure andenergy assets. Mr. Eckel received a Bachelor of Arts degree from Miami University in 1980 and a Master ofPublic Administration degree from Syracuse University, Maxwell School of Citizenship and Public Affairs, in1981. He holds Series 24, 63 and 79 securities licenses. We believe Mr. Eckel’s extensive experience inmanaging companies operating in the energy sector and expertise in financing energy assets make him qualifiedto serve as our president and chief executive officer and as chairman of our board of directors.
J. Brendan Herron, 55, has served in a variety of roles at the Predecessor and its affiliates from 1994 to2005, has been a senior vice president from 2011 to 2013 and serves as an executive vice president and our chieffinancial officer. Mr. Herron has over 20 years of experience in structuring, executing and operatinginfrastructure and technology investments. From 2006 to 2011, Mr. Herron was the vice president of CorporateDevelopment & Strategy for Current Group, LLC, a provider of smart grid technology to electric utilities. Heformerly served on the U.S. Commerce Secretary’s Renewable Energy and Energy Efficiency AdvisoryCommittee and is presently a member of the Board of Trustees of Calvert Hall College High School (Baltimore,MD). Mr. Herron received a Bachelor of Science degree in accounting and computer science from LoyolaUniversity Maryland in 1982 and a Master of Business Administration degree from Loyola University Marylandin 1987 and has passed the CPA and CMA examinations. We believe Mr. Herron’s financial background,extensive experience in infrastructure and technology investments and expertise in energy infrastructure makehim qualified to serve as our chief financial officer.
Steven L. Chuslo, 58, has been with the Predecessor as general counsel since 2008 and serves in that roleand as an executive vice president. Mr. Chuslo is responsible for all internal governance matters and is activelyinvolved in structuring, developing, negotiating and closing transactions. He has more than 25 years ofexperience in the fields of securities, commercial finance and energy development, U.S. federal regulation andproject finance. From 2006 to 2008, Mr. Chuslo was the senior legal and finance advisor to the AssistantSecretary of the U.S. Department of Energy Office of Energy Efficiency and Renewable Energy. Prior to this, heworked as a legal consultant to the office of the general counsel for AOL, Inc. from 2004 to 2006. He wasGeneral Counsel to EnergyWorks, LLC, from 1996 to 2001. Mr. Chuslo was an associate attorney forChadbourne & Parke, LLP from 1994 to 1995, practicing in the power project finance group and earlier withDavis Polk & Wardwell LLP from 1990 to 1994, practicing in the corporate finance group. Mr. Chuslo receiveda Bachelor of Arts degree in History from the University of Massachusetts/Amherst in 1982 and a Juris Doctoratefrom the Georgetown University Law Center in 1990.
- 11 -

Nathaniel J. Rose, CFA, 38, has been with the Predecessor since 2000, in a variety of roles, most recentlyas a senior vice president since 2007, and has served us as an executive vice president and chief operating officersince 2015. He has been involved with a vast majority of our transactions since 2000. He earned a joint Bachelorof Science and Bachelor of Arts degree from the University of Richmond in 2000, a Master of BusinessAdministration degree from the Darden School of Business Administration at the University of Virginia in 2009,is a Chartered Financial Analyst, or CFA, charter holder and has passed the CPA examination. He holds a Series63 and 79 securities licenses.
Daniel K. McMahon, CFA, 44, has been with the Predecessor since 2000 in a variety of roles, mostrecently as a senior vice president since 2007 and has served us as an executive vice president since 2015.Mr. McMahon responsibilities include originating and executing transactions with our government andinstitutional customers and sourcing capital markets transactions. He has played a role in analyzing, negotiatingand structuring several billion dollars of transactions. Mr. McMahon previously worked with T. Rowe Price from1997 to 2000. Mr. McMahon received his Bachelor of Arts degree from the University of California, San Diegoin 1993, and is a CFA charter holder. He holds Series 24, 63 and 79 securities licenses.
M. Rhem Wooten Jr., 56, has been with the Predecessor as a managing director since October 2010 andserves as an executive vice president. Mr. Wooten has worked in the energy industry for more than 30 years, andhas extensive experience in project development, commodity trading/risk management and project finance.Mr. Wooten previously held a number of senior management positions, including serving as President of DukeEnergy Corporation’s domestic and international independent power production affiliates from 1988 to 1996, asManaging Director, origination and operations of Duke/Louis Dreyfus from 1996-1997, chief executive officer ofMerchant Energy Group of the Americas (MEGA) from 1997 to 2000, as president and chief executive officer ofPradium, Inc. from 2000 to 2001 and as president of Allied Syngas Corporation from 2004 to 2010. Mr. Wootenreceived a Bachelor of Science degree in Business Administration from the University of North Carolina-ChapelHill in 1981. He holds Series 63 and 79 securities licenses.
AVAILABLE INFORMATION
We maintain a website at www.hannonarmstrong.com. Information on our website is not incorporated byreference in this Form 10-K. We will make available, free of charge, on our website (a) our Form 10-K, quarterlyreports on Form 10-Q and current reports on Form 8-K (including any amendments thereto), proxy statementsand other information (collectively, “Company Documents”) filed with, or furnished to, the Securities andExchange Commission (the “SEC”), as soon as reasonably practicable after such documents are so filed orfurnished, (b) Corporate Governance Guidelines, (c) director independence standards, (d) Code of BusinessConduct and Ethics policy and (e) written charters of the Audit Committee, Compensation Committee andNominating and Corporate Governance Committee of our board of directors. Company Documents filed with, orfurnished to, the SEC are also available for review and copying by the public at the SEC’s Public ReferenceRoom at 100 F Street, NE., Washington, DC 20549 and at the SEC’s website at www.sec.gov. Informationregarding the operation of the Public Reference Room may be obtained by calling the SEC at 1-800-SEC-0330.We provide copies of our Corporate Governance Guidelines and Code of Business Conduct and Ethics policy,free of charge, to stockholders who request such documents. Requests should be directed to Investor Relations,1906 Towne Centre Blvd, Suite 370, Annapolis, Maryland 21401, (410) 571-9860.
- 12 -
Item 1A. Risk Factors.
Our business and operations are subject to a number of risks and uncertainties, the occurrence of whichcould adversely affect our business, financial condition, consolidated results of operations and ability to makedistributions to stockholders and could cause the value of our capital stock to decline. We may refer to theenergy efficiency, renewable energy and the other sustainable infrastructure projects or market collectively asthe sustainable infrastructure projects or industry. Please also refer to the section entitled “Forward-LookingStatements.”
Risks Related to Our Business and Our Industry
Our business depends in part on U.S. federal, state and local government policies and a decline in the levelof government support could harm our business.
The projects in which we invest typically depend in part on various U.S. federal, state or local governmentalpolicies and incentives that support or enhance project economic feasibility. Such policies may includegovernmental initiatives, laws and regulations designed to reduce energy usage, encourage the use of renewableenergy or encourage the investment in and the use of sustainable infrastructure. Incentives provided by the U.S.federal government may include tax credits (with some of these tax credits that are related to renewable energyscheduled to be reduced in the future), tax deductions, bonus depreciation as well as federal grants and loanguarantees. Incentives provided by state and local governments may include renewable portfolio standards,which specify the portion of the power utilized by local utilities that must be derived from renewable energysources such as renewable energy as well as the state or local government sponsored programs where thefinancing of energy efficiency or renewable energy projects is repaid through an assessment in the property taxbill in a program commonly referred to as property assessed clean energy (“PACE”). Additionally, certain stateshave implemented feed-in tariffs, pursuant to which electricity generated from renewable energy sources ispurchased at a higher rate than prevailing wholesale rates. Other incentives include tariffs, tax incentives andother cash and non-cash payments. In addition, U.S. federal, state and local governments provide regulatory, taxand other incentives to encourage the development and growth of sustainable infrastructure.
Governmental agencies, commercial entities and developers of sustainable infrastructure projects frequentlydepend on these policies and incentives to help defray the costs associated with, and to finance, various projects.Government regulations also impact the terms of third party financing provided to support these projects. If anyof these government policies, incentives or regulations are adversely amended, delayed, eliminated, reduced ornot extended beyond their current expiration dates, the demand for, and the returns available from, the financingwe provide may decline, which could harm our business. Changes in government policies, support andincentives, including retroactive changes, could also negatively impact the operating results of the projects wefinance and the returns on our assets.
U.S. federal, state and local government entities are major participants in the sustainable infrastructureindustry and their actions could be adverse to our projects or our company.
The projects where we invest are, and will continue to be, subject to substantial regulation by U.S. federal,state and local governmental agencies. For example, many projects require government permits, licenses,concessions, leases or contracts. Government entities, due to the wide-ranging scope of their authority, havesignificant leverage in setting their contractual and regulatory relationships with third parties. In addition,government permits, licenses, concessions, leases and contracts are generally very complex, which may result inperiods of non-compliance, or disputes over interpretation or enforceability. If the projects where we invest failto obtain or comply with applicable regulations, permits or contractual obligations, they could be prevented frombeing constructed or subjected to monetary penalties or loss of operational rights, which could negatively impactproject operating results and the returns on our assets.
Contracts with government counterparties that support the projects where we invest may be more favorableto the government counterparties compared to commercial contracts with private parties. For example, a lease,
- 13 -

concession or general service contract may enable the government to modify or terminate the contract withoutrequiring the payment of adequate compensation. Typically, our contracts with government counterpartiescontain termination provisions including prepayment amounts. In most cases, the prepayment amounts provideus with amounts sufficient to repay the financing we have provided, but may be less than amounts that would bepayable under “make whole” provisions customarily found in commercial lending arrangements.
In addition, government counterparties also may have the discretion to change or increase regulation ofproject operations, or implement laws or regulations affecting project operations, separate from any contractualrights they may have. These actions could adversely impact the efficient and profitable operation of the projectsin which we invest.
Government entities may also suspend or debar contractors from doing business with the government orpursue various criminal or civil remedies under various government contract regulations. They may also issuenew government contracts or fail to extend existing government contracts. Our ability to originate new assetscould be adversely affected if one or more of the ESCOs with whom we have relationships with are so suspendedor debarred or fail to win new, or renew existing, contracts.
Changes in the terms of energy savings performance contracts could have a material and adverse impacton our business.
We derive a significant amount of our income from the assignment to us of payment streams under energysavings performance contracts with property owners, including government customers, in which the scope andcost of improvements and services are specified. While U.S. federal, state and local government rules governingsuch contracts vary, such rules may, for example, permit the funding of such contracts through long-termfinancing arrangements, permit long-term payback periods from the savings realized through such contracts,allow units of government to exclude debt related to such contracts from the calculation of their statutory debtlimitation, allow for award of contracts on a “best value” instead of “lowest cost” basis and allow for the use ofsole source providers. To the extent these rules become more restrictive in the future, our ability to providefinancing to support these projects could be adversely impacted, which could harm our business. Changes inthese rules, including retroactive changes, could also negatively impact the operating results of the projects wefinance and the returns on our assets.
A change in the fiscal health, level of appropriations or budgets of U.S. federal, state and localgovernments could reduce demand for our financing solutions.
Although our energy efficiency assets do not normally require direct governmental appropriations andinstead the resulting cash flow is generally paid for out of general operating and maintenance appropriationsbased on the energy and operating savings derived from the improved facility, a significant decline in the fiscalhealth, level of appropriations or budgets of government customers may make it difficult or undesirable for themto make existing payments or to enter into new energy efficiency improvement projects. This could have amaterial and adverse effect on the repayment of our financings or the return on our asset for existing projects andon our ability to originate new assets. Moreover, other changes in resources available to governments may alsoimpact their willingness to undertake energy efficiency projects. For example, an increase in money set aside forgovernment expenditures for energy efficiency projects may reduce demand for our financing.
In addition, to the extent we provide financing solutions that involve direct appropriations funding, we willdepend on approval of the necessary spending for the projects. The repayment of the financing, or the return onour asset, could be adversely affected if appropriations for any such projects are delayed or terminated.
- 14 -

Because our business depends to a significant extent upon relationships with key industry players, ourinability to maintain or develop these relationships, or the failure of these relationships to generatebusiness opportunities, could adversely affect our business.
We will rely to a significant extent on our relationships with key industry players in the markets we target.We originate transactions through programmatic finance relationships with various parties, including globalESCOs. We also originate transactions with renewable energy manufacturers, developers and operators such asEDF Renewable Energy, EDP Renewables, E.ON, First Solar, Invenergy, SunPower and other companies whoown and operate renewable energy projects, including a number of U.S. utility companies. In addition to the netproceeds from past and future offerings, we have traditionally financed our business by accessing thesecuritization or syndication market, primarily utilizing our relationships with insurance companies andcommercial banks. We also rely on relationships with a variety of key financial participants, includinginstitutional investors, private equity funds, senior lenders, and investment and commercial banks, as well asleading intermediaries, to complement our origination and financing activities. Our inability to maintain ordevelop these relationships, or the failure of these relationships to generate business opportunities, couldadversely affect our business. In addition, individuals and entities with whom we have relationships are notobligated to provide us with business opportunities, and, therefore, there is no assurance that such relationshipswill generate business opportunities for us.
If the cost of energy generated by traditional sources of energy continues to stay at present levels ordeclines, demand for the projects in which we invest may decline.
Many traditional sources of energy such as coal, petroleum based fuels and natural gas are highly influencedby the price of underlying or substitute commodities. While we believe the potential for rising or increasinglyvolatile commodity prices and inflation will spur investment in our industry, there have been, and may continueto be, decreases in such prices which may reduce the demand for energy efficiency projects or other projects,including renewable energy facilities, that do not rely on traditional energy sources. For example, we believe thecurrent low prices in natural gas may reduce the demand for other projects like renewable energy that are asubstitute for natural gas. Additionally, low natural gas prices can adversely affect both the price available torenewable energy projects under future power sale agreements and the price of the electricity the projects sell oneither a forward or a spot-market basis. Technological progress in electricity generation, storage or in theproduction of traditional fuels or the discovery of large new deposits of traditional fuels could reduce the cost ofenergy generated from those sources and consequently reduce the demand for the types of projects in which weinvest, which could harm our new business origination prospects. In addition, volatility in commodity prices,including energy prices, may cause building owners and other parties to be reluctant to commit to projects forwhich repayment is based upon a fixed monetary value for energy savings that would not decline if the price ofenergy declines. Any resulting decline in demand for our financing solutions or the price that industryparticipants receive for the sale of their products could adversely impact our operating results.
If the market for various types of sustainable infrastructure projects or the investment techniques relatedto such projects do not develop as we anticipate, new business generation in this target area would beadversely impacted.
The market for various types of sustainable infrastructure projects such as renewable energy projects andcommercial office building energy efficiency projects are emerging and rapidly evolving, leaving their futuresuccess uncertain. Similarly, various investing techniques, such as leasing land for renewable energy projects,purchasing interest in existing renewable energy projects, the use of PACE financing and the use of taxable debtfor state and local energy efficiency financings are emerging and the future success of these investing techniquesis also uncertain. If some or all of these market segments or investing techniques prove unsuitable for widespreadcommercial deployment or if demand for such projects or techniques fail to grow sufficiently, the demand for ourcapital and financing solutions may decline or develop more slowly than we anticipate. Many factors willinfluence the widespread adoption and demand for such projects and investing techniques, including general and
- 15 -

local economic conditions, commodity prices of traditional energy sources, the availability of cost-effectiveenergy storage, the cost-effectiveness of such projects and techniques, performance and reliability of suchtechnologies compared to conventional power sources and technologies, the extent of government subsidies tosupport sustainable infrastructure and regulatory developments in the power and natural resource industries. Inaddition, renewable energy projects rely on electric and other types of transmission lines, pipelines and facilitiesowned and operated by third parties to obtain their inputs or distribute their output. Any substantial accessbarriers to these lines and facilities could make projects that depend on them more expensive, which couldadversely impact the demand or financial performance for such projects and our financing solutions.
Existing electric utility industry regulations, and changes to regulations, may present technical, regulatoryand economic barriers to the purchase and use of renewable energy and energy efficiency systems thatmay significantly reduce demand for systems in which we can invest.
Federal, state and local government regulations and policies concerning the electric utility industry, andinternal policies and regulations promulgated by electric utilities, heavily influence the market for electricityproducts and services. These regulations and policies often relate to electricity pricing and the interconnection ofcustomer-owned electricity generation. In the United States, governments and utilities continuously modify theseregulations and policies. These regulations and policies could deter customers from purchasing energy efficiencyand renewable energy systems. This could result in a significant reduction in the potential demand for suchsystems. For example, utilities commonly charge fees to larger, industrial customers for disconnecting from theelectric grid or for having the capacity to use power from the electric grid for back-up purposes. In addition, thereis an increasing trend towards initiating or increasing fixed fees for users to have electricity service from a utility.These fees could increase our customers’ cost to use renewable energy and energy efficiency systems notsupplied by the utility and make them less desirable, thereby harming our business, prospects, financial conditionand results of operations. In addition, any changes to government or internal utility regulations and policies thatfavor electric utilities could reduce competitiveness and cause a significant reduction in demand for systems inwhich we invest.
Some projects in which we invest rely on net metering and related policies to improve project economicswhich if reduced could impact repayment of our financings or the return on our assets.
Many states have a regulatory policy known as net energy metering, or net metering. Net metering typicallyallows some project customers to interconnect their on-site solar or other renewable energy systems to the utilitygrid and offset their utility electricity purchases by receiving a bill credit at the utility’s retail rate for the amountof energy in excess of their electric usage that is generated by their renewable energy system and is exported tothe grid. At the end of the billing period, the customer simply pays for the net energy used or receives a credit atthe retail rate if more energy is produced than consumed. Net metering policies are under review in a number ofstates and have been recently reduced in Nevada. The ability and willingness of customers to pay for renewableenergy systems which benefit from net metering rules may be reduced if net metering rules are eliminated ortheir benefits reduced, which may also impact our returns on such systems.
Sustainable infrastructure projects that involve the generation, transmission or sale of electricity such asrenewable energy projects may be subject to regulation by the Federal Energy Regulatory Commissionunder the Federal Power Act or other regulations that regulate the sale of electricity, which may adverselyaffect the profitability of such projects.
Sustainable infrastructure projects that involve the generation, transmission or sale of electricity such asrenewable energy projects may be “qualifying facilities” that are exempt from regulation as public utilities by theFederal Energy Regulatory Commission, (the “FERC”) under the Federal Power Act, (the “FPA”) while certainother such projects may be subject to rate regulation by the FERC under the FPA. FERC regulations under theFPA confer upon these qualifying facilities key rights to interconnection with local utilities, and can entitle suchfacilities to enter into PPAs with local utilities, from which the qualifying facilities benefit. Changes to these U.S.
- 16 -

federal laws and regulations could increase the regulatory burdens and costs, and could reduce the revenue of theproject. In addition, modifications to the pricing policies of utilities could require sustainable infrastructureprojects to achieve lower prices in order to compete with the price of electricity from the electric grid and mayreduce the economic attractiveness of certain energy efficiency measures. To the extent that the projects in whichwe invest are subject to rate regulation, the project owners will be required to obtain FERC acceptance of theirrate schedules for wholesale sales of energy, capacity and ancillary services. Any changes in the rates projectowners are permitted to charge could impact the repayment of our financings, or the return on our assets.
In addition, the operation of, and electrical interconnection for, our sustainable infrastructure projects maybe subject to U.S. federal, state or local interconnection and federal reliability standards, some of which are setforth in utility tariffs. These standards and tariffs specify rules, business practices and economic terms to whichthe projects where we invest are subject and which may impact on a project’s ability to deliver the electricity itproduces or transports to its end customer. The tariffs are drafted by the utilities and approved by the utilities’state and U.S. federal regulatory commissions. These standards and tariffs change frequently and it is possiblethat future changes will increase our administrative burden or adversely affect the terms and conditions underwhich the projects render services to their customers.
In addition, under certain circumstances, we may also be subject to the reliability standards of the NorthAmerican Electric Reliability Corporation. If project owners fail to comply with the mandatory reliabilitystandards, they could be subject to sanctions, including substantial monetary penalties, which could also raisecredit risks for, or lower the returns available from, the projects in which we invest.
These various regulations may also limit the transferability or sale of renewable energy projects and anysuch limits could negatively impact our returns from such projects.
Unfavorable publicity or public perception of the industries in which we operate could adversely impactour operating results and our reputation.
The sustainable infrastructure industry, including various forms of renewable energy receives significantmedia coverage that, whether or not directly related to our business or our projects, can adversely impact ourreputation and the demand for our financing solutions. Similarly, negative publicity or public perception of thebroader energy-related industries in which we operate, including through media coverage of environmentalcontamination and climate change concerns, could reduce demand for our financing solutions and our projects’services. Any reduction in demand for sustainable infrastructure projects or for our financing solutions coulddamage our reputation or could have a material adverse effect on our results of operations and businessprospects.
Future litigation or administrative proceedings could have a material and adverse effect on our business,financial condition and results of operations.
We may become involved in legal proceedings, administrative proceedings, claims and other litigation thatarise in the ordinary course of business. In addition, we may be subject to legal proceedings or claims arising outof the projects in which we invest. Adverse outcomes or developments relating to these proceedings, such asjudgments for monetary damages, injunctions or denial or revocation of permits, could have a material adverseeffect on the projects in which we invest, which could adversely impact the repayment of or the returns availablefor our assets.
We operate in a competitive market and future competition may impact the terms of our financingsolutions.
We compete against a number of parties who may provide alternatives to our investments includingspecialty finance companies, savings and loan associations, banks, private equity, hedge or infrastructure
- 17 -

investment funds, insurance companies, mutual funds, institutional investors, investment banking firms, financialinstitutions, utilities, independent power producers, project developers, pension funds, governmental bodies,public entities established to own infrastructure assets and other entities. We also encounter competition in theform of potential customers or our origination partners electing to use their own capital rather than engaging anoutside provider such as us. In addition, we may also face competition based on technological developments thatreduce demand for electricity, increase power supplies through existing infrastructure or that otherwise competewith our sustainable infrastructure projects. Some of our competitors are significantly larger than we are, haveaccess to greater capital and other resources than we do and may have other advantages over us. In addition,some of our competitors may have higher risk tolerances or different risk assessments, which could allow them toconsider a wider variety of investments and establish more relationships than we can. In addition, many of ourcompetitors are not subject to the operating constraints associated with REIT tax compliance or maintenance ofan exception from the 1940 Act. These characteristics could allow our competitors to consider a wider variety ofopportunities, establish more relationships and offer better pricing and more flexible structuring than we canoffer. We may lose business opportunities if we do not match our competitors’ pricing, terms and structure. If weare forced to match our competitors’ pricing, terms and structure, we may not be able to achieve acceptablerisk-adjusted returns on our assets or we may be forced to bear greater risks of loss. A portion of our competitiveadvantage stems from the fact that certain segments of the market opportunities in sustainable infrastructureprojects are underserved by traditional commercial banks and other sources. A significant increase in the numberand/or the size of our competitors in this market could force us to accept less attractive terms on our investments.As a result, competitive pressures we face could have a material adverse effect on our business, financialcondition and results of operations.
Our business is affected by seasonal trends and construction cycles, and these trends and cycles could havean adverse effect on our operating results.
The volume and timing of our originations are subject to seasonal fluctuations and construction cycles,particularly in climates that experience colder weather during the winter months, such as the northern UnitedStates, or at educational institutions, where large projects are typically carried out during summer months whentheir facilities are unoccupied. In addition, government customers, many of which have fiscal years that do notcoincide with ours, typically follow annual procurement cycles and appropriate funds on a fiscal-year basis eventhough contract performance may take more than one year. Further, government contracting cycles can beaffected by the timing of, and delays in, the legislative process related to government programs and incentivesthat help drive demand for sustainable infrastructure projects. As a result of such fluctuations, we mayoccasionally experience fluctuations in the timing of new asset opportunities or declines in revenue or earnings ascompared to the immediately preceding quarter, and comparisons of our operating results on a period-to-periodbasis may not be meaningful.
Risks Related to Our Assets and Projects In Which We Invest
Interest rate fluctuations and increases in interest rates could adversely affect the value of our assets whichcould result in reduced earnings or losses and negatively affect our profitability.
Interest rates are highly sensitive to many factors, including governmental monetary and tax policies,domestic and international economic and political considerations and other factors beyond our control. Many ofour assets pay a fixed rate of interest or provide a fixed preferential return.
With respect to our business operations, increases in interest rates, in general, may over time cause:(1) project owners to be less interested in borrowing or raising equity and thus reduce the demand for our assets;(2) the interest expense associated with our borrowings to increase; (3) the value of our fixed rate or fixed returnassets to decline; and (4) the value of our interest rate swap agreements to increase, to the extent we enter intosuch agreements as part of our hedging strategy. Conversely, decreases in interest rates, in general, may overtime cause: (1) project owners to be more interested in borrowing or raising equity and thus increase the demand
- 18 -

for our assets; (2) prepayments on our assets, to the extent allowed, to increase; (3) the interest expenseassociated with our borrowings to decrease; (4) the value of our fixed rate or fixed return assets to increase; and(5) the value of our interest rate swap agreements to decrease, to the extent we enter into such agreements as partof our hedging strategy. Adverse developments resulting from changes in interest rates could have a materialadverse effect on our business, financial condition and results of operations.
The lack of liquidity of our assets may adversely affect our business, including our ability to value and sellour assets.
Volatile market conditions could significantly and negatively impact the liquidity of our assets. Illiquidassets typically experience greater price volatility, as a ready market does not exist, and can be more difficult tovalue. In addition, validating third-party pricing for illiquid assets may be more subjective than more liquidassets. The illiquidity of our assets may make it difficult for us to sell such assets if the need or desire arises. Inaddition, if we are required to liquidate all or a portion of our Portfolio quickly, we may realize significantly lessthan the value at which we have previously recorded our assets. To the extent that we utilize leverage to financeour purchase of assets that are or become illiquid, the negative impact on us related to trying to sell assets in ashort period of time for cash could be greatly exacerbated. As a result, our ability to vary our portfolio inresponse to changes in economic and other conditions may be relatively limited, which could adversely affect ourresults of operations and financial condition.
We may experience a decline in the fair value of our assets.
A decline in the fair market value of available for sale securities, our financing receivables held for sale, ourinterest rate hedges, if any, or any other assets which we may carry at fair value in the future, may require us toreduce the value of such assets under generally accepted accounting principles in the United States (“U.S.GAAP”). In addition, all of our other financial assets are subject to an impairment assessment that could result inadjustments to their carrying values. Upon the subsequent disposition or sale of such assets, we could incurfuture losses or gains based on the difference between the sale price received and adjusted value of such assets asreflected on our balance sheet at the time of sale. See Note 2 and Note 3 of the audited financial statements inthis Form 10-K for additional details related to our determination of fair value.
Some of the assets in our portfolio may be recorded at fair value (as determined in accordance with ourpricing policy as approved by our board of directors) and, as a result, there could be uncertainty as to thevalue of these assets.
The financings we provide and the other assets we hold are not publicly traded. The fair value of assets thatare not publicly traded may not be readily determinable. As required under and in accordance with U.S. GAAP,we record certain of our assets at fair value, which may include unobservable inputs. Because such valuations aresubjective, the fair value of these assets may fluctuate over short periods of time and our determinations of fairvalue may differ materially from the values that would have been used if a ready market for these assets existed.The value of our common stock could be adversely affected if our determinations regarding the fair value ofthese assets were materially higher than the values that we ultimately realize upon their disposal. Additionally,our results of operations for a given period could be adversely affected if our determinations regarding the fairvalue of these assets were materially higher than the values that we ultimately realize upon their disposal. Thevaluation process has been particularly challenging in recent periods as market events have made valuations ofcertain assets more difficult, unpredictable and volatile.
We may not realize income or gains from our assets, which could cause the value of our common stock todecline.
We seek to provide attractive risk-adjusted returns to our stockholders. However, our assets may notappreciate in value and, in fact, may decline in value, and the assets we originate or acquire may default or not
- 19 -

perform in accordance with our expectations. Accordingly, we may not be able to realize gains or income fromour assets. Any gains that we do realize may not be sufficient to offset any other losses we experience. Anyincome that we realize may not be sufficient to offset our expenses.
Many of our assets are not rated by a rating agency, which may result in an amount of risk, volatility orpotential loss of principal that is greater than that of alternative asset opportunities.
Many of our assets are not rated by any rating agency and we expect that many of the assets we originateand acquire in the future will not be rated by any rating agency. Although we focus on sustainable infrastructureprojects with high credit quality obligors, we believe that some of the projects or obligors in which we invest, ifrated, would be rated below investment grade, due to speculative characteristics of the project or the obligor’scapacity to pay interest and repay principal or pay dividends. Some of our assets may result in an amount of risk,volatility or potential loss of principal that is greater than that of alternative asset opportunities.
Any credit ratings assigned to our assets or obligors are subject to ongoing evaluations and revisions andwe cannot assure you that those ratings will not be downgraded.
To the extent the assets we hold or their underlying obligors are rated by credit rating agencies or by ourinternal rating process, such assets will be subject to ongoing evaluation by credit rating agencies and our internalrating process, and we cannot assure you that any ratings will not be changed or withdrawn in the future. If ratingagencies assign a lower-than-expected rating or if a rating is reduced or withdrawn by a rating agency or us, or ifthere are indications of a potential reduction or withdrawal of the ratings of our assets or the underlying obligorsin the future, the value of these assets could significantly decline and could result in losses upon disposition orthe failure of obligors to satisfy their obligations to us.
Our assets are subject to delinquency, foreclosure and loss, any or all of which could result in losses to us.
Our assets are subject to risks of delinquency, foreclosure and loss. In many cases, the ability of a borrowerto repay our financing or the ability of an investment to return our capital and our expected return is dependentprimarily upon the successful development, construction and operation of the underlying project. If the cash flowof the project is reduced, the borrower’s ability to repay the debt financing we provide or the ability of aninvestment to return our capital and our expected return may be impaired. We make certain estimates regardingproject cash flows or savings during the underwriting of our investment. These estimates may not prove accurate,as actual results may vary from estimates. The cash flows or cost savings of a project can be affected by, amongother things: the terms of the power purchase or other use agreements used in such project; the creditworthinessof the power off-taker or project user; power prices now and in the future; the technology deployed;unanticipated expenses in the development or operation of the project and changes in national, regional or localeconomic conditions; and environmental legislation, acts of God, terrorism, social unrest and civil disturbances.
In the event of any default or shortfall of an investment, we will bear a risk of loss of principal or equity tothe extent of any deficiency between the value of the collateral, if any, and the amount of our investment, whichcould have a material adverse effect on our cash flow from operations. In the event of the bankruptcy of a projectowner or other borrower, our investment will be deemed to be subject to the avoidance powers of the bankruptcytrustee or debtor-in-possession and our contractual rights may be unenforceable under state law. Foreclosureproceedings against a project can be an expensive and lengthy process, which could have a substantial negativeeffect on our anticipated return on the foreclosed investment.
Our sustainable infrastructure projects may incur liabilities that rank equally with, or senior to, ourinvestments in such projects.
We provide a range of investment structures, including various types of debt and equity securities, seniorand subordinated loans, real property leases, mezzanine debt, preferred equity and common equity. Our projects
- 20 -
may have, or may be permitted to incur, other liabilities or equity preferences that rank equally with, or senior to,our positions or investments in such projects or businesses, as the case may be, including with respect to grantsof collateral. By their terms, such instruments may entitle the holders to receive payment of interest, principalpayments or equity distributions on or before the dates on which we are entitled to receive payments with respectto the instruments in which we invest. Also, in the event of insolvency, liquidation, dissolution, reorganization orbankruptcy of an entity in which we have invested, holders of instruments ranking senior to our investment inthat project or business would typically be entitled to receive payment in full before we receive any distribution.After repaying such senior stakeholders, such project may not have any remaining assets to use for repaying itsobligation to us. In the case of securities ranking equally with instruments we hold, we would have to share on anequal basis any distributions with other stakeholders holding such instruments in the event of an insolvency,liquidation, dissolution, reorganization or bankruptcy of the relevant project.
Our mezzanine or subordinated loans are less protected against losses than senior debt.
We make or acquire mezzanine or subordinated loans, which are loans made to project owners forsustainable infrastructure projects that are subordinate to other more senior interest or are secured by pledges ofthe borrower’s ownership interests in the project and/or the project owner. These mezzanine or subordinatedloans may be subordinate to senior secured loans on the project or to the returns required by the tax equityinvestor in the project but senior to the project owner’s equity in the project. In the event a borrower defaults on aloan and lacks sufficient assets to satisfy our mezzanine or subordinated financing, we may suffer a loss ofprincipal or interest. In the event a borrower declares bankruptcy, we may not have full recourse to the assets ofthe borrower, or the assets of the borrower may not be sufficient to satisfy our mezzanine or subordinated loan.In addition, mezzanine or subordinated loans are by their nature structurally subordinated to more senior projectlevel financings, and in some cases, to tax equity investors. If a borrower defaults on our mezzanine orsubordinated loan, on its obligations to the tax equity investor or on debt or other obligations senior to our loan,or if a borrower declares bankruptcy, our mezzanine or subordinated loan will be satisfied only after the projectlevel debt or other obligations or tax equity and other senior debt is paid in full. Significant losses related to ourmezzanine or subordinated loans would result in operating losses for us and may limit our ability to makedistributions to our stockholders.
Our subordinated and mezzanine debt and equity investments, many of which are illiquid with no readilyavailable market, involve a substantial degree of risk.
We make subordinated and mezzanine debt and equity investments which may fail to be repaid orappreciate and may decline in value or become worthless and our ability to recover our investment will dependon the success of the project in which we make such investments. Subordinated and mezzanine debt and equityinvestments involve a number of significant risks, including:
• subordinated and mezzanine debt and any equity investment we make in a project could be subject tofurther dilution as a result of the issuance of additional debt or equity interests and to serious risksbecause subordinated and mezzanine debt are subordinate to other indebtedness and in some cases,project tax equity, and equity interests are subordinate to all indebtedness (including trade creditors)and any senior securities in the event that the issuer is unable to meet its obligations or becomes subjectto a bankruptcy process;
• to the extent that a project in which we invest requires additional capital and is unable to obtain it, wemay not recover our investment; and
• in some cases, subordinated and mezzanine debt will not pay current interest or principal or equityinvestments will not pay current dividends, and our ability to realize a return on our investment, as wellas to recover our investment, will be dependent on the success of the project in which we invest. Theproject may face unanticipated costs or delays or may not generate projected cash flows which couldlead to the project generating lower rates of return than we expected when we decided to fund the
- 21 -

project. Further, many projects in which we make subordinated and mezzanine debt or equityinvestments will be subject to competitive risks and to volatility in commodity prices including theprice of energy. Even if the project is successful, our ability to realize the value of our investment maybe dependent on our ability to renew commercial contracts for a project or on the occurrence of aliquidity or other event.
We generally do not control the projects in which we invest.
Although the covenants in our financing or investment documentation generally restrict certain actions thatmay be taken by project owners, we generally do not control the projects in which we invest. As a result, we aresubject to the risk that the project owner may make business decisions with which we disagree or take risks orotherwise act in ways that do not serve our interests.
We invest in joint ventures or other similar arrangements that subject us to additional risks.
Some of our projects are structured as joint ventures, partnerships and securitization, syndication andconsortium arrangements. Part of our strategy is to participate with other institutional investors in consortiumsand in partnerships on various sustainable infrastructure transactions. These arrangements are driven by themagnitude of capital required to complete acquisitions and the development of sustainable infrastructure projectsand other industry-wide trends that we believe will continue. Such arrangements involve risks not present wherea third party is not involved, including the possibility that partners or co-venturers might become bankrupt orotherwise fail to fund their share of required capital contributions. Additionally, partners or co-venturers might atany time have economic or other business interests or goals different from us.
Joint ventures, partnerships and securitization, syndication and consortium investments generally providefor a reduced level of control over an acquired project because governance rights are shared with others.Accordingly, decisions relating to the underlying operations, including decisions relating to the management,operation and the timing and nature of any exit, are often made by a majority vote of the investors or by separateagreements that are reached with respect to individual decisions. In addition, such operations may be subject tothe risk that the project owners may make business, financial or management decisions with which we do notagree or the management of the project may take risks or otherwise act in a manner that does not serve ourinterests. Because we may not have the ability to exercise control over such operations, we may not be able torealize some or all of the benefits that we believe will be created from our involvement. If any of the foregoingwere to occur, our business, financial condition and results of operations could suffer as a result.
In addition, some of our joint ventures, partnerships, securitization or syndication or consortiumarrangements, including our wind equity investments, subject the sale or transfer of our interests in these projectsto rights of first refusal or first offer, tag along rights or drag along rights and buy-sell, call-put or other similararrangements. Such rights may be triggered at a time when we may not want them to be exercised and such rightsmay inhibit our ability to sell our interest in an entity within our desired time frame or on any other desired basis.
Energy efficiency, renewable energy and other sustainable infrastructure projects are subject toperformance risks that could impact the repayment of and the return on our assets.
Energy efficiency, renewable energy and other sustainable infrastructure projects are subject to variousconstruction and operating delays and risks that may cause them to incur higher than expected costs or generateless than expected amounts of output such as electricity in the case of a renewable energy project. These risksinclude construction delays, a failure or degradation of our, our customers’ or the utilities’ equipment; aninability to find suitable equipment or parts; labor shortages; less than expected supply of a project’s source ofrenewable energy, such as solar insolation, wind, geothermal brine or biomass; or a faster than expecteddiminishment of such supply. Further, many projects in which we invest will be subject to competitive risks andto volatility in commodity prices including the price of energy. Any extended interruption in the project’sconstruction or operation, any cost overrun or failure of the project for any reason to generate the expectedamount of output or cash flow, could have a material adverse effect on the repayment of and the return on ourassets.
- 22 -

Many of our assets depend on revenues from third-party contractual arrangements.
Many of the projects in which we invest rely on revenue or repayment from contractual commitments ofend-customers such as the federal government for our energy efficiency projects or utilities under powerpurchase agreements. There is a risk that these customers will default under their contracts. Furthermore, thebankruptcy, insolvency or other liquidity constraints of one or more customers may reduce the likelihood ofcollecting defaulted obligations. Some projects rely on one customer for their revenue and thus the project couldbe materially and adversely affected by any material change in the financial condition of that customer. Whilethere may be alternative customers for such a project, there can be no assurance that a new contract on the sameterms will be able to be negotiated for the project.
Certain of our projects with contractually-committed revenues or other sources of repayment under a smallnumber of long term contracts will be subject to re-contracting risk in the future. We cannot provide assurancethat these contracts can be re-negotiated once their terms expire on equally favorable terms or at all. If it is notpossible to renegotiate these contracts on favorable terms, our business, financial condition, results of operationand prospects could be materially and adversely affected.
Revenues at some of the projects in which we invest depend on reliable and efficient metering, or otherrevenue collection systems, which are often specified in the contract. There is a risk that, if one or more of suchprojects are not able to operate and maintain the metering or other revenue collection systems in the mannerexpected, if the operation and maintenance costs, are greater than expected, or if the customer disputes the outputof the revenue collection system, the ability of the project to repay our financing or provide a return to us on ourasset could be materially and adversely affected.
We are exposed to the credit risk of ESCOs and others.
While we do not anticipate facing significant credit risk in our assets related to U.S. federal governmentenergy efficiency projects, we are subject to varying degrees of credit risk in these projects in relation toguarantees provided by ESCOs where payments under energy savings performance contracts are contingent uponenergy savings. We are also exposed to credit risk in projects in which we invest that do not depend on fundingfrom the U.S. federal government. We increasingly target such projects as part of our strategy. We seek tomitigate this credit risk by employing a comprehensive review and asset selection process and careful ongoingmonitoring of acquired assets. Nevertheless, unanticipated credit losses could occur which could adverselyimpact our operating results. During periods of economic downturn in the global economy, our exposure to creditrisks from obligors increases, and our efforts to monitor and mitigate the associated risks may not be effective inreducing our credit risks. Certain participants in the sustainable energy industry have experienced significantdeclines in the value of their equity and may face difficulty in raising or refinancing debt, both of which increasesthe credit risk to these companies and there can be no assurance they will be able to fulfill their obligations whichcould adversely impact our operating results.
Some of the projects in which we invest have sold their output under power purchase agreements whichexpose the projects to various risks.
Some of our projects enter into PPAs when they contract to sell all or a fixed proportion of the electricitygenerated by the project, sometimes bundled with renewable energy credits and capacity or other environmentalattributes, to a power purchaser, often a utility. PPAs are used to stabilize our revenues from that project. We areexposed to the risk that the power purchaser, who we consider an obligor, will fail to perform under a PPA,which will lead to that project needing to sell its electricity at the market price, which could be substantiallylower than the price provided in the applicable PPA. In most instances, the project also commits to sell minimumlevels of generation. If the project generates less than the committed volumes, it may be required to buy theshortfall of electricity on the open market or make payments of liquidated damages or be in default under a PPA,which could result in its termination. In the event that any of these events were to occur, our business, financialcondition and results of operations could suffer as a result.
- 23 -

Certain of the electricity our assets generate is sold on the open market at spot-market prices. A prolongedenvironment of low prices for natural gas, or other conventional fuel sources, could have a materialadverse effect on our long-term business prospects, financial condition and results of operations.
Historically low prices for traditional fossil fuels, particularly natural gas, could cause demand forrenewable energy to decrease or adversely affect both the price available to our projects under PPAs that theprojects may enter into in the future and the price of the electricity the projects generate for sale on a spot-marketbasis. Low spot market power prices, if combined with other factors, could have a material adverse effect on theprojects and our results of operations and cash available for distribution. Additionally, cheaper conventional fuelsources could also have a negative impact on the power prices the projects are able to negotiate upon theexpiration of current PPAs. As a result, the price our projects realize in the open market could be materially andadversely affected, which could, in turn, have a material adverse effect on the project’s results of operations andcash available for distribution. In the event that any of these events were to occur, our business, financialcondition and results of operations could suffer as a result.
The ability of our assets to generate revenue from certain utility renewable energy projects depends onhaving interconnection arrangements and services.
The future success of our renewable energy assets will depend, in part, on their ability to maintainsatisfactory interconnection agreements. If the interconnection or transmission agreement of a renewable energyproject is terminated for any reason, they may not be able to replace it with an interconnection and transmissionarrangement on terms as favorable as the existing arrangement, or at all, or they may experience significantdelays or costs in connection with securing a replacement. If a network to which one or more of the renewableenergy projects is connected experiences equipment or operational problems or other forms of “down time,” theaffected project may lose revenue and be exposed to non-performance penalties and claims from its customers.These may include claims for damages incurred by customers, such as the additional cost of acquiring alternativeelectricity supply at then-current spot market rates. The owners of the network will not usually compensateelectricity generators for lost income due to down time. These factors could materially affect the ability toforecast operations on these projects, which could negatively affect our business, results of operations, financialcondition and cash flow.
The generation of electric energy from renewable energy sources depends heavily on suitablemeteorological conditions. If renewable conditions are unfavorable, the electricity generation, andtherefore revenue from our renewable generation assets, may be substantially below our expectations.
The electricity produced and revenues generated by a renewable electric generation facility are highlydependent on suitable weather conditions, which are beyond our control. Furthermore, components of renewableenergy systems, such as turbines, solar panels and inverters, could be damaged by natural disasters or severeweather, including hailstorms or tornadoes. The projects in which we invest will be obligated to bear the expenseof repairing the damaged renewable energy systems, and replacing spare parts for key components and insurancemay not cover the costs or the lost revenue. Natural disasters or unfavorable weather and atmospheric conditionscould impair the effectiveness of the renewable energy assets, reduce their output beneath their rated capacity,require shutdown of key equipment or impede operation of the renewable energy assets which could adverselyaffect our business, financial condition and results of operations and cash flows. Sustained unfavorable weathercould also unexpectedly delay the installation of renewable energy systems, which could result in a delay in ourinvesting in new projects or increase the cost of such projects.
We typically base our investment decisions with respect to each renewable energy facility on the findings ofstudies conducted on-site prior to construction or based on historical conditions at existing facilities. However,actual climatic conditions at a facility site may not conform to the findings of these studies. Even if an operatingproject’s historical renewable energy resources are consistent with the long-term estimates, the unpredictablenature of weather conditions often results in daily, monthly and yearly material deviations from the average
- 24 -

renewable resources anticipated during a particular period. Therefore, renewable energy facilities in which weinvest may not meet anticipated production levels or the rated capacity of the generation assets, which couldadversely affect our business, financial condition and results of operations and cash flows.
The amount of electricity renewable energy generation assets produce is also dependent in part on the timeof year. For example, because shorter daylight hours in winter months results in less solar irradiation, thegeneration of particular assets will vary depending on the season. Further, time-of-day pricing factors varyseasonally which contributes to variability of revenues. As a result, we expect the revenue and cash flow fromcertain of our assets to vary based on the time of year.
Operation of electric generation facilities involves significant risks and hazards customary to the powerindustry that could have a material adverse effect on our business, financial condition, results ofoperations and cash flows.
The ongoing operation of the projects in which we invest involves risks that include the breakdown orfailure of equipment or processes or performance below expected levels of output or efficiency due to wear andtear, latent defect, design error or operator error or force majeure events, among other things. In addition tonatural risks such as earthquake, flood, drought, lightning, hurricane and wind, other hazards, such as fire,explosion, structural collapse and machinery failure, acts of terrorism or related acts of war, hostile cyberintrusions or other catastrophic events are inherent risks in the operation of a project. These and other hazardscan cause significant personal injury or loss of life, severe damage to and destruction of property, plant andequipment and contamination of, or damage to, the environment and suspension of operations. Operation of aproject also involves risks that the operator will be unable to transport its product to its customers in an efficientmanner due to a lack of transmission capacity. Unplanned outages of generating units, including extensions ofscheduled outages due to mechanical failures or other problems, occur from time to time and are an inherent riskof the business. Unplanned outages typically increase operation and maintenance expenses and may reducerevenues as a result of selling fewer megawatt hours or require the project to incur significant costs as a result ofobtaining replacement power from third parties in the open market to satisfy forward power sales obligations.The project’s inability to operate its electric generation assets efficiently, manage capital expenditures and costsand generate earnings and cash flow could have a material adverse effect on our investment and our business,financial condition, results of operations and cash flows. While the projects maintain insurance, obtain warrantiesfrom vendors and obligate contractors to meet certain performance levels, the proceeds of such insurance,warranties or performance guarantees may not cover the lost revenues, increased expenses or liquidated damagespayments should the project experience equipment breakdown or non-performance by contractors or vendors.
Some of the projects in which we invest may require substantial operating or capital expenditures in thefuture.
Many of the projects in which we invest are capital intensive and require substantial ongoing expendituresfor, among other things, additions and improvements, and maintenance and repair of plant and equipment relatedto project operations. While we do not typically bear the responsibility for these expenditures, any failure by theequity owner to make necessary operating or capital expenditures could adversely impact project performance. Inaddition, some of these expenditures may not be recoverable from current or future contractual arrangements.
The use of real property rights that we acquire or are used for our sustainable infrastructure projects maybe adversely affected by the rights of lienholders and leaseholders that are superior to those of thegrantors of those real property rights to us.
The projects in which we invest often require large areas of land for construction and operation or othereasements or access to the underlying land. In addition, we may acquire rights to land or other real property. Therights to use the land can be obtained through freehold title, leases and other rights of use. Although we believe
- 25 -
that the real property rights we acquire, or our projects in which we invest, have valid rights to all materialeasements, licenses and rights of way, not all of such easements, licenses and rights of way are registered againstthe lands to which they relate and may not bind subsequent owners. Some of our real property rights and projectsgenerally are, and are likely to continue to be, located on land occupied pursuant to long-term easements andleases. The ownership interests in the land subject to these easements and leases may be subject to mortgagessecuring loans or other liens (such as tax liens) and other easement and lease rights of third parties (such as leasesof oil or mineral rights) that were created prior to, or are superior to, our or our projects’ easements and leases.As a result, the rights under these easements or leases may be subject, and subordinate, to the rights of those thirdparties. We typically obtain representations or perform title searches or obtain title insurance to protect our realproperty interest or our investments in our projects against these risks. Such measures may, however, beinadequate to protect against all risk of loss of rights to use the land rights we have acquired or the land on whichthese projects are located, which could have a material and adverse effect on our land rights, our projects andtheir financial condition and operating results.
We own land or leasehold interests that are used by renewable energy projects. Negative marketconditions or adverse events affecting tenants, or the industries in which they operate, could have anadverse impact on our underwritten returns. Moreover, such assets are concentrated in a limited numberof properties, which subjects us to an increased risk of significant loss if any property declines in value orif we are unable to lease a property.
We own a limited number of land or leasehold interests that are used by renewable energy projects. Oneconsequence of a limited number of real property assets is that the aggregate returns we realize may besubstantially adversely affected by the unfavorable performance of a small number of leases or a significantdecline in the value of any single property. Our cash flow depends in part on the ability to lease the real estate totenants on economically favorable terms. We could be adversely affected by various facts and events over whichwe have limited or no control, such as:
• lack of demand in areas where our properties are located;
• inability to retain existing tenants and attract new tenants;
• oversupply of space and changes in market rental rates;
• our tenants’ creditworthiness and ability to pay rent, which may be affected by their operations, thecurrent economic situation and competition within their industries from other operators;
• defaults by and bankruptcies of tenants, failure of tenants to pay rent on a timely basis, or failure oftenants to comply with their contractual obligations; and
• economic or physical decline of the areas where the properties are located.
At any time, any tenant may experience a downturn in its business that may weaken its operating results oroverall financial condition, a tenant may delay lease commencement, fail to make rental payments when due,decline to extend a lease upon its expiration, become insolvent or declare bankruptcy. Any tenant bankruptcy orinsolvency, leasing delay or failure to make rental payments when due could result in the termination of thetenant’s lease and material losses to us.
If a tenant elects to terminate its lease prior to or upon its expiration or does not renew its lease as it expires,we may not be able to rent or sell the properties. Furthermore, leases that are renewed and some new leases forproperties that are re-leased, may have terms that are less economically favorable than expiring lease terms, ormay require us to incur significant costs, such as lease transaction costs. In addition, negative market conditionsor adverse events affecting tenants, or the industries in which they operate, may force us to sell vacant propertiesfor less than their carrying value, which could result in impairments. Any of these events could adversely affectcash flow from operations and our ability to make distributions to stockholders and service indebtedness. Asignificant portion of the costs of owning property, such as real estate taxes, insurance and maintenance, are not
- 26 -

necessarily reduced when circumstances cause a decrease in rental revenue from the properties. In a weakenedfinancial condition, tenants may not be able to pay these costs of ownership and we may be unable to recoverthese operating expenses from them.
Further, the occurrence of a tenant bankruptcy or insolvency could diminish the income we receive from thetenant’s lease or leases. For instance, a bankruptcy court might authorize the tenant to terminate its leases withus. If that happens, our claim against the bankrupt tenant for unpaid future rent would be subject to statutorylimitations that most likely would be substantially less than the remaining rent we are owed under the leases. Inaddition, any claim we have for unpaid past rent, if any, may not be paid in full. As a result, tenant bankruptciesmay have a material adverse effect on our results of operations.
In addition, since renewable energy projects are often concentrated in certain states, we would also besubject to any adverse change in the political or regulatory climate in those states or specific counties where suchproperties are located that could adversely affect our properties and our ability to lease such properties.
Performance of projects where we invest may be harmed by future labor disruptions and economicallyunfavorable collective bargaining agreements.
A number of the projects where we invest could have workforces that are unionized or that in the future maybecome unionized and, as a result, are required to negotiate the wages, benefits and other terms with many oftheir employees collectively. If these projects were unable to negotiate acceptable contracts with any of theirunions as existing agreements expire, they could experience a significant disruption of their operations, higherongoing labor costs and restrictions on their ability to maximize the efficiency of their operations, which couldhave a material and adverse effect on our business, financial condition and results of operations. In addition, insome jurisdictions where our projects have operations, labor forces have a legal right to strike which may have anegative impact on our business, financial condition and results of operations, either directly or indirectly, forexample if a critical upstream or downstream counterparty was itself subject to a labor disruption which impactedthe ability of our projects to operate.
We invest in projects that rely on third parties to manufacture quality products or provide reliableservices in a timely manner and the failure of these third parties could cause project performance to beadversely affected.
We invest in projects that typically rely on third parties to select and manage various equipment and serviceproviders. These third parties may be responsible for choosing vendors, including equipment suppliers andsubcontractors. Project success often depends on third parties who are capable of installing and managingprojects and structuring contracts that provide appropriate protection against construction and operational risks.In many cases, in addition to contractual protections and remedies, project owners may seek guaranties,warranties and construction bonding to provide additional protection.
The warranties provided by the third parties and, in some cases, their subcontractors, typically limit anydirect harm that results from relying on their products and services. However, there can be no assurance that asupplier or subcontractor will be willing or able to fulfill its contractual obligations and make necessary repairsor replace equipment. In addition, these warranties generally expire within one to five years or may be of limitedscope or provide limited remedies. If projects are unable to avail themselves of warranty protection or receive theexpected protection under the terms of the guaranties or bonding, we may need to incur additional costs,including replacement and installation costs, which could adversely impact our investment.
- 27 -
Liability relating to environmental matters may impact the value of properties that we may acquire or theproperties underlying our assets.
Under various U.S. federal, state and local laws, an owner or operator of real estate or a project may becomeliable for the costs of removal of certain hazardous substances released from the project or any underlying realproperty. These laws often impose liability without regard to whether the owner or operator knew of, or wasresponsible for, the release of such hazardous substances.
The presence of hazardous substances may adversely affect our, or another owner’s, ability to sell acontaminated project or borrow using the project as collateral. To the extent that we, or another project owner,become liable for removal costs, our investment, or the ability of the owner to make payments to us, may benegatively impacted.
We acquire real property rights, make investments in projects that own real property, have collateralconsisting of real property and in the course of our business, we may take title to a project or its underlying realestate assets relating to one of our debt financings. In these cases, we could be subject to environmental liabilitieswith respect to these assets. To the extent that we become liable for the removal costs, our results of operationand financial condition may be adversely affected. The presence of hazardous substances, if any, may adverselyaffect our ability to sell the affected real property or the project and we may incur substantial remediation costs,thus harming our financial condition.
Our insurance and contractual protections may not always cover lost revenue, increased expenses orliquidated damages payments.
Although our assets or projects generally have insurance, supplier warranties, subcontractors performanceassurances such as bonding and other risk mitigation measures, the proceeds of such insurance, warranties,bonding or other measures may not be adequate to cover lost revenue, increased expenses or liquidated damagespayments that may be required in the future.
Risks Related to Our Company
We may change our operational policies (including our investment guidelines, strategies and policies) withthe approval of our board of directors but without stockholder consent at any time, which may adverselyaffect the market value of our common stock and our ability to make distributions to our stockholders.
Our board of directors determines our operational policies and may amend or revise our policies, includingour policies with respect to acquisitions, dispositions, growth, operations, compensation, indebtedness,capitalization and dividends, or approve transactions that deviate from these policies, without a vote of, or noticeto, our stockholders at any time. We may change our investment guidelines, underwriting process and ourstrategy at any time with the approval of our board of directors, but without the consent of our stockholders,which could result in our originating assets that are different in type from, and possibly riskier than, the assetsinitially contemplated. In addition, our charter provides that our board of directors may authorize us to revoke orotherwise terminate our REIT election, without the approval of our stockholders, if it determines that it is nolonger in our best interests to qualify as a REIT. These changes could adversely affect our business, financialcondition, results of operations and our ability to make distributions to our stockholders.
Our management and employees depend on information systems and system failures could significantlydisrupt our business, which may, in turn, negatively affect the market price of our common stock and ourability to make distributions to our stockholders.
Our underwriting process and our asset and financial management and reporting are dependent on ourpresent and future communications and information systems. Any failure or interruption of these systems couldcause delays or other problems in our originating, financing, investing, asset and financial management andreporting activities, which could have a material adverse effect on our operating results.
- 28 -

Cybersecurity risk and cyber incidents may adversely affect our business by causing a disruption to ouroperations, a compromise or corruption of our confidential information and/or damage to our businessrelationships, all of which could negatively impact our financial results.
A cyber incident is considered to be any adverse event that threatens the confidentiality, integrity oravailability of our information resources. These incidents may be an intentional attack or an unintentional eventand could involve gaining unauthorized access to our information systems for purposes of misappropriatingassets, stealing confidential information, corrupting data or causing operational disruption. The result of theseincidents may include disrupted operations, misstated or unreliable financial data, liability for stolen assets orinformation, increased cybersecurity protection and insurance cost, litigation and damage to our relationships. Asour reliance on technology has increased, so have the risks posed to both our information systems and thoseprovided by third-party service providers. We have implemented processes, procedures and internal controls tohelp mitigate cybersecurity risks and cyber intrusions, but these measures, as well as our increased awareness ofthe nature and extent of a risk of a cyber incident, do not guarantee that our financial results, operations orconfidential information will not be negatively impacted by such an incident.
We may seek to expand our business internationally, which will expose us to additional risks that we donot face in the United States, which could have an adverse effect on our business, financial condition andoperating results.
We generate substantially all of our revenue from operations in the United States, and currently derive onlya small amount of revenue from outside of the United States. We may seek to expand our revenue and projectsoutside of the United States in the future. These operations will be subject to a variety of risks that we do not facein the United States, including risk from changes in foreign country regulations, infrastructure, legal systems andmarkets. Other risks include possible difficulty in repatriating overseas earnings and fluctuations in foreigncurrencies.
Our overall success in international markets will depend, in part, on our ability to succeed in different legal,regulatory, economic, social and political conditions. We may not be successful in developing and implementingpolicies and strategies that will be effective in managing these risks in each country where we decide to dobusiness. Our failure to manage these risks successfully could harm our international projects, reduce ourinternational income or increase our costs, thus adversely affecting our business, financial condition andoperating results.
We may seek to expand our business in part through future acquisitions
As we grow our business, we may find opportunities to use acquisitions of companies or assets to invest innew or different projects, expand our project skill-sets and capabilities, expand our geographic markets, addexperienced management and increase our product and service offerings. There are a number of risks associatedwith any acquisition and we may not achieve our goals in making an acquisition. Any future acquisitions that wemay make could disrupt our business, cause dilution to our stockholders and harm our business, financialcondition or operating results. In addition, the time and effort involved in attempting to identify acquisitioncandidates and consummate acquisitions may divert members of our management from the operations of ourcompany.
Risks Relating to Regulation
We cannot predict the unintended consequences and market distortions that may stem from far-ranginggovernmental intervention in the economic and financial system or from regulatory reform of theoversight of financial markets.
The U.S. federal government, the Federal Reserve Board of Governors, the U.S. Treasury, the SEC, U.S.Congress and other governmental and regulatory bodies have taken, are taking or may in the future take, variousactions to address the financial crisis or other areas of regulatory concern. Such actions could have a dramatic
- 29 -

impact on our business, results of operations and financial condition, and the cost of complying with anyadditional laws and regulations could have a material adverse effect on our financial condition and results ofoperations. The far-ranging government intervention in the economic and financial system may carry unintendedconsequences and cause market distortions. We are unable to predict at this time the extent and nature of suchunintended consequences and market distortions, if any.
Loss of our 1940 Act exception would adversely affect us, the market price of shares of our common stockand our ability to distribute dividends.
We conduct our operations so that we are not required to register as an investment company under the 1940Act. Section 3(a)(1)(A) of the 1940 Act defines an investment company as any issuer that is or holds itself out asbeing engaged primarily in the business of investing, reinvesting or trading in securities. Section 3(a)(1)(C) of the1940 Act defines an investment company as any issuer that is engaged or proposes to engage in the business ofinvesting, reinvesting, owning, holding or trading in securities and owns or proposes to acquire investmentsecurities having a value exceeding 40% of the value of the issuer’s total assets (exclusive of U.S. Governmentsecurities and cash items) on a non-consolidated basis, which we refer to as the 40% test. Excluded from the term“investment securities,” among other things, are U.S. Government securities and securities issued bymajority-owned subsidiaries that are not themselves investment companies and are not relying on the exceptionfrom the definition of investment company set forth in Section 3(c)(1) or Section 3(c)(7) of the 1940 Act.
We conduct our businesses primarily through our subsidiaries and our operations so that we comply with the40% test. The securities issued by any wholly-owned or majority-owned subsidiaries that we hold or may form inthe future that are excepted from the definition of “investment company” based on Section 3(c)(1) or 3(c)(7) ofthe 1940 Act, together with any other investment securities we may own, may not have a value in excess of 40%of the value of our total assets on a non-consolidated basis. Certain of our subsidiaries rely on or will rely on anexception from registration as an investment company under the 1940 Act pursuant to Section 3(c)(5)(C) of the1940 Act, which is available for entities which are not primarily engaged in issuing redeemable securities,face-amount certificates of the installment type or periodic payment plan certificates and which are primarilyengaged in the business of purchasing or otherwise acquiring mortgages and other liens on and interests in realestate. This exception generally requires that at least 55% of such subsidiaries’ portfolios must be comprised ofqualifying assets and at least 80% of each of their portfolios must be comprised of qualifying assets and realestate-related assets under the 1940 Act. Consistent with guidance published by the SEC staff, we intend to treatas qualifying assets for this purpose loans secured by projects for which the original principal amount of the loandid not exceed 100% of the value of the underlying real property portion of the collateral when the loan wasmade. We intend to treat as real estate-related assets non-controlling equity interests in joint ventures that ownprojects whose assets are primarily real property. In general, with regard to our subsidiaries relying onSection 3(c)(5)(C), we rely on other guidance published by the SEC or its staff or on our analyses of guidancepublished with respect to other types of assets to determine which assets are qualifying real estate assets and realestate-related assets.
In addition, one or more of our subsidiaries qualifies for an exception from registration as an investmentcompany under the 1940 Act pursuant to either Section 3(c)(5)(A) of the 1940 Act, which is available for entitieswhich are not engaged in the business of issuing redeemable securities, face-amount certificates of theinstallment type or periodic payment plan certificates, and which are primarily engaged in the business ofpurchasing or otherwise acquiring notes, drafts, acceptances, open accounts receivable, and other obligationsrepresenting part or all of the sales price of merchandise, insurance, and services, or Section 3(c)(5)(B) of the1940 Act, which is available for entities primarily engaged in the business of making loans to manufacturers,wholesalers, and retailers of, and to prospective purchasers of, specified merchandise, insurance, and services.These exceptions generally require that at least 55% of such subsidiaries’ portfolios must be comprised ofqualifying assets that meet the requirements of the exception. We intend to treat energy efficiency loans wherethe loan proceeds are specifically provided to finance equipment, services and structural improvements toproperties and other facilities and renewable energy and other sustainable infrastructure projects or
- 30 -

improvements as qualifying assets for purposes of these exceptions. In general, we also expect, with regard to oursubsidiaries relying on Section 3(c)(5)(A) or (B), to rely on guidance published by the SEC or its staff or on ouranalyses of guidance published with respect to other types of assets to determine which assets are qualifyingassets under the exceptions.
Although we monitor the portfolios of our subsidiaries relying on the Section 3(c)(5)(A), (B) or(C) exceptions periodically and prior to each acquisition, there can be no assurance that such subsidiaries will beable to maintain their exceptions. Qualification for exceptions from registration under the 1940 Act will limit ourability to make certain investments. For example, these restrictions will limit the ability of these subsidiaries tomake loans that are not secured by real property or that do not represent part or all of the sales price ofmerchandise, insurance, and services.
There can be no assurance that the laws and regulations governing the 1940 Act, including the Division ofInvestment Management of the SEC providing more specific or different guidance regarding these exceptions,will not change in a manner that adversely affects our operations. For example, on August 31, 2011, the SECissued a concept release (No. IC-29778; File No. SW7-34-11, Companies Engaged in the Business of AcquiringMortgages and Mortgage-Related Instruments) pursuant to which it is reviewing the scope of the exception fromregistration under Section 3(c)(5)(C) of the 1940 Act. Any additional guidance from the SEC or its staff from thisprocess or in other circumstances could provide additional flexibility to us, or it could further inhibit our abilityto pursue the strategies we have chosen. If we or our subsidiaries fail to maintain an exception from the 1940Act, we could, among other things, be required either to (1) change the manner in which we conduct ouroperations to avoid being required to register as an investment company, (2) effect sales of our assets in a mannerthat, or at a time when, we would not otherwise choose to do so or (3) register as an investment company, any ofwhich could negatively affect our business, our ability to make distributions and the market price for our sharesof common stock.
We have not requested the SEC or its staff to approve our treatment of any company as a majority-ownedsubsidiary and neither the SEC nor its staff has done so. If the SEC or its staff were to disagree with ourtreatment of one or more companies as majority-owned subsidiaries, we would need to adjust our strategy andour assets in order to continue to pass the 40% test. Any such adjustment in our strategy could have a materialadverse effect on us.
Rapid changes in the values of our assets may make it more difficult for us to maintain our qualification asa REIT or our exception from the 1940 Act.
If the market value or income potential of our assets changes as a result of changes in interest rates, generalmarket conditions, government actions or other factors, we may need to adjust the portfolio mix of our real estateassets and income or liquidate our non-qualifying assets to maintain our REIT qualification or our exceptionfrom the 1940 Act. If changes in asset values or income occur quickly, this may be especially difficult toaccomplish. This difficulty may be exacerbated by the illiquid nature of the assets we may own. We may have tomake decisions that we otherwise would not make absent the REIT and 1940 Act considerations.
Because we expect to distribute substantially all of our taxable income to our stockholders, we will needadditional capital to finance our growth and such capital may not be available on favorable terms or at all.
We may need additional capital to fund our growth. U.S. federal income tax law generally requires that aREIT distribute annually at least 90% of its REIT taxable income, without regard to the deduction for dividendspaid and excluding net capital gains, and that it pay tax at regular corporate rates to the extent that it annuallydistributes greater than 90% but less than 100% of its REIT taxable income. Because we intend to grow ourbusiness, this limitation may require us to incur additional debt or raise additional equity at a time when it maybe disadvantageous to do so. We cannot make any assurance that debt and equity financing will be available to uson favorable terms, or at all, and debt financings may be restricted by the terms of any of our outstanding
- 31 -

borrowings. If additional funds are not available to us, we could be forced to curtail or cease new assetoriginations and acquisitions, which could have a material adverse effect on our business and financial condition.
The preparation of our financial statements involves use of estimates, judgments and assumptions, and ourfinancial statements may be materially affected if our estimates prove to be inaccurate.
Financial statements prepared in accordance with U.S. GAAP require the use of estimates, judgments andassumptions that affect the reported amounts. Different estimates, judgments and assumptions reasonably couldbe used that would have a material effect on the financial statements, and changes in these estimates, judgmentsand assumptions are likely to occur from period to period in the future. Significant areas of accounting requiringthe application of management’s judgment include, but are not limited to determining the fair value of our assets.These estimates, judgments and assumptions are inherently uncertain, and, if they prove to be wrong, then weface the risk that charges to income will be required. In addition, because our company has a limited operatinghistory, we have in some of these areas limited experience in making these estimates, judgments and assumptionsand the risk of future charges to income may be greater than if we had more experience in these areas. Any suchcharges could significantly harm our business, financial condition, results of operations and the price of oursecurities. See “Management’s Discussion and Analysis of Financial Condition and Results of Operations—Critical Accounting Policies” for a discussion of the accounting estimates, judgments and assumptions that webelieve are the most critical to an understanding of our business, financial condition and results of operations.
Risks Related to Borrowings
We use leverage in executing our business strategy, which may adversely affect the return on our assetsand may reduce cash available for distribution to our stockholders, as well as increase losses wheneconomic conditions are unfavorable.
We use leverage to finance our assets, including our credit facility and our nonrecourse debt as well assecuritizations. In the future, our financing sources may also include other fixed and floating rate borrowings inthe form of new bank credit facilities (including term loans and revolving facilities), warehouse facilities,repurchase agreements, securitizations and public and private debt issuances. For further information on ourcredit facility and nonrecourse debt, see “Management’s Discussion and Analysis of Financial Condition andResults of Operations—Credit Facility and —Nonrecourse Debt.”
Changes in the financial markets and the economy generally could adversely affect one or more of ourlenders or potential lenders and could cause one or more of our lenders, potential lenders or institutional investorsto be unwilling or unable to provide us with financing or participate in securitizations or could increase the costsof that financing or securitization. The return on our assets and cash available for distribution to our stockholdersmay be reduced to the extent that market conditions prevent us from leveraging our assets or increase the cost ofour financing relative to the income that can be derived from the assets acquired. Increases in our financing costswill reduce cash available for distributions to stockholders. We may not be able to meet our financing obligationsand, to the extent that we cannot, we risk the loss of some or all of our assets to liquidation or sale to satisfy theobligations.
An increase in our borrowing costs relative to the interest we receive on our leveraged assets mayadversely affect our profitability and our cash available for distribution to our stockholders. Ourborrowings may have a shorter duration than our assets.
Borrowing rates are currently at historically low levels that may not be sustained in the long run. As anyborrowing agreements we enter into mature, we will be required either to enter into new borrowings or to sellcertain of our assets. In addition, our credit facility has rates that adjust on a frequent basis based on prevailinginterest rates. An increase in interest rates, or the flattening of the yield curve, would reduce the spread betweenthe returns on our assets and the cost of any new borrowings or borrowings where the interest rate adjusts to
- 32 -

market rates. This increase in interest rates would adversely affect the returns on our assets, which might reduceour earnings and, in turn, cash available for distribution to our stockholders. In addition, as we may useshort-term borrowings including repurchase agreements and warehouse facilities that are generally short-termcommitments of capital, lenders may respond to market conditions making it more difficult for us to securecontinued financing. If we are not able to renew our then existing facilities or arrange for new financing on termsacceptable to us, or if we default on our covenants or are otherwise unable to access funds under any of thesefacilities, we may have to curtail entering into new transactions and/or dispose of assets. We will face particularrisk in this regard given that we expect many of our borrowings will have a shorter duration than the assets theyfinance.
We do not have a formal policy limiting the amount of debt we may incur. Our board of directors maychange our leverage policy without stockholder approval.
Although we are not restricted by any regulatory requirements to maintain our leverage ratio at or below anyparticular level, the amount of leverage we may deploy for particular assets will depend upon the availability ofparticular types of financing and our assessment of the credit, liquidity, price volatility and other risks of thoseassets and the credit quality of our financing counterparties. In March 2015, we increased our leverage target to2.5 to 1 from less than 2.0 to 1. Our debt to equity ratio was approximately 2.1 to 1 as of December 31, 2015. Wealso have increased the percentage of fixed rate debt from zero at the IPO to approximately 71% as ofDecember 31, 2015, or slightly above our targeted fixed rate debt percentage range of approximately 50% to70%. In order to simplify these calculations, we have begun to use, in February 2016, the total debt on ourbalance sheet, including our credit facility, nonrecourse securitization debt and other nonrecourse match fundeddebt. Historically, we excluded the other nonrecourse match funded debt, which as of December 31, 2015, was$101 million, and if such debt would have been excluded, the debt to equity ratio would have been 1.9 to 1 andthe fixed rate debt percentage was 68%. We continue to calculate both of these ratios exclusive of securitizationsthat are not consolidated on our balance sheet (where the collateral is typically borrowings with U.S. governmentobligors) and for the purposes of the fixed rate debt target, we include as fixed rate debt, the present notionalvalue hedged by interest rate swaps. However, our charter and bylaws do not limit the amount or type ofindebtedness we can incur, and our board of directors has changed, and has the discretion to deviate from orchange at any time in the future, our leverage policy, which could result in an investment portfolio with adifferent risk profile. Moreover, we have more limited experience dealing with debt financings with obligorsother than U.S. federal government agencies as well as with our other types of assets and we may apply too muchleverage to our assets or use the wrong kinds of financings to leverage our assets.
We will require additional borrowings and equity raises in the future to achieve our targets
To achieve our leverage target and to grow our business, we will require new sources of debt and equitywhich may be difficult to arrange or which may have significantly higher costs. Certain participants in thesustainable energy industry have experienced significant declines in the value of their equity and may facedifficulty in raising new equity or in raising or refinancing debt. If we were to experience such declines ordifficulties, we may be forced to limit our growth, liquidate assets or incur higher costs which may significantlyharm our business, financial condition, results of operations, and our ability to make or grow our distributions,which could cause the value of our common stock to decline.
The use of securitizations and special purpose entities would expose us to additional risks.
We presently hold, and to the extent that we securitize loans in the future, we anticipate that we will oftenhold the most junior certificates or the residual value associated with a securitization. We may also establishother funds or special purpose entities where we would hold only a partial interest, a residual value or a right toparticipate in the profits of such entity once it achieves a predefined threshold. As a holder of the residual valueor other such interests, we are more exposed to losses on the underlying collateral because the interest we retainin the securitization vehicle or other entity would be subordinate to the more senior notes or interests issued to
- 33 -

investors and we would, therefore, absorb all of the losses, up to the value of our interests, sustained with respectto the underlying assets before the owners of the notes or other interests experience any losses. In addition, theinability to securitize our portfolio or assets within our portfolio could hurt our performance and our ability togrow our business.
We also use various special purpose entities to own and finance our assets. These subsidiaries incur varioustypes of debt, which can be used to finance one or more of our assets. This debt is typically structured asnonrecourse debt, which means it is repayable solely from the revenue from the investment financed by the debtand is secured by the related physical assets, major contracts, cash accounts and in some cases, a pledge of ourownership interests in the subsidiaries involved in the projects. Although this subsidiary debt is typicallynonrecourse to us, we make certain representations and warranties or enter into certain guaranties of oursubsidiary’s obligations or covenants to the nonrecourse debt holder, the breach of which may require us to makepayments to the lender. We may also from time to time determine to provide financial support to the subsidiaryin order to maintain rights to the project or otherwise avoid the adverse consequences of a default. In the event asubsidiary defaults on its indebtedness, its creditors may foreclose on the collateral securing the indebtedness,which may result in us losing our ownership interest in some or all of the subsidiary’s assets. The loss of ourownership interest in a subsidiary or some or all of a subsidiary’s assets could have a material adverse effect onour business, financial condition and operating results.
Our existing credit facility and nonrecourse debt contain, and any future financing facilities may contain,covenants that restrict our operations and may inhibit our ability to grow our business and increaserevenues.
Our existing senior secured revolving credit facility contains, and any future financing facilities maycontain, various affirmative and negative covenants, including maintenance of an interest coverage ratio andlimitations on the incurrence of liens and indebtedness, investments, fundamental organizational changes,dispositions, changes in the nature of business, transactions with affiliates, use of proceeds and stockrepurchases. In addition, the terms of our nonrecourse debt include restrictions and covenants, includinglimitations on our ability to transfer or incur liens on the assets that secure the debt. For further information see“Management’s Discussion and Analysis of Financial Condition and Results of Operations—Credit Facilityand —Nonrecourse Debt.”
The covenants and restrictions included in our existing financings do, and the covenants and restrictions tobe included in any future financings may, restrict our ability to, among other things:
• incur or guarantee additional debt;
• make certain investments, originations or acquisitions;
• make distributions on or repurchase or redeem capital stock;
• engage in mergers or consolidations;
• reduce liquidity below certain levels;
• grant liens;
• incur operating losses for more than a specified period; and
• enter into transactions with affiliates.
Our nonrecourse debt limits our ability to take action with regard to the assets pledged as security for thedebt. These restrictions, as well as any other covenants contained in any future financings, may interfere with ourability to obtain financing, or to engage in other business activities, which may significantly limit or harm ourbusiness, financial condition, liquidity and results of operations. Our financing agreements may containcross-default provisions, so that if a default occurs under any one agreement, the lenders under our other
- 34 -

agreements could also declare a default. Although as of December 31, 2015, we were in compliance with all ofthe covenants in our existing credit facility and nonrecourse debt, a default and resulting repayment accelerationcould significantly reduce our liquidity, which could require us to sell our assets to repay amounts due andoutstanding. This could also significantly harm our business, financial condition, results of operations, and ourability to make distributions, which could cause the value of our common stock to decline and adversely affectour ability to qualify, or remain qualified, as a REIT. A default will also significantly limit our financingalternatives such that we will be unable to pursue our leverage strategy, which could curtail the returns on ourassets.
We will have to pay off the remaining balance or refinance our borrowings when they become due. Thefailure to be able to pay off the remaining balance or refinance such borrowings or an increase in interestrates of such refinancing could have a material impact on our business.
Some of our borrowings will have a remaining balance when they become due. See Note 7 and 8 of ouraudited financial statements in this Form 10-K for more information on our borrowings. If our subsidiary isunable to repay or refinance the remaining balance of this debt, or if the terms of any available refinancing arenot favorable, we may be forced to liquidate assets or incur higher costs which may significantly harm ourbusiness, financial condition, results of operations, and our ability to make distributions, which could cause thevalue of our common stock to decline.
If a counterparty to repurchase transactions defaults on its obligation to resell the underlying securityback to us at the end of the transaction term, or if the value of the underlying security has declined as ofthe end of that term, or if we default on obligations under the repurchase agreement, we will lose moneyon repurchase transactions.
If we engage in repurchase transactions, we will generally sell loans or other financings to lenders (i.e.,repurchase agreement counterparties) and receive cash from the lenders. The lenders will be obligated to resellthe same financings back to us at the end of the term of the transaction. Because the cash we will receive fromthe lender when we initially sell the financing to the lender is less than its value (this difference is the haircut), ifthe lender defaults on its obligation to resell the same loans back to us we would incur a loss on the transactionequal to the amount of the haircut (assuming there was no other change in value). We would also lose money ona repurchase transaction if the value of the underlying loans has declined as of the end of the transaction term, aswe would have to repurchase the loans for their initial value but would receive loans worth less than that amount.We may also be forced to sell assets at significantly depressed prices to meet margin calls, post additionalcollateral and maintain adequate liquidity, which could cause us to incur losses. Moreover, to the extent we areforced to sell assets at such time, given market conditions, we may be selling at the same time as others facingsimilar pressures, which could exacerbate a difficult market environment and which could result in our incurringsignificantly greater losses on our sale of such assets. In an extreme case of market duress, a market may noteven be present for certain of our assets at any price. Such a situation would likely result in a rapid deteriorationof our financial condition and possibly necessitate a filing for protection under the United States BankruptcyCode (the “Bankruptcy Code”). Further, if we default on one of our obligations under a repurchase transaction,the lender will be able to terminate the transaction and cease entering into any other repurchase transactions withus. We expect that our repurchase agreements will contain cross-default provisions, so that if a default occursunder any one agreement, the lenders under our other agreements could also declare a default. If a default occursunder any of our repurchase agreements and the lenders terminate one or more of our repurchase agreements, wemay need to enter into replacement repurchase agreements with different lenders. There can be no assurance thatwe will be successful in entering into such replacement repurchase agreements on the same terms as therepurchase agreements that were terminated or at all. Any losses we incur on our repurchase transactions couldadversely affect our earnings and thus our cash available for distribution to our stockholders. In the event of ourinsolvency or bankruptcy, certain repurchase agreements may qualify for special treatment under the BankruptcyCode, the effect of which, among other things, would be to allow the lender under the applicable repurchaseagreement to avoid the automatic stay provisions of the Bankruptcy Code and to foreclose on the collateralagreement without delay, which could ultimately reduce the amounts we could otherwise recover.
- 35 -

Risks Related to Hedging
We, or the projects in which we invest, enter into hedging transactions that could expose us to contingentliabilities in the future and adversely impact our financial condition.
Subject to maintaining our qualification as a REIT, part of our strategy, or the strategy of the projects inwhich we invest, involves entering into hedging transactions that could require us to fund cash payments incertain circumstances (e.g., the early termination of the hedging instrument caused by an event of default or otherearly termination event, or the decision by a counterparty to request margin securities it is contractually owedunder the terms of the hedging instrument). The amount due would be equal to the unrealized loss of the openswap positions with the respective counterparty and could also include other fees and charges. These economiclosses will be reflected in our, or the project’s, results of operations, and our, or the project’s, ability to fund theseobligations will depend on the liquidity of our, or the project’s, assets and access to capital at the time, and theneed to fund these obligations could adversely impact our financial condition.
We have limited experience hedging the interest rate or commodity risk of our assets and such hedgingmay adversely affect our results of operations.
We have limited experience hedging the interest rate or commodity risk of our assets, as the holders of thenotes issued by trusts or vehicles and collateralized by our projects historically managed this risk. However, aspart of our strategy, we may pursue various hedging strategies to seek to reduce our exposure to adverse changesin interest rates or commodity prices. Our hedging activity will vary in scope based on the level and volatility ofinterest rates or the underlying commodity, the type of assets held and other changing market conditions. Interestrate or commodity hedging may fail to protect or could adversely affect us because, among other things:
• our hedging strategies may be poorly designed or improperly executed resulting from our limitedexperience hedging the interest rate or commodity risk of our assets;
• interest rate or commodity hedging can be expensive, particularly during periods of rising and volatileinterest rates or commodity prices;
• available interest rate or commodity hedges may not correspond directly with the interest rate orcommodity risk for which protection is sought;
• the duration of the hedge may not match the duration of the related liability or exposure;
• the amount of income that a REIT may earn from certain hedging transactions (other than throughtaxable REIT subsidiaries, or “TRSs”), to offset interest rate losses is limited by U.S. federal taxprovisions governing REITs;
• the credit quality of the hedging counterparty owing money on the hedge may be downgraded to suchan extent that it impairs our ability to sell or assign our side of the hedging transaction;
• the hedging counterparty owing money in the hedging transaction may default on its obligation to pay;and
• our hedging transactions, which are intended to limit losses, may actually adversely affect our earnings,which could reduce our cash available for distribution to our stockholders.
In addition, over-the-counter hedges entered into to hedge interest rates or commodity prices involve risksince they often are not traded on regulated exchanges or cleared through a central counterparty. We wouldremain exposed to our counterparty’s ability to performance perform its obligations under each hedge and cannotlook to the creditworthiness of a central counterparty for performance. As a result, if a hedging counterpartycannot perform under the terms of the hedge, we would not receive payments due under that hedge, we may loseany unrealized gain associated with the hedge and the hedged liability would cease to be hedged. While wewould seek to terminate the relevant hedge transaction and may have a claim against the defaulting counterparty
- 36 -

for any losses, including unrealized gains, there is no assurance that we would be able to recover such amounts orto replace the relevant hedge on economically viable terms or at all. In such case, we could be forced to cover ourunhedged liabilities at the then current market price. We may also be at risk for any collateral we have pledged tosecure our obligations under the hedge if the counterparty becomes insolvent or files for bankruptcy.
Furthermore, our interest rate swaps and other hedge transactions are subject to increasing statutory andother regulatory requirements and, depending on the identity of the counterparty, applicable internationalrequirements. Recently, new regulations have been promulgated by U.S. and foreign regulators to strengthen theoversight of swaps, and any further actions taken by such regulators could constrain our strategy or increase ourcosts, either of which could materially and adversely impact our results of operations.
In addition, the Dodd—Frank Wall Street Reform and Consumer Protection Act requires certain derivatives,including certain interest rate swaps, to be executed on a regulated market and cleared through a centralcounterparty. Unlike over-the-counter swaps, the counterparty for the cleared swaps is the clearing house, whichreduces counterparty risk. However, cleared swaps require us to appoint clearing brokers and to post margin inaccordance with the clearing house’s rules, which has resulted in increased costs for cleared swaps compared toover-the-counter swaps. Our over-the-counter hedges with swap dealers will become subject to marginregulations promulgated by U.S. regulators on March 1, 2017, which regulations are expected to increase therequired margin, and the cost to us of over-the-counter swaps. The margin requirements for both cleared anduncleared swaps also limit eligible margin to cash and specified types of securities, which may further increasethe costs of hedging and induce us to change or reduce the use of hedging transactions. The margin regulationsare not expected to apply to any over-the-counter swaps that were entered into prior to the effective date of suchregulations.
In addition, the projects in which we invest, may enter into various forms of hedging including interest rateand power price hedging. To the extent they enter into such hedges, the financial results of the project will beexposed to similar risks as described above which could adversely impact our results of operations.
If we choose not to pursue, or fail to qualify for, hedge accounting treatment, our operating results maysuffer because losses on the derivatives that we enter into may not be offset by a change in the fair value ofthe related hedged transaction.
We may choose not to pursue, or fail to qualify for, hedge accounting treatment relating to derivative andhedging transactions. We may fail to qualify for hedge accounting treatment for a number of reasons, including ifwe use instruments that do not meet the Accounting Standards Codification (“ASC”) Topic 815 definition of aderivative (such as short sales), we fail to satisfy ASC Topic 815 hedge documentation and hedge effectivenessassessment requirements or our instruments are not highly effective. If we fail to qualify for, or choose not topursue, hedge accounting treatment, our operating results may suffer because losses on the derivatives that weenter into may not be offset by a change in the fair value of the related hedged transaction.
Risks Related to Our Common Stock
There can be no assurance that an active trading market for our common stock will continue, which couldcause our common stock to trade at a discount and make it difficult for holders of our common stock tosell their shares.
Our common stock is listed on the NYSE. However, there can be no assurance that an active trading marketfor our common stock will continue, which could cause our common stock to trade at a discount. Accordingly, noassurance can be given as to the ability of our stockholders to sell their common stock or the price that ourstockholders may obtain for their common stock. Some of the factors that could negatively affect the marketprice of our common stock include:
• our actual or projected operating results, financial condition, cash flows and liquidity or changes inbusiness strategy or prospects;
- 37 -

• changes in the mix of our financing products and services, including the level of securitizations or feeincome in any quarter;
• actual or perceived conflicts of interest with individuals, including our executives;
• our ability to arrange financing for projects;
• equity issuances by us, or share resales by our stockholders, or the perception that such issuances orresales may occur;
• seasonality in construction and demand for our financial solutions;
• actual or anticipated accounting problems;
• publication of research reports about us or the sustainable infrastructure industry;
• changes in market valuations of similar companies;
• adverse market reaction to any increased indebtedness we may incur in the future;
• commodity price changes;
• interest rate changes;
• additions to or departures of our key personnel;
• speculation in the press or investment community;
• our failure to meet, or the lowering of, our earnings estimates or those of any securities analysts;
• increases in market interest rates, which may lead investors to demand a higher distribution yield forour common stock, and would result in increased interest expenses on our debt;
• changes in governmental policies, regulations or laws;
• failure to qualify, or maintain our qualification, as a REIT or failure to maintain our exception fromregistration as an investment company under the 1940 Act;
• price and volume fluctuations in the stock market generally; and
• general market and economic conditions, including the current state of the credit and capital markets.
Market factors unrelated to our performance could also negatively impact the market price of our commonstock. One of the factors that investors may consider in deciding whether to buy or sell our common stock is ourdistribution rate as a percentage of our stock price relative to market interest rates. If market interest ratesincrease, prospective investors may demand a higher distribution rate or seek alternative investments payinghigher dividends or interest. As a result, interest rate fluctuations and conditions in capital markets can affect themarket value of our common stock.
Common stock and preferred stock eligible for future sale may have adverse effects on our share price.
Subject to applicable law, our board of directors, without stockholder approval, may authorize us to issueadditional authorized and unissued shares of common stock and preferred stock on the terms and for theconsideration it deems appropriate.
In addition, we entered into a registration rights agreement pursuant to which we granted registration rightsto those persons who received common stock (including common stock issuable upon exchange of units oflimited partnership interests in our Operating Partnership (“OP units”)) in our formation transactions. OnAugust 27, 2014, the SEC declared effective the registration statement, which covers the resale of 3,178,410shares of our common stock (including 331,282 shares of common stock issuable upon exchange of an equivalentnumber of OP units). In certain circumstances, the registration rights agreement also requires us to providepiggyback and underwritten offering demand rights to those holders who received common stock (includingcommon stock issuable upon exchange of OP units) in our formation transactions.
- 38 -

We cannot predict the effect, if any, of future sales of our common stock or the availability of shares forfuture sales, on the market price of our common stock. Sales of substantial amounts of common stock or theperception that such sales could occur may adversely affect the prevailing market price for our common stock.
We cannot assure you of our ability to make distributions in the future. If our portfolio of assets fails togenerate sufficient income and cash flow, we could be required to sell assets, borrow funds or make aportion of our distributions in the form of a taxable stock distribution or distribution of debt securities.
We are generally required to distribute to our stockholders at least 90% of our REIT taxable income(without regard to the deduction for dividends paid and excluding net capital gains) each year for us to qualify,and maintain our qualification, as a REIT under the Internal Revenue Code of 1986, as amended (the “InternalRevenue Code”). Our current policy is to pay quarterly distributions, which on an annual basis will equal all orsubstantially all of our taxable income. In the event that our board of directors authorizes distributions in excessof the income or cash flow generated from our assets, we may make such distributions from the proceeds offuture offerings of equity or debt securities or other forms of debt financing or the sale of assets.
Our ability to make distributions may be adversely affected by a number of factors. Therefore, although weanticipate making quarterly distributions to our stockholders, our board of directors has the sole discretion todetermine the timing, form and amount of any distributions to our stockholders. If our portfolio of assets fails togenerate sufficient income and cash flow, we could be required to sell assets, borrow funds or make a portion ofour distributions in the form of a taxable stock distribution or distribution of debt securities. To the extent that weare required to sell assets in adverse market conditions or borrow funds at unfavorable rates, our results ofoperations could be materially and adversely affected. Our board of directors will make determinations regardingdistributions based upon various factors, including our earnings, our financial condition, our liquidity, our debtand preferred stock covenants, maintenance of our REIT qualification, applicable provisions of the MGCL andother factors as our board of directors may deem relevant from time to time. We believe that a change in any oneof the following factors could adversely affect our results of operations and impair our ability to makedistributions to our stockholders:
• our ability to make profitable investments and loans;
• margin calls or other expenses that reduce our cash flow;
• defaults in our asset portfolio or decreases in the value of our portfolio; and
• the fact that anticipated operating expense levels may not prove accurate, as actual results may varyfrom estimates.
As a result, no assurance can be given that we will be able to make distributions to our stockholders at anytime in the future or that the level of any distributions we do make to our stockholders will achieve a marketyield or increase or even be maintained over time, any of which could materially and adversely affect us.
In addition, distributions that we make to our stockholders will generally be taxable to our stockholders asordinary income. However, a portion of our distributions may be designated by us as long-term capital gains tothe extent that they are attributable to capital gain income recognized by us or may constitute a return of capitalto the extent that they exceed our earnings and profits as determined for tax purposes. A return of capital is nottaxable, but has the effect of reducing the basis of a stockholder’s investment in shares of our common stock.
Future offerings of debt or equity securities, which may rank senior to our common stock, may adverselyaffect the market price of our common stock.
Our present debt ranks, and any future debt would rank, senior to our common stock. Such debt is, and likelywill be, governed by a loan agreement, an indenture or other instrument containing covenants restricting ouroperating flexibility. Additionally, any equity securities or convertible or exchangeable securities that we issue in
- 39 -

the future may have rights, preferences and privileges more favorable than those of our common stock and mayresult in dilution to owners of our common stock. We and, indirectly, our stockholders will bear the cost ofissuing and servicing such debt or securities. Because our decision to issue debt or equity securities in any futureoffering will depend on market conditions and other factors beyond our control, we cannot predict or estimate theamount, timing or nature of our future offerings. Thus, holders of our common stock will bear the risk of ourfuture offerings reducing the market price of our common stock and diluting the value of their stock holdings inus.
Risks Related to Our Organization and Structure
Our business could be harmed if key personnel terminate their employment with us.
Our success depends, to a significant extent, on the continued services of Jeffrey Eckel, Brendan Herron,Steven Chuslo, Rhem Wooten, Nate Rose, Daniel McMahon and the other members of our senior managementteam. Upon completion of our IPO and our formation transactions, several of our officers, including JeffreyEckel, our chief executive officer, Brendan Herron, our executive vice president and chief financial officer,Steven Chuslo, our executive vice president and general counsel, Rhem Wooten and Daniel McMahon, ourexecutive vice presidents, and Nate Rose, our executive vice president and chief operating officer, entered intonew employment agreements with us. These employment agreements provide for an initial four-year term ofemployment. Notwithstanding these agreements, there can be no assurance that any or all of these members ofour senior management team will remain employed by us. We do not maintain key person life insurance on anyof our officers other than two policies we maintain for Mr. Eckel under which we are a named beneficiary in theamount of approximately $3 million. The loss of services of one or more members of our senior managementteam could harm our business and our prospects.
Conflicts of interest could arise as a result of our structure.
Conflicts of interest could arise in the future as a result of the relationships between us and our affiliates, onthe one hand, and our Operating Partnership or any partner thereof, on the other. Our directors and officers haveduties to our company under applicable Maryland law in connection with our management. At the same time, wehave fiduciary duties, as a general partner, to our Operating Partnership and to our limited partners underDelaware law in connection with the management of our Operating Partnership. Our duties, as the generalpartner, to our Operating Partnership and our partners may come into conflict with the duties of our directors andofficers to us.
Unless otherwise provided for in the relevant partnership agreement, Delaware law generally requires ageneral partner of a Delaware limited partnership to adhere to fiduciary duty standards under which it owes itslimited partners the highest duties of good faith, fairness and loyalty and which generally prohibit such generalpartner from taking any action or engaging in any transaction as to which it has a conflict of interest.
Additionally, the partnership agreement of our Operating Partnership expressly limits our liability byproviding that neither we, as the general partner of the Operating Partnership, nor any of our directors or officers,will be liable or accountable in damages to our Operating Partnership, its limited partners or their assignees forerrors in judgment, mistakes of fact or law or for any act or omission if the general partner, director or officer,acted in good faith. In addition, our Operating Partnership is required to indemnify us, our affiliates and each ofour and their respective officers, directors, employees and agents to the fullest extent permitted by applicable lawagainst any and all losses, claims, damages, liabilities (whether joint or several), expenses (including, withoutlimitation, attorneys’ fees and other legal fees and expenses), judgments, fines, settlements and other amountsarising from any and all claims, demands, actions, suits or proceedings, civil, criminal, administrative orinvestigative, that relate to the operations of the Operating Partnership, provided that our Operating Partnershipwill not indemnify any such person for (1) willful misconduct or a knowing violation of the law, (2) any
- 40 -

transaction for which such person received an improper personal benefit in violation or breach of any provisionof the partnership agreement of our Operating Partnership, or (3) in the case of a criminal proceeding, the personhad reasonable cause to believe the act or omission was unlawful.
The provisions of Delaware law that allow the common law fiduciary duties of a general partner to bemodified by a partnership agreement have not been resolved in a court of law, and we have not obtained anopinion of counsel covering the provisions set forth in the partnership agreement of our Operating Partnershipthat purport to waive or restrict our fiduciary duties that would be in effect under common law were it not for thepartnership agreement of our Operating Partnership.
Certain provisions of Maryland law could inhibit changes in control.
Certain provisions of the MGCL may have the effect of deterring a third party from making a proposal toacquire us or of impeding a change in control under circumstances that otherwise could provide the holders ofour common stock with the opportunity to realize a premium over the then-prevailing market price of ourcommon stock. We are subject to the “business combination” provisions of the MGCL that, subject tolimitations, prohibit certain business combinations (including a merger, consolidation, statutory share exchange,or, in circumstances specified in the statute, an asset transfer or issuance or reclassification of equity securities)between us and an “interested stockholder” (defined generally as any person who beneficially owns 10% or moreof our then outstanding voting stock or an affiliate or associate of ours who, at any time within the two-yearperiod prior to the date in question, was the beneficial owner of 10% or more of our then outstanding votingstock) or an affiliate thereof for five years after the most recent date on which the stockholder becomes aninterested stockholder. After the five-year prohibition, any business combination between us and an interestedstockholder generally must be recommended by our board of directors and approved by the affirmative vote of atleast (1) 80% of the votes entitled to be cast by holders of outstanding shares of our voting stock and (2) twothirds of the votes entitled to be cast by holders of our voting stock other than shares held by the interestedstockholder with whom or with whose affiliate the business combination is to be effected or held by an affiliateor associate of the interested stockholder. These super-majority vote requirements do not apply if, among otherconditions, our common stockholders receive a minimum price, as defined under the MGCL, for their shares inthe form of cash or other consideration in the same form as previously paid by the interested stockholder for itsshares. These provisions of the MGCL do not apply, however, to business combinations that are approved orexempted by a board of directors prior to the time that the interested stockholder becomes an interestedstockholder. Our board of directors has by resolution exempted business combinations between us and (1) anyother person, provided, that such business combination is first approved by our board of directors (including amajority of our directors who are not affiliates or associates of such person), (2) the Predecessor and its affiliatesand associates as part of our formation transactions and (3) persons acting in concert with any of the foregoing.As a result, any person described in the preceding sentence may be able to enter into business combinations withus that may not be in the best interests of our stockholders, without compliance by our company with thesupermajority vote requirements and other provisions of the statute. There can be no assurance that our board ofdirectors will not amend or revoke the exemption at any time.
The “control share” provisions of the MGCL provide that, subject to certain exceptions, a holder of “controlshares” of a Maryland corporation (defined as shares which, when aggregated with all other shares controlled bythe stockholder (except solely by virtue of a revocable proxy), entitle the stockholder to exercise one of threeincreasing ranges of voting power in electing directors) acquired in a “control share acquisition” (defined as thedirect or indirect acquisition of ownership or control of issued and outstanding “control shares”) has no votingrights with respect to such shares except to the extent approved by our stockholders by the affirmative vote of atleast two thirds of all the votes entitled to be cast on the matter, excluding votes entitled to be cast by the acquirerof control shares, our officers and our directors who are also our employees. Our bylaws contain a provisionexempting from the control share acquisition statute any and all acquisitions by any person of shares of our stock.There can be no assurance that this provision will not be amended or eliminated at any time in the future.
- 41 -
The “unsolicited takeover” provisions of Title 3, Subtitle 8 of the MGCL permit our board of directors,without stockholder approval and regardless of what is currently provided in our charter or bylaws, to implementcertain takeover defenses, some of which (for example, a classified board) we do not yet have. Our chartercontains a provision whereby we have elected to be subject to the provisions of Title 3, Subtitle 8 of the MGCL,pursuant to which our board of directors has the exclusive power to fill vacancies on our board of directors.These provisions may have the effect of inhibiting a third party from making an acquisition proposal for us or ofdelaying, deferring or preventing a change in control of us under the circumstances that otherwise could providethe holders of shares of common stock with the opportunity to realize a premium over the then current marketprice.
Our authorized but unissued shares of common and preferred stock may prevent a change in our control.
Our charter permits our board of directors to authorize us to issue additional shares of our authorized butunissued common or preferred stock. In addition, our board of directors may, without common stockholderapproval, amend our charter to increase the aggregate number of our shares of stock or the number of shares ofstock of any class or series that we have the authority to issue and classify or reclassify any unissued shares ofcommon or preferred stock and set the terms of the classified or reclassified shares. As a result, our board ofdirectors may establish a series of common or preferred stock that could delay or prevent a transaction or achange in control that might involve a premium price for shares of our common stock or otherwise be in the bestinterest of our stockholders.
Our rights and the rights of our stockholders to take action against our directors and officers are limited,which could limit stockholder recourse in the event of actions not in our stockholders’ best interests.
Our charter eliminates the liability of our present and former directors and officers to us and ourstockholders for money damages to the maximum extent permitted under Maryland law. Under Maryland law,our present and former directors and officers will not have any liability to us or our stockholders for moneydamages other than liability resulting from:
• actual receipt of an improper benefit or profit in money, property or services; or
• active and deliberate dishonesty by the director or officer that was established by a final judgment andwas material to the cause of action adjudicated.
Our charter authorizes us to indemnify our directors and officers for actions taken by them in those andother capacities to the maximum extent permitted by Maryland law. Our bylaws require us to indemnify eachpresent and former director or officer, and each person who served any predecessor of our company, includingthe Predecessor, in a similar capacity, to the maximum extent permitted by Maryland law, in connection with thedefense of any proceeding to which he or she is made, or threatened to be made, a party or a witness by reason ofhis or her service to us or any predecessor. In addition, we may be obligated to pay or reimburse the expensesincurred by such persons in connection with any such proceedings without requiring a preliminary determinationof their ultimate entitlement to indemnification.
Our charter contains provisions that make removal of our directors difficult, which could make it difficultfor our stockholders to effect changes to our management.
Our charter provides that, subject to the rights of holders of any series of preferred stock, a director may beremoved with or without cause upon the affirmative vote of holders of at least two thirds of the votes entitled tobe cast generally in the election of directors. Vacancies may be filled only by a majority of the remainingdirectors in office, even if less than a quorum. These requirements make it more difficult to change ourmanagement by removing and replacing directors and may prevent a change in control of our company that is inthe best interests of our stockholders.
- 42 -

Ownership limitations may restrict change of control or business combination opportunities in which ourstockholders might receive a premium for their shares.
In order for us to qualify as a REIT for each taxable year after 2013, no more than 50% in value of ouroutstanding capital stock may be owned, directly or constructively, by five or fewer individuals during the lasthalf of any calendar year, and at least 100 persons must beneficially own our stock during at least 335 days of ataxable year of 12 months, or during a proportionate portion of a shorter taxable year. “Individuals” for thispurpose include natural persons, private foundations, some employee benefit plans and trusts, and somecharitable trusts. To assist us in preserving our REIT qualification, among other purposes, our charter generallyprohibits any person from directly or indirectly owning more than 9.8% in value or in number of shares,whichever is more restrictive, of the aggregate outstanding shares of our capital stock, the outstanding shares ofany class or series of our preferred stock or the outstanding shares of our common stock. These ownership limitscould have the effect of discouraging a takeover or other transaction in which holders of our common stockmight receive a premium for their shares over the then prevailing market price or which holders might believe tobe otherwise in their best interests. Our board of directors has established exceptions from these ownership limitsthat permit certain institutional investors and their clients to hold shares of our common stock in excess of theseownership limits.
We are subject to financial reporting and other requirements for our accounting, internal audit and othermanagement systems and resources and the failure to comply with such requirements may adversely effectour business, operating results and stock price.
We are subject to reporting and other obligations under the Exchange Act, including the requirements ofSection 404 of the Sarbanes-Oxley Act of 2002 (the “Sarbanes-Oxley Act”). Section 404 requires annualmanagement assessments of the effectiveness of our internal controls over financial reporting and, after we areno longer an “Emerging Growth Company” for purposes of the Jumpstart Our Business Startups Act (the“JOBS Act”), our independent registered public accounting firm to express an opinion on the effectiveness ofour internal controls over financial reporting. To the extent applicable, these reporting and other obligationsplace or will place significant demands on our management, administrative, operational, internal audit andaccounting resources and will cause us to incur significant expenses. We may need to upgrade our systems orcreate new systems; implement additional financial and management controls, reporting systems andprocedures; expand or outsource our internal audit function; and hire additional accounting, internal audit andfinance staff. If we are unable to accomplish these objectives in a timely and effective fashion, our ability tocomply with the financial reporting requirements and other rules that apply to reporting companies could beimpaired. We believe that we have in place, or will have in place at the end of any applicable phase-in periodspermitted by the NYSE, the SEC and the JOBS Act, accounting, internal audit and other management systemsand resources that will allow us to maintain compliance with the requirements of the Sarbanes-Oxley Act. Anyfailure to maintain effective internal controls could have a material adverse effect on our business, operatingresults and stock price.
Pursuant to the JOBS Act, we are eligible to take advantage of certain specified reduced disclosure andother requirements that are otherwise generally applicable to public companies for so long as we are an“emerging growth company.”
We are an “emerging growth company” as defined in the JOBS Act and we are eligible to take advantage ofcertain specified reduced disclosure and other requirements that are otherwise generally applicable to publiccompanies that are not “emerging growth companies” including, but not limited to, not being required to complywith the auditor attestation requirements of Section 404 of the Sarbanes-Oxley Act, reduced disclosureobligations regarding executive compensation in our periodic reports and proxy statements, and exemptions fromthe requirements of holding a nonbinding advisory vote on executive compensation and stockholder approval ofany golden parachute payments not previously approved. We may take advantage of these exemptions for up tofive years or such earlier time that we are no longer an “emerging growth company.” We would cease to be an
- 43 -

“emerging growth company” if we have more than $1 billion in annual gross revenues, we have more than $700million in market value of our stock held by non-affiliates, or we issue more than $1 billion of non-convertibledebt over a three-year period. If we do take advantage of any or all of these exceptions, we cannot predict if someinvestors will find our common stock less attractive because we will rely on these exemptions. The result may bea less active trading market for our common stock and our stock price may be more volatile.
Risks Related to Our Taxation as a REIT
Qualifying as a REIT involves highly technical and complex provisions of the Internal Revenue Code, andour failure to qualify or remain qualified as a REIT would subject us to U.S. federal income tax andapplicable state and local tax, which would negatively impact the results of our operations and reduce theamount of cash available for distribution to our stockholders.
We elected and qualified as a REIT for U.S. federal income tax purposes commencing with our taxable yearended December 31, 2013. The U.S. federal income tax laws governing REITs are complex, and judicial andadministrative interpretations of the U.S. federal income tax laws governing REIT qualification are limited. Toqualify as a REIT and remain so qualified, we must meet, on an ongoing basis through actual operating results,various tests regarding the nature and diversification of our assets and our income, the ownership of ouroutstanding shares, and the amount of our distributions. Even a technical or inadvertent violation couldjeopardize our REIT qualification. Our ability to satisfy the asset tests depends upon our analysis of thecharacterization and fair market values of our assets, some of which are not susceptible to a precisedetermination, and for which we will not obtain independent appraisals.
We intend to continue to treat a substantial portion of our existing assets and any similar assets that we mayin the future have an interest in as qualifying real estate assets for purposes of the REIT asset tests, and intend tocontinue to treat the income derived from such assets as interest income qualifying under the 75% gross incometest. We received a private letter ruling from the Internal Revenue Service (“IRS”) relating to our ability to treatcertain of our assets as qualifying REIT assets to the extent they fall within the scope of such private letter ruling.We are entitled to rely upon this ruling for those assets which fit within the scope of the ruling only to the extentthat we have the legal and contractual rights described therein and did not misstate or omit in the ruling request arelevant fact and that we continue to operate in the future in accordance with the relevant facts described in suchrequest, and no assurance can be given that we will always be able to do so.
If we were not able to treat the interest income that we receive as qualifying income for purposes of theREIT gross income tests, we would be required to restructure the manner in which we receive such income andwe may realize significant income that does not qualify for the REIT 75% gross income test, which could causeus to fail to qualify as a REIT. In addition, our compliance with the REIT income and quarterly assetrequirements also depends upon our ability to successfully manage the composition of our income and assets onan ongoing basis in accordance with existing REIT regulations and rules and interpretations thereof. Moreover,the IRS, new legislation, court decisions or other administrative guidance, in each case possibly with retroactiveeffect, may make it more difficult or impossible for us to qualify as a REIT.
In addition, our ability to satisfy the requirements to qualify as a REIT depends in part on the actions ofthird parties over which we have no control or only limited influence, including in cases where we own an equityinterest in an entity that is classified as a partnership for U.S. federal income tax purposes. Thus, while we intendto operate so that we will qualify as a REIT, given the highly complex nature of the rules governing REITs, theongoing importance of factual determinations, and the possibility of future changes in our circumstances, noassurance can be given that we will so qualify for any particular year.
If we fail to qualify as a REIT in any taxable year, and we do not qualify for certain statutory reliefprovisions, we would be required to pay U.S. federal income tax on our taxable income, and distributions to our
- 44 -
stockholders would not be deductible by us in determining our taxable income. In such a case, we might need toborrow money or sell assets in order to pay our taxes. Our payment of income tax would negatively impact theresults of our operations and decrease the amount of our income available for distribution to our stockholders.Furthermore, if we fail to maintain our qualification as a REIT, we no longer would be required to distributesubstantially all of our taxable income to our stockholders. In addition, unless we were eligible for certainstatutory relief provisions, we could not re-elect to qualify as a REIT for the subsequent four taxable yearsfollowing the year in which we failed to qualify.
Complying with REIT requirements may force us to liquidate or forego otherwise attractiveinvestments.
To qualify as a REIT, we must ensure that we meet the REIT gross income tests annually and that, at theend of each calendar quarter, at least 75% of the value of our total assets consists of cash, cash items, governmentsecurities, shares in REITs and other qualifying real estate assets. The remainder of our investment in securities(other than government securities and REIT qualified real estate assets) generally cannot include more than 10%of the outstanding voting securities of any one issuer or more than 10% of the total value of the outstandingsecurities of any one issuer. In addition, in general, no more than 5% of the value of our total assets (other thangovernment securities, securities of a TRS and securities that are qualifying real estate assets) can consist of thesecurities of any one issuer, and no more than 25% (20% beginning with the taxable year ending December 31,2018) of the value of our total assets can be represented by securities of one or more TRSs, and no more than25% of the value of our assets can consist of debt instruments issued by publicly offered REITs that are nototherwise secured by real property. If we fail to comply with these requirements at the end of any calendarquarter, we must correct the failure within 30 days after the end of the calendar quarter or qualify for certainstatutory relief provisions to avoid losing our REIT qualification and suffering adverse tax consequences. As aresult, we may be required to liquidate from our portfolio, or contribute to a TRS, otherwise attractiveinvestments, and may be unable to pursue investments that would be otherwise advantageous to us in order tosatisfy the source of income or asset diversification requirements for qualifying as a REIT. These actions couldhave the effect of reducing our income and amounts available for distribution to our stockholders.
REIT distribution requirements could adversely affect our ability to execute our business plan and mayrequire us to incur debt or sell assets to make such distributions.
In order to qualify as a REIT, we must distribute to our stockholders, each calendar year, at least 90% of ourREIT taxable income (including certain items of non-cash income), determined without regard to the deductionfor dividends paid and excluding net capital gain. To the extent that we satisfy the 90% distribution requirement,but distribute less than 100% of our taxable income, we will be subject to U.S. federal corporate income tax onour undistributed income. In addition, we will incur a 4% non-deductible excise tax on the amount, if any, bywhich our distributions in any calendar year are less than a minimum amount specified under U.S. federalincome tax laws. We intend to distribute our taxable income to our stockholders in a manner intended to satisfythe REIT 90% distribution requirement and to avoid the 4% non-deductible excise tax.
In addition, differences in timing between the recognition of taxable income, our U.S. GAAP income andthe actual receipt of cash may occur. For example, we may be required to accrue interest and discount income ondebt securities or interests in debt securities before we receive any payments of interest or principal on suchassets, and there may be timing differences in the accrual of such interest and discount income for tax purposesand for U.S. GAAP purposes.
As a result of the foregoing, we may generate less cash flow than taxable income in a particular year andfind it difficult or impossible to meet the REIT distribution requirements in certain circumstances. In suchcircumstances, we may be required to: (i) sell assets in adverse market conditions, (ii) borrow on unfavorableterms, (iii) distribute amounts that would otherwise be invested in future acquisitions, capital expenditures orrepayment of debt, (iv) make a taxable distribution of our shares as part of a distribution in which stockholders
- 45 -

may elect to receive shares or (subject to a limit measured as a percentage of the total distribution) cash or (v) usecash reserves, in order to comply with the REIT distribution requirements and to avoid U.S. federal corporateincome tax and the 4% non-deductible excise tax. Thus, compliance with the REIT distribution requirements mayhinder our ability to grow, which could adversely affect the value of our common stock.
Even if we qualify as a REIT, we may face tax liabilities that reduce our cash flow.
Even if we qualify for taxation as a REIT, we may be subject to certain U.S. federal, state and local taxes onour income and assets, including taxes on any undistributed income, tax on income from some activitiesconducted as a result of a foreclosure, and state or local income, franchise, property and transfer taxes, includingmortgage recording taxes. In addition, any TRSs we own will be subject to U.S. federal, state and local corporateincome or franchise taxes. In order to meet the REIT qualification requirements, or to avoid the imposition of a100% tax that applies to certain gains derived by a REIT from sales of inventory or property held primarily forsale to customers in the ordinary course of business, we may hold some of our assets through TRSs. Any taxespaid by such TRSs would decrease the cash available for distribution to our stockholders.
The failure of assets subject to a repurchase agreement to be considered owned by us or a mezzanine loanto qualify as a real estate asset may adversely affect our ability to qualify as a REIT.
We may enter into repurchase agreements under which we will nominally sell certain of our assets to acounterparty and simultaneously enter into an agreement to repurchase the sold assets. We believe that we will betreated for U.S. federal income tax purposes as the owner of the assets that are the subject of any suchagreements and that the repurchase agreements will be treated as secured lending transactions notwithstandingthat such agreements may transfer record ownership of the assets to the counterparty during the term of theagreement. It is possible, however, that the IRS could assert that we did not own the assets during the term of therepurchase agreement, in which case we could fail to qualify as a REIT.
In addition, we may acquire mezzanine loans, which are loans secured by equity interests in a partnershipor limited liability company that directly or indirectly owns real property. In IRS Revenue Procedure 2003-65,the IRS provided a safe harbor pursuant to which a mezzanine loan, if it meets each of the requirementscontained in the Revenue Procedure, will be treated by the IRS as a real estate asset for purposes of the REITasset tests, and interest derived from the mezzanine loan will be treated as qualifying mortgage interest forpurposes of the REIT 75% gross income test. Although IRS Revenue Procedure 2003-65 provides a safe harboron which taxpayers may rely, it does not prescribe rules of substantive tax law. We may acquire mezzanineloans that may not meet all of the requirements for reliance on this safe harbor. In the event we own amezzanine loan that does not meet the safe harbor, the IRS could challenge such loan’s treatment as a real estateasset for purposes of the REIT asset and income tests, and if such a challenge were sustained, we could fail toqualify as a REIT.
We may be required to report taxable income for certain investments in excess of the economic income weultimately realize from them.
To the extent we acquire debt instruments in the secondary market for less than their face amount, theamount of such discount will generally be treated as “market discount” for U.S. federal income tax purposes. Weexpect to accrue market discount on the basis of a constant yield to maturity of a debt instrument. Accruedmarket discount is reported as income when, and to the extent that, any payment of principal of the debtinstrument is made, unless we elect to include accrued market discount in income as it accrues. Principalpayments on certain loans are made monthly, and consequently accrued market discount may have to be includedin income each month as if the debt instrument were assured of ultimately being collected in full. If we collectless on the debt instrument than our purchase price plus the market discount we had previously reported asincome, we may not be able to benefit from any offsetting loss deductions.
- 46 -

Similarly, some of the debt instruments that we acquire may have been issued with original issue discount.We will be required to report such original issue discount based on a constant yield method and will be taxedbased on the assumption that all future projected payments due on such debt instruments will be made. If suchdebt instruments turn out not to be fully collectible, an offsetting loss deduction will become available only in thelater year that uncollectability is provable. In addition, in the event that any debt instruments acquired by us aredelinquent as to mandatory principal and interest payments, or in the event payments with respect to a particulardebt instrument are not made when due, we may nonetheless be required to continue to recognize the unpaidinterest as taxable income as it accrues, despite doubt as to its ultimate collectability. While we would in generalultimately have an offsetting loss deduction available to us when such interest was determined to beuncollectible, the utility of that deduction could depend on our having taxable income in that later year orthereafter. Although we do not presently intend to, we may, in the future, acquire debt investments that aresubsequently modified by agreement with the borrower. If such amendments are “significant modifications”under the applicable Treasury Regulations, we may be required to recognize taxable income as a result of suchamendments. Finally, we may be required under the terms of indebtedness that we incur with private lenders touse cash received from interest payments to make principal payments on that indebtedness, with the effect ofrecognizing income but not having a corresponding amount of cash available for distribution to our stockholders.
The interest apportionment rules under Treasury Regulation Section 1.856-5(c) provide that, if a loan issecured by both real property and other property, a REIT is required to apportion its annual interest income to thereal property securing the loan based on a fraction, the numerator of which is the value of such real property,determined when the REIT commits to acquire the loan, and the denominator of which is the highest “principalamount” of the loan during the year. Beginning in 2016, if a mortgage loan is secured by both real property andpersonal property and the value of the personal property does not exceed 15% of the aggregate value of theproperty securing the mortgage loan, the mortgage loan is treated as secured solely by real property for thispurpose. IRS Revenue Procedure 2014-51 interprets the “principal amount” of the loan to be the face amount ofthe loan, despite the Internal Revenue Code requiring taxpayers to treat any market discount, that is thedifference between the purchase price of the loan and its face amount, for all purposes (other than certainwithholding and information reporting purposes) as interest rather than principal. The interest apportionmentregulations apply only if the loan in question is secured by both real property and other property and, beginningin 2016, the value of personal property securing the mortgage exceeds 15% of the aggregate value of the propertysecuring the mortgage.
If the IRS were to assert successfully that our loans were secured by property other than real estate, theinterest apportionment rules applied for purposes of our REIT testing, and that the position taken in IRS RevenueProcedure 2014-51 should be applied to certain loans in our portfolio, then depending upon the value of the realproperty securing our loans and their face amount, and the sources of our gross income generally, we may fail tomeet the 75% REIT gross income test. If we do not meet this test, we could potentially lose our REITqualification or be required to pay a penalty to the IRS.
The “taxable mortgage pool” rules may increase the taxes that we or our stockholders may incur, and maylimit the manner in which we effect future securitizations.
Securitizations by us or our subsidiaries could result in the creation of taxable mortgage pools for U.S.federal income tax purposes. As a result, we could have “excess inclusion income.” Certain categories ofstockholders, such as non-U.S. stockholders eligible for treaty or other benefits, U.S. stockholders with netoperating losses, and certain U.S. tax-exempt stockholders that are subject to unrelated business income tax,could be subject to increased taxes on a portion of their dividend income from us that is attributable to any suchexcess inclusion income. In the case of a stockholder that is a REIT, a regulated investment company (a “RIC”)common trust fund or other pass-through entity, our allocable share of our excess inclusion income could beconsidered excess inclusion income of such entity. In addition, to the extent that our common stock is owned byU.S. tax-exempt “disqualified organizations,” such as certain government-related entities and charitableremainder trusts that are not subject to tax on unrelated business income, we may incur a corporate level tax on a
- 47 -

portion of any excess inclusion income. Because this tax generally would be imposed on us, all of ourstockholders, including stockholders that are not disqualified organizations, generally will bear a portion of thetax cost associated with the classification of us or a portion of our assets as a taxable mortgage pool. A RIC, orother pass-through entity owning our common stock in record name will be subject to tax at the highest U.S.federal corporate tax rate on any excess inclusion income allocated to their owners that are disqualifiedorganizations. Moreover, we could face limitations in selling equity interests in these securitizations to outsideinvestors, or selling any debt securities issued in connection with these securitizations that might be considered tobe equity interests for tax purposes. Finally, if we were to fail to qualify as a REIT, any taxable mortgage poolsecuritizations would be treated as separate taxable corporations for U.S. federal income tax purposes that couldnot be included in any consolidated U.S. federal corporate income tax return. These limitations may prevent usfrom using certain techniques to maximize our returns from securitization transactions.
Although our use of TRSs may be able to partially mitigate the impact of meeting the requirementsnecessary to maintain our qualification as a REIT, our ownership of and relationship with our TRSs islimited and a failure to comply with the limits would jeopardize our REIT qualification and may result inthe application of a 100% excise tax.
A REIT may own up to 100% of the stock of one or more TRSs. Subject to certain exceptions, a TRS mayhold assets and earn income that would not be qualifying assets or income if held or earned directly by a REIT.Both the subsidiary and the REIT must jointly elect to treat the subsidiary as a TRS. A corporation of which aTRS directly or indirectly owns more than 35% of the voting power or value of the stock will automatically betreated as a TRS. Overall, no more than 25% (20% beginning with the taxable year ending December 31, 2018)of the value of a REIT’s total assets may consist of stock or securities of one or more TRSs. In addition, the TRSrules limit the deductibility of interest paid or accrued by a TRS to its parent REIT to assure that the TRS issubject to an appropriate level of corporate taxation. The rules also impose a 100% excise tax on certaintransactions between a TRS and its parent REIT that are not conducted on an arm’s-length basis. Our TRSs willpay U.S. federal, state and local income or franchise tax on their taxable income, and their after-tax net incomewill be available for distribution to us but will not be required to be distributed to us, unless necessary tomaintain our REIT qualification. While we will be monitoring the aggregate value of the securities of our TRSsand intend to conduct our affairs so that such securities will represent less than 25% (or 20% beginningJanuary 1, 2018) of the value of our total assets, there can be no assurance that we will be able to comply with theTRS limitation in all market conditions.
Dividends payable by REITs generally do not qualify for the reduced tax rates on dividend income fromregular corporations, which could adversely affect the value of our shares.
The maximum U.S. federal income tax rate for certain qualified dividends payable to U.S. stockholders thatare individuals, trusts and estates is 20%. Dividends payable by REITs are generally not eligible for the reducedrates and therefore may be subject to a 39.6% maximum U.S. federal income tax rate on ordinary income.Although the reduced U.S. federal income tax rate applicable to dividend income from regular corporatedividends does not adversely affect the taxation of REITs or dividends paid by REITs, the more favorable ratesapplicable to regular corporate dividends could cause investors who are individuals, trusts and estates to perceiveinvestments in REITs to be relatively less attractive than investments in the stocks of non-REIT corporations thatpay dividends, which could adversely affect the value of the shares of REITs, including shares of our commonstock.
The tax on prohibited transactions limits our ability to engage in transactions, including certain methodsof securitizing loans, which would be treated as sales for U.S. federal income tax purposes.
A REIT’s net income from prohibited transactions is subject to a 100% tax. In general, prohibitedtransactions are sales or other dispositions of property, other than foreclosure property, but including loans, heldas inventory or primarily for sale to customers in the ordinary course of business. We might be subject to this tax
- 48 -
if we were to sell or securitize loans in a manner that was treated as a sale of the loans as inventory for U.S.federal income tax purposes. Therefore, in order to avoid the prohibited transactions tax, we may choose not toengage in certain sales of loans, other than through a TRS, and we may be required to limit the structures we usefor our securitization transactions, even though such sales or structures might otherwise be beneficial for us.
Complying with REIT requirements may limit our ability to hedge effectively.
The REIT provisions of the Internal Revenue Code may limit our ability to hedge our assets and operations.Under these provisions, any income that we generate from transactions intended to hedge our interest rateexposure will be excluded from gross income for purposes of the REIT 75% and 95% gross income tests if (i) theinstrument (A) hedges interest rate risk on liabilities used to carry or acquire real estate assets or certain otherspecified types of risk, or (B) hedges an instrument described in clause (A) for a period following theextinguishment of the liability or the disposition of the asset that was previously hedged by the hedgedinstrument, and (ii) such instrument is properly identified under applicable Treasury Regulations. Income fromhedging transactions that do not meet these requirements will generally constitute non-qualifying income forpurposes of both the REIT 75% and 95% gross income tests. As a result of these rules, we may have to limit ouruse of hedging techniques that might otherwise be advantageous or implement those hedges through a TRS. Thiscould increase the cost of our hedging activities because our TRS would be subject to tax on gains or the limitson our use of hedging techniques could expose us to greater risks associated with changes in interest rates thanwe would otherwise want to bear. In addition, losses in our TRS will generally not provide any tax benefit to us,although such losses may be carried forward to offset future taxable income of the TRS.
We may be subject to adverse legislative or regulatory tax changes that could reduce the market price ofshares of our common stock.
At any time, the U.S. federal income tax laws or regulations governing REITs or the administrativeinterpretations of those laws or regulations may be changed, possibly with retroactive effect. SeeItem 7. “Management Discussion and Analysis of Financial Condition and Operating Results—Factors Impactingour Operating Results—Recent U.S. Federal Income Tax Legislation” for recently adopted REIT legislation. Wecannot predict if or when any new U.S. federal income tax law, regulation or administrative interpretation, or anyamendment to any existing U.S. federal income tax law, regulation or administrative interpretation, will beadopted, promulgated or become effective or whether any such law, regulation or interpretation may take effectretroactively. We and our stockholders could be adversely affected by any such change in, or any new, U.S.federal income tax law, regulation or administrative interpretation.
On May 14, 2014, the U.S. Department of the Treasury published proposed regulations which, if adopted inthe form proposed, would revise the definition of “real property” for purposes of the REIT income and assettests. The proposed regulations are not yet in effect, and, depending upon whether and in what form they areactually adopted and how if adopted they are interpreted, may affect the classification of certain of our assetsunder these tests, and thus could require us to alter our mix of assets, adjust our approach to qualifying as a REITor adjust our business strategy. The proposed regulations are proposed to be effective for calendar quartersbeginning after they are published in final form. The Treasury has not indicated whether or when the proposedregulations will be finalized.
Liquidation of our assets may jeopardize our REIT qualification.
To qualify as a REIT, we must comply with requirements regarding our assets and our sources of income. Ifwe are compelled to liquidate our assets to repay obligations to our lenders, we may be unable to comply withthese requirements, thereby jeopardizing our qualification as a REIT, or we may be subject to a 100% tax on anyresultant gain if we sell assets that are treated as inventory or property held primarily for sale to customers in theordinary course of business.
- 49 -

Your investment has various U.S. federal income tax risks.
We urge you to consult your tax advisor concerning the effects of U.S. federal, state, local and foreign taxlaws to you with regard to an investment in shares of our common stock.
Item 1B. Unresolved Staff Comments.
None.
Item 2. Properties.
Our principal executive offices are located at 1906 Towne Centre Blvd, Suite 370, Annapolis, Maryland21401. Our telephone number is (410) 571-9860.
Item 3. Legal Proceedings.
From time to time, we may be involved in various claims and legal actions in the ordinary course ofbusiness. As of December 31, 2015, we are not currently subject to any legal proceedings that are likely to have amaterial adverse effect on our financial position, results of operations or cash flows.
Item 4. Mine Safety Disclosures.
Not applicable.
- 50 -

PART II
Item 5. Market for Registrant’s Common Equity, Related Stockholder Matters and Issuer Purchases ofEquity Securities.
Market Information
Our common stock began trading on the NYSE on April 18, 2013 under the symbol “HASI.” Prior to thattime, there was no public trading market for our common stock. On February 26, 2016, the last sales price for ourcommon stock on the NYSE was $17.49 per share. The following table presents the high and low sales prices pershare of our common stock during each calendar quarter since it commenced trading on the NYSE on April 18,2013 until December 31, 2015:
2015: High Low Dividends
October 1, 2015 through December 31, 2015 $19.58 $15.46 $0.30July 1, 2015 through September 30, 2015 21.52 16.32 0.26April 1, 2015 through June 30, 2015 21.32 18.00 0.26January 1, 2015 through March 31, 2015 19.15 13.61 0.26
2014: High Low Dividends
October 1, 2014 through December 31, 2014 $14.48 $13.07 $0.26July 1, 2014 through September 30, 2014 14.87 13.28 0.22April 1, 2014 through June 30, 2014 14.88 12.91 0.22January 1, 2014 through March 31, 2014 15.11 12.61 0.22
2013: High Low Dividends
October 1, 2013 through December 31, 2013 $14.15 $11.03 $0.36July 1, 2013 through September 30, 2013 12.51 11.05 0.06April 18, 2013 through June 30, 2013 12.51 9.15 —
Holders
As of February 26, 2016, we had 125 registered holders of our common stock. The 125 holders of recorddoes not include the beneficial owners of our common stock whose shares are held by a broker or bank. Suchinformation was obtained from The Depository Trust Company.
Dividends
We intend to make regular quarterly distributions to holders of our common stock. U.S. federal income taxlaw generally requires that a REIT distribute annually at least 90% of its REIT taxable income, without regard tothe deduction for dividends paid and excluding net capital gains, and that it pay tax at regular corporate rates tothe extent that it annually distributes less than 100% of its REIT taxable income. Our current policy is to payquarterly distributions, which on an annual basis will equal all or substantially all of our taxable income. Anydistributions we make will be at the discretion of our board of directors and will depend upon, among otherthings, our actual results of operations. These results and our ability to pay distributions will be affected byvarious factors, including the net interest and other income from our portfolio, our operating expenses and anyother expenditures. See Item 1A, “Risk Factors,” and Item 7, “Management’s Discussion and Analysis ofFinancial Conditions and Results of Operations,” of this Form 10-K, for information regarding the sources offunds used for dividends and for a discussion of factors, if any, which may adversely affect our ability to paydividends. See Note 11 of the audited financial statements in this Form 10-K for details of our dividends declaredin 2014 and 2015.
- 51 -

Stockholder Return Performance
The stock performance graph and table below shall not be deemed, under the Securities Act or the ExchangeAct, to be (i) “soliciting material” or “filed” or (ii) incorporated by reference by any general statement into anyfiling made by us with the SEC, except to the extent that we specifically incorporate such stock performancegraph and table by reference.
The following graph is a comparison of the cumulative total stockholder return on our shares of commonstock, the Standard & Poor’s 500 Index (the “S&P 500 Index”), and the SNL Finance REIT Index and the DowJones Utility Average which are peer group indexes from April 18, 2013 (our first day of trading on the NYSE)to December 31, 2015. The graph assumes that $100 was invested at closing on April 18, 2013 in our shares ofcommon stock, the S&P 500 Index, and the peer group indexes and that all dividends were reinvested without thepayment of any commissions. There can be no assurance that the performance of our common stock willcontinue in line with the same or similar trends depicted in the graph below.
$200
$140$150$160$170$180$190
$130$120$110$100
$90$80$70
4/18/2013
Comparison of Cumulative Total Return(HASI, S&P 500 Index, SNL Finance REIT and Dow Jones Utility Average)
12/31/201512/31/201412/31/2013
HASI S&P 500 SNL Finance REIT Dow Jones Utility Average
Index 04/18/13 12/31/13 12/31/14 12/31/15
Hannon Armstrong Sustainable Infrastructure Capital, Inc. $100.00 $126.51 $137.59 $193.74S&P 500 Index $100.00 $121.73 $138.39 $140.31SNL Finance REIT Index (1) $100.00 $ 84.25 $ 96.48 $ 88.47Dow Jones Utility Average $100.00 $ 96.99 $126.71 $122.83
Source: SNL Financial LC, Charlottesville, VA© 2015(1) As of December 31, 2015, the SNL Finance REIT Index comprised of the following companies: AG
Mortgage Investment Trust, Inc.; American Capital Agency Corp.; American Capital Mortgage InvestmentCorp.; American Church Mortgage Company; Annaly Capital Management, Inc.; Anworth Mortgage AssetCorporation; Apollo Commercial Real Estate Finance, Inc.; Apollo Residential Mortgage, Inc.; ArborRealty Trust, Inc.; Ares Commercial Real Estate Corporation; ARMOUR Residential REIT, Inc.; BiminiCapital Management, Inc.; Blackstone Mortgage Trust, Inc.; Capstead Mortgage Corporation; Cherry HillMortgage Investment Corporation; Chimera Investment Corporation; Colony Capital, Inc.; CV Holdings,
- 52 -
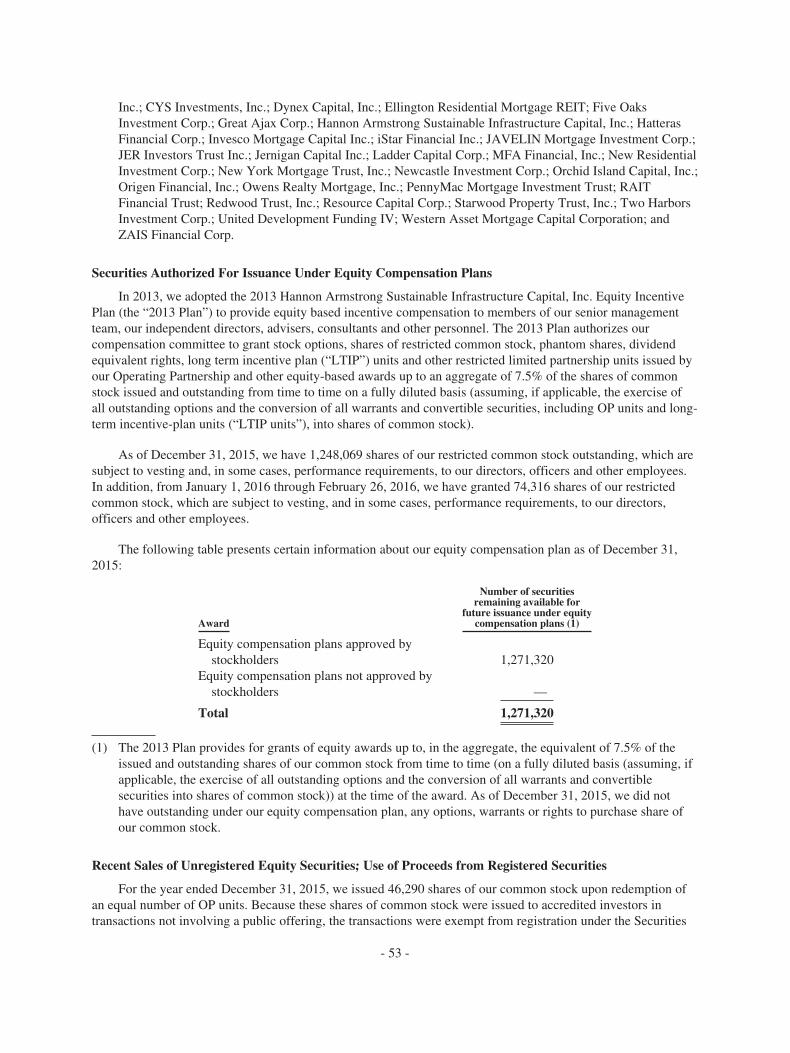
Inc.; CYS Investments, Inc.; Dynex Capital, Inc.; Ellington Residential Mortgage REIT; Five OaksInvestment Corp.; Great Ajax Corp.; Hannon Armstrong Sustainable Infrastructure Capital, Inc.; HatterasFinancial Corp.; Invesco Mortgage Capital Inc.; iStar Financial Inc.; JAVELIN Mortgage Investment Corp.;JER Investors Trust Inc.; Jernigan Capital Inc.; Ladder Capital Corp.; MFA Financial, Inc.; New ResidentialInvestment Corp.; New York Mortgage Trust, Inc.; Newcastle Investment Corp.; Orchid Island Capital, Inc.;Origen Financial, Inc.; Owens Realty Mortgage, Inc.; PennyMac Mortgage Investment Trust; RAITFinancial Trust; Redwood Trust, Inc.; Resource Capital Corp.; Starwood Property Trust, Inc.; Two HarborsInvestment Corp.; United Development Funding IV; Western Asset Mortgage Capital Corporation; andZAIS Financial Corp.
Securities Authorized For Issuance Under Equity Compensation Plans
In 2013, we adopted the 2013 Hannon Armstrong Sustainable Infrastructure Capital, Inc. Equity IncentivePlan (the “2013 Plan”) to provide equity based incentive compensation to members of our senior managementteam, our independent directors, advisers, consultants and other personnel. The 2013 Plan authorizes ourcompensation committee to grant stock options, shares of restricted common stock, phantom shares, dividendequivalent rights, long term incentive plan (“LTIP”) units and other restricted limited partnership units issued byour Operating Partnership and other equity-based awards up to an aggregate of 7.5% of the shares of commonstock issued and outstanding from time to time on a fully diluted basis (assuming, if applicable, the exercise ofall outstanding options and the conversion of all warrants and convertible securities, including OP units and long-term incentive-plan units (“LTIP units”), into shares of common stock).
As of December 31, 2015, we have 1,248,069 shares of our restricted common stock outstanding, which aresubject to vesting and, in some cases, performance requirements, to our directors, officers and other employees.In addition, from January 1, 2016 through February 26, 2016, we have granted 74,316 shares of our restrictedcommon stock, which are subject to vesting, and in some cases, performance requirements, to our directors,officers and other employees.
The following table presents certain information about our equity compensation plan as of December 31,2015:
Award
Number of securitiesremaining available for
future issuance under equitycompensation plans (1)
Equity compensation plans approved bystockholders 1,271,320
Equity compensation plans not approved bystockholders —
Total 1,271,320
(1) The 2013 Plan provides for grants of equity awards up to, in the aggregate, the equivalent of 7.5% of theissued and outstanding shares of our common stock from time to time (on a fully diluted basis (assuming, ifapplicable, the exercise of all outstanding options and the conversion of all warrants and convertiblesecurities into shares of common stock)) at the time of the award. As of December 31, 2015, we did nothave outstanding under our equity compensation plan, any options, warrants or rights to purchase share ofour common stock.
Recent Sales of Unregistered Equity Securities; Use of Proceeds from Registered Securities
For the year ended December 31, 2015, we issued 46,290 shares of our common stock upon redemption ofan equal number of OP units. Because these shares of common stock were issued to accredited investors intransactions not involving a public offering, the transactions were exempt from registration under the Securities
- 53 -
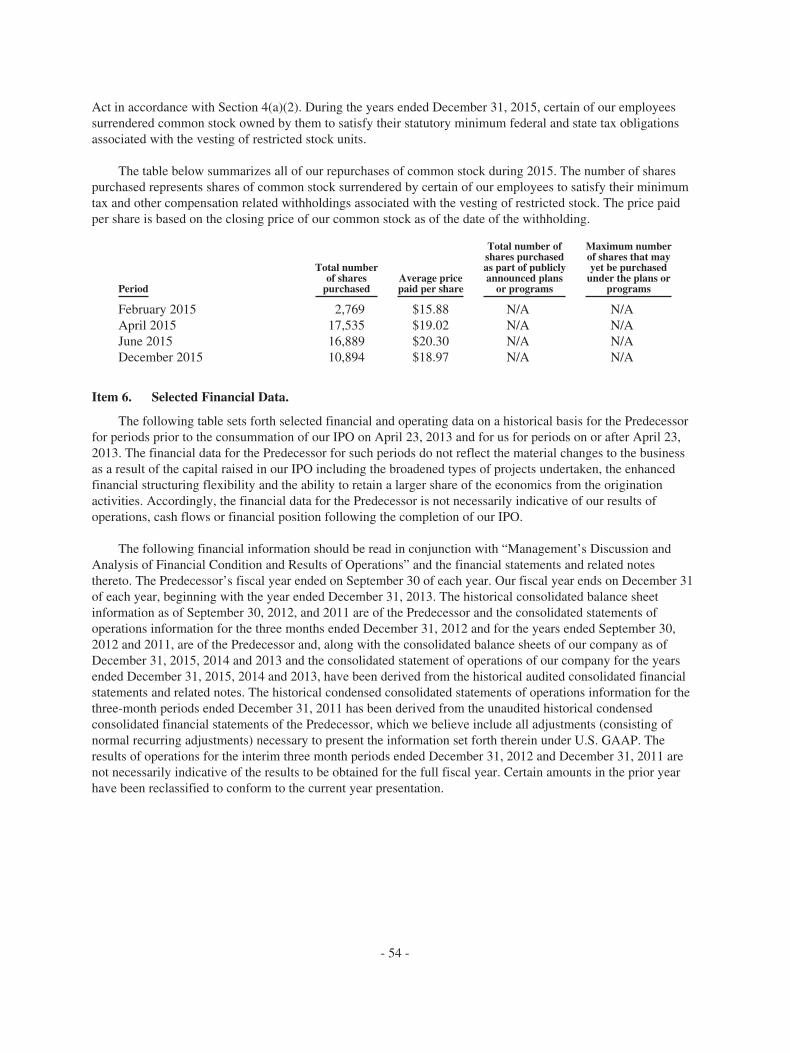
Act in accordance with Section 4(a)(2). During the years ended December 31, 2015, certain of our employeessurrendered common stock owned by them to satisfy their statutory minimum federal and state tax obligationsassociated with the vesting of restricted stock units.
The table below summarizes all of our repurchases of common stock during 2015. The number of sharespurchased represents shares of common stock surrendered by certain of our employees to satisfy their minimumtax and other compensation related withholdings associated with the vesting of restricted stock. The price paidper share is based on the closing price of our common stock as of the date of the withholding.
Period
Total numberof shares
purchasedAverage pricepaid per share
Total number ofshares purchasedas part of publiclyannounced plans
or programs
Maximum numberof shares that mayyet be purchased
under the plans orprograms
February 2015 2,769 $15.88 N/A N/AApril 2015 17,535 $19.02 N/A N/AJune 2015 16,889 $20.30 N/A N/ADecember 2015 10,894 $18.97 N/A N/A
Item 6. Selected Financial Data.
The following table sets forth selected financial and operating data on a historical basis for the Predecessorfor periods prior to the consummation of our IPO on April 23, 2013 and for us for periods on or after April 23,2013. The financial data for the Predecessor for such periods do not reflect the material changes to the businessas a result of the capital raised in our IPO including the broadened types of projects undertaken, the enhancedfinancial structuring flexibility and the ability to retain a larger share of the economics from the originationactivities. Accordingly, the financial data for the Predecessor is not necessarily indicative of our results ofoperations, cash flows or financial position following the completion of our IPO.
The following financial information should be read in conjunction with “Management’s Discussion andAnalysis of Financial Condition and Results of Operations” and the financial statements and related notesthereto. The Predecessor’s fiscal year ended on September 30 of each year. Our fiscal year ends on December 31of each year, beginning with the year ended December 31, 2013. The historical consolidated balance sheetinformation as of September 30, 2012, and 2011 are of the Predecessor and the consolidated statements ofoperations information for the three months ended December 31, 2012 and for the years ended September 30,2012 and 2011, are of the Predecessor and, along with the consolidated balance sheets of our company as ofDecember 31, 2015, 2014 and 2013 and the consolidated statement of operations of our company for the yearsended December 31, 2015, 2014 and 2013, have been derived from the historical audited consolidated financialstatements and related notes. The historical condensed consolidated statements of operations information for thethree-month periods ended December 31, 2011 has been derived from the unaudited historical condensedconsolidated financial statements of the Predecessor, which we believe include all adjustments (consisting ofnormal recurring adjustments) necessary to present the information set forth therein under U.S. GAAP. Theresults of operations for the interim three month periods ended December 31, 2012 and December 31, 2011 arenot necessarily indicative of the results to be obtained for the full fiscal year. Certain amounts in the prior yearhave been reclassified to conform to the current year presentation.
- 54 -

Years EndedDecember 31,
Three MonthsEnded
December 31,Years Ended
September 30,
2015 2014 2013 2012 2011 2012 2011
(unaudited)(amounts in thousands, except per share data)
Total Revenue:Total revenue $ 58,679 $ 45,275 $ 24,445 $ 5,622 $ 5,578 $ 27,140 $ 16,641Investment interest expense (26,385) (16,655) (9,815) (2,347) (2,821) (9,852) (9,442)Provision for credit losses — — (11,000) — — — —
Total Revenue, net of investmentinterest expense and provision 32,294 28,620 3,630 3,275 2,757 17,288 7,199
Compensation and benefits (16,788) (10,518) (12,312) (1,157) (1,065) (7,697) (4,028)General and administrative (6,462) (5,550) (3,844) (584) (626) (3,901) (2,506)Acquisition costs — (2,456) — — — — —Other, net (794) (300) (359) (137) (153) (602) (630)Loss from equity method
investments in affiliates (98) — — (448) (799) (1,284) (5,047)
Other Expenses, net (24,142) (18,824) (16,515) (2,326) (2,643) (13,484) (12,211)
Net income (loss) before income tax 8,152 9,796 (12,885) $ 949 $ 114 $ 3,804 $ (5,012)
Income tax (expense)benefit (118) (26) 251 — — — —
Net Income (Loss) 8,034 9,770 (12,634) $ 949 $ 114 $ 3,804 $ (5,012)
Net income (loss) attributable tonon-controlling interest holders 76 163 (2,175)
Net income (loss) income attributableto controlling shareholders $ 7,958 $ 9,607 $ (10,459)
Balance Sheet Data (at Period End):Financing receivables $ 783,967 $ 552,706 $ 347,871 $ 195,582 $ 143,776Financing receivables held-for-sale 60,376 62,275 24,758 — —Investments (1) 29,017 27,273 95,177 — 506Real estate (2) 155,699 113,965 — — —Equity method investments in
affiliates 318,769 143,903 — — —Cash and cash equivalents 42,645 58,199 31,846 20,948 1,633Total assets 1,469,621 1,008,682 571,275 232,463 174,594Nonrecourse debt 663,791 319,196 259,767 200,283 148,177Credit facility 247,350 315,748 77,114 4,599 6,895Total liabilities 1,037,515 734,640 420,651 213,301 158,309Total equity 432,106 274,042 150,624 19,162 16,285Total liabilities and equity 1,469,621 1,008,682 571,275 232,463 174,594Per Share Data:Basic and diluted earnings per share $ 0.21 $ 0.43 $ (0.68)Weighted average shares
outstanding—basic and diluted 30,761,151 20,656,826 15,716,250Managed Assets (3) $ 3,188,174 $ 2,609,548 $ 2,085,798 $1,608,275 $1,538,526
(1) The December 31, 2013 balance includes investments held-to-maturity.(2) Includes real estate intangible assets.(3) See “—Non-GAAP Financial Measures—Managed Assets and Investment Income from Managed Assets”
for information on Managed Assets.
- 55 -

Item 7. Management’s Discussion and Analysis of Financial Condition and Results of Operations.
The following discussion should be read in conjunction with our financial statements andaccompanying notes included in Item 8, “Financial Statements and Supplementary Data,” of this Form 10-K.
Our Business
We provide debt and equity financing to the energy efficiency and renewable energy markets. We focus onproviding preferred or senior level capital to established sponsors and high credit quality obligors for assets thatgenerate long-term, recurring and predictable cash flows.
We are internally managed and our management team has extensive industry knowledge and experiencehaving completed its first renewable energy financing over 25 years ago and its first energy efficiency financingover 15 years ago. We have deep and long-standing relationships in the markets we target with leading energyservice providers, manufacturers, project developers and owners. We originate many of our transactions throughprogrammatic finance relationships with global ESCOs, such as Honeywell International, Ingersoll Rand,Johnson Controls, Schneider Electric, Siemens and United Technologies. We also originate transactions withrenewable energy manufacturers, developers and operators such as EDF Renewable Energy, EDP Renewables,E.ON, First Solar, Invenergy, SunPower and other companies who own and operate renewable energy projects,including a number of U.S. utility companies. Additionally, we rely on relationships with a variety of keyfinancial participants, including institutional investors, private equity funds, senior lenders, and investment andcommercial banks, as well as leading intermediaries, to complement our origination and financing activities. Webelieve we are the leading provider of financing for energy efficiency projects for the U.S. federal government,the largest property owner and energy user in the United States.
We focus our investment activities primarily on:
• Energy Efficiency Projects: projects, typically undertaken by ESCOs, which reduce a building’s orfacility’s energy usage or cost by improving or installing various building components, includingHVAC systems, lighting, energy controls, roofs, windows, building shells, and/or combined heat andpower systems; and
• Renewable Energy Projects: projects that deploy cleaner energy sources, such as solar and wind togenerate power production.
We may also provide financing solutions for other projects, such as water or communications infrastructure,that improve water or energy efficiency, increase energy system resiliency, positively impact the environment ormore efficiently use natural resources.
Our goal is to deliver attractive risk-adjusted returns to our stockholders by investing in projects thatgenerate long-term, recurring and predictable cash flows or cost savings. The cash flows or cost savings aregenerally generated from proven technologies that minimize performance uncertainty, enabling us to moreaccurately predict project cash flow over the term of the financing or investment. We provide capital throughdebt financings and a variety of preferred and common equity structures with a preference for structures in whichwe hold a senior or preferred position in the capital structure.
We completed approximately $935 million of transactions during 2015, compared to approximately $875million during 2014. Our strategy includes holding a large portion of these transactions on our balance sheet. Asof December 31, 2015, we held approximately $1.3 billion of transactions on our balance sheet, includingapproximately 75% of our 2015 transactions. The transactions that we hold on our balance sheet as of a givendate, which we refer to as our “Portfolio” included the following as of December 31, 2015:
• Financing Receivables, such as project loans, receivables and direct financing leases,
• Debt securities,
- 56 -

• Real Estate, such as land or other physical assets and related intangible assets used in sustainableinfrastructure projects, and
• Equity Investments in unconsolidated affiliates, such as projects where we hold a non-controllingequity interest in a project.
As of December 31, 2015, approximately 64% of our Portfolio consisted of loans, financing receivables,direct financing leases or debt securities with 59% structured with fixed rates and 5% structured with floatingrates. Approximately 12% of our Portfolio was real estate with long-term leases and approximately 24%represented equity ownership of wind projects. Excluding our equity investments, approximately 45% of ourPortfolio consisted of U.S. federal government or state or local government obligors, approximately 54%consisted of investment grade commercial obligations and 1% consisted of non-investment grade ratedcommercial obligations, in all cases rated either by an independent third party rating service or our internal creditrating system. Our Portfolio consisted of over 105 transactions and the weighted average remaining life of ourPortfolio as of December 31, 2015, (excluding match-funded transactions) was approximately ten years. Formore information on the assets included in our Portfolio, see the “Our Portfolio” section of Financial Conditionand Results of Operation discussed below.
We also originate transactions for securitization trusts or similar vehicles, including the Hannon ArmstrongMulti-Asset Infrastructure Trust, or Hannie Mae, that we manage or service. Large institutional investors,primarily insurance companies and commercial banks, provide the financing needed for a project by purchasingthe notes issued by the trust or vehicle. The securitization market for the assets we finance has remained activethroughout various market cycles due to investor demand for high credit quality, long-term investments. Wetypically arrange such securitizations of loans or other assets prior to originating the transaction and thus haveavoided exposure to credit spread and interest rate risks that are normally associated with traditional capitalmarkets conduit transactions. Additionally, we have typically avoided funding risks for these loans or otherassets given that our securitization partners contractually agree to fund such assets before the originationtransaction is completed. In most cases, the transfer of loans or other assets to these non-consolidatedsecuritization trusts qualify as sales for accounting purposes. In these transactions, we record income as a gain onsale of receivables and investments.
We also typically manage and service these assets in exchange for fees and other payments, which werecord as fee income on our statement of operations. We may also use other funds or structures whereinstitutional investors purchase all or a portion of the economics of the transaction and where we may receiveupfront revenues or ongoing fees for managing the assets. We periodically provide other services, includingarranging financings that are held on the balance sheet of other investors and advising various companies withrespect to structuring investments.
We managed approximately $3.2 billion of assets, which consisted of our Portfolio plus approximately $1.8billion of assets held in non-consolidated securitization trusts. We refer to this $3.2 billion of assets collectivelyas our managed assets.
We have raised net proceeds of approximately $470 million including $181 million in two follow on publicofferings completed in 2015. Since April 2013, we have also completed approximately $610 million ofnonrecourse borrowings and have a credit facility with maximum capacity of $500 million. In 2015, wecompleted approximately $395 million of nonrecourse borrowings and had a $50 million increase in availablecapacity under our credit facility.
We have a large and active pipeline of potential new opportunities that are in various stages of ourunderwriting process. We refer to potential opportunities as being part of our pipeline if we have determined thatthe project fits within our investment strategy and exhibits the appropriate risk/reward characteristics through aninitial credit analysis, including a quantitative and qualitative assessment of the opportunity, as well as research
- 57 -

on the market and sponsor. Our pipeline of transactions that could potentially close in the next 12 monthsconsists of opportunities in which we will be the lead originator, as well as projects in which we may participatewith other institutional investors. As of December 31, 2015, our pipeline consisted of more than $2.5 billion innew debt and equity opportunities. There can, however, be no assurance that any or all of the transactions in ourpipeline will be completed.
Market Conditions
We believe that the markets we serve are in the midst of a prolonged expansion fueled principally by thefollowing macro-economic and geopolitical trends:
• global climate change caused by man-made GHG emissions;
• governmental policies that seek to address global climate change and other environmental issues;
• volatile commodity prices;
• national security risks associated with energy procurement that threaten energy supply;
• fiscal challenges and budgetary constraints facing U.S. federal, state and local governments; and
• changes in global banking regulations which increase capital requirements for banks when they retainfinancing for long-lived clean energy projects, thus reducing the amount of available bank financing forsuch projects.
For example, in October 2015, the U.S. Environmental Protection Agency introduced the Clean Power Planintended to establish GHG emissions guidelines for existing U.S. power plants, the implementation of which wasstayed by the Supreme Court of the United States pending review on the merits by lower appellate courts. On aglobal basis, nearly 200 countries participated in a December 2015 Conference of the Parties to the UnitedNations Framework Convention on Climate Change (COP 21) where an agreement was reached to continueefforts to reduce GHG emissions.
In part due to this growing demand, we believe that capital availability has not kept pace with the growingfinancing demands in the markets we serve in the United States, as well as elsewhere around the world. In theface of growing demand for capital, we are concurrently witnessing a decline, elimination or expiration ofimportant government subsidies that have played an important historical role in bringing capital to our markets.In addition, much of the capital that is available to the sector comes with conditions attached, includingsubstantial minimum project size requirements, requirements that all project cash flows be fully contracted priorto any provision of financing, and the inability of lenders to take any “merchant” or investment risk with respectto various government incentives.
While we believe that the long-term growth prospects for our business remain positive, recent financialmarket and commodity price volatility and interest rate movements have raised near-term concerns that haveimpacted the markets we serve. The U.S. Energy Information Administration reported that U.S. benchmark crudeoil prices were down 53% in 2015 compared with 2014 and the 2015 average benchmark natural gas pricesdecreased by 41% from 2014. Oil represents only about 1% of U.S. power production and thus has limitedimpact on power pricing. However, wholesale electricity prices are closely tied to wholesale natural gas prices inmany parts of the country and thus lower natural gas prices have the potential to negatively impact renewableenergy projects that sell wholesale power on a “merchant” basis at spot prices.
The price declines in energy have also adversely impacted energy debt and equity markets, including masterlimited partnerships that transport, store or process oil and gas. In addition, concerns have been raised about thelevel of economic growth in the United States as well in other important economic centers around the world.While this impact is still developing, it has the potential to cause investors and lenders, who in some cases alsoparticipate in the sustainable energy industry, to adjust the types and amounts of investments that they make.Certain participants in the sustainable energy industry have experienced significant declines in the value of theirequity and may face difficulty in raising or refinancing debt.
- 58 -

As described in more detail in “—Factors Impacting our Operating Results—Commodity Prices” below, weattempt to mitigate our exposure to commodity price volatility by focusing on projects with contracted revenuesand by negotiating certain structural protections such as preferred returns. In addition, we do not lend toindividual companies but instead focus on projects or portfolios of assets which are typically held in specialpurpose entities. We also seek to manage credit risk that might arise from commodity price declines thoroughdue diligence and underwriting processes, strong structural protections in our transaction agreements withcustomers and on-going active asset management and portfolio monitoring.
The U.S. Federal Reserve raised its target range for the fed funds rate by 0.25% in December 2015 andcredit spreads, the difference between a credit index and U.S. Treasuries of a comparable maturity, have alsoincreased. As described in “—Factors Impacting our Operating Results—Changes in Market Interest Rates andLiquidity,” on the asset side, rising rates and spread widening will increase the returns from new investments wemake, which we believe will have a positive impact on our overall Portfolio yield. On the liability side, and inresponse to concerns over rising interest rates, we have increased our level of fixed rate debt and plan to continueto broaden our sources of debt over the next one to three years.
Notwithstanding the near-term concerns that current market conditions have raised for our business, webelieve significant opportunities exist for us to grow our business in the face of these conditions. Historically,better risk adjusted returns were available in an environment where demand for capital is growing but capitalavailability is in shorter supply. As a long-term player committed to providing capital to the energy efficiencyand renewable energy markets, we plan to continue to fund projects that meet our underwriting standards andlook for opportunities to expand our business as other capital providers withdraw or scale back their fundingallocations to our markets.
Factors Impacting our Operating Results
We expect that our results of operations will be affected by a number of factors and will primarily dependon the size of our Portfolio, including the mix of transactions which we hold in our Portfolio, the income wereceive from securitizations, syndications and other services, our Portfolio’s credit risk profile, changes in marketinterest rates, commodity prices, U.S. federal, state and/or municipal governmental policies, general marketconditions in local, regional and national economies and our ability to qualify as a REIT and maintain ourexception from registration as an investment company under the 1940 Act.
Portfolio Size
The size of our Portfolio will be a key revenue driver. Generally, as the size of our Portfolio on our balancesheet grows the amount of our investment revenue will increase. Our Portfolio may grow at an uneven pace asopportunities to originate new assets may be irregularly timed, and the timing and extent of our success in suchoriginations cannot be predicted. To the extent the size of our Portfolio changes due to investment activity in ourequity method affiliates, the income or loss from such investments will not be included in revenue but arereflected on a separate line in our income statement. In addition, we may decide for any particular project that weshould securitize or otherwise sell a portion, or all, of the project, which would result in gain on sale ofreceivables and investments or fee income as, described below. The level of portfolio activity will fluctuate fromperiod to period based upon the market demand for the capital we provide, our view of economic fundamentalsincluding interest rates, the present mix of our Portfolio, our ability to identify new opportunities that meet ourinvestment criteria, the volume of projects that have advanced to stages where we believe a transaction isappropriate, seasonality in our activities and in the various projects where we may provide debt or equity and ourability to consummate the identified opportunities, including as a result of our available capital. The level of ournew origination activity, the percentage of the originations that we choose to retain on our balance sheet and therelated income, will directly impact our investment revenue.
- 59 -

Income from Securitization, Syndication and Other Services
We will also earn gain on sale of receivables and investments or fee income by securitizing or selling all ora portion of our transactions and by servicing the securitization financings we arrange. For transactions that wesecuritize to a non-consolidated trust, we recognize a gain on securitization of the receivables. We receive amajority of the gain in cash and record the present value of the remaining portion as a retained interest in oursecuritization assets. We may also recognize additional income such as servicing fees from these securitizationassets over the life of the project.
In many cases, we arrange the securitization of the loan or other asset prior to originating the transaction andthus have avoided exposure to credit spread and interest rate risks that are typically associated with traditionalcapital markets conduit transactions. In these cases, we avoid funding risks for these loans or other assets giventhat our securitization partners contractually agree to fund such assets before the origination transaction iscompleted.
We also generate fee income for syndications where we arrange financings that are held directly on thebalance sheet of other investors or if we sell existing transactions to other investors. In these transactions, unlesswe decide to hold a portion of the economic interest of the transaction on our balance sheet, we have no exposureto risks related to ownership of those financings. We may charge advisory, retainer or other fees, includingthrough our broker dealer subsidiary. As a large portion of these fees are earned upon the closing of a financingtransaction, the timing of these fees will vary from quarter to quarter.
The gain on sale income and our other sources of fee income will also vary depending on the level of ournew origination activity and the portion of our originated assets we decide to transfer to other investors. We viewthis revenue from such activities as a valuable component of our earnings and an important source of franchisevalue. The total amount of fee income will vary on a quarter to quarter basis depending on various factors,including the level of our originations, the duration, credit quality and types of assets we originate, current andanticipated future interest rates, the mix of our Portfolio and our need to tailor our mix of assets in order to allowus to qualify as a REIT for U.S. federal income tax purposes and maintain our exception from registration underthe 1940 Act.
Credit Risks
We source and identify quality opportunities within our broad areas of expertise and apply our rigorousunderwriting processes to our transactions, which, we believe, will generally enable us to keep our credit lossesand financing costs low. While we do not anticipate facing significant credit risk in our financings related to U.S.federal government energy efficiency projects, we are subject to varying degrees of credit risk in these projects inrelation to guarantees provided by ESCOs where payments under energy savings performance contracts arecontingent upon achieving pre-determined levels of energy savings. We are also exposed to credit risk in projectsthat do not benefit from the U.S. federal government as obligor. We increasingly target such projects as part ofour strategy. In the case of various renewable energy and sustainable infrastructure projects, we will also beexposed to the credit risk of the obligor of the project’s power purchase agreement or other long-term contractualrevenue commitments. We may encounter enhanced credit risk as we expect that over time our strategy willincreasingly include mezzanine debt, real estate or equity investments. We seek to manage credit risk usingthorough due diligence and underwriting processes, strong structural protections in our transaction agreementswith customers and continual, active asset management and portfolio monitoring. Nevertheless, unanticipatedcredit losses could occur and during periods of economic downturn in the global economy, our exposure to creditrisks from obligors increases, and our efforts to monitor and mitigate the associated risks may not be effective inreducing our credit risks.
We utilize a risk rating system to evaluate projects that we increasingly target, such as on balance sheetfinancing of projects undertaken by state and local governments, universities, schools and hospitals, as well asprivately owned commercial projects. We first evaluate the credit rating of the obligors involved in the projectusing an average of the external credit ratings for an obligor, if available, or an estimated internal rating based on
- 60 -

a third party credit scoring system. We then evaluate the probability of default and estimated recovery rate basedon the obligors’ credit ratings and the terms of the contract. We also review the performance of each investment,including through, as appropriate, a review of project performance, monthly payment activity and activecompliance monitoring, regular communications with project management and, as applicable, its obligors,sponsors and owners, monitoring the financial performance of the collateral, periodic property visits andmonitoring cash management and reserve accounts. The results of our reviews are used to update the project’srisk rating as necessary.
Changes in Market Interest Rates and Liquidity
Interest rates and prepayment speeds vary according to the type of asset, conditions in the financial markets,competition and other factors, none of which can be predicted with any certainty. With respect to our businessoperations, increases in interest rates, in general, may over time cause: (1) an increase in the returns we receivefrom new financings we provide, but will also likely cause project owners to be less interested in borrowing orraising equity and thus reduce the demand for our financings and services; (2) the interest expense associatedwith our borrowings to increase; (3) the market value of our fixed rate or fixed return investments to decline; and(4) the market value of interest rate swap agreements to increase, to the extent we, or the projects to which weprovide capital, enter into such agreements as part of a hedging strategy. Conversely, decreases in interest rates,in general, may over time cause: (1) a decrease in the returns we receive from new financings we provide, butwill also likely cause project owners to be more interested in borrowing or raising equity and thus increase thedemand for our financings; (2) prepayments on our investments, to the extent allowed, to increase; (3) theinterest expense associated with our borrowings to decrease; (4) the market value of our fixed rate or fixed returninvestments to increase; and (5) the market value of interest rate swap agreements to decrease, to the extent we,or the projects to which we provide capital, enter into such agreements as part of our hedging strategy. We are,and will, in the future, be subject to changes in market interest rate for any new floating or inverse floating rateassets and credit facilities including our existing credit facility and the refinancing of our fixed rated debt.Because short-term borrowings are generally short-term commitments of capital, lenders may respond to marketconditions, making it more difficult for us to secure continued financing. If we are not able to renew our thenexisting facilities or arrange for new financing on terms acceptable to us, or if we default on our covenants or areotherwise unable to access funds under any of these facilities, we may have to curtail our origination of newassets and/or dispose of assets. We face particular risk in this regard given that we expect many of ourborrowings will have a shorter duration than the assets they finance. In addition, our ability to receive protectionagainst prepayments, which occur in a declining interest rate environment, including through the use ofmake-whole payments, will vary according to type of investment and obligor. Subject to maintaining ourqualification as a REIT for U.S. federal income tax purposes and our exception from registration under the 1940Act, we may, from time to time, utilize derivative financial instruments to hedge interest rate risk. In addition tothe use of traditional derivative instruments, we also seek to mitigate interest rate risk by using securitizationssuch as asset backed securitizations, syndications and other techniques to construct a portfolio with a staggeredmaturity profile.
In preparation for potentially higher interest rates, we also have increased the percentage of fixed rate debtfrom approximately 50% as of December 31, 2014 to approximately 71% as of December 31, 2015, or slightlyabove our targeted fixed rate debt percentage range of approximately 50% to 70%. For the purposes of thesecalculations, we used the total debt on our balance sheet, including our credit facility, nonrecourse securitizationdebt and other nonrecourse match funded debt but excluding securitizations that are not consolidated on ourbalance sheet (where the collateral is typically borrowings with U.S. government obligors). In addition, for thepurposes of the fixed rate debt target, we include in the fixed rate debt, the present notional value hedged byinterest rate swaps.
We have also worked to expand our liquidity and access to the debt and bank loan markets and in 2015,entered into borrowing relationships with three new lenders and with several institutional investors through our$101 million issuance of HASI Sustainable Yield Bonds in 2015 . We also increased the size of our credit facilityby $50 million and continue to conduct securitizations with institutional investors.
- 61 -

Commodity Prices
When we provide debt or equity for a project that acts as a substitute for an underlying commodity we areexposed to volatility in prices for that commodity. For example, the performance of renewable energy projectsthat produce electricity can be impacted by volatility in the market prices of various forms of energy, includingelectricity, coal and natural gas. This is especially true for utility scale projects that sell power on a wholesalebasis such as many of our wind projects as opposed to distributed renewable projects or energy efficiencyprojects which compete against the retail or delivered costs of electricity which includes the cost of transmittingand distributing the electricity to the end user.
Although we generally focus on renewable energy projects that have the majority of their operating cashflow supported by long-term PPAs, ranging from 10 to 30 years, to the extent that the projects have shorter termcontracts (which may have the potential of producing higher current returns) or sell their power in the openmarket on a merchant basis, the cash flows of such projects, and thus the repayment of, or the returns availablefor, our assets, may be subject to risk if energy prices change. We also mitigate our exposure through structuralprotections. These structural protections, which are typically in the form of a preferred return mechanism, aredesign to allow recovery of our capital and an acceptable return over time. When structuring and underwritingthese transactions, we evaluate these transactions using a variety of scenarios, including long-term depressednatural gas prices. In the case of utility scale solar projects, we focus on owning the land under the project whereour rent is paid out of project operational costs before the debt or equity in the project receives any payments.
We believe the current low prices in natural gas will increase demand for some types of our projects, such ascombined heat and power, but may reduce the demand for other projects such as renewable energy that may be asubstitute for natural gas. We seek to structure our energy efficiency financings so that we typically avoidexposure to commodity price risk. However, volatility in energy prices may cause building owners and otherparties to be reluctant to commit to projects for which repayment is based upon a fixed monetary value forenergy savings that would not decline if the price of energy declines.
Government Policies
We provide debt and equity financing to projects that typically depend in part on various U.S. federal, stateor local governmental policies that support or enhance the project’s economic feasibility. Such policies mayinclude governmental initiatives, laws and regulations designed to reduce energy usage, encourage the use ofrenewable energy or encourage the investment in and the use of sustainable infrastructure. Incentives provided bythe U.S. federal government may include tax credits (with some of these tax credits that are related to renewableenergy schedule to be reduced in the future), tax deductions, bonus depreciation as well as federal grants and loanguarantees. Incentives provided by state and local governments may include renewable portfolio standards,which specify the portion of the power utilized by local utilities that must be derived from renewable energysources such as renewable energy as well as the state or local government sponsored programs where thefinancing of energy efficiency or renewable energy projects is repaid through an assessment in the property taxbill in a program commonly referred to as PACE. Additionally, certain states have implemented feed-in tariffs,pursuant to which electricity generated from renewable energy sources is purchased at a higher rate thanprevailing wholesale rates. Other incentives include tariffs, tax incentives and other cash and non-cash payments.In addition, U.S. federal, state and local governments provide regulatory, tax and other incentives to encouragethe development and growth of sustainable infrastructure. Governmental agencies and other owners of real estatefrequently depend on these policies to help defray the costs associated with, and to finance, various projects.Government regulations also impact the terms of third party financing provided to support these projects. If anyof these government policies, incentives or regulations are adversely amended, delayed, eliminated, reduced ornot extended beyond their current expiration dates the demand for, and the returns available from, the financingwe provide may decline, which could harm our business. Changes in government policies, support andincentives, including retroactive changes, could also negatively impact the operating results of the projects wefinance and the returns on our assets.
- 62 -

Recent U.S. Federal Income Tax Legislation
On December 18, 2015, President Obama signed into law the Consolidated Appropriations Act, 2016, anomnibus spending bill, with a division referred to as the Protecting Americans From Tax Hikes Act of 2015 (the“PATH Act”). The PATH Act changes certain of the rules affecting REIT qualification and taxation of REITsand REIT shareholders, which are briefly summarized below.
• For taxable years beginning after 2017, the percentage of a REIT’s total assets that may be representedby securities of one or more TRSs is reduced from 25% to 20%.
• “Publicly offered REITs” (which generally include any REIT required to file annual and periodicreports with the SEC, including us) are no longer subject to the preferential dividend rules for taxableyears beginning after 2014.
• For taxable years beginning after 2015, debt instruments issued by publicly offered REITs arequalifying assets for purposes of the 75% REIT asset test. However, no more than 25% of the value ofa REIT’s assets may consist of debt instruments that are issued by publicly offered REITs that are nototherwise treated as real estate assets, and interest on debt of a publicly offered REIT will not bequalifying income under the 75% REIT gross income test unless the debt is secured by real property.
• For taxable years beginning after 2015, to the extent rent attributable to personal property is treated asrents from real property (because rent attributable to the personal property for the taxable year does notexceed 15% of the total rent for the taxable year for such real and personal property), the personalproperty will be treated as a real estate asset for purposes of the 75% REIT asset test. Similarly, debtobligation secured by a mortgage on both real and personal property will be treated as a real estateasset for purposes of the 75% asset test, and interest thereon will be treated as interest on an obligationsecured by real property, if the fair market value of the personal property does not exceed 15% of thefair market value of all property securing the debt.
• For taxable years beginning after 2014, the period during which dispositions of properties with netbuilt-in gains from C corporations in carry-over basis transactions will trigger the built-in gains tax isreduced from ten years to five years.
• For taxable years beginning after 2015, a 100% excise tax will apply to “redetermined servicesincome,” i.e., non-arm’s-length income of a REIT’s TRS attributable to services provided to, or onbehalf of, the REIT (other than services provided to REIT tenants, which are potentially taxed asredetermined rents).
• The rate of withholding tax applicable under the Foreign Investment in Real Property Tax Act of 1980(“FIRPTA”) to certain sales and other dispositions of U.S. real property interests (“USRPIs”) by non-U.S. persons, and certain distributions from corporations whose stock may constitute a USRPI, isincreased from 10% to 15% for dispositions and distributions occurring after February 16, 2016.
• For dispositions and distributions on or after December 18, 2015, the stock ownership thresholds forexemption from FIRPTA taxation on sale of stock of a publicly traded REIT and for recharacterizingcapital gain dividends received from a publicly traded REIT as ordinary dividends is increased fromnot more than 5% to not more than 10%.
• Effective December 18, 2015, certain look-through, presumption, and other rules will apply forpurposes of determining if we qualify as domestically controlled.
• For dispositions and distributions after December 18, 2015, certain “qualified foreign pension funds”satisfying certain requirements, as well as entities that are wholly owned by a qualified foreign pensionfund, are exempt from income and withholding taxes applicable under FIRPTA. In addition, newFIRPTA rules apply to ownership of REIT shares by “qualified shareholders,” which generally includepublicly traded non-U.S. stockholders meeting certain requirements.
- 63 -

Our Qualification as a REIT
We have elected to qualify, and operate our business so as to qualify, to be taxed as a REIT under Sections856 through 860 of the Internal Revenue Code commencing with our taxable year ended December 31, 2013. Webelieve that we have been organized and operated, and we intend to continue to operate, in such a manner so as toqualify for taxation as a REIT under the Internal Revenue Code. Qualification and taxation as a REIT depends onour ability to satisfy, among other requirements, certain asset and income tests, some of which depend upon theclassification of at least 75% of the “fair market value” of our assets as real estate assets under the InternalRevenue Code. As described above, the PATH Act has changed certain rules affecting REIT qualification andtaxation. In May 2014, the United States Department of the Treasury published proposed regulations which, ifadopted in the form proposed, would revise the definition of “real property” for purposes of the REIT income andasset tests. Most of the new rules and the proposed regulations are not yet in effect, and, depending upon whetherand in what form they are actually adopted and how if adopted they are interpreted, may affect the classificationof certain of our assets under these tests, and thus could require us to alter our mix of assets, adjust our approachto qualifying as a REIT or adjust our business strategy. The proposed regulations are proposed to be effective forcalendar quarters beginning after they are published in final form. The Treasury has not indicated whether orwhen the proposed regulations will be finalized.
In order for us to continue to qualify as a REIT under the Internal Revenue Code, shares of our stock mustbe owned by 100 or more persons during at least 335 days of a taxable year of 12 months. Also, not more than50% of the value of the outstanding shares of our stock may be owned, directly or constructively, by five orfewer individuals (as defined in the Internal Revenue Code to include certain entities) during the last half of ataxable year. To assist us in preserving our REIT qualification, among other purposes, our charter generallyprohibits any person from directly or indirectly owning more than 9.8% in value or in number of shares,whichever is more restrictive, of the aggregate outstanding shares of our capital stock, the outstanding shares ofany class or series of our preferred stock or the outstanding shares of our common stock. Our board of directorshas established exceptions from these ownership limits in our charter which permits certain institutional investorsand their clients to hold shares of our common stock in excess of these ownership limits.
Critical Accounting Policies and Use of Estimates
Our financial statements are prepared in accordance with U.S. GAAP, which requires the use of estimatesand assumptions that involve the exercise of judgment and use of assumptions as to future uncertainties. Thefollowing discussion addresses the accounting policies that we use. Our most critical accounting policies involvedecisions and assessments that could affect our reported assets and liabilities, as well as our reported revenuesand expenses. We believe that all of the decisions and assessments upon which our financial statements are basedare reasonable at the time made and based upon information available to us at that time. Our critical accountingpolicies and accounting estimates may be expanded over time. Those material accounting policies and estimatesthat we expect to be most critical to an investor’s understanding of our financial results and condition and requirecomplex management judgment are discussed below. See Note 2 of the audited financial statements in thisForm 10-K for further details on our accounting policies.
Financing Receivables
Financing receivables include financing energy efficiency and renewable energy project loans, receivablesand direct financing leases.
Unless otherwise noted, we generally have the ability and intent to hold our financing receivables for theforeseeable future and thus they are classified as held for investment. Our ability and intent to hold certainfinancing receivables may change from time to time depending on a number of factors, including economic,liquidity and capital conditions. The carrying value of financing receivables held for investment represents thepresent value of the note, lease or other payments, net of any unearned fee income, which is recognized asincome over the term of the note or lease using the effective interest method. Financing receivables that are held
- 64 -

for investment are carried, unless deemed impaired, at cost, net of any unamortized acquisition premiums ordiscounts and include origination and acquisition costs, as applicable. Financing receivables that we intend to sellin the short-term are classified as held-for-sale and are carried at the lower of amortized cost or fair value on ourbalance sheet. The net purchases and proceeds from these sales of our held-for-sale financing receivables arerecorded as an operating activity in our statement of cash flows based on our intent at the time of purchase. Wemay secure nonrecourse debt with the proceeds from our financing receivables.
We evaluate our financing receivables for potential delinquency or impairment on at least a quarterly basisand more frequently when economic or other conditions warrant such an evaluation. When a financing receivablebecomes 90 days or more past due, and if we otherwise do not expect the debtor to be able to service all of itsdebt or other obligations, we will generally consider the financing receivable delinquent or impaired and placethe financing receivable on non-accrual status and cease recognizing income from that financing receivable untilthe borrower has demonstrated the ability and intent to pay contractual amounts due. If a financing receivable’sstatus significantly improves regarding the debtor’s ability to service the debt or other obligations, we willremove it from non-accrual status.
A financing receivable is also considered impaired as of the date when, based on current information andevents, it is determined that it is probable that we will be unable to collect all amounts due in accordance with theoriginal contracted terms. Many of our financing receivables are secured by energy efficiency and renewableenergy infrastructure projects. Accordingly, we regularly evaluate the extent and impact of any creditdeterioration associated with the performance and value of the underlying project, as well as the financial andoperating capability of the borrower, its sponsors or the obligor as well as any guarantors. We consider a numberof qualitative and quantitative factors in our assessment, including, as appropriate, a project’s operating results,loan-to-value ratios and any cash reserves, the ability of expected cash from operations to cover the cash flowrequirements currently and into the future, key terms of the transaction, the ability of the borrower to refinancethe transaction, other credit support from the sponsor or guarantor and the project’s collateral value. In addition,we consider the overall economic environment, the sustainable infrastructure sector, the effect of local, industry,and broader economic factors, the impact of any variation in weather and the historical and anticipated trends ininterest rates, defaults and loss severities for similar transactions.
If a financing receivable is considered to be impaired, we record an allowance to reduce the carrying valueof the financing receivable to the present value of expected future cash flows discounted at the financingreceivable’s contractual effective rate or the amount realizable from other contractual terms such as the currentlyestimated fair market value of the collateral less estimated selling costs, if repayment is expected solely from thecollateral. We charge off financing receivables against the allowance when we determine the unpaid principalbalance is uncollectible, net of recovered amounts.
We record income from financing receivables held on our balance sheet on an accrual basis to the extentamounts are expected to be collected. We expect that income on our financing receivables will be accrued basedon the actual coupon rate and the outstanding principal balance of such securities, or if no actual coupon rateexists, using the effective interest method. Premiums and discounts will be amortized or accreted into incomeover the lives of the financing receivables using the effective yield method, as adjusted for actual prepayments inaccordance with ASC 310-40, Receivables—Nonrefundable Fees and Other Costs. For financing receivables thatare direct financing leases under ASC 840, Leases, we amortize the unearned income to income over the leaseterm to produce a constant periodic rate of return on the net investment in the lease.
Investments
Investments include debt securities that meet the criteria of ASC 320, Investments—Debt and EquitySecurities. As a result of the sale of certain debt securities previously designated as held-to-maturity in 2014, wehave designated our debt securities as available-for-sale and will carry these securities at fair value on ourbalance sheet from that date. Unrealized gains and losses, to the extent not considered other than temporaryimpairment (“OTTI”), on available-for-sale debt securities are recorded as a component of accumulated othercomprehensive income (“OCI”) in equity on our balance sheet.
- 65 -

We evaluate our investments for OTTI on at least a quarterly basis, and more frequently when economic ormarket conditions warrant such an evaluation. Our OTTI assessment is a subjective process requiring the use ofjudgments and assumptions. Accordingly, we regularly evaluate the extent and impact of any credit deteriorationassociated with the financial and operating performance and value of the underlying project. We consider anumber of qualitative and quantitative factors in our assessment. We first consider the current fair value of thesecurity and the duration of any unrealized loss. Other factors considered include changes in the credit rating,performance of the underlying project, key terms of the transaction, the value of any collateral and any supportprovided by the sponsor or guarantor.
To the extent that we have identified an OTTI for a security and intend to hold the investment to maturityand we do not expect that we will be required to sell the security prior to recovery of the amortized cost basis, werecognize only the credit component of OTTI in earnings. We determine the credit component using thedifference between the securities’ amortized cost basis and the present value of its expected future cash flows,discounted using the effective interest method or its estimated collateral value. Any remaining unrealized lossdue to factors other than credit, or the non-credit component, is recorded in accumulated OCI.
To the extent we hold investments with an OTTI and if we have made the decision to sell the security or it ismore likely than not that we will be required to sell the security prior to recovery of its amortized cost basis, werecognize the entire portion of the impairment in earnings.
We expect that income on investments that are debt securities will be accrued based on the actual couponrate and the outstanding principal balance of such securities, or if no actual coupon rate exists, using the effectiveinterest method. Premiums or discounts on investment securities are amortized or accreted into investmentinterest income using the effective interest method.
Real Estate
Real estate reflects land or other real estate held on our balance sheet. Real estate intangibles reflect thevalue of associated lease intangibles, net of any amortization. In accordance with ASC 805, BusinessCombinations, the fair value of the real estate acquired in a business combination with in-place leases is allocatedto (i) the acquired tangible assets, consisting of land or other real property such as buildings, and (ii) theidentified intangible assets and liabilities, consisting of the value of above-market and below-market leases andthe value of other acquired intangible assets, based in each case on their fair values.
The fair value of the tangible assets of an acquired leased property is determined by valuing the property asif it were vacant, and the “as-if-vacant” value is then allocated to land, building and tenant improvements, if any,based on the determination of the fair values of these assets. The as-if-vacant fair value of a property isdetermined by management based on an appraisal of the property by a qualified appraiser.
In allocating the fair value of the identified intangible assets and liabilities of an acquired property, above-market and below-market in-place lease values are recorded as intangible assets based on the present value (usingan interest rate which reflects the risks associated with the leases acquired) of the difference between (i) thecontractual amounts to be paid pursuant to the in-place leases, and (ii) management’s estimate of fair marketlease rates for the corresponding in-place leases, measured over a period equal to the remaining term of the lease,including renewal periods likely of being exercised by the lessee. The capitalized above-market lease values areamortized as a reduction of rental income and the capitalized below-market lease values are amortized as anincrease to rental income. We also record, as appropriate, an intangible asset for in-place leases. The value of theleases in place at the time of the transaction is equal to the potential revenue (rent and expenses) lost if the leaseswere not in place (during downtime) and that would be incurred to obtain the lease. The amortization iscalculated over the initial term unless management believes that it is likely that the tenant would exercise therenewal option, whereby we would amortize the value attributable to the renewal over the renewal period. If alease were to be terminated, all unamortized amounts relating to that lease would be written off.
- 66 -

We record the purchases of real estate, other than in a business combination (i.e. real estate with no in-places leases), as asset acquisitions that are recorded at cost, including acquisition and closing costs.
Our real estate is generally leased to tenants on a net lease basis, whereby the tenant is responsible for alloperating expenses relating to the property, generally including property taxes, insurance, maintenance, repairsand capital expenditures. Scheduled rental revenue typically varies during the lease term and thus rental incomeis recognized on a straight-line basis, unless there is considerable risk as to collectability, so as to produce aconstant periodic rent over the term of the lease. Accrued rental income is the aggregate difference between thescheduled rents which vary during the lease term and the income recognized on a straight-line basis and isrecorded in other assets. Rental expenses (if any) are charged to operations as incurred.
Securitization of Receivables
We have established various special purpose entities or securitization trusts for the purpose of securitizingcertain financing receivables or other debt investments. We determined that the trusts used in securitizations arevariable interest entities, as defined in ASC 810, Consolidation. We typically serve as primary or master servicerof these trusts; however, as the servicer, we do not have the power to make significant decisions impacting theperformance of the trusts. Based on an analysis of the structure of the trusts, under U.S. GAAP, we haveconcluded that we are not the primary beneficiary of the trusts as we do not have power over the trusts’significant activities. Therefore, we do not consolidate these trusts in our consolidated financial statements.
We account for transfers of financing receivables to these securitization trusts as sales pursuant to ASC 860,Transfers and Servicing, as we have concluded the transferred receivables have been isolated from the transferor(i.e., put presumptively beyond the reach of the transferor and its creditors, even in bankruptcy or otherreceivership) and we have surrendered control over the transferred receivables. We have received true-sale-at-law opinions for all of our securitization trust structures and non-consolidation legal opinions for all but one oldsecuritization trust structure that support our conclusion regarding the transferred receivables. When we sellreceivables in securitizations, we generally retain minor interests in the form of servicing rights and residualassets, which we refer to as securitization assets.
Gain or loss on the sale of receivables is calculated based on the excess of the proceeds received from thesecuritization (less any transaction costs) plus any retained interests obtained over the cost basis of thereceivables sold. For retained interests, we generally estimate fair value based on the present value of futureexpected cash flows using our best estimates of the key assumptions of anticipated losses, prepayment rates, andcurrent market discount rates commensurate with the risks involved.
We initially account for all separately recognized servicing assets and servicing liabilities at fair value andsubsequently measure such servicing assets and liabilities using the amortization method. Servicing assets andliabilities are amortized in proportion to, and over the period of, estimated net servicing income with servicingincome recognized as earned. We assess servicing assets for impairment at each reporting date. If the amortizedcost of servicing assets is greater than the estimated fair value, we will recognize an impairment in net income.
Our other retained interest in securitized assets, the residual assets, are classified as available-for-salesecurities and carried at fair value on the consolidated balance sheets in Other Assets. We generally do not sellour residual assets. Our residual assets are evaluated for impairment on a quarterly basis.
Interest income related to the residual assets is recognized using the effective interest rate method. If there isa change in expected cash flows related to the residual assets, we calculate a new yield based on the currentamortized cost of the residual assets and the revised expected cash flows. This yield is used prospectively torecognize interest income.
- 67 -

Other Fee Income
We may periodically provide services, including arranging financing that is held on the balance sheet ofother investors and advising various companies with respect to structuring investments. For services that areseparately identifiable and where evidence exists to substantiate fair value, income is recognized as earned,which is generally when the investment or other applicable transaction closes. Retainer fees are amortized overthe performance period.
Valuation of Financial Instruments
ASC 820 establishes a framework for measuring fair value in accordance with U.S. GAAP and expandsfinancial statement disclosure requirements for fair value measurements. ASC 820 further specifies a hierarchyof valuation techniques, which is based on whether the inputs into the valuation technique are observable orunobservable. Where inputs for a financial asset or liability fall in more than one level in the fair value hierarchy,the financial asset or liability is classified in its entirety based on the lowest level input that is significant to thefair value measurement of that financial asset or liability. We use our judgment and consider factors specific tothe financial assets and liabilities in determining the significance of an input to the fair value measurements. Asof December 31, 2015 and 2014, only our residual assets, financing receivables held-for-sale, interest rate swapsand investments available-for-sale, if any, were carried at fair value on the consolidated balance sheets on arecurring basis. The three levels of the fair value hierarchy are described below:
• Level 1—Quoted prices (unadjusted) in active markets that are accessible at the measurement date.
• Level 2—Observable prices that are based on inputs not quoted on active markets, but corroborated bymarket data.
• Level 3—Unobservable inputs that are used when little or no market data is available.
For financial assets and liabilities carried at fair value, we use quoted market prices, when available, todetermine the fair value of an asset or liability. If quoted market prices are not available, we consult independentpricing services or third party broker quotes, provided that there is no ongoing material event that affects theissuer of the securities being valued or the market thereof. If there is such an ongoing event, or if quoted marketprices are not available, we will determine the fair value of the securities using valuation techniques that use,when possible, current market-based or independently-sourced market parameters, such as interest rates.
Fair value for most of our assets are measured using a discounted cash flow model, contractual terms andLevel 3 unobservable inputs which consist of base interest rates and spreads over base rates which are basedupon market observation and recent comparable transactions. An increase in these unobservable inputs wouldresult in a lower fair value and a decline would result in a higher fair value. Fair value under U.S. GAAPrepresents an exit price in the normal course of business, not a forced liquidation price. If we were forced to sellassets in a short period to meet liquidity needs, the prices we receive could be substantially less than theirrecorded fair values. Furthermore, the analysis of whether it is more likely than not that we will be required tosell securities in an unrealized loss position prior to an expected recovery in value (if any), the amount of suchexpected required sales, and the projected identification of which securities would be sold is also subject tosignificant judgment, particularly in times of market illiquidity.
Any changes to the valuation methodology will be reviewed by our investment committee to ensure thechanges are appropriate. As markets and products develop and the pricing for certain products becomes moretransparent, we will continue to refine our valuation methodologies. The methods used by us may produce a fairvalue calculation that may not be indicative of net realizable value or reflective of future fair values.Furthermore, while we anticipate that our valuation methods will be appropriate and consistent with other marketparticipants, the use of different methodologies, or assumptions, to determine the fair value of certain financialinstruments could result in a different estimate of fair value at the reporting date. We will use inputs that arecurrent as of the measurement date, which may include periods of market dislocation, during which pricetransparency may be reduced.
- 68 -

Variable Interest Entities and Equity Method Investments in Affiliates
We account for our investment in entities that are considered voting or variable interest entities under ASC810. We perform an ongoing assessment to determine the primary beneficiary of each entity as required by ASC810. We have established various special purpose entities or securitization trusts for the purpose of securitizingcertain financing receivables or other debt investments which are not consolidated in our financial statements asdescribed in Securitization of Receivables above.
Substantially all of the activities of the special purpose entities that are formed for the purpose of holdingour financing receivables and investments on our balance sheet are closely associated with our activities. Basedon our assessment, we determined that we have power over and receive the benefits of these special purposeentities; hence, we are the primary beneficiary and should consolidate these entities under the provisions of ASC810.
As described in Note 1 of the audited financial statements in this Form 10-K, we made equity investments invarious wind projects. Wind projects are typically owned in partnerships structures (using limited liabilitycorporations, or LLCs taxed as partnerships) where we, along with other large institutional investors, if any,receive a stated preferred return consisting of a priority distribution of the project’s cash flows, and in somecases, tax attributes. Once this preferred return is achieved, the partnership “flips” and the wind energy companywhich operates the project, receives the a larger portion of the cash flows through its interest in the holdingcompany and we, along with the other institutional investors, will have an on-going residual interest.
The limited liability entities with JPMorgan Chase & Co. (“JPMorgan”) (which own the interest in theholding companies that own certain of the wind projects) are jointly controlled with each member owning 50% ofthe voting stock. Based on our assessment, we have determined that these entities are voting interest entities andwe have the ability to exercise influence over their operating and financial policies and as such we thereforeaccount for such investments using the equity method. JPMorgan has certain rights to withdraw from thepartnership in the future in which case we would be obligated to buy their interest at the fair market value at thetime of withdraw.
We own directly, or indirectly as partners with JPMorgan, interests in various limited liability holdingcompanies that own wind projects. Each of the holding companies is partially owned and operated by a windenergy company. Based on our assessment, we have determined that each of the holding companies (includingthe acquired ownership interest in the Creston Ridge Management, LLC and Buckeye Wind Energy Class BHoldings LLC) is a variable interest entity and that we have the ability to exercise influence over operating andfinancial policies of the holding companies, but we are not the primary beneficiary as we do not have the powerto direct the most important decisions related to the most significant activities of the investment. Thus we do notconsolidate the limited liability entities or the holding companies, but account for them using the equity methodof accounting as described below. Our maximum exposure to loss associated with these entities is limited to ourinvestment.
Under the equity method of accounting, the carrying value of our equity method investments is determinedbased on amounts we invested, adjusted for the equity in earnings or losses of investee allocated based on thelimited liability entity agreement, less distributions received. Because the limited liability entity and holdingcompany agreements contain preferences with regard to cash flows from operations, capital events andliquidation, we reflect our share of profits and losses by determining the difference between our “claim on theinvestee’s book value” at the end and the beginning of the period. This claim is calculated as the amount wewould receive (or be obligated to pay) if the investee were to liquidate all of its assets at recorded amountsdetermined in accordance with U.S. GAAP and distribute the resulting cash to creditors and investors inaccordance with their respective priorities. This method is commonly referred to as the hypothetical liquidation atbook value method or (“HLBV”). Intra-company gains and losses are eliminated for an amount equal to ourinterest and are reflected in the share in loss from equity method investment in affiliate in the consolidated
- 69 -

statements of operations. Cash distributions received from our equity method investments are classified asoperating cash flows to the extent of cumulative HLBV earnings. Any additional cash flows are deemed to bereturns of the investment and are classified as investing cash flows.
We evaluate the realization of our investment accounted for using the equity method if circumstancesindicate that our investment is OTTI. OTTI impairment occurs when the estimated fair value of an investment isbelow the carrying value and the difference is determined to not be recoverable. This evaluation requiressignificant judgment regarding, but not limited to, the severity and duration of the impairment; the ability andintent to hold the securities until recovery; financial condition, liquidity, and near-term prospects of the issuer;specific events; and other factors. Based on an evaluation of our equity method investments, we determined thatno impairment had occurred for 2015 or 2014. We did not have any equity method investments as ofDecember 31, 2013.
Derivative Financial Instruments
We may utilize derivative financial instruments, primarily interest rate swaps, to manage, or hedge, ourinterest rate risk exposures associated with new debt issuances, to manage our exposure to fluctuations in interestrates on variable rate debt, and to optimize the mix of our fixed and floating-rate debt. In addition, we may useforward-starting interest rate swap contracts to manage a portion of our interest rate exposure for anticipatedrefinancing of our long-term debts. Our objective is to manage the impact of interest rates on the results ofoperations and cash flows and the market value of our debt.
We use interest rate swaps designated as cash flow hedges to manage our interest rate exposures associatedwith new debt issuances and to manage our exposure to fluctuations in interest rates on variable rate debt. Weattempt to use derivative instruments that are considered highly effective in reducing our exposure to the interestrate risk that they are designated to hedge. This effectiveness is essential in order to qualify for hedge accounting.Instruments that meet these hedging criteria are formally designated as hedges at the inception of the derivativecontract. Derivatives are recorded on the consolidated balance sheet at fair value. If a derivative is designated asa cash flow hedge, the effective portions of changes in the fair value of the derivative are recorded inAccumulated other comprehensive income, net of associated deferred income tax effects, in our ConsolidatedStatements of Stockholders’ Equity and Comprehensive Income (Loss) and are recognized in the ConsolidatedStatements of Operations when the hedged item affects earnings. Changes in fair value of the ineffective portionsof these hedges are recognized in Other, net in our Consolidated Statements of Operations. For derivativeinstruments not designated as hedging instruments, changes in fair value are recognized in our ConsolidatedStatements of Operations in the period that the change occurs. We assess, both at the inception of the hedge andon an ongoing basis, whether the derivatives that are used in hedging transactions are highly effective inoffsetting changes in cash flows of hedged items. As of December 31, 2015, all of our derivatives weredesignated as hedging instruments and there was no ineffectiveness recorded on our designated hedges. As ofDecember 31, 2014 or 2013, we did not hold any derivatives. We do not hold derivatives for trading purposes.
Interest rate swap contracts contain a credit risk that counterparties may be unable to fulfill the terms of theagreement. We attempt to minimize that risk by evaluating the creditworthiness of its counterparties, who arelimited to major banks and financial institutions, and do not anticipate nonperformance by the counterparties.
Income Taxes
We elected and qualified to be taxed as a REIT for U.S. federal income tax purposes, commencing with ourtaxable year ended December 31, 2013. To qualify as a REIT, we must meet a number of organizational andoperational requirements, including a requirement that we currently distribute at least 90% of our net taxableincome, excluding capital gains, to our shareholders. We intend to continue to meet the requirements forqualification as a REIT. As a REIT, we are not subject to U.S. federal corporate income tax on that portion of netincome that is currently distributed to our owners. However, our taxable REIT subsidiaries (“TRS”) will
- 70 -

generally be subject to U.S. federal, state, and local income taxes as well as taxes of foreign jurisdictions, if any.Prior to the completion of the IPO, the Predecessor was taxed as a partnership for U.S. federal income taxpurposes.
We account for income taxes of our TRS using the asset and liability method. Deferred tax assets andliabilities are recognized for the estimated future tax consequences attributable to the differences between theconsolidated financial statement carrying amounts of existing assets and liabilities and their respective tax bases.Deferred tax assets and liabilities are measured using enacted tax rates in effect for the year in which thosetemporary differences are expected to be recovered or settled. The effect on deferred tax assets and liabilitiesfrom a change in tax rates is recognized in earnings in the period when the new rate is enacted.
We apply accounting guidance with respect to how uncertain tax positions should be recognized, measured,presented, and disclosed in the financial statements. This guidance requires the accounting and disclosure of taxpositions taken or expected to be taken in the course of preparing our tax returns to determine whether the taxpositions are “more likely than not” to be sustained by the applicable tax authority. We are required to analyze allopen tax years, as defined by the statute of limitations, for all major jurisdictions, which includes U.S. federaland certain states. We have no examinations in progress, none are expected at this time, and years 2012 through2014 are open. As of December 31, 2015 and 2014, we had no uncertain tax positions. Our policy is to recognizeinterest expense and penalties related to income tax matters as a component of other expense. There were noaccrued interest and penalties as of December 31, 2015 or 2014, and no interest and penalties were recognizedduring the years ended December 31, 2015, 2014 or 2013.
Equity-Based Compensation
At the time of completion of our IPO, we adopted the 2013 Plan, which provides for grants of stock options,stock appreciation rights, restricted stock units, shares of restricted common stock, phantom shares, dividendequivalent rights, LTIP units and other restricted limited partnership units issued by our Operating Partnershipand other equity-based awards. From time to time, we may award unvested restricted stock as compensation tomembers of our senior management team, our independent directors, employees, advisors, consultants and otherpersonnel under our 2013 Plan.
We record compensation expense for stock awards in accordance with ASC 718, Compensation—StockCompensation. We record compensation expense for unvested shares that vest solely based on service conditionson a straight-line basis over the vesting period based upon the fair market value of the shares on the date of grant,adjusted for forfeitures. For awards where the vesting is contingent upon achievement of certain performancetargets, compensation expense is recorded over the requisite service period (which includes the performanceperiod) based on our estimate of the achievement of the various performance targets, adjusted for forfeitures. Ourshare price at the date of grant and actual performance results at the end of the performance period determine thefair value and the number of shares that will ultimately be awarded. The award earned is generally between 0%and 150% of the initial target, depending on the extent to which the performance target are met. If minimumperformance targets are not attained, no awards will be made.
Segment Reporting
We provide and arrange debt and equity financing for sustainable infrastructure projects and report all of ouractivities as one business segment.
Results of Operations
We completed approximately $935 million of transactions during 2015, compared to approximately $875million during 2014. Our strategy includes holding a large portion of these transactions on our balance sheet to .As of December 31, 2015, we held approximately $1.3 billion of our assets on our balance sheet, includingapproximately 75% of our 2015 transactions. We refer to the transactions we hold on our balance sheet as of agiven date as our “Portfolio.”
- 71 -

Our Portfolio
As of December 31, 2015, approximately 64% of our Portfolio consisted of loans, financing receivables,direct financing leases or debt securities with 59% structured with fixed rates and 5% structured with floatingrates. Approximately 12% of our Portfolio was real estate with long-term leases and approximately 24%represented equity ownership of wind projects. Excluding our equity investments, approximately 45% of ourPortfolio consisted of U.S. federal government or state or local government obligors, approximately 54%consisted of investment grade commercial obligations and 1% consisted of non-investment grade ratedcommercial obligations, in all cases rated either by an independent third party rating service or our internal creditrating system. Our Portfolio consisted of over 105 transactions and the weighted average remaining life of ourPortfolio as of December 31, 2015, (excluding match-funded transactions) was approximately ten years.
The following is an analysis of our Portfolio by type of obligor and credit quality as of December 31, 2015:
Investment Grade CommercialNon-
InvestmentGrade (3)
Subtotal,Debt and
RealEstate
EquityMethod
Investments (4) TotalGovernment (1)
CommercialInvestmentGrade (2)
(dollars in millions)
Financing receivables $401 $383 $— $ 784 $— $ 784Financing receivables held-for-sale 60 — — 60 — 60Investments — 16 13 29 — 29Real estate (5) — 156 — 156 — 156Equity method investments — — — — 319 319
Total $461 $555 $ 13 $1,029 $319 $1,348
% of Debt and Real Estate Portfolio 45% 54% 1% 100% N/A N/AAverage Remaining Balance (6) $ 12 $ 9 $ 13 $ 10 $ 27 $ 12
(1) Transactions where the ultimate obligor is the U.S. federal government or state or local governments wherethe obligors are rated investment grade (either by an independent rating agency or based upon our internalcredit analysis). This amount includes $297 million of U.S. federal government transactions and $164million of transactions where the ultimate obligors are state or local governments. Transactions may haveguaranties of energy savings from third party service providers, the majority of which are entities ratedinvestment grade by an independent rating agency.
(2) Transactions where the projects or the ultimate obligors are commercial entities, including institutions suchas hospitals or universities, that have been rated investment grade (either by an independent rating agency orbased on our internal credit analysis). Of this total, $12 million of the transactions have been ratedinvestment grade by an independent rating agency. Commercial investment grade financing receivablesinclude $175 million of internally rated residential solar loans where the cash flows which support ourfinancing receivables are subordinated to the tax equity investors (whose return is largely derived from therenewable energy tax incentives) and for which we rely on certain tax related indemnities of the publiclytraded residential solar provider.
(3) Transactions where the projects or the ultimate obligors are commercial entities, including institutions suchas hospitals or universities, that have ratings below investment grade (either by an independent ratingagency or using our internal credit analysis).
(4) Consists of ownership interests in operating wind projects in which we earn a preferred return.(5) Includes the real estate and the lease intangible assets through which we receive scheduled lease payments,
typically under long-term triple net lease agreements.(6) Excludes 77 transactions each with outstanding balances that are less than $1 million and that in the
aggregate total $26 million.
- 72 -

The table below provides details on the interest rate and maturity of our financing receivables andinvestments as of December 31, 2015:
Balance inMillions Maturity
Floating-rate financing receivable, interest rateof 5.78% per annum $ 73 2020
Fixed-rate financing receivables, interest ratesfrom 1.52% to 5.00% per annum 341 2017 to 2039
Fixed-rate financing receivables, interest ratesfrom 5.01% to 6.50% per annum 179 2017 to 2038
Fixed-rate financing receivables, interest ratesfrom 6.51% to 9.62% per annum 191 2018 to 2069
Financing receivables 784Allowance for credit losses —
Financing receivables, net of allowance 784Financing receivables held-for-sale, interest rate of
3.19% to 3.99% per annum 60 2026 to 2031Fixed-rate investment in debt securities, interest rates
of 4.25% to 5.89% per annum 29 2017 to 2035
Total Financing Receivables and Investments $873
The table below presents, for each major category of our Portfolio and the related interest-bearing liabilities,the average outstanding balances, investment income earned, the interest expense incurred, and average yield orcost. Our earnings from our equity method investments are not included in Total Revenue and thus we haveexcluded our equity method investments and the related earnings and interest expenses from these calculations.Our net investment margin represents the difference between the interest, investment and rental incomegenerated by our Portfolio and the interest expense, divided by our Portfolio balance.
Years Ended December 31,
2015 2014 2013
(In millions except for interest rate data)
Interest Income, Financing receivables $ 37 $ 23 $ 15Average monthly balance of financing receivables (1) $703 $430 $272Average interest rate from financing receivables 5.3% 5.4% 5.7%Interest Income, Investments $ 2 $ 4 $ 2Average monthly balance of investments $ 28 $ 67 $ 34Average interest rate from investments 5.3% 5.7% 5.6%Rental Income $ 9 $ 3 $—Average monthly balance of real estate $140 $ 50 $—Average yield on real estate 6.5% 6.3% —Average monthly balance of Portfolio $871 $547 $306Average yield from Portfolio 5.5% 5.5% 5.7%Investment interest expense (2) $ (20) $ (15) $ (10)Average monthly balance of debt (2) $571 $381 $229Average interest rate from debt (2) 3.4% 4.0% 4.3%Average interest spread (2) 2.1% 1.5% 1.4%Net investment margin (2) 3.3% 2.7% 2.5%
(1) Excludes the allowance for credit losses of $1.2 million and $11.0 million as of December 31, 2014 and2013, respectively.
(2) Excludes the nonrecourse debt used to finance the equity investments in the wind projects because ourearnings from the equity investments in the wind projects are not included in investment revenue.
- 73 -

The following table provides a summary of our anticipated principal repayments for our financingreceivables and investments as of December 31, 2015:
Payment due by Period
TotalLess than
1 year 1-5 years 5-10 yearsMore than10 years
(dollars in millions)
Financing Receivables (1) $784 $31 $212 $192 $349Investments $ 29 $ 1 $ 17 $ 4 $ 7
(1) Financing receivables does not include financing receivables held-for-sale of $60 million.
For the anticipated maturity dates of our financing receivables and investments and the weighted averageyield for each range of maturities as of December 31, 2015, see Note 6 of our audited financial statements in thisForm 10-K.
For information on the term of our leases and a schedule of our future minimum rental income under ourland lease agreements as of December 31, 2015, see Note 6 of our audited financial statements in thisForm 10-K.
For information on our residual assets relating to our securitization trusts, see Note 5 of our audited financialstatements in this Form 10-K. The residual assets do not have a contractual maturity date and the underlyingsecuritized assets have contractual maturity dates ranging from 2016 to 2038.
Our non-investment grade rated commercial obligations as of December 31, 2015, include $13 million outof approximately $58 million in senior secured debt securities in an operating wind project with a long-termpower purchase agreement with the remaining portion owned by a large financial institution (the “Majority DebtHolder”). As previously discussed in our 2014 Annual Report on Form 10-K, our Form 10-Qs for the quartersended March 31, 2015, June 30, 2015 and September 30, 2015 and our Form 8-K dated October 13, 2015,although all interest and principal payments under these securities have been timely made, the trustee under theindenture for these securities determined that events of default arose under the indenture due to the termination ofa tax credit agreement among project participants caused by a change of control in the parent company that ownsthe project and from the borrower’s failure during separate intervals in 2015 to deliver sufficient funds to fundprincipal payments or to fund reserves allocated for future principal and interest payments under the indenture.As a result, approximately $1.1 million of the approximately $5.5 million debt service reserve for this projectwas used to fund the May 2015 principal payment and the borrower used an additional approximately $2.0million out of this reserve to fund the payments made in early November 2015. On November 3, 2015, as a resultof these defaults, the trustee, as directed by the Majority Debt Holder, provided a notice of acceleration andproposal of foreclosure relating to the outstanding debt securities. The project owner has agreed to theforeclosure proposal pending required regulatory approvals which are pending. The Majority Debt Holder is inthe process of selling the project to a third party wind operator. Although there can be no assurances in thisregard, we expect that the sales price would be sufficient to repay in full the remaining amounts due under thebonds and that the project sale to be completed in the first half of 2016. Based on our evaluation of our cash flowmodel for, and other aspects of, the project as well as the expected sales price, we have concluded that the debtsecurities were not impaired as of December 31, 2015.
We had no financing receivables, investments or leases on nonaccrual status as of December 31, 2015. Weevaluate any modifications to our financing receivables in accordance with the guidance in ASC 310,Receivables. We evaluate modifications of financing receivables to determine if the modification is more thanminor, whereby any related fees, such as prepayment fees, would be recognized as income at the time of themodification. We did not have any loan modifications that qualify as trouble debt restructurings for the yearsended December 31, 2015, 2014 or 2013.
- 74 -

Comparison of the Year Ended December 31, 2015 to the Year Ended December 31, 2014
Years endedDecember 31
$ Change % Change2015 2014
(dollars in millions)
Net Investment Revenue:Interest Income, Financing receivables $ 37 $ 23 $ 14 61%Interest Income, Investments 2 4 (2) (50%)Rental Income 9 3 6 200%Gain on sale of receivables and investments 9 13 (4) (31%)Fee income 2 2 (0) — %
Total Revenue 59 45 14 31%Investment interest expense (27) (16) (11) (69%)Provision for credit losses — — — — %
Total Revenue, net of investment interest expense andprovision 32 29 3 10%
Compensation and benefits (17) (11) (6) (55%)General and administrative (6) (6) (0) — %Acquisition costs — (2) 2 100%Other, net (1) (0) (1) NM(Loss) from equity method investments in affiliates (0) — (0) NM
Other Expenses, net (24) (19) (5) (26%)
Net Income (Loss) before income tax 8 10 (2) (20%)Income tax (expense) benefit (0) (0) (0) NM
Net Income (Loss) $ 8 $ 10 $ (2) (20%)
NM—Percentage change is not meaningful.
Net Income
Net income decreased by $2 million to $8 million for the year ended December 31, 2015, compared to $10million for the same period in 2014. A $3 million increase in in total revenue, net of investment interest expenseand provision was offset by a $5 million increase in other expenses in the year ended December 31, 2015.
Our equity method investment in the wind projects had a significant impact on the changes in our operatingresults during the year ended December 31, 2015, when compared to the same period in 2014. For the year endedDecember 31, 2015, we recorded investment interest expense of $7 million related to the financing of ourinvestment in the wind projects as compared on $2 million in 2014 and recorded an equity method loss related tothose investments of $0 million in both periods. These results do not include the Non-GAAP Core Earningsadjustment related to recognizing income based on the effective interest methodology in order to treat thisinvestment in a manner similar to our other investments, which is discussed in the Non-GAAP FinancialMeasures section below.
Total Revenue
Total revenue increased to $59 million for the year ended December 31, 2015, from $45 million in the sameperiod in 2014. The increase was driven primarily by an increase in the average size of our Portfolio of assetsheld during the year ended December 31, 2015, when compared to the same period in 2014. The monthly averagePortfolio balance increased to approximately $0.9 billion in the year ended December 31, 2015, fromapproximately $0.5 billion in the same period in 2014. This increase in our Portfolio was driven largely by
- 75 -

additional investments in financing receivables, leading to an increase in our average monthly portfolio offinancing receivables and investments of over $230 million for the year ended December 31, 2015, comparedwith the same period in 2014. In addition, the acquisition of our real estate investments beginning in May 2014contributed approximately $140 million to the average monthly balance of our Portfolio and $9 million in rentalrevenue in the year ended December 31, 2015, as compared to contributing $50 million to the average monthlybalance of real estate and $3 million in rental revenue for the year ended December 31, 2014. The increase fromour Portfolio was offset by a $4 million decrease in gain on sale of receivables and investments for the yearended December 31, 2015, primarily as a result of fewer transactions and a lower margin on the sale ofinvestments in the year ended December 31, 2015 when compared to same period in 2014.
Total Revenue, Net of Investment Interest Expense and Provision
Total revenue, net of investment interest expense and provision increased by $3 million for the year endedDecember 31, 2015 from $29 million for the year ended December 31, 2014. The increase in total revenuedescribed above was offset by an $11 million increase in investment interest expense for the year endedDecember 31, 2015 when compared to the same period ended in 2014. As we have increased our leverage, themonthly average debt balance, excluding the nonrecourse secured borrowings used to finance the equityinvestments in the wind projects, increased in the year ended December 31, 2015 to approximately $571 millioncompared to approximately $381 million during the year ended December 31, 2014. Our average debt rate onthese borrowings decreased to 3.4% during the year ended December 31, 2015, from 4.0% during the sameperiod in 2014 due primarily to holding a higher average balance in the credit facility in 2015. The higheraverage monthly debt balance increased our investment interest expense by $5 million. The remaining increase inour investment interest expense is primarily related to the nonrecourse secured borrowings used to finance ourequity method investments in wind projects.
Other Expenses, Net
Other expenses, net increased by $5 million primarily as a result of higher compensation and benefits costsof $6 million driven by higher equity based compensation expenses in the year ended December 31, 2015 of $5million when compared to same period in 2014 and a $1 million change in other. Equity based compensationexpense is calculated based upon actual and expected achievement of certain performance targets and or service-based vesting periods that may consist of multi-year periods. The 2015 equity based compensation expenseincludes expenses for awards granted in 2013, 2014 and 2015 that have performance periods and service-basedvesting terms in 2015 and beyond. There were no business combination related acquisition costs in 2015 whencompared to $2 million of costs incurred in 2014 related to our real estate acquisitions.
- 76 -

Comparison of the Year Ended December 31, 2014 to the Year Ended December 31, 2013 (1)
Years endedDecember 31
2014 2013 $ Change % Change
(dollars in millions)
Net Investment Revenue:Interest Income, Financing receivables $ 23 $ 15 $ 8 53%Interest Income, Investments 4 2 2 100%Rental Income 3 — 3 NMGain on sale of receivables and investments 13 6 7 117%Fee income 2 1 1 100%
Total Revenue 45 24 21 88%Investment interest expense (16) (10) (6) (60%)Provision for credit losses — (11) 11 100%
Total Revenue, net of investment interest expense andprovision 29 3 26 867%
Compensation and benefits (11) (12) 1 8%General and administrative (6) (4) (2) (50%)Acquisition costs (2) — (2) NMOther, net (0) (0) 0 NM
Other Expenses, net (19) (16) (3) (19%)
Net Income (Loss) before income tax 10 (13) 23 177%Income tax (expense) benefit 0 0 (0) NM
Net Income (Loss) $ 10 $ (13) $23 177%
(1) Year ended December 31, 2103 includes results of our Predecessor prior to our IPO. See Part 1 of this10-K for further information.
NM—Percentage change is not meaningful.
Net Income
Net income increased by $23 million to $10 million for the year ended December 31, 2014, compared to aloss of $13 million for the same period in 2013. This increase was primarily the result of a $26 million increasein total revenue, net of investment interest expense and provision that was driven primarily by the increase in thesize of our Portfolio including our new investments in real estate that drove the increase in rental income, anincrease in our securitization transactions and sale of investments when comparing the year ended December 31,2014 to the same period in 2013, and the $11 million provision for credit losses in the year ended December 31,2013. In addition, other expenses, net increased by $3 million due primarily to acquisitions costs of $2 millionand a $2 million net increase in general and administrative expenses and other resulting from higher legal,consulting and accounting costs associated with being a public company, offset by a $1 million decrease incompensation and benefits as a result of lower equity-based compensation, during the year ended December 31,2014, compared to the same period in 2013.
Our equity method investment in the wind projects had a significant impact on the changes in our operatingresults during the year ended December 31, 2014, when compared to the same period in 2013. For the year endedDecember 31, 2014, we recorded investment interest expense of $2 million related to the financing of ourinvestment in the wind projects. We did not have our equity method investments in 2013. These results do notinclude the Non-GAAP Core Earnings adjustment related to recognizing income based on the effective interestmethodology in order to treat this investment in a manner similar to our other investments, which is discussed inthe Non-GAAP Financial Measures section below.
- 77 -

Total Revenue
Total revenue increased to $45 million for the year ended December 31, 2014, from $24 million in the sameperiod in 2013. The increase was driven primarily by an increase in the average size of our Portfolio of assetsheld during the year ended December 31, 2014, when compared to the same period in 2013. The monthly averagePortfolio balance increased to approximately $547 million in the year ended December 31, 2014, fromapproximately $306 million in the same period in 2013. This increase in our Portfolio was driven by our strategyto hold more originated transactions on our balance sheet to increase our shareholders’ value. The increase in ourPortfolio was partially offset by a decline in average interest rates earned on these assets, which decreased to5.5% in the year ended December 31, 2014, from 5.7% in the same period in 2013. This decrease was drivenprimarily by the impact of the current lower interest rate environment as compared to the historical rateenvironment when our legacy portfolio was originated. Our larger Portfolio, partially offset by lower interestrates, generated a $13 million increase in interest and rental income.
Gain on sale of receivables and investments increased by $7 million for the year ended December 31, 2014,when compared to the year ended December 31, 2013. The increase was the result of higher transaction volumein 2014 when compared to 2013. Fee income in 2014 also increased by $1 million primarily as a result of anincrease in the value of syndication fee transactions closed in the year ended December 31, 2014 when comparedto such transactions closed in the same period in 2013.
Total Revenue, Net of Investment Interest Expense and Provision
Total revenue, net of investment interest expense and provision increased by $26 million to $29 million forthe year ended December 31, 2014, compared to $3 million for the same period in 2013. This increase wasprimarily a result of the $21 million increase in total revenue as described above. Additionally, there was noprovision for credit loss recorded in the year ended December 31, 2014, while a provision for credit loss of $11million relating to a mezzanine debt investment in a geothermal project was recorded in the year endedDecember 31, 2013.
These increases were offset by an increase in investment interest expense of $6 million in the year endedDecember 31, 2014, compared to the same period in 2013. We used our existing credit facility and ournonrecourse debt to finance the majority of the growth in our Portfolio as the monthly average debt balanceincreased in the year ended December 31, 2014, to approximately $381 million compared to approximately $229million during the same period in 2013. This increase in our monthly average debt balance was the primarydriver for the increase in our investment interest expense when comparing the year ended December 31, 2014, tothe same period ended December 31, 2013. Our average debt rate decreased to 4.0% during the year endedDecember 31, 2014, from 4.3% for the same period ending December 31, 2013, due to the lower interest rates onour credit facility and our asset backed debt as compared to our historical match funded other nonrecourse debt.In addition, our investment interest expense increased by approximately $2 million when comparing the yearended December 31, 2014, to the same period ended December 31, 2013 as a result the issuance of nonrecoursedebt of $115 million used to fund our equity method investment in the wind projects.
Other Expenses, Net
Other expenses, net increased by $3 million to $19 million in the year ended December 31, 2014, comparedto $16 million in the same period in 2013, primarily as a result of acquisition costs of $2 million related to the2014 business combinations including the AWCC transaction and other smaller real estate acquisitions andhigher general and administrative expenses and other of $2 million due to an increase in legal and professionalfees related to being a public company. These increases were offset by lower compensation and benefits costs of$1 million driven by the one-time IPO related equity-based compensation expense charge in 2013 of $6 million,which was partially offset by higher equity-based compensation and staff expenses of $5 million in 2014 whencompared to 2013 excluding the one-time IPO related charge.
- 78 -
Non-GAAP Financial Measures
We consider the following non-GAAP financial measures useful to investors as key supplemental measuresof our performance: (1) core earnings, (2) managed assets and (3) investment income from managed assets.These non-GAAP financial measures should be considered along with, but not as alternatives to, net income orloss as measures of our operating performance. These non-GAAP financial measures, as calculated by us, maynot be comparable to similarly named financial measures as reported by other companies that do not define suchterms exactly as we define such terms.
Core Earnings
We calculate Core Earnings as U.S. GAAP net income excluding non-cash equity compensation expense,non-cash provision for credit losses, amortization of intangibles, one-time acquisition related costs, if any andany non-cash tax charges. We also make an adjustment to account for our equity method investment in the windprojects on an effective interest method as described below. In the future, Core Earnings may also exclude one-time events pursuant to changes in U.S. GAAP and certain other non-cash charges as approved by a majority ofour independent directors.
Our equity method investments in the wind projects are structured using typical wind partnership “flip”structures where we, along with other institutional investors, if any, receive a pre-negotiated preferred returnconsisting of priority distributions from the project cash flows along with tax attributes. Once this preferredreturn is achieved, the partnership flips and the wind energy company, which operates the project, receives themajority of the cash flows through its equity interests with the institutional investors retaining an ongoingresidual interest. Given this structure, we negotiated our purchase price of our wind investments based on ourassessment of the expected cash flows from each investment discounted back to net present value based on adiscount rate that represented an expected yield on the investment. This is similar to how we value the expectedcash flows in financing receivables. Under U.S. GAAP, we are required to account for these investments utilizingthe hypothetical liquidation at book value method (“HLBV”), in which we recognize income or loss based on thechange in the amount each partner would receive if the assets were liquidated at book value, in this case, at theend of the immediately preceding quarter after adjusting for any distributions or contributions made during suchquarter. As HLBV incorporates non-cash items, such as depreciation, and because we are entitled to receive apreferred return of cash flows on our investments independent of how profits and losses are allocated, the HLBVallocation does not, in our opinion, reflect the economics of our investments. As a result, and in an attempt totreat these investments in a manner similar to our other investments and our initial valuation, in calculating ourCore Earnings for the above periods, we adjusted the income we receive from these investments as if we wererecognizing income or loss based on an effective interest methodology. Generally, under this methodologyincome is recognized over the life of the asset using a constant effective yield. The initial constant effective yieldwe selected is equal to the discount rates we used in making our investment decisions. On at least a quarterlybasis, we will review and, if appropriate, adjust the discount rates and the income or loss we receive from theseinvestments for purposes of calculating our Core Earnings in future periods, as necessary, to reflect changes inboth actual cash flows received and our estimates of the future cash flows from the projects. Our allocation ofprofits and losses in our JPMorgan transactions is projected to change in 2019, which is expected to result in anincrease of the amount of HLBV profits or losses allocated to us. In June 2015, JPMorgan and one of the projectholding companies entered into an agreement regarding the treatment of certain tax matters that had the impact ofreducing our expected future cash flows from that holding company. As a result of this agreement, JPMorganpaid us approximately $3 million, which effectively reduced our investment in that entity. In accordance with themethodology described above, we have calculated a new constant effective yield based upon the reducedinvestment amount and the reduction in expected future cash flows. We used this new effective yield, which isnot materially different from our initial constant effective yield, beginning with the quarter ended September 30,2015.
We have approximately $234 million of nonrecourse borrowings outstanding as of December 31, 2015,using our equity method investments as collateral. Included in our U.S. GAAP investment interest expense for
- 79 -
the year ended December 31, 2015, was approximately $7 million of interest expense related to thesenonrecourse loans. For the year ended December 31, 2015, we collected cash distributions from our windinvestments of approximately $25 million (in addition to the $3 million payment), of which $13 millionrepresents our Core Earnings adjustment for these investments based upon the effective yield methodologydiscussed above.
We believe that Core Earnings provides an additional measure of our core operating performance byeliminating the impact of certain non-cash expenses and facilitating a comparison of our financial results to thoseof other comparable REITs with fewer or no non-cash charges and comparison of our own operating results fromperiod to period. Our management uses Core Earnings in this way. We believe that our investors also use CoreEarnings, or a comparable supplemental performance measure, to evaluate and compare our performance to thatof our peers, and as such, we believe that the disclosure of Core Earnings is useful to (and expected by) ourinvestors.
However, Core Earnings does not represent cash generated from operating activities in accordance with U.S.GAAP and should not be considered as an alternative to net income (determined in accordance with U.S. GAAP),or an indication of our cash flow from operating activities (determined in accordance with U.S. GAAP), ameasure of our liquidity, or an indication of funds available to fund our cash needs, including our ability to makecash distributions. In addition, our methodology for calculating Core Earnings may differ from themethodologies employed by other REITs to calculate the same or similar supplemental performance measures,and accordingly, our reported Core Earnings may not be comparable to the core earnings reported by otherREITs.
We have calculated our Core Earnings for the years ended December 31, 2015, 2014 and 2013. The tablebelow provides a reconciliation of our U.S. GAAP net income to Core Earnings:
For the Years Ended December 31,
2015 2014 2013
$ Per Share $ Per Share $ Per Share
(in thousands, except per share amounts)
Net income (loss) attributable to controllingshareholders $ 7,958 $0.21 $ 9,607 $0.43 $(10,459) $(0.68)
Core Earnings AdjustmentsEquity method investment in Wind
Projects 13,405 2,376 —Non-cash equity-based compensation
charge 10,641 5,187 7,079Business combination acquisition costs — 2,456 —Amortization of real estate intangibles 1,179 276 —Amortization of other intangibles 203 203 265Non-cash provision (benefit) for taxes 46 9 (251)Current year earnings attributable to
minority interest 76 163 (2,175)Non-cash provision for credit losses — — 11,000Pre-IPO losses attributable to minority
interest (2) — — 1,880
Core Earnings (1) $33,508 $1.04 $20,277 $0.93 $ 7,339 $ 0.43
(1) Core Earnings per share is based on 32,310,395, 21,870,184 and 16,886,041 shares for the years endedDecember 31, 2015, 2014 and 2013, respectively, which represents the weighted average number of fully-diluted shares outstanding including participating securities and the minority interest in our OperatingPartnership.
(2) Excludes amount allocated to Predecessor’s members prior to the IPO.
- 80 -
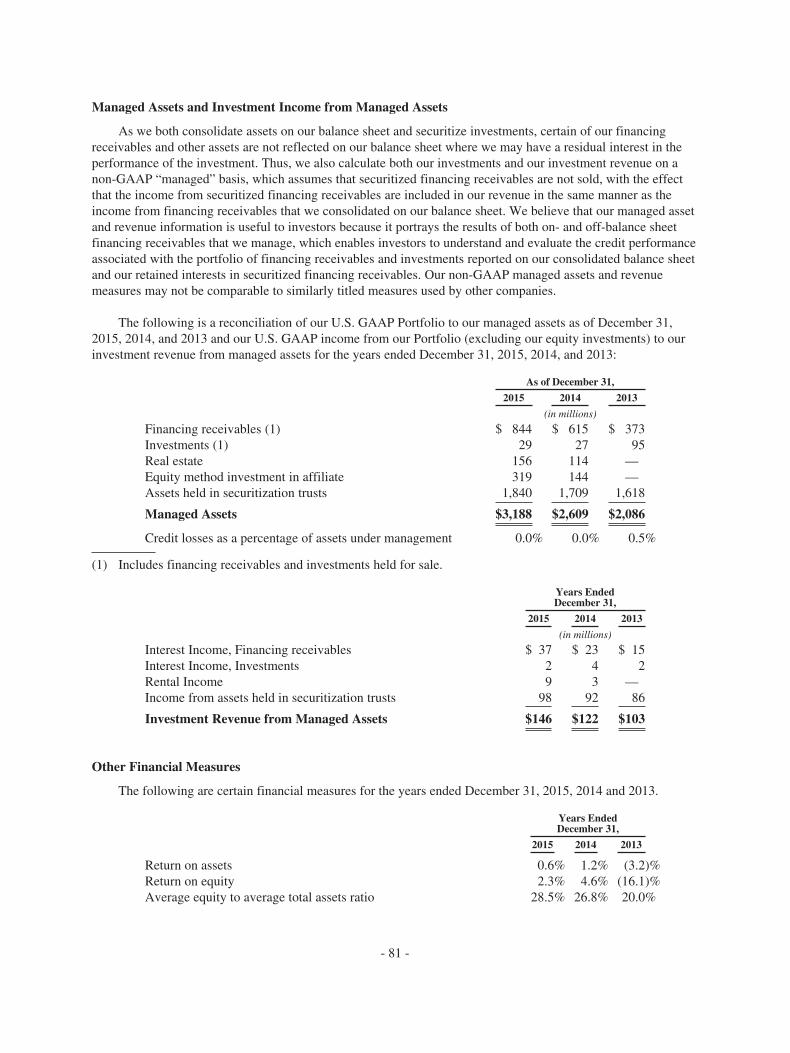
Managed Assets and Investment Income from Managed Assets
As we both consolidate assets on our balance sheet and securitize investments, certain of our financingreceivables and other assets are not reflected on our balance sheet where we may have a residual interest in theperformance of the investment. Thus, we also calculate both our investments and our investment revenue on anon-GAAP “managed” basis, which assumes that securitized financing receivables are not sold, with the effectthat the income from securitized financing receivables are included in our revenue in the same manner as theincome from financing receivables that we consolidated on our balance sheet. We believe that our managed assetand revenue information is useful to investors because it portrays the results of both on- and off-balance sheetfinancing receivables that we manage, which enables investors to understand and evaluate the credit performanceassociated with the portfolio of financing receivables and investments reported on our consolidated balance sheetand our retained interests in securitized financing receivables. Our non-GAAP managed assets and revenuemeasures may not be comparable to similarly titled measures used by other companies.
The following is a reconciliation of our U.S. GAAP Portfolio to our managed assets as of December 31,2015, 2014, and 2013 and our U.S. GAAP income from our Portfolio (excluding our equity investments) to ourinvestment revenue from managed assets for the years ended December 31, 2015, 2014, and 2013:
As of December 31,
2015 2014 2013
(in millions)
Financing receivables (1) $ 844 $ 615 $ 373Investments (1) 29 27 95Real estate 156 114 —Equity method investment in affiliate 319 144 —Assets held in securitization trusts 1,840 1,709 1,618
Managed Assets $3,188 $2,609 $2,086
Credit losses as a percentage of assets under management 0.0% 0.0% 0.5%
(1) Includes financing receivables and investments held for sale.
Years EndedDecember 31,
2015 2014 2013
(in millions)
Interest Income, Financing receivables $ 37 $ 23 $ 15Interest Income, Investments 2 4 2Rental Income 9 3 —Income from assets held in securitization trusts 98 92 86
Investment Revenue from Managed Assets $146 $122 $103
Other Financial Measures
The following are certain financial measures for the years ended December 31, 2015, 2014 and 2013.
Years EndedDecember 31,
2015 2014 2013
Return on assets 0.6% 1.2% (3.2)%Return on equity 2.3% 4.6% (16.1)%Average equity to average total assets ratio 28.5% 26.8% 20.0%
- 81 -

Liquidity and Capital Resources
Liquidity is a measure of our ability to meet potential short-term (within one year) and long-term cashrequirements, including ongoing commitments to repay borrowings, fund and maintain our current and futureassets, make distributions to our stockholders and other general business needs. We will use significant cash tomake debt and equity investments, repay principal and interest on our borrowings, make distributions to ourstockholders and fund our operations.
We use borrowings as part of our financing strategy to increase potential returns to our stockholders andhave available to us a broad range of financing sources. In July 2013, we entered into a $350 million seniorsecured revolving credit facility with maximum total advances of $700 million. Since that time, we have enteredinto a number of amendments intended to increase the flexibility and borrowing capability under the creditfacility and to extend the maturity date. The facility has been increased to $500 million with maximum totaladvances of $1.5 billion and the facility was extended an additional year and matures in July 2019.
In addition, we have completed approximately $610 million of nonrecourse borrowings since April 2013,including approximately $395 million in 2015. We have worked to expand our liquidity and access to the debtand bank loan markets and in 2015, entered into borrowing relationships with three new lenders and with severalinstitutional investors through our $101 million issuance of HASI Sustainable Yield Bonds in 2015. We believethat our 2013 financing was one of the first asset-backed securitizations that provided details on GHG saved bythe technologies that secured the financing. We believe that investors will increasingly be interested in debtinvestments that have a measurable GHG savings.
Prior to our IPO, we financed our business primarily through fixed rate nonrecourse debt where the debt wasmatch-funded with corresponding fixed rate yielding assets and through the use of non-consolidatedsecuritizations. In our securitization transactions, we transfer the loans or other assets we originate tosecuritization trusts or other bankruptcy remote special purpose funding vehicles. Large institutional investors,primarily insurance companies and commercial banks, have provided the financing needed for these assets bypurchasing the notes issued by the funding vehicle.
We continue to use both of these funding sources and, as of December 31, 2015, had outstandingapproximately $101 million of this match funded debt, all of which was consolidated on our balance sheet and isreferred to as Other nonrecourse debt in our balance sheet. As of December 31, 2015, the outstanding principalbalance of our assets financed through the use of securitizations which are not consolidated on our balance sheetwas approximately $1.8 billion. For further information on the credit facility, asset backed nonrecourse notes,securitizations and our nonrecourse match funded debt, see Note 5, 7 and Note 8 of our audited financialstatements included in this Form 10-K.
We plan to use other fixed and floating rate borrowings in the form of additional bank credit facilities(including term loans and revolving facilities), warehouse facilities, repurchase agreements and public andprivate equity and debt issuances, including match funded arrangements, as a means of financing our business.We also expect to use both on-balance sheet and non-consolidated securitizations and also believe we will beable to customize securitized tranches to meet investment preferences of different investors. We may alsoconsider the use of separately funded special purpose entities or funds to allow us to expand the investments thatwe make.
The decision on how we finance specific assets or groups of assets is largely driven by capital allocationsand risk and portfolio management considerations, as well as the overall interest rate environment, prevailingcredit spreads and the terms of available financing and market conditions. Over time, as market conditionschange, we may use other forms of leverage in addition to these financings arrangements.
- 82 -

We may continue to raise funds through capital market transactions by issuing capital stock. We have raisednet proceeds of approximately $470 million including $181 million in two follow on public offerings completedin 2015. See Note 11 of the audited financial statements in this Form 10-K for a summary of our public offeringsof common stock.
In August 2014, we filed a registration statement with the SEC registering the possible offering and sale ofup to $500 million of any combination of our common stock, preferred stock, depositary shares and warrants andrights (collectively referred to as the “securities.”) that has been declared effective by the SEC. We may offer thesecurities directly, through agents, or to or through underwriters. Sales of the securities may be made by meansof ordinary brokers’ transactions on the NYSE or otherwise at market prices prevailing at the time of sale or atnegotiated prices. The specific terms of the securities offering and the names of any underwriters involved in thesale of the securities will be set forth in the applicable prospectus supplement.
Although we are not restricted by any regulatory requirements to maintain our leverage ratio at or below anyparticular level, the amount of leverage we may deploy for particular assets will depend upon the availability ofparticular types of financing and our assessment of the credit, liquidity, price volatility and other risks of thoseassets, the interest rate environment and the credit quality of our financing counterparties. In March 2015, weincreased our leverage target to 2.5 to 1 from less than 2.0 to 1. Our debt to equity ratio was approximately 2.1 to1 as of December 31, 2015. We also have increased the percentage of fixed rate debt from zero at the IPO toapproximately 71% as of December 31, 2015, or slightly above our targeted fixed rate debt percentage range ofapproximately 50% to 70%. In order to simplify these calculations, we have begun to use, effective February2016, the total debt on our balance sheet, including our credit facility, nonrecourse securitization debt and othernonrecourse match funded debt. Historically, we excluded the other nonrecourse match funded debt, which as ofDecember 31, 2015, was $101 million, and if such debt would have been excluded, the debt to equity ratio wouldhave been 1.9 to 1 and the fixed rate debt percentage was 68%. We continue to calculate both of these ratiosexclusive of securitizations that are not consolidated on our balance sheet (where the collateral is typicallyborrowings with U.S. government obligors) and for the purposes of the fixed rate debt target, we include as fixedrate debt, the present notional value hedged by interest rate swaps.
We intend to use leverage for the primary purpose of financing our portfolio and business activities and notfor the purpose of speculating on changes in interest rates. While we may temporarily exceed the leverage target,if our board of directors approves a material change to our leverage target, we anticipate advising ourstockholders of this change through disclosure in our periodic reports and other filings under the Exchange Act.
While we generally intend to hold our target assets that we do not securitize upon acquisition as long-terminvestments, certain of our investments may be sold in order to manage our interest rate risk and liquidity needs,to meet other operating objectives and to adapt to market conditions. The timing and impact of future sales offinancings, if any, cannot be predicted with any certainty. Since we expect that our assets will generally befinanced, we expect that a significant portion of the proceeds from sales of our assets (if any), prepayments andscheduled amortization will be used to repay balances under our financing sources.
We believe these identified sources of liquidity will be adequate for purposes of meeting our short-term andlong-term liquidity needs, which include funding future investments, operating costs and distributions to ourstockholders. To qualify as a REIT, we must distribute annually at least 90% of our REIT’s taxable incomewithout regard to the deduction for dividends paid and excluding net capital gains. These dividend requirementslimit our ability to retain earnings and thereby replenish or increase capital for growth and our operations.
Sources and Uses of Cash
We had approximately $43 million and $58 million of unrestricted cash and cash equivalents as ofDecember 31, 2015 and 2014, respectively.
- 83 -

Cash Flows Relating to Operating Activities
Net cash provided by operating activities was approximately $19 million for the year ended December 31,2015, driven primarily by net income of $8 million, impact from the sale of financing receivables (including thechange in financing receivables held-for-sale) and investments of $4 million, and adjustments for noncash itemsof $15 million, consisting primarily of equity-based compensation and depreciation and amortization. This wasoffset by changes in accounts payable and accrued expenses and other of $8 million.
Net cash provided by operating activities was approximately $5 million for the year ended December 31,2014, driven by net income of $10 million and $8 million of non-cash items, consisting primarily of equity-basedcompensation and amortization of deferred financing fees. This was offset by gain on sales of financingreceivables and investments of $7 million for which the proceeds from these sales are included in cash flowsfrom investing activities. This was further offset by cash used to pay accounts payable and accrued expenses andother of $6 million.
Net cash used in operating activities was approximately $11 million for the year ended December 31, 2013,driven primarily by operating cash flows used to acquire the financing receivables held-for-sale of $16 millionand the net loss of $13 million, partially offset by the non-cash provision for credit losses of $11 million relatedto the impairment of a mezzanine debt investment in a geothermal project and non-cash equity-basedcompensation expense of $7 million, which includes a one-time charge of $6 million relating to the reallocationbetween the owners and employees of the equity interest of the Predecessor as part of our IPO and formationtransactions.
Cash Flows Relating to Investing Activities
Net cash used in investing activities was approximately $361 million for the year ended December 31, 2015.We used $324 million to purchase financing receivables and investments, $43 million to purchase real estate, andnet cash of $200 million for additional wind equity investments. We set aside $12 million of restricted cash. Wecollected cash from principal payments on our financing receivables and investments of $79 million. In addition,we received $114 million from the sale of financing receivables and investments and cash distributions from ourinvestment in our wind projects of $25 million.
Net cash used in investing activities was approximately $319 million for the year ended December 31, 2014.We added to our Portfolio of investments $154 million in real estate assets, including the real estate businessacquisitions in 2014 and subsequent purchases of real estate, and $144 million in an equity method investment.In addition, we invested $235 million in the purchase of financing receivables and investments. Theseinvestments in our Portfolio were partially offset by sales of financing receivables and investments and principalcollections of $106 million and $70 million, respectively. In addition, we released $38 million of restricted cashduring the year ended December 31, 2014.
Net cash used in investing activities was approximately $229 million for the year ended December 31, 2013.Cash of $156 million and $92 million were used to acquire financing receivables and investments, respectively,and $50 million was set-aside in restricted cash to be used to pay for future funding obligations associated withthe new investments. These cash outlays were offset by $69 million of principal collections on financingreceivables held on our balance sheet.
Cash Flows Relating to Financing Activities
Net cash provided by financing activities was approximately $327 million for the year ended December 31,2015. This includes credit facility and nonrecourse debt borrowings of $714 million and net proceeds of $181million from the sale of our common stock. These cash inflows were partially offset by payments to reduce our
- 84 -

borrowings under the credit facility, deferred funding obligations, and nonrecourse debts totaling $506 million,the payment of dividends and distributions to our stockholders and OP unit holders of $32 million, a change inother cash outflows of $30 million.
Net cash provided by financing activities was approximately $340 million for the year ended December 31,2014. This includes cash of $311 million provided from borrowings under our credit facility to fund our Portfoliogrowth, $115 million provided from nonrecourse borrowings to fund our investment in the wind projects and$129 million of net proceeds from the sale of our common stock. These cash receipts were partially offset bypayments on our deferred funding obligations of $67 million, payments on our credit facility and nonrecoursedebt of $72 million and $56 million, respectively, dividends and distributions of $14 million and other cashoutflows of $6 million.
Net cash provided by financing activities was approximately $264 million for the year ended December 31,2013. Our IPO resulted in net proceeds of $160 million. Total borrowings were $260 million with borrowingsfrom the new credit facility of $131 million and nonrecourse borrowings of $129 million, including our newprivate placement of asset-backed nonrecourse notes of $100 million. Payments of $65 million and $58 millionwere made on nonrecourse debt and on the credit facilities, respectively, and $17 million was paid on deferredfunding obligations. Dividends and distributions were $7 million and $9 million was used on other cash outflows.
Contractual Obligations and Commitments
We lease office space at our headquarters in Annapolis, Maryland under an operating lease entered into inJuly 2011 and amended in October 2013 to add additional space. The lease provides for operating expensereimbursements and annual escalations that are amortized over the respective lease terms on a straight-line basis.Lease payments under this lease commenced in March 2012 and incremental payments related to the amendmentcommenced in March 2014.
The following table provides a summary of our contractual obligations as of December 31, 2015:
Payment due by Period
Contractual Obligations TotalLess than
1 year 1 – 3 Years 3 – 5 YearsMore than
5 years
(dollars in millions)
Long-Term Debt Obligations (1) $ 680 $ 48 $ 84 $268 $280Interest on Long-term Debt Obligations (1) 186 30 55 47 54Credit Facility 247 — — 247 —Interest on Credit Facility (2) 20 6 11 3 —Deferred Funding Obligations 108 93 15 — —Operating Lease Obligations 3 — 1 1 1
Total $1,244 $177 $166 $566 $335
(1) The Long-Term Debt Obligations are secured by the financing receivables that were financed with norecourse to our general assets and excludes the $16 million of debt issuance costs. Debt service, in themajority of the cases, is equal to or less than the financing receivables. Interest is calculated based on theinterest rate in effect at December 31, 2015 including the effect of interest rate hedges as applicable. Interestpaid on these obligations was $16 million and $10 million for the years ended December 31, 2015 and 2014,respectively.
(2) Interest is calculated based on the interest rate in effect at December 31, 2015, and includes all interestexpense incurred and expected to be incurred in the future based on the current principal balance through thecontractual maturity of the credit facility. Interest paid on the credit facility was $8 million and $3 millionfor the years ended December 31, 2015 and 2014, respectively
- 85 -

Off-Balance Sheet Arrangements
As described under “—Critical Accounting Policies and Use of Estimates,” we have relationships with non-consolidated entities or financial partnerships, such as entities often referred to as structured investment vehicles,or special purpose or variable interest entities, established to facilitate the sale of securitized assets. Other thanour securitization assets of approximately $9 million as of December 31, 2015, that may be at risk in the event ofdefaults in our securitization trusts, we have not guaranteed any obligations of nonconsolidated entities or enteredinto any commitment or intent to provide additional funding to any such entities. A more detailed description ofour relations with non-consolidated entities can be found in Note 2 of our audited financial statements includedin this Form 10-K.
Dividends
U.S. federal income tax law generally requires that a REIT distribute annually at least 90% of its REITtaxable income, without regard to the deduction for dividends paid and excluding net capital gains, and that it paytax at regular corporate rates to the extent that it annually distributes less than 100% of its REIT taxable income.Our current policy is to pay quarterly distributions, which on an annual basis will equal or exceed substantiallyall of our REIT taxable income. Any distributions we make will be at the discretion of our board of directors andwill depend upon, among other things, our actual results of operations. These results and our ability to paydistributions will be affected by various factors, including the net interest and other income from our portfolio,our operating expenses and any other expenditures. In the event that our board of directors determines to makedistributions in excess of the income or cash flow generated from our assets, we may make such distributionsfrom the proceeds of future offerings of equity or debt securities or other forms of debt financing or the sale ofassets. To the extent that in respect of any calendar year, cash available for distribution is less than our taxableincome, we could be required to sell assets or borrow funds to make cash distributions or make a portion of therequired distribution in the form of a taxable stock distribution or distribution of debt securities. We willgenerally not be required to make distributions with respect to activities conducted through our domestic TRS.
We anticipate that our distributions generally will be taxable as ordinary income to our stockholders,although a portion of the distributions may be designated by us as qualified dividend income or capital gain ormay constitute a return of capital. In addition, a portion of such distributions may be taxable stock dividendspayable in our shares. We will furnish annually to each of our stockholders a statement setting forth distributionspaid during the preceding year and their characterization as ordinary income, return of capital, qualified dividendincome or capital gain.
The dividends declared in 2014 and 2015 are described under Note 11 of the audited financial statements inthis Form 10-K.
Book Value Considerations
As of December 31, 2015, we carried only our investments available-for-sale, interest rate swaps andretained assets in securitized receivables at fair value on our balance sheet. As a result, in reviewing our bookvalue, there are a number of important factors and limitations to consider. Other than the approximately $29million in investments available-for-sale, approximately $1 million liability for interest rate swaps and the $9million in residual assets relating to our retained interests in securitized receivables that are on our balance sheetat fair value as of December 31, 2015, the carrying value of our remaining assets and liabilities are calculated asof a particular point in time, which is largely determined at the time such assets and liabilities were added to ourbalance sheet using a cost basis in accordance with U.S. GAAP. As such, our remaining assets and liabilities donot incorporate other factors that may have a significant impact on their value, most notably any impact ofbusiness activities, changes in estimates, or changes in general economic conditions or interest rates since thedates the assets or liabilities were initially recorded. Accordingly, our book value does not necessarily representan estimate of our net realizable value, liquidation value or our market value as a whole.
- 86 -
Inflation
We do not anticipate that inflation will have a significant effect on our results of operations. However, in theevent of a significant increase in inflation, interest rates could rise and our projects and investments may bematerially adversely affected.
Item 7A. Quantitative and Qualitative Disclosures About Market Risk.
We anticipate that our primary market risks will be related to commodity prices, the credit quality of ourcounterparties and project companies, market interest rates and the liquidity of our assets. We will seek tomanage these risks while, at the same time, seeking to provide an opportunity to stockholders to realize attractivereturns through ownership of our common stock.
Credit Risks
We source and identify quality opportunities within our broad areas of expertise and apply our rigorousunderwriting processes to our transactions, which, we believe, will generally enable us to minimize our creditlosses and keep financing costs low. While we do not anticipate facing significant credit risk in our financingsrelated to U.S. federal government energy efficiency projects, we are subject to varying degrees of credit risk inthese projects in relation to guarantees provided by ESCOs where payments under energy savings performancecontracts are contingent upon achieving pre-determined levels of energy savings. We are also exposed to creditrisk in projects including those projects we have under long-term lease arrangements that do not benefit from theU.S. federal government as obligor. We increasingly target such projects as part of our strategy. In the case ofvarious renewable energy and sustainable infrastructure projects, we will also be exposed to the credit risk of theobligor of the project’s power purchase agreement or other long-term contractual revenue commitments. We mayencounter enhanced credit risk as we expect that over time our strategy will increasingly include mezzanine debt,real estate and equity investments. We seek to manage credit risk using thorough due diligence and underwritingprocesses, strong structural protections in our transaction agreements with customers and continual, active assetmanagement and portfolio monitoring. Nevertheless, unanticipated credit losses could occur and during periodsof economic downturn in the global economy, our exposure to credit risks from obligors increases, and ourefforts to monitor and mitigate the associated risks may not be completely effective in reducing our credit risks.
Interest Rate and Borrowing Risks
Interest rate risk is highly sensitive to many factors, including governmental monetary and tax policies,domestic and international economic and political considerations and other factors beyond our control.
We are subject to interest rate risk in connection with new asset originations and our credit facility, and inthe future, will be subject to interest rate risk for any new floating or inverse floating rate assets and creditfacilities. Because short-term borrowings are generally short-term commitments of capital, lenders may respondto market conditions, making it more difficult for us to secure continued financing. If we are not able to renewour then existing facilities or arrange for new financing on terms acceptable to us, or if we default on ourcovenants or are otherwise unable to access funds under any of these facilities, we may have to curtail enteringinto new transactions and/or dispose of assets. We face particular risk in this regard given that we expect many ofour borrowings will have a shorter duration than the assets they finance. Increasing interest rates may reduce thedemand for our investments while declining interest rates may increase the demand. Both our current and futurecredit facilities may be of limited duration and are periodically refinanced at then current market rates. We expectto attempt to reduce interest rate risks and to minimize exposure to interest rate fluctuations through the use ofmatch funded or fixed rate financing structures, when appropriate, whereby we may seek (1) to match thematurities of our debt obligations with the maturities of our assets, (2) to borrow at fixed rates for a period oftime, like in our asset backed securitizations, or (3) to match the interest rates on our assets with like-kind debt(i.e., we may finance floating rate assets with floating rate debt and fixed-rate assets with fixed-rate debt),directly or through the use of interest rate swap agreements, interest rate cap agreements or other financial
- 87 -

instruments, or through a combination of these strategies. We expect these instruments will allow us to minimize,but not eliminate, the risk that we have to refinance our liabilities before the maturities of our assets and toreduce the impact of changing interest rates on our earnings. In addition to the use of traditional derivativeinstruments, we also seek to mitigate interest rate risk by using securitizations, syndications and other techniquesto construct a portfolio with a staggered maturity profile. We monitor the impact of interest rate changes on themarket for new originations and often have the flexibility to increase the term of the project to offset interest rateincreases.
Our nonrecourse debt is at fixed rates or we have used interest rate hedges which convert the floating rate tofixed rate as describe in Note 8 of the audited financial statements in this Form 10-K. Changes in market ratesimpact the fair value of the fixed rate debt but have no impact on our consolidated financial statements, otherthan the fair value change of our interest rate hedges which should be offset by a corresponding change in thevalue of the debt. If interest rates rise, and our fixed debt balance remains constant, we expect the fair value ofour debt to decrease and the value of our hedge to increase. As of December 31, 2015 and 2014, the estimatedfair value of our fixed rate nonrecourse debt was approximately $677 million and $335 million, respectively,which is based on having the same debt service requirements that could have been borrowed at the datepresented, at prevailing current market interest rates.
Our credit facility is a variable rate loan with approximately $247 million outstanding as of December 31,2015 and we have $13 million of variable rate exposure under our nonrecourse debt. Significant increases ininterest rates would result in higher interest expense while decreases in interest rates would result in lowerinterest expense. As described above, we may use various financing techniques including interest rate swapagreements, interest rate cap agreements or other financial instruments, or a combination of these strategies tomitigate the variable interest nature of this facility. A 50 basis point increase in LIBOR would increase thequarterly interest expense related to the $260 million in variable rate borrowings by $0.3 million. Suchhypothetical impact of interest rates on our variable rate borrowings does not consider the effect of any change inoverall economic activity that could occur in a rising interest rate environment. Further, in the event of such achange in interest rates, we may take actions to further mitigate our exposure to such a change. However, due tothe uncertainty of the specific actions that would be taken and their possible effects, the analysis assumes nochanges in our financial structure.
We record our retained assets at fair value in our financial statements and any changes in the discount ratewould impact the value of these assets. See Note 3 of the audited financial statements in this Form 10-K for moreinformation.
Liquidity and Concentration Risk
The assets that comprise our asset portfolio are not and will not be publicly traded. A portion of these assetsmay be subject to legal and other restrictions on resale or will otherwise be less liquid than publicly-tradedsecurities. The illiquidity of our assets may make it difficult for us to sell such assets if the need or desire arises,including in response to changes in economic and other conditions. Our projects typically have one obligor andthus we are subject to concentration risk and could incur significant losses if any of these projects perform poorlyor if we are required to write down the value of any these projects. See also “—Credit Risks” above.
Commodity Price Risk
When we provide debt or equity for a project that acts as a substitute for an underlying commodity we areexposed to volatility in prices for that commodity. For example, the performance of renewable energy projectsthat produce electricity can be impacted by volatility in the market prices of various forms of energy, includingelectricity, coal and natural gas. This is especially true for utility scale projects that sell power on a wholesalebasis like many of our wind projects as opposed to distributed renewable projects or energy efficiency projectswhich compete against the retail or delivered costs of electricity which includes the cost of transmitting anddistributing the electricity to the end user.
- 88 -

Although we generally focus on renewable energy projects that have the majority of their operating cashflow supported by long-term PPAs, ranging from 10 to 30 years, to the extent that the projects have shorter termcontracts (which may have the potential of producing higher current returns) or sell their power in the openmarket on a merchant basis, the cash flows of such projects, and thus the repayment of, or the returns availablefor, our assets, may be subject to risk if energy prices change. We also mitigate our exposure through structuralprotections. These structural protections, which are typically in the form of a preferred return, are design to allowrecovery of our capital and an acceptable return over time. When structuring and underwriting these transactions,we evaluate these transactions using a variety of scenarios, including natural gas prices remaining low for anextended period of time. In the case of utility scale solar projects, we focus on owning the land under the projectwhere our rent is paid out of project operational costs before the debt or equity in the project receives anypayments.
We believe the current low prices in natural gas will increase demand for some types of our projects, such ascombined heat and power, but may reduce the demand for other projects such as renewable energy that may be asubstitute for natural gas. We seek to structure our energy efficiency financings so that we typically avoidexposure to commodity price risk. However, volatility in energy prices may cause building owners and otherparties to be reluctant to commit to projects for which repayment is based upon a fixed monetary value forenergy savings that would not decline if the price of energy declines.
Risk Management
Our ongoing active asset management and portfolio monitoring processes provide investment oversight andvaluable insight into our origination, underwriting and structuring processes. These processes create valuethrough active monitoring of the state of our markets, enforcement of existing contracts and real-time receivablesmanagement. Subject to maintaining our qualification as a REIT, and as described above, we engage in a varietyof interest rate management techniques that seek to mitigate the economic effect of interest rate changes on thevalues of, and returns on, some of our assets. While there have been only two incidents of credit loss, amountingto approximately $18 million (net of recoveries) on the more than $5 billion of transactions we originated since2000, which represents an aggregate loss of approximately 0.4% on cumulative transactions originated over thistime period, there can be no assurance that we will continue to be as successful, particularly as we invest in morecredit sensitive assets or more equity positions and engage in increasing numbers of transactions with obligorsother than U.S. federal government agencies.
We seek to manage credit risk using thorough due diligence and underwriting processes, strong structuralprotections in our loan agreements with customers and continual, active asset management and portfoliomonitoring.
- 89 -

Item 8. Financial Statements and Supplementary Data.
Hannon Armstrong Sustainable Infrastructure Capital, Inc., Consolidated Financial Statements,For the Years Ended December 31, 2015, 2014 and 2013
Report of Independent Registered Public Accounting Firm 91Consolidated Balance Sheets 92Consolidated Statements of Operations 93Consolidated Statements of Comprehensive Income (Loss) 94Consolidated Statements of Stockholders’ Equity 95Consolidated Statements of Cash Flows 96Notes to Consolidated Financial Statements 97
- 90 -

Item 8. Financial Statements and Supplementary Data
REPORT OF INDEPENDENT REGISTERED PUBLIC ACCOUNTING FIRM
Board of Directors and StockholdersHannon Armstrong Sustainable Infrastructure Capital, Inc.
We have audited the accompanying consolidated balance sheets of Hannon Armstrong SustainableInfrastructure Capital, Inc. (the Company) as of December 31, 2015, and 2014, and the related consolidatedstatements of operations, comprehensive income (loss), stockholders’ equity and cash flows for each of the threeyears in the period ended December 31, 2015. These financial statements are the responsibility of the Company’smanagement. Our responsibility is to express an opinion on these financial statements based on our audits.
We conducted our audits in accordance with standards of the Public Company Accounting Oversight Board(United States). Those standards require that we plan and perform the audit to obtain reasonable assurance aboutwhether the financial statements are free of material misstatement. We were not engaged to perform an audit ofthe Company’s internal control over financial reporting. Our audits included consideration of internal controlover financial reporting as a basis for designing audit procedures that are appropriate in the circumstances, butnot for the purpose of expressing an opinion on the effectiveness of the Company’s internal control over financialreporting. Accordingly, we express no such opinion. An audit also includes examining, on a test basis, evidencesupporting the amounts and disclosures in the financial statements, assessing the accounting principles used andsignificant estimates made by management and evaluating the overall financial statement presentation. Webelieve that our audits provide a reasonable basis for our opinion.
In our opinion, the financial statements referred to above present fairly, in all material respects, theconsolidated financial position of Hannon Armstrong Sustainable Infrastructure Capital, Inc. at December 31,2015, and 2014, and the consolidated results of its operations and its cash flows for each of the three years in theperiod ended December 31, 2015, in conformity with U.S. generally accepted accounting principles.
/s/ Ernst & Young LLP
McLean, VirginiaMarch 1, 2016
- 91 -
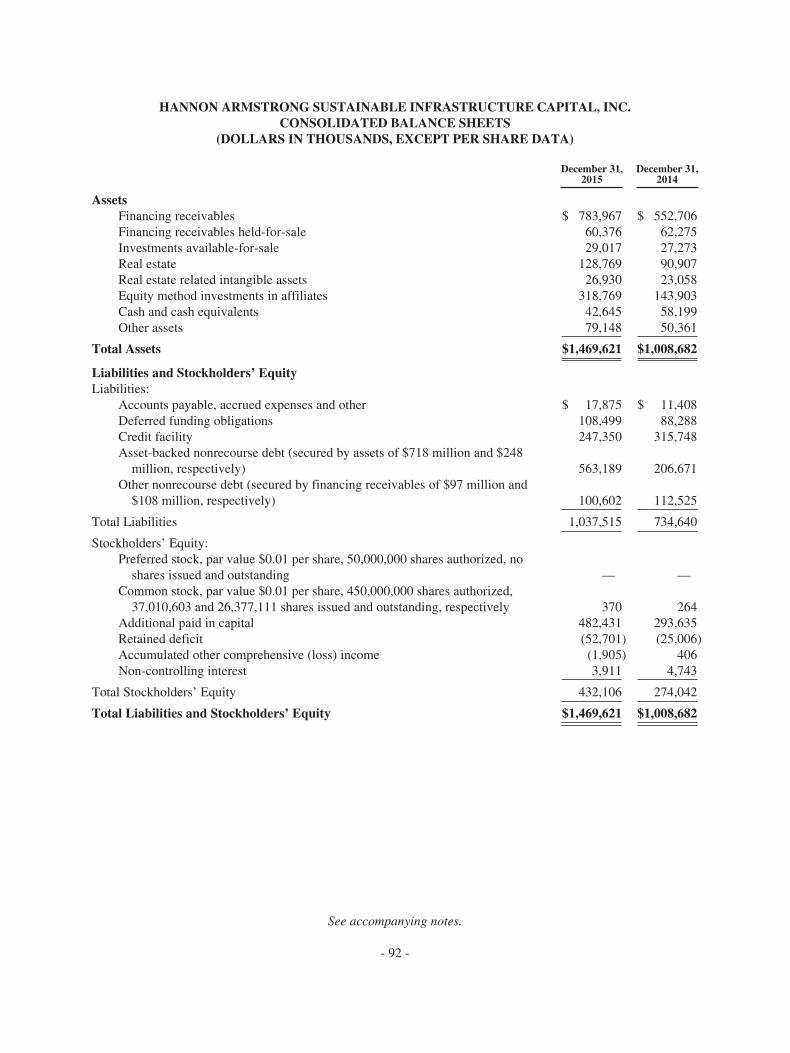
HANNON ARMSTRONG SUSTAINABLE INFRASTRUCTURE CAPITAL, INC.CONSOLIDATED BALANCE SHEETS
(DOLLARS IN THOUSANDS, EXCEPT PER SHARE DATA)
December 31,2015
December 31,2014
AssetsFinancing receivables $ 783,967 $ 552,706Financing receivables held-for-sale 60,376 62,275Investments available-for-sale 29,017 27,273Real estate 128,769 90,907Real estate related intangible assets 26,930 23,058Equity method investments in affiliates 318,769 143,903Cash and cash equivalents 42,645 58,199Other assets 79,148 50,361
Total Assets $1,469,621 $1,008,682
Liabilities and Stockholders’ EquityLiabilities:
Accounts payable, accrued expenses and other $ 17,875 $ 11,408Deferred funding obligations 108,499 88,288Credit facility 247,350 315,748Asset-backed nonrecourse debt (secured by assets of $718 million and $248
million, respectively) 563,189 206,671Other nonrecourse debt (secured by financing receivables of $97 million and
$108 million, respectively) 100,602 112,525
Total Liabilities 1,037,515 734,640
Stockholders’ Equity:Preferred stock, par value $0.01 per share, 50,000,000 shares authorized, no
shares issued and outstanding — —Common stock, par value $0.01 per share, 450,000,000 shares authorized,
37,010,603 and 26,377,111 shares issued and outstanding, respectively 370 264Additional paid in capital 482,431 293,635Retained deficit (52,701) (25,006)Accumulated other comprehensive (loss) income (1,905) 406Non-controlling interest 3,911 4,743
Total Stockholders’ Equity 432,106 274,042
Total Liabilities and Stockholders’ Equity $1,469,621 $1,008,682
See accompanying notes.
- 92 -

HANNON ARMSTRONG SUSTAINABLE INFRASTRUCTURE CAPITAL, INC.CONSOLIDATED STATEMENTS OF OPERATIONS
(DOLLARS IN THOUSANDS, EXCEPT PER SHARE DATA)
Years Ended December 31,
2015 2014 2013
Revenue:Interest income, financing receivables $ 37,404 $ 23,178 $ 15,468Interest income, investments 1,493 3,772 1,897Rental income 9,107 3,175 —Gain on sale of receivables and investments 9,224 13,250 5,597Fee income 1,451 1,900 1,483
Total Revenue 58,679 45,275 24,445Investment interest expense (26,385) (16,655) (9,815)Provision for credit losses — — (11,000)
Total Revenue, net of investment interest expense and provision 32,294 28,620 3,630
Compensation and benefits (16,788) (10,518) (12,312)General and administrative (6,462) (5,550) (3,844)Acquisition costs — (2,456) —Other, net (794) (300) (359)(Loss) from equity method investments in affiliates (98) — —
Other Expenses, net (24,142) (18,824) (16,515)
Net income (loss) before income taxes 8,152 9,796 (12,885)Income tax (expense) benefit (118) (26) 251
Net Income (Loss) $ 8,034 $ 9,770 $ (12,634)
Net income (loss) attributable to non-controlling interestholders 76 163 (2,175)
Net Income (Loss) attributable to Controlling Shareholders $ 7,958 $ 9,607 $ (10,459)
Basic earnings per common share $ 0.21 $ 0.43 $ (0.68)
Diluted earnings per common share $ 0.21 $ 0.43 $ (0.68)
Weighted average common shares outstanding—basic 30,761,151 20,656,826 15,716,250Weighted average common shares outstanding—diluted 30,761,151 20,656,826 15,716,250
See accompanying notes.
- 93 -
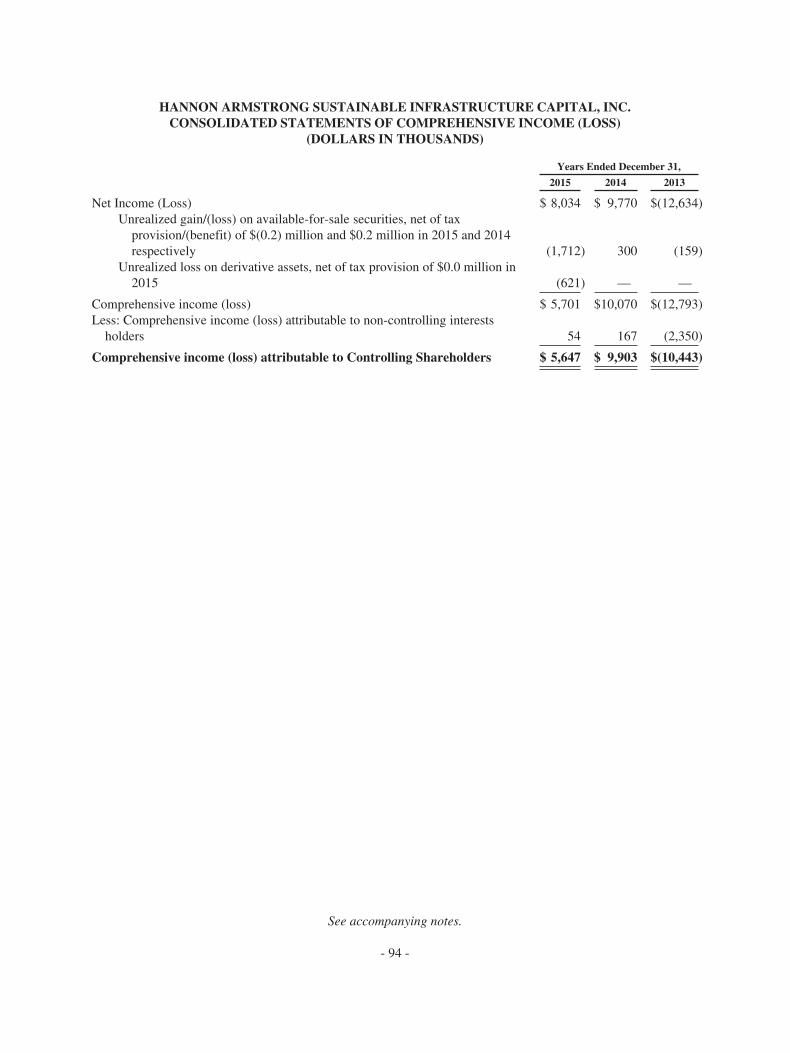
HANNON ARMSTRONG SUSTAINABLE INFRASTRUCTURE CAPITAL, INC.CONSOLIDATED STATEMENTS OF COMPREHENSIVE INCOME (LOSS)
(DOLLARS IN THOUSANDS)
Years Ended December 31,
2015 2014 2013
Net Income (Loss) $ 8,034 $ 9,770 $(12,634)Unrealized gain/(loss) on available-for-sale securities, net of tax
provision/(benefit) of $(0.2) million and $0.2 million in 2015 and 2014respectively (1,712) 300 (159)
Unrealized loss on derivative assets, net of tax provision of $0.0 million in2015 (621) — —
Comprehensive income (loss) $ 5,701 $10,070 $(12,793)Less: Comprehensive income (loss) attributable to non-controlling interests
holders 54 167 (2,350)
Comprehensive income (loss) attributable to Controlling Shareholders $ 5,647 $ 9,903 $(10,443)
See accompanying notes.
- 94 -

HANNON ARMSTRONG SUSTAINABLE INFRASTRUCTURE CAPITAL, INC.CONSOLIDATED STATEMENTS OF STOCKHOLDERS’ EQUITY
(AMOUNTS IN THOUSANDS)
Common Stock Class ACommon
Units
AdditionalPaid-inCapital
RetainedEarnings
AccumulatedOther
ComprehensiveIncome (Loss)
Non-controllingInterest TotalShares Amount
Balance at December 31, 2012 — $— 69 $ — $ 5,510 272 $ — $ 5,851Net loss (10,459) — (2,175) (12,634)Unrealized gain (loss) on residual assets 16 (175) (159)Issue shares of common stock 15,795 158 (69) 157,892 — — — 157,981Equity-based compensation — 6,885 — 194 7,079Establishment of non-controlling interest (4,300) (1,981) (178) 6,459 —Issuance (repurchase) of vested
equity-based compensation shares 98 1 (357) (10) (366)Dividends and distributions (6,934) (194) (7,128)
Balance at December 31, 2013 15,893 $159 — $160,120 $(13,864) $ 110 $ 4,099 $150,624Net income 9,607 163 9,770Unrealized gain on securities 296 4 300Issue shares of common stock 10,350 104 129,247 — 129,351Equity-based compensation 5,106 — 81 5,187Issuance (repurchase) of vested
equity-based compensation shares 134 1 (206) (205)Redemption of OP units (618) (1,164) (1,782)Redemption value change for non-
controlling interest redeemable for cash (1,833) 1,833 —Tax basis difference on contributed asset 1,819 39 1,858Dividends and distributions (20,749) (312) (21,061)
Balance at December 31, 2014 26,377 $264 $— $293,635 $(25,006) $ 406 $ 4,743 $274,042Net income 7,958 76 8,034Unrealized loss on securities (1,696) (16) (1,712)Unrealized loss on derivatives (615) (6) (621)Issue shares of common stock 10,350 104 181,259 181,363Equity-based compensation 8,680 83 8,763Issuance (repurchase) of vested
equity-based compensation shares 238 2 (929) (927)Redemption of OP units 46 (214) (662) (876)Dividends and distributions (35,653) (307) (35,960)
Balance at December 31, 2015 37,011 $370 $— $482,431 $(52,701) $(1,905) $ 3,911 $432,106
See accompanying notes.
- 95 -
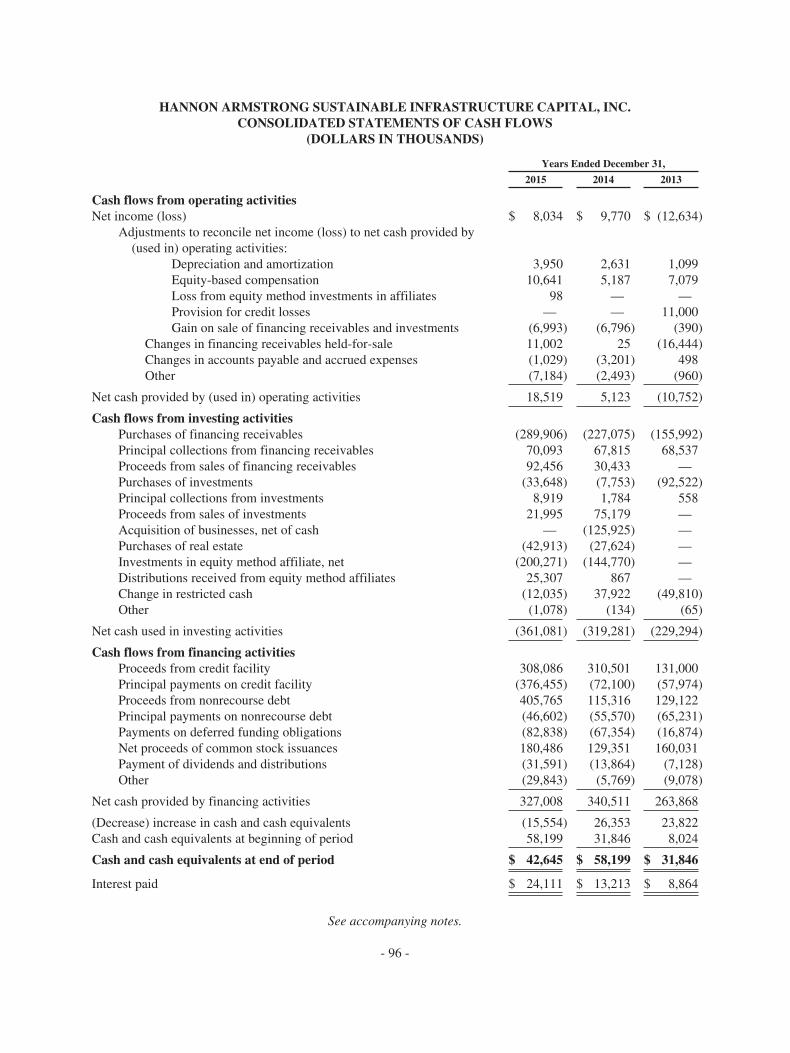
HANNON ARMSTRONG SUSTAINABLE INFRASTRUCTURE CAPITAL, INC.CONSOLIDATED STATEMENTS OF CASH FLOWS
(DOLLARS IN THOUSANDS)
Years Ended December 31,
2015 2014 2013
Cash flows from operating activitiesNet income (loss) $ 8,034 $ 9,770 $ (12,634)
Adjustments to reconcile net income (loss) to net cash provided by(used in) operating activities:
Depreciation and amortization 3,950 2,631 1,099Equity-based compensation 10,641 5,187 7,079Loss from equity method investments in affiliates 98 — —Provision for credit losses — — 11,000Gain on sale of financing receivables and investments (6,993) (6,796) (390)
Changes in financing receivables held-for-sale 11,002 25 (16,444)Changes in accounts payable and accrued expenses (1,029) (3,201) 498Other (7,184) (2,493) (960)
Net cash provided by (used in) operating activities 18,519 5,123 (10,752)
Cash flows from investing activitiesPurchases of financing receivables (289,906) (227,075) (155,992)Principal collections from financing receivables 70,093 67,815 68,537Proceeds from sales of financing receivables 92,456 30,433 —Purchases of investments (33,648) (7,753) (92,522)Principal collections from investments 8,919 1,784 558Proceeds from sales of investments 21,995 75,179 —Acquisition of businesses, net of cash — (125,925) —Purchases of real estate (42,913) (27,624) —Investments in equity method affiliate, net (200,271) (144,770) —Distributions received from equity method affiliates 25,307 867 —Change in restricted cash (12,035) 37,922 (49,810)Other (1,078) (134) (65)
Net cash used in investing activities (361,081) (319,281) (229,294)
Cash flows from financing activitiesProceeds from credit facility 308,086 310,501 131,000Principal payments on credit facility (376,455) (72,100) (57,974)Proceeds from nonrecourse debt 405,765 115,316 129,122Principal payments on nonrecourse debt (46,602) (55,570) (65,231)Payments on deferred funding obligations (82,838) (67,354) (16,874)Net proceeds of common stock issuances 180,486 129,351 160,031Payment of dividends and distributions (31,591) (13,864) (7,128)Other (29,843) (5,769) (9,078)
Net cash provided by financing activities 327,008 340,511 263,868
(Decrease) increase in cash and cash equivalents (15,554) 26,353 23,822Cash and cash equivalents at beginning of period 58,199 31,846 8,024
Cash and cash equivalents at end of period $ 42,645 $ 58,199 $ 31,846
Interest paid $ 24,111 $ 13,213 $ 8,864
See accompanying notes.
- 96 -

HANNON ARMSTRONG SUSTAINABLE INFRASTRUCTURE CAPITAL, INC.NOTES TO CONSOLIDATED FINANCIAL STATEMENTS
DECEMBER 31, 2015
1. The Company
Hannon Armstrong Sustainable Infrastructure Capital, Inc. (“the Company”) provides debt and equity to the energyefficiency and renewable energy markets. The Company and its subsidiaries are hereafter referred to as “we,” “us,” or“our.” We refer to the financings that we hold on our balance sheet as our “Portfolio.” Our Portfolio may include:
• Financing Receivables, such as project loans, receivables and direct financing leases,
• Investments, such as debt and equity securities,
• Real Estate, such as land or other physical assets and related intangible assets used in renewable energyprojects, and
• Equity Investments in unconsolidated affiliates, such as projects where we hold a non-consolidatedequity interest in a project
We finance our business through cash on hand, borrowings under our credit facility and debt transactions,and various asset-backed securitization transactions and equity issuances. We also generate fee income throughasset-backed securitizations, by providing broker/dealer services and by servicing assets owned by third parties.Some of our subsidiaries are special purpose entities that are formed for specific operations associated withfinancing sustainable infrastructure receivables for specific long term contracts.
We have raised net proceeds of approximately $470 million including $181 million in two follow on publicofferings completed in 2015. Concurrently with our April 2013 initial public offering (“IPO”), we completed aseries of transactions, which are referred to as the formation transactions that resulted in Hannon ArmstrongCapital, LLC (the “Predecessor”), and the entity that operated the historical business prior to the consummationof the IPO, becoming our subsidiary. Our common stock is listed on the New York Stock Exchange (“NYSE”)under the symbol “HASI.” See Note 11 for a summary of our public offerings of common stock.
We elected and qualified as a REIT for U.S. federal income tax purposes commencing with our taxable yearended December 31, 2013. We generally will not be subject to U.S. federal income taxes on our taxable incometo the extent that we annually distribute all of our taxable income to stockholders and maintain our qualificationas a REIT. We operate our business through, and serve as the sole general partner of, our operating partnershipsubsidiary, Hannon Armstrong Sustainable Infrastructure, L.P, (the “Operating Partnership”), which was formedto acquire and directly or indirectly own our assets. We also intend to operate our business in a manner that willcontinue to permit us to maintain our exception from registration as an investment company under the InvestmentCompany Act of 1940, as amended.
To the extent any of the financial data included in this report is as of or from a period prior to April 23,2013, such financial data is that of the Predecessor. The financial data for the Predecessor for such periods do notreflect the material changes to our business as a result of the capital raised in the IPO, including the broadenedscope of projects targeted for financing, our enhanced financial structuring flexibility and our ability to retain alarger share of the economics from our origination activities. Accordingly, the financial data for the Predecessoris not necessarily indicative of our results of operations, cash flows or financial position following thecompletion of our IPO and formation transactions.
Real Estate Acquisitions
In May 2014, we acquired all of the outstanding member interests in American Wind Capital Company,LLC (“AWCC”) from Northwharf Nominees Limited, DBD AWCC LLC, NGP Energy Technology Partners II,L.P. and C.C. Hinckley Company, LLC in exchange for approximately $107 million (the “Purchase Price”),which we funded with our cash on hand and availability under our credit facilities.
- 97 -

The unaudited pro forma summary below presents the consolidated results of operations as if the acquisitionwas completed on January 1, 2013. The pro forma information is not necessarily indicative of what our actualresults of operations would have been for the period, nor does it purport to represent our estimate of future resultsof operations.
For the year endedDecember 31,
2014 2013
(dollars in millions, unaudited)
Pro forma net investment revenue $32 $ 21Pro forma net income (loss) $12 $(12)
Since the AWCC acquisition that was accounted for as a business combination, we have completed severalsmaller transactions that were also accounted for as business combinations for additional consideration ofapproximately $19 million, which we funded with our cash on hand and availability under our existing creditfacilities.
We incurred approximately $2.5 million of acquisition related costs in connection with these transactions,which we have previously expensed as acquisition costs in our 2014 consolidated statement of operations. Werecorded the acquired assets (including real estate related intangibles) at fair value. We did not assume anyindebtedness in connection with these transactions. We used a qualified appraiser to assist us with thedetermination of the fair value estimates for the majority of these assets.
The purchase price allocation for these business combinations, which reflects our estimates of the fair valueof the assets acquired, is as follows (dollars in millions, unaudited):
Financing receivables $ 37Real estate 67Real estate related intangibles 20Goodwill 2
Purchase Price $126
As a result of these acquisitions, we recorded rental income of $3.2 million and interest income of $1.5million for the year ended December 31, 2014 in our consolidated statement of operations.
Investments in Equity Method Affiliates
We have made several minority interest investments in wind projects operated by various wind energycompanies through limited liability entities with an affiliate of JPMorgan Chase & Co (“JPMorgan”), BluestemCreston Ridge, LLC (“Bluestem”) and an affiliate of Invenergy LLC (“Invenergy”). Through these arrangements,we indirectly own minority interests in six limited liability holding companies that own twelve operating windprojects. The following table sets forth certain information related to our equity method investments.
Date Transaction Investment Partner
(dollars in millions)
October 2014 Strong Upwind Holdings I, LLC $141 JPMorganApril 2015 Strong Upwind Holdings II, LLC $36 JPMorganAugust 2015 Creston Ridge Management, LLC $13 BluestemDecember 2015 Strong Upwind Holdings III, LLC $84 JPMorganDecember 2015 Buckeye Wind Energy Class B Holdings
LLC $71 Invenergy
- 98 -

In June 2015, JPMorgan and one of the holding companies entered into an agreement regarding thetreatment of certain tax matters that had the impact of reducing our expected future cash flows from that holdingcompany. To offset this reduction in our future cash flows, in June 2015, JPMorgan paid us approximately $3million, which effectively reduced our original investment from $144 million to $141 million in Strong UpwindHoldings I, LLC.
See Note 2 for our accounting treatment of these investments and Note 13 for the financial position andresults of operations of the holding companies.
2. Summary of Significant Accounting Policies
Basis of Presentation
The preparation of financial statements in accordance with U.S. generally accepted accounting principles(“U.S. GAAP”) requires management to make estimates and assumptions that affect the reported amounts ofassets and liabilities and the reported amounts of revenues and expenses during the reporting period. Actualresults could differ from these estimates and such differences could be material. Certain amounts in the prior yearhave been reclassified to conform to the current year presentation, including the format of the revenue section ofthe income statement to include a calculation of Total Revenue. We also implemented ASU No. 2015-03,Interest—Imputation of Interest, which simplifies the presentation of debt issuance costs. See Recently IssuedAccounting Pronouncements below and Note 8 for further information.
The consolidated financial statements include the accounts of the Company and its controlled subsidiaries,including the Operating Partnership. All significant intercompany transactions and balances have been eliminatedin consolidation.
Following the guidance for non-controlling interests in Financial Accounting Standards Board (“FASB”)Accounting Standards Codification (“ASC”) 810, Consolidation, references in this report to our earnings pershare and our net income and shareholders’ equity attributable to common shareholders do not include amountsattributable to non-controlling interests.
Financing Receivables
Financing receivables include financing energy efficiency and renewable energy project loans, receivablesand direct financing leases.
Unless otherwise noted, we generally have the ability and intent to hold our financing receivables for theforeseeable future and thus they are classified as held for investment. Our ability and intent to hold certainfinancing receivables may change from time to time depending on a number of factors, including economic,liquidity and capital conditions. The carrying value of financing receivables held for investment represents thepresent value of the note, lease or other payments, net of any unearned fee income, which is recognized asincome over the term of the note or lease using the effective interest method. Financing receivables that are heldfor investment are carried, unless deemed impaired, at cost, net of any unamortized acquisition premiums ordiscounts and include origination and acquisition costs, as applicable. Financing receivables that we intend to sellin the short-term are classified as held-for-sale and are carried at the lower of amortized cost or fair value on ourbalance sheet. The net purchases and proceeds from these sales of our held-for-sale financing receivables arerecorded as an operating activity in our statement of cash flows based on our intent at the time of purchase. Wemay secure nonrecourse debt with the proceeds from our financing receivables.
We evaluate our financing receivables for potential delinquency or impairment on at least a quarterly basisand more frequently when economic or other conditions warrant such an evaluation. When a financing receivablebecomes 90 days or more past due, and if we otherwise do not expect the debtor to be able to service all of itsdebt or other obligations, we will generally consider the financing receivable delinquent or impaired and placethe financing receivable on non-accrual status and cease recognizing income from that financing receivable until
- 99 -

the borrower has demonstrated the ability and intent to pay contractual amounts due. If a financing receivable’sstatus significantly improves regarding the debtor’s ability to service the debt or other obligations, we willremove it from non-accrual status.
A financing receivable is also considered impaired as of the date when, based on current information andevents, it is determined that it is probable that we will be unable to collect all amounts due in accordance with theoriginal contracted terms. Many of our financing receivables are secured by energy efficiency and renewableenergy infrastructure projects. Accordingly, we regularly evaluate the extent and impact of any creditdeterioration associated with the performance and value of the underlying project, as well as the financial andoperating capability of the borrower, its sponsors or the obligor as well as any guarantors. We consider a numberof qualitative and quantitative factors in our assessment, including, as appropriate, a project’s operating results,loan-to-value ratios and any cash reserves, the ability of expected cash from operations to cover the cash flowrequirements currently and into the future, key terms of the transaction, the ability of the borrower to refinancethe transaction, other credit support from the sponsor or guarantor and the project’s collateral value. In addition,we consider the overall economic environment, the sustainable infrastructure sector, the effect of local, industry,and broader economic factors, the impact of any variation in weather and the historical and anticipated trends ininterest rates, defaults and loss severities for similar transactions.
If a financing receivable is considered to be impaired, we record an allowance to reduce the carrying valueof the financing receivable to the present value of expected future cash flows discounted at the financingreceivable’s contractual effective rate or the amount realizable from other contractual terms such as the currentlyestimated fair market value of the collateral less estimated selling costs, if repayment is expected solely from thecollateral. We charge off financing receivables against the allowance when we determine the unpaid principalbalance is uncollectible, net of recovered amounts.
Investments
Investments include debt securities that meet the criteria of ASC 320, Investments—Debt and EquitySecurities. As a result of the sale of certain debt securities previously designated as held-to-maturity in 2014, wehave designated our debt securities as available-for-sale and will carry these securities at fair value on ourbalance sheet from that date. Unrealized gains and losses, to the extent not considered other than temporaryimpairment (“OTTI”), on available-for-sale debt securities are recorded as a component of accumulated othercomprehensive income (“OCI”) in equity on our balance sheet.
We evaluate our investments for OTTI on at least a quarterly basis, and more frequently when economic ormarket conditions warrant such an evaluation. Our OTTI assessment is a subjective process requiring the use ofjudgments and assumptions. Accordingly, we regularly evaluate the extent and impact of any credit deteriorationassociated with the financial and operating performance and value of the underlying project. We consider anumber of qualitative and quantitative factors in our assessment. We first consider the current fair value of thesecurity and the duration of any unrealized loss. Other factors considered include changes in the credit rating,performance of the underlying project, key terms of the transaction, the value of any collateral and any supportprovided by the sponsor or guarantor.
To the extent that we have identified an OTTI for a security and intend to hold the investment to maturityand we do not expect that we will be required to sell the security prior to recovery of the amortized cost basis, werecognize only the credit component of OTTI in earnings. We determine the credit component using thedifference between the securities’ amortized cost basis and the present value of its expected future cash flows,discounted using the effective interest method or its estimated collateral value. Any remaining unrealized lossdue to factors other than credit, or the non-credit component, is recorded in accumulated OCI.
To the extent we hold investments with an OTTI and if we have made the decision to sell the security or it ismore likely than not that we will be required to sell the security prior to recovery of its amortized cost basis, werecognize the entire portion of the impairment in earnings.
- 100 -

Premiums or discounts on investment securities are amortized or accreted into investment interest incomeusing the effective interest method.
Real Estate
Real estate reflects land or other real estate held on our balance sheet. Real estate intangibles reflect thevalue of associated lease intangibles, net of any amortization. In accordance with ASC 805, BusinessCombinations, the fair value of the real estate acquired in a business combination with in-place leases is allocatedto (i) the acquired tangible assets, consisting of land or other real property such as buildings, and (ii) theidentified intangible assets and liabilities, consisting of the value of above-market and below-market leases andthe value of other acquired intangible assets, based in each case on their fair values.
The fair value of the tangible assets of an acquired leased property is determined by valuing the property asif it were vacant, and the “as-if-vacant” value is then allocated to land, building and tenant improvements, if any,based on the determination of the fair values of these assets. The as-if-vacant fair value of a property isdetermined by management based on an appraisal of the property by a qualified appraiser.
In allocating the fair value of the identified intangible assets and liabilities of an acquired property, above-market and below-market in-place lease values are recorded as intangible assets based on the present value (usingan interest rate which reflects the risks associated with the leases acquired) of the difference between (i) thecontractual amounts to be paid pursuant to the in-place leases, and (ii) management’s estimate of fair marketlease rates for the corresponding in-place leases, measured over a period equal to the remaining term of the lease,including renewal periods likely of being exercised by the lessee. The capitalized above-market lease values areamortized as a reduction of rental income and the capitalized below-market lease values are amortized as anincrease to rental income. We also record, as appropriate, an intangible asset for in-place leases. The value of theleases in place at the time of the transaction is equal to the potential revenue (rent and expenses) lost if the leaseswere not in place (during downtime) and that would be incurred to obtain the lease. The amortization iscalculated over the initial term unless management believes that it is likely that the tenant would exercise therenewal option, whereby we would amortize the value attributable to the renewal over the renewal period. If alease were to be terminated, all unamortized amounts relating to that lease would be written off.
We record the purchases of real estate, other than in a business combination (i.e. real estate with no in-places leases), as asset acquisitions that are recorded at cost, including acquisition and closing costs.
Our real estate is generally leased to tenants on a net lease basis, whereby the tenant is responsible for alloperating expenses relating to the property, generally including property taxes, insurance, maintenance, repairsand capital expenditures. Scheduled rental revenue typically varies during the lease term and thus rental incomeis recognized on a straight-line basis, unless there is considerable risk as to collectability, so as to produce aconstant periodic rent over the term of the lease. Accrued rental income is the aggregate difference between thescheduled rents which vary during the lease term and the income recognized on a straight-line basis and isrecorded in other assets. Rental expenses (if any) are charged to operations as incurred.
Securitization of Receivables
We have established various special purpose entities or securitization trusts for the purpose of securitizingcertain financing receivables or other debt investments. We determined that the trusts used in securitizations arevariable interest entities, as defined in ASC 810, Consolidation. We typically serve as primary or master servicerof these trusts; however, as the servicer, we do not have the power to make significant decisions impacting theperformance of the trusts. Based on an analysis of the structure of the trusts, under U.S. GAAP, we haveconcluded that we are not the primary beneficiary of the trusts as we do not have power over the trusts’significant activities. Therefore, we do not consolidate these trusts in our consolidated financial statements.
We account for transfers of financing receivables to these securitization trusts as sales pursuant to ASC 860,Transfers and Servicing, as we have concluded the transferred receivables have been isolated from the transferor
- 101 -

(i.e., put presumptively beyond the reach of the transferor and its creditors, even in bankruptcy or otherreceivership) and we have surrendered control over the transferred receivables. We have received true-sale-at-law opinions for all of our securitization trust structures and non-consolidation legal opinions for all but one oldsecuritization trust structure that support our conclusion regarding the transferred receivables. When we sellreceivables in securitizations, we generally retain minor interests in the form of servicing rights and residualassets, which we refer to as securitization assets.
Gain or loss on the sale of receivables is calculated based on the excess of the proceeds received from thesecuritization (less any transaction costs) plus any retained interests obtained over the cost basis of thereceivables sold. For retained interests, we generally estimate fair value based on the present value of futureexpected cash flows using our best estimates of the key assumptions of anticipated losses, prepayment rates, andcurrent market discount rates commensurate with the risks involved.
We initially account for all separately recognized servicing assets and servicing liabilities at fair value andsubsequently measure such servicing assets and liabilities using the amortization method. Servicing assets andliabilities are amortized in proportion to, and over the period of, estimated net servicing income with servicingincome recognized as earned. We assess servicing assets for impairment at each reporting date. If the amortizedcost of servicing assets is greater than the estimated fair value, we will recognize an impairment in net income.
Our other retained interest in securitized assets, the residual assets, are classified as available-for-salesecurities and carried at fair value on the consolidated balance sheets in Other Assets. We generally do not sellour residual assets. Our residual assets are evaluated for impairment on a quarterly basis. Interest income relatedto the residual assets is recognized using the effective interest rate method. If there is a change in expected cashflows related to the residual assets, we calculate a new yield based on the current amortized cost of the residualassets and the revised expected cash flows. This yield is used prospectively to recognize interest income.
Cash and Cash Equivalents
Cash and cash equivalents include short-term government securities, certificates of deposit and moneymarket funds, all of which had an original maturity of three months or less at the date of purchase. Thesesecurities are carried at their purchase price, which approximates fair value.
Restricted Cash
Restricted cash includes cash and cash equivalents set aside with certain lenders primarily to supportdeferred funding and other obligations outstanding as of the balance sheet dates. Restricted Cash is reported aspart of Other Assets in the consolidated balance sheets.
Variable Interest Entities and Equity Method Investments in Affiliates
We account for our investment in entities that are considered voting or variable interest entities under ASC810. We perform an ongoing assessment to determine the primary beneficiary of each entity as required by ASC810. We have established various special purpose entities or securitization trusts for the purpose of securitizingcertain financing receivables or other debt investments which are not consolidated in our financial statements asdescribed in Securitization of Receivables above.
Substantially all of the activities of the special purpose entities that are formed for the purpose of holding ourfinancing receivables and investments on our balance sheet are closely associated with our activities. Based on ourassessment, we determined that we have power over and receive the benefits of these special purpose entities;hence, we are the primary beneficiary and should consolidate these entities under the provisions of ASC 810.
As described in Note 1, we made equity investments in various wind projects. We share in the cash flowsand tax attributes according to a negotiated schedule. Wind projects are typically owned in partnershipsstructures (using limited liability corporations, or LLCs taxed as partnerships) where we, along with other large
- 102 -
institutional investors, if any, receive a stated preferred return consisting of a priority distribution of the project’scash flows, and in some cases, tax attributes. Once this preferred return is achieved, the partnership “flips” andthe wind energy company which operates the project, receives the a larger portion of the cash flows through itsinterest in the holding company and we, along with the other institutional investors, will have an on-goingresidual interest.
The limited liability entities with JPMorgan (which own the interest in the holding companies that owncertain of the wind projects) are jointly controlled with each member owning 50% of the voting stock. Based onour assessment, we have determined that these entities are voting interest entities and we have the ability toexercise influence over their operating and financial policies and as such we therefore account for suchinvestments using the equity method. JPMorgan has certain rights to withdraw from the partnership in the futurein which case we would be obligated to buy their interest at the fair market value at the time of withdraw.
We own directly, or indirectly as partners with JPMorgan, interests in various limited liability holdingcompanies that own wind projects. Each of the holding companies is partially owned and operated by a windenergy company. Based on our assessment, we have determined that each of the holding companies (includingthe acquired ownership interest in the Creston Ridge Management, LLC and Buckeye Wind Energy Class BHoldings LLC) is a variable interest entity and that we have the ability to exercise influence over operating andfinancial policies of the holding companies, but we are not the primary beneficiary as we do not have the powerto direct the most important decisions related to the most significant activities of the investment. Thus we do notconsolidate the limited liability entities or the holding companies, but account for them using the equity methodof accounting as described below. Our maximum exposure to loss associated with these entities is limited to ourinvestment.
Under the equity method of accounting, the carrying value of our equity method investments is determinedbased on amounts we invested, adjusted for the equity in earnings or losses of investee allocated based on thelimited liability entity agreement, less distributions received. Because the limited liability entity and holdingcompany agreements contain preferences with regard to cash flows from operations, capital events andliquidation, we reflect our share of profits and losses by determining the difference between our “claim on theinvestee’s book value” at the end and the beginning of the period. This claim is calculated as the amount wewould receive (or be obligated to pay) if the investee were to liquidate all of its assets at recorded amountsdetermined in accordance with U.S. GAAP and distribute the resulting cash to creditors and investors inaccordance with their respective priorities. This method is commonly referred to as the hypothetical liquidation atbook value method or (“HLBV”). Intra-company gains and losses are eliminated for an amount equal to ourinterest and are reflected in the share in loss from equity method investment in affiliate in the consolidatedstatements of operations. Cash distributions received from our equity method investments are classified asoperating cash flows to the extent of cumulative HLBV earnings. Any additional cash flows are deemed to bereturns of the investment and are classified as investing cash flows. We have elected to recognize earnings fromthese investments one quarter in arrears to allow for the receipt of financial information.
We evaluate the realization of our investment accounted for using the equity method if circumstancesindicate that our investment is OTTI. OTTI impairment occurs when the estimated fair value of an investment isbelow the carrying value and the difference is determined to not be recoverable. This evaluation requiressignificant judgment regarding, but not limited to, the severity and duration of the impairment; the ability andintent to hold the securities until recovery; financial condition, liquidity, and near-term prospects of the issuer;specific events; and other factors. Based on an evaluation of our equity method investments, we determined thatno impairment had occurred for 2015 or 2014. We did not have any equity method investments as ofDecember 31, 2013.
Intangible Assets and Goodwill
Intangible assets are amortized using the straight-line method over the remaining estimated life, generallyranging from three to 15 years. The carrying amounts of intangible assets are reviewed for impairment when
- 103 -

indicators of impairment are identified. If the carrying amount of the asset exceeds the undiscounted expectedcash flows that are directly associated with the use and eventual disposition of the asset, an impairment charge isrecognized to the extent the carrying amount of the asset exceeds the fair value.
Goodwill represents the costs of business acquisitions in excess of the fair value of identifiable net assetsacquired. We evaluate goodwill for potential impairment for our one reporting unit annually on September 30, orwhenever impairment indicators are present. We perform a two-step goodwill impairment test to identifypotential goodwill impairment and measure the amount of goodwill impairment to be recognized, if any. First,we compare our fair value using our market capitalization based on the average market price relative to ourcurrent carrying value, including goodwill. If our fair value is in excess of the carrying value, the relatedgoodwill is not considered impaired and no further analysis is necessary. If, however, our carrying value exceedsour fair value, there is an indication of potential impairment and a second step of testing is performed to measurethe amount of impairment, if any. If our estimated fair value were to be less than our book value, the second stepof the review process is performed to calculate the implied fair value of our goodwill in order to determinewhether any impairment of goodwill is required. The implied fair value of the goodwill is calculated byallocating our estimated fair value to all of our assets and liabilities (including any unrecognized intangibleassets) as if we had been acquired in a business combination. If the carrying value of the goodwill exceeds theimplied fair value of the goodwill, we recognize an impairment loss for that excess amount. We did not recognizeany goodwill impairments in 2015, 2014, or 2013.
Derivative Financial Instruments
We may utilize derivative financial instruments, primarily interest rate swaps, to manage, or hedge, ourinterest rate risk exposures associated with new debt issuances, to manage our exposure to fluctuations in interestrates on variable rate debt, and to optimize the mix of our fixed and floating-rate debt. In addition, we may useforward-starting interest rate swap contracts to manage a portion of our interest rate exposure for anticipatedrefinancing of our long-term debts. Our objective is to manage the impact of interest rates on the results ofoperations and cash flows and the market value of our debt.
We use interest rate swaps designated as cash flow hedges to manage our interest rate exposures associatedwith new debt issuances and to manage our exposure to fluctuations in interest rates on variable rate debt. Weattempt to use derivative instruments that are considered highly effective in reducing our exposure to the interestrate risk that they are designated to hedge. This effectiveness is essential in order to qualify for hedge accounting.Instruments that meet these hedging criteria are formally designated as hedges at the inception of the derivativecontract. Derivatives are recorded on the consolidated balance sheet at fair value. If a derivative is designated asa cash flow hedge, the effective portions of changes in the fair value of the derivative are recorded inAccumulated Other Comprehensive Income, net of associated deferred income tax effects, in our ConsolidatedStatements of Stockholders’ Equity and Comprehensive Income (Loss) and are recognized in the ConsolidatedStatements of Operations when the hedged item affects earnings. Changes in fair value of the ineffective portionsof these hedges are recognized in Other, net in our Consolidated Statements of Operations. For derivativeinstruments not designated as hedging instruments, changes in fair value are recognized in our ConsolidatedStatements of Operations in the period that the change occurs. We assess, both at the inception of the hedge andon an ongoing basis, whether the derivatives that are used in hedging transactions are highly effective inoffsetting changes in cash flows of hedged items. We do not hold derivatives for trading purposes.
Interest rate swap contracts contain a credit risk that counterparties may be unable to fulfill the terms of theagreement. We attempt to minimize that risk by evaluating the creditworthiness of its counterparties, who arelimited to major banks and financial institutions, and do not anticipate nonperformance by the counterparties.
Income Taxes
We elected and qualified to be taxed as a REIT for U.S. federal income tax purposes, commencing with ourtaxable year ended December 31, 2013. To qualify as a REIT, we must meet a number of organizational and
- 104 -

operational requirements, including a requirement that we currently distribute at least 90% of our net taxableincome, excluding capital gains, to our shareholders. We intend to continue to meet the requirements forqualification as a REIT. As a REIT, we are not subject to U.S. federal corporate income tax on that portion of netincome that is currently distributed to our owners. However, our taxable REIT subsidiaries (“TRS”) willgenerally be subject to U.S. federal, state, and local income taxes as well as taxes of foreign jurisdictions, if any.Prior to the completion of the IPO, the Predecessor was taxed as a partnership for U.S. federal income taxpurposes.
We account for income taxes of our TRS using the asset and liability method. Deferred tax assets andliabilities are recognized for the estimated future tax consequences attributable to the differences between theconsolidated financial statement carrying amounts of existing assets and liabilities and their respective tax bases.Deferred tax assets and liabilities are measured using enacted tax rates in effect for the year in which thosetemporary differences are expected to be recovered or settled. The effect on deferred tax assets and liabilitiesfrom a change in tax rates is recognized in earnings in the period when the new rate is enacted.
We apply accounting guidance with respect to how uncertain tax positions should be recognized, measured,presented, and disclosed in the financial statements. This guidance requires the accounting and disclosure of taxpositions taken or expected to be taken in the course of preparing our tax returns to determine whether the taxpositions are “more likely than not” to be sustained by the applicable tax authority. We are required to analyze allopen tax years, as defined by the statute of limitations, for all major jurisdictions, which includes U.S. federaland certain states.
Equity-Based Compensation
At the time of completion of our IPO, we adopted our 2013 Equity Incentive Plan (the “2013 Plan”), whichprovides for grants of stock options, stock appreciation rights, restricted stock units, shares of restricted commonstock, phantom shares, dividend equivalent rights, long-term incentive-plan units (“LTIP units”) and otherrestricted limited partnership units issued by our Operating Partnership and other equity-based awards. Fromtime to time, we may award unvested restricted stock as compensation to members of our senior managementteam, our independent directors, employees, advisors, consultants and other personnel under our 2013 Plan.
We record compensation expense for stock awards in accordance with ASC 718, Compensation—StockCompensation. We record compensation expense for unvested shares that vest solely based on service conditionson a straight-line basis over the vesting period based upon the fair market value of the shares on the date of grant,adjusted for forfeitures. For awards where the vesting is contingent upon achievement of certain performancetargets, compensation expense is recorded over the requisite service period (which includes the performanceperiod) based on our estimate of the achievement of the various performance targets, adjusted for forfeitures. Ourshare price at the date of grant and actual performance results at the end of the performance period determine thefair value and the number of shares that will ultimately be awarded. The award earned is generally between 0%and 150% of the initial target, depending on the extent to which the performance target are met. If minimumperformance targets are not attained, no awards will be made.
Earnings Per Share
We compute earnings per share of common stock in accordance with ASC 260, Earnings Per Share. Basicearnings per share is calculated by dividing net income attributable to controlling stockholders (afterconsideration of the earnings allocated to unvested shares of restricted common stock or restricted stock units) bythe weighted-average number of shares of common stock outstanding during the period excluding the weightedaverage number of unvested shares of restricted common stock or restricted stock units (“participating securities”as defined in Note 12). Diluted earnings per share is calculated by dividing net income attributable to controllingstockholders by the weighted-average number of shares of common stock outstanding during the period plusother potentially dilutive securities. No adjustment is made for shares that are anti-dilutive during a period.
- 105 -

Segment Reporting
We provide and arrange debt and equity financing for sustainable infrastructure projects and report all of ouractivities as one business segment.
Recently Issued Accounting Pronouncements
Revenue from Contracts with Customers
In May 2014, the FASB issued Accounting Standards Update (“ASU”) No. 2014-09, Revenue fromContracts with Customers, requiring an entity to recognize the amount of revenue to which it expects to beentitled for the transfer of promised goods or services to customers. The updated standard will replace mostexisting revenue recognition guidance in U.S. GAAP when it becomes effective and permits the use of either theretrospective or cumulative effect transition method. The FASB proposed delaying the effective date of thestandard by one year and issued a proposal that is intended to clarify and simplify the guidance. The updatedstandard becomes effective for us on January 1, 2018 and we expect will be first presented in our March 31,2018, Form 10-Q. We have not yet selected a transition method, and we are currently evaluating the effect thatthe updated standard will have on our consolidated financial statements and related disclosures.
Debt Issuance Costs
In April 2015, the FASB issued ASU No. 2015-03, Interest—Imputation of Interest, which simplifies thepresentation of debt issuance costs. ASU 2015-03 requires debt issuance costs related to long-term debt to bepresented in the balance sheet as a reduction to the carrying amount of the related debt liability, consistent withthe presentation of discounts. ASU 2015-03 is effective for fiscal years beginning after December 15, 2015, andfor interim periods within those fiscal years, and is eligible for early adoption. We have adopted this standard inour consolidated financial statements for our nonrecourse debt. As allowed under the ASU, we continue to recordunamortized issuance costs related to our credit facility in Other Assets. We do not have a material amount ofunamortized debt issuance costs and thus the adoption of the new standard did not have a material effect on ourconsolidated financial statements and related disclosures. See Note 8 for further information.
3. Fair Value Measurements
Fair value is defined as the price that would be received for an asset or paid to transfer a liability in anorderly transaction between market participants on the measurement date. The fair value accounting guidanceprovides a three-level hierarchy for classifying financial instruments. The levels of inputs used to determine thefair value of our financial assets and liabilities carried on the balance sheet at fair value and for those which onlydisclosure of fair value is required are characterized in accordance with the fair value hierarchy established byASC 820, Fair Value Measurements. Where inputs for a financial asset or liability fall in more than one level inthe fair value hierarchy, the financial asset or liability is classified in its entirety based on the lowest level inputthat is significant to the fair value measurement of that financial asset or liability. We use our judgment andconsider factors specific to the financial assets and liabilities in determining the significance of an input to thefair value measurements. As of December 31, 2015 and 2014, only our residual assets (described in Note 5),financing receivables held-for-sale, interest rate swaps and investments available-for-sale, if any, were carried atfair value on the consolidated balance sheets on a recurring basis. The three levels of the fair value hierarchy aredescribed below:
• Level 1—Quoted prices (unadjusted) in active markets that are accessible at the measurement date.
• Level 2—Observable prices that are based on inputs not quoted on active markets, but corroborated bymarket data.
• Level 3—Unobservable inputs are used when little or no market data is available.
- 106 -

Unless otherwise discussed below, fair value is measured using a discounted cash flow model, contractualterms and Level 3 unobservable inputs which consist of base interest rates and spreads over base rates which arebased upon market observation and recent comparable transactions. An increase in these unobservable inputswould result in a lower fair value and a decline would result in a higher fair value. The financing receivables heldfor sale are carried at the lower of cost or market.
As of December 31, 2015
FairValue
CarryingValue Level
(dollars in millions)
AssetsFinancing receivables $806 $784 Level 3Financing receivables held-for-sale 61 60 Level 3Investments available-for-sale (1) 29 29 Level 3LiabilitiesCredit facility $247 $247 Level 3Asset-backed nonrecourse notes (2) 579 579 Level 3Other nonrecourse debt 111 101 Level 3Derivative liabilities 1 1 Level 2
(1) The amortized cost of our investments available-for-sale as of December 31, 2015, was $31 million.(2) Carrying value of asset-based nonrecourse notes excludes unamortized debt issuance costs.
As of December 31, 2014
FairValue
CarryingValue Level
(dollars in millions)
AssetsFinancing receivables (1) $598 $553 Level 3Financing receivables held-for-sale 62 62 Level 3Investments available-for-sale (2) 27 27 Level 3LiabilitiesCredit facility $316 $316 Level 3Asset-backed nonrecourse notes (3) 208 208 Level 3Other nonrecourse debt 127 113 Level 3
(1) An allowance for loan losses of $1.2 million was included in the carrying value of the financing receivablesas of December 31, 2014. There was no allowance for loan losses outstanding as of December 31, 2015.
(2) The amortized cost of our investments available-for-sale as of December 31, 2014, was $27 million.(3) Carrying value of asset-backed nonrecourse notes excludes unamortized debt issuance costs.
- 107 -

Investments
During 2014 as part of our portfolio management process, we sold an investment designated as held-to-maturity. As a result, we have transferred all of our remaining investments in debt securities to investmentsavailable-for-sale at fair value. The following table reconciles the beginning and ending balances for our Level 3investments that are carried at fair value on a recurring basis following the transfer of our investments toavailable-for-sale:
For the year endedDecember 31,
2015 2014
(dollars in millions)
Balance, beginning of period $ 27 $—Transfers to / purchases of available-for-sale debt
securities. 33 83Payments on available-for-sale debt securities (8) —Sale of available-for-sale debt securities (22) (60)Unrealized gains on debt securities transferred to
available for sale — 5Gains on debt securities recorded in earnings 1 3Losses on debt securities recorded in OCI (2) (4)
Balance, end of Period $ 29 $ 27
For investments held at fair value, we used a range of interest rate spreads of 3% to 5% based uponcomparable transactions.
Interest Rate Swap Agreements
The fair values of the derivative financial instruments are determined using widely accepted valuationtechniques including discounted cash flow analysis on the expected cash flows of each derivative. We havedetermined that the significant inputs, such as interest yield curves and discount rates, used to value ourderivatives fall within Level 2 of the fair value hierarchy and that the credit valuation adjustments associatedwith our counterparties and our own credit risk utilize Level 3 inputs, such as estimates of current credit spreadsto evaluate the likelihood of our or our counterparties default. As of December 31, 2015, we assessed thesignificance of the impact of the credit valuation adjustments on the overall valuation of our derivative positionsand determined that the credit valuation adjustments were not significant to the overall valuation of ourderivatives. As a result, we determined that our derivative valuations in their entirety are classified in Level 2 ofthe fair value hierarchy. The fair values of the derivative financial instruments are included in the accountspayable, accrued expenses and other line item in the consolidated balance sheets.
Non-recurring Fair Value Measurements
Our financial statements may include non-recurring fair value measurements related to acquisitions, if any.Assets acquired in a business combination are recorded at their fair value. We use third party valuation firms toassist us with developing our estimates of fair value.
- 108 -

Concentration of Credit Risk
Financing receivables, investments and leases consist of primarily U.S. federal government-backedreceivables, investment grade state and local government receivables and receivables from various sustainableinfrastructure projects and do not, in our view, represent a significant concentration of credit risk. See Note 6 foran analysis by type of obligor. As described above, we do not believe we have a significant credit exposure to ourinterest rate swap providers. We had cash deposits that are subject to credit risk as shown below:
December 31,
2015 2014
(dollars in millions)
Cash Deposits $43 $58Restricted Cash Deposits (included in Other assets) 36 12
Total Cash Deposits 79 70Amount of Cash Deposits in excess of amounts federally
insured $75 $66
4. Non-Controlling Interest
Non-Controlling Interest in Consolidated Entities
Units of limited partnership interests in the Operating Partnership (“OP units”) that are owned by limitedpartners other than the Company are included in non-controlling interest on our consolidated balance sheets. Theoutstanding OP units held by outside limited partners represents approximately 1% of our outstanding OP unitsand are redeemable for cash, or at our option, for a like number of shares of our common stock. We exchanged46,290 OP units held by our non-controlling interest holders for the same number of shares of our common stockduring the year ended December 31, 2015. For the year ended December 31, 2014, we redeemed 131,093 OPunits held by our non-controlling interest holders for cash of $1.8 million. The non-controlling interest holdersare generally allocated their pro rata share of income, other comprehensive income and equity transactions.
5. Securitization of Receivables
The following summarizes certain transactions with our securitization trusts:
Year ended December 31,
2015 2014 2013
(dollars in millions)
Gains on securitizations $ 8 $ 9 $ 6Purchase of receivables securitized $286 $248 $260Proceeds from securitizations $294 $257 $266Residual and servicing assets included in Other Assets $ 9 $ 6 $ 5Cash received from residual and servicing assets $ 2 $ 2 $ 1
In connection with securitization transactions, we typically retain servicing responsibilities and residualassets. In certain instances, we receive annual servicing fees ranging from 0.05% to 0.20% of the outstandingbalance. Included in other assets in our consolidated balance sheets are our servicing assets at amortized cost andour residual assets at fair value. Our residual assets are subordinate to investors’ interests, and their values aresubject to credit, prepayment and interest rate risks on the transferred financial assets. The investors and thesecuritization trusts have no recourse to our other assets for failure of debtors to pay when due. In computinggains and losses on securitizations, we use the same 8% discount rate we use for the fair value calculation ofresidual assets, which is determined based on a review of comparable market transactions.
As of December 31, 2015 and 2014, our managed assets totaled $3.2 billion and $2.5 billion, of which $1.8billion and $1.7 billion were securitized assets held in unconsolidated securitization trusts. There were no
- 109 -

securitization credit losses in 2015, 2014 or 2013, and no material securitization delinquencies as ofDecember 31, 2015 and 2014. The securitized assets consist of financing receivables from contracts for theinstallation of energy efficiency and other technologies in facilities owned by, or operated for or by, the federalgovernment where the ultimate obligor is the U.S. federal government. The contracts may have guarantees ofenergy savings from third party service providers, the majority of which are entities rated investment grade by anindependent rating agency. Based on the nature of the receivables and experience-to-date, we do not currentlyexpect to incur any credit losses on the receivables sold.
6. Our Portfolio
As of December 31, 2015, our Portfolio included approximately $1.3 billion of financing receivables,investments, real estate and equity method investments on our balance sheet. The financing receivables andinvestments are typically collateralized by contractually committed debt obligations of government entities orprivate high credit quality obligors and are often supported by additional forms of credit enhancement, includingsecurity interests and supplier guaranties. The real estate is typically land and related lease intangibles for long-term leases to wind and solar projects with high credit quality obligors. The equity method investments representour minority equity investments in wind projects.
The following is an analysis of our Portfolio by type of obligor and credit quality as of December 31, 2015:
Investment Grade
Government (1)
CommercialInvestmentGrade (2)
CommercialNon-Investment
Grade (3)
Subtotal,Debt and
RealEstate
EquityMethod
Investments (4) Total
(dollars in millions)
Financing receivables $401 $383 $— $ 784 $— $ 784Financing receivables held-for-sale 60 — — 60 — 60Investments — 16 13 29 — 29Real estate (5) — 156 — 156 — 156Equity method investments — — — — 319 319
Total $461 $555 $ 13 $1,029 $319 $1,348
% of Debt and Real Estate Portfolio 45% 54% 1% 100% N/A N/AAverage Remaining Balance (6) $ 12 $ 9 $ 13 $ 10 $ 27 $ 12
(1) Transactions where the ultimate obligor is the U.S. federal government or state or local governments wherethe obligors are rated investment grade (either by an independent rating agency or based upon our internalcredit analysis). This amount includes $297 million of U.S. federal government transactions and $164million of transactions where the ultimate obligors are state or local governments. Transactions may haveguaranties of energy savings from third party service providers, the majority of which are entities ratedinvestment grade by an independent rating agency.
(2) Transactions where the projects or the ultimate obligors are commercial entities, including institutions suchas hospitals or universities, that have been rated investment grade (either by an independent rating agency orbased on our internal credit analysis). Of this total, $12 million of the transactions have been ratedinvestment grade by an independent rating agency. Commercial investment grade financing receivablesinclude $175 million of internally rated residential solar loans where the cash flows which support ourfinancing receivables are subordinated to the tax equity investors (whose return is largely derived from therenewable energy tax incentives) and for which we rely on certain tax related indemnities of the publiclytraded residential solar provider.
(3) Transactions where the projects or the ultimate obligors are commercial entities, including institutions suchas hospitals or universities, that have ratings below investment grade (either by an independent ratingagency or using our internal credit analysis).
(4) Consists of ownership interests in operating wind projects in which we earn a preferred return.
- 110 -

(5) Includes the real estate and the lease intangible assets through which we receive scheduled lease payments,typically under long-term triple net lease agreements.
(6) Excludes 77 transactions each with outstanding balances that are less than $1 million and that in theaggregate total $26 million.
The components of financing receivables of December 31, 2015 and 2014 were as follows:
December 31,
2015 2014
(dollars in millions)
Financing receivablesFinancing or minimum lease payments (1) $1,025 $ 723Unearned interest income (238) (166)Allowance for credit losses — (1)Unearned fee income, net of initial direct costs (3) (3)
Financing receivables (1) $ 784 $ 553
(1) Excludes $60 million and $62 million in financing receivables held-for-sale at December 31, 2015 and2014, respectively.
In accordance with the terms of certain financing receivables purchase agreements, payments of thepurchase price is scheduled to be made over time, generally within twelve months of entering into thetransaction, and as a result, we have recorded deferred funding obligations of $108 million and $88 million as ofDecember 31, 2015 and 2014, respectively.
The following table provides a summary of our anticipated maturity dates of our financing receivables andinvestments and the weighted average yield for each range of maturities as of December 31, 2015:
Total Less than 1 year 1-5 years 5-10 yearsMore than 10
years
(dollars in millions)
Financing Receivables (1)Payment due by period $784 $— $122 $52 $610Weighted average yield by period 5% — % 6% 5% 5%InvestmentsPayment due by period $ 29 $ 13 $— $ 1 $ 15Weighted average yield by period 5% 6% — % 5% 4%
(1) Excludes financing receivables held-for-sale of $60 million.
Our real estate is leased to renewable energy projects, typically under long-term triple net leases withexpiration dates that range between the years 2033 and 2045 under the initial terms and 2047 and 2080 if allextensions are exercised. The components of our real estate portfolio as of December 31, 2015 and 2014 were asfollows:
December 31,
2015 2014
(dollars in million)
Real EstateLand $129 $ 91Real estate related intangibles 28 23Accumulated amortization of real estate intangibles (1) (0)
Real Estate $156 $114
- 111 -

There are conservation easement agreements covering several of our properties that limit the use of theproperty upon expiration of the respective leases. The real estate related intangible assets are amortized on astraight-line basis over the contracted lease term. As of December 31, 2015, the future amortization expense ofthese intangible assets is as follows:
(dollars in millions)
Year Ending December 31,2016 $ 12017 12018 12019 12020 1Thereafter 22
Total $27
As of December 31, 2015, the future minimum rental income payments under our land lease agreements isas follows:
(dollars in millions)
Year Ending December 31,2016 $ 82017 92018 102019 102020 10Thereafter 250
Total $297
In December 2013, we recorded an allowance of $11.0 million on the remaining $11.8 million balance of a$24 million loan made in May 2013 to a wholly owned subsidiary of EnergySource LLC (“EnergySource”) to beused for a geothermal project. In November 2014, we entered into a Forbearance and Mutual Release Agreementwith EnergySource under which in full satisfaction of the remaining balance of our loan, we would realize aportion of the proceeds from the sale of land held by EnergySource in an estimated amount of $0.8 million. As aresult of this agreement, we charged off $9.8 million of the receivable against the allowance, resulting in aremaining allowance of $1.2 million. During the year ended December 31, 2015, we collected the $0.8 millionbalance, as a final recovery from the EnergySource loan and therefore, we charged off the remaining loanbalance of $1.2 million against the allowance of $1.2 million. There was no effect on the statement of operationsfor this loan during the years ended December 31, 2015 and 2014. For the year ended December 31, 2013, theloan had an average balance of $24.7 million and we recorded and collected interest income on the loan of $2.4million. Certain of our executive officers and directors own an indirect minority interest in EnergySourcefollowing the distribution of the Predecessor’s ownership interest prior to our IPO.
We had no other financing receivables, investments or leases that were impaired or on nonaccrual status asof December 31, 2015, 2014 or 2013. We did not have any loan modifications that qualify as trouble debtrestructurings for the years ended December 31, 2015, 2014, or 2013.
7. Credit Facility
We have a senior secured revolving credit facility which provides for total maximum advances of $1.5billion with the aggregate amount outstanding at any point in time of $500 million and which consists of twocomponents, the G&I Facility and the PF Facility. The “G&I Facility” can be used to leverage certain qualifyinggovernment and institutional financings entered into by us and the “PF Facility” can be used to leverage certainqualifying project financings entered into by us.
- 112 -

The facility was originally entered into in 2013 and has been amended a number of times, including inJanuary 2016. The effect of the various amendments has been to increase the size, flexibility and allocation of thefacility and extend the termination date to July 19, 2019. The limit of borrowing at any point in time and the totalmaximum advances is summarized below:
Limit of Borrowing at anypoint in time Maximum Total Advances
As of G&I Facility PF Facility G&I Facility PF Facility
(dollars in millions)
December 31, 2014 $125 $325 $375 $ 975December 31, 2015 $150 $350 $450 $1,050January 2016 $250 $250 $600 $ 900
Loans under the G&I Facility bear interest at a rate equal to the London Interbank Offered Rate (“LIBOR”)plus 1.5% or, under certain circumstances, 1.5% plus the highest of (i) the Federal Funds Rate plus 0.5%, (ii) therate of interest publicly announced by Bank of America from time to time as its “prime rate,” and (iii) LIBORplus 1.0%. Loans under the PF Facility bear interest at a rate equal to LIBOR plus 2.5% or, under certaincircumstances, 2.5% plus the highest of (i) the Federal Funds Rate plus 0.5%, (ii) the rate of interest publiclyannounced by Bank of America from time to time as its “prime rate,” and (iii) LIBOR plus 1.0%. Under the PFFacility, we also have the option to borrow at a fixed rate of interest until the expiration of the credit facility inJuly 2019. The fixed rate is determined by agreement with the Administrative Agent and is based on theprevailing US SWAP rate of an equivalent term to the average-life of the fixed rate portion of the borrowing plusan agreed upon margin. The loans are made through wholly-owned special purpose subsidiaries (the“Borrowers”) and we have guaranteed the obligations of the Borrowers under the credit facility pursuant to (x) aContinuing Guaranty, dated July 19, 2013, and (y) a Limited Guaranty, dated July 19, 2013, both as amended andrestated.
Any financing we propose to be included in the borrowing base as collateral under the facility is subject tothe approval of the administrative agent in its sole discretion and the payment of a placement fee. We may, withthe consent of the administrative agent, borrow against new projects before such projects become ApprovedFinancings (as defined in the PF Facility loan agreement) but after they have been pledged as collateral. Theamount eligible to be drawn under the facility for purposes of financing such investments will be based on adiscount to the value of each investment or an applicable valuation percentage. Under the G&I Facility, theapplicable valuation percentage for non-delinquent investments is 85% in the case of a U.S. federal governmentobligor, 80% in the case of an institutional obligor or a state and local obligor, and with respect to other obligorsor in certain circumstances, such other percentage as the administrative agent may prescribe. Under the PFFacility, the applicable valuation percentage is 67% or such other percentage as the administrative agent mayprescribe. The sum of approved financings after taking into account the valuation percentages and any changes inthe valuation of the financings in accordance with the loan agreements determines the borrowing capacity,subject to the overall facility limits described above.
The following table provides additional detail on our credit facility as of December 31, 2015 and 2014:
December 31,
2015 2014
(dollars in millions)
Outstanding balance $247 $316Value of collateral pledged to credit facility $356 $422Weighted average short-term borrowing rate 2.3% 2.4%
We incurred approximately $12 million of costs associated with the credit facility that have been capitalized(included in other assets on the consolidated balance sheets) and will be amortized on a straight-line basis over
- 113 -
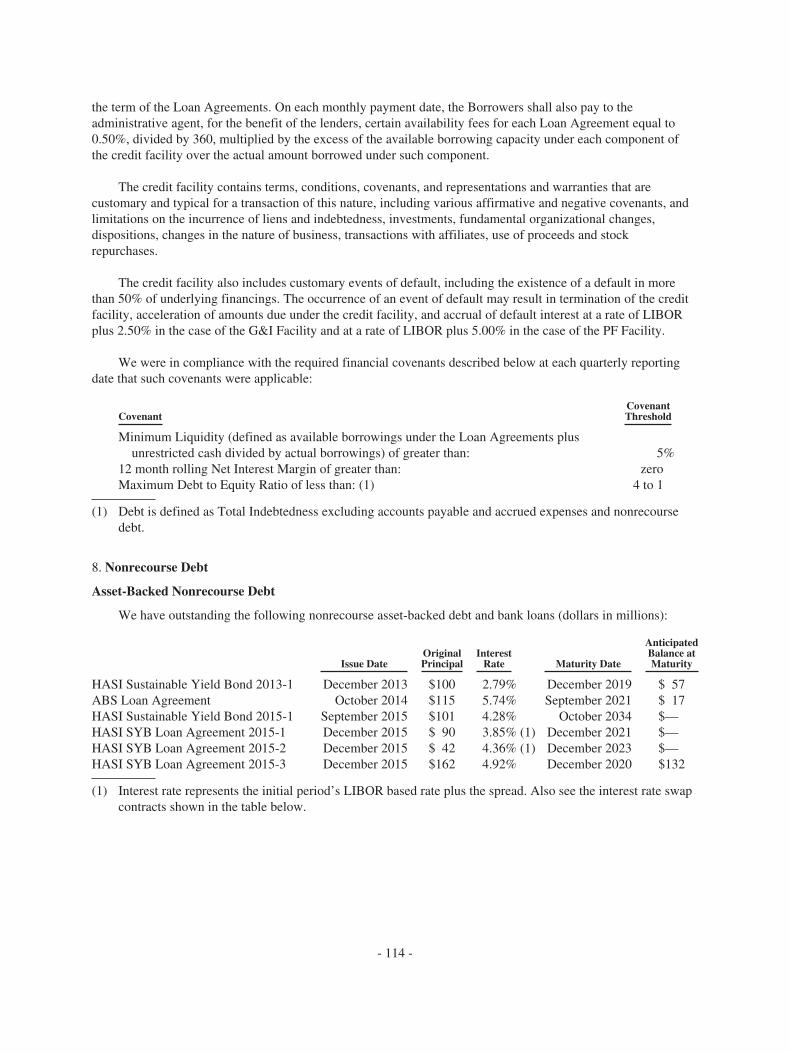
the term of the Loan Agreements. On each monthly payment date, the Borrowers shall also pay to theadministrative agent, for the benefit of the lenders, certain availability fees for each Loan Agreement equal to0.50%, divided by 360, multiplied by the excess of the available borrowing capacity under each component ofthe credit facility over the actual amount borrowed under such component.
The credit facility contains terms, conditions, covenants, and representations and warranties that arecustomary and typical for a transaction of this nature, including various affirmative and negative covenants, andlimitations on the incurrence of liens and indebtedness, investments, fundamental organizational changes,dispositions, changes in the nature of business, transactions with affiliates, use of proceeds and stockrepurchases.
The credit facility also includes customary events of default, including the existence of a default in morethan 50% of underlying financings. The occurrence of an event of default may result in termination of the creditfacility, acceleration of amounts due under the credit facility, and accrual of default interest at a rate of LIBORplus 2.50% in the case of the G&I Facility and at a rate of LIBOR plus 5.00% in the case of the PF Facility.
We were in compliance with the required financial covenants described below at each quarterly reportingdate that such covenants were applicable:
CovenantCovenantThreshold
Minimum Liquidity (defined as available borrowings under the Loan Agreements plusunrestricted cash divided by actual borrowings) of greater than: 5%
12 month rolling Net Interest Margin of greater than: zeroMaximum Debt to Equity Ratio of less than: (1) 4 to 1
(1) Debt is defined as Total Indebtedness excluding accounts payable and accrued expenses and nonrecoursedebt.
8. Nonrecourse Debt
Asset-Backed Nonrecourse Debt
We have outstanding the following nonrecourse asset-backed debt and bank loans (dollars in millions):
Issue DateOriginalPrincipal
InterestRate Maturity Date
AnticipatedBalance atMaturity
HASI Sustainable Yield Bond 2013-1 December 2013 $100 2.79% December 2019 $ 57ABS Loan Agreement October 2014 $115 5.74% September 2021 $ 17HASI Sustainable Yield Bond 2015-1 September 2015 $101 4.28% October 2034 $—HASI SYB Loan Agreement 2015-1 December 2015 $ 90 3.85% (1) December 2021 $—HASI SYB Loan Agreement 2015-2 December 2015 $ 42 4.36% (1) December 2023 $—HASI SYB Loan Agreement 2015-3 December 2015 $162 4.92% December 2020 $132
(1) Interest rate represents the initial period’s LIBOR based rate plus the spread. Also see the interest rate swapcontracts shown in the table below.
- 114 -

Outstanding amounts under the nonrecourse asset-backed debt agreements and bank loans and the value ofassets pledged as security are as follows (dollars in millions):
OutstandingBalance as ofDecember 31,
Value of AssetsPledged as ofDecember 31,
2015 2014 2015 2014 Description of Assets Pledged
HASI Sustainable Yield Bond 2013-1 $ 83 $ 92 $ 99 $104 Financing receivablesABS Loan Agreement $102 $116 $117 $144 Equity interest in Strong Upwind
Holdings I, LLCHASI Sustainable Yield Bond 2015-1 $100 $— $139 $— Financing receivables, real estate and
real estate intangiblesHASI SYB Loan Agreement 2015-1 $ 90 $— $117 $— Equity interest in Strong Upwind
Holdings II and III, LLC, relatedinterest rate swap
HASI SYB Loan Agreement 2015-2 $ 42 $— $ 71 $— Equity interest in Buckeye WindEnergy Class B Holdings LLC,related interest rate swap
HASI SYB Loan Agreement 2015-3 $162 $— $175 $— Residential Solar Financingreceivables
Debt issuance costs $ (16) $ (2)
Asset-backed nonrecourse debt $563 $206
We have pledged the ownership interest in the relevant assets or the relevant assets themselves tobankruptcy remote entities as security for the nonrecourse debt. The assets and credit of these entities are notavailable to satisfy any of our other debts and obligations, except as set forth in the debt agreements. The debtorscan only look to the cash flows of the pledged assets to satisfy the debt and we are not liable for nonpayment ofsuch cash flows. The debt agreements contain terms, conditions, covenants, and representations and warrantiesthat are customary and typical for a transaction of this nature, including limitations on the incurrence of liens andindebtedness, investments, fundamental organizational changes, dispositions, changes in the nature of business,transactions with affiliates, use of proceeds and stock repurchases. The agreements also include customary eventsof default, the occurrence of which may result in termination of the agreements, acceleration of amounts due, andaccrual of default interest. We typically act as servicer for the debt transactions.
We have guaranteed the performance of the representations and warranties and other obligations of certainof our subsidiaries under certain of the debt agreements and provided an indemnify against certain losses from“bad acts” of such subsidiaries including fraud, failure to disclose a material fact, theft, misappropriation,voluntary bankruptcy or unauthorized transfers. In the case of the debt secured by our wind equity interests, wehave also guarantied our compliance with certain tax matters and certain obligations if JPMorgan exercises itsright to withdraw from our partnerships.
The HASI Sustainable Yield Bond (“HASI SYB”) 2015-1 consists of two notes, (i) $101 million inaggregate principal amount of 4.28% HASI SYB 2015-1A, Class A Bonds (the “Class A Bonds”) and (ii) $18million in aggregate principal amount of 5.0% HASI SYB 2015-1B, Class B Bonds (the “Class B Bonds”), bothwith an anticipated repayment date in October 2034. The Class A Bonds rank senior to the Class B Bonds inpriority of payment. We retained the Class B Bonds. The other loan and debt transactions were negotiated with,and held by, commercial banks, including one loan agreement that has a corporate financial subsidiary as a co-lender.
- 115 -

In connection with several of our nonrecourse debt borrowings, we have entered into the following interestrate swaps which are designated as cash flow hedges (dollars in millions):
Notional Valueas of December 31,
Fair Valueas of
December 31,
Base RateHedged
Rate 2015 2014 2015 2014 Term
HASI SYB Loan Agreement 2015-1 3 month Libor 1.55% $ 81 $— $(0.3) $— September 2021HASI SYB Loan Agreement 2015-2 3 month Libor 1.52% $ 38 $— $(0.1) $— December 2015 to
December 2018HASI SYB Loan Agreement 2015-2 3 month Libor 2.55% $ 29 $— $(0.2) $— December 2018 to
December 2024
Total $148 $— $(0.6) $—
The total fair value of our hedges relating to interest rate hedges that are effective in offsetting variable cashflows is reflected as unrealized losses in accumulated other comprehensive income and in Accounts payable,accrued expenses and other in the accompanying consolidated balance sheet. As of December 31, 2015, all of ourderivatives were designated as hedging instruments and there was no ineffectiveness recorded on our designatedhedges and no portion of the Accumulated other comprehensive income, net of associated deferred income taxeffects was reclassified into interest expense. As of December 31, 2014 or 2013, we did not hold any derivatives.
Other Nonrecourse Debt
We have other nonrecourse debt that was used to finance certain of our financing receivables for the term ofthe financing receivables. Amounts due under nonrecourse notes are secured by financing receivables with acarrying value of approximately $97 million and $108 million as of December 31, 2015 and 2014, respectively,and there is no recourse to our general assets. Debt service payment requirements, in a majority of cases, areequal to or less than the cash flows received from the underlying financing receivables.
Additional information related to other nonrecourse debt by interest rate is as follows:
As of December 31, 2015 Balance Maturity
(dollars in millions)
Fixed-rate promissory notes, interest rates from 2.26% to5.00% per annum $ 33 2017 to 2032
Fixed-rate promissory notes, interest rates from 5.01% to6.50% per annum 46 2017 to 2031
Fixed-rate promissory notes, interest rates from 6.51% to8.00% per annum 22 2019 to 2031
Other nonrecourse debt $101
As of December 31, 2014 Balance Maturity
(dollars in millions)
Fixed-rate promissory notes, interest rates from 2.06% to5.00% per annum $ 32 2015 to 2032
Fixed-rate promissory notes, interest rates from 5.01% to6.50% per annum 58 2015 to 2031
Fixed-rate promissory notes, interest rates from 6.51% to8.00% per annum 23 2015 to 2031
Other nonrecourse debt $113
- 116 -

The stated minimum maturities of nonrecourse debt as of December 31, 2015, were as follows:
Nonrecourse Debt
As of December 31,Asset Backed
Nonrecourse NotesOther Nonrecourse
Debt Total
(dollars in millions)
2016 $ 30 $ 18 $ 482017 31 14 452018 31 7 382019 92 4 962020 168 4 172Thereafter 227 54 281
Total minimum maturities 579 101 680Deferred Financing Costs, net (16) — (16)
$563 $101 $664
9. Commitments and Contingencies
Leases
We lease office space at our headquarters in Annapolis, Maryland under an operating lease entered into inJuly 2011 and amended in October 2013 to add additional space. The lease provides for operating expensereimbursements and annual escalations that are amortized over the respective lease terms on a straight-line basis.Lease payments under this lease commenced in March 2012 and incremental payments related to the amendmentcommenced in March 2014. The lease expires in 2022.
Rent expense was $0.5 million, $0.5 million, and $0.3 million for the years ended December 31, 2015, 2014,and 2013, respectively.
Future gross minimum lease payments are less than $0.5 million per year during the remaining term of thelease.
Litigation
The nature of our operations exposes us to the risk of claims and litigation in the normal course of ourbusiness. Other than non-material litigation arising out of the ordinary course of business, we are not currentlysubject to any legal proceedings that are probable of having a material adverse effect on our financial position,results of operations or cash flows.
10. Income Tax
We recorded a tax expense of $0 million for the years ended December 31, 2015, 2014 and 2013,respectively, related to the activities of our TRS. The income tax expense and benefits recorded were determinedusing a federal rate of 35% and a combined state rate, net of federal benefit, of 5%. The effective tax rate for theTRS for the year ended December 31, 2015, was (1)%, which is below the combined statutory tax rate of 40%primarily due to the establishment of a valuation allowance of approximately $2 million related to incomestatement items. The effective tax rate for the TRS for the year ended December 31, 2014, was 0%, which isbelow the combined statutory tax rate of 40% primarily as a result of the release of a valuation allowance ofapproximately $2.5 million.
During 2014, we transferred an asset to our TRS that had a tax basis in excess of its book basis. Werecognized a deferred tax asset for the amount we expect to be realizable. Because the transfer was done amongstentities under common control, we recorded the $1.9 million impact of the transaction to additional paid incapital.
- 117 -

We recorded a deferred tax liability of $0 million as of December 31, 2015 and 2014, respectively, related tothe activities of our TRS. Our deferred tax liability is included in Accounts payable, accrued expenses and otheron our consolidated balance sheet. Deferred income taxes represent the tax effect from continuing operations ofthe differences between the book and tax basis of assets and liabilities, and for equity-based compensation itrepresents the impact of the vesting of restricted stock. Deferred tax assets (liabilities) include the following as ofDecember 31:
2015 2014
(dollars in millions)
Financing receivable basis difference $ (6) $ (6)Other (2) (0)
Gross deferred tax liabilities (8) (6)
Net operating loss (NOL) carryforwards 9 4Equity-based compensation 2 1Other 0 1Valuation allowance (3) —
Gross deferred tax assets 8 6
Net deferred tax liabilities $— $—
The ability to carryforward our NOL of approximately $23 million will begin to expire in 2034 for federaland state tax purposes if not utilized. If our TRS entities were to experience a change in control as defined inSection 382 of the Internal Revenue Code, the TRS’s ability to utilize NOL in the years after the change incontrol would be limited.
We have no examinations in progress, none are expected at this time, and years 2012 through 2014 are open.As of December 31, 2015 and 2014, we had no uncertain tax positions. Our policy is to recognize interestexpense and penalties related to income tax matters as a component of other expense. There was no accruedinterest and penalties as of December 31, 2015 and 2014, and no interest and penalties were recognized during2015, 2014, or 2013.
For federal income tax purposes, the cash dividends paid for the years ended December 31, 2015 and 2014are characterized as follows:
2015 2014
Common distributionsOrdinary income 23% 5%Return of capital 77% 95%
100% 100%
As our aggregate distributions paid in 2015 and 2014 exceeded our taxable earnings and profits for suchyear:
• the January 2016 distribution declared in the fourth quarter of 2015, and payable to shareholders ofrecord as of December 30, 2015, will be treated as a 2016 distribution for federal income tax purposesand is not included in the 2015 tax characterization shown above, and
• the January 2015 distribution declared in the fourth quarter of 2014, and payable to shareholders ofrecord as of December 19, 2014, will be treated as a 2015 distribution for federal income tax purposesand is not included in the 2014 tax characterization shown above
- 118 -

11. Equity
Dividends and Distributions
Our board of directors declared the following dividends in 2014 and 2015:
Announced Date Record Date Pay Date Amount per share
3/13/14 3/27/14 4/9/14 $0.226/17/14 6/27/14 7/10/14 $0.229/16/14 9/26/14 10/9/14 $0.2212/8/14 12/19/14 1/9/15 $0.263/17/15 3/30/15 4/9/15 $0.266/16/15 6/30/15 7/9/15 $0.269/16/15 9/30/15 10/8/15 $0.2612/15/15 12/30/15 1/7/16 $0.30
We completed the following public offerings of common stock:
Closing DateSharesIssued 1
PricePer Share
NetProceeds 2
(amounts in millions, except per share amounts)
4/23/13 14.15 $12.50 $1604/29/14 5.75 $13.00 $ 7010/31/14 4.60 $13.60 $ 595/4/15 4.60 $18.50 $ 8210/19/15 5.75 $18.00 $ 99
1 Includes shares issued in connection with the exercise of the underwriters’ option to purchase additionalshares.
2 Net proceeds from the offerings is shown after deducting underwriting discounts, commissions, otheroffering costs and, in the case of our IPO, formation transaction costs.
Awards of Shares of Restricted Common Stock under our 2013 Plan
We recognize equity-based compensation expense as described in Note 2 and have issued both awards withservice conditions and awards with both service and performance conditions. During the year endedDecember 31, 2015, our board of directors awarded employees and directors 196,517 shares of restrictedcommon stock that vest in 2015 to 2019 and 390,131 shares of restricted common stock to certain employees thatvest upon the achievement of certain performance targets. As of December 31, 2015, we have concluded that it isprobable that the performance conditions will be met.
For the years ended December 31, 2015 and 2014, we recorded $11 million and $5 million of equity-basedcompensation expense, respectively. For the year ended December 31,2013, we recorded $7 million of equity-based compensation expense, including the compensation expense associated with the reallocation ofPredecessor’s membership units to employees at the time of the IPO. The total unrecognized compensationexpense related to awards of shares of restricted common stock was $9 million as of December 31, 2015, that isexpected to be recognized over a weighted-average term of approximately two years. The calculation of theequity-based compensation expense assumes a forfeiture rate up to 5%.
- 119 -
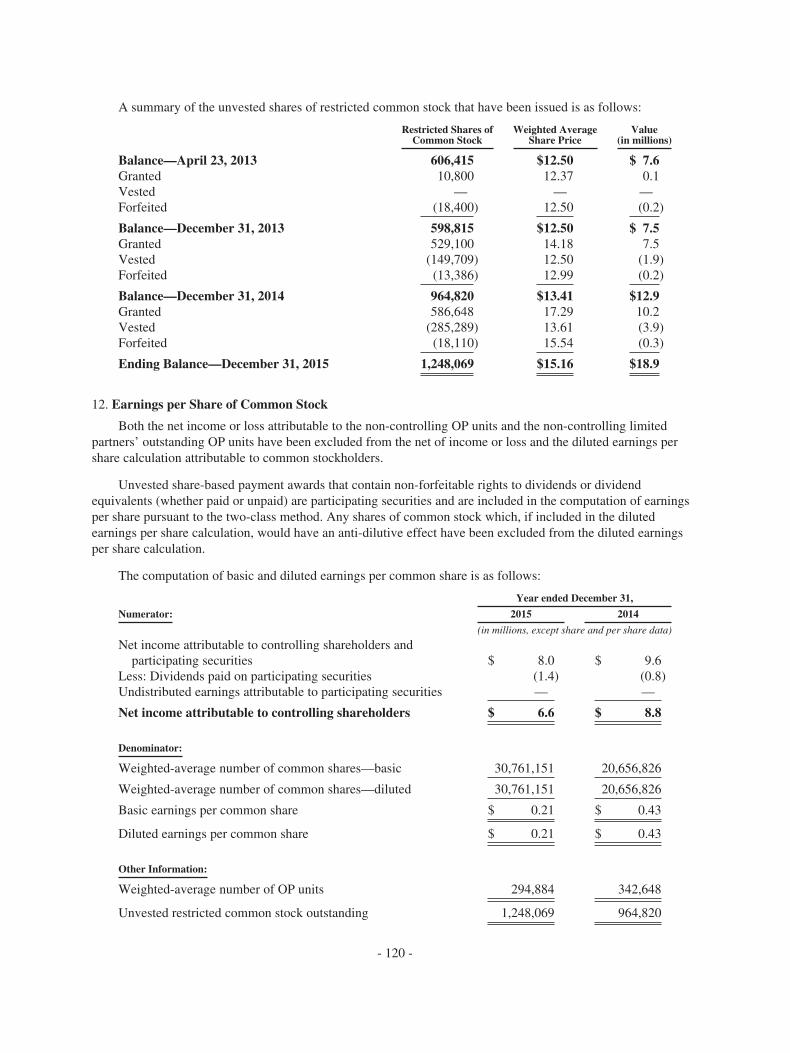
A summary of the unvested shares of restricted common stock that have been issued is as follows:
Restricted Shares ofCommon Stock
Weighted AverageShare Price
Value(in millions)
Balance—April 23, 2013 606,415 $12.50 $ 7.6Granted 10,800 12.37 0.1Vested — — —Forfeited (18,400) 12.50 (0.2)
Balance—December 31, 2013 598,815 $12.50 $ 7.5Granted 529,100 14.18 7.5Vested (149,709) 12.50 (1.9)Forfeited (13,386) 12.99 (0.2)
Balance—December 31, 2014 964,820 $13.41 $12.9Granted 586,648 17.29 10.2Vested (285,289) 13.61 (3.9)Forfeited (18,110) 15.54 (0.3)
Ending Balance—December 31, 2015 1,248,069 $15.16 $18.9
12. Earnings per Share of Common Stock
Both the net income or loss attributable to the non-controlling OP units and the non-controlling limitedpartners’ outstanding OP units have been excluded from the net of income or loss and the diluted earnings pershare calculation attributable to common stockholders.
Unvested share-based payment awards that contain non-forfeitable rights to dividends or dividendequivalents (whether paid or unpaid) are participating securities and are included in the computation of earningsper share pursuant to the two-class method. Any shares of common stock which, if included in the dilutedearnings per share calculation, would have an anti-dilutive effect have been excluded from the diluted earningsper share calculation.
The computation of basic and diluted earnings per common share is as follows:
Year ended December 31,
Numerator: 2015 2014
(in millions, except share and per share data)
Net income attributable to controlling shareholders andparticipating securities $ 8.0 $ 9.6
Less: Dividends paid on participating securities (1.4) (0.8)Undistributed earnings attributable to participating securities — —
Net income attributable to controlling shareholders $ 6.6 $ 8.8
Denominator:
Weighted-average number of common shares—basic 30,761,151 20,656,826
Weighted-average number of common shares—diluted 30,761,151 20,656,826
Basic earnings per common share $ 0.21 $ 0.43
Diluted earnings per common share $ 0.21 $ 0.43
Other Information:
Weighted-average number of OP units 294,884 342,648
Unvested restricted common stock outstanding 1,248,069 964,820
- 120 -

13. Equity Method Investments in Affiliate
Strong Upwind
As described in Notes 1 and 2, we have noncontrolling equity investments in entities that own minorityinterests in wind projects. During the year ended December 31, 2015, we recognized a loss of $0.1 million, fromour equity method investments. We did not have any income or loss from our equity method investments in2014.
The following is a summary of the consolidated financial position and results of operations of the significantholding companies, accounted for using the equity method:
As of and for thenine months ended
September 30,2015
As of and for theyear ended
December 31,2014
(in millions, unaudited)
Current Assets $ 46 $ 62Total Assets $1,420 $1,501Current Liabilities $ 12 $ 18Total Liabilities $ 59 $ 66Members’ Equity $1,361 $1,435Revenue $ 109 $ 154Income from Continuing Operations $ 22 $ 44Net Income $ 22 $ 44
14. Intangible Assets and Goodwill
During the year ended December 31, 2014, we recorded goodwill of $2 million related to the real estateacquisitions described in Note 1. We also recorded real estate related lease intangibles that are described inNote 6.
In connection with a business purchase combination, which occurred in 2007, we recorded intangible assetsof $5 million to be amortized over their estimated useful life and goodwill of $4 million. Based on our annualgoodwill impairment test, we determined that the goodwill of the reporting unit is considered not impaired as itsfair value exceeds the carrying amount. The remaining unamortized balance of the intangible assets was $1million as of December 31, 2015 and $2 million as of December 31, 2014. Intangible amortization expense ineach of the years ended December 31, 2015 and 2014 was $0.2 million and $0.3 million for the year endedDecember 31, 2013. Future amortization expenses related to non real estate related amortizable intangible assetsat December 31, 2015 will be approximately $0.2 million annually through the year ending December 31, 2021.Non real estate intangible assets and goodwill are included in the other assets line item in the consolidatedbalance sheets.
15. Defined Contribution Plan
We administer a 401(k) savings plan, a defined contribution plan covering substantially all of ouremployees. Employees in the plan may contribute up to the maximum annual IRS limit before taxes via payrolldeduction. Under the plan, we provide a dollar for dollar match for the first 4% of the employee’s contributionsand a $0.50 per dollar match for the next 2% of employee contributions. We contributed $0.3 million, $0.2million, and $0.2 million under the plan for the years ended December 31, 2015, 2014, and 2013, respectively.
- 121 -

16. Selected Quarterly Financial Data (Unaudited)
The following table summarizes our quarterly financial data which, in the opinion of management, reflectsall adjustments, consisting only of normal recurring adjustments, necessary for a fair presentation of our resultsof operations (Amounts for the individual quarters when aggregated may not agree to the full year due torounding, in thousands, except for per share data):
For the Three-Months Ended
March 31, 2015 June 30, 2015 Sept. 30, 2015 Dec. 31, 2015
Total Revenue, net of investment interest expense andprovision $ 7,760 $ 7,428 $ 8,354 $ 8,752
Other Expenses, net (5,636) (5,868) (6,188) (6,450)
Net income before income tax $ 2,124 $ 1,560 $ 2,166 $ 2,302
Income tax benefit (expense) 23 (76) (24) (41)
Net Income $ 2,147 $ 1,484 $ 2,142 $ 2,261
Net Income attributable to controlling shareholders $ 2,122 $ 1,470 $ 2,119 $ 2,247
Basic earnings per common share $ 0.07 $ 0.04 $ 0.06 $ 0.05Diluted earnings per common share $ 0.07 $ 0.04 $ 0.06 $ 0.05
For the Three-Months Ended
March 31, 2014 June 30, 2014 Sept. 30, 2014 Dec. 31, 2014
Total Revenue, net of investment interest expense andprovision $ 5,699 $ 7,572 $ 7,813 $ 7,536
Other Expenses, net (2,826) (5,527) (4,604) (5,867)
Net income before income tax $ 2,873 $ 2,045 $ 3,209 $ 1,669
Income tax (expense) benefit (60) 830 (607) (189)
Net Income $ 2,813 $ 2,875 $ 2,602 $ 1,480
Net Income attributable to controlling shareholders $ 2,753 $ 2,828 $ 2,564 $ 1,462
Basic earnings per common share $ 0.17 $ 0.13 $ 0.11 $ 0.05Diluted earnings per common share $ 0.17 $ 0.13 $ 0.11 $ 0.05
- 122 -

Item 9. Changes in and Disagreements with Accountants on Accounting and Financial Disclosure.
None.
Item 9A. Controls and Procedures.
A review and evaluation was performed by our management, including our Chief Executive Officer (the“CEO”) and Chief Financial Officer (the “CFO”), of the effectiveness of the design and operation of ourdisclosure controls and procedures (as such term is defined in Rules 13a-15(e) and 15d-15(e) under the ExchangeAct), as of the end of the period covered by this Form 10-K. Based on that review and evaluation, the CEO andCFO have concluded that our current disclosure controls and procedures, as designed and implemented, wereeffective. Notwithstanding the foregoing, a control system, no matter how well designed and operated, canprovide only reasonable, not absolute, assurance that it will detect or uncover failures within our company todisclose material information otherwise required to be set forth in our periodic reports.
Our management is responsible for establishing and maintaining adequate internal control over financialreporting. Internal control over financial reporting is defined in Rules 13a-15(f) and 15d-15(f) promulgated underthe Exchange Act as a process designed by, or under the supervision of, our principal executive and principalfinancial officers and effected by our board of directors, management and other personnel to provide reasonableassurance regarding the reliability of financial reporting and the preparation of financial statements for externalpurposes in accordance with U.S. GAAP and includes those policies and procedures that:
• pertain to the maintenance of records that in reasonable detail accurately and fairly reflect thetransactions and dispositions of the assets of our company;
• provide reasonable assurance that transactions are recorded as necessary to permit preparation offinancial statements in accordance with U.S. GAAP, and that our receipts and expenditures are beingmade only in accordance with authorizations of our management and directors; and
• provide reasonable assurance regarding prevention or timely detection of unauthorized acquisition, useor disposition of our assets that could have a material effect on the financial statements.
Because of its inherent limitations, internal control over financial reporting may not prevent or detectmisstatements. Projections of any evaluation of effectiveness to future periods are subject to the risks thatcontrols may become inadequate because of changes in conditions or that the degree of compliance with thepolicies or procedures may deteriorate.
Our management assessed the effectiveness of our internal control over financial reporting as ofDecember 31, 2015. In making this assessment, our management used criteria set forth by the Committee ofSponsoring Organizations of the Treadway Commission in Internal Control-Integrated Framework (2013Framework).
Based on this assessment, our management believes that, as of December 31, 2015, our internal control overfinancial reporting was effective based on those criteria.
There have been no changes in our internal control over financial reporting that occurred during the quarterended December 31, 2015 that have materially affected, or are reasonably likely to materially affect, our internalcontrol over financial reporting.
This annual report does not include an attestation report of our registered public accounting firm regardinginternal control over financial reporting pursuant to rules of the SEC that permit our company to provide onlymanagement’s report in this annual report.
Item 9B. Other Information.
None.
- 123 -

PART III
Item 10. Directors, Executive Officers and Corporate Governance.
The information regarding our directors, executive officers and certain other matters required by Item 401 ofRegulation S-K is incorporated herein by reference to our definitive proxy statement relating to our annualmeeting of stockholders (the “Proxy Statement”), to be filed with the SEC within 120 days after December 31,2015.
The information regarding compliance with Section 16(a) of the Exchange Act required by Item 405 ofRegulation S-K is incorporated herein by reference to the Proxy Statement to be filed with the SEC within 120days after December 31, 2015.
The information regarding our Code of Business Conduct and Ethics required by Item 406 of RegulationS-K is incorporated herein by reference to the Proxy Statement to be filed with the SEC within 120 days afterDecember 31, 2015.
The information regarding certain matters pertaining to our corporate governance required byItem 407(c)(3), (d)(4) and (d)(5) of Regulation S-K is incorporated by reference to the Proxy Statement to befiled with the SEC within 120 days after December 31, 2015.
Item 11. Executive Compensation.
The information regarding executive compensation and other compensation related matters required byItems 402 and 407(e)(4) and (e)(5) of Regulation S-K is incorporated herein by reference to the Proxy Statementto be filed with the SEC within 120 days after December 31, 2015.
Item 12. Security Ownership of Certain Beneficial Owners and Management and Related StockholderMatters.
The tables on equity compensation plan information and beneficial ownership of our Company required byItems 201(d) and 403 of Regulation S-K are incorporated herein by reference to the Proxy Statement to be filedwith the SEC within 120 days after December 31, 2015.
Item 13. Certain Relationships and Related Transactions and Director Independence.
The information regarding transactions with related persons, promoters and certain control persons anddirector independence required by Items 404 and 407(a) of Regulation S-K is incorporated herein by reference tothe Proxy Statement to be filed with the SEC within 120 days after December 31, 2015.
Item 14. Principal Accountant Fees and Services.
The information concerning principal accounting fees and services and the Audit Committee’s pre-approvalpolicies and procedures required by Item 14 is incorporated herein by reference to the Proxy Statement to be filedwith the SEC within 120 days after December 31, 2015.
- 124 -

PART IV
Item 15. Exhibits and Financial Statement Schedules.
Documents filed as part of the report
The following documents are filed as part of this Form 10-K in Part II, Item 8 and are incorporated by reference:
(a)(1) Financial Statements:
See index in Item 8—“Financial Statements and Supplementary Data,” filed herewith for a list of financialstatements.
(3) Exhibits Files:
Exhibitnumber Exhibit description
3.1 Articles of Amendment and Restatement of Hannon Armstrong Sustainable Infrastructure Capital,Inc. (incorporated by reference to Exhibit 3.1 to the Registrant’s Form 10-Q for the quarter endedJune 30, 2013 (No. 001-35877), filed on August 9, 2013)
3.2 Bylaws of Hannon Armstrong Sustainable Infrastructure Capital, Inc. (incorporated by referenceto Exhibit 3.2 to the Registrant’s Form 10-Q for the quarter ended June 30, 2013 (No. 001-35877),filed on August 9, 2013)
3.3 Amended and Restated Agreement of Limited Partnership of Hannon Armstrong SustainableInfrastructure, L.P. (incorporated by reference to Exhibit 3.3 to the Registrant’s Form 10-Q for thequarter ended June 30, 2013 (No. 001-35877), filed on August 9, 2013)
4.1 Specimen Common Stock Certificate of Hannon Armstrong Sustainable Infrastructure Capital,Inc. (incorporated by reference to Exhibit 4.1 to Amendment No. 3 to the Registrant’s Form S-11(No. 333-186711), filed on April 12, 2013)
10.1 Form of Indemnification Agreement (incorporated by reference to Exhibit 10.5 to AmendmentNo. 3 to the Registrant’s Form S-11 (No. 333-186711), filed on April 12, 2013)
10.2 2013 Hannon Armstrong Sustainable Infrastructure Capital, Inc. Equity Incentive Plan(incorporated by reference to Exhibit 10.1 to the Registrant’s Form 10-Q for the quarter endedJune 30, 2013 (No. 001-35877), filed on August 9, 2013)
10.3 Restricted Stock Award Agreement dated April 23, 2013 between Hannon Armstrong SustainableInfrastructure Capital, Inc. and Jeffrey W. Eckel (incorporated by reference to Exhibit 10.2 to theRegistrant’s Form 10-Q for the quarter ended June 30, 2013 (No. 001-35877), filed on August 9,2013)
10.4 Form of Restricted Stock Award Agreement (Executive Officers) (incorporated by reference toExhibit 10.3 to the Registrant’s Form 10-Q for the quarter ended June 30, 2013 (No. 001-35877),filed on August 9, 2013)
10.5 Form of Restricted Stock Award Agreement (Non-employee Directors) (incorporated by referenceto Exhibit 10.4 to the Registrant’s Form 10-Q for the quarter ended June 30, 2013(No. 001-35877), filed on August 9, 2013)
10.6 Form of Restricted Stock Unit Award Agreement (incorporated by reference to Exhibit 10.5 to theRegistrant’s Form 10-Q for the quarter ended June 30, 2013 (No. 001-35877), filed on August 9,2013)
- 125 -

10.7 Registration Rights Agreement, dated April 23, 2013, by and among Hannon ArmstrongSustainable Infrastructure Capital, Inc. and the parties listed on Schedule I thereto (incorporatedby reference to Exhibit 10.6 to the Registrant’s Form 10-Q for the quarter ended June 30, 2013(No. 001-35877), filed on August 9, 2013)
10.8 Employment Agreement, dated April 17, 2013, by and between Hannon Armstrong SustainableInfrastructure Capital, Inc. and Jeffrey Eckel (incorporated by reference to Exhibit 10.7 to theRegistrant’s Form 10-Q for the quarter ended June 30, 2013 (No. 001-35877), filed on August 9,2013)
10.9 Employment Agreement, dated April 17, 2013, by and between Hannon Armstrong SustainableInfrastructure Capital, Inc. and J. Brendan Herron, Jr. (incorporated by reference to Exhibit 10.8to the Registrant’s Form 10-Q for the quarter ended June 30, 2013 (No. 001-35877), filed onAugust 9, 2013)
10.10 Employment Agreement, dated April 17, 2013, by and between Hannon Armstrong SustainableInfrastructure Capital, Inc. and Steven L. Chuslo (incorporated by reference to Exhibit 10.9 to theRegistrant’s Form 10-Q for the quarter ended June 30, 2013 (No. 001-35877), filed on August 9,2013)
10.11 Employment Agreement, dated April 17, 2013, by and between Hannon Armstrong SustainableInfrastructure Capital, Inc. and Nathaniel J. Rose (incorporated by reference to Exhibit 10.10 tothe Registrant’s Form 10-Q for the quarter ended June 30, 2013 (No. 001-35877), filed onAugust 9, 2013)
10.12 Employment Agreement, dated April 17, 2013, by and between Hannon Armstrong SustainableInfrastructure Capital, Inc. and Marvin R. Wooten (incorporated by reference to Exhibit 10.11 tothe Registrant’s Form 10-Q for the quarter ended June 30, 2013 (No. 001-35877), filed onAugust 9, 2013)
10.13 Employment Agreement, dated April 17, 2013, by and between Hannon Armstrong SustainableInfrastructure Capital, Inc. and Daniel McMahon (incorporated by reference to Exhibit 10.3 to theRegistrant’s Form 10-Q for the quarter ended June 30, 2015 (No. 001-35877), filed on August 7,2015)
10.14 Agreement and Plan of Merger, dated as of April 23, 2013, by and among Hannon ArmstrongSustainable Infrastructure Capital, Inc., HA Merger Sub I LLC, HA Merger Sub III LLC,MissionPoint HA Parallel Fund, LLC, MissionPoint ES Parallel Fund I, L.P., MissionPoint HAParallel Fund I Corp. and MissionPoint HA Parallel Fund, L.P. (incorporated by reference toExhibit 10.12 to the Registrant’s Form 10-Q for the quarter ended June 30, 2013 (No. 001-35877),filed on August 9, 2013)
10.15 Agreement and Plan of Merger, dated as of April 23, 2013, by and among Hannon ArmstrongSustainable Infrastructure Capital, Inc., HA Merger Sub II LLC, HA Merger Sub III LLC,MissionPoint HA Parallel Fund II, LLC, MissionPoint ES Parallel Fund II, L.P. MissionPoint HAParallel Fund II Corp. and MissionPoint HA Parallel Fund, L.P. (incorporated by reference toExhibit 10.13 to the Registrant’s Form 10-Q for the quarter ended June 30, 2013 (No. 001-35877),filed on August 9, 2013)
10.16 Trust Agreement relating to HASI SYB 2013-1 Trust, dated as of December 20, 2013, amongHASI SYB 2013-1 Trust, HASI SYB I LLC, HAT SYB I LLC, The Bank of New York Mellon asTrustee and Hannon Armstrong Sustainable Infrastructure Capital, Inc. (incorporated by referenceto Exhibit 10.26 to the Registrant’s Form 10-K for the year ended December 31, 2013(No. 001-35877), filed on March 18, 2014)
- 126 -

10.17 Note Purchase Agreement, dated as of December 20, 2013, among HASI SYB 2013-1 Trust,HASI SYB I LLC, HAT SYB I LLC, The Bank of New York Mellon as Trustee and the purchaserof the notes thereunder (incorporated by reference to Exhibit 10.27 to the Registrant’s Form 10-Kfor the year ended December 31, 2013 (No. 001-35877), filed on March 18, 2014)
10.18 Unit Purchase Agreement, dated as of May 28, 2014, by and among Hannon ArmstrongSustainable Infrastructure Capital, Inc., American Wind Capital Company, LLC, NorthwharfNominees Limited, DBD AWCC LLC, NGP Energy Technology Partners II, L.P. and C.C.Hinckley Company, LLC (incorporated by reference to Exhibit 10.1 to the Registrant’sForm 10-Q for the quarter ended June 30, 2014 (No. 001-35877), filed on August 14, 2014)
10.19 Agreement for Professional Services, dated as of May 28, 2014, by and among HannonArmstrong Capital, LLC and AWCC Capital, LLC (incorporated by reference to Exhibit 10.2 tothe Registrant’s Form 10-Q for the quarter ended June 30, 2014 (No. 001-35877), filed onAugust 14, 2014)
10.20 First Amendment to the Registration Rights Agreement of Hannon Armstrong SustainableInfrastructure Capital, Inc. (incorporated by reference to Exhibit 10.1 to the Registrant’sForm 8-K (No. 001-35877), filed on June 20, 2014)
10.21 Amendment No. 2 to PF Loan Agreement and Amendment No. 1 to Intercreditor Agreementdated as of May 28, 2014, by and among HASI CF I Borrower LLC, and HAT CF I BorrowerLLC and Bank of America, N.A. (incorporated by reference to Exhibit 1.1 to the Registrant’sForm 8-K (No. 001-35877), filed on June 3, 2014)
10.22 Amended and Restated PF Loan Agreement, dated as of August 12, 2014, by and among HASICF I Borrower LLC, HAT CF I Borrower LLC, HAT CF II Borrower LLC each lender from timeto time party thereto and Bank of America, N.A. (incorporated by reference to Exhibit 10.1 to theRegistrant’s Form 10-Q for the quarter ended September 30, 2014 (No. 001-35877), filed onNovember 7, 2014)
10.23 Amended and Restated PF Continuing Guaranty, dated as of August 12, 2014, by and amongHannon Armstrong Sustainable Infrastructure Capital, Inc., Hannon Armstrong SustainableInfrastructure, LP, and Hannon Armstrong Capital, LLC (incorporated by reference toExhibit 10.2 to the Registrant’s Form 10-Q for the quarter ended September 30, 2014(No. 001-35877), filed on November 7, 2014)
10.24 Amended and Restated PF Limited Guaranty, dated as of August 12, 2014, by HAT Holdings ILLC (incorporated by reference to Exhibit 10.3 to the Registrant’s Form 10-Q for the quarterended September 30, 2014 (No. 001-35877), filed on November 7, 2014)
10.25 PF Limited Guaranty, dated as of August 12, 2014, by HAT Holdings II LLC (incorporated byreference to Exhibit 10.4 to the Registrant’s Form 10-Q for the quarter ended September 30, 2014(No. 001-35877), filed on November 7, 2014)
10.26 Amended and Restated G&I Loan Agreement, dated as of August 12, 2014, by and among HASICF I Borrower LLC, HAT CF I Borrower LLC, HAT CF II Borrower LLC each lender from timeto time party thereto and Bank of America, N.A. (incorporated by reference to Exhibit 10.5 to theRegistrant’s Form 10-Q for the quarter ended September 30, 2014 (No. 001-35877), filed onNovember 7, 2014)
10.27 Amended and Restated G&I Continuing Guaranty, dated as of August 12, 2014, by and amongHannon Armstrong Sustainable Infrastructure Capital, Inc., Hannon Armstrong SustainableInfrastructure, LP, and Hannon Armstrong Capital, LLC (incorporated by reference toExhibit 10.6 to the Registrant’s Form 10-Q for the quarter ended September 30, 2014(No. 001-35877), filed on November 7, 2014)
- 127 -
10.28 Amended and Restated G&I Limited Guaranty, dated as of August 12, 2014, by HAT Holdings ILLC (incorporated by reference to Exhibit 10.7 to the Registrant’s Form 10-Q for the quarterended September 30, 2014 (No. 001-35877), filed on November 7, 2014)
10.29 G&I Limited Guaranty, dated as of August 12, 2014, by HAT Holdings II LLC (incorporated byreference to Exhibit 10.8 to the Registrant’s Form 10-Q for the quarter ended September 30, 2014(No. 001-35877), filed on November 7, 2014)
10.30 Form of Amended and Restated PF and G&I Security Agreement, dated as of August 12, 2014, byand among HASI CF I Borrower LLC, HAT CF I Borrower LLC, HAT CF II Borrower LLC andBank of New York Mellon (incorporated by reference to Exhibit 10.9 to the Registrant’sForm 10-Q for the quarter ended September 30, 2014 (No. 001-35877), filed on November 7,2014)
10.31 Form of Amended and Restated PF and G&I Pledge and Security Agreement, dated as ofAugust 12, 2014 (incorporated by reference to Exhibit 10.10 to the Registrant’s Form 10-Q for thequarter ended September 30, 2014 (No. 001-35877), filed on November 7, 2014)
10.32 Amendment No. 1 to Amended and Restated PF Loan Agreement, dated as of September 22,2014, by and among HASI CF I Borrower LLC, HAT CF I Borrower LLC, HAT CF II BorrowerLLC, each lender from time to time party thereto and Bank of America, N.A. (incorporated byreference to Exhibit 10.11 to the Registrant’s Form 10-Q for the quarter ended September 30,2014 (No. 001-35877), filed on November 7, 2014)
10.33 Amendment No. 1 to Amended and Restated G&I Loan Agreement, dated as of September 22,2014, by and among HASI CF I Borrower LLC, HAT CF I Borrower LLC, HAT CF II BorrowerLLC, each lender from time to time party thereto and Bank of America, N.A. (incorporated byreference to Exhibit 10.12 to the Registrant’s Form 10-Q for the quarter ended September 30,2014 (No. 001-35877), filed on November 7, 2014)
10.34 Amendment No. 2 to Amended and Restated Loan Agreement (PF) and Amendment No. 1 toAmended & Restated Intercreditor Agreement, dated December 22, 2014 (incorporated byreference to Exhibit 1.1 to the Registrant’s Form 8-K (No. 001-35877), filed on December 24,2014)
10.35 Amendment No. 2 to Amended and Restated Loan Agreement (G&I) and Amendment No. 1 toAmended & Restated Intercreditor Agreement, dated December 22, 2014 (incorporated byreference to Exhibit 1.2 to the Registrant’s Form 8-K (No. 001-35877), filed on December 24,2014)
10.36 Amendment No. 1 and Reaffirmation of Guaranty to the Amended & Restated ContinuingGuaranty (PF), dated December 22, 2014 (incorporated by reference to Exhibit 1.3 to theRegistrant’s Form 8-K (No. 001-35877), filed on December 24, 2014)
10.37 Amendment No. 1 and Reaffirmation of Guaranty to the Amended & Restated ContinuingGuaranty (G&I), dated December 22, 2014 (incorporated by reference to Exhibit 1.4 to theRegistrant’s Form 8-K (No. 001-35877), filed on December 24, 2014)
10.38 Credit Agreement dated as of October 15, 2014, among HA WIND I LLC, as the Borrower, TheFinancial Institutions and Other Persons From Time To Time Parties Hereto, as the Lenders andBank of America, N.A., as Administrative Agent and Collateral Agent (incorporated by referenceto Exhibit 10.39 to the Registrant’s Form 10-K for the year ended December 31, 2014(No. 001-35877), filed on March 9, 2015)
10.39 Amendment No. 3 to Amended and Restated Loan Agreement (PF) and Amendment No. 2 toAmended & Restated Intercreditor Agreement, dated April 17, 2015 (incorporated by reference toExhibit 1.1 to the Registrant’s Form 8-K (No. 001-35877), filed on April 21, 2015)
- 128 -

10.40 Amendment No. 3 to Amended and Restated Loan Agreement (G&I) and Amendment No. 2 toAmended & Restated Intercreditor Agreement, dated April 17, 2015 (incorporated by reference toExhibit 1.2 to the Registrant’s Form 8-K (No. 001-35877), filed on April 21, 2015)
10.41 Amendment No. 4 to Amended and Restated Loan Agreement (G&I) and Amendment No. 3 toAmended & Restated Intercreditor Agreement, dated July 16, 2015 (incorporated by reference toExhibit 1.1 to the Registrant’s Form 8-K (No. 001-35877), filed on July 17, 2015)
10.42 Amendment No. 4 to Amended and Restated Loan Agreement (PF), dated July 16, 2015(incorporated by reference to Exhibit 1.2 to the Registrant’s Form 8-K (No. 001-35877), filed onJuly 17, 2015)
10.43 Reaffirmation of Guaranty (G&I), dated July 16, 2015 (incorporated by reference to Exhibit 1.3 tothe Registrant’s Form 8-K (No. 001-35877), filed on July 17, 2015)
10.44 Employment Agreement, dated April 17, 2013, by and between Hannon Armstrong SustainableInfrastructure Capital, Inc. and Daniel McMahon (incorporated by reference to Exhibit 10.3 to theRegistrant’s Form 10-Q for the quarter ended June 30, 2015 (No. 001-35877), filed on August 7,2015)
10.45 Indenture, dated as of September 30, 2015, among HASI SYB Trust 2015-1, the Bank of NewYork Mellon and Hannon Armstrong Capital, LLC (incorporated by reference to Exhibit 10.4 tothe Registrant’s Form 10-Q for the quarter ended September 30, 2015 (No. 001-35877), filed onNovember 5, 2015)
10.46 Bond Purchase Agreement (Class A), dated as of September 30, 2015, among HASI SYB Trust2015-1, HA Land Lease Holdings, LLC and the purchasers named therein (incorporated byreference to Exhibit 10.5 to the Registrant’s Form 10-Q for the quarter ended September 30, 2015(No. 001-35877), filed on November 5, 2015)
10.47 Contribution and Sale Agreement, dated as of September 30, 2015, among HASI SYB Trust2015-1, and HA Land Lease Holdings, LLC (incorporated by reference to Exhibit 10.6 to theRegistrant’s Form 10-Q for the quarter ended September 30, 2015 (No. 001-35877), filed onNovember 5, 2015)
10.48 Indemnity Agreement, dated as of September 30, 2015, by Hannon Armstrong SustainableInfrastructure Capital, Inc. in favor of the Bank of New York Mellon (incorporated by reference toExhibit 10.7 to the Registrant’s Form 10-Q for the quarter ended September 30, 2015(No. 001-35877), filed on November 5, 2015)
21.1* List of subsidiaries of Hannon Armstrong Sustainable Infrastructure Capital, Inc.
23.1* Consent of Ernst & Young LLP for Hannon Armstrong Sustainable Infrastructure Capital, Inc.
24.1* Power of Attorney (included on signature page)
31.1* Certification of Chief Executive Officer pursuant to Section 302 of the Sarbanes-Oxley Act of2002
31.2* Certification of Chief Financial Officer pursuant to Section 302 of the Sarbanes-Oxley Act of2002
32.1** Certification of Chief Executive Officer pursuant to section 18 U.S.C. Section 1350 as adoptedpursuant to Section 906 of the Sarbanes—Oxley Act of 2002
32.2** Certification of Chief Financial Officer pursuant to section 18 U.S.C. Section 1350 as adoptedpursuant to Section 906 of the Sarbanes—Oxley Act of 2002
101.INS* XBRL Instance Document
- 129 -

101.SCH* XBRL Taxonomy Extension Schema
101.CAL* XBRL Taxonomy Extension Calculation Linkbase
101.DEF* XBRL Taxonomy Extension Definition Linkbase
101.LAB* XBRL Taxonomy Extension Label Linkbase
101 PRE* XBRL Taxonomy Extension Presentation Linkbase
* Filed herewith.** Furnished with this report.
- 130 -

SIGNATURES
Pursuant to the requirements of Section 13 or 15(d) of the Securities Exchange Act of 1934, the registranthas duly caused this report to be signed on its behalf by the undersigned, thereunto duly authorized.
HANNON ARMSTRONG SUSTAINABLEINFRASTRUCTURE CAPITAL, INC.
By: /s/ Jeffrey W. Eckel
Name: Jeffrey W. EckelTitle: Chairman, Chief Executive Officer and
President
- 131 -

POWER OF ATTORNEY
KNOW ALL PERSONS BY THESE PRESENTS, that each person whose signature appears below constitutesand appoints Jeffrey W. Eckel and J. Brendan Herron, and each of them, with full power to act without the other,such person’s true and lawful attorneys-in-fact and agents, with full power of substitution and resubstitution, forhim or her and in his or her name, place and stead, in any and all capacities, to sign this Form 10-K and any andall amendments thereto, and to file the same, with exhibits and schedules thereto, and other documents inconnection therewith, with the Securities and Exchange Commission, granting unto said attorneys-in-fact andagents, and each of them, full power and authority to do and perform each and every act and thing necessary ordesirable to be done in and about the premises, as fully to all intents and purposes as he or she might or could doin person, hereby ratifying and confirming all that said attorneys-in-fact and agents, or any of them, or their or hisor her substitute or substitutes, may lawfully do or cause to be done by virtue hereof.
Pursuant to the requirements of the Securities Exchange Act of 1934, as amended, this report has been signedbelow by the following persons on behalf of the Registrant and in the capacities and on the dates indicated.
Signatures Title
By: /s/ Jeffrey W. Eckel
Jeffrey W. Eckel
Chairman of the Board, Presidentand Chief Executive Officer(Principal Executive Officer)
March 1, 2016
By: /s/ J. Brendan Herron
J. Brendan Herron
Chief Financial Officer andExecutive Vice President (PrincipalFinancial and Accounting Officer)
March 1, 2016
By: /s/ Mark J. Cirilli
Mark J. Cirilli
March 1, 2016
By: /s/ Charles M. O’Neil
Charles M. O’Neil
March 1, 2016
By: /s/ Richard J. Osborne
Richard J. Osborne
March 1, 2016
By: /s/ Jackalyne Pfannenstiel
Jackalyne Pfannenstiel
March 1, 2016
By: /s/ Steven G. Osgood
Steven G. Osgood
March 1, 2016
- 132 -

Executive Management Team
Jeffrey W. EckelChairman, President& Chief Executive Officer
J. Brendan HerronChief Financial Officer& Executive Vice President
Nathaniel J. Rose, CFAChief Operating Officer& Executive Vice President
Steven L. ChusloGeneral Counsel& Executive Vice President
Daniel K. McMahon, CFAExecutive Vice President
M. Rhem Wooten Jr.Executive Vice President
Board of Directors
Jeffrey W. EckelChairman
Richard J. OsborneLead Director
Teresa M. Brenner
Mark J. Cirilli
Charles M. O'Neil
Steven G. Osgood
Corporate Headquarters1906 Towne Centre Boulevard, Suite 370Annapolis, MD [email protected]
Phone: 410-571-9860
Investor Relations [email protected]: 410-571-6189
Stock ListingHannon Armstrong Sustainable Infrastructure Capital, Inc.’s common stock is listed on the New York Stock Exchange under the symbol “HASI”.


