34
CONGRESS OF THE UNITED STATES CONGRESSIONAL BUDGET OFFICE A CBO PAPER MARCH 2005 Financing Universal Telephone Service S. Alden/Photolink/Photodisc/Getty Images

CONGRESS OF THE UNITED STATESCONGRESSIONAL BUDGET OFFICE
A
CBOP A P E R
MARCH 2005
FinancingUniversalTelephone
Service
S. A
lden
/Pho
tolin
k/P
hoto
disc
/Get
ty Im
ages

CBO
Financing Universal Telephone Service
March 2005
A
P A P E R
The Congress of the United States O Congressional Budget Office
Notes
Numbers in the text and tables of this paper may not sum to totals because of rounding.
Unless otherwise indicated, all years referred to in this paper are calendar years.
Preface
Under the Telecommunications Act of 1996, the Universal Service Fund (USF) supports both traditional telephone service and advanced telecommunications services, partic-ularly in rural and other remote regions that otherwise might not be served by telecommuni-cations companies. Since the enactment of the 1996 law, universal access has been financed by a federal tax on interstate and international long-distance calls. However, a recent decline in revenues generated by long-distance service has raised concern about the desirability of that financing mechanism.
This Congressional Budget Office (CBO) paper—prepared at the request of the Senate Bud-get Committee—examines recent trends in the financing sources that underlie universal ser-vice and analyzes options for change. In keeping with CBO’s mandate to provide objective, impartial analysis, this report makes no recommendations.
Philip Webre of CBO’s Microeconomic and Financial Studies Division prepared the paper under the supervision of Roger Hitchner and David Moore. The paper benefited from com-ments by Coleman Bazelon, Billy Jack Gregg, Jim Lande, and Paul Vasington. (The assistance of those external reviewers implies no responsibility for the final product, which rests solely with CBO.) Within CBO, Kim Cawley, Bob Dennis, Pete Fontaine, Arlene Holen, Bob Mur-phy, Sarah Puro, Tom Woodward, Dennis Zimmerman, and Melissa Zimmerman offered helpful suggestions.
Loretta Lettner edited the manuscript, and Christian Spoor proofread it. Angela Z. McCol-lough prepared drafts of the paper. Maureen Costantino designed the cover and prepared the paper for publication. Lenny Skutnik produced the printed copies, and Annette Kalicki pre-pared the electronic version for CBO’s Web site (www.cbo.gov).
Douglas Holtz-EakinDirector
March 2005


Summary vii
1 Introduction 1Budgetary and Administrative Background 2Telecommunications Revenues, the USF Revenue Base,
and the Contribution Factor 4
2 Options for Financing Universal Service 13Expand the Contribution Base of the Current System 13Establish Fees Based on Telephone Numbers 14Establish Fees Based on the Capacity of Telephone Lines 15Distributional Issues 15
3 The Economic Cost of Alternatives for Financing Universal Service 19
Economic Distortions from the Current Mechanism and Alternatives 19
USF Fees and Competing Advanced Telecommunications Services 20
Funding the USF Through General Revenues 20
CONTENTS
vi FINANCING UNIVERSAL TELEPHONE SERVICE
Tables
S-1. Receipts and Outlays of the Universal Service Fund, 1999 to 2004 viii
S-2. The Contribution Base for the Universal Service Fund in Relation to Telecommunications Revenues, 1997 to 2004 ix
S-3. Distribution of Telecommunications Companies’ Contributions to the USF Under Different Financing Mechanisms, 2003 and 2007 x
S-4. Distribution of Business and Residential Consumers’ Share of USF Contributions Under Different Financing Mechanisms, 2003 and 2007 xi
1-1. Receipts and Outlays of the Universal Service Fund, 1999 to 2004 4
1-2. Telecommunications Industry Revenues, 2003 5
1-3. The Contribution Base for the Universal Service Fund in Relation to Telecommunications Revenues, 1997 to 2004 7
2-1. Distribution of Telecommunications Companies’ Contributions to the USF Under Different Financing Mechanisms, 2003 and 2007 17
2-2. Distribution of Business and Residential Consumers’ Share of USF Contributions Under Different Financing Mechanisms, 2003 and 2007 18
Figures
1-1. Annual Changes in Consumer Long-Distance Prices 8
1-2. Share of Contributions to the Universal Service Fund, by Type of Company 9
1-3. Universal Service Fund Contribution Factors, by Quarter 10
Boxes
1-1. How USF Contributions Are Collected 3
1-2. Fees for Telecommunications Spending 6
1-3. The Universal Service Fund and the Antideficiency Act 11

Summary
The Telecommunications Act of 1996 reaffirmed and expanded federal policy regarding the concept of uni-versal telephone service. The goal of universal service is to ensure that the largest number of U.S. residents possible have access to high-quality telephone service regardless of their household income or geographic location. The 1996 law further authorized the Federal Communica-tions Commission (FCC) to make advanced telecommu-nications services available to qualifying schools, libraries, and rural nonprofit health care providers at subsidized rates.
To achieve the law’s stated objectives, the FCC requires that telecommunications carriers contribute a percentage of the revenues they derive from long-distance telephone and other interstate and international services to the Uni-versal Service Fund (USF). The USF, in turn, disburses payments to eligible carriers that provide the services that federal policy seeks to make widely available. Overall re-sponsibility for the process lies with the FCC, which, in conjunction with state utility regulators, determines the level of spending necessary to meet the requirements of the law and ensures that telecommunications companies make adequate contributions. The Universal Service Ad-ministrative Company (USAC), a not-for-profit corpora-tion regulated by the FCC, administers the specific pro-grams that promote universal service. The USAC collects the funds to pay for the programs and dispenses pay-ments to eligible telecommunications providers. Because payments into and disbursements from the USF are required by law, they are counted as revenues and outlays in the federal budget.
Since the enactment of the Telecommunications Act, spending for USF programs has steadily increased. Mean-while, the revenue base that is taxed to fund those pro-grams has eroded. Some observers argue that rapid changes in the telecommunications marketplace have rendered the current financing system increasingly im-practicable and unfair. As a consequence, FCC officials
and other policymakers have begun to explore new ways of funding universal service. In this report, the Congres-sional Budget Office (CBO) focuses on the current sys-tem of USF financing and discusses proposals to change that system.
The Universal Service Fund’sStructure, Spending, and RevenuesThe Universal Service Fund supports four main programs that are designed to help achieve the federally mandated goal of universal service in the United States and its terri-tories. Those mechanisms for providing widespread tele-communications services include the High Cost support program, the Low Income support program, the Schools and Libraries support program, and the Rural Health Care support program. The High Cost mechanism assists eligible local telephone companies that serve customers in remote or rural areas, where the cost of providing service comparable to that available in urban areas is substan-tially greater than the national average. The Low Income program provides local telephone companies with funds that enable them to offer discounts on the installation of standard residential telephone service or assistance with monthly service charges. The Schools and Libraries sup-port program provides financial assistance to schools and libraries for the purchase and installation of advanced telecommunications services (such as high-speed Internet access). Finally, the Rural Health Care support mecha-nism assists eligible medical facilities by ensuring that they pay no more than urban health care providers do for comparable advanced telecommunications services.
The USF operates by collecting mandatory contributions from all providers of interstate and international telecom-munications services in order to subsidize local services and providers. Those contributions are based on a per-centage of the revenues derived from providing interstate and international services, subject to certain adjustments. Telecommunications companies may recover all or part of
viii FINANCING UNIVERSAL TELEPHONE SERVICE
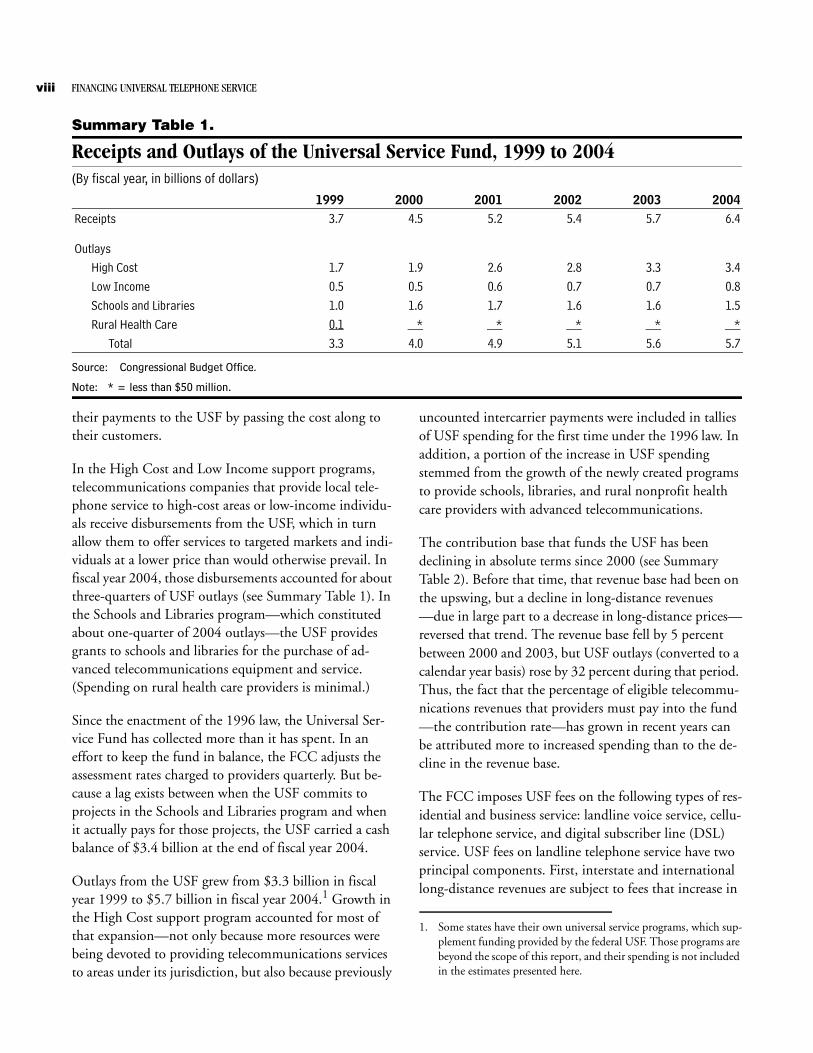
Summary Table 1.
Receipts and Outlays of the Universal Service Fund, 1999 to 2004(By fiscal year, in billions of dollars)
Source: Congressional Budget Office.
Note: * = less than $50 million.
their payments to the USF by passing the cost along to their customers.
In the High Cost and Low Income support programs, telecommunications companies that provide local tele-phone service to high-cost areas or low-income individu-als receive disbursements from the USF, which in turn allow them to offer services to targeted markets and indi-viduals at a lower price than would otherwise prevail. In fiscal year 2004, those disbursements accounted for about three-quarters of USF outlays (see Summary Table 1). In the Schools and Libraries program—which constituted about one-quarter of 2004 outlays—the USF provides grants to schools and libraries for the purchase of ad-vanced telecommunications equipment and service. (Spending on rural health care providers is minimal.)
Since the enactment of the 1996 law, the Universal Ser-vice Fund has collected more than it has spent. In an effort to keep the fund in balance, the FCC adjusts the assessment rates charged to providers quarterly. But be-cause a lag exists between when the USF commits to projects in the Schools and Libraries program and when it actually pays for those projects, the USF carried a cash balance of $3.4 billion at the end of fiscal year 2004.
Outlays from the USF grew from $3.3 billion in fiscal year 1999 to $5.7 billion in fiscal year 2004.1 Growth in the High Cost support program accounted for most of that expansion—not only because more resources were being devoted to providing telecommunications services to areas under its jurisdiction, but also because previously
uncounted intercarrier payments were included in tallies of USF spending for the first time under the 1996 law. In addition, a portion of the increase in USF spending stemmed from the growth of the newly created programs to provide schools, libraries, and rural nonprofit health care providers with advanced telecommunications.
The contribution base that funds the USF has been declining in absolute terms since 2000 (see Summary Table 2). Before that time, that revenue base had been on the upswing, but a decline in long-distance revenues—due in large part to a decrease in long-distance prices—reversed that trend. The revenue base fell by 5 percent between 2000 and 2003, but USF outlays (converted to a calendar year basis) rose by 32 percent during that period. Thus, the fact that the percentage of eligible telecommu-nications revenues that providers must pay into the fund —the contribution rate—has grown in recent years can be attributed more to increased spending than to the de-cline in the revenue base.
The FCC imposes USF fees on the following types of res-idential and business service: landline voice service, cellu-lar telephone service, and digital subscriber line (DSL) service. USF fees on landline telephone service have two principal components. First, interstate and international long-distance revenues are subject to fees that increase in
1999 2000 2001 2002 2003 2004Receipts 3.7 4.5 5.2 5.4 5.7 6.4
OutlaysHigh Cost 1.7 1.9 2.6 2.8 3.3 3.4Low Income 0.5 0.5 0.6 0.7 0.7 0.8Schools and Libraries 1.0 1.6 1.7 1.6 1.6 1.5Rural Health Care 0.1 * * * * *
Total 3.3 4.0 4.9 5.1 5.6 5.7
1. Some states have their own universal service programs, which sup-plement funding provided by the federal USF. Those programs are beyond the scope of this report, and their spending is not included in the estimates presented here.

SUMMARY ix
Summary Table 2.
The Contribution Base for the Universal Service Fund in Relation toTelecommunications Revenues, 1997 to 2004(Billions of dollars)
Source: Congressional Budget Office based on Federal Communications Commission, Trends in Telephone Service (May 2004), Table 15.1, and Telecommunications Industry Revenues (various years), Tables 1, 6, and 8.
Notes: To avoid double taxation, the contribution base includes only revenues from services to end users.
To be consistent with previous years, 2003 and 2004 data include revenues declared uncollectible.
a. Preliminary estimate.
direct proportion to the amount spent on the service. Second, the FCC imposes USF fees on the portion of local telephone companies’ revenues that, by convention, is associated with the cost of providing interstate and international long-distance calls. Because of the difficulty of separating interstate revenues from total revenues, cel-lular carriers are subject to a modified fee system. Cell phone operators pay USF fees on 28.5 percent of their total revenues, unless they can provide evidence that their interstate share is less than that “safe harbor” percentage. Because DSL has been classified as an interstate service, providers pay USF assessments on the telecommunica-tions portion of the service. (The portion of DSL reve-nues that pays for Internet access is exempt from USF contributions.) Large-capacity leased telephone lines that large institutions use for Internet access and other data services also incur USF fees.
Financing AlternativesIf policymakers determined that the current financing mechanism was no longer appropriate, universal service could be financed in other ways. Three alternatives to the current system have received attention:
B Expanding the present revenue-based system to in-clude revenues that are currently excluded from tele-communications services (for instance, revenues from intrastate service or from high-speed Internet service delivered through cable modems);
B Establishing a financing system based on connec-tions—such as telephone numbers or communica-tions capacity—rather than on interstate revenues; or,
B Using a combination of all of those various fundingmechanisms.
Some proposals would use charges on telephone numbers or telecommunications capacity as the primary financing mechanism and supplement it with complementary fees that address special situations. For example, large enter-prises often lease high-capacity lines for their data or in-ternal telephone networks. The capacity of such lines is greater than that of the average telephone line by signifi-cant degrees. To avoid shifting a disproportionate share of the financing of universal service to such lines, proposals for a capacity-based system include tiers of fees that would increase with capacity but would levy lower per-unit capacity charges on those lines.
For this analysis, CBO estimated the distribution of pay-ments to the USF by types of telecommunications pro-viders and by the share (if distributed proportionately) shown on the bills of residential and business consumers under current policy and under several financing alterna-tives. CBO’s analysis relied on a modified version of an accounting model developed by the FCC. Those esti-mated distributions indicate sources of payments—not the ultimate burden of USF fees on consumers and providers.
1997 1998 1999 2000 2001 2002 2003 2004a
Total Telecommunications Revenues from Service to End Users 188.4 200.4 215.8 229.1 235.5 232.4 230.7 228.3
Contribution Base for the USF 69.3 74.9 79.9 80.6 79.2 77.0 76.6 76.3
Contribution Base as a Percentage of Total Revenues 36.8 37.4 37.0 35.2 33.6 33.1 33.2 33.4

x FINANCING UNIVERSAL TELEPHONE SERVICE
Summary Table 3.
Distribution of Telecommunications Companies’ Contributions to the USFUnder Different Financing Mechanisms, 2003 and 2007(Percent)
Source: Congressional Budget Office.
Note: USF = Universal Service Fund; n.a. = not applicable.
a. Cable modem revenues only.
Distribution of the Initial Burden of USFContributions Among Different Types ofTelecommunications ProvidersThe distribution of USF fees among providers has shifted, largely because of the increasing number of cellu-lar providers and the entry of local telephone companies into the long-distance market. Under current policy, cel-lular carriers’ share of payments to the USF is forecast to rise from 22 percent in 2003 to 31 percent in 2007 (see Summary Table 3). That increase mirrors the decline in long-distance carriers’ share (from 51 percent to 37 per-cent)—with local telephone companies making up the difference.
The distribution of those fees under the policy options that CBO examined would vary greatly. Including reve-nues based on services provided by cable modems in the USF contribution base would slightly reduce cellular car-riers’, long-distance carriers’, and local telephone compa-nies’ shares of the payments. A plan based on telephone numbers would shift responsibility for funding the USF away from long-distance providers and toward local tele-phone companies, doubling their share of payments com-pared with the 2003 level. A plan based on communica-
tions capacity would cause similar, but smaller, changes in shares.
Distribution of USF Fees Between Business andResidential Consumers Under current policy, the relative burden on households is not projected to change substantially between 2003 and 2007. Assuming that carriers recovered all of their USF contributions from their customers, residential consumers’ share of USF payments would rise from 43 percent in 2003 to 44 percent in 2007 (see Summary Table 4). Correspondingly, business consumers would see their share fall from 57 percent to 56 percent. The policy alternatives that CBO analyzed would not significantly affect the distribution of USF fees between residential and business consumers compared with that under cur-rent policy.
If policy did not change, households would see their monthly charges rise from about $2.09 in 2003 to $2.26 in 2007, an increase of 8.1 percent (or 0.1 percent with the effects of inflation removed). Under some alternative financing options, total USF contributions would more than double. However, long-distance rates and house-
Share of Total Contributions, by Type of Company
Financing OptionLocal Telephone
CompaniesLong-Distance
CompaniesCellular Telephone
Companies Cable Companiesa
In 2003
Current Policy 28 51 22 n.a.
In 2007
Current Policy 31 37 31 n.a.
Including Cable Modem Revenues 28 34 28 9
Telephone-Number-Based Plan 55 13 32 n.a.
Capacity-Based Plan 43 22 33 n.a.

SUMMARY xi
Summary Table 4.
Distribution of Business and Residential Consumers’ Share of USF Contributions Under Different Financing Mechanisms, 2003 and 2007
Source: Congressional Budget Office.
Note: USF = Universal Service Fund.
holds’ monthly interstate charges (including their sub-scriber line charges, long-distance charges, and USF fees) would fall compared with 2003 levels. By contrast, the cost of the intrastate portion of local phone service, which is largely exempt from USF fees, would rise.
Financing Universal Service EfficientlyA central question to be asked about any mechanism used to finance federal spending is whether there is a way to collect the funds at a lower cost to the economy. The overall economic cost hinges on the degree to which a financing mechanism affects choices made by both pro-ducers and consumers. Consumers who pay a fee will have forgone not only the value of the fee itself but also the benefits they would have derived from the goods they did not buy because of the fee.
Some analysts argue that the current system for funding the USF imposes a greater cost on the economy than would alternative financing mechanisms. The present fee structure is intended to fall disproportionately on long-distance and cellular telephone calls. Studies have shown that consumers alter their consumption patterns more in response to increases in the prices they pay for those ser-vices than they do in response to price increases on basic telephone access. Considered in that light, USF fees that taxed telecommunications capacity or telephone numbers
would be less likely to distort consumers’ choices than the current system does.
However, the pricing structure of the telecommunica-tions industry seems to be moving on its own in a direc-tion that lessens the distortions caused by USF fees. In-creasingly, long-distance and cellular service carriers are able to offer bundles of long-distance minutes for a flat rate. Carriers can provide diverse plans that vary in size, time-of-day restrictions, and monthly fees. For consum-ers who subscribe to such plans, the USF becomes less a usage fee on their individual long-distance calls and more an access fee on long-distance service in general. The price of an additional phone call for those consumers—if they stay within their plans—is unaffected by the USF fees. Consequently, the negative effects of the fees are reduced. Such bundled or flat-rate plans now account for about a quarter of consumer subscriptions.
Consideration of mechanisms to finance universal service also raises the question of potentially uneven effects on communications technology. In selecting types of ser-vices, consumers also choose among different technolo-gies. If USF fees fall unequally on similar services that use different technologies, then consumers’ choices will be af-fected by the fees as well as by the costs of providing spe-cific services. As far as high-speed access to the Internet is
Average Monthly Charge per Household Percentage of the Contributions Met by
Financing Option (Dollars) Residential Consumers Business ConsumersIn 2003
Current Policy 2.09 43 57
In 2007
Current Policy 2.26 44 56
Including Cable Modem Revenues 2.47 48 52
Telephone-Number-Based Plan 2.47 46 54
Capacity-Based Plan 2.28 45 55

xii FINANCING UNIVERSAL TELEPHONE SERVICE
concerned, the current system—which imposes a fee on the telecommunications portion of DSL service but not on its nearest competitor, high-speed Internet access de-livered through a cable modem—favors cable technology. That different treatment arose in part because DSL ser-vice evolved within the context of landline telephone ser-vice, which is subject to USF fees, whereas cable modem service evolved in the context of cable video service, which is not.
Most federal spending is funded with general revenues, and some analysts have suggested that lawmakers con-sider financing universal service in that way. The current system of financing the USF is a legacy of the days when the Bell telephone system relied on profits from business and long-distance customers to help defray the expense of providing service in high-cost areas. With the dissolution of the Bell system, what had been a system of implicit intracorporate transfers became a set of increasingly explicit intercarrier transfers, which were most recently modified in the Telecommunications Act of 1996. Fund-ing universal service with general revenues would sever
the current relationship between telecommunications industry revenues and universal service funding.
Raising general revenues tends to distort consumers’ choices less than raising sector-specific taxes does. Anal-yses of economic losses indicate that USF fees cost the economy an additional $0.64 to $1.47 for each dollar in revenue they produced.2 (Those estimates probably over-state the current economic cost of the USF fee system because long-distance access fees have declined recently.) By comparison, the economic losses arising from general federal taxes are estimated to be substantially lower, rang-ing between $0.25 and $0.40 for each additional dollar collected.
2. Michael H. Riordan, “Universal Residential Telephone Service,” in Martin Cave and others, eds., Handbook of Telecommunications Economics, vol. 1, Structure, Regulation and Competition (Amster-dam: Elsevier, 2002), p. 438, available at www.columbia.edu/~mhr21/US-aug-29.pdf; and Jerry Hausman, Taxation by Tele-communications Regulation: The Economics of the E-Rate (Washing-ton, D.C.: AEI Press, 1998), p. 15, available at www.aei.org/docLib/20040218_book245.pdf.

1Introduction
Efforts to foster the goal of universal telephone service in the United States and its territories were reaf-firmed and amplified by the Telecommunications Act of 1996. As codified in that law, the overriding goal of uni-versal service is to ensure that the largest number of U.S. residents possible have access to high-quality telephone service regardless of their household income or geo-graphic location. The 1996 law further authorized the Federal Communications Commission (FCC)—the administering agency—to provide funds to make ad-vanced telecommunications service available to qualifying schools, libraries, and rural nonprofit health care provid-ers at subsidized rates.
To achieve the law’s stated objectives, telecommunica-tions companies are required to contribute a percentage of the revenues they derive from long-distance and other interstate and international services to the Universal Ser-vice Fund (USF). In turn, the USF reimburses eligible telecommunications carriers that provide the services that the law seeks to make widely available. Overall responsi-bility for the process lies with the FCC, which, in con-junction with state utility regulators, determines the level of spending necessary to meet the law’s requirements and ensures that telecommunications companies comply by making adequate compensation. The Universal Service Administrative Company (USAC), a not-for-profit cor-poration regulated by the FCC, manages the specific pro-grams that promote and support universal service. The USAC also collects the funds necessary to finance those programs and dispenses the payments to eligible telecom-munications providers. Because those transfers between providers are required by law, payments into and dis-bursements from the Universal Service Fund are counted as revenues and outlays in the federal budget.1
The USF supports four primary programs designed to help achieve the federal goal of universal service.2 Those mechanisms are the High Cost support program, the
Low Income support program, the Schools and Libraries support program, and the Rural Health Care support program. The largest of the four, the High Cost mecha-nism assists eligible local telephone companies that serve customers in remote or rural areas where the cost of pro-viding service comparable to that available in urban areas is substantially greater than the national average. The Low Income program provides local telephone compa-nies with funds that enable them to offer discounts to qualified low-income people (rural or urban) on installa-tion charges for residential telephone service and on monthly service fees. The Schools and Libraries program offers assistance to schools and libraries for the purchase of certain network hardware, the payment of monthly charges for high-speed Internet access, and other expenses related to installation of advanced telecommunications services.3 (That program largely focuses on schools and libraries that serve low-income communities.) Finally, the
C HAP TER
1. Rate-making policies under the jurisdictions of the states also fur-ther the objective of universal service by establishing cross-subsi-dies—pricing some services to some customers above cost so that other services to other customers can be priced below cost—with the net result that residential customers benefit at the expense of business customers. Those implicit subsidies do not appear in fed-eral or state budgets.
2. Assistance offered by the Telecommunications Relay Services (TRS), which is funded with federal dollars and administered by the National Exchange Carrier Association, is also considered to promote universal service because the TRS makes telephone ser-vice available to the speech- and hearing-impaired. Although the TRS shares the goal of making telephone service more widely available, those services are administered separately from the other universal service programs. The fees are also separate. For those reasons, this report generally excludes them. In addition, some states have universal service programs, which are outside the scope of this analysis.
3. The Schools and Libraries program is the one mechanism in which a substantial amount of USF funding goes to entities other than telecommunications carriers.

2 FINANCING UNIVERSAL TELEPHONE SERVICE
Rural Health Care support program assists eligible medi-cal facilities by ensuring that they pay no more than ur-ban health care providers do for comparable telecommu-nications services.
For a variety of reasons, spending on the programs that support universal service is rising. The costs associated with delivering telephone services to high-cost areas and low-income people have steadily grown. In addition, some of the cost increases borne by the USF are an out-growth of accounting changes mandated by the Telecom-munications Act of 1996. Specifically, the law required universal support to be explicit, thus reducing many im-plicit cross-subsidies that had formerly been a mainstay of universal service.4 Consequently, some of the increase in USF spending can be attributed to changes in the method of funding—and its inclusion in the federal bud-get—rather than to new economic resources devoted to providing universal service. Lastly, the 1996 law autho-rized the creation of programs designed to subsidize advanced telecommunications services for qualifying schools, libraries, and rural nonprofit health care provid-ers.5
At the same time that funding demands have increased, the revenue base of interstate and international services that pays for universal service has shrunk since 2000, and most likely will continue to erode, for various reasons. The escalation of costs, in combination with an eroding revenue base, has caused a corresponding rise in the USF “contribution factor”—the tax rate that the FCC levies on revenues from long-distance and other interstate and international telephone services. (The contribution factor is set on a quarterly basis to raise sufficient funds to cover the costs of universal service.) As a consequence, the FCC and other policymakers have begun to consider new ways of financing universal service. This Congressional Budget Office (CBO) report examines the system currently used to fund universal service and compares proposals for changing that system.
Budgetary and AdministrativeBackgroundThe current financing system for the Universal Service Fund derives its authority from Section 254(d) of the Communications Act of 1934, as added by the Telecom-munications Act of 1996.6 That section states that every provider of interstate telecommunications service must contribute to the USF. The law further directs the FCC to establish a funding mechanism that is “specific, pre-dictable, and sufficient.” Subsequent FCC decisions and court cases have refined that general statement of princi-pals into a functioning system. (For a description of the process used to calculate mandatory contributions from telecommunications carriers, see Box 1-1.)
In concept, the USF is budget neutral: contributions are intended to be just sufficient to cover spending. The con-tribution rates for telecommunications carriers are vari- able, changing quarterly in an effort to maintain the fund in balance. In the High Cost and Low Income programs, the administrators of the USF have generally been suc-cessful in matching fund inflows with outflows. But be-cause a lag exists in the Schools and Libraries program between when the USF commits to funding projects and when it actually pays for those projects, the USF has con-sistently collected more than it has spent in recent years. At the end of fiscal year 2004, for instance, the fund car-ried a cash balance of $3.4 billion.
Spending on Universal ServiceBoth USF outlays and receipts have grown since 1999. Outlays from the fund rose from $3.3 billion in fiscal year 1999 to $5.7 billion in fiscal year 2004, while receipts grew from $3.7 billion to $6.4 billion (see Table 1-1).7 Outlays may not be the best measure of the yearly claims of universal service programs on the tele-communications sector. Program receipts—the funds that telecommunications carriers (and ultimately their customers) are required to pay into the USF—better rep-resent the programs’ anticipated claims on the economy. Since those commitments may take several years to spend, receipts are consistently greater than outlays.
4. 44 U.S.C. 254(e).
5. See Congressional Budget Office, Federal Subsidies of Advanced Telecommunications for Schools, Libraries, and Health Care Providers (January 1998).
6. 44 U.S.C. 254(d).
7. The estimates presented in this report are USAC outlays and receipts. USF program commitments will differ from those esti-mates. The USAC’s fiscal year also differs from the federal fiscal year.

CHAPTER ONE INTRODUCTION 3
Factors Underlying the Growth in Spending Increased spending from the USF can be attributed to many sources. The High Cost and Low Income programs experienced substantial growth in recent years. Outlays for the program to reduce the cost of providing telecom-munications service in high-cost rural areas, for example, rose from $1.7 billion to $3.4 billion between fiscal year 1999 and fiscal year 2004, while the cost of support for low-income households rose from $490 million to $760 million. Part of the growth in USF spending also stems from the expansion of the new programs to provide schools, libraries, and nonprofit rural health care provid-ers with advanced telecommunications services.
One of the main reasons that the High Cost fund has grown is the requirement in the Telecommunications Act of 1996 that implicit subsidies—which were formerly embedded in access charges paid by long-distance provid-ers to local telephone companies—be recognized as ex-plicit USF payments. In response to that requirement, in 2000 the FCC created the Interstate Access Support pro-gram within the High Cost program, which added $650 million in outlays to the High Cost program in that fiscal year. In 2002, the FCC created the Interstate Common Line Support program for rural carriers, also within the High Cost program. Together, those two programs—which provide an alternative source of revenues that pre-
Box 1-1.
How USF Contributions Are Collected
Contributions to the Universal Service Fund (USF) are collected in an interactive process that involves telecommunications carriers, the administrator of the various universal service programs—the Univer-sal Service Administrative Company (USAC)—and the Federal Communications Commission (FCC). Each quarter, telecommunications providers report their eligible billings from the previous quarter (in-cluding USF charges) to the USAC, as well as how much they expect to bill in the subsequent quarter (including USF charges). Carriers also report how much of their eligible billings they actually expect to collect.
With that information, the USAC calculates the “projected collected” revenues for the current quar-ter. For example, assume that a carrier reports that it billed $100 million in the previous quarter and that it expects to bill $104 million in the coming quarter. Assume further that the carrier reports that, from its accounting studies, it has discovered that 5 percent of its accounts are uncollectible. The USAC will as-sume that the current quarter of collectible billing for that carrier will be $102 million (the average of the previous and subsequent quarters) minus 5 per-cent uncollectible, or $96.9 million.
To calculate the USF contribution rate, the USAC totals all of the estimates of eligible billings from the individual carriers to obtain an aggregate estimate of the projected collected revenues for the current quar-ter, adjusted for expected USF contributions. (With-out an adjustment for USF contributions, there would be double taxation.) The administrators then divide the estimate of projected collected revenues into the estimate of the current quarter’s USF needs.1 From that calculation, the FCC derives a “contribution factor.” Each carrier’s contribution equals the contribution factor multiplied by the car-rier’s eligible billings. Carriers make contributions monthly.
To continue the example above, assume that the USAC announces that it needs $1.5 billion to cover program and administrative costs for a quarter. If the industry revenues eligible for contribution total $18.75 billion, the FCC calculates a contribution factor of 8 percent ($1.5 billion divided by $18.75 billion). That percentage multiplied by the carrier’s $96.9 million in eligible billings equals $7.75 mil-lion, which is the carrier’s quarterly obligation (paid in monthly installments).
1. The USAC also includes periodic revisions to bring pro-jected revenues in line with actual revenues.

4 FINANCING UNIVERSAL TELEPHONE SERVICE
Table 1-1.
Receipts and Outlays of the Universal Service Fund, 1999 to 2004(By fiscal year, in billions of dollars)
Source: Congressional Budget Office.
Note: * = less than $50 million.
viously flowed between long-distance companies and local telephone companies in the form of interstate access charges—have added more than $1.1 billion in spending to the High Cost program.
In addition, a number of new networks, primarily cellular telephone networks, have become eligible for USF pay-ments. That development has led to higher spending in all of the programs contained in the High Cost fund. Between 2002 and 2003, the funds going to rural local telephone companies grew by $190 million. Support for new cellular telephone networks accounted for $80 mil-lion of that growth.
Spending levels are determined differently for each of the four main programs. Spending for the Schools and Li-braries mechanism is capped by the FCC at $2.25 billion per year.8 Meanwhile, the Rural Health Care mechanism is not fully utilized by potential recipients, and spending for that program does not approach its cap. In the case of the Low Income support mechanism, individual states determine eligibility criteria for recipients. In many states, enrollment in the program has risen since 1997, with a corresponding increase in program costs.
Spending in the High Cost support mechanism is deter-mined by a complex combination of historical costs and economic models. Each fall, the National Exchange Car-
riers Association (NECA) submits a filing to the FCC that details the costs to rural telephone service providers of providing local telephone lines. The NECA filing is used to determine per-line costs. A portion of those per-line costs that is above the national average for each car-rier is multiplied by the number of lines each carrier serves: the portion is determined by the size of the carrier and the extent to which costs in a given area exceed the national average for local line costs. That figure becomes the carrier’s subsidy for the first quarter of the next calen-dar year.9 Payments for the subsequent quarter are ad-justed according to the line count for each provider. For larger, nonrural providers’ local line support, the FCC uses a cost model to determine per-line costs. In addition to the local line support portion of the High Cost mecha-nism, there are other, smaller elements of the High Cost mechanism that are determined by different combina-tions of formulas and embedded costs, all of which are occasionally subject to caps.
Telecommunications Revenues,the USF Revenue Base, and theContribution FactorReceipts collected for the Universal Service Fund origi-nate as revenues from telecommunications services. As indicated, however, only those revenues over which the federal government has regulatory jurisdiction enter the USF revenue base. Because the USF administrators are
1999 2000 2001 2002 2003 2004Receipts 3.7 4.5 5.2 5.4 5.7 6.4
OutlaysHigh Cost 1.7 1.9 2.6 2.8 3.3 3.4Low Income 0.5 0.5 0.6 0.7 0.7 0.8Schools and Libraries 1.0 1.6 1.7 1.6 1.6 1.5Rural Health Care 0.1 * * * * *
Total 3.3 4.0 4.9 5.1 5.6 5.7
8. Although more schools and libraries apply for grants than can be funded, the delays in getting matching local funding and other-wise solidifying their plans mean that the $2.25 billion cap gener-ates only $1.5 billion in outlays.
9. The annual growth of subsidies to those providers is capped by formula as well.

CHAPTER ONE INTRODUCTION 5
Table 1-2.
Telecommunications Industry Revenues, 2003(Billions of dollars)
Source: Federal Communications Commission, Telecommunications Industry Revenues, 2003 (March 2005), Tables 6 and 8.
mandated to collect sufficient revenues to match spend-ing, they set the contribution factor to match collections with anticipated spending. (See Box 1-2 for a description of fees on consumer services.)
From Telecommunications Revenuesto the USF Contribution BaseAlthough only interstate and international revenues are subject to USF contributions, interstate revenues are defined to include a portion of revenues that local tele-phone companies assess for originating and completing interstate and international long-distance calls.10
Various limitations apply to the inclusion of international revenues in the contribution base. Such revenues are ex-cluded if the total amount of interstate revenues recorded by the filing firm and its affiliates is less than 12 percent of the total of interstate and international revenues of the consolidated firm and its affiliates. Small firms with min-imal contributions are also excluded. Revenues derived from the provision of service for resale (commonly called the carrier’s carrier) are not subject to USF contributions, in order to avoid double taxation. (It would be as if there were a tax on tires and then a tax on the car that included the tires.)
After adjustment for the exclusions and deductions out-lined above, only $76.6 billion (or one-third) of the $230.7 billion in end-user telecommunications revenues in 2003 entered the contribution base (see Table 1-2).
Toll carriers—providers of interstate and international services—saw 64 percent of their end-user revenues enter the base, whereas 23 percent of the end-user revenues of cellular and local telephone companies were included in the base.
Both total telecommunications revenues derived from service to end users and the USF contribution base have declined in recent years, although each peaked in differ-ent years (see Table 1-3). Total end-user telecommunica-tions revenues have fallen by 3 percent from their 2001 peak, and the revenues used to finance the USF have de-clined by 5 percent from their 2000 peak.11 However, the deterioration of the contribution base as a percentage of total end-user revenues seems to have stopped.
The Shrinking Contribution BaseThe contribution base has gotten smaller for several rea-sons. First, an increase in the supply of long-haul capacity in the competitive market for long-distance services re-duced the prices that companies charged their consumers by so much that revenues actually declined from 2000 to 2002.12 Decreases in long-distance telephone prices, although common since the 1982 consent decree that broke up the Bell telephone system, became larger after 2000. According to federal price data, the decline in
USF ContributionTelecommunications Revenues
from Service to End UsersIndustry Segment Base Intrastate Interstate International Total Local Wireline Carriers 20.4 67.7 20.4 0.3 88.5Wireless Service Carriers 19.0 65.0 19.2 0.2 84.4Toll-Service Carriers 37.2 18.1 30.1 9.6 57.8
Total 76.6 150.9 69.7 10.1 230.7
10. Those subscriber line charges represent the portion of the local network assigned to the interstate jurisdiction and are regulated by the FCC. Subscriber line charges appear on customers’ local bills for local services, and revenues produced by those charges are retained by the local telephone carriers.
11. Starting in 2003, the FCC began netting out revenues deemed by the telecommunications carriers as uncollectible. To be consistent with previous years, CBO used the gross numbers in its calcula-tions. After removing uncollectible revenues, end-user revenues totaled $223.9 billion in 2003.
12. In 2000, total international and interstate revenues were $119.7 billion, but by 2002 that figure had fallen to $111.8 billion. Fed-eral Communications Commission, Trends in Telephone Service (May 2004), Table 15.1.

6 FINANCING UNIVERSAL TELEPHONE SERVICE
Box 1-2.
Fees for Telecommunications Spending
The Federal Communications Commission (FCC) imposes Universal Service Fund (USF) fees on con-sumers’ wireline, wireless, and digital subscriber line (DSL) service. (The actual fees are paid by the rele-vant telecommunications service providers, but the carriers generally attempt to recover those costs from their customers.)
The current structure of residential USF fees is as follows:
B Wireline Voice. Two components of revenues from wireline voice telephone service enter into the USF contribution base: payments for interstate and international long-distance calls and charges paid to a local telephone company by its custom-ers for access to interstate service. (The latter is called the subscriber line charge.)
B Wireless. Cell phone companies pay on a modified fee system. USF fees on cell phone service in-crease with cellular charges but only on 28.5 per-cent of the revenues. Alternatively, if a cell phone company can show that less than 28.5 percent of its calls are long distance, it can use a lower per-centage based on its own study.
B Broadband. Typically, the charge for DSL service is a combination of a telecommunications por-tion and an Internet service portion. The FCC has decided that Internet access delivered through DSL is an interstate service. The portion of DSL charges devoted to Internet access is considered an information service and is not subject to USF assessment. Consequently, only the telecommuni-cations portion of DSL is subject to USF contri-butions.
For the most part, businesses pay the same USF fees that residential consumers do. Businesses that lease private telephone lines for their data and internal telephone systems also pay a fee on those services. In addition, there are fees to handle special situations, such as those applying to pay-phone companies.
All of the fees discussed above are assessed directly on service providers, not on households or businesses. Generally, providers attempt to recover their contri-butions through charges outlined on the bills they send to their customers. They can do so either by raising their rates or by including one or more sepa-rate “line items” for universal service charges.
Starting in 2003, the FCC restricted the ability of carriers to recover their costs through line items.1 The FCC had found that many of the line items des-ignated by carriers as universal service charges were significantly higher than the contributions actually paid by the carriers. Some of the overcharging was intended to account for uncollectibles and other fac-tors related to the USF. But in its concern, the FCC prohibited carriers from marking up the USF line item above the relevant contribution. Furthermore, carriers were not allowed to average contribution costs across all end users when establishing end-user amounts. (The FCC imposed no such limitation if the carrier tried to include the recovery of USF con-tributions in its service rates.) The FCC also ex-empted customers of Lifeline—one of the USF sup-port mechanisms aimed at low-income consumers—from charges designed to recover USF contributions.
1. Federal Communications Commission, In the Matter of Fed-eral-State Joint Board on Universal Service and Other Matters: Report and Order and Second Further Notice of Proposed Rule-making (December 12, 2002), pp. 25-32, available at http://hraunfoss. fcc.gov/edocs_public/attachmatch/FCC-02-329A1.pdf.

CHAPTER ONE INTRODUCTION 7
Table 1-3.
The Contribution Base for the Universal Service Fund in Relation toTelecommunications Revenues, 1997 to 2004(Billions of dollars)
Source: Congressional Budget Office based on Federal Communications Commission, Trends in Telephone Service (May 2004), Table 15.1, and Telecommunications Industry Revenues (various years), Tables 1, 6, and 8.
Notes: To avoid double taxation, the contribution base includes only revenues from services to end users.
To be consistent with previous years, 2003 and 2004 data includes revenues declared uncollectible.
a. Preliminary estimate.
consumer long-distance charges averaged 2.7 percent an-nually between 1986 and 2004. But since 2000, the aver-age annual drop has been 6.1 percent (see Figure 1-1).13
Second, the spread of advanced telecommunications technologies has contributed to the decline in the revenue base. Cell phone companies often include (or bundle) long-distance calls in their service plans at low effective rates; consequently, a smaller percentage of cell phone revenues enters the contribution base than is the case for revenues derived from landline services. Similarly, cus-tomers are most likely substituting e-mail or Internet browsing for long-distance telephone calls.14 As to the fu-ture, Internet telephony or Voice over Internet Protocol will almost certainly diminish the demand for traditional wireline long distance, although the FCC has not yet de-cided whether Internet telephony will be subject to USF fees.
Contributions by Type of ProviderUnder the Telecommunications Act of 1996, current USF spending is funded by fees on interstate telecommu-nications revenues, but that limitation does not mean that only long-distance companies pay. Local telephone companies increasingly provide interstate services, as do cellular phone companies. In addition, the whole panoply of telecommunications providers, such as paging compa-nies and pay-phone operators, also make payments into the USF. (See Box 1-1 on page 3 for a description of the collection method.)
Because the industry is in flux, USF revenue sources have changed in the recent past. Shortly after the Telecommu-nications Act was enacted, toll-service providers—mainly long-distance companies—accounted for 82 percent of the revenues going into the fund (see Figure 1-2). How-ever, as local telephone companies were allowed to offer long distance under the provisions of the 1996 law, their share of USF financing rose along with their share of long-distance revenues. But it was wireless companies that increased their share most dramatically, from 3 per-cent in 1997 to 17 percent in 2002. As other participants’ shares rose, the relative contribution of long-distance companies fell. One implication of Figure 1-2 is that thecurrent division of the revenue base is neither stable nor of long standing.
1997 1998 1999 2000 2001 2002 2003 2004a
Total Telecommunications Revenues from Service to End Users 188.4 200.4 215.8 229.1 235.5 232.4 230.7 228.3
Contribution Base for the USF 69.3 74.9 79.9 80.6 79.2 77.0 76.6 76.3
Contribution Base as a Percentage of Total Revenues 36.8 37.4 37.0 35.2 33.6 33.1 33.2 33.4
13. Department of Commerce, Bureau of Economic Analysis, Under-lying Detail Tables of the National Income and Product Accounts, Table 2.4.4U, “Chain-Type Price Indexes for Personal Consump-tion Expenditures, Long-Distance Telephone.” The Bureau of Economic Analysis data series is based on an unpublished con-sumer price index series from the Bureau of Labor Statistics.
14. Consumers made 22 percent fewer interstate calls (measured in minutes) in 2003 than in 2000. Federal Communications Com-mission, Trends in Telephone Service, Table 10.1.

8 FINANCING UNIVERSAL TELEPHONE SERVICE
Figure 1-1.
Annual Changes in Consumer Long-Distance Prices(Percent)
Source: Congressional Budget Office based on data from the Bureau of Economic Analysis.
Contribution Factors Contribution rates have been increasing since 1999 (see Figure 1-3 on page 10), more because of increases in spending than because of the decline in the revenue base. Between 2000 and 2003, that base fell from $80.6 billion to $76.6 billion, a drop of 4.9 percent.15 By comparison, USF outlays (converted from fiscal year to calendar year) rose from $4.2 billion to $5.6 billion over the same period, an increase of 32 percent.
Those contribution rates would have been higher at sev-eral points were it not for various factors. For example, during much of 2002 and 2003, the FCC pursued the stopgap measure of using funds that had been committed but not yet spent from the Schools and Libraries support program to stabilize collection requirements. But taking advantage of lags and leads between receipts and outlays provided only a temporary solution. Commitments made under the Schools and Libraries program will eventually be manifest in spending, and the USF will have to replace the funds it used earlier. In part, the FCC raised the con-
tribution rate for the first quarter of 2005 to make up for that deficiency.
Another factor holding down contribution rates was a change in the contribution methodology applied to the revenues of cellular telephone companies. Initially, the FCC allowed cell phone companies to include only 15 percent of their revenues in the USF base, believing that most cell phone calls were local. As long-distance cell phone calling plans became more common, the FCC increased that “safe harbor” portion to 28.5 percent. That policy change increased the size of the revenue base and reduced the rate of growth of the contribution factors.
The USAC’s shift to accounting practices that more closely resemble those used by the federal government may also affect the contribution rate. (For a discussion of the differences between USAC accounting practices and those of federal agencies, see Box 1-3 on page 11.) As the FCC makes the USAC conform to government account-ing standards, USF administrators may need to raise con-tribution rates to ensure that funds are in hand before they are committed. However, that change would be a onetime shift and might not permanently affect contribu-tion rates.
1986 1988 1990 1992 1994 1996 1998 2000 2002 2004
-15
-10
-5
0
5
10
15. FCC, Telecommunications Industry Revenues, various years, Table 8.

CHAPTER ONE INTRODUCTION 9
Figure 1-2.
Share of Contributions to the Universal Service Fund, by Type of Company(Percent)
Source: Congressional Budget Office based on Federal Communications Commission, Trends in Telephone Service (May 2004), p. 19-19.
Note: 2003 data run through the second quarter of the year.
1997 1998 1999 2000 2001 2002 2003
0
20
40
60
80
100
Long-Distance Providers Fixed Local Providers Wireless Providers

10 FINANCING UNIVERSAL TELEPHONE SERVICE
Figure 1-3.
Universal Service Fund Contribution Factors, by Quarter(Percent)
Source: Congressional Budget Office.
1998 1999 2000 2001 2002 2003 2004 2005
0
2
4
6
8
10
12

CHAPTER ONE INTRODUCTION 11
Box 1-3.
The Universal Service Fund and the Antideficiency Act
The Administration concluded several years ago that the Universal Service Fund (USF) constitutes a per-manent indefinite appropriation (that is, funding ap-propriated or authorized by law to be collected and available for specified purposes without further Con-gressional action). Although the USF constitutes “appropriated funds,” the fiscal and accountability controls applicable to the USF have not been clear. In September 2004, the Federal Communications Commission (FCC) decided that the Antideficiency Act was applicable to the USF.1 That law requires an agency to limit obligations of federal funds to the amount of financial resources available to the agency. The FCC also decided that funding commitment letters issued under the Schools and Libraries pro-gram (also known as the E-Rate Program) are record-able obligations, so the total amount of funds com-mitted may not exceed the amount available to the USF.
To comply with the Antideficiency Act, the Univer-sal Service Administrative Company (USAC) abruptly suspended issuing commitment letters and liquidated about $3 billion of investments in securi-ties and commercial paper. That action was required for two reasons. First, the USAC was obligating funds for the Schools and Libraries program in ex-cess of the total amount available. The USAC’s expe-rience with the Schools and Libraries Fund indicated that between 10 percent and 20 percent of its fund-ing commitments were not executed because recipi-ents or their vendors failed to satisfy requirements of the program. As a consequence, the USAC regularly issued commitment letters totaling the amount it ex-pected to actually provide rather than the amount it
had collected. Obligations in violation of the Antide-ficiency Act also resulted from the fact that although the USF receives funds each quarter on a regular schedule, commitment letters are issued in batches that could exceed available funds.
Second, the USF had invested in nonfederal securi-ties and commercial paper. Such funds held outside the Treasury are not available for obligation. In order to obtain sufficient funds to cover existing commit-ments, the USAC was forced to liquidate its invest-ments. The results of USAC’s sale of its nonfederal financial investments were recorded in the federal budget as receipts in 2004.2 According to the FCC and the Office of Management and Budget, none of the USF is currently invested outside the Treasury. In view of the applicability of the Antideficiency Act to the USF, the Government Accountability Office has asked the FCC to consider whether the Miscella-neous Receipts Statute is also applicable. That statute requires that money received for the use of the United States be deposited in the Treasury unless otherwise authorized by law. Application of the stat-ute would mean that the USAC could not resume holding any funds in nonfederal securities.
After suspending new commitments under the Schools and Libraries program late in fiscal year 2004, the USAC resumed issuing commitment let-ters in November 2004. In December 2004, the Congress and the President enacted Public Law 108-494, giving the USF a one-year exemption from ap-plication of the Antideficiency Act. In February 2005, a bill (S. 241) was introduced to permanently exempt the USF from compliance with the Antidefi-ciency Act.
1. 31 U.S.C. 1341(a). The Government Accountability Office recently concurred with that legal opinion. See GAO, Tele-communications: Greater Involvement Needed by FCC in the Management and Oversight of the E-Rate Program, GAO-05-151 (February 2005).
2. At the end of fiscal year 2004, the USF had $3.4 billion in cash held outside the Treasury.


2Options for Financing Universal Service
One choice regarding the financing of the Univer-sal Service Fund is whether to keep a telecommunica-tions-specific fee as the main source of financing or whether to fund universal service using general revenues, which pay for most federal programs. (The latter issue will be discussed in Chapter 3.)
If policymakers choose to keep financing universal service through fees on telecommunications services, several options are open to them. They could simply retain the current system despite its deteriorating revenue base. Alternatively, policymakers could expand the current approach of taxing revenues to include more telecommu-nications revenues in the contribution base. They could also move in new directions, most notably by assessing fees on telephone numbers or telephone capacity.
All of the alternatives discussed in this chapter would retain the current requirement that providers of telecom-munications services contribute directly to the USF. The method of calculating the fees would change, however. Instead of basing carriers’ contributions on interstate tele-communications revenues, the USF would use alternative metrics as the basis for carriers’ contributions. As with the current system, those fees would enter the carriers’ cost structure, which in turn would be reflected in the prices that carriers charged their business and residential cus-tomers. Also, as with the current contribution rate, those alternative metrics would need quarterly adjustment to match the USF’s changing need for funds.
Expand the Contribution Base of the Current SystemAs noted in Chapter 1, only about $80 billion of the roughly $230 billion in telecommunications revenues that are generated each year qualify for inclusion in the USF contribution base. The gap between the USF contri-bution base and total telecommunications revenues could
be narrowed by including more revenues in the base. Currently, revenues generated by intrastate telecommuni-cations services constitute the largest category of excluded funds. Additionally, some categories of nontelecommuni-cations spending are commonly discussed in that context, most notably revenues from high-speed Internet service delivered through cable modems.
Interstate Versus Intrastate RevenuesThe courts have ruled against the use of intrastate reve-nues to fund the USF, finding that the Telecommunica-tions Act of 1996 specified the use of interstate revenues to fund universal service.1 Nevertheless, the Federal Communications Commission has expanded the portion of telecommunications revenues that it defines as inter-state. The FCC has also raised the share of cell phone revenues that it considers to be interstate for contribution purposes, and it may similarly raise the default interstate portion for both cellular service and bundled services in the future. The FCC was able to increase the share of costs it identified as interstate and remain within the bounds of the law because a large fraction of the total costs incurred to deliver either interstate or intrastate service is joint and fixed and because the FCC provides guidance on the allocation of such costs to one or another specific service.2 Including intrastate revenues in the USF contribution base would also reduce the administrative burden of the current system: the administrators would no longer have to decide which carrier revenues were interstate and which were intrastate.
C HAP TER
1. Texas Office of Public Utility Counsel v. FCC, 183 F.3d 393 (5th Cir. 1999), cert. denied, 120 S. Ct. 2212 (2000).
2. Rules governing jurisdictional separation, established in FCC reg-ulations, assign 25 percent of the cost of local service to interstate service and thus define an upper limit. Jean-Jacques Laffont and Jean Tirole, Competition in Telecommunications (Cambridge, Mass.: MIT Press, 2000), p. 232.

14 FINANCING UNIVERSAL TELEPHONE SERVICE
Cable ModemsRevenues from Internet access services delivered through cable modems are not classified as telecommunications revenues, and the providers of such services are not con-sidered telecommunications carriers. In a series of deci-sions on the regulatory problems caused by the interde-pendence of computer technologies and services and the communications industry, the FCC divided “services” into telecommunications services and information ser-vices. The former are limited to transmitting voice or data without transforming them in any way. Information services, by contrast, involve transforming the communi-cations in some way. Thus, transmitting a voice conversa-tion is a telecommunications service, but providing voice mail, which records the voice for future playback, is an information service. As noted in Box 1-2, the transmis-sion portion of DSL is a telecommunications service sub-ject to USF contributions. Accessing the Internet is an in-formation service.
In response to court rulings, the FCC determined that cable modem service was an information service with an integrated telecommunications component. The implica-tion of the FCC determination is that because cable mo-dem service is not classified as an interstate telecommuni-cations service, cable companies are not required to pay into the USF for cable modem service, even though their service now competes with DSL, which is considered an interstate telecommunications service.3 The FCC deci-sion is being contested, and the issue of how to classify cable modem services is now before the Supreme Court. If the Court decides that cable modem service constitutes a telecommunications service, then providers of that ser-vice may become subject to USF contributions.
Establish Fees Based on Telephone NumbersOne proposed alternative for financing the USF is to im-pose a fee on carriers for each telephone number assigned to a customer.4 As of December 31, 2003, roughly 500 million telephone numbers were assigned in the United States—a number that was growing by 2.1 percent per year.5 A charge of about $1 per month per telephone number would have raised about $6 billion in 2003, almost covering the costs of universal service that year.
Because assigned telephone numbers currently cost noth-ing, carriers and institutions may be assigned more num-
bers than they actually use. If a system of financing uni-versal service that relied solely on a per-number tax was put in place, the volume of numbers assigned might drop even without any change in behavior, resulting in a per-line fee higher than $1 per month.
As a complement to a per-number fee, various number-based approaches present additional revenue-collection options. Most notably, many large institutions lease high-capacity private communications lines on which they cur-rently pay USF fees.6 Those lines are often not used for telephones directly connected to public telephone net-works but rather carry data and the institutions’ internal telephone system. The most prominent telephone-num-ber-based proposals include such large-capacity lines in the revenue base. Advocates of telephone-number-based fees propose that such large-capacity lines pay a multiple of the per-number fee based on tiers of capacity. For ex-ample, private leased lines with communications capacity of between 1.5 million and 4.5 million bits per second might pay one multiple of the per-number fee, and pri-vate lines with capacity of between 4.5 million and 45 million bits per second might pay a higher multiple. But the increase in the multiple would be less than the order-of-magnitude increase in the capacity of the line. Mean-while, private leased lines with capacity above 45 million bits per second would pay yet another multiple of the per-phone-number fee.7
3. FCC Order 02-77, March 14, 2002.
4. See Comments of AT&T Corporation Before the Federal Communi-cations Commission in the Matter of Federal-State Joint Board on Universal Service, CC Docket No. 96-45 (February 28, 2003), available at http://gullfoss2.fcc.gov/prod/ecfs/retrieve.cgi?native_or_pdf=pdf&id_document=6513583215. See also Comments of the Intercarrier Corporation Forum Before the Federal Communica-tions Commission in the Matter of Developing a Unified Intercarrier Compensation Regime, CC Docket No. 01-92 (October 5, 2004), available at http://www2.sprint.com/mr/cmastaticfiles/non-landing/documents/PPTopic/Complete%20Ex%20Parte.pdf.
5. Federal Communications Commission, Number Resource Utiliza-tion in the United States as of December 31, 2003 (May 2004), Table 1.
6. Typically, the capacity of a telecommunications connection, regardless of the medium (fiber-optic cable, copper wire, or radio spectrum) is measured by the number of bits (computer zeros or ones) that it can carry per second. A landline voice conversation is allocated 64,000 bits per second; cell phones can carry less than a typical landline, which in part accounts for their inferior quality. Private lines, rented by large institutions, often have a capacity of 1.5 million bits per second but can range much higher.
7. Each proposal is different and includes a different set of tiers.

CHAPTER TWO OPTIONS FOR FINANCING UNIVERSAL SERVICE 15
Advocates of that type of system argue that it would stem the current erosion of the revenue base and would sup-port that base in the future. A tax on telephone numbers would fall on both landline and cellular telephones. Bun-dling local service together with long-distance service would not present a problem because, regardless of the number of services put on a telephone, the associated cus-tomer would still pay a single USF fee on the telephone number. Advocates of financing the USF with a num-ber-based system argue that it would cover Internet tele-phony because if Internet telephony customers wanted to connect to the telephone network, they would still need a telephone number.
Although a telephone-number-based fee might be more resilient in the future than the current revenue-based sys-tem, some changes in behavior to avoid the tax would be likely to occur. For example, online fax services might re-duce the number of telephone numbers they used. Some erosion, therefore, would probably be inevitable.
Establish Fees Based on theCapacity of Telephone LinesSome carriers and analysts have suggested imposing USF fees on carriers on the basis of the capacity of the tele-phone lines that the carriers provide to end users. As with a telephone-number-based revenue system, the idea behind replacing the current system with a fee on tele-phone-line capacity is to decouple USF financing from a declining revenue base. The capacity of the telecommuni-cations system to transmit information is growing: more telephone conversations, e-mails, and other computer files can be carried than ever before. As with the number-based system, advocates of a capacity-based financing sys-tem argue that such a policy change would provide pro-tection from the largest threats to the USF’s contribution base. Since the new fees would be based on capacity, bun-dling long-distance and local services or providing flat-rate long distance would not continue to undermine the base. Nor would growth in Internet telephony erode the contribution base. The reason is that no matter what pro-tocol or physical medium—wired or wireless—is used to communicate, capacity is a requirement for connection.
Some proposals for a capacity-based system contain a fee schedule under which capacity tiers would determine where the fees would rise in a series of steps. That feature is designed to account for the extremely high capacity of a relatively small number of end users, who, without the
tiering adjustment, would pay a disproportionate amount of the cost of universal service.
Capacity-based fees would require the FCC to collect a substantial amount of new information about carriers’ physical infrastructure, specifically the capacity of their end-user connections. Rough estimates of such capacity are available, but they are not of sufficient quality or de-tail to serve as the basis for a financing system. Further-more, like the information on current revenues, estimates of communications capacity would be subject to frequent change as technology improved.
Distributional IssuesChanging the USF financing system raises three issues about who would bear the costs of the system:8
B The distribution of the initial burden of USF fees among telecommunications companies;
B The split of USF fees between business and residential consumers; and
B The division of USF fees between providers and con-sumers of telecommunications services.
Analyzing the Distributional Effectsof Policy OptionsTo evaluate the current and alternative financing mecha-nisms for the USF, the Congressional Budget Office used an FCC model that traces quantities of traffic and the capacity to carry that traffic among many different classes of telecommunication carriers, consumers, and services. The model allows analysts to estimate how policy changes would affect both carriers and consumers. CBO used the model to estimate how various policy changes would alter the fees paid by providers (local, long distance, and cellu-lar) and consumers (both residential and business).9
The model employs assumptions about the quantities and prices of a variety of telecommunications services. Those assumptions are typically based on historical trends (for example, growth in subscribers to telephone service). The details of a proposed policy, such as which type of service or line is to contribute, are specified in the
8. The distributional issues on the spending side of the USF are not addressed in this paper.
9. The model provides no usage or geographic information about the distribution of the fees within those categories.

16 FINANCING UNIVERSAL TELEPHONE SERVICE
model, which then calculates how the policy changes would affect the fees needed to fund USF program spending and how those fees would be distributed between residential and business consumers and among different types of telecommunications companies.
The model is based on data collected through 2001 and produces estimates through 2007.10 Some factors have changed little since 2001. For example, the rates of household formation and telephone installation among households change only slowly. The use of residential high-speed Internet and cellular telephony, however, has increased rapidly.
A limitation of the model is that it cannot be used to show the distributional effects of including revenues derived from intrastate services in the contribution base. However, it can be used to analyze the effects of including cable modem revenues in the contribution base.
Distribution of the Initial Burden of USFContributions Among Different Types of Telecommunications ProvidersRegardless of how the burden of paying for universal ser-vice is ultimately divided between the consumers of tele-communications services and the owners and employees of telecommunications companies, the obligation to pay falls first on providers. The model allows the initial distri-bution of payments to be divided among three types of carriers: long-distance companies, local telephone compa-nies, and wireless carriers. The model does not distin-guish within each group, although there are differences within each category.
Under current policy, the rise in cellular carriers’ share of the initial burden mirrors the decline in long-distance carriers’ share. In 2003, wireless carriers paid 22 percent of all contributions to the USF. By 2007, contributions from wireless carriers are projected to account for 31 per-cent of contributions. Long-distance carriers are expected to experience a substantial decline during the same period, from 51 percent to 37 percent of contributions. Local telephone carriers would experience a small increase in their share under current policy, from 28 percent to 31 percent, over the same period (see Table 2-1).
Except for a fairly consistent rise in the share of cellular carriers, different financing systems would produce gen-erally divergent distributions of the burden of fees. De-pending on the system, local telephone companies’ share could range from 28 percent to 55 percent. Similarly, long-distance companies could see their share range from 13 percent to 37 percent.
Compared with current policy, including cable modem service revenues would not alter the relative standings of different types of providers: the share of each provider type would fall by 3 percentage points compared with the estimated shares in 2007 under current policy. However, that result is not the whole story. Increasingly, cable com-panies provide local telephone service. Consequently, some carriers classified as local telephone companies would be disproportionately affected by that option. However, as noted above, the model does not make dis-tinctions within categories of providers: that is, it cannot distinguish between the revenues derived from local tele-phone service provided by a cable company and the reve-nues derived from local telephone service provided by a traditional wireline company.
Division of USF Fees Between Business andResidential ConsumersThe second distributional question is how a policy change would affect the share of USF contributions that appear on the bills of residential and business consumers, assuming that the carriers passed on their contributions to their customers without markup. That distribution of billings does not indicate who would ultimately bear the burden of universal service, however. Businesses typically attempt to pass along any cost increase, whether from USF fees or other sources, to their customers. The extent to which they can do so depends on the conditions of supply and demand in their market. Cost increases gener-ally result, on the one hand, in higher prices for consum-
10. The FCC staff model and study relating to alternative methodolo-gies for calculating contributions to federal universal service and its accompanying documentation can be found at www.fcc.gov/wcb/universal_service/documents/USFSTUDY.WK4; www.fcc.gov/wcb/universal_service/documents/USFprint.WK4; and http://hraunfoss.fcc.gov/edocs_public/attachmatch/FCC-03-31A1.pdf.
CBO updated a few of the more rapidly changing variables to reflect current conditions in the market. The major changes in assumptions were that CBO assumed lower USF revenue require-ments, lower long-distance and broadband prices, and lower resi-dential Internet telephony subscriptions. CBO assumed higher rates of residential broadband subscriptions, cellular telephony- only subscriptions and consequently a movement by consumers to larger buckets of cellular minutes.

CHAPTER TWO OPTIONS FOR FINANCING UNIVERSAL SERVICE 17
Table 2-1.
Distribution of Telecommunications Companies’ Contributions to the USFUnder Different Financing Mechanisms, 2003 and 2007 (Percent)
Source: Congressional Budget Office.
Note: USF = Universal Service Fund; n.a. = not applicable.
a. Cable modem revenues only.
ers and, on the other, in reduced profits for business own-ers and lower wages for employees. But the FCC model presents only the initial and second-round allocation of the USF contributions, not their ultimate incidence in the economy.
On average, contributions by households would not change substantially on an absolute or relative basis if current policy remained in effect between 2003 and 2007. Households would see their monthly charges rise from roughly $2.09 in 2003 to $2.26 in 2007 if policy did not change, an 8.1 percent increase (or 0.1 percent after removing the effects of inflation). Their share of USF payments would rise from 43 percent in 2003 to 44 percent in 2007 (see Table 2-2). Correspondingly, busi-ness consumers would see their share fall from 57 percent to 56 percent of payments. Most of the proposed policy alternatives would not affect the percentage distribution of USF fees between residential and business consumers compared with current policy.
In absolute terms, however, households would see their USF charges rise from $2.09 per month in 2003 to between $2.26 and $2.47 per month in 2007, depending on whether current policy or one of the alternatives con-
sidered here was used to finance universal service. That $0.17 to $0.38 monthly increase would most likely occur in the context of a decrease of about $1.98 in residential customers’ average monthly interstate bill (including the subscriber line charge, long-distances charges, and USF fees) over the 2003-2007 period and increases in the cost of the intrastate portion of local phone service, which is exempt from USF fees.11
Division of USF fees Between Providersand ConsumersThe initial distribution results produced by the model measured only USF payments made by telephone compa- nies. Although the costs and benefits of the USF fall mostly on telecommunications companies (and, by ex-tension, on their shareholders and employees) in the first instance, they pass on some of those costs and benefits to their customers. The extent to which they are successful in doing so depends on market conditions and regulatory constraints.
Share of Total Contributions, by Type of Company
Financing OptionLocal Telephone
CompaniesLong-Distance
CompaniesCellular Telephone
Companies Cable Companiesa
In 2003
Current Policy 28 51 22 n.a.
In 2007
Current Policy 31 37 31 n.a.
Including Cable Modem Revenues 28 34 28 9
Telephone-Number-Based Plan 55 13 32 n.a.
Capacity-Based Plan 43 22 33 n.a.
11. FCC, Trends in Telephone Service (May 2004), Table 13.1, indi-cates that over the past decade, the average increase in local monthly charges and other fees besides the subscriber line charge was $0.16 per year.

18 FINANCING UNIVERSAL TELEPHONE SERVICE
Table 2-2.
Distribution of Business and Residential Consumers’ Share of USF Contributions Under Different Financing Mechanisms, 2003 and 2007
Source: Congressional Budget Office.
Note: USF = Universal Service Fund.
The empirical evidence is mixed about the extent to which providers pass along the expense of USF contribu-tions to consumers. An FCC study of some long-distance companies’ markups of USF fees suggested that providers sometimes charged customers fees that were greater than the companies’ underlying USF contributions.12 In other instances, the size of consumer USF charges bore no clear relationship to the USF fees. However, the FCC noted that some of those charges could be accounted for by the need to recover the fees from uncollectible accounts and other factors. As a result of its study, the FCC limited the ability of providers to mark up their USF contributions in a 2002 ruling.
CBO has found no academic studies that specifically address the pass-through of USF contributions. But there is a parallel literature involving long-distance access charges.13 Access charges are fees that long-distance com-panies pay to local companies to complete long-distance calls. As access charges have decreased, various analysts have examined whether competition among long-
distance companies has been sufficient to make them pass the decreases through to their consumers. The results of such studies are mixed, with more-recent ones suggesting that long-distance firms were under sufficient competi-tive pressure to make them pass through the decreases in access charges to their consumers. If long-distance companies behaved similarly with charge increases as with decreases, then they would pass along increases or decreases in their USF contributions to their customers.
The USF contributions based on the subscriber line charge, however, are based on a service delivered in a mar-ket with little competition. The division of that portion of the contributions between providers and consumers would depend on the conditions of supply and demand in the particular market and on the regulatory regime in place. In its analysis, CBO assumed that all USF contri-butions would be passed forward without markup to both business and residential consumers.
Average Monthly Chargeper Household Percentage of Contributions Met by
Financing Option (Dollars) Residential Consumers Business ConsumersIn 2003
Current Policy 2.09 43 57
In 2007
Current Policy 2.26 44 56
Including Cable Modem Revenues 2.47 48 52
Telephone-Number-Based Plan 2.47 46 54
Capacity-Based Plan 2.28 45 55
12. FCC, In the Matter of Federal-State Joint Board on Universal Service and Other Matters: Report and Order and Second Further Notice of Proposed Rulemaking (December 12, 2002), pp. 25-32, available at http://hraunfoss.fcc.gov/edocs_public/attachmatch/FCC-02- 329A1.pdf. See especially paragraph 45 ff and footnotes 124 and 125.
13. This discussion is based on David Kaserman and John Mayo, “Competition in the Long Distance Market,” in Martin Cave and others, eds., Handbook of Telecommunications Economics, vol. 1, Structure, Regulation and Competition (Amsterdam: Elsevier, 2002), pp. 533-544. As noted in Chapter 1, the USF operates along with other policies that promote universal service. Access charges also help rural carriers provide inexpensive telephone ser-vice.

3The Economic Cost of Alternatives
for Financing Universal Service
A key consideration underlying any choice about federal financing is whether funds are collected at the lowest cost to the economy. Because fees or taxes imposed on the consumption of a service alter the prices that con-sumers face, they distort consumers’ choices: consumers will allocate their spending differently than they would have in the absence of a tax. Aside from taxes intended to discourage a particular activity, taxes or fees typically di-minish the benefits that the economy delivers to consum-ers. Different taxes and fees distort consumers’ choices to different degrees and so impose different costs on the economy.
Economic Distortions from theCurrent Mechanism and AlternativesEstimates of the losses to the economy that are caused by distortions associated with the current system of funding universal service provide a basis on which to conclude that either a number-based or a capacity-based system would most likely have a lower economic cost than the current system does. This analysis does not extend to quantifying the size of that advantage, however.
The extent of the loss induced by a tax or fee depends for the most part on two factors: the size of the tax and the degree to which consumers reduce their purchases as a result of being forced to pay the higher prices associated with the tax. The higher the tax rate and the more con-sumers reduce their purchases when faced with higher tax-inclusive prices, the greater the loss caused by distor-tion.
The universal service system generally serves to reduce the cost of basic access for people in high-cost areas by in-creasing the cost of long distance for all users.1 The de-mand for basic access is extremely insensitive to price: in
other words, consumers have almost no reaction to changes in the price of basic telephone access.2 Consum-ers’ reaction to price changes for long-distance service is also small but not quite zero. (A similar argument could be made about cellular service, which is also more sensi-tive to price fluctuations than is basic access.) Fees on the use of long-distance and cellular telephone service, there-fore, trigger a larger consumer response and thus a larger reduction of consumer benefit than does a fee of the same size on basic access. Because the USF fee varies with con-sumer spending on long distance, it affects a consumer’s decision every time a long-distance or cell phone call is made. Thus, a flat fee that is insensitive to use, such as the fee in both the number-based and capacity-based alterna-tives, would distort consumer choice less than the current variable fee does.
However, recent changes in telephone billing practices moderate one distortion caused by the USF fee. Increas-ingly, long-distance and cellular service carriers are pro-viding bundles of long-distance minutes for a fixed fee. Carriers offer diverse plans that vary in size, time-of-day restrictions, and monthly fees.3 For consumers who sub-scribe to such plans, the USF becomes less a usage fee on
C HAP TER
1. This discussion focuses on the High Cost component of universal service, which is the largest. The arguments would be different for the other support mechanisms.
2. In economic terms, the elasticity of demand for long-distance calls is generally agreed to be around -0.7, whereas the elasticity of demand for basic telephone access is thought to be closer to -0.02 or -0.03. Lester Taylor, “Customer Demand Analysis,” in Martin Cave and others, eds., Handbook of Telecommunications Economics, vol. 1, Structure, Regulation and Competition (Amsterdam: Else-vier, 2002), pp. 126-127. See, in the same volume, Michael H. Riordan, “Universal Residential Telephone Service,” p. 447.
3. For a sample of the terms of such plans, see www.MyRatePlan.com.

20 FINANCING UNIVERSAL TELEPHONE SERVICE
their long-distance calls and more an access fee on long-distance service. For those consumers, the price of any additional phone call—if they stay within their plans—is unaffected by the USF fees, and consequently the nega-tive impact of the fees is reduced. Marketing statistics suggest that about a quarter of telephone subscribers cur-rently have such plans and that more consumers will buy them in the future.
Cell phone subscriptions contribute to the trend toward flatter fees. Traditionally, long-distance and international service provided by wireline is priced by minutes of ser-vice. But cell phone plans more often offer unlimited long-distance calls (albeit, usually only during the eve-ning and on weekends) and specified numbers of minutes (usually allocated in “buckets”) that can be used anytime without incurring extra charges beyond the flat monthly fee. Since about 170 million people have cellular tele-phones, the ability to substitute cellular long distance for conventional long distance is available for many house-holds and can be expected to increase. New technology should make various combinations of services more readily available. The use of cell phones and other fixed-minute-based pricing plans means that USF fees are less often an influence on a consumer’s decision to buy an additional minute of telephony service than they were in the past.
USF Fees and Competing Advanced Telecommunications ServicesAs noted in Chapter 2, the FCC does not impose USF fees on cable modem service but does impose them on a portion of the revenues derived from digital subscriber line service. Those two forms of high-speed Internet access—cable modems and DSL—compete in the mar-ketplace for residential customers and generally provide the same service. A tax applied to one technology that provides a certain service but not to another technology that provides the same service distorts prices and thus imposes an economic cost.
The uneven regulatory treatment of cable modems and DSL is largely a historical artifact, arising from the fact that DSL is a service provided over a telephone wire, which was already subject to USF fees.4 By contrast, cable modem service evolved in the context of cable video ser-
vice, which was not subject to USF fees because it was never considered a telecommunications service. Thus, services delivered by telephone wires and video cables have now come to compete in the marketplace under dif-ferent regulatory regimes and different taxation—creating economic distortions.
Funding the USF Through General RevenuesMost federal spending is funded through general reve-nues, and some analysts have suggested that lawmakers consider financing universal service through that mecha-nism.5 The current financing system was put into place when the Bell telephone system relied on profits from business and long-distance customers to provide service in high-cost areas. With the breakup of the Bell system, what had been a set of intracorporate transfers became a set of intercarrier transfers, which was then modified, most recently, in the Telecommunications Act of 1996. Financing universal service with general revenues would dissolve the long-standing relationship between the fund-ing of universal service and spending on telecommunica-tions services.
The economic cost of raising a dollar in general revenues, which may influence the supply of labor and capital, is generally less than the economic cost of raising a dollar from sector-specific taxes, which tend to distort consum-ers’ choices by affecting the prices of goods and services. A 1998 assessment determined that USF fees cost the economy an additional $0.64 to $1.47 for each dollar in revenue they produced.6 Because long-distance access fees have declined since that analysis, those estimates probably overstate the current economic cost of the USF fee sys-tem. The economic losses arising from general taxes are estimated to range between $0.25 and $0.40 for each ad-ditional dollar collected. Thus, they are substantially lower than the cost of raising an additional dollar through fees or taxes on telecommunications services.
4. However, the FCC did affirmatively decide to subject DSL to USF fees. See GTE Corporation Asymmetric Digital Subscriber Line Order, 13 F.C.C. Rcd. 22466 (1998).
5. Thomas Hazlett and others, Sending the Right Signals: Promoting Competition Through Telecommunications Reform (report submit-ted by the Analysis Group to the U.S. Chamber of Commerce, September 22, 2004), p. xviii.
6. Michael H. Riordan, “Universal Residential Telephone Service,” in Cave and others, eds., Handbook of Telecommunications Eco-nomics, vol. 1, p. 438, available at www.columbia.edu/~mhr21/US-aug-29.pdf; and Jerry Hausman, Taxation by Telecommunica-tions Regulation: The Economics of the E-Rate (Washington, D.C.: AEI Press, 1998), p. 15, available at www.aei.org/docLib/20040218_book245.pdf.


