Weierstraß-Institut für Angewandte Analysis und Stochastik Hans-Joachim Mucha, Tatjana Mirjam Gluhak AG DANK Meeting, Berlin, WIAS, November 19, 2016 Finding Groups in Compositional Data – Some Experiments AG DANK Meeting, Berlin, WIAS XIX.XI.2016
Transcript
Weierstraß-Institut für
Angewandte Analysis und Stochastik
Hans-Joachim Mucha, Tatjana Mirjam Gluhak
AG DANK Meeting, Berlin, WIAS, November 19, 2016
Finding Groups in
Compositional Data –Some Experiments
AG DANK Meeting, Berlin, WIAS XIX.XI.2016
AG DANK Meeting, Berlin, WIAS XIX.XI.2016
Outline
• Introduction
• Motivation
• Clustering of profiles
• Applications to archaeometry
• Validation of stability of clusters
• Summary
2
AG DANK Meeting, Berlin, WIAS XIX.XI.2016
Introduction
In archaeometry or geology, the chemical composition
of oxides of objects is measured, and often the results
are presented in percentages. Then, so-called
“compositional data analysis” (Aitchison 1986) should
be applied as the only one valid statistical analysis.
Nowadays, besides oxides, a much greater number of
trace elements can be measured by new innovative
technical equipment. Usually, these measurements are
in ppm (parts per million) or ppb (parts per billion).
The question arises: Can we find groups in such
(mixed) data by applying “usual” statistical clustering?
3
AG DANK Meeting, Berlin, WIAS XIX.XI.2016
Introduction
First, the talk is concerned with finding groups (clusters)
in (strict) compositional data, that is nonnegative data
with row sums equal to a constant, usually 1 in case of
proportions or 100 in case of percentages.
Without loss of generality, the cluster analysis of
observations of compositional data is considered,
where the row profiles contains parts of some whole.
Distance functions between profiles and appropriate
clustering methods are recommended. Finally,
applications to archaeometry are presented.
4
AG DANK Meeting, Berlin, WIAS XIX.XI.2016
Motivation
In archaeology, the aim of clustering is to find groups in
data such as proveniences of glass objects or pottery.
The motivating example is taken from Baxter & Freestone
(2006) where the complete original data matrix Z is
published as it is analyzed hereafter.
Each object is characterized by J = 11 variables, the
contents of oxides in %. The sum in each row is 100%.
This dataset of colorless Romano-British vessel glass
contains two groups. Group 1 consists of 40 cast bowls
with high amounts of Fe2O3. Group 2 also consists of 40
objects: this is a collection of facet-cut beakers with low
Al2O3.
5
AG DANK Meeting, Berlin, WIAS XIX.XI.2016
Motivation
Log-ratio
compositional
data analysis
(Aitchison
1986): use X
with elements
instead of Z,
where
is the geometric
mean of object i.
6
))((log iijij gzx z
J
iJiii zzzzg /1
21 )...()(
AG DANK Meeting, Berlin, WIAS XIX.XI.2016
Motivation
Log-ratio compositional data analysis produces outliers, see object
79. Moreover, if one changes the value of Sb2O3 quite slightly, say
from 0.08 to 0.0008, object 79 “drives” far away in the PCA plot.
7
AG DANK Meeting, Berlin, WIAS XIX.XI.2016
Motivation
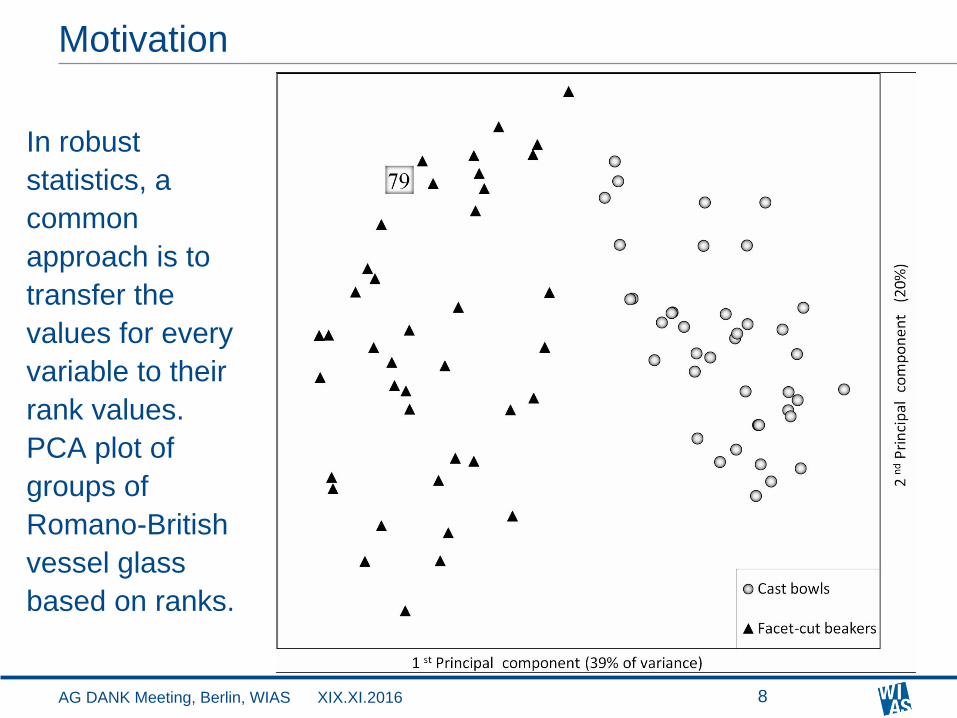
In robust
statistics, a
common
approach is to
transfer the
values for every
variable to their
rank values.
PCA plot of
groups of
Romano-British
vessel glass
based on ranks.
8
AG DANK Meeting, Berlin, WIAS XIX.XI.2016
Motivation
Transformation into ranks solves the problems of different scales,
skewness, and (univariate) outliers. Alternatives are concave
transformations such as the logarithmic transformation (see later).
9
AG DANK Meeting, Berlin, WIAS XIX.XI.2016
Motivation
What happens if one
applies “usual”
clustering? Heatmap
of the Euclidean (80
× 80) distance
matrix D of the
vessel glass objects.
The square of a cell
is proportional to the
distance value.
Both, Ward and k-
means find the true
classes without
error.
10
AG DANK Meeting, Berlin, WIAS XIX.XI.2016
Clustering of profiles
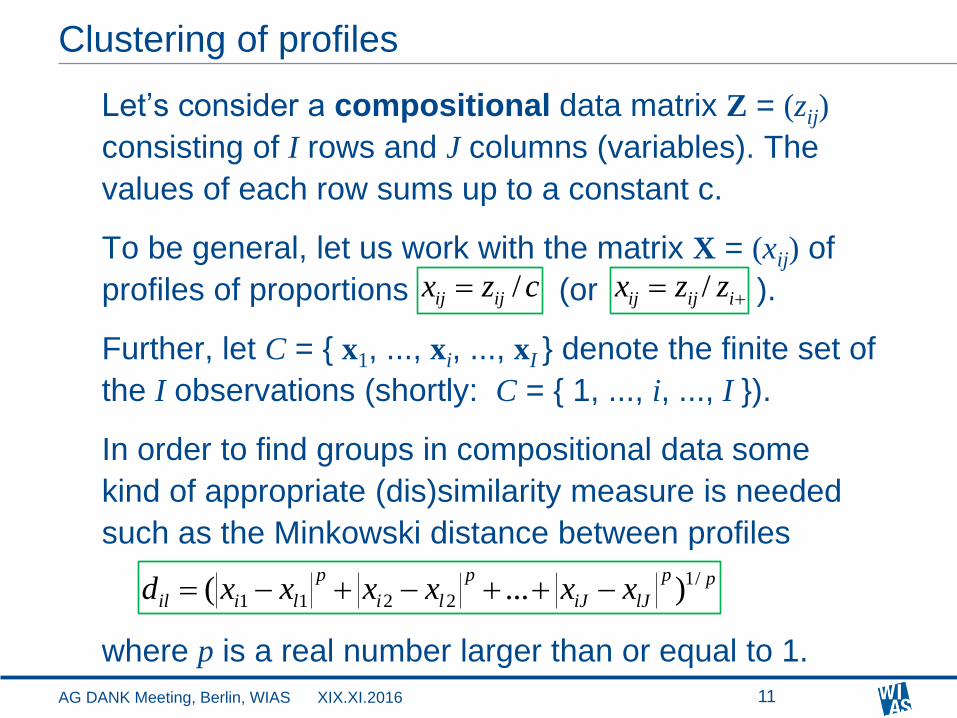
Let’s consider a compositional data matrix Z = (zij)
consisting of I rows and J columns (variables). The
values of each row sums up to a constant c.
To be general, let us work with the matrix X = (xij) of
profiles of proportions (or ).
Further, let C = { x1, ..., xi, ..., xI } denote the finite set of
the I observations (shortly: C = { 1, ..., i, ..., I }).
In order to find groups in compositional data some
kind of appropriate (dis)similarity measure is needed
such as the Minkowski distance between profiles
where p is a real number larger than or equal to 1.
11
czx ijij /
iijij zzx /
pp
lJiJ
p
li
p
liil xxxxxxd /1
2211 )...(
AG DANK Meeting, Berlin, WIAS XIX.XI.2016
Clustering of profiles
The usual task of clustering is finding a partition of C in K
non-empty clusters (subsets) Ck, k = 1,2,...,K.
The most general model-based Gaussian clustering is
when the covariance matrix Σk of each cluster k is allowed
to vary completely.
Then has to minimized, where
is the sample cross-product
matrix, nk the cardinality, and the mean profile cluster k.
Clearly, Wk is singular in the case of compositional data.
12
K
k k
kkK
nnV
1
logW
T
ki
Ci
kik
k
)()( xxxxW
kx
AG DANK Meeting, Berlin, WIAS XIX.XI.2016
Clustering of profiles
However, the sum of squares (SS) criterion
looks fit for clustering of profiles.
This is equivalent to minimizing ,
where is the squared
Euclidean distance. The latter can be generalized to
,
where Q is diagonal with qjj = qj >0. Examples are
(to get Chi-squared distance),
(S: estimate of Σ)
(transformation to mean 1) …
13
K
k
kKV1
)tr( W
2
liild xx
2)()(),(
QQ xxxxQxxxx lili
T
lilid
k kCi
ilCl
il
K
k k
K dn
V1
1
1))(diag( SQ
),...,,diag(21 Jx
x
x
x
x
x
Q
2/1)),...,,(diag( 21
JxxxQ
AG DANK Meeting, Berlin, WIAS XIX.XI.2016
Applications to archaeometry
PCA plot of cluster membership of 54 basalt mortars from El-Wad
based on logarithmic transformed data . Ward’s
hierarchical method is applied. 11 oxides (28 trace elements not used).
14
)1ln( ijij zx
Most stable
region (see
validation
below):
103, 105,
107, 111,
122, 124,
136, 137,
139, 25, 40,
48, 53, 83).
AG DANK Meeting, Berlin, WIAS XIX.XI.2016
Applications to archaeometry
Investigation of stability of Ward’s clustering via bootstrap
resampling technique. The ARI votes for K=2 clusters.
15
AG DANK Meeting, Berlin, WIAS XIX.XI.2016
Applications to archaeometry
Investigation of individual cluster stability of Ward’s clustering. The
stability of clusters look quite different.
16
AG DANK Meeting, Berlin, WIAS XIX.XI.2016
Introduction
Investigation of
stability (reliability) of
cluster membership of
each observation
(partial view of the
table).
17
AG DANK Meeting, Berlin, WIAS XIX.XI.2016
Summary
Log-ratio compositional data analysis is problematic (zero
values not allowed, generates outliers, geometric mean
seems to be inappropriate,…).
The most difficult problems in clustering remain:
model selection (variable selection),
validation (investigation of stability) of clustering results,
appropriate data preprocessing such as logarithmic