55
- Mr Kim

- Mr Kim

3 4 5 6 7 8 9 10
0
5
10
15
20
25
30
x
c.f
3 4 5 6 7 8 9 10
0
5
10
15
20
25
30
x
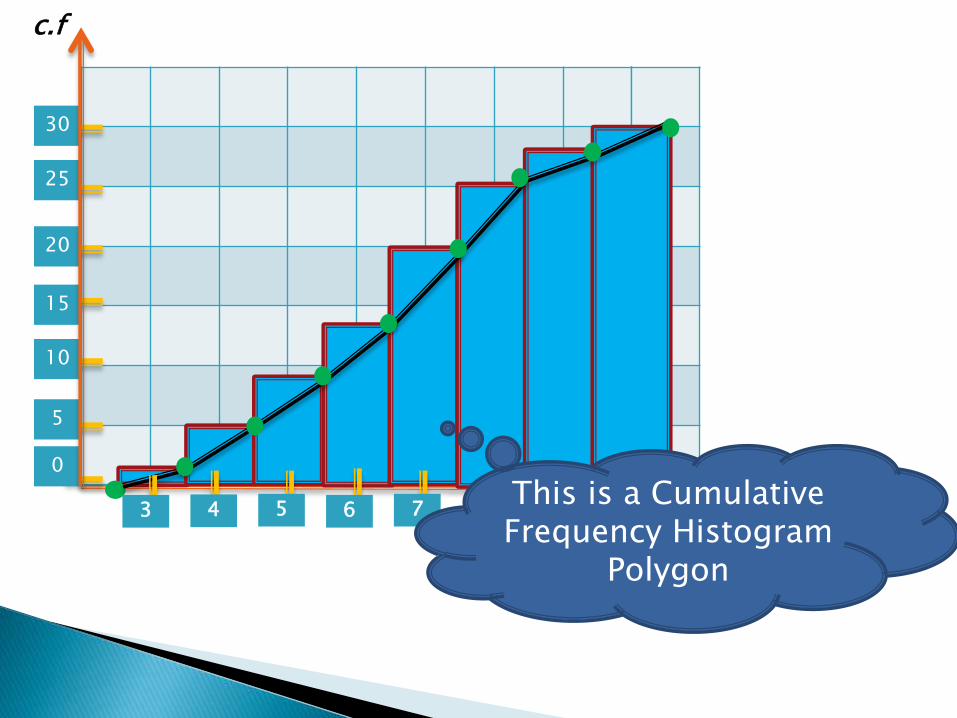
c.f
This is a Cumulative Frequency Histogram
Polygon
3 4 5 6 7 8 9 10
0
5
10
15
20
25
30
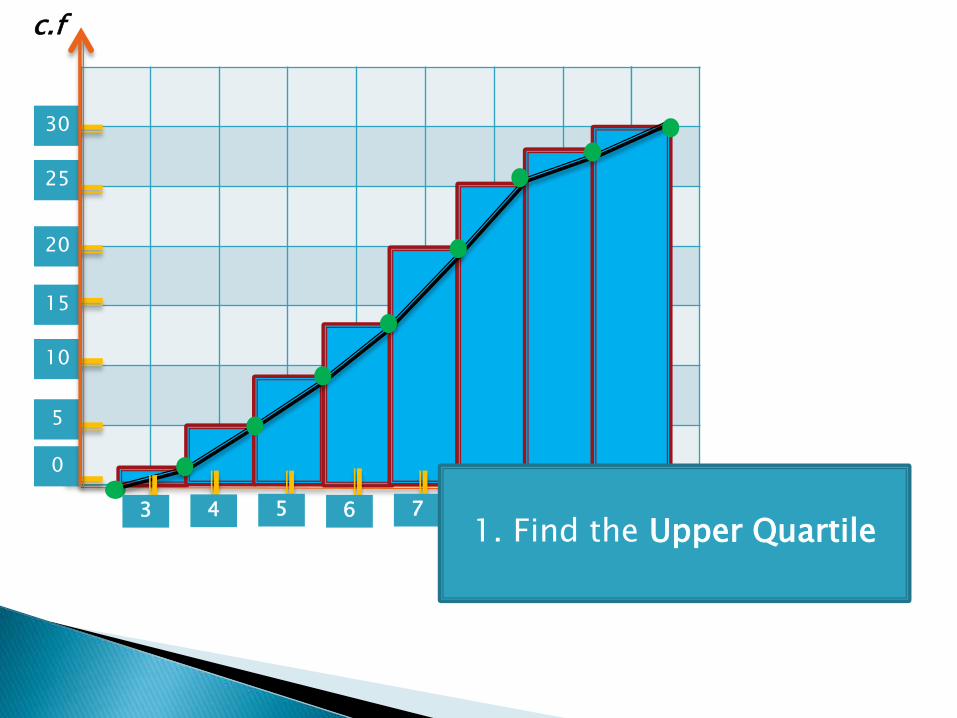
c.f
x1. Find the Upper Quartile

3 4 5 6 7
0
5
10
15
20
25
30
8
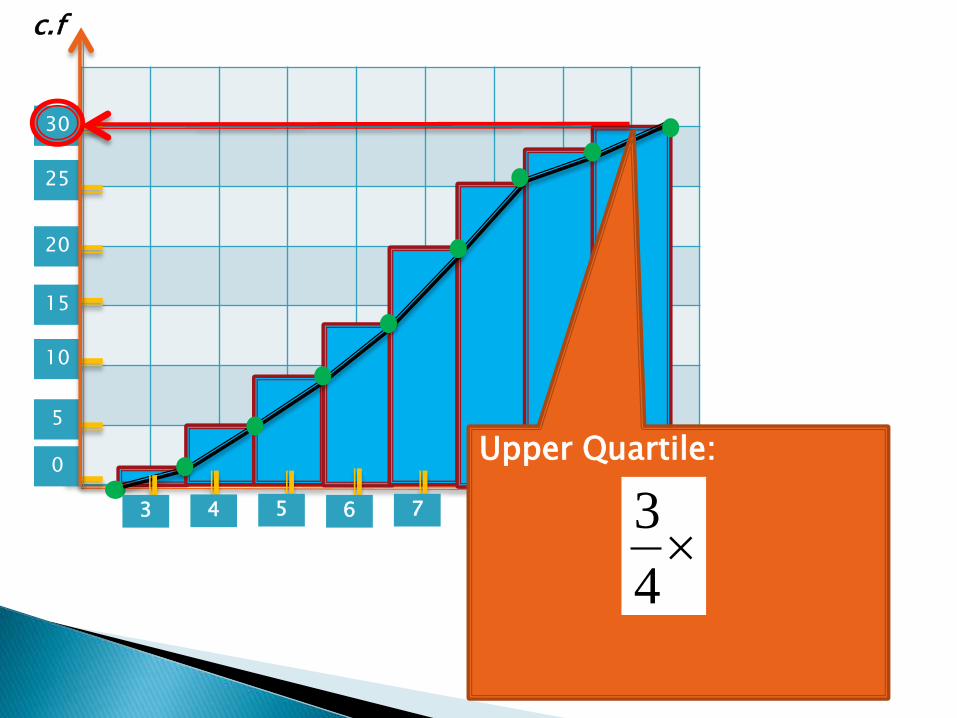
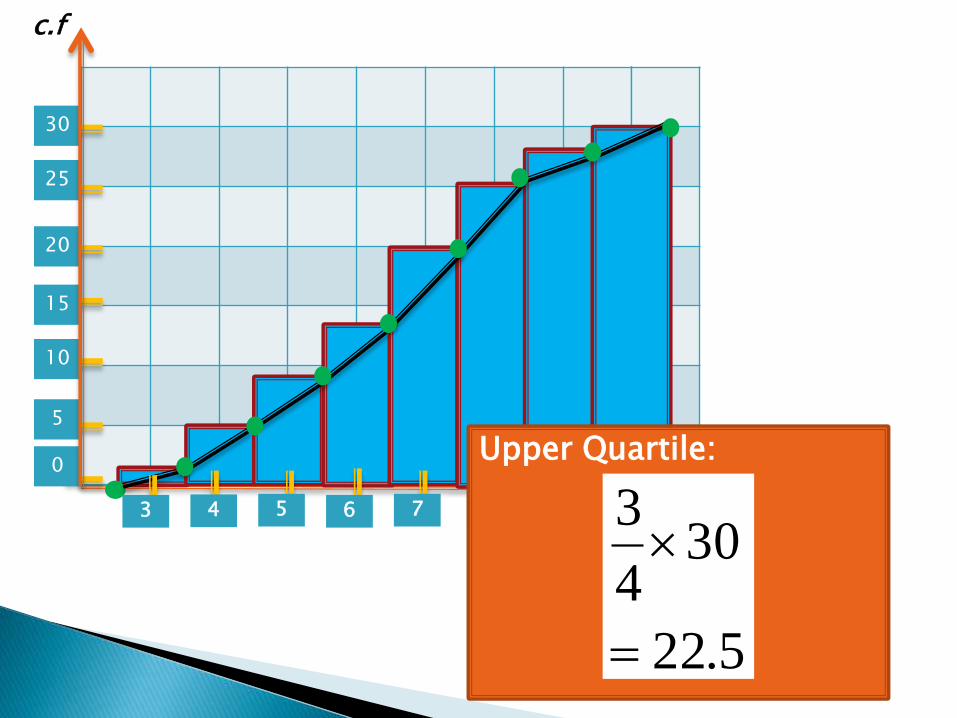
Upper Quartile:
c.f
x
4
3

3 4 5 6 7
0
5
10
15
20
25
30
8
Upper Quartile:
c.f
x
4
3
For Upper Quartile, always
Multiply by 4
3

3 4 5 6 7
0
5
10
15
20
25
30
8
Upper Quartile:
c.f
x
4
3
Locate the highest column

3 4 5 6 7 8 9 10
0
5
10
15
20
25
30
Upper Quartile:
c.f
x
4
3

3 4 5 6 7 8 9 10
0
5
10
15
20
25
30
Upper Quartile:
c.f
x
4
3
3 4 5 6 7 8 9 10
0
5
10
15
20
25
30
Upper Quartile:
c.f
x
4
3

3 4 5 6 7 8 9 10
0
5
10
15
20
25
30
Upper Quartile:
c.f
x
304
3
3 4 5 6 7 8 9 10
0
5
10
15
20
25
30
Upper Quartile:
5.22
304
3
c.f

3 4 5 6 7 8 9 10
0
5
10
15
20
25
30
Upper Quartile:
c.f
x
5.22
304
3
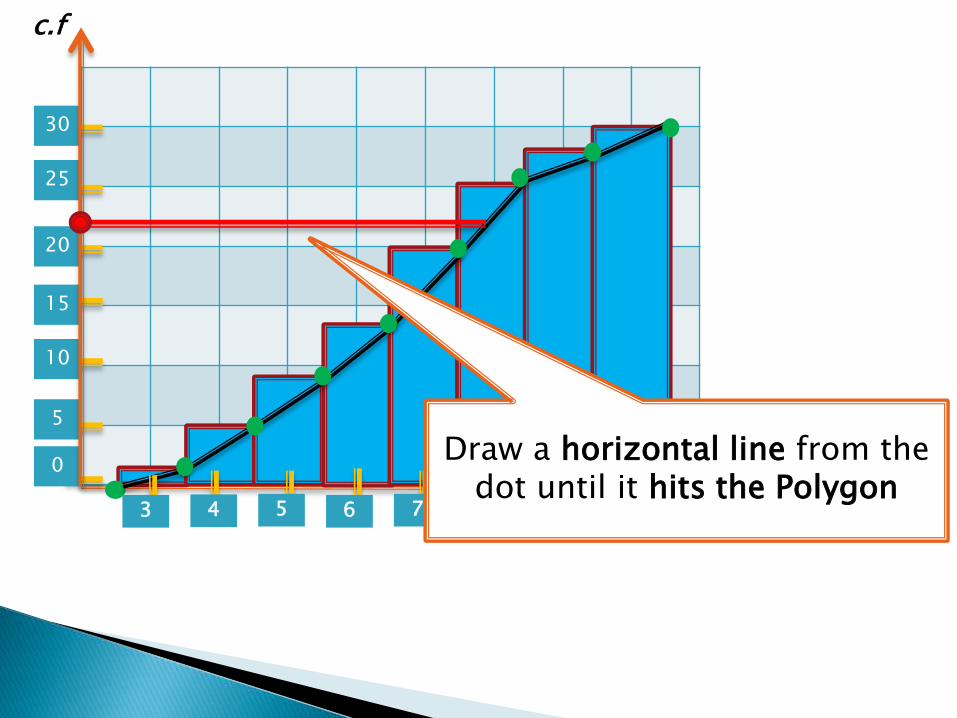
Locate 22.5 on the c.f axis

3 4 5 6 7 8 9 10
0
5
10
15
20
25
30
Upper Quartile:
c.f
x
5.22
304
3
Locate 22.5 on the c.f axis
3 4 5 6 7 8 9 10
0
5
10
15
20
25
30
c.f
x
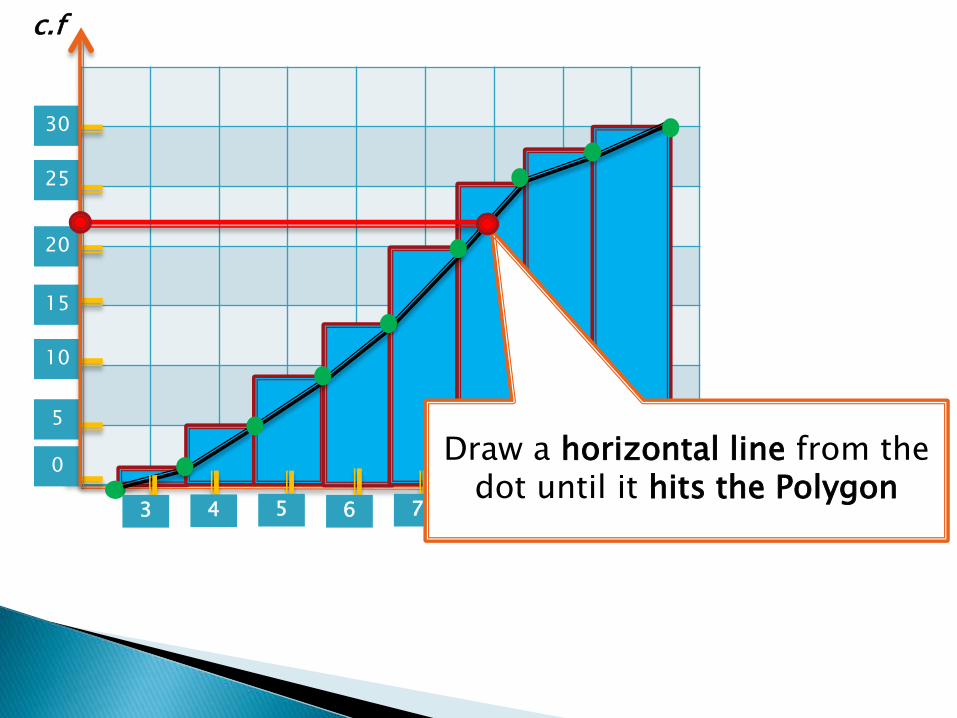
Draw a horizontal line from the dot until it hits the Polygon
3 4 5 6 7 8 9 10
0
5
10
15
20
25
30
c.f
x
Draw a horizontal line from the dot until it hits the Polygon
3 4 5 6 7 8 9 10
0
5
10
15
20
25
30
c.f
x
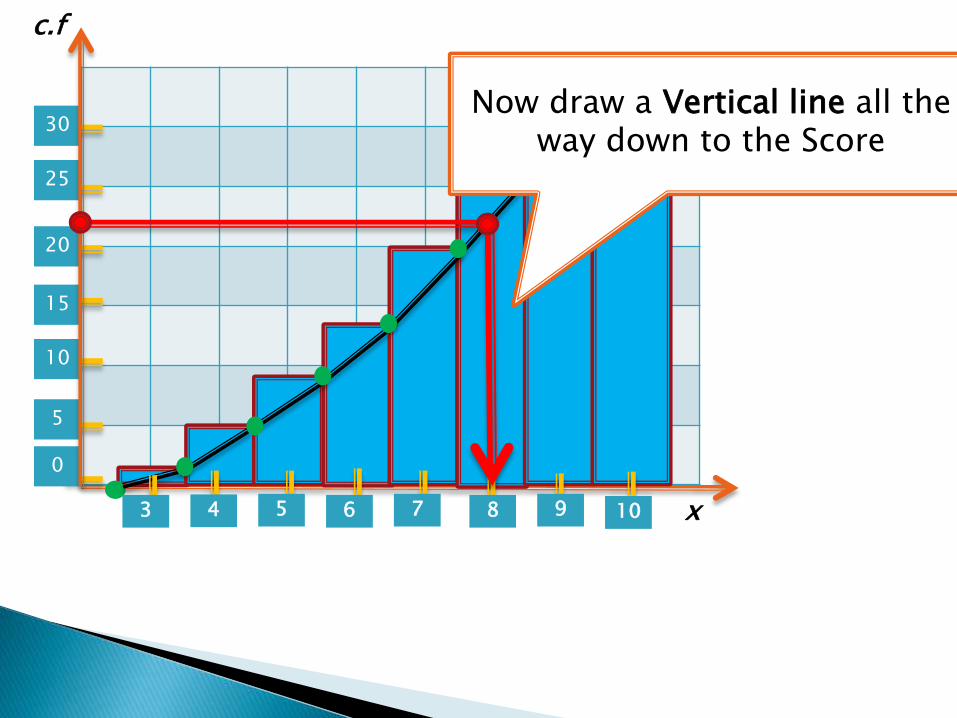
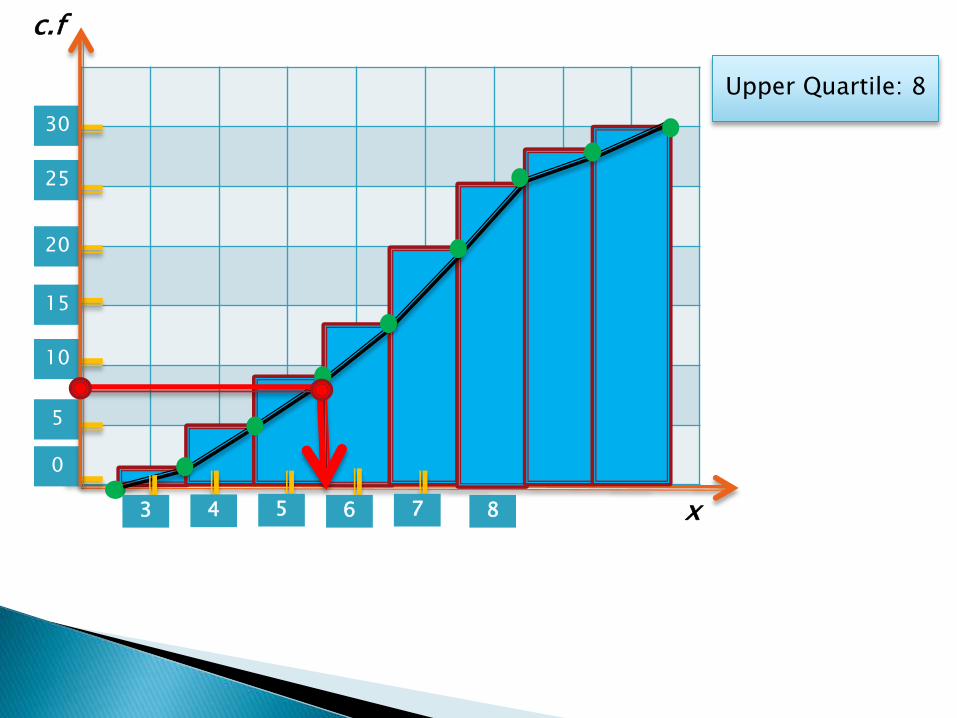
Now draw a Vertical line all the way down to the Score
3 4 5 6 7 8 9 10
0
5
10
15
20
25
30
c.f
x

3 4 5 6 7 8 9 10
0
5
10
15
20
25
30
c.f
x

3 4 5 6 7 8 9 10
0
5
10
15
20
25
30
c.f
x
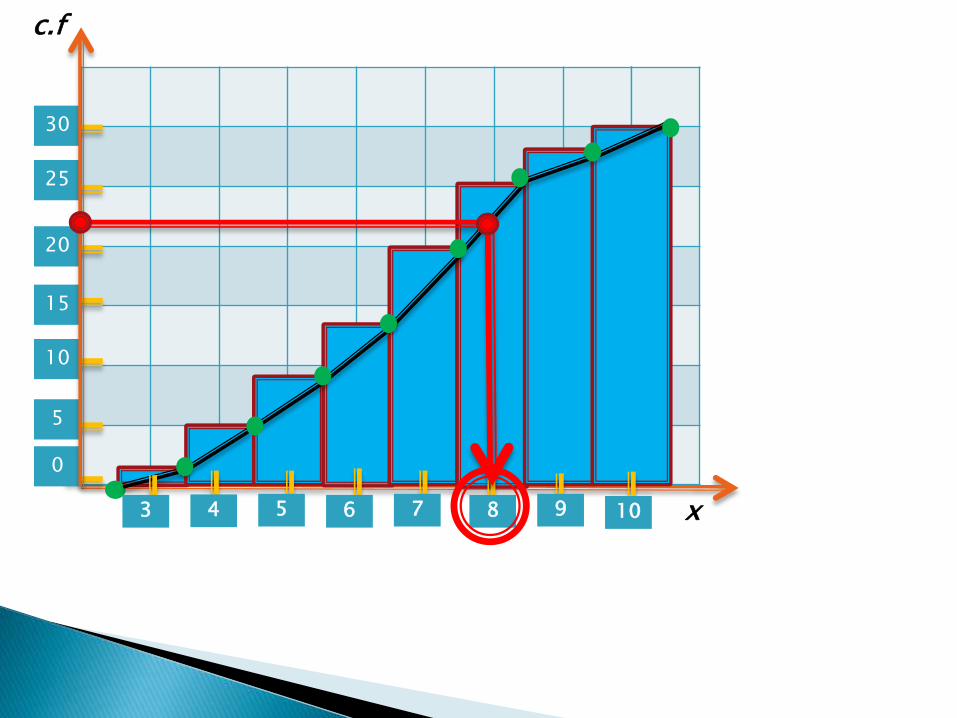
Upper Quartile: 8

3 4 5 6 7 8 9 10
0
5
10
15
20
25
30
c.f
x
Upper Quartile: 8
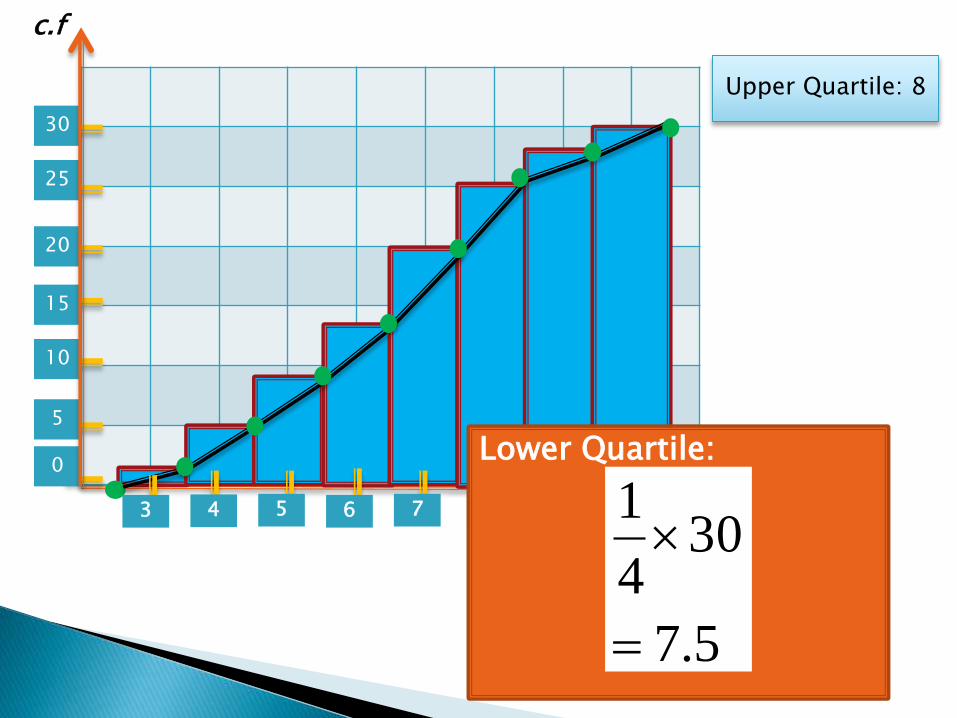
2. Now find the Lower Quartile

3 4 5 6 7
0
5
10
15
20
25
30
8
Lower Quartile:
c.f
x
4
1
Upper Quartile: 8

3 4 5 6 7
0
5
10
15
20
25
30
8
Lower Quartile:
c.f
x
4
1
Upper Quartile: 8
For Lower Quartile, always
Multiply by 4
1

3 4 5 6 7
0
5
10
15
20
25
30
8
Lower Quartile:
c.f
x
4
1
Upper Quartile: 8

3 4 5 6 7
0
5
10
15
20
25
30
8
Lower Quartile:
c.f
x
4
1
Upper Quartile: 8
Remember the highest column was 30

3 4 5 6 7
0
5
10
15
20
25
30
8
Lower Quartile:
c.f
x
304
1
Upper Quartile: 8
3 4 5 6 7
0
5
10
15
20
25
30
8
Lower Quartile:
c.f
x
5.7
304
1
Upper Quartile: 8

3 4 5 6 7
0
5
10
15
20
25
30
8
Lower Quartile:
c.f
x
5.7
304
1
Upper Quartile: 8
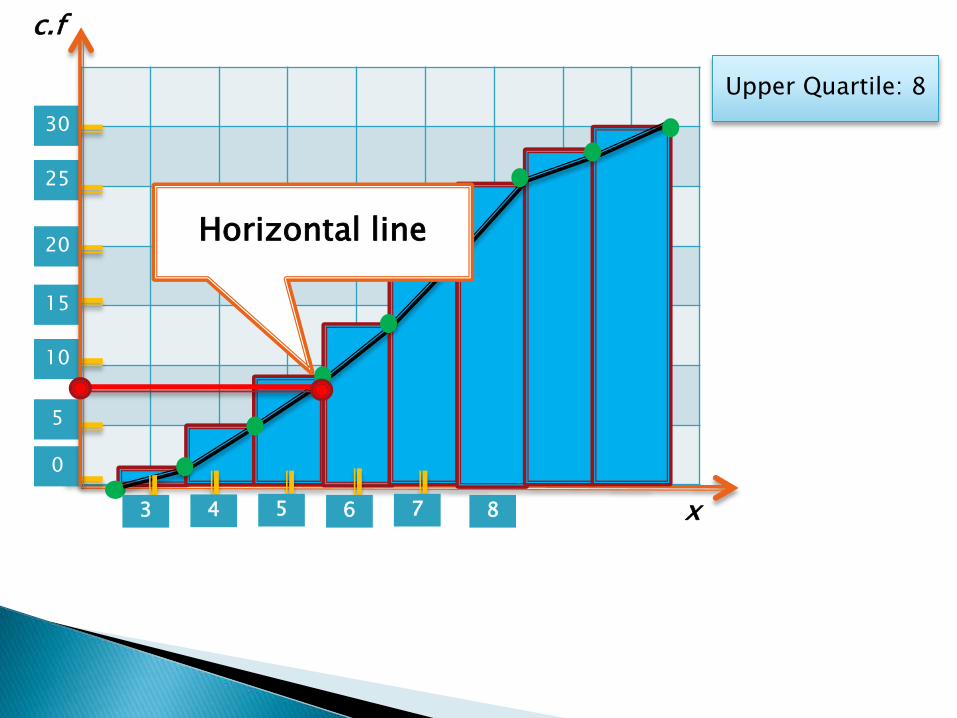
Locate 7.5 on the c.f axis

3 4 5 6 7
0
5
10
15
20
25
30
8
Lower Quartile:
c.f
x
5.7
304
1
Upper Quartile: 8
Locate 7.5 on the c.f axis

3 4 5 6 7
0
5
10
15
20
25
30
8
c.f
x
Upper Quartile: 8
Horizontal line
3 4 5 6 7
0
5
10
15
20
25
30
8
c.f
x
Upper Quartile: 8
Horizontal line
3 4 5 6 7
0
5
10
15
20
25
30
8
c.f
x
Upper Quartile: 8
3 4 5 6 7
0
5
10
15
20
25
30
8
c.f
x
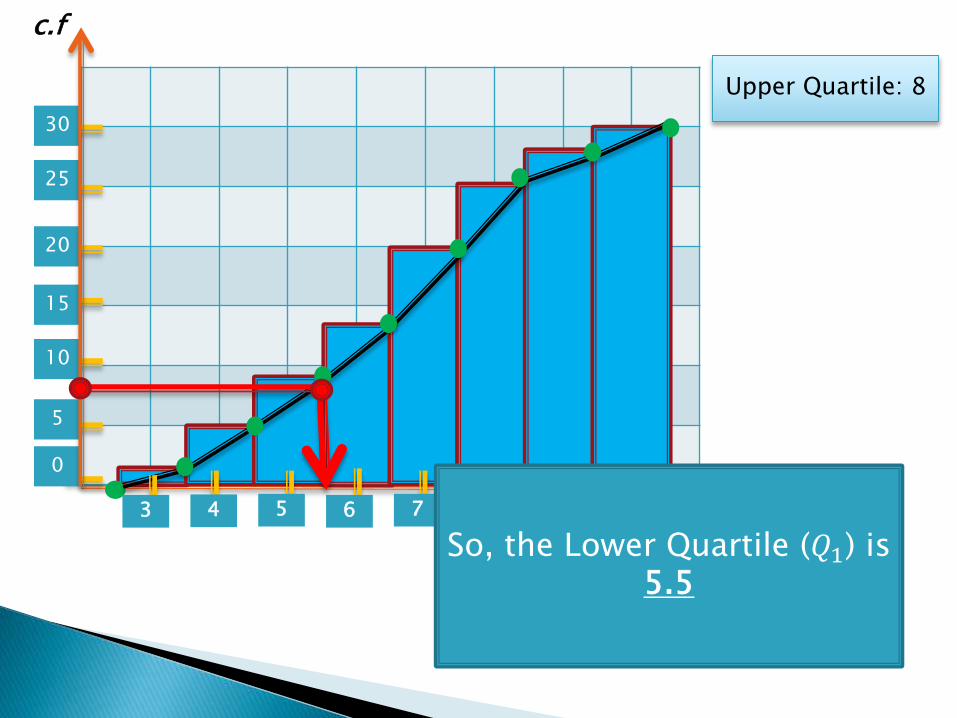
Upper Quartile: 8
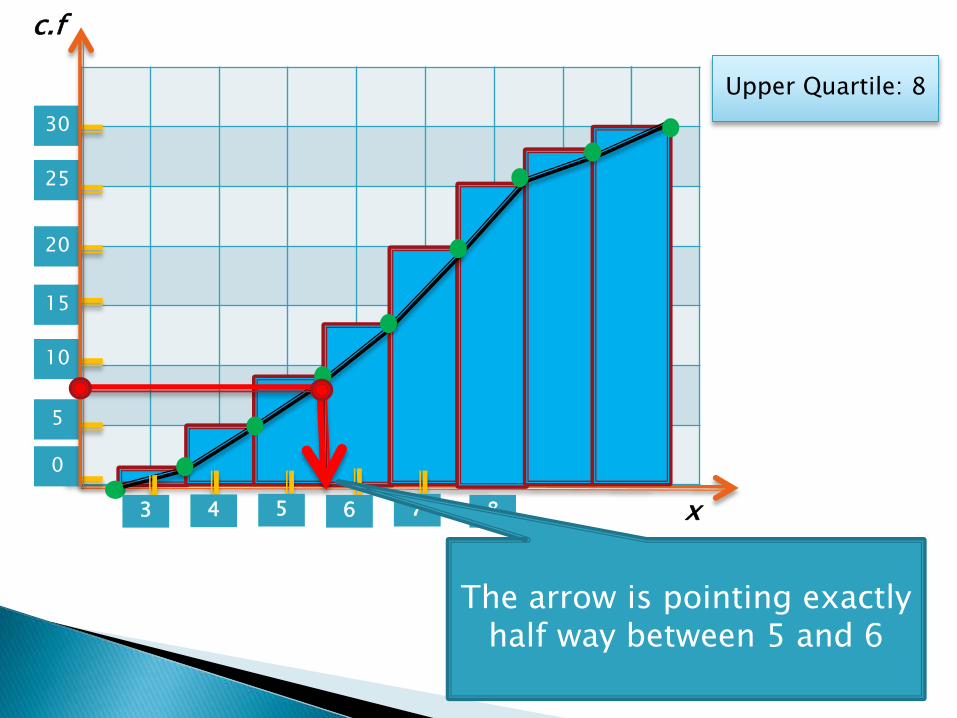
The arrow is pointing exactly half way between 5 and 6
3 4 5 6 7
0
5
10
15
20
25
30
8
c.f
x
Upper Quartile: 8
So, the Lower Quartile (𝑄1) is 5.5
3 4 5 6 7 8 9 10
0
5
10
15
20
25
30
x
c.f
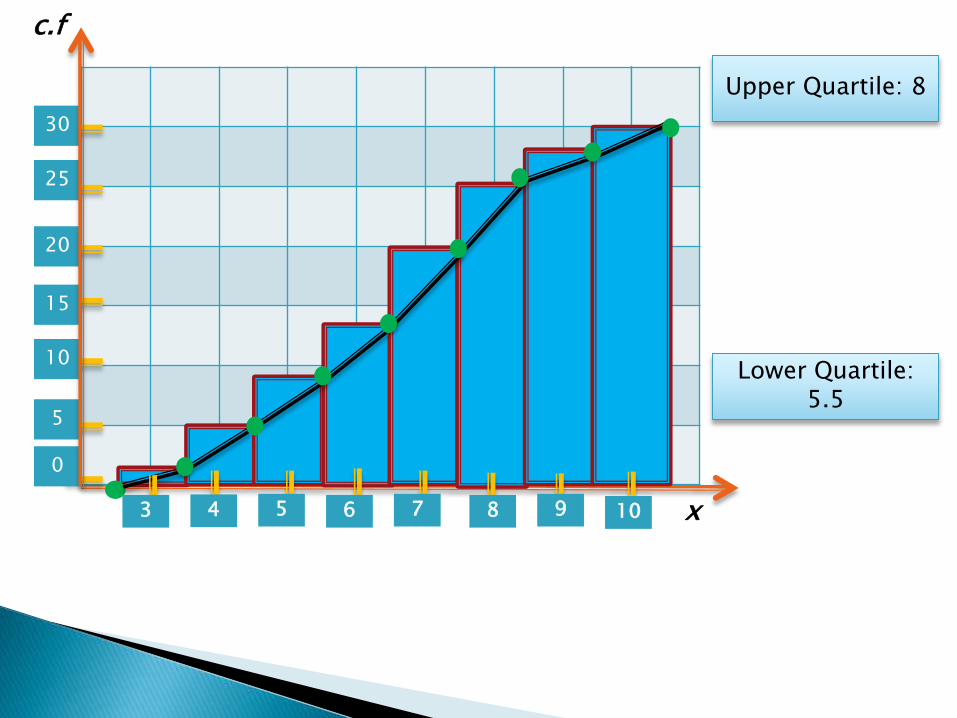
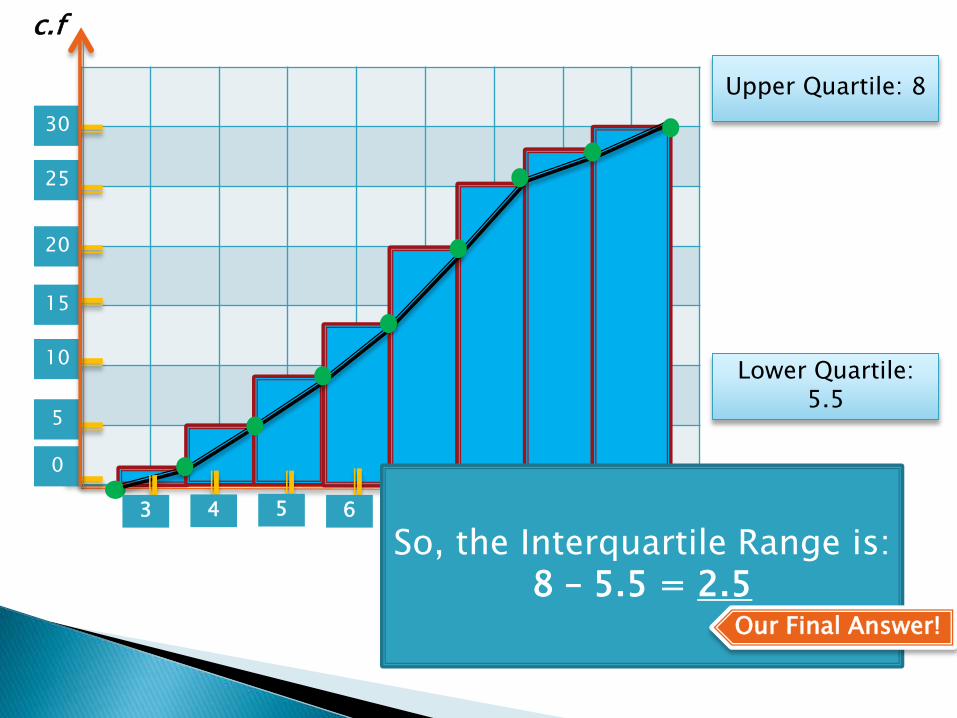
Upper Quartile: 8
Lower Quartile: 5.5
3 4 5 6 7 8 9 10
0
5
10
15
20
25
30
x
c.f
Upper Quartile: 8
Lower Quartile: 5.5
So, the Interquartile Range is:

x3 4 5 6 7 8 9 10
0
5
10
15
20
25
30
c.f
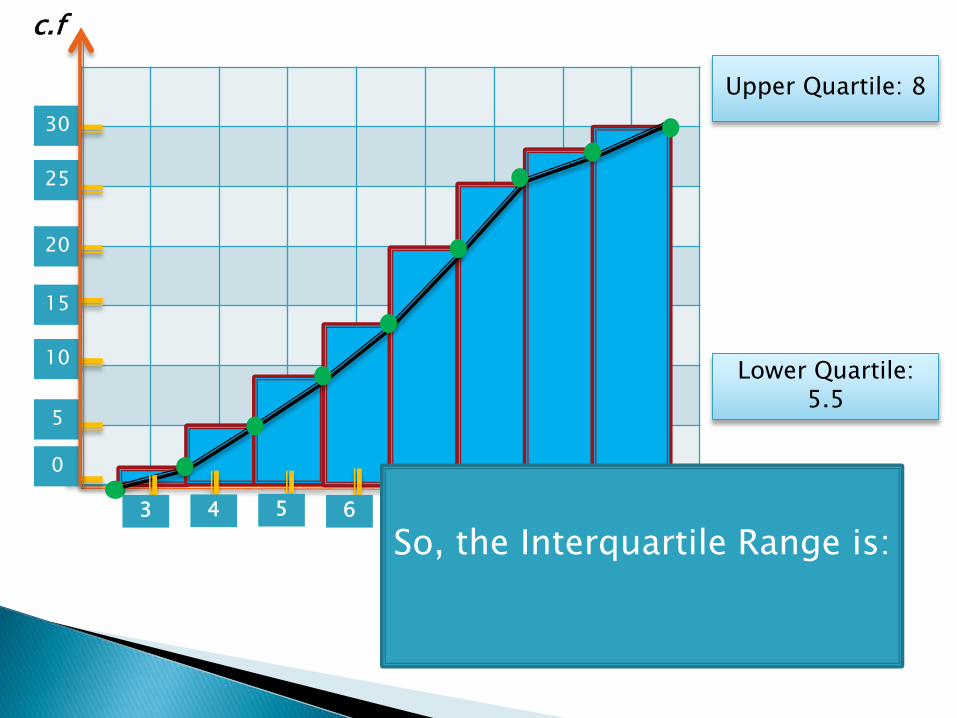
Upper Quartile: 8
Lower Quartile: 5.5
So, the Interquartile Range is:

3 4 5 6 7 8 9 10
0
5
10
15
20
25
30
x
c.f
Upper Quartile: 8
Lower Quartile: 5.5
So, the Interquartile Range is:8 -

3 4 5 6 7 8 9 10
0
5
10
15
20
25
30
x
c.f
Upper Quartile: 8
Lower Quartile: 5.5
So, the Interquartile Range is:8 -
3 4 5 6 7 8 9 10
0
5
10
15
20
25
30
x
c.f
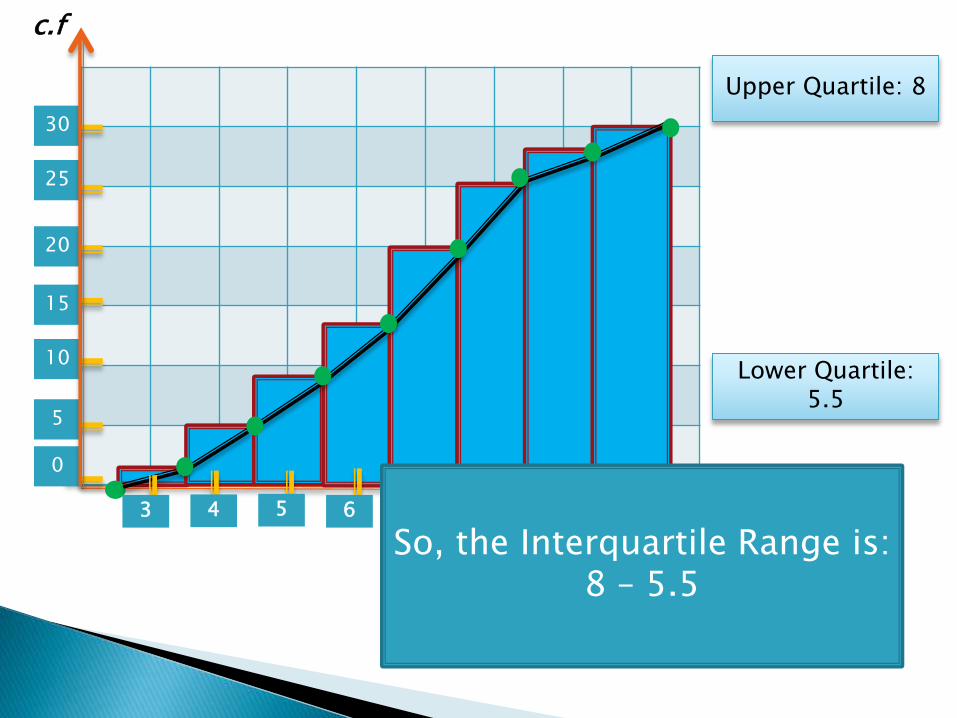
Upper Quartile: 8
Lower Quartile: 5.5
So, the Interquartile Range is:8 – 5.5
3 4 5 6 7 8 9 10
0
5
10
15
20
25
30
x
c.f
Upper Quartile: 8
Lower Quartile: 5.5
So, the Interquartile Range is:8 – 5.5 = 2.5
Our Final Answer!

3 4 5 6 7 8 9 10
0
5
10
15
20
25
30
x
c.f

3 4 5 6 7 8 9 10
0
5
10
15
20
25
30
x
c.f
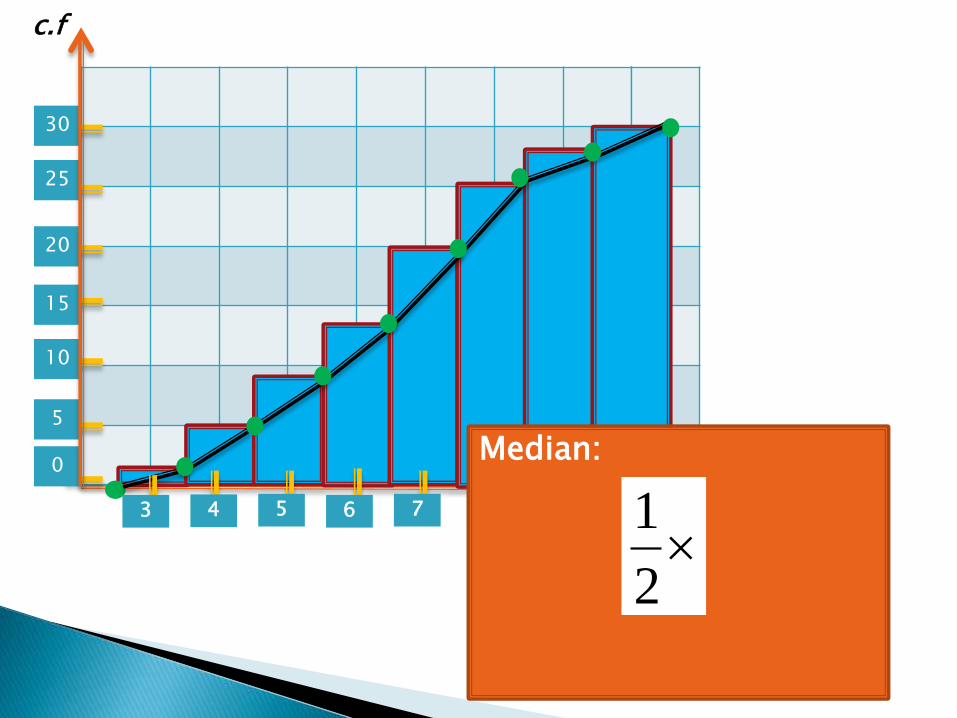
The Median (Q2 ) can be found from the graph as well
3 4 5 6 7 8 9 10
0
5
10
15
20
25
30
x
c.f
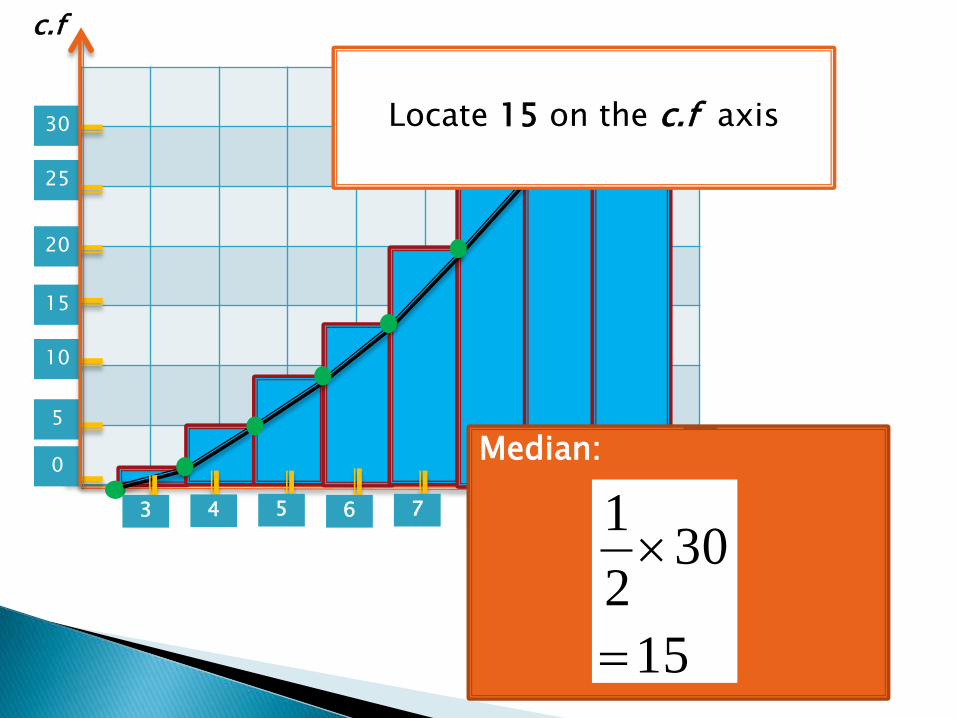
Median:
2
1
3 4 5 6 7 8 9 10
0
5
10
15
20
25
30
x
c.f
Median:
2
1
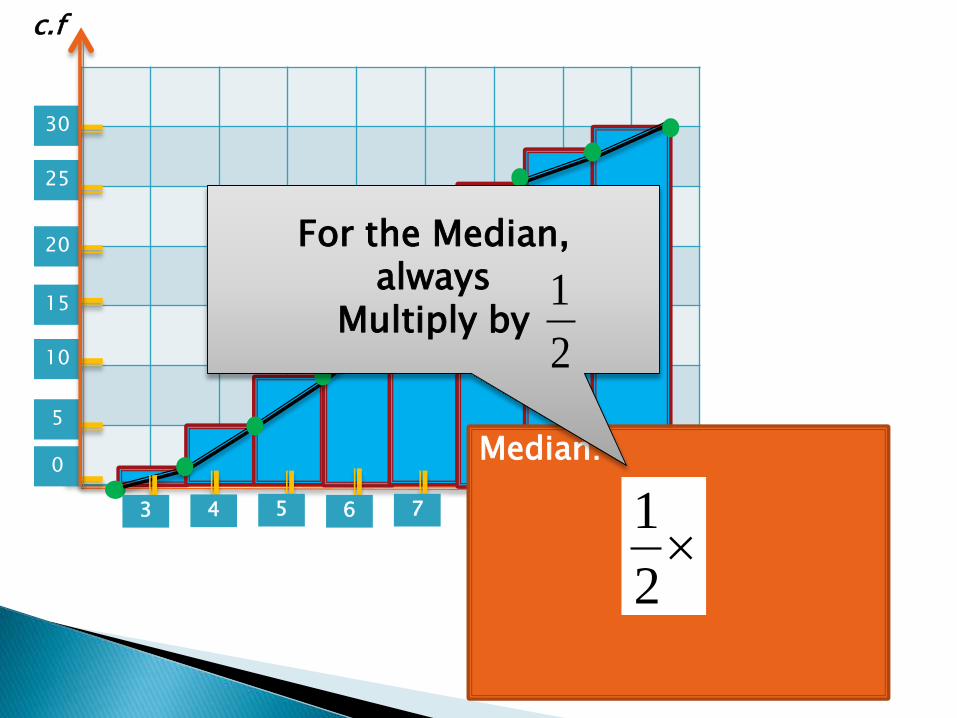
For the Median,always
Multiply by 2
1
3 4 5 6 7 8 9 10
0
5
10
15
20
25
30
x
c.f
Median:
2
1

3 4 5 6 7 8 9 10
0
5
10
15
20
25
30
x
c.f
Median:
302
1

3 4 5 6 7 8 9 10
0
5
10
15
20
25
30
x
c.f
Median:
15
302
1
3 4 5 6 7 8 9 10
0
5
10
15
20
25
30
x
c.f
Median:
15
302
1
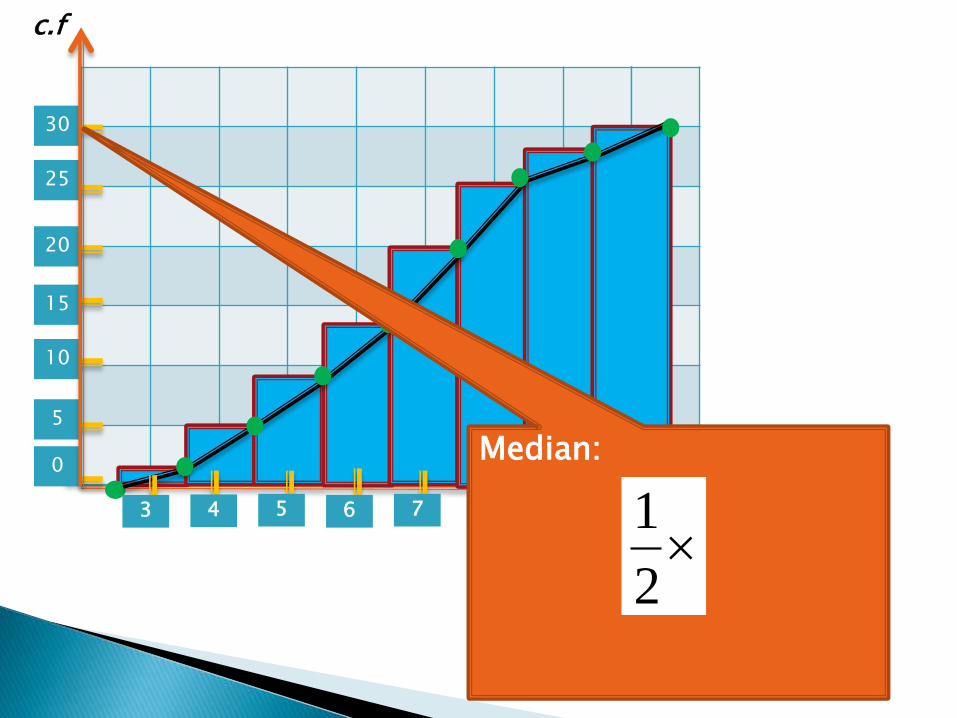
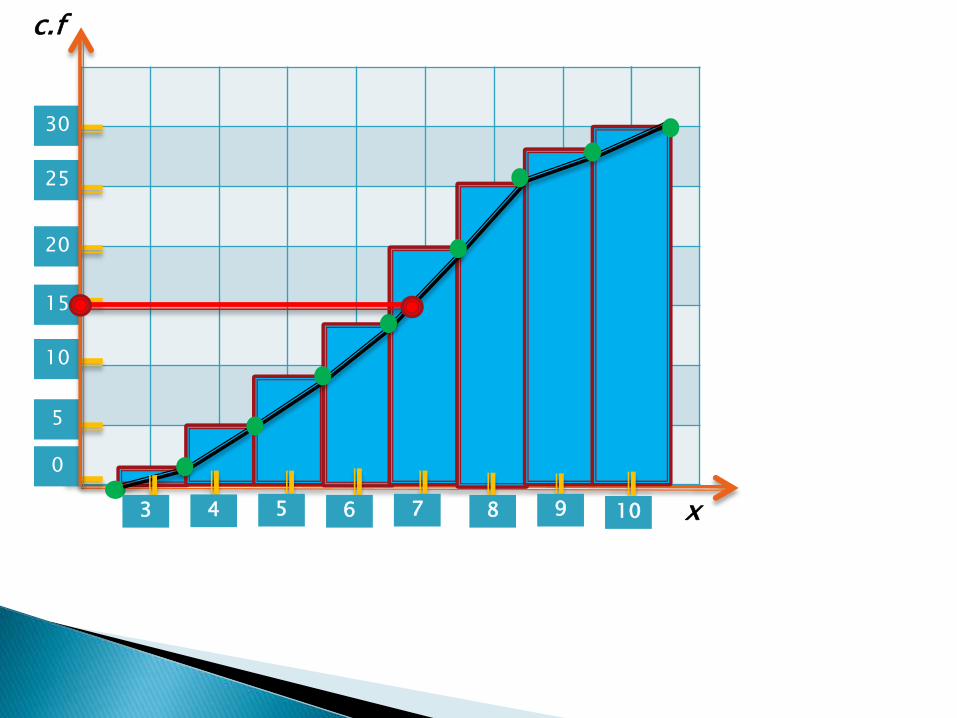
Locate 15 on the c.f axis

3 4 5 6 7 8 9 10
0
5
10
15
20
25
30
x
c.f
Median:
15
302
1
Locate 15 on the c.f axis
3 4 5 6 7 8 9 10
0
5
10
15
20
25
30
x
c.f

3 4 5 6 7 8 9 10
0
5
10
15
20
25
30
x
c.f

3 4 5 6 7 8 9 10
0
5
10
15
20
25
30
x
c.f
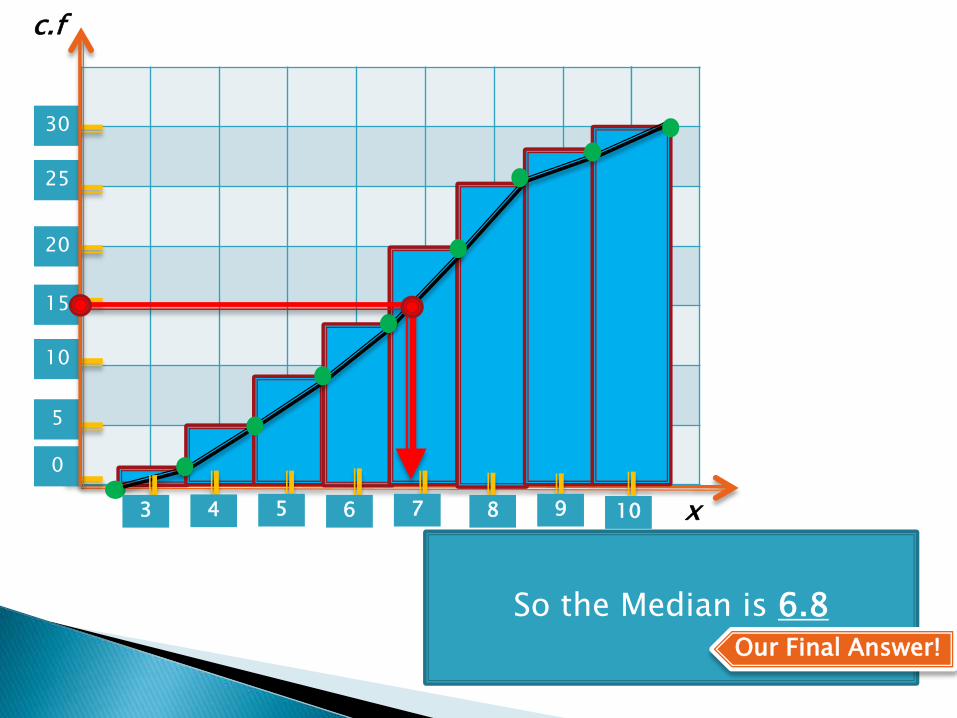
Look where the arrow is pointing

3 4 5 6 7 8 9 10
0
5
10
15
20
25
30
x
c.f
The Median is just below 7, by estimation it is 6.8
3 4 5 6 7 8 9 10
0
5
10
15
20
25
30
x
c.f
So the Median is 6.8
Our Final Answer!


