30
FINE AEROSOL COMPOSITION IN NORTH AMERICA Annual mean PM 2.5 concentrations (NARSTO, 2004) Current air quality standard is 15 mg m -3
| Date post: | 18-Dec-2015 |
| Category: |
Documents |
| Upload: | bertram-davis |
| View: | 214 times |
| Download: | 0 times |
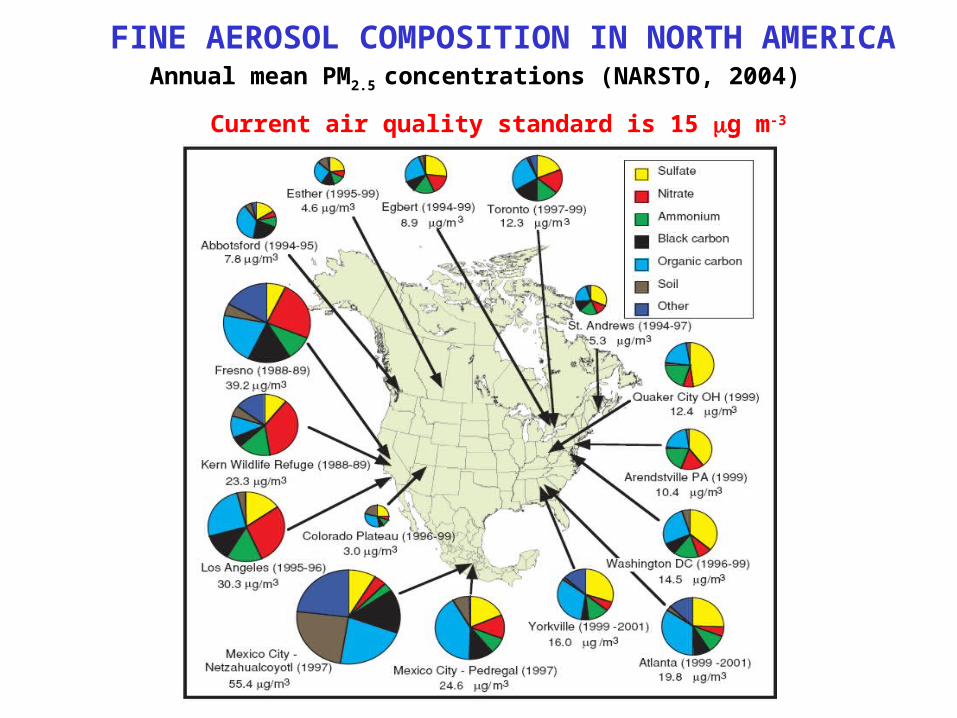
FINE AEROSOL COMPOSITION IN NORTH AMERICAAnnual mean PM2.5 concentrations (NARSTO, 2004)
Current air quality standard is 15 mg m-3
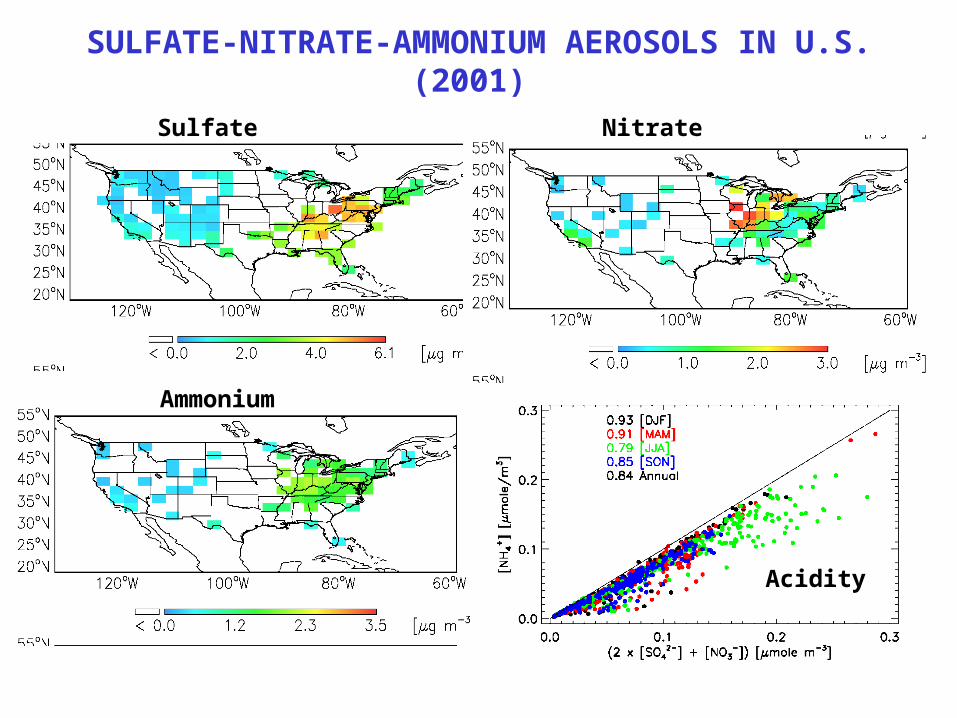
SULFATE-NITRATE-AMMONIUM AEROSOLS IN U.S. (2001)
Highest concentrations in industrial Midwest(coal-fired power plants)
Sulfate Nitrate
Ammonium
Acidity
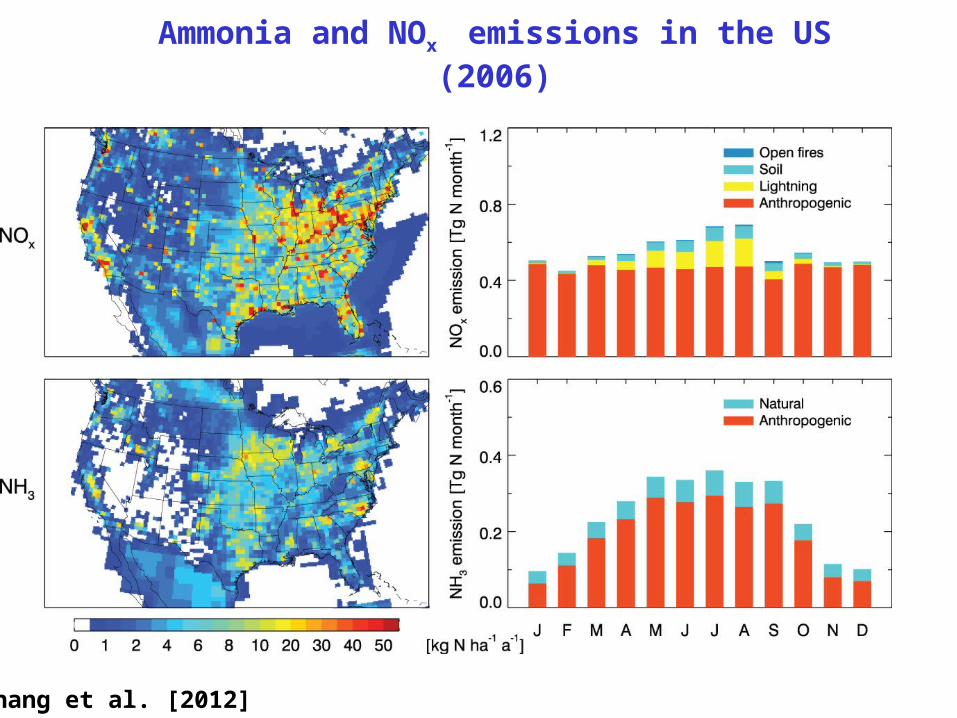
Ammonia and NOx emissions in the US (2006)
Zhang et al. [2012]
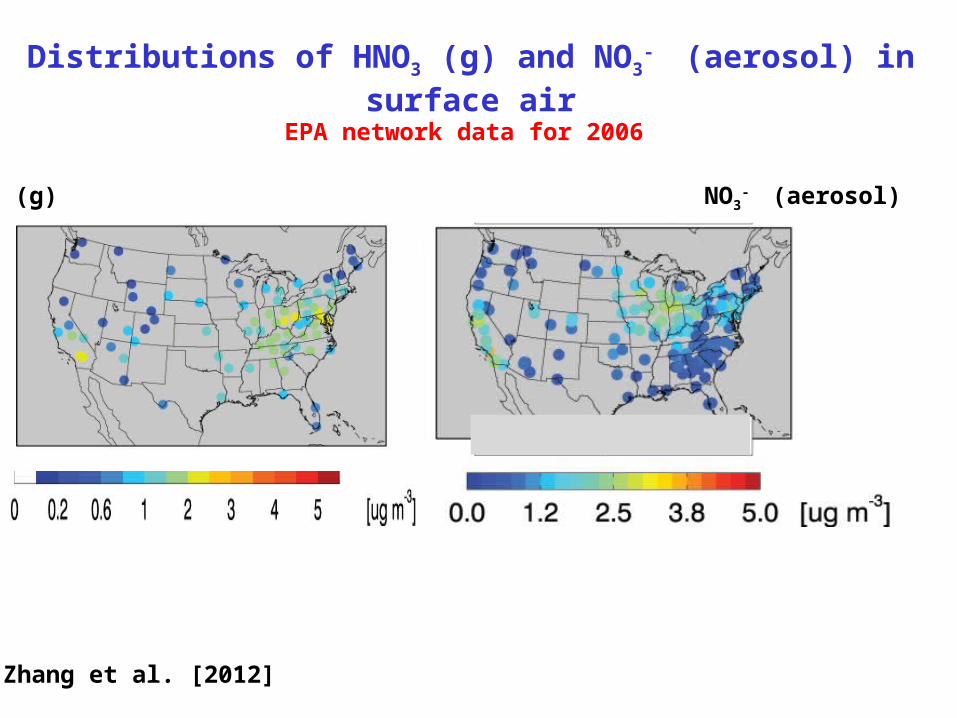
Distributions of HNO3 (g) and NO3- (aerosol) in surface air
HNO3 (g) NO3- (aerosol)
EPA network data for 2006
Zhang et al. [2012]
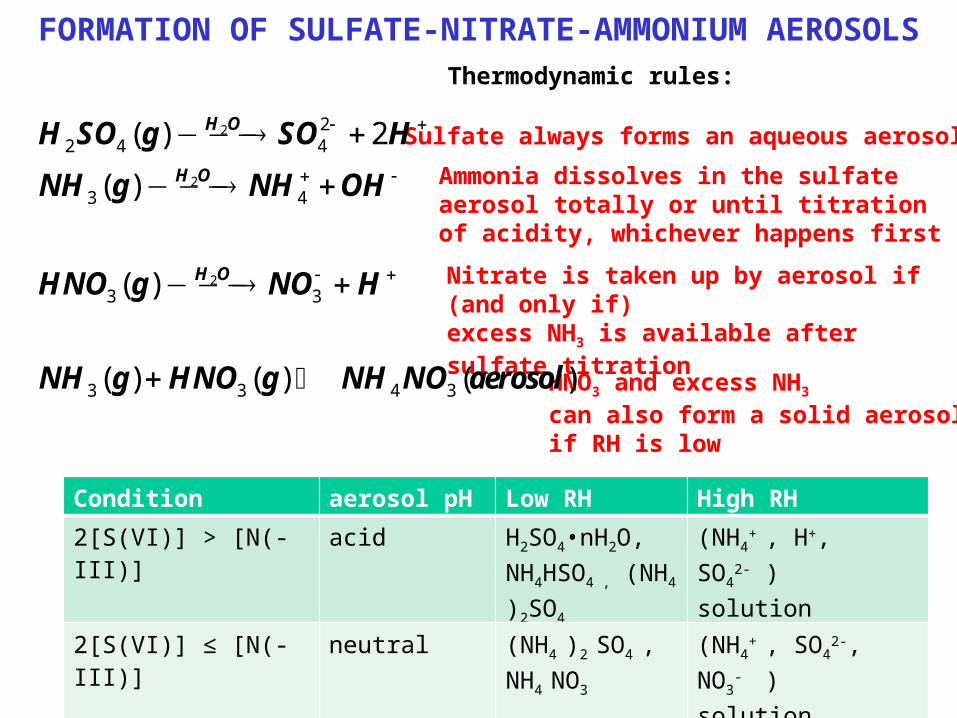
FORMATION OF SULFATE-NITRATE-AMMONIUM AEROSOLS
2
2
2
22 4 4
3 4
3 3
3 3 4 3
( ) 2
( )
( )
( ) ( ) ( )
H O
H O
H O
H SO g SO H
NH g NH OH
HNO g NO H
NH g HNO g NH NO aerosol
Sulfate always forms an aqueous aerosol
Ammonia dissolves in the sulfate aerosol totally or until titration of acidity, whichever happens first
Nitrate is taken up by aerosol if (and only if)excess NH3 is available after sulfate titration
HNO3 and excess NH3 can also form a solid aerosol if RH is low
Thermodynamic rules:
Highest concentrations in industrial Midwest(coal-fired power plants)
Condition aerosol pH Low RH High RH
2[S(VI)] > [N(-III)] acid H2SO4•nH2O, NH4HSO4 , (NH4 )2SO4
(NH4+ , H+, SO4
2- ) solution
2[S(VI)] ≤ [N(-III)] neutral (NH4 )2 SO4 , NH4 NO3
(NH4+ , SO4
2-, NO3- )
solution
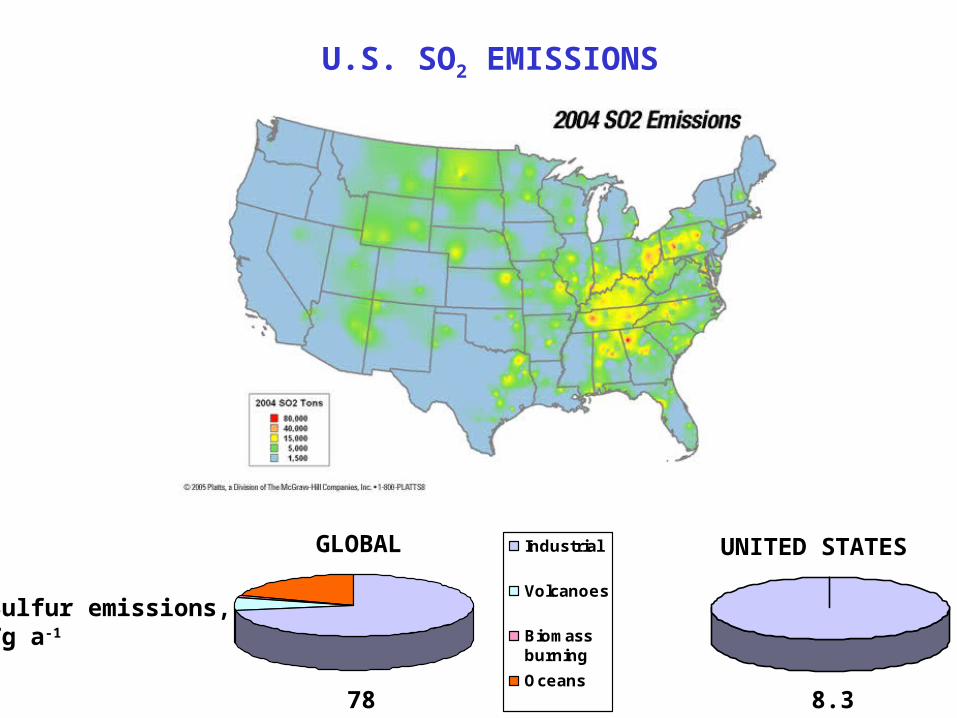
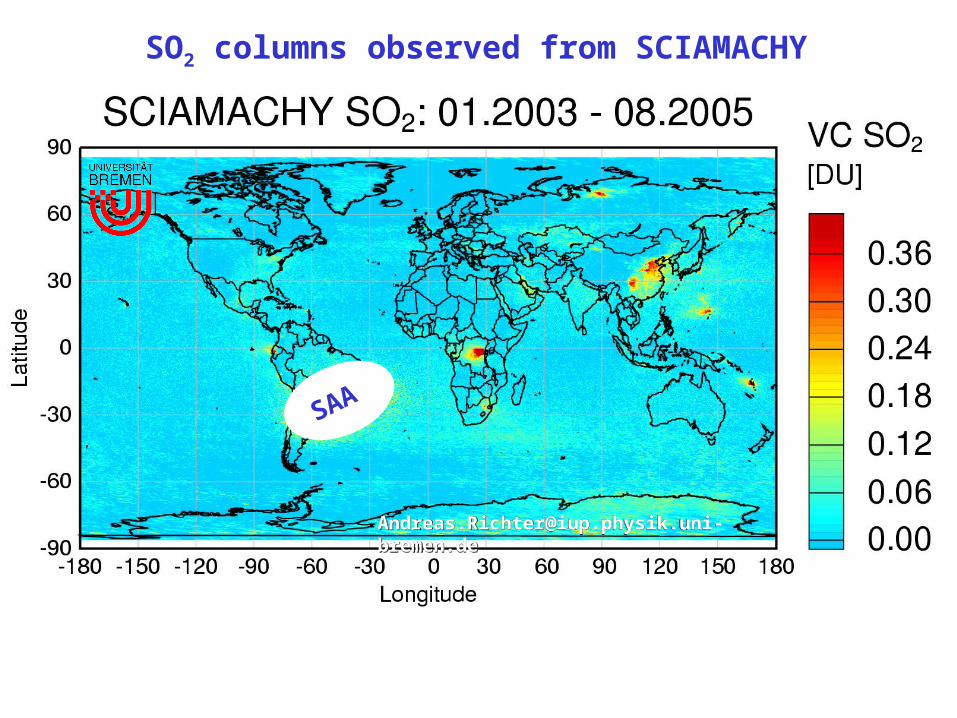
U.S. SO2 EMISSIONS
Industrial
Volcanoes
Biomassburning
Oceans
Sulfur emissions,Tg a-1
78 8.3
GLOBAL UNITED STATES
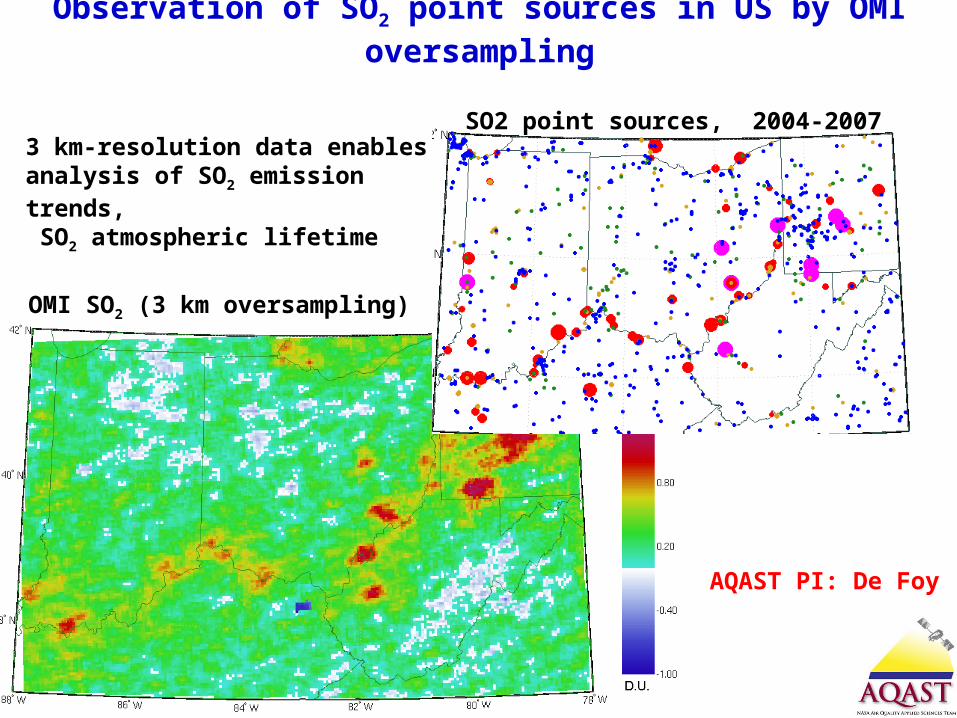
Observation of SO2 point sources in US by OMI oversampling
SO2 point sources, 2004-2007
OMI SO2 (3 km oversampling)
3 km-resolution data enables analysis of SO2 emission trends, SO2 atmospheric lifetime
AQAST PI: De Foy
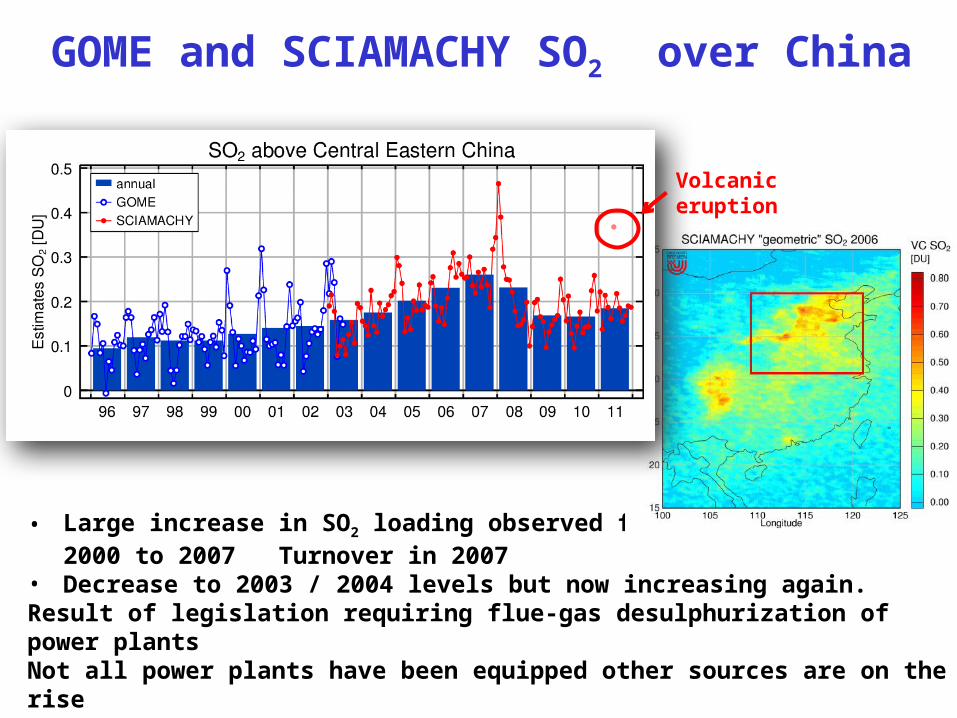
GOME and SCIAMACHY SO2 over China
• Large increase in SO2 loading observed from 2000 to 2007 Turnover in 2007
• Decrease to 2003 / 2004 levels but now increasing again.Result of legislation requiring flue-gas desulphurization of power plantsNot all power plants have been equipped other sources are on the rise
Volcanic eruption
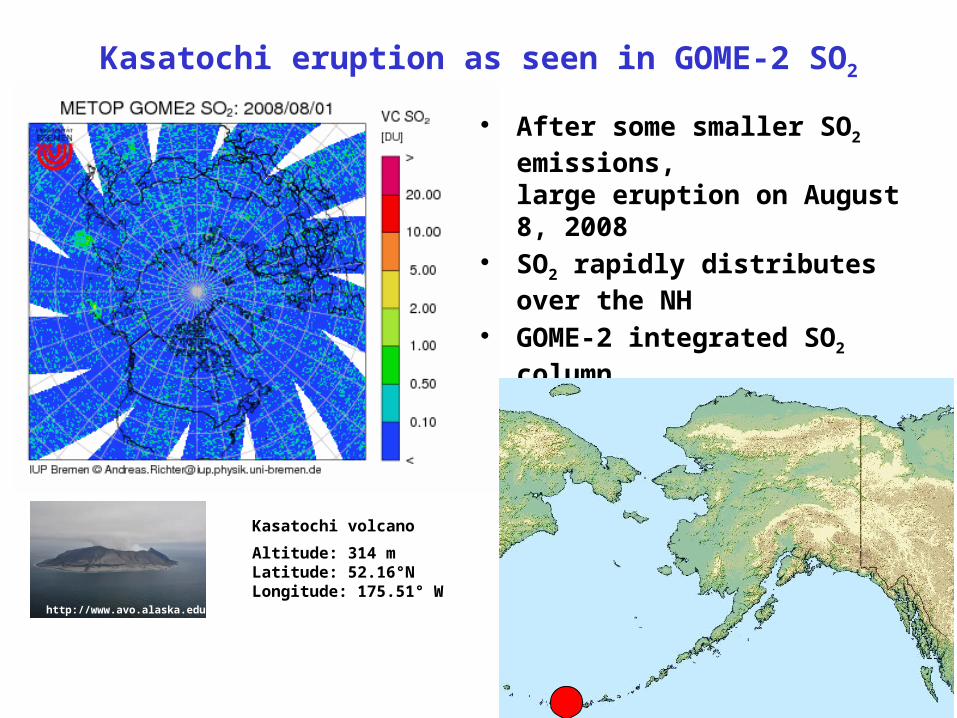
Kasatochi eruption as seen in GOME-2 SO2
• After some smaller SO2 emissions, large eruption on August 8, 2008
• SO2 rapidly distributes over the NH
• GOME-2 integrated SO2 column indicates more than 1 Tg total SO2 emission
http://www.avo.alaska.edu/
Kasatochi volcano
Altitude: 314 mLatitude: 52.16°NLongitude: 175.51° W
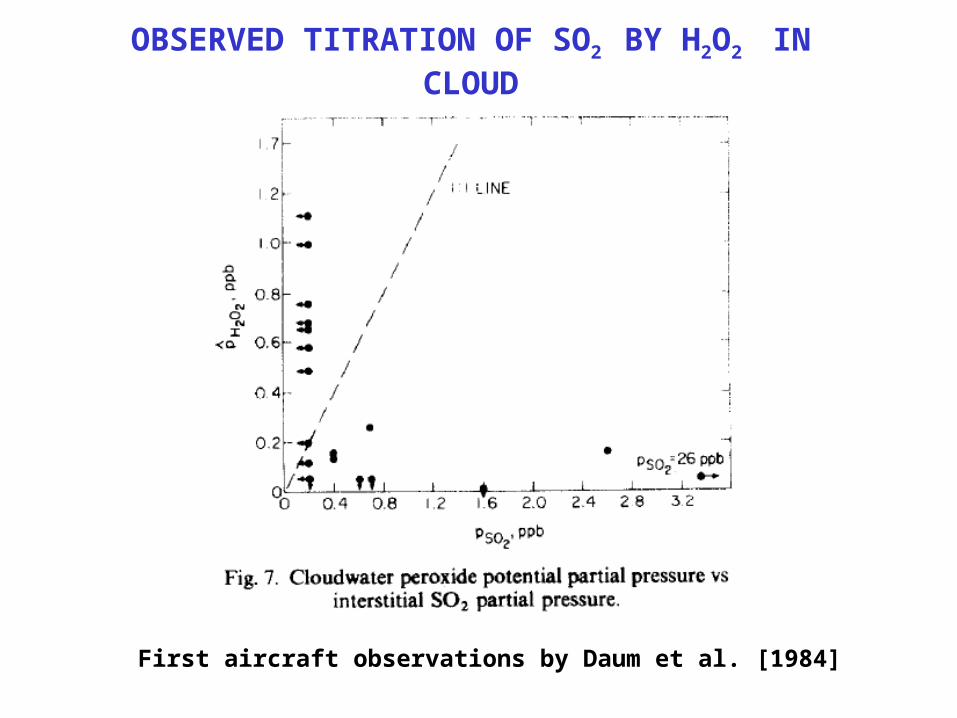
OBSERVED TITRATION OF SO2 BY H2O2 IN CLOUD
First aircraft observations by Daum et al. [1984]
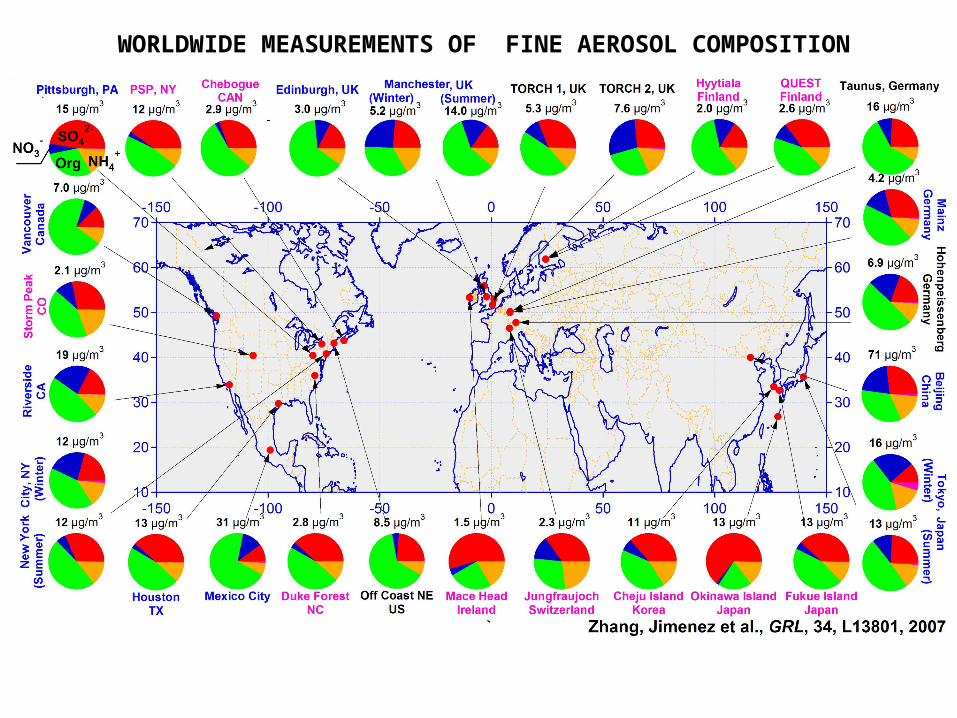
WORLDWIDE MEASUREMENTS OF FINE AEROSOL COMPOSITION
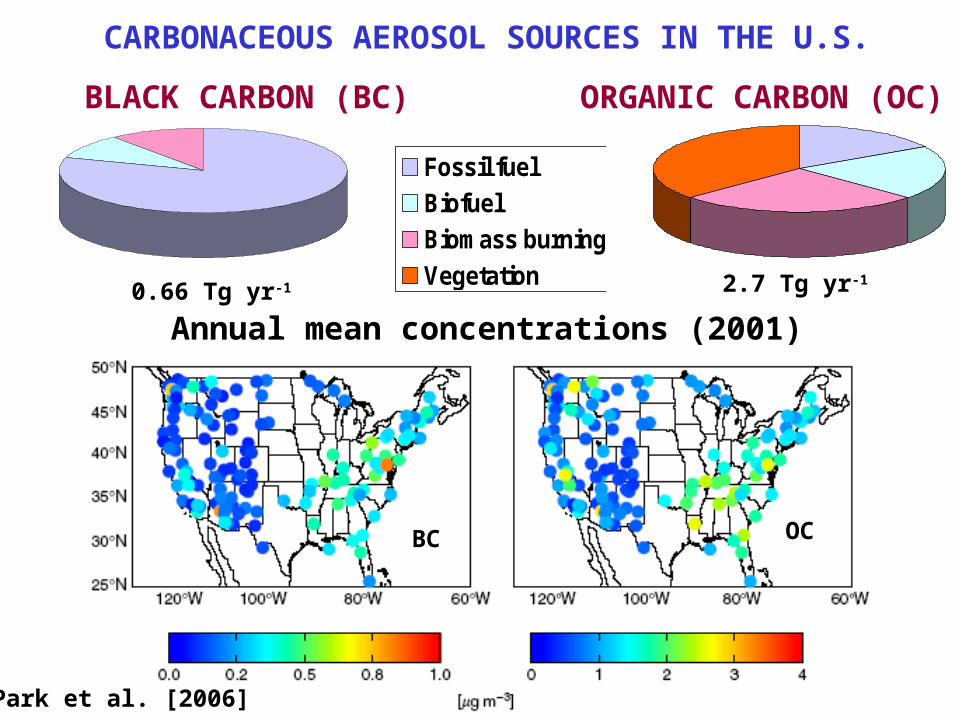
CARBONACEOUS AEROSOL SOURCES IN THE U.S.
Fossil fuel
Biofuel
Biomass burning
Vegetation
Fossil fuel
Biofuel
Biomass burning
Vegetation
ORGANIC CARBON (OC)
2.7 Tg yr-1
BLACK CARBON (BC)
0.66 Tg yr-1
Annual mean concentrations (2001)
BC OC
Park et al. [2006]
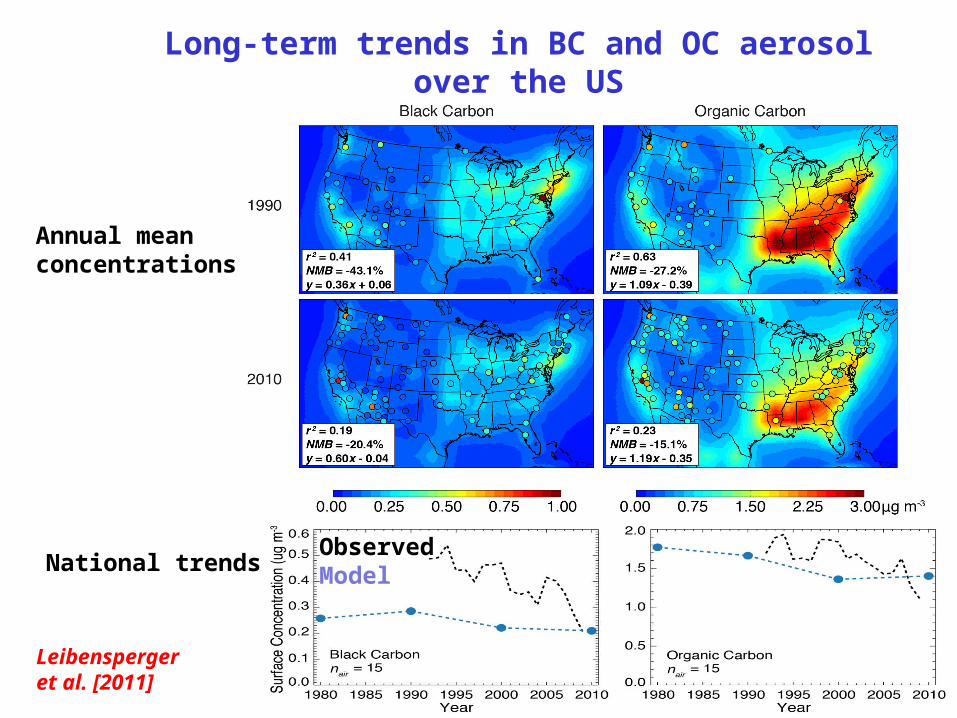
Long-term trends in BC and OC aerosol over the US
Annual meanconcentrations
National trendsObservedModel
Leibensperger et al. [2011]
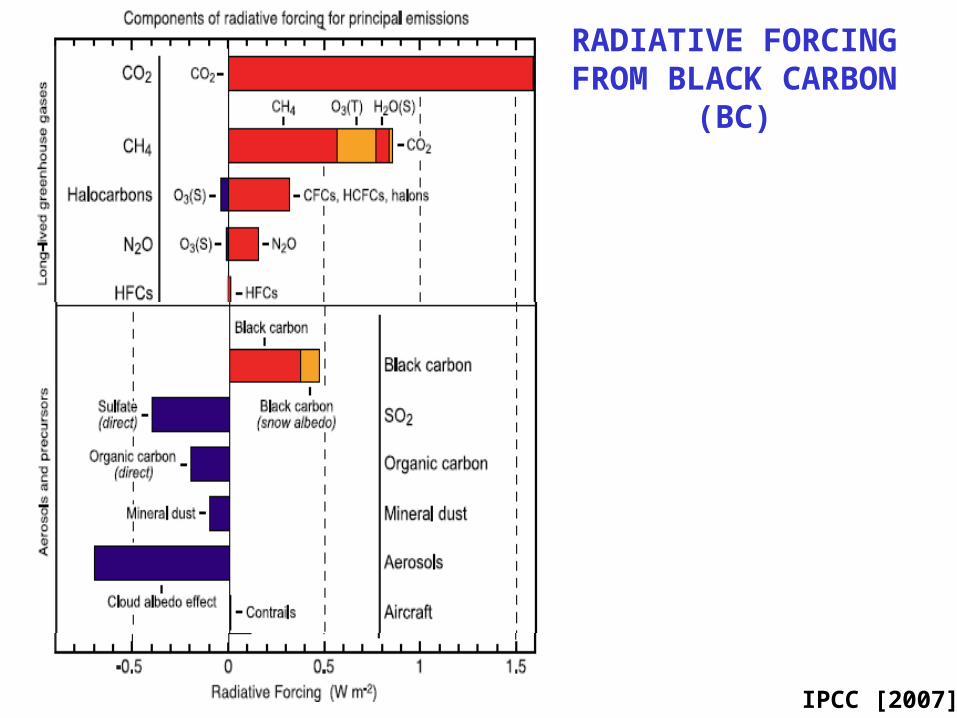
RADIATIVE FORCING FROM BLACK CARBON (BC)
IPCC [2007]
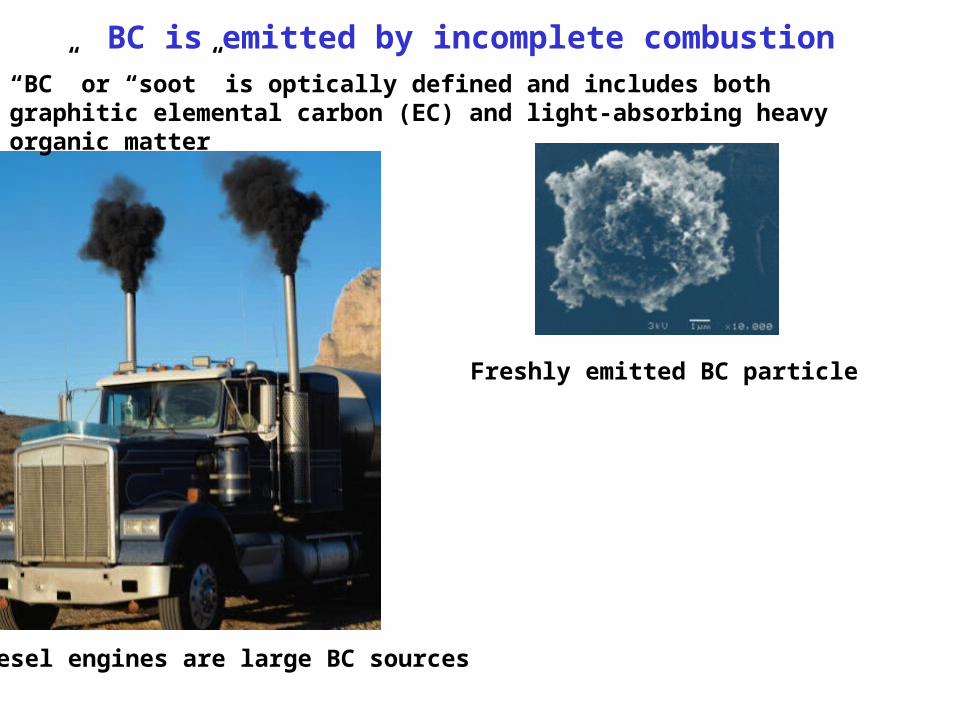
BC is emitted by incomplete combustion“BC” or “soot” is optically defined and includes both graphitic elemental carbon (EC) and light-absorbing heavy organic matter
Diesel engines are large BC sources
Freshly emitted BC particle
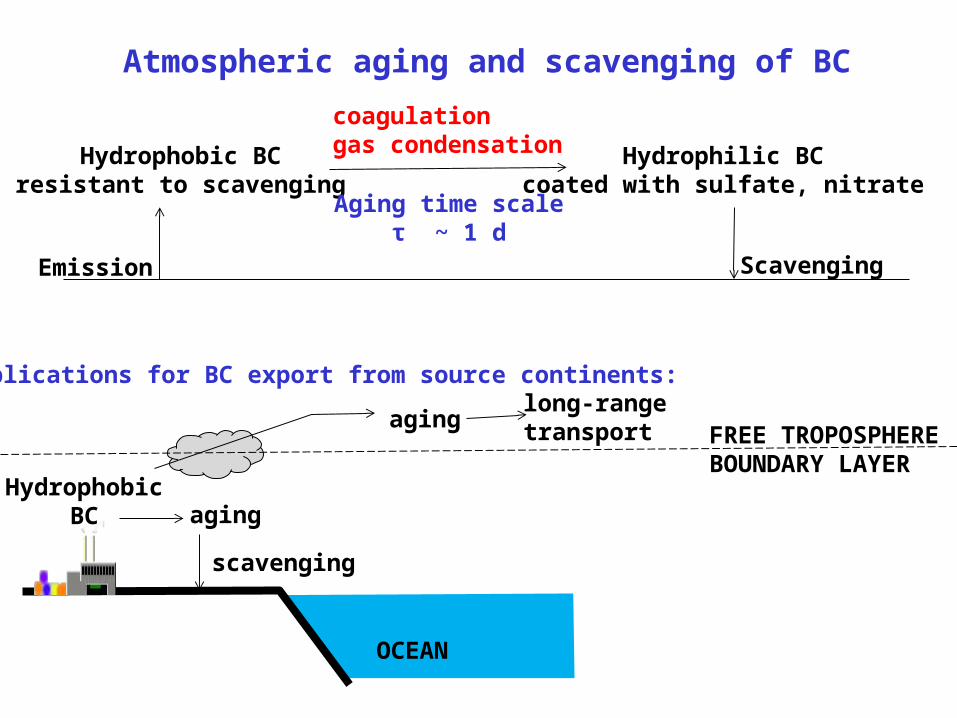
Atmospheric aging and scavenging of BC
Emission
Hydrophobic BCresistant to scavenging
coagulationgas condensation Hydrophilic BC
coated with sulfate, nitrate
Scavenging
Aging time scaleτ ~ 1 d
Implications for BC export from source continents:
OCEAN
aging
scavenging
HydrophobicBC
aginglong-range transport FREE TROPOSPHERE
BOUNDARY LAYER
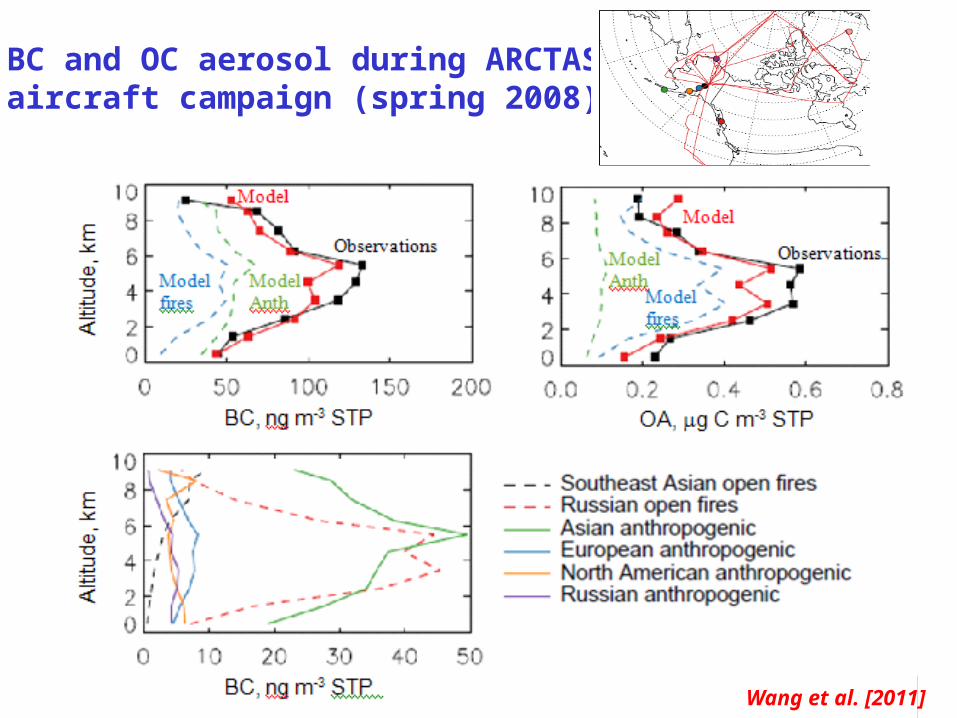
BC and OC aerosol during ARCTASaircraft campaign (spring 2008)
Wang et al. [2011]
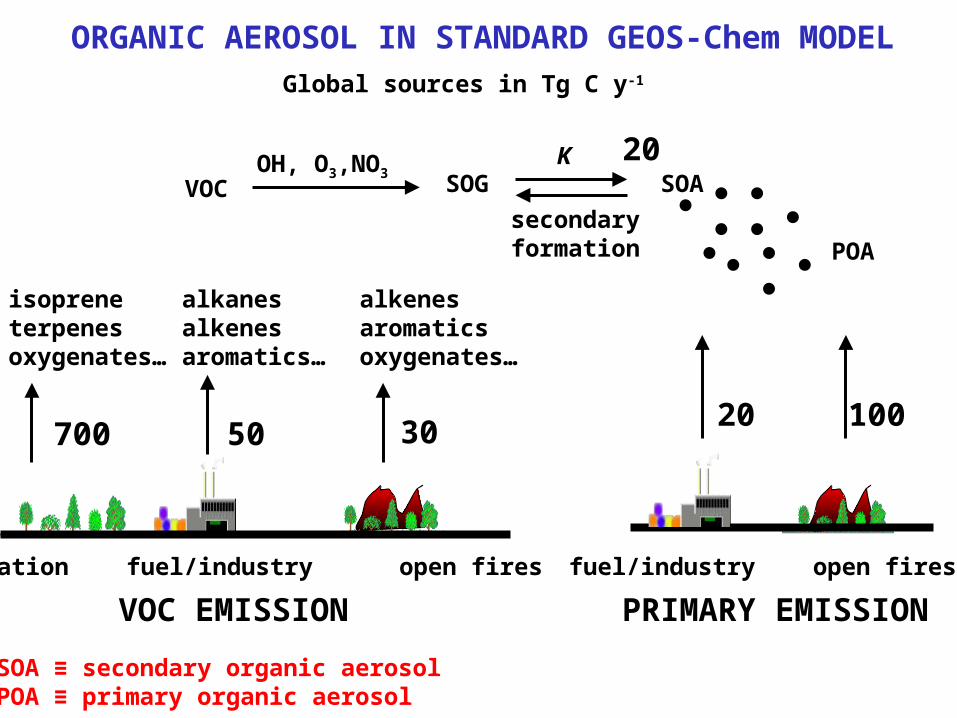
ORGANIC AEROSOL IN STANDARD GEOS-Chem MODEL
fuel/industry open fires
OH, O3,NO3SOG SOA
POA
K
vegetation fuel/industry open fires
700
isopreneterpenesoxygenates…
30
alkenesaromaticsoxygenates…
alkanesalkenesaromatics…
VOC EMISSION PRIMARY EMISSION
VOC
5020 100
20
Global sources in Tg C y-1
secondaryformation
SOA ≡ secondary organic aerosolPOA ≡ primary organic aerosol
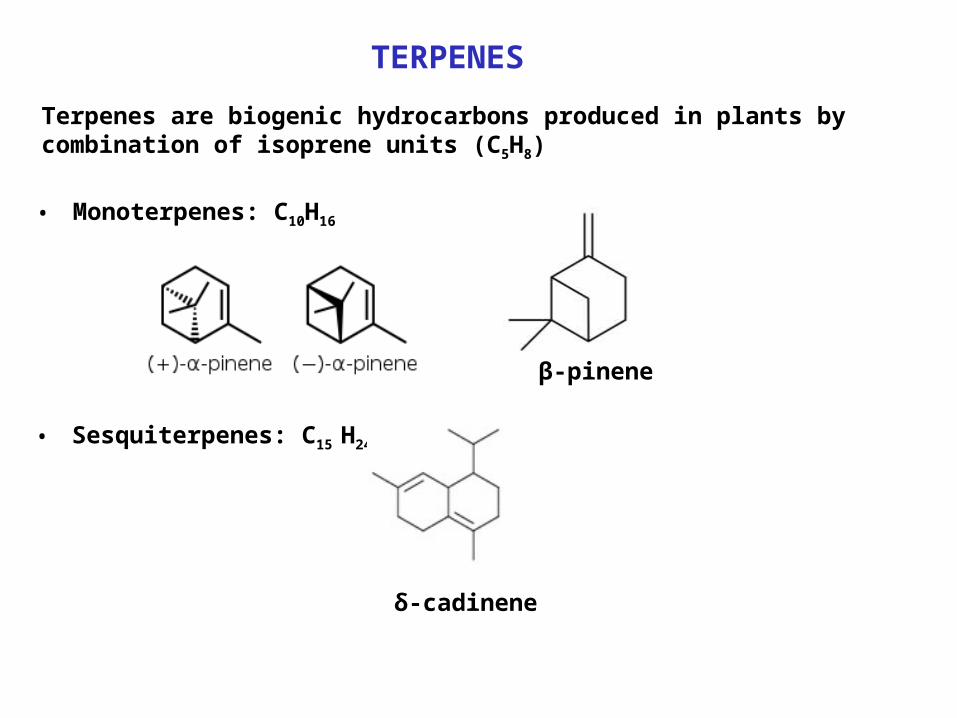
TERPENES
Terpenes are biogenic hydrocarbons produced in plants by combination of isoprene units (C5H8)
• Monoterpenes: C10H16
β-pinene
• Sesquiterpenes: C15 H24
δ-cadinene
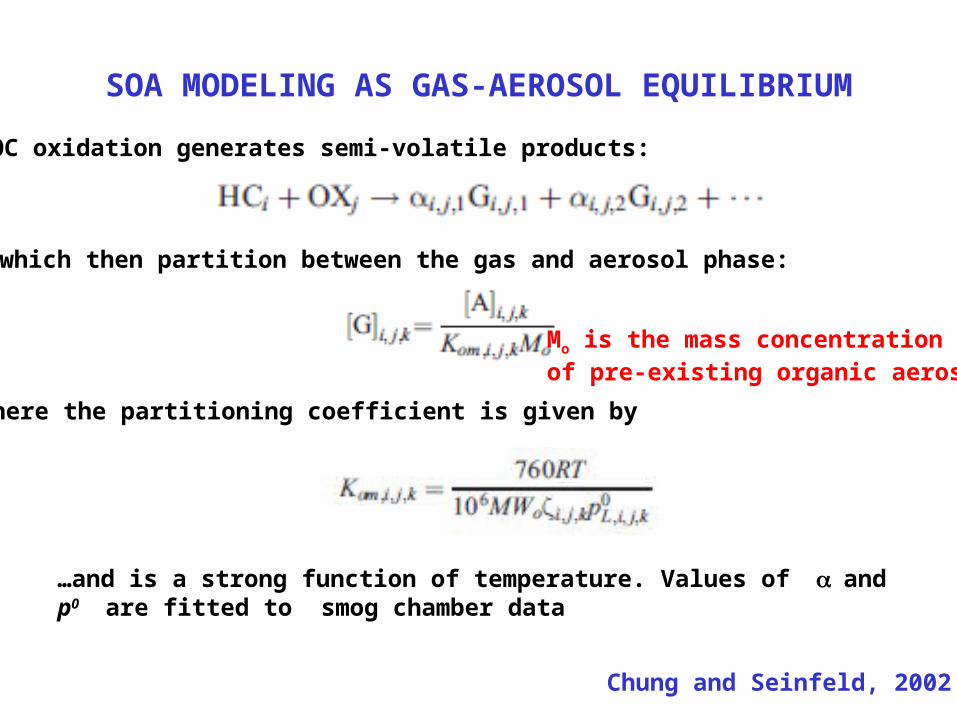
SOA MODELING AS GAS-AEROSOL EQUILIBRIUM
VOC oxidation generates semi-volatile products:
…which then partition between the gas and aerosol phase:
where the partitioning coefficient is given by
…and is a strong function of temperature. Values of a and p0 are fitted to smog chamber data
Chung and Seinfeld, 2002
Mo is the mass concentrationof pre-existing organic aerosol
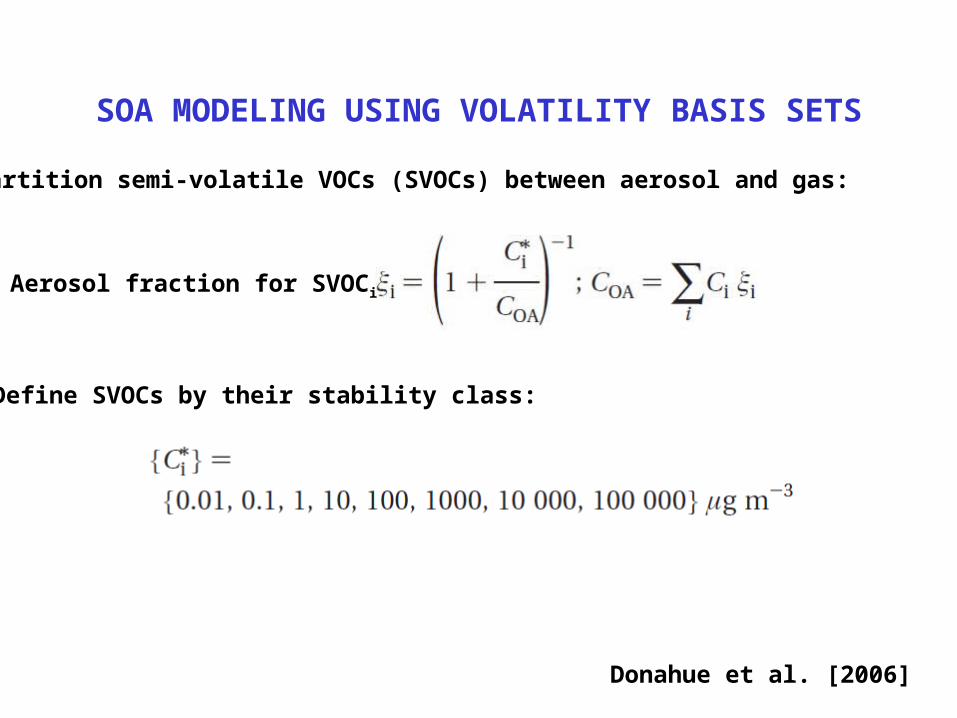
SOA MODELING USING VOLATILITY BASIS SETS
Partition semi-volatile VOCs (SVOCs) between aerosol and gas:
Aerosol fraction for SVOCi
Define SVOCs by their stability class:
Donahue et al. [2006]
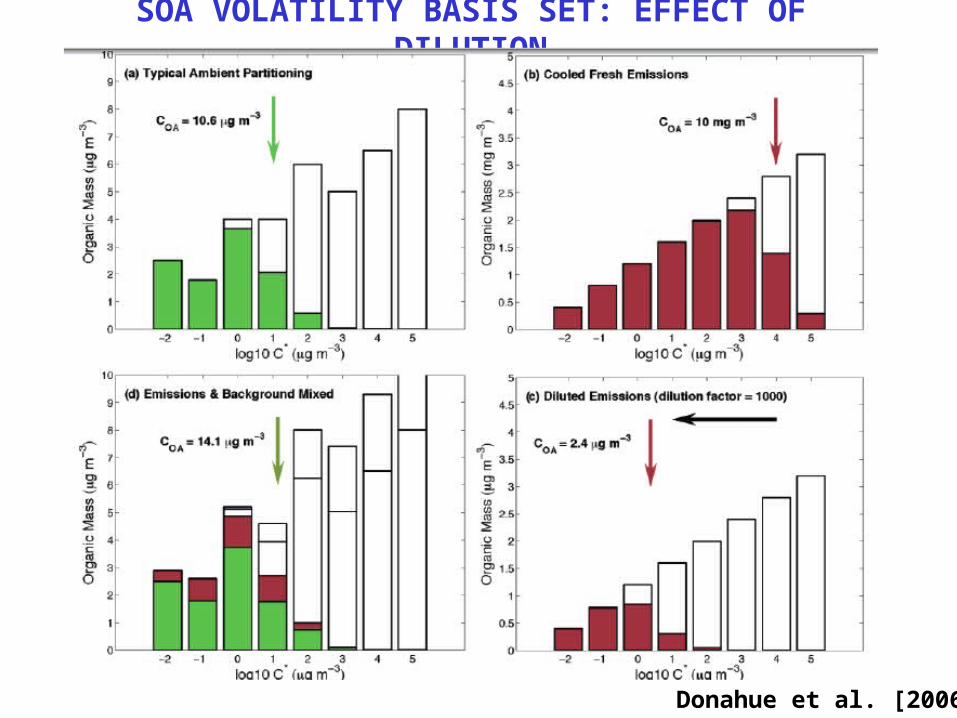
SOA VOLATILITY BASIS SET: EFFECT OF DILUTION
Donahue et al. [2006]
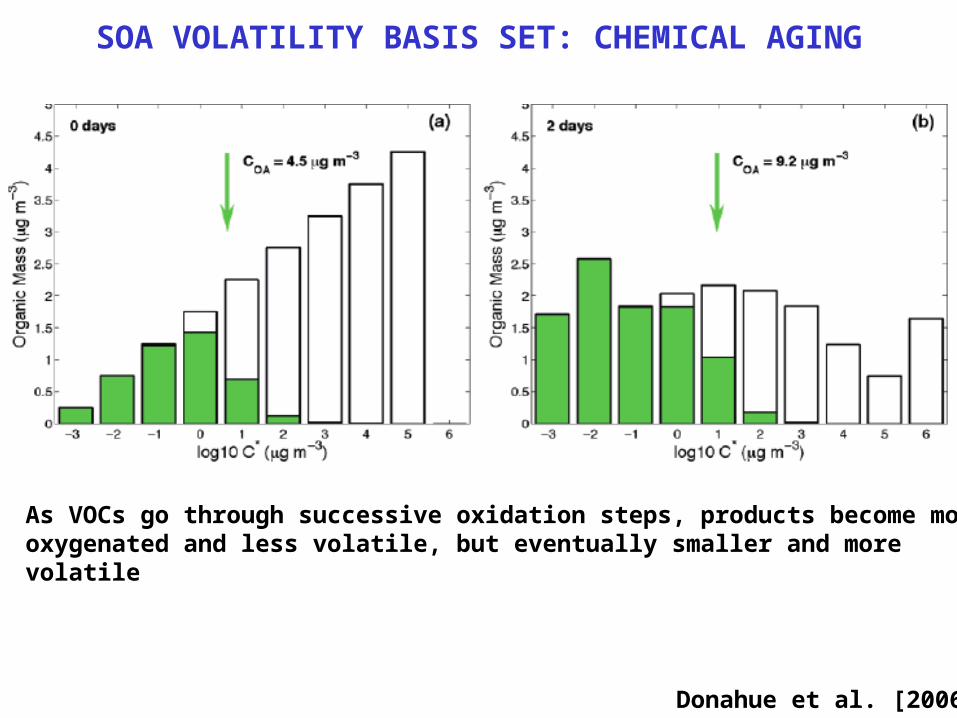
SOA VOLATILITY BASIS SET: CHEMICAL AGING
Donahue et al. [2006]
As VOCs go through successive oxidation steps, products become more oxygenated and less volatile, but eventually smaller and more volatile
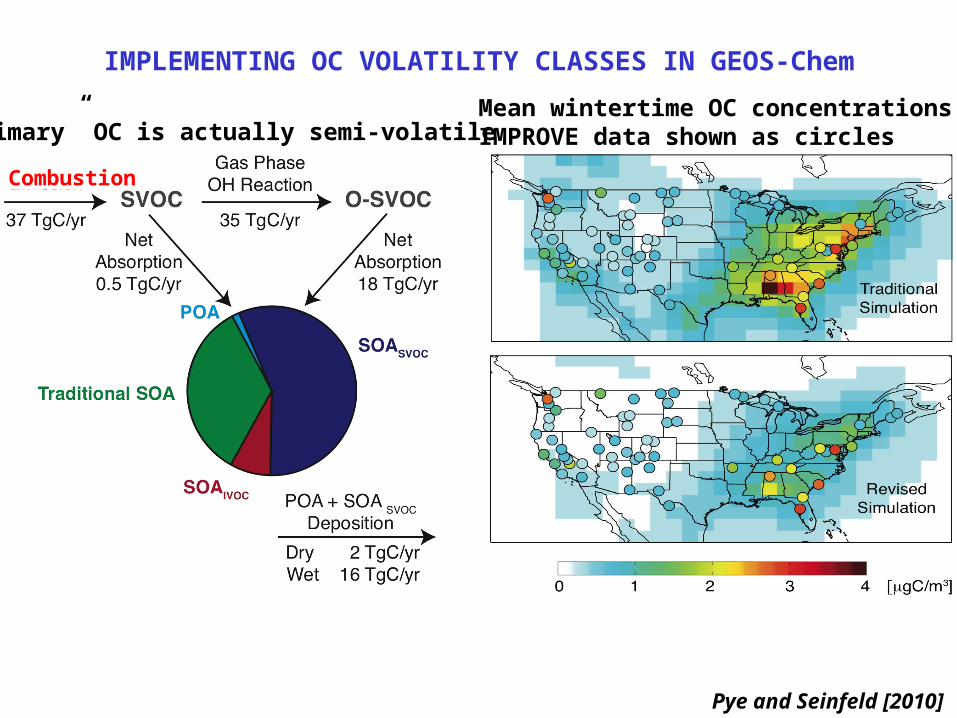
IMPLEMENTING OC VOLATILITY CLASSES IN GEOS-Chem
Pye and Seinfeld [2010]
Combustion
“Primary” OC is actually semi-volatile Mean wintertime OC concentrations:IMPROVE data shown as circles
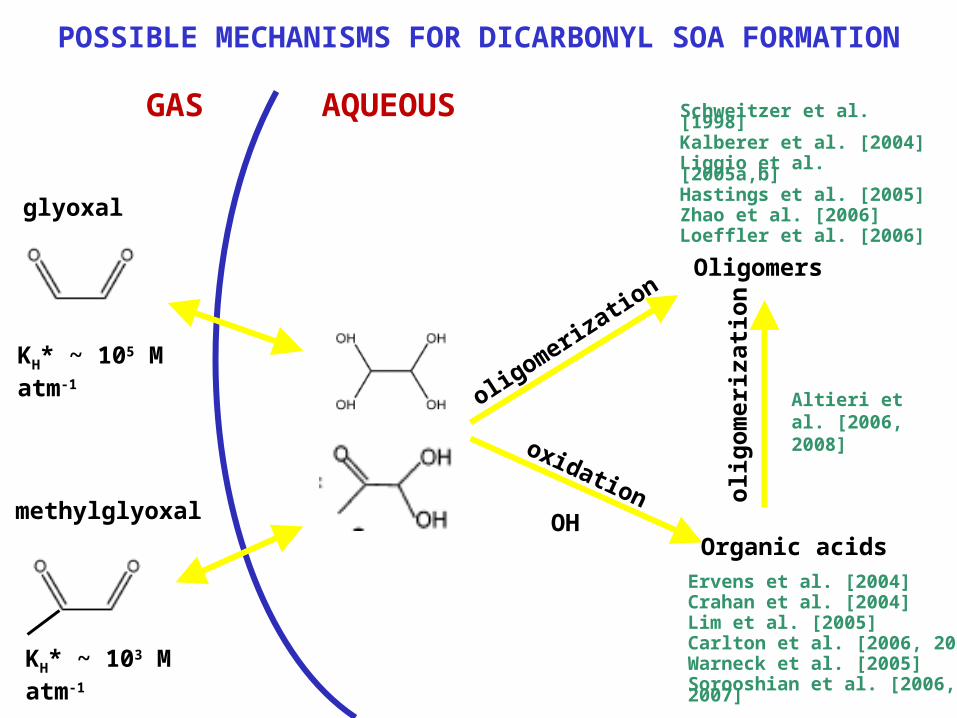
POSSIBLE MECHANISMS FOR DICARBONYL SOA FORMATION
GAS AQUEOUS
Oligomers
OHOrganic acids
KH* ~ 105 M atm-1
Ervens et al. [2004]Crahan et al. [2004]Lim et al. [2005]Carlton et al. [2006, 2007]Warneck et al. [2005]Sorooshian et al. [2006, 2007]
Altieri et al. [2006, 2008]
Schweitzer et al. [1998]Kalberer et al. [2004]Liggio et al. [2005a,b] Hastings et al. [2005] Zhao et al. [2006]Loeffler et al. [2006]glyoxal
KH* ~ 103 M atm-1
methylglyoxal
oxidation
oligomeriz
ation
oli
go
mer
izat
ion
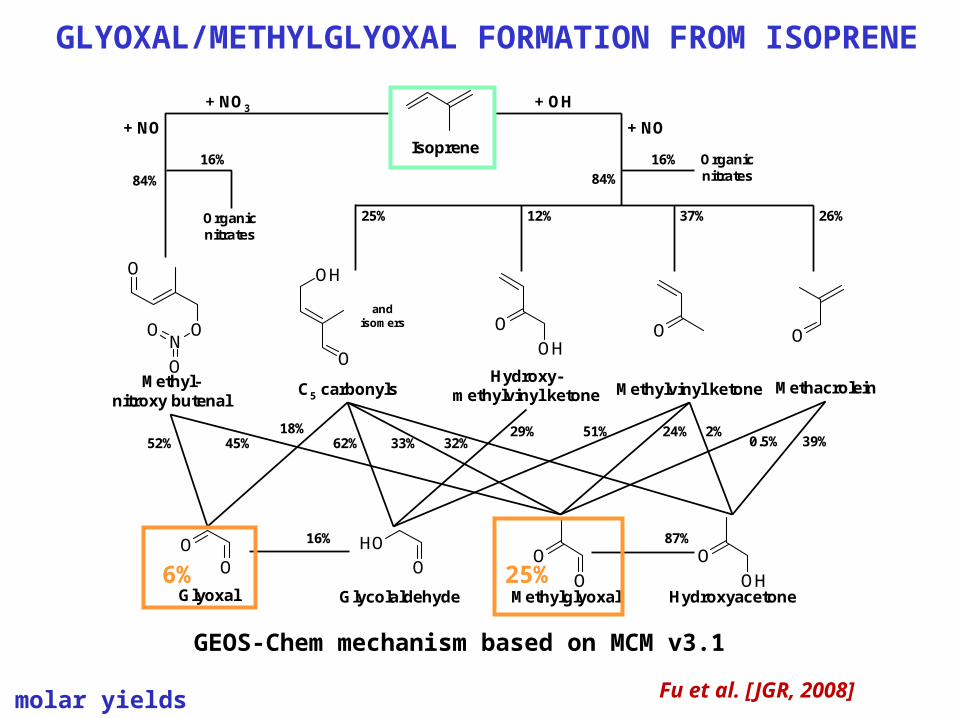
GLYOXAL/METHYLGLYOXAL FORMATION FROM ISOPRENE
ON
O
O
O OH
OOH
O O O
OO
HO
OO
O
O
OH
Isoprene
C5 carbonylsHydroxy-
methylvinyl ketone Methylvinyl ketone Methacrolein
Glyoxal Glycolaldehyde Methylglyoxal Hydroxyacetone
Methyl-nitroxy butenal
25% 12% 37% 26%
18%33% 32%62%
29% 51% 24%39%
87%16%
45%52%
+ OH+ NO3
+ NO + NO
16%
84%
16%
84%
2%
andisomers
0.5%
Organicnitrates
Organicnitrates
GEOS-Chem mechanism based on MCM v3.1
Fu et al. [JGR, 2008]
6% 25%
molar yields
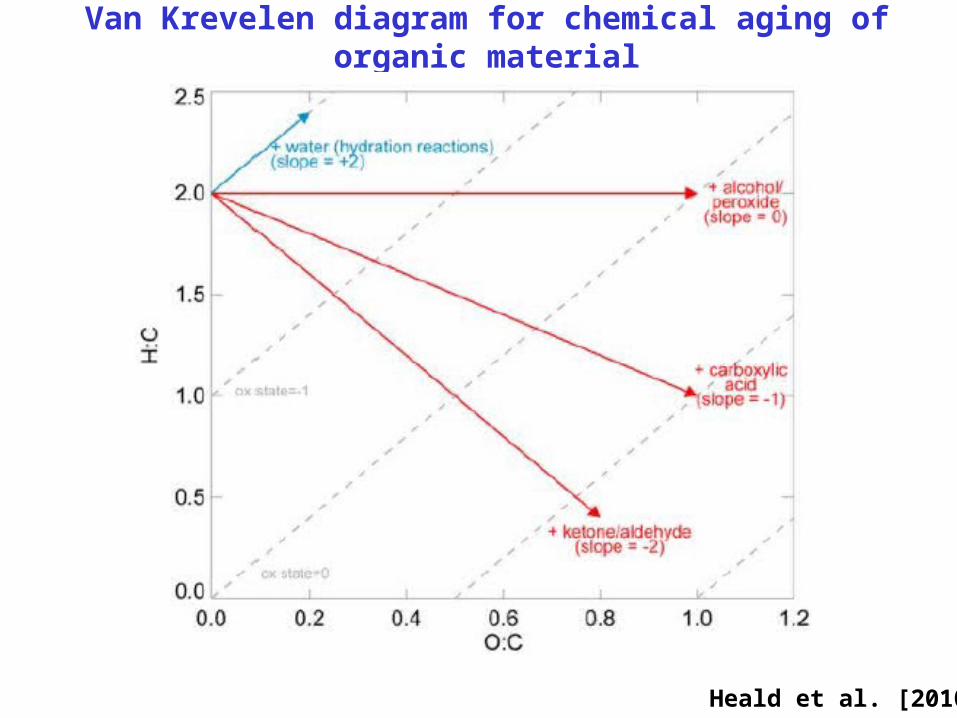
Van Krevelen diagram for chemical aging of organic material
Heald et al. [2010]
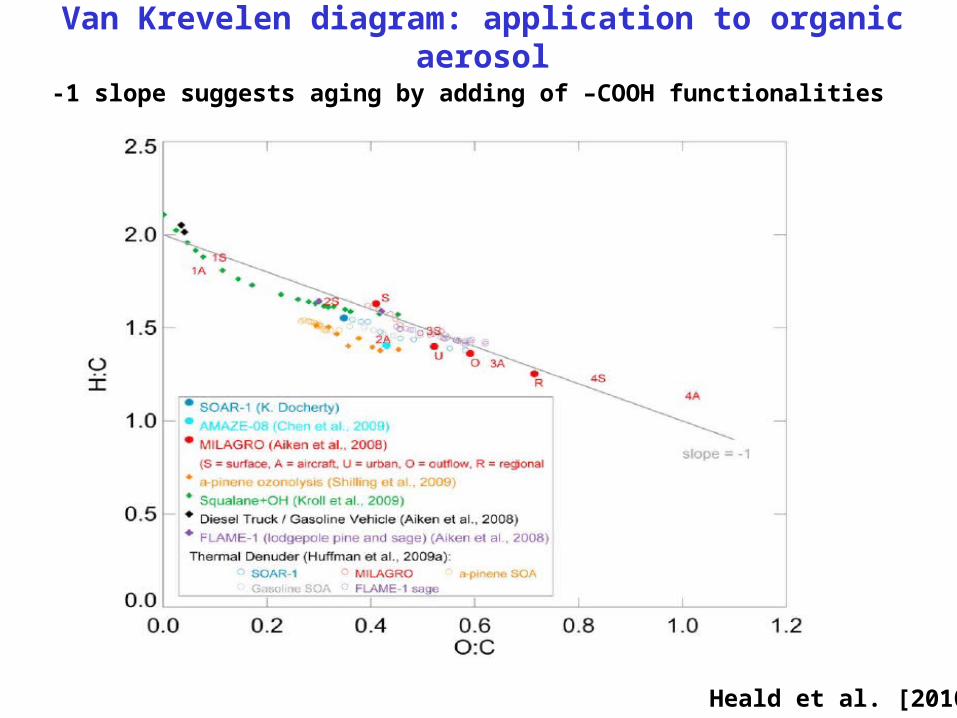
Van Krevelen diagram: application to organic aerosol
Heald et al. [2010]
-1 slope suggests aging by adding of –COOH functionalities