The Science of the Total Environment 314 –316 (2003) 513–534 0048-9697/03/$ - see front matter 2003 Elsevier Science B.V. All rights reserved. doi:10.1016/S0048-9697(03)00071-8 Fingerprinting suspended sediment sources in a large urban river system Julie Carter , Philip N. Owens *, Desmond E. Walling , Graham J.L. Leeks a,1 a, a b Department of Geography, University of Exeter, Exeter, Devon EX4 4RJ, UK a Centre for Ecology and Hydrology, Wallingford, Oxfordshire OX10 8BB, UK b Accepted 1 January 2003 Abstract Very few studies have attempted to quantify the sources of suspended sediment transported in urban river systems. In this study, statistically verified composite fingerprints and a multivariate mixing model have been used to identify the main sources of the suspended sediment transported by the River Aire and its main tributary, the River Calder. Because of the polluted nature of the AireyCalder catchment and its effect on fingerprint property concentrations, source tracing was undertaken separately for the upper and lower reaches. The mean contributions from individual source types (i.e. surface materials from woodland, uncultivated and cultivated areas, channel bank material, road dust and solids from sewage treatment works) varied between the upper and lower reaches of the rivers, reflecting the change in land use from primarily pasture and moorland in the upper reaches to mainly urban areas (with some cultivated land) in the lower reaches. The suspended sediment in the upper reaches of the River Aire originates largely from channel bank sources (43–84%) and from uncultivated topsoil (16–57%). In the lower reaches of the AireyCalder system, local sources of cultivated topsoil contribute 20–45% of the suspended sediment load and there is a significant contribution from urban sources, such as road dust (19–22%) and solids from sewage treatment works (14–18%). In the upper reaches, the proportion of sediment derived from each of the two main geological areas corresponds broadly to the proportion of the catchment occupied by each geological area. The relative contribution from the Rivers Aire and Calder to the suspended sediment load transported below the confluence demonstrates that most of the sediment is derived from the River Calder. 2003 Elsevier Science B.V. All rights reserved. Keywords: Suspended sediment; Sediment sources; Fingerprinting; Urban sources; Mixing model *Corresponding author. National Soil Resources Institute, Cranfield University, North Wyke, Okehampton, Devon EX20 2SB, UK. Tel.: q44-1837-883524; fax: q44-1837 82139. E-mail address: [email protected](P.N. Owens). Present address: Institute of Water and Environment, Cran- 1 field University, Silsoe, Bedfordshire MK45 4DT, UK. 1. Introduction The suspended sediment load transported by a river commonly represents a mixture of sediment derived from different locations and different sed- iment source types within the contributing catch- ment. Information on suspended sediment provenance is an important requirement in the
Transcript
The Science of the Total Environment 314–316(2003) 513–534
0048-9697/03/$ - see front matter� 2003 Elsevier Science B.V. All rights reserved.doi:10.1016/S0048-9697(03)00071-8
Fingerprinting suspended sediment sources in a large urban riversystem
Julie Carter , Philip N. Owens *, Desmond E. Walling , Graham J.L. Leeksa,1 a, a b
Department of Geography, University of Exeter, Exeter, Devon EX4 4RJ, UKa
Centre for Ecology and Hydrology, Wallingford, Oxfordshire OX10 8BB, UKb
Accepted 1 January 2003
Abstract
Very few studies have attempted to quantify the sources of suspended sediment transported in urban river systems.In this study, statistically verified composite fingerprints and a multivariate mixing model have been used to identifythe main sources of the suspended sediment transported by the River Aire and its main tributary, the River Calder.Because of the polluted nature of the AireyCalder catchment and its effect on fingerprint property concentrations,source tracing was undertaken separately for the upper and lower reaches. The mean contributions from individualsource types(i.e. surface materials from woodland, uncultivated and cultivated areas, channel bank material, roaddust and solids from sewage treatment works) varied between the upper and lower reaches of the rivers, reflectingthe change in land use from primarily pasture and moorland in the upper reaches to mainly urban areas(with somecultivated land) in the lower reaches. The suspended sediment in the upper reaches of the River Aire originateslargely from channel bank sources(43–84%) and from uncultivated topsoil(16–57%). In the lower reaches of theAireyCalder system, local sources of cultivated topsoil contribute 20–45% of the suspended sediment load and thereis a significant contribution from urban sources, such as road dust(19–22%) and solids from sewage treatment works(14–18%). In the upper reaches, the proportion of sediment derived from each of the two main geological areascorresponds broadly to the proportion of the catchment occupied by each geological area. The relative contributionfrom the Rivers Aire and Calder to the suspended sediment load transported below the confluence demonstrates thatmost of the sediment is derived from the River Calder.� 2003 Elsevier Science B.V. All rights reserved.
Keywords: Suspended sediment; Sediment sources; Fingerprinting; Urban sources; Mixing model
*Corresponding author. National Soil Resources Institute,Cranfield University, North Wyke, Okehampton, Devon EX202SB, UK. Tel.:q44-1837-883524; fax:q44-1837 82139.
E-mail address: [email protected](P.N. Owens).Present address: Institute of Water and Environment, Cran-1
field University, Silsoe, Bedfordshire MK45 4DT, UK.
1. Introduction
The suspended sediment load transported by ariver commonly represents a mixture of sedimentderived from different locations and different sed-iment source types within the contributing catch-ment. Information on suspended sedimentprovenance is an important requirement in the
514 J. Carter et al. / The Science of the Total Environment 314 –316 (2003) 513–534
examination of sediment routing and delivery, andin the construction of catchment sediment budgets(Dietrich and Dunne, 1978; Walling and Webb,1983). From a management perspective, there isalso a need to identify sediment sources in orderto implement appropriate strategies to control sed-iment mobilisation and subsequent siltation of riverchannels and reservoirs. There is also increasingawareness of the role of suspended sediment as avector for the transport of sediment-associatednutrients and contaminants(e.g. heavy metals,phosphorus, PCBs) in fluvial systems(Horowitz,1991; Owens et al., 2001). The source of thesediment influences its chemical and physicalproperties and its contaminant loading, and as suchis an important consideration in the managementof polluted river systems. The precise type ofinformation required on sediment source dependson the purpose in hand and the nature of anysediment-related problem. However, informationon both the source type(e.g. sheet erosion ondifferent land use types, erosion of channel banksor solids from urban runoff) and spatial location(e.g. which tributary or part of the basin) isfrequently required(Walling et al., 1999).Information on sediment provenance has tradi-
tionally been collected using direct monitoringtechniques(cf. Loughran and Campbell, 1995).However, studies employing erosion pins andtroughs to estimate soil erosion rates, or sedimentload measurements to quantify the relative contri-bution of suspended sediment from different sourceareas within a catchment, face a number of prob-lems(Peart and Walling, 1986) and fingerprintingtechniques are increasingly being used as an alter-native(e.g. Walling and Woodward, 1995; Collinset al., 1998; Bottrill et al., 1999). Advantagesinclude the limited field data collection involved(i.e. collection of source material and suspendedsediment samples as opposed to extensive long-term monitoring at a number of sites). The basicprinciple underlying the fingerprinting approach isthat different potential sediment sources can becharacterised, or fingerprinted, using a number ofdiagnostic physical and chemical(and possiblybiological) properties, and that comparison of thesefingerprints with equivalent information for sus-pended sediment samples permits the relative
importance of the different potential sources to bedetermined(Oldfield et al., 1979; Walling andWoodward, 1995). Many different physical andchemical properties have been successfully usedto discriminate potential sediment sources in drain-age basins, including mineralogy(Klages andHsieh, 1975; Johnson and Kelley, 1984), sedimentchemistry (Wall and Wilding, 1976; Peart andWalling, 1986), mineral magnetism(Oldfield etal., 1979; Slattery et al., 2000) and environmentalradionuclides(Walling and Woodward, 1992; Heand Owens, 1995). The use of a single diagnosticproperty is now recognised as being inadequate todiscriminate between the wide range of sedimentsources found in river catchments, and compositefingerprinting procedures, based on a number ofdifferent properties, have been developed(Collinset al., 1998; Walling et al., 1999; Collins andWalling, 2002). This approach involves the use ofa number of different diagnostic properties toestablish statistically verified composite finger-prints, and the subsequent application of a multi-variate mixing model to establish the relativeimportance of the different potential sources(Heand Owens, 1995; Walling and Woodward, 1995;Collins et al., 1998; Walling et al., 1999). Thishas the advantage of permitting the discriminationof a greater range of sediment sources and is likelyto prove more effective in establishing source–sediment linkages by reducing the possibility ofspurious matches that may occur with the use ofindividual tracers.Although the fingerprinting approach is being
increasingly used to establish sediment sources inagricultural drainage basins in contrasting environ-ments(e.g. Collins et al., 1998, 2001; Bottrill etal., 1999; Walling et al., 1999; Owens et al., 2000;Slattery et al., 2000; Russell et al., 2001), veryfew studies have attempted to determine suspendedsediment sources in urbanised and industrialisedcatchments. Notable exceptions include the workof Charlesworth et al.(2000) and Charlesworthand Lees(2001), although their studies have tend-ed to focus on small(i.e. usually -10 km )2
catchments. As far as we are aware, there havebeen no previous attempts to determine suspendedsediment sources in a large(i.e. )1000 km)2
highly urbanised catchment using composite fin-
515J. Carter et al. / The Science of the Total Environment 314 –316 (2003) 513–534
gerprints. This paper reports the use of the finger-printing approach to establish the relativeimportance of different potential suspended sedi-ment sources, defined in terms of both source type(i.e. agricultural and urban sources) and spatiallocation (i.e. different geological zones and indi-vidual sub-basins), within the heavily polluteddrainage basin of the River Aire in Yorkshire, UK.To the best of our knowledge, this study representsthe first attempt to include urban sources of roaddust and solids from sewage treatment works(STWs) within the composite fingerprintingapproach.
2. Study basin and methods
2.1. Study basin
The River Aire is a tributary of the River Ouse,which drains into the North Sea via the HumberEstuary(Fig. 1). It has a total catchment area of1932 km above the tidal limit, and a long-term2
(1958–1998) mean annual discharge of 35.4 m3
s at the Environment Agency(EA) gaugingy1
station at Beal(NERC, 2001). The River Calderis the main tributary of the River Aire and has acatchment area of 930 km and a long-term(1988–2
1998) mean annual discharge of 19.0 m s at3 y1
the EA gauging station at Methley, thus contrib-uting over half of the discharge of the lower Aire(NERC, 2001). Both rivers rise on land dominatedby pasture and rough grazing, where water qualityis generally good, except for small discharges ofagricultural effluent and some limited diffuse-source pollution. However, in the middle and lowerreaches, the AireyCalder system drains a heavilyurbanised and industrialised catchment with a pop-ulation of approximately 2 000 000 people. Themain industries in the catchment include wool,textiles, chemicals, engineering, and food anddrink production. Most of the industrial effluent istreated by sewage treatment works(STWs),although some industries have consent for tradeeffluent to be discharged directly to the river.Consequently, the middle and lower reaches ofboth rivers are heavily polluted and receive dis-charges of sewage effluent from STWs, combinedsewer overflows and sewer dykes(CSOSD), and
industrial discharges(direct and indirect), in addi-tion to inputs from road drainage. This transitionfrom a non-polluted upstream river to a heavilypolluted system in downstream reaches providesan ideal opportunity to investigate contrasts insediment source between rural and urban areas.The underlying geology of the upper reaches ofthe AireyCalder system is Carboniferous limestoneand millstone grit(Fig. 1). The middle and lowerreaches are underlain by Carboniferous coal meas-ures, while below the confluence of the two riversthis gives way to Permian magnesian limestone.The soils in the upper reaches are dominated byraw oligo-fibrous peats, and stagnohumic and stag-nogley soils. These give way to typical brownearths and pelo-stagnogley soils in the middle andlower reaches. The narrow band of Permian mag-nesian limestone at the catchment outlet is overlainby typical brown calcareous earths, which arefrequently cultivated.
2.2. Field sampling
Bulk suspended sediment samples were collect-ed from a number of locations throughout theAireyCalder catchment(Fig. 1). Over 70 bulksuspended sediment samples were collectedbetween November 1997 and January 1999.Because most of the suspended sediment load ofthe River Aire is transported during a few highflow events(cf. Wass and Leeks, 1999), sedimentsamples were collected primarily during theseevents. As an example, Fig. 2 shows the time ofsample collection at Beal in relation to river flowat this site. It is clear from Fig. 2 that sedimentsamples were collected during most of the highflow events that occurred during the samplingperiod. Furthermore, the samples collectedthroughout the Aire catchment encompassed arange of suspended sediment concentrations(range;10–400 mg l , which is typical for this river;y1
cf. Wass and Leeks, 1999) and likely seasonal,inter- and intra-storm variations in sediment prop-erties. The sediment samples collected are, there-fore, considered to be reasonably representative ofthe suspended sediment load transported past eachsite. The sediment samples were collected fromthe centre of the channel, using a submersible
516 J. Carter et al. / The Science of the Total Environment 314 –316 (2003) 513–534
Fig. 1. Location map showing the study area, the suspended sediment and floodplain sampling sites and the main geologicalsubdivisions.
pump powered by a portable generator, to fillseveral 25-l acid-washed polyethylene containers.The suspended sediment was recovered from thebulk samples by continuous flow centrifugation
and freeze-dried prior to analysis. At one site(Allerton), where no suspended sediment sampleswere collected, overbank floodplain deposits wereused as a surrogate(cf. Bottrill et al., 1999). Such
517J. Carter et al. / The Science of the Total Environment 314 –316 (2003) 513–534
Fig. 2. Variation in flow of the River Aire at Beal during thestudy period, and the timing of the collection of suspendedsediment samples.
deposits were collected using Astroturf mats(cf.Lambert and Walling, 1987), which were deployedprior to overbank flooding and collected soon afterthe floodwaters had receded.In order to characterise potential source materi-
als, ca. 150 source material samples()500 g)were collected throughout the study area using astainless steel trowel. These were collected over aperiod of 12 months in order to take account ofseasonal fluctuations in tracer properties. Sourcematerial sampling was stratified to incorporategeological and land-use variations. Within each ofthe main geological zones(cf. Fig. 1), represen-tative samples were collected from the surface(top;2 cm) of woodland, uncultivated(i.e. pasture,rough grazing and moorland) and cultivated areas,and also from the faces of eroding channel banks.Previous fingerprinting studies have not includedurban areas as a potential sediment source. Thiswas clearly an important consideration in an urbancatchment(Stone and Marsalek, 1996), and there-fore samples of road dust and of solids from aSTW were also collected. Samples of road dust inthe most built-up areas were swept into labelledpolythene bags. Care was taken to sample areaslocated close to drains to ensure that the sedimentwas representative of sediment likely to enter theriver. Due to logistical and safety problems asso-ciated with collecting samples of STW effluent
discharged to the River Aire during high-flowconditions, and the fact that the river level isusually above the level of the STW dischargepipes, samples(ns3) of the influent to EsholtSTW (a large STW that serves the city of Brad-ford; see Fig. 1) were collected. Such samples arelikely to be representative of the material dis-charged into rivers, particularly during stormevents, when storm bypass channels mean thatsewage influent is discharged directly to the river(Owens and Walling, 2002). All source materialsamples were dried at 408C, gently disaggregatedand then dry-sieved to-63mm to facilitate directcomparison with fluvial(suspended and overbank)sediment samples(Collins et al., 1998; Walling etal., 1999).
2.3. Laboratory analysis
Laboratory analysis of both source material andsuspended sediment samples was undertaken for arange of potential fingerprint properties. Phospho-rus (P) concentrations(total, organic and inorgan-ic) were determined using a Pye Unicam SP6 UVyvisible spectrophotometer after chemical extraction(Mehta et al., 1954). Metal concentrations weredetermined using a Unicam 939 atomic absorptionspectrophotometer after acid(concentrated HCland HNO) digestion(Allen, 1989). Carbon(C)3
and nitrogen(N) concentrations were measuredusing a Carlo Erba ANA 1400 analyser. Radionu-clide concentrationswcaesium-137( Cs), radium-137
226 ( Ra) and unsupported lead-210( Pb)x226 210
were determined using an EG&G Ortec hyper-puregermanium well-type detector. In order to correctfor further contrasts in grain size compositionbetween source materials and suspended sediment,the specific surface area of the samples was esti-mated from their particle size distributions. Thelatter were determined using a Coulter LS130 laserdiffraction granulometer, after removal of organicmatter (by H O ) and chemicalw(NaPO) x and2 2 3 6
ultrasonic dispersion.
2.4. The fingerprinting approach
In order to exploit fully the potential of partic-ular properties to differentiate potential source
518 J. Carter et al. / The Science of the Total Environment 314 –316 (2003) 513–534
types, firm verification is needed that a propertyis capable of discriminating between the sourcegroups identified. A two-stage statistical verifica-tion procedure was used to produce multicompo-nent signatures for the discrimination of differentsource types and areas(Collins et al., 1998;Walling et al., 1999). First, either the Mann–WhitneyU-test(to distinguish between two poten-tial sources) or the Kruskal–WallisH-test (todistinguish between three or more potentialsources) was used to establish which properties(i.e. P, Cr, Cs) exhibited significant differences137
between the sources(i.e. cultivated topsoil, chan-nel bank material, street dust). Properties failingthis test were removed from the subsequent anal-ysis. Secondly, multivariate discriminant functionanalysis was applied to the properties selected inthe first stage, in order to identify the set ofproperties or composite fingerprint that affordedthe best discrimination between source groups. Astepwise selection algorithm, based on the min-imisation of Wilks’ lambda, was used in thisanalysis. A multivariate mixing model was subse-quently used to estimate the relative contributionof the potential sediment sources to a particularsuspended sediment sample. This mixing model issimilar in principle to those used in other investi-gations that have successfully quantified the prov-enance of suspended sediment in predominantlyagricultural catchments(Collins et al., 1998, 2001;Bottrill et al., 1999; Walling et al., 1999; Owenset al., 2000; Russell et al., 2001).Suspended sediment samples are generally
enriched in fines compared to source materials(Walling et al., 2000), resulting in sediment sam-ples exhibiting higher concentrations of many con-stituents than the source material(Horowitz,1991). The effect of contrasts in grain size com-position between source materials and suspendedsediment was partly addressed by restricting anal-ysis to the-63-mm fraction, but further correctionwas required to make the sediment samples direct-ly comparable with the source materials. Thevalues for the fingerprint properties of samplesfrom each source were therefore corrected fordifferences in particle size composition comparedwith the suspended sediment being traced, usingthe ratio of the specific surface area of each
suspended sediment sample to the mean value foreach source(e.g. cultivated topsoil or limestonegeology or Calder sub-basin). This provides asimple and convenient means of correcting all ofthe fingerprint property values for each source(Walling et al., 1999). Peart and Walling(1986)noted that suspended sediment is also likely to beenriched in organic matter, which may then act asa scavenger for many elements(Horowitz, 1991).Consequently, Collins et al.(1998) suggested thatit was necessary to include correction for organicmatter content in the model. However, the rela-tionship between organic matter content and heavymetal content is complex and difficult to generalise(Walling et al., 1999), and such correction wasnot included in this study, since it may also resultin the over-correction of tracer properties. Meanvalues of the particle size-corrected tracer proper-ties for each source were used in the mixing model.Due to the wide range of discharges and sus-
pended sediment concentrations when sampleswere collected(cf. Fig. 2), the relative contribu-tions from each source for the individual sedimentsamples were weighted according to the values ofdischarge and suspended sediment concentrationat the time of sampling(cf. Walling et al., 1999;Owens et al., 2000). This sediment load-weightingapproach ensures that the importance of sourcecontributions associated with periods of high sed-iment load is emphasised, and therefore providesa more realistic estimate of the proportion of thetotal suspended sediment load at a sampling sitecontributed by individual sources than a simpleaverage of the percentage contribution values asso-ciated with individual suspended sediment sam-ples. However, for the purposes of this study,continuous discharge and turbidity data were onlyavailable at the most downstream sites on eachriver, and consequently mean values for the indi-vidual samples were used at other sites.The goodness-of-fit provided by the mixing
model was assessed by comparing the actual fin-gerprint property concentrations found in the sus-pended sediment samples with the correspondingvalues predicted by the mixing model, using theprocedures described in Collins et al.(1998). Themean(average for all properties within each com-posite fingerprint) relative errors for the mixing
519J. Carter et al. / The Science of the Total Environment 314 –316 (2003) 513–534
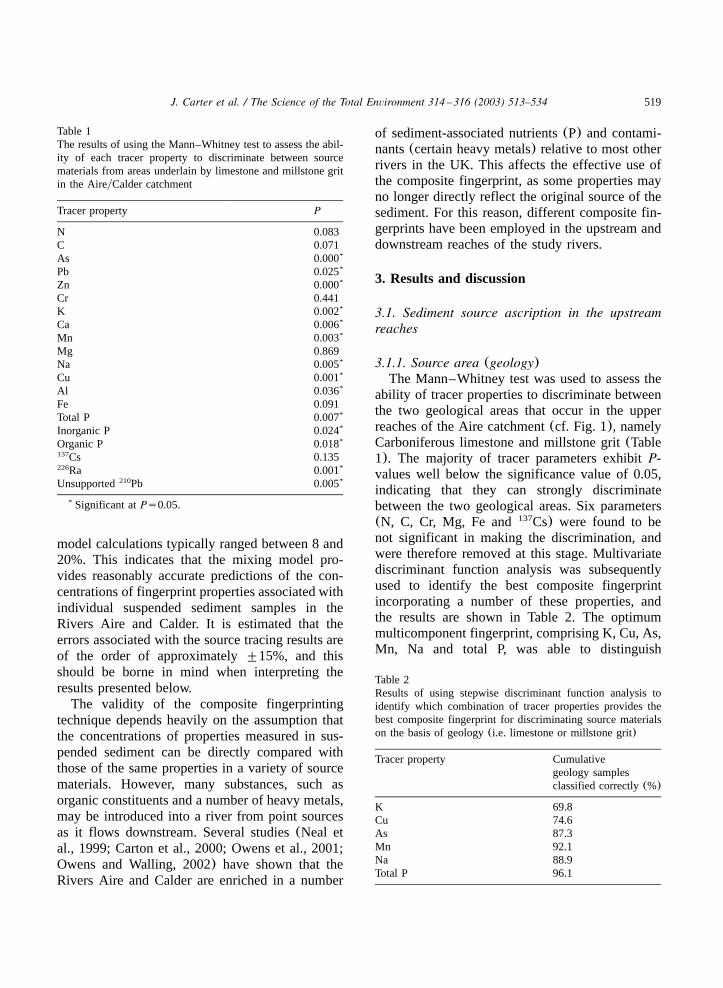
Table 1The results of using the Mann–Whitney test to assess the abil-ity of each tracer property to discriminate between sourcematerials from areas underlain by limestone and millstone gritin the AireyCalder catchment
Tracer property P
N 0.083C 0.071As 0.000*
Pb 0.025*
Zn 0.000*
Cr 0.441K 0.002*
Ca 0.006*
Mn 0.003*
Mg 0.869Na 0.005*
Cu 0.001*
Al 0.036*
Fe 0.091Total P 0.007*
Inorganic P 0.024*
Organic P 0.018*
Cs137 0.135Ra226 0.001*
Unsupported Pb210 0.005*
Significant atPs0.05.*
Table 2Results of using stepwise discriminant function analysis toidentify which combination of tracer properties provides thebest composite fingerprint for discriminating source materialson the basis of geology(i.e. limestone or millstone grit)
model calculations typically ranged between 8 and20%. This indicates that the mixing model pro-vides reasonably accurate predictions of the con-centrations of fingerprint properties associated withindividual suspended sediment samples in theRivers Aire and Calder. It is estimated that theerrors associated with the source tracing results areof the order of approximately"15%, and thisshould be borne in mind when interpreting theresults presented below.The validity of the composite fingerprinting
technique depends heavily on the assumption thatthe concentrations of properties measured in sus-pended sediment can be directly compared withthose of the same properties in a variety of sourcematerials. However, many substances, such asorganic constituents and a number of heavy metals,may be introduced into a river from point sourcesas it flows downstream. Several studies(Neal etal., 1999; Carton et al., 2000; Owens et al., 2001;Owens and Walling, 2002) have shown that theRivers Aire and Calder are enriched in a number
of sediment-associated nutrients(P) and contami-nants(certain heavy metals) relative to most otherrivers in the UK. This affects the effective use ofthe composite fingerprint, as some properties mayno longer directly reflect the original source of thesediment. For this reason, different composite fin-gerprints have been employed in the upstream anddownstream reaches of the study rivers.
3. Results and discussion
3.1. Sediment source ascription in the upstreamreaches
3.1.1. Source area (geology)The Mann–Whitney test was used to assess the
ability of tracer properties to discriminate betweenthe two geological areas that occur in the upperreaches of the Aire catchment(cf. Fig. 1), namelyCarboniferous limestone and millstone grit(Table1). The majority of tracer parameters exhibitP-values well below the significance value of 0.05,indicating that they can strongly discriminatebetween the two geological areas. Six parameters(N, C, Cr, Mg, Fe and Cs) were found to be137
not significant in making the discrimination, andwere therefore removed at this stage. Multivariatediscriminant function analysis was subsequentlyused to identify the best composite fingerprintincorporating a number of these properties, andthe results are shown in Table 2. The optimummulticomponent fingerprint, comprising K, Cu, As,Mn, Na and total P, was able to distinguish
520 J. Carter et al. / The Science of the Total Environment 314 –316 (2003) 513–534
Table 3Mean contributions of each geological area to the suspended sediment samples collected from the upper reaches of the River Aireduring the period November 1997–January 1999
River Site Number of Geological area contribution(%)sediment
The approximate surface areas underlain by each geological area are listed in parentheses.
Fig. 3. Inter-storm variability in the relative contribution of areas underlain by limestone and millstone grit to suspended sedimentsamples collected from Kildwick and Apperley.
correctly 96% of the source area samples. Theaddition of further tracer properties to the compos-ite fingerprint does not increase the success of theclassification. The numerical mixing model wasused to establish the relative contribution of eachsource to the individual suspended sediment sam-ples collected from the upstream sites on the RiverAire. The mean results for each site are presentedin Table 3. In the catchment of the River Aireabove Bell Busk and the Eller Beck at Skipton,there are no millstone grit outcrops, and conse-quently the area underlain by limestone is the onlysource of the suspended sediment loads at thesesites. At Kildwick, 56% of the sediment originatesfrom the limestone area. This is in close agreementwith the area occupied by this geology(approx.59%). At Apperley there is a decrease in theproportion of sediment derived from the limestonearea. This reflects the increase in the proportion ofland underlain by millstone grit above this sam-
pling site. The fact that the millstone grit atApperley supplies 87% of the suspended sedimentload while only occupying approximately 62% ofthe area may reflect higher rates of erosion andsediment supply associated with the millstone grit.However, the apparent importance of the millstonegrit rocks may simply reflect the timing of sus-pended sediment sampling in relation to the stormhydrograph.The considerable variation in the relative contri-
butions from the different geological areas associ-ated with the individual suspended sedimentsamples collected at Kildwick and Apperley isshown in Fig. 3. The proportion of sedimentsupplied by the limestone area reached 80% atKildwick and 40% at Apperley. The results high-light the importance of the timing of suspendedsediment sampling, since the routing of sedimentcontributions from different parts of the catchmentcauses these contributions to pass the sampling
521J. Carter et al. / The Science of the Total Environment 314 –316 (2003) 513–534
Fig. 4. Storm-period variation in the relative contribution of areas underlain by limestone and millstone grit to suspended sedimentsamples collected from Kildwick.
Fig. 5. Storm-period variation in the relative contribution of areas underlain by limestone and millstone grit to suspended sedimentsamples collected from Apperley.
site at different times. Fig. 4 shows the intra-stormvariations in sediment source areas for samplescollected from Kildwick during two storm events.During these events, the proportion of sedimentderived from the limestone area peaks on the risinglimb or at the peak, and then decreases during thefalling limb. This reflects the close proximity ofthe site to the area underlain by limestone. Fig. 5shows selected intra-storm variation in sedimentsource at Apperley. During these events, it appearsthat the proportion of sediment derived from thelimestone area increases during the latter stages ofan event, as sediment from more distant parts ofthe catchment underlain by limestone takes longerto reach the site.
3.1.2. Source type (land use)The source materials collected from the
upstream areas were also classified according tosource type. Previous authors(Collins et al., 1998;Walling et al., 1999; Owens et al., 2000) havedivided sources into four categories(i.e. surfacematerial from woodland, uncultivated and cultivat-
ed areas, and material from channel banks). Thereis very little cultivated land in the upper reachesof the AireyCalder catchment, and because it isunlikely that it would have an influence on thesupply of sediment to the river, this source typewas removed from the analysis at this stage. Theresults of the Kruskal–WallisH-test are shown inTable 4. A total of 14 out of 20 tracer propertiesprovided clear discrimination between surfacematerial from woodland and uncultivated(moor-landypasture) areas and channel bank material. Amulticomponent signature containing organic P,Cs, Mg, K, Mn and Fe was selected as the137
optimum fingerprint capable of classifying 87% ofthe source material samples correctly(Table 5).Summary results for the use of the mixing modelare presented in Table 6. For the suspended sedi-ment samples collected from the Otterburn Beckat Bell Busk and the River Aire at Kildwick andApperley, the contribution from surface materialfrom woodland areas is zero. This finding isconsistent with that obtained for other Yorkshirerivers (e.g. Walling et al., 1999) and reflects the
522 J. Carter et al. / The Science of the Total Environment 314 –316 (2003) 513–534
Table 4Results of applying the Kruskal–Wallis test to assess the abilityof each tracer property to discriminate between surface materialfrom uncultivated and woodland areas, and channel bank mate-rial collected from the AireyCalder catchment
Table 5Results of using stepwise discriminant function analysis toidentify which combination of tracer properties provides thebest composite fingerprint for discriminating between surfacematerials from woodland and uncultivated areas, and channelbank material
Table 6Mean contributions of each source type to the suspended sediment samples collected from the upper reaches of the River Aireduring the period November 1997–January 1999
River Site Number of Source type contribution(%)sediment
limited spatial extent of woodland in the catchmentand the lack of surface erosion from such areas.For the River Aire at Bell Busk and the Eller Beckat Skipton, small contributions from woodlandsources are identified, and this is probably due tothe existence of areas of woodland in close prox-imity to the sampling sites. The predominant sed-iment source at Bell Busk, for both the OtterburnBeck and the River Aire, and at Kildwick is
material from eroding channel banks. The contri-bution from channel banks is higher than thatreported previously for studies in the UK(Collinset al., 1998; Walling et al., 1999; Owens et al.,2000), for which values have typically rangedbetween;10 and 40%. The high contribution ofsediment from channel banks in the upper reachesof the River Aire can be partly explained by theabsence of cultivated land. This means that theactual amount of sediment supplied by channelbanks may not be substantially greater than inother catchments, but because there is a lack ofcultivated land as a sediment source, thepropor-tion contributed by eroding channel banks isincreased. However, there is some evidence ofsevere bank erosion in the upper reaches of thecatchment. In addition, the greater than averagerainfall during the study period may have contrib-uted to an above average incidence of bank col-
523J. Carter et al. / The Science of the Total Environment 314 –316 (2003) 513–534
Fig. 6. Inter-storm variability in the relative contribution of surface material from uncultivated and woodland areas, and channelbank material to suspended sediment collected from the upper reaches of the River Aire(at Bell Busk, Kildwick and Apperley)and two upstream tributaries(Otterburn Beck and Eller Beck).
lapse and channel scour by increasing the erosivepotential of the river during periods of high dis-charge. The contribution of surface material fromuncultivated areas to the suspended sediment loadis substantial and reflects the large amount ofpasture and moorland in the upper catchment. Thecontribution from channel banks to the suspendedsediment samples collected at Apperley is lowerthan at the other sites, as many channels belowKildwick are protected and bank erosion is not ascommon. The eroded bank material from upstreamreaches is, therefore, diluted by substantial inputsof surface materials from uncultivated areas in thevicinity of Apperley.
The mean values reported in Table 6 concealsignificant inter- and intra-storm variations insource type, which are highlighted in Fig. 6.Appreciable temporal variation in the relativeimportance of sediment sources was also noted byHe and Owens(1995), Walling and Woodward(1995) and Walling et al.(1999). Such variationsreflect antecedent conditions and changes in land-use and land-cover between events, exhaustion ofsources as an event proceeds, and the timing ofsampling in relation to the hydrograph peak. Forthe River Aire at Bell Busk, Kildwick and Apper-ley, there is evidence to suggest that events duringthe summer months contribute smaller proportions
524 J. Carter et al. / The Science of the Total Environment 314 –316 (2003) 513–534
Fig. 7. Storm-period variation in the relative contribution of surface material from woodland and uncultivated areas, and channelbank material to suspended sediment samples collected from Kildwick.
Fig. 8. Storm-period variation in the relative contribution of surface material from woodland and uncultivated areas, and channelbank material to suspended sediment samples collected from Apperley.
of bank material. This may relate to the absenceof freeze–thaw processes, which prepare sedimentfor entrainment during the winter months. Alter-natively, it may reflect the fact that discharges are
lower in the summer months, and thus have lesspotential for entraining sediment from large areasof riverbank. However, insufficient samples werecollected during the summer to statistically verify
525J. Carter et al. / The Science of the Total Environment 314 –316 (2003) 513–534
this trend. The intra-storm variability in sourcetype contributions at Kildwick and Apperley isshown in Figs. 7 and 8, respectively. At Kildwick,for the events shown, there is a slight increase inthe proportion of bank material supplied duringthe latter stages of the event. This is consistentwith the findings of Walling et al.(1999) andOwens et al.(2000), who suggested that bankmaterial is entrained at high discharges and thathigher amounts of bank material can thus beexpected at the discharge peak or shortly after-wards, depending on the distance from the sourceof the material to the sampling site. The delayedbank input could also reflect bank collapse as thewater levels recede. At Apperley on the 10 Decem-ber 1997, there was also an increase in the pro-portion of bank material supplied during the fallinglimb. This also coincided with an increase in theproportion of sediment derived from limestoneareas(cf. Fig. 5) and again reflects the importanceof upstream sources within the limestone area inthe supply of channel bank material. On the 3January 1998, the proportion of bank material waslow and this also corresponds with a low propor-tion of sediment derived from the limestone area(cf. Fig. 3). The event occurring on the 16 October1998 exhibited the highest proportions of bankmaterial and also the highest proportion of sedi-ment from limestone areas, thus highlighting theconsistency between the two sets of sedimentsource investigations.
3.2. Sediment source ascription in the lowerreaches
Fingerprinting of sediment sources at the catch-ment outlet is complicated by the well-documentedfact that the fluvial sediment in the AireyCaldercatchment is contaminated by a variety of sedi-ment-associated nutrients and heavy metals(Nealet al., 1999; Carton et al., 2000; Owens et al.,2001; Owens and Walling, 2002). Consequently,it is not appropriate to use the composite finger-prints that were used for the upstream reaches,which were derived using source materials collect-ed from agricultural areas only. Instead, it isnecessary to also incorporate likely urban sources,such as road dust and solids from STWs. Further-
more, because there is the potential problem thatsome tracer properties may be discharged frompoint sources to rivers in solution and subsequentlysorb onto existing suspended sediment in the river(Owens and Walling, 2002), thereby elevating theproperty concentration of the suspended sediment,it is necessary to exclude properties that show anelevated concentration in suspended sediment rel-ative to those for the various potential sourcesbefore the fingerprinting exercise is carried out.
3.2.1. Source area (geology)In order to ascribe sources to the suspended
sediment collected in the lower reaches of theriver, all source materials were classified accordingto whether they were sampled from limestone,millstone grit, coal measures or magnesian lime-stone. The concentrations of tracer properties inthe source materials were then corrected for parti-cle size effects by multiplying the concentrationby the ratio of the mean specific surface area ofthe suspended sediment to that for the sourcematerial. When the mean property concentrationsfor the suspended sediment load were comparedto the particle size-corrected concentrations in thesource materials, the concentrations of eight of the20 properties fell outside the range of valuesrepresented by the source materials. Consequently,these properties were deemed unsuitable for fin-gerprinting and they were excluded at this stage.The ability of the remaining properties to discrim-inate between the four geological areas was testedusing the Kruskal–WallisH-test. Six propertieswere shown to discriminate between the fourgeological areas. However, multivariate discrimi-nant function analysis showed that-70% of thesamples could be correctly classified using theseproperties. For this reason it was decided that itwas not viable to attempt to use these fingerprintproperties to establish source area contributions inthe downstream reaches of the study catchment.These problems highlight the difficulties of sourceascription in a contaminated catchment.
3.2.2. Source type (land use)In order to establish the source type contribu-
tions to the suspended sediment collected at thecatchment outlet, source materials were classified
526 J. Carter et al. / The Science of the Total Environment 314 –316 (2003) 513–534
Table 7Comparisons between the concentration of tracer properties in source materials(corrected for particle size differences) and suspendedsediment
Values in bold italics represent concentrations in suspended sediment that lie outside the range associated with source materials.
according to whether they were surface materialsfrom woodland, uncultivated(pastureymoorland)or cultivated areas, channel bank material(i.e.agricultural sources), solids from STWs or roaddust (i.e. urban sources). The source materialproperties were then corrected for particle sizedifferences(Table 7). Average concentrations forsuspended sediment for 16 out of 20 propertiesfell within the range for the source materials andwere consequently subjected to the Kruskal–WallisH-test (Table 8). All of the 16 properties wereable to distinguish between the six source types,and subsequent analysis produced a multicompo-nent signature containing Zn, C, N, unsupportedPb, Cs and total P. This fingerprint classified210 137
76% of the source type samples correctly(Table9). The mean load-weighted results provided bythe mixing model for the River Aire at Beal andthe River Calder at Methley are presented in Table10. For the River Aire at Beal, the dominantsediment source is from channel banks(approx.
33%). This reflects the importance of the erosionof channel banks in the downstream reaches of theriver, where banks are often)2 m in height. Italso reflects the downstream location of the sam-pling sites, and thus the distal location of manytopsoil sources, particularly pastureymoorland andwoodland areas, which are mainly located inupstream areas. Due to their distal location, theopportunity for conveyance losses is greater. Thesefindings are consistent with those documented byWalling et al.(1999) and Owens et al.(2000) fordownstream reaches of the Rivers Ouse and Tweed,UK, for which the contributions from channel banksources were approximately 37 and 39%, respec-tively. The increased importance of cultivated(approx. 20%) over uncultivated(pastureymoor-land) topsoil sources(ca. 7%) reflects the exis-tence of large areas of intensively cultivated landin close proximity to the sampling sites and thehigh rates of soil loss commonly associated withcultivated soils(cf. Morgan, 1986). The location
527J. Carter et al. / The Science of the Total Environment 314 –316 (2003) 513–534
Table 8Results of using the Kruskal–Wallis test to assess the abilityof each tracer property to discriminate between surface materialfrom uncultivated, cultivated and woodland areas, channelbank material, solids from STWs and road dust collected fromthe AireyCalder catchment
Tracer property H P
N 85.07 0.000C 77.29 0.000Pb 37.52 0.000Zn 47.89 0.000K 49.37 0.000Ca 38.19 0.000Mg 25.18 0.000Na 35.52 0.000Cu 39.36 0.000Al 44.78 0.000Total P 25.43 0.000Inorganic P 31.90 0.000Organic P 39.69 0.000Cs137 68.60 0.000Ra226 47.41 0.000
Unsupported Pb210 59.21 0.000
H significant at 7.82.
Table 9Results of using stepwise discriminant function analysis toidentify which combination of tracer properties provides thebest composite fingerprint for discriminating source materialson the basis of source type(i.e. surface material from culti-vated, uncultivated and woodland areas, channel bank material,solids from STWs and road dust)
Table 10Load-weighted mean contributions of each source type to the suspended sediment samples collected from Beal and Methley duringthe period November 1997–January 1999
of the main area of cultivated land in the lowerreaches of the catchment minimises conveyancelosses, such as those associated with floodplaindeposition. There was insufficient sediment sup-plied by woodland sources for its contribution tobe detected by the mixing model. This reflectsboth the limited extent of woodland in the catch-ment and the lack of erosion from such sources.Perhaps the most significant finding listed in Table10 is the relative importance of urban sources tothe suspended sediment samples collected at Beal.It is estimated that approximately 40% of thesuspended sediment that is transported in the RiverAire at Beal is derived from roads and STWswithin the urbanised part of the catchment. The
results for the River Calder at Methley are broadlysimilar to those for the River Aire at Beal, withthe main difference being an increase in contribu-tions of surface material from cultivated areas(45%) and a decrease in contributions from chan-nel banks(18%) compared to Beal. As with Beal,a significant amount(approx. 33%) of the sedi-ment load transported in the downstream reachesof the River Calder is derived from urban sources.The mean values shown in Table 10 again
conceal many inter- and intra-storm variations insediment source. Fig. 9 shows the source contri-butions for all the sediment samples collected.Insufficient samples were collected during thesummer months to permit investigation of seasonalvariations in sediment source. However, it is clearthat considerable variation exists between differentsamples. Such variations are most likely to reflectthe timing of sampling, as sediment is deliveredfrom different parts of the catchment at differentstages of the storm hydrograph. This is further
528 J. Carter et al. / The Science of the Total Environment 314 –316 (2003) 513–534
Fig. 9. Inter-storm variability in the relative contribution of surface material from uncultivated and cultivated areas, channel bankmaterial, road dust, and solids from STWs to suspended sediment collected from the lower reaches of the Rivers Aire and Calder.
Fig. 10. Variation in the relative contribution of surface material from uncultivated and cultivated areas, channel bank material, roaddust, and solids from STWs to suspended sediment samples collected from Beal during a storm event during 3–4 March 1998.
529J. Carter et al. / The Science of the Total Environment 314 –316 (2003) 513–534
Table 11Results of using the Mann–Whitney test to assess the abilityof each tracer property to discriminate between sediment col-lected from Methley and Allerton
Tracer property P
N 0.035*
C 0.001*
As 0.690Pb 0.095Zn 1.000Cr 0.008*
K 0.548Ca 0.008*
Mn 1.151Mg 1.000Na 0.222Cu 0.320Al 0.095Fe 0.008*
Total P 0.393Inorganic P 0.786Organic P 0.036*
Cs137 0.030*
Ra226 0.019*
Unsupported Pb210 0.662
Significant atPs0.05.*
illustrated in Fig. 10, which shows the variation insediment sources during a storm event at Beal.During the rising limb of the hydrograph, therelative contribution of channel bank materialdominates, reflecting the entrainment of exposedbank material. As the discharge increases, therelative contribution of bank sources decreases,probably due to dilution with other sources, andthe contribution of topsoil from cultivated areasand road dust increases. The increase in contribu-tions from cultivated topsoil reflects the higherosion rates and sediment delivery associated withthis land use and its close proximity to the sam-pling site (relative to pastureymoorland areas).The increase in the relative contribution of roaddust reflects the increase in the connectivity of theroad network to the channel system as the stormprogresses. The decrease in the relative contribu-tions of solids from STWs during the hydrographmay reflect the dilution of sediment derived fromsuch sources by that from more distal parts of thecatchment, including pasture topsoil, the contribu-tion of which only becomes significant during thefalling limb of the hydrograph. Fig. 10 demon-strates that variations in the relative contributionsof the main sources are controlled primarily by thelocation of the sources within the catchment rela-tive to the sampling site, with channel banks andSTWs contributing most sediment at the start ofthe event, and road dust and the surface materialfrom pastureymoorland areas contributing moretowards the middle and end of the event.
3.2.3. Spatial location (sub-basins)It is possible to compare suspended sediment
samples collected from the River Aire at Beal withthose collected from sites upstream of the Aire–Calder confluence in order to obtain informationon the relative contribution of the Rivers Aire andCalder to the suspended sediment load transporteddownstream of the confluence. The main advan-tage of such an approach(i.e. comparing suspend-ed sediment properties from different sites) is thatthe complications introduced by differences inparticle size composition and organic matter con-tent between source materials and sediments arereduced (cf. Walling et al., 1999). However,because no suspended sediment samples were col-
lected from the River Aire immediately upstreamof the confluence, floodplain deposits were usedin place of suspended sediment for the River Aireat Allerton. Because such deposits in essencerepresent suspended sediment deposited duringoverbank events, the property concentrations asso-ciated with overbank deposits should be represen-tative of those of suspended sediment at the samelocation, once particle size effects have been takeninto account. The floodplain deposits from Allertonwere characterised by a similar particle size to thesuspended sediment from Methley, but were, none-theless, corrected for particle size differences inthe same way as for the source materials. TheMann–Whitney U-test was used to assess theability of tracer properties to discriminate betweenthe two rivers(Table 11). Eight tracer parametersexhibit P-values below the significance value of0.05, indicating that they afford strong discrimi-nation between the two rivers. A multicomponentsignature containing Ca, C, Cr, Fe and organic Pwas subsequently identified as a fingerprint capa-ble of classifying 100% of the samples correctly
530 J. Carter et al. / The Science of the Total Environment 314 –316 (2003) 513–534
Table 12Results of using stepwise discriminant function analysis toidentify which combination of tracer properties provides thebest composite fingerprint for discriminating suspended sedi-ment samples collected from the River Calder at Methley andsamples of overbank sediment collected from the River Aireat Allerton
(Table 12). The numerical mixing model was usedto establish the load-weighted relative contributionof the two rivers to the individual suspendedsediment samples collected from Beal. The load-weighted mean contribution from the River Calderis 72%. This is higher than expected, as datapresented by Wass and Leeks(1999) suggest thatapproximately 55% of sediment delivered to thesite at Beal originates from the River Calder. Thedifference between the two estimates may partlyreflect the different periods of record involved,since the sediment samples were collected duringthe period November 1997–January 1999, whereasthe data presented by Wass and Leeks(1999)relate to the years 1994–1997. However, the dif-ferences may also reflect the timing of sedimentsampling in relation to the storm hydrograph, andthus bias introduced by the limited number ofsamples collected at Beal. Many of the suspendedsediment samples from Beal were collected closeto the hydrograph peak, and it is possible that atthis time, contributions from the River Calderdominated the sediment flux.Fig. 11 presents information on the variation of
the proportion of sediment originating from eachsub-catchment in relation to the hydrograph. It isclear, with the exception of the event on 10December 1997, that at the discharge peak thesediment is supplied primarily by the River Calder.The graph of the event on 3 March 1998 clearlyshows that the samples taken on the rising limbcontain the highest proportions of sediment from
the Aire sub-catchment. This can help to explainthe trend in source type contributions previouslydescribed(see Fig. 10). The first two sampleswere taken before the arrival of the peak sedimentload from the River Calder(Fig. 11) and reflectthe dominance of channel bank along the lengthof the Aire sub-catchment. The subsequent samplescoincide with the peak in the delivery of sedimentfrom the River Calder, and consequently consistof a greater proportion of cultivated topsoil fromthe southern tributaries of the River Calder.Most of the samples from Beal were collected
close to the hydrograph peak, and this may, there-fore, explain the apparent dominance of sedimentoriginating from the Calder sub-catchment. Thisexplanation can be further validated by comparingthe timing of the hydrograph peak at Methley withthat at Beal(Table 13). It is estimated that thetime taken for the discharge peak to travel fromMethley to Beal(17.5 km) is approximately 3–4h (EA, personal communication). Therefore, com-paring the time of peak discharge at Methley withthat at Beal, the peak discharge at Beal usuallyoccurs within 1–2 h of the expected arrival of theflow from the Calder sub-catchment. Consequently,as the suspended sediment concentration peaksalongside discharge at Methley, suspended sedi-ment sampled within 2 h of the discharge peak atBeal is likely to contain a large proportion ofsediment from the River Calder.
4. Conclusions
Statistically verified composite fingerprints,relating to both source materials and suspendedsediment and overbank deposits collected upstreamof the Aire-Calder confluence, and a multivariatemixing model have been used to identify the mainsources of the suspended sediment transported bythe River Aire and its primary tributary, the RiverCalder. Because of the polluted nature of the AireyCalder catchment and its effect on property con-centrations, it was necessary to divide thecatchment into upper and lower reaches in orderto produce the best composite fingerprint for eachsection of river. The mean contributions fromindividual source types(i.e. surface materials fromwoodland, uncultivated and cultivated areas, chan-
531J. Carter et al. / The Science of the Total Environment 314 –316 (2003) 513–534
Fig. 11. Intra-storm variations in the contribution of the Rivers Aire and Calder to the suspended sediment load supplied to thecatchment outlet at Beal.
nel banks, road dust and solids from STWs) variedbetween the upper and lower reaches of the rivers,reflecting the change in land use from largelypastureyrough grazing to an urban area and
increasing amounts of cultivated land. The sus-pended sediment transported in the upper reachesof the River Aire during the sampling periodoriginated primarily from channel bank sources
532 J. Carter et al. / The Science of the Total Environment 314 –316 (2003) 513–534
Table 13Timing of discharge peaks for the River Calder at Methley and the River Aire at Beal
Date of sampling Hydrograph peak
Time of peak discharge(h)
Methley Beal
Estimated Actual
11 December 1997 15:00(15:30) 18:00–19:00 21:00(14:30)3–4 January 1998 19:15(02:00) 22:15–23:15 02:15(06:30)4 March 1998 12:30(12:30) 15:30–16:30 15:15(17:15)17 October 1998 05:15(07:15) 08:15–09:15 10:00(08:30)17 January 1999 08:00(07:15) 11:00–12:00 12:00(10:30)
Times in parentheses represent the time of the peak in suspended sediment concentration.
(43–84%) and from uncultivated topsoil(16–57%), whereas in the lower reaches of the AireyCalder system, local sources of cultivated topsoilcontributed 20–45% of the suspended sedimentand there was a significant contribution from urbansources such as road dust(19–22%) and solidsfrom STWs(14–18%). In the upper reaches, theproportion of sediment derived from each of thetwo main geological areas corresponded broadlyto the proportion of the catchment occupied byeach geological area.The proportion of sediment derived from each
source type or geological area varied at all sites,both within and between storms, and this partlyrelates to the timing of sampling in relation to thestorm hydrograph. For example, there was a higherproportion of sediment originating from road dustat the end of events as it was flushed in fromurban sources. This highlights the problems asso-ciated with the use of spot samples of suspendedsediment to establish the relative importance of anumber of potential sediment sources. The resultsobtained for an individual suspended sedimentsample reflect the relative contributions of thevarious sources to the sediment represented by thatparticular sample, and therefore may not be rep-resentative of the entire flood event or the longerterm. For this reason, it is important to collect anumber of suspended sediment samples, encom-passing a range of discharge(especially thoseevents when most of the suspended sediment loadis transported) and antecedent conditions.
Despite their limitations, the results presentedabove serve to demonstrate the potential of thefingerprinting approach in establishing the relativecontributions of a number of sediment sources tothe suspended sediment load of a river, even whencomplicated by the presence of a large urbanisedand industrialised area. Traditional approaches toinvestigating source contributions(e.g. erosionplots and sediment load measurements) would notpermit an investigation of the contribution fromroad dust(or sewage inputs) or of the changes insediment source as the river flows downstreamthrough an urban and industrialised area. Thisstudy has quantified the contribution of agriculturaland urban sources to the suspended sediment loadtransported in an urbanised river. As such, it hasimportant implications for the management ofsediment, and associated nutrients and contami-nants, in urban river systems.
Acknowledgments
The work reported in this paper was undertakenas a collaborative project involving the Departmentof Geography at the University of Exeter andCEH, Wallingford, within the framework of theNERC Environmental Diagnostics Research Pro-gramme. It was supported by a postgraduate stu-dentship (JC) and a research grant(GSTy03y1574) and this funding is gratefully acknowledged.Thanks are also extended to Scott Lewis forhelping with fieldwork, to Art Ames for assistance
533J. Carter et al. / The Science of the Total Environment 314 –316 (2003) 513–534
with laboratory analysis and to Helen Jones forproducing the diagrams.
References
Allen SE. Chemical Analysis of Ecological Materials. Oxford:Blackwell, 1989.
Bottrill LJ, Walling DE, Leeks GJL. Geochemical character-istics of overbank deposits and their potential for determin-ing suspended sediment provenance; an example from theRiver Severn, UK. In: Marriott SB, Alexander J, editors.Floodplains: interdisciplinary approaches. Special Publica-tion 163. London: Geological Society, 1999. p. 241–257.
Carton J, Walling DE, Owens PN, Leeks GJL. Spatial andtemporal variability of the chromium content of suspendedand flood-plain sediment in the River Aire, Yorkshire, UK.In: Stone M, editor. The role of erosion and sedimenttransport in nutrient and contaminant transfer. IAHS Publi-cation 263. Wallingford: IAHS Press, 2000. p. 219–226.
Charlesworth SM, Lees JA. The application of some mineralmagnetic measurements and heavy metal analysis for char-acterising fine sediments in an urban catchment, Coventry,UK. J Appl Geophys 2001;48:113–125.
Charlesworth SM, Ormerod LM, Lees JA. Tracing sedimentswithin urban catchments using heavy metal, mineral mag-netic and radionuclide signatures. In: Foster IDL, editor.Tracers in geomorphology. Chichester: John Wiley and SonsLtd, 2000. p. 345–368.
Collins AL, Walling DE. Selecting fingerprint properties fordiscriminating potential suspended sediment sources in riverbasins. J Hydrol 2002;261:218–244.
Collins AL, Walling DE, Leeks GJL. Use of compositefingerprints to determine the provenance of the contempo-rary suspended sediment load transported by rivers. EarthSurf Process Landforms 1998;23:31–52.
Collins AL, Walling DE, Sichingabula HM, Leeks GJL.Suspended sediment source fingerprinting in a small tropicalcatchment and some management implications. Appl Geogr2001;21:387–412.
Dietrich WE, Dunne T. Sediment budget for a small catchmentin mountainous terrain. Z Geomorphol 1978;29:191–206.
He Q, Owens PN. Determination of suspended sedimentprovenance using caesium-137, unsupported lead-210 andradium-226: a numerical mixing model approach. In: FosterIDL, Gurnell AM, Webb BW, editors. Sediment and waterquality in river catchments. Chichester: John Wiley andSons Ltd, 1995. p. 207–227.
Horowitz AJ. A primer to trace-element chemistry. Michigan,USA: Lewis Publishers, 1991.
Johnson AG, Kelley JT. Temporal, spatial and textural variationin the mineralogy of Mississippi River suspended sediment.J Sediment Petrol 1984;54:67–72.
Klages MG, Hsieh YP. Suspended solids carried by the GallatinRiver of southwestern Montana II. Using mineralogy forinferring sources. J Environ Qual 1975;4:68–73.
Lambert CP, Walling DE. Floodplain sedimentation: a prelim-inary investigation of contemporary deposition within thelower reaches of the River Culm, Devon, UK. Geogr Ann1987;69A:393–404.
Loughran RJ, Campbell BL. The identification of catchmentsediment sources. In: Foster I, Gurnell A, Webb B, editors.Sediment and water quality in river catchments. Chichester:John Wiley and Sons Ltd, 1995. p. 189–205.
Mehta NC, Legg JO, Goring CAI, Black CA. Determinationof organic phosphorus in soils: I. Extraction methods. SoilSci Soc Am J 1954;18:443–449.
Morgan RPC. Soil erosion and conservation. UK: Longmans,1986.
Neal C, Jarvie HP, Oguchi T. Acid-available particulate tracemetals associated with suspended sediment in the Humberrivers: a regional assessment. Hydrol Process1999;13:1117–1136.
Natural Environment Research Council. http:yywww.nerc-wallingford.ac.ukyihynrfaystation_summaries, 28 September2001.
Oldfield F, Rummery TA, Thompson R, Walling DE. Identifi-cation of suspended sediment sources by means of mineralmagnetic measurements: some preliminary results. WaterResour Res 1979;15:211–219.
Owens PN, Walling DE. The phosphorus content of fluvialsediment in rural and industrialised river basins. Water Res2002;36:685–701.
Owens PN, Walling DE, Leeks GJL. Tracing fluvial suspendedsediment sources in the catchment of the River Tweed,Scotland, using composite fingerprints and a numericalmixing model. In: Foster IDL, editor. Tracers in geomor-phology. Chichester: John Wiley and Sons Ltd, 2000. p.291–308.
Owens PN, Walling DE, Carton J, Meharg AA, Wright J,Leeks GJL. Downstream changes in the transport andstorage of sediment-associated contaminants(P, Cr andPCBs) in agricultural and industrialised basins. Sci TotalEnviron 2001;266:177–186.
Peart M, Walling DE. Fingerprinting sediment source: theexample of a drainage basin in Devon, UK. In: Hadley RF,editor. Drainage basin sediment delivery. IAHS Publication159. Wallingford: IAHS Press, 1986. p. 41–55.
Russell MA, Walling DE, Hodgkinson RA. Suspended sedi-ment sources in two small lowland agricultural catchmentsin the UK. J Hydrol 2001;252:1–24.
Slattery MC, Walden J, Burt TP. Use of mineral magneticmeasurements to fingerprint suspended sediment sources:results from a linear mixing model. In: Foster IDL, editor.Tracers in geomorphology. Chichester: John Wiley and SonsLtd, 2000. p. 309–322.
Stone M, Marsalek J. Trace metal composition and speciationin street sediment: Sault Ste. Marie, Canada. Water Air SoilPollut 1996;87:149–169.
534 J. Carter et al. / The Science of the Total Environment 314 –316 (2003) 513–534
Wall GJ, Wilding LP. Mineralogy and related parameters offluvial suspended sediment samples in Northwestern Ohio.J Environ Qual 1976;5:168–173.
Walling DE, Webb BW. Patterns of sediment yield. In: GregoryKJ, editor. Background to palaeohydrology. Chichester: JohnWiley and Sons Ltd, 1983. p. 69–100.
Walling DE, Woodward JC. Use of radiometric fingerprints toderive information on suspended sediment sources. In:Bogen J, Walling DE, Day T, editors. Erosion and sedimenttransport monitoring programmes in river basins. IAHSPublication 210. Wallingford: IAHS Press, 1992. p. 153–164.
Walling DE, Woodward JC. Tracing sources of suspendedsediment in river basins: a case study of the River Culm,Devon, UK. J Mar Freshwater Res 1995;46:327–336.
Walling DE, Owens PN, Leeks GJL. Fingerprinting suspendedsediment sources in the catchment of the River Ouse,Yorkshire, UK. Hydrol Process 1999;13:955–975.
Walling DE, Owens PN, Waterfall BD, Leeks GJL, Wass PD.The particle size characteristics of fluvial suspended sedi-ment in the Humber and Tweed catchments, UK. Sci TotalEnviron 2000;251y252:205–222.
Wass PD, Leeks GJL. Suspended sediment fluxes in theHumber catchment, UK. Hydrol Process 1999;13:935–953.