Finite element analysis for dental prosthetic design 61 X Finite element analysis for dental prosthetic design Akikazu Shinya, DDS, PhD Department of Crown and Bridge, School of Life Dentistry at Tokyo, The Nippon Dental University, Japan, Honorary Assistant Professor, Dental Materials Science Unit, Faculty of Dentistry, The University of Hong Kon and Research scientist, Department of Biomaterials Science, Institute of Dentistry and BioCity Turku Biomaterials Research Program, University of Turku Daiichiro Yokoyama, DDS, PhD Department of Crown and Bridge, School of Life Dentistry at Tokyo, The Nippon Dental University, 1-9-20 Fujimi, Chiyoda-ku, Tokyo 102-8158, Japan. 1. Background There is a limited amount of dental research which is focused on the aforementioned aspects. In a finite element (FE) analysis, a large structure is divided into a number of small simple shaped elements, for which individual deformation (strain and stress) can be more easily calculated than for the whole undivided large structure. Using the traditional biophysical knowledge database in a rational validation process 1) , the use of FE analysis in the dental field has been significantly refined during the last decade 2-9) . However, fixed prosthesis cannot be assimilated to a simplified geometric representation due to both their anatomical shape and layered structure. Sophisticated techniques have therefore been developed to refine geometry acquisition, such as the recreation and digitization of planar outlines. In general, a 3D FE modeling is a complicated process which is often the most time-consuming for the scientists. In addition, this process is prone to errors and simplifications which may induce faulty predictions. Hybrid composite are clinically applicable to inlays, onlays ,crowns and by the recent experiences of fiber reinforced composites (FRC) composite resins have created a new era in metal-free, esthetic dentistry 10-13) . (Figure 1 and 2) The most commonly used FRC contains continuous unidirectional glass fibers, typically E (electrical) glass embedded in dimethacrylate or semi-IPN (interpenetrating polymer network) matrix of dimethacrylate and polymethylmethacrylate. Flexural modulus of metal alloys is generally higher than that of FRC. However, there are differences in flexural modulus between FRC as well. Highly cross-linked polymer matrix made of dimetharylates provides higher flexural modulus for FRC than obtained with semi-IPN matrix with similar fibers. It has been suggested that there are two factors which explain the better clinical function of FRC FPD compared to their metal alloy framework counterparts. Firstly, there are studies showing that composite resins adhere initially better to the FRC framework with semi-IPN matrix than to the metal alloys. 3 www.intechopen.com
Transcript
Finite element analysis for dental prosthetic design 61
Finite element analysis for dental prosthetic design
Akikazu Shinya and Daiichiro Yokoyama
X
Finite element analysis for dental prosthetic design
Akikazu Shinya, DDS, PhD
Department of Crown and Bridge, School of Life Dentistry at Tokyo, The Nippon Dental University, Japan, Honorary Assistant Professor, Dental Materials Science Unit, Faculty
of Dentistry, The University of Hong Kon and Research scientist, Department of Biomaterials Science, Institute of Dentistry and BioCity Turku Biomaterials Research
Program, University of Turku Daiichiro Yokoyama, DDS, PhD
Department of Crown and Bridge, School of Life Dentistry at Tokyo, The Nippon Dental University, 1-9-20 Fujimi, Chiyoda-ku, Tokyo 102-8158, Japan.
1. Background There is a limited amount of dental research which is focused on the aforementioned aspects. In a finite element (FE) analysis, a large structure is divided into a number of small simple shaped elements, for which individual deformation (strain and stress) can be more easily calculated than for the whole undivided large structure. Using the traditional biophysical knowledge database in a rational validation process1), the use of FE analysis in the dental field has been significantly refined during the last decade2-9). However, fixed prosthesis cannot be assimilated to a simplified geometric representation due to both their anatomical shape and layered structure. Sophisticated techniques have therefore been developed to refine geometry acquisition, such as the recreation and digitization of planar outlines. In general, a 3D FE modeling is a complicated process which is often the most time-consuming for the scientists. In addition, this process is prone to errors and simplifications which may induce faulty predictions. Hybrid composite are clinically applicable to inlays, onlays,crowns and by the recent experiences of fiber reinforced composites (FRC) composite resins have created a new era in metal-free, esthetic dentistry10-13). (Figure 1 and 2) The most commonly used FRC contains continuous unidirectional glass fibers, typically E (electrical) glass embedded in dimethacrylate or semi-IPN (interpenetrating polymer network) matrix of dimethacrylate and polymethylmethacrylate. Flexural modulus of metal alloys is generally higher than that of FRC. However, there are differences in flexural modulus between FRC as well. Highly cross-linked polymer matrix made of dimetharylates provides higher flexural modulus for FRC than obtained with semi-IPN matrix with similar fibers. It has been suggested that there are two factors which explain the better clinical function of FRC FPD compared to their metal alloy framework counterparts. Firstly, there are studies showing that composite resins adhere initially better to the FRC framework with semi-IPN matrix than to the metal alloys.
3
www.intechopen.com
Finite Element Analysis62
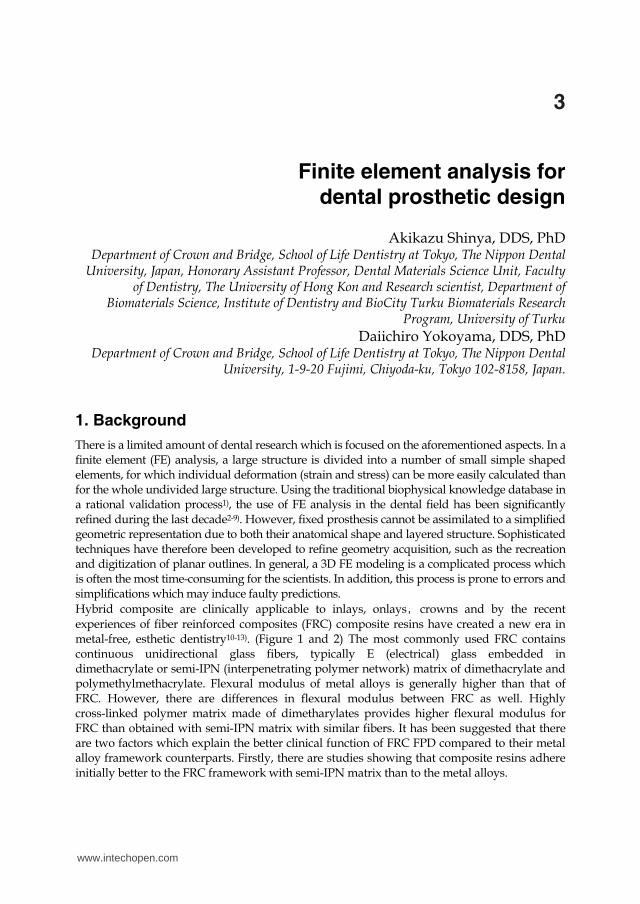
Fig. 1. FRC-FPDs in the region of the maxillary left lateral incisor.
The clinical applications for FRC have been investigated from different points of view in terms of the quantity of fiber for reinforcement, matrix coupling, biocompatibility, fatigue property, the type of fiber and bending strength with various testing methods 14-27). Designs for fiber framework for posterior FPD have been extensively investigated using FE method and FE analysis, clarifying that the reinforcement effects differ and depend on the position of the fiber framework 8,28). The structure of framework of FRC FPD consists of (1) main framework which supports the FPD against vertical loads, (2) Bonding wings or full-coverage crowns on abutments which increase resistance against dislodgement, and (3) of additional fibers placed to support pontic against delamination. In anterior region, curving the main framework labially could provide alternative for using additional fibers. Anterior and posterior teeth play different roles in masticatory movement. While chewing, the maxillary and mandibular anterior teeth come into contact in the edge-to-edge occlusal position, after a sliding movement on the lingual surface, and then progress into the intercuspal position. Prosthetic appliances placed in the anterior region are subjected to the influence of the diverse occlusal contacts of maxillary and mandibular teeth, as well as to the occlusal force of the masticatory movement. Due to the different crown contours and loading conditions, the mechanical behavior of FRC-FPD in the anterior region is quite different from that of the posterior region. The present study investigated the design of FRC framework in order to obtain it’s maximum reinforcement effect for anterior and posterior FRC FPD.
Fig. 2. Frontal view of the same patent.
2. Mechanical approach for designing of an anterior FRC FPD
Introduction
The optimal design of an FRC framework was obtained the maximum reinforcement for anterior FPD. FRC frameworks were designed using three different variations in the pontic. The results were compared with the control, a hybrid composite FPD without any fiber reinforcement, using the 3-D FE method. Materials and Methods Definition of structures: Preparation of the C-FPD FE Model To create an FE model, a three-unit FPD replica of the maxillary right central incisor to maxillary right canine replacing the maxillary right lateral incisor was fabricated. The replica (D51-SC41, Nisshin) was made in accordance with the Textbook of Dental Anatomy
29) and the following anatomic measurements were used: mesiodistal distance of the FPD (23.5 mm) and crown length (11.0 mm). Preparation designs are shown in Figure 3. A 1mm circumferential reduction shoulder preparation and a 2-mm incisal reduction were prepared for an assumed jacket crown. Because cementum, periodontal regiment, and alveolar bone were thought to have only a slight influence on the magnitude and distribution of stresses, they were ignored and a complete FPD-abutment interface was established.30–33) A replica was measured at 0.25-mm intervals using a 3-D dental computer-aided design unit (Dental Cadim, ADVANCE) and the contact scanning method. The preprocessor of an FE analysis program (ANSYS 10.0, ANSYS) generated point clouds describing the replica surface, which were used as input data for the FE model (Figure 4).
Fig. 3. The size of the abutment equipment (left) Maxillary right central incisor; (right) maxillary right canine.
www.intechopen.com
Finite element analysis for dental prosthetic design 63
Fig. 1. FRC-FPDs in the region of the maxillary left lateral incisor.
The clinical applications for FRC have been investigated from different points of view in terms of the quantity of fiber for reinforcement, matrix coupling, biocompatibility, fatigue property, the type of fiber and bending strength with various testing methods 14-27). Designs for fiber framework for posterior FPD have been extensively investigated using FE method and FE analysis, clarifying that the reinforcement effects differ and depend on the position of the fiber framework 8,28). The structure of framework of FRC FPD consists of (1) main framework which supports the FPD against vertical loads, (2) Bonding wings or full-coverage crowns on abutments which increase resistance against dislodgement, and (3) of additional fibers placed to support pontic against delamination. In anterior region, curving the main framework labially could provide alternative for using additional fibers. Anterior and posterior teeth play different roles in masticatory movement. While chewing, the maxillary and mandibular anterior teeth come into contact in the edge-to-edge occlusal position, after a sliding movement on the lingual surface, and then progress into the intercuspal position. Prosthetic appliances placed in the anterior region are subjected to the influence of the diverse occlusal contacts of maxillary and mandibular teeth, as well as to the occlusal force of the masticatory movement. Due to the different crown contours and loading conditions, the mechanical behavior of FRC-FPD in the anterior region is quite different from that of the posterior region. The present study investigated the design of FRC framework in order to obtain it’s maximum reinforcement effect for anterior and posterior FRC FPD.
Fig. 2. Frontal view of the same patent.
2. Mechanical approach for designing of an anterior FRC FPD
Introduction
The optimal design of an FRC framework was obtained the maximum reinforcement for anterior FPD. FRC frameworks were designed using three different variations in the pontic. The results were compared with the control, a hybrid composite FPD without any fiber reinforcement, using the 3-D FE method. Materials and Methods Definition of structures: Preparation of the C-FPD FE Model To create an FE model, a three-unit FPD replica of the maxillary right central incisor to maxillary right canine replacing the maxillary right lateral incisor was fabricated. The replica (D51-SC41, Nisshin) was made in accordance with the Textbook of Dental Anatomy
29) and the following anatomic measurements were used: mesiodistal distance of the FPD (23.5 mm) and crown length (11.0 mm). Preparation designs are shown in Figure 3. A 1mm circumferential reduction shoulder preparation and a 2-mm incisal reduction were prepared for an assumed jacket crown. Because cementum, periodontal regiment, and alveolar bone were thought to have only a slight influence on the magnitude and distribution of stresses, they were ignored and a complete FPD-abutment interface was established.30–33) A replica was measured at 0.25-mm intervals using a 3-D dental computer-aided design unit (Dental Cadim, ADVANCE) and the contact scanning method. The preprocessor of an FE analysis program (ANSYS 10.0, ANSYS) generated point clouds describing the replica surface, which were used as input data for the FE model (Figure 4).
Fig. 3. The size of the abutment equipment (left) Maxillary right central incisor; (right) maxillary right canine.
www.intechopen.com
Finite Element Analysis64
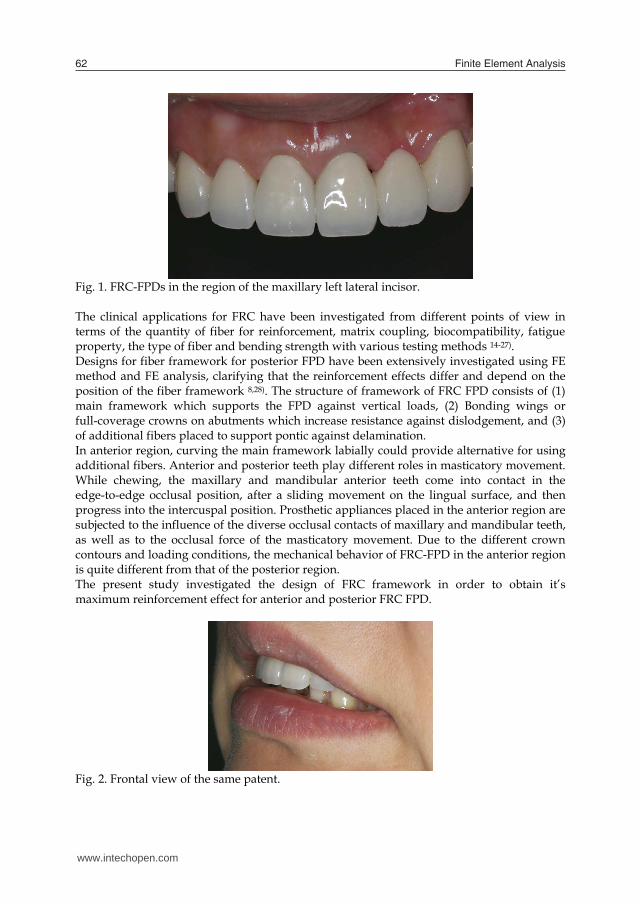
Fig. 4. External form of the FPD FE model (lingual view).
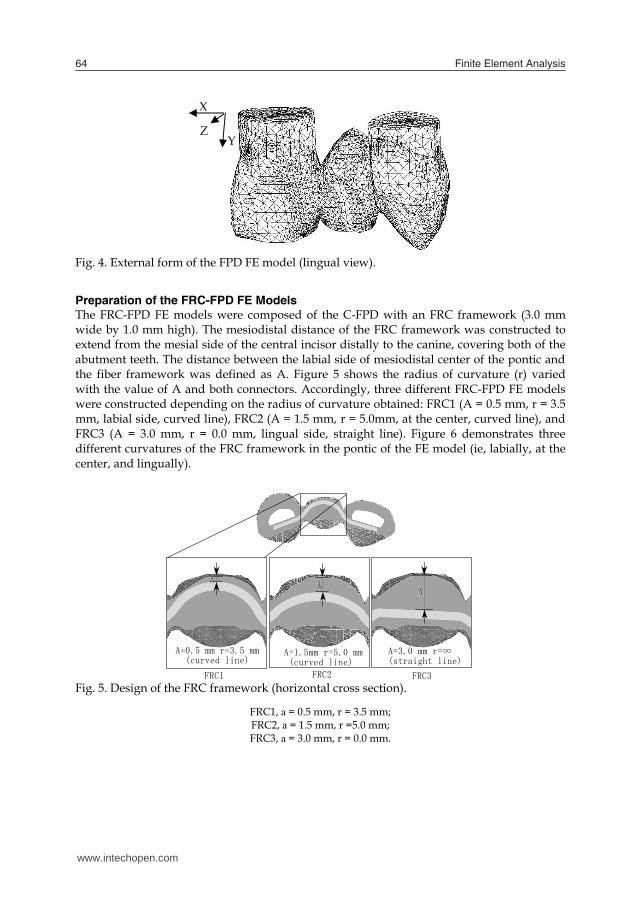
Preparation of the FRC-FPD FE Models The FRC-FPD FE models were composed of the C-FPD with an FRC framework (3.0 mm wide by 1.0 mm high). The mesiodistal distance of the FRC framework was constructed to extend from the mesial side of the central incisor distally to the canine, covering both of the abutment teeth. The distance between the labial side of mesiodistal center of the pontic and the fiber framework was defined as A. Figure 5 shows the radius of curvature (r) varied with the value of A and both connectors. Accordingly, three different FRC-FPD FE models were constructed depending on the radius of curvature obtained: FRC1 (A = 0.5 mm, r = 3.5 mm, labial side, curved line), FRC2 (A = 1.5 mm, r = 5.0mm, at the center, curved line), and FRC3 (A = 3.0 mm, r = 0.0 mm, lingual side, straight line). Figure 6 demonstrates three different curvatures of the FRC framework in the pontic of the FE model (ie, labially, at the center, and lingually).
A=0.5 mm r=3.5 mm
(curved line)
A=1.5mm r=5.0 mm
(curved line)
A=3.0 mm r=∞
(straight line)
FRC1 FRC2FRC3
Fig. 5. Design of the FRC framework (horizontal cross section).
FRC1, a = 0.5 mm, r = 3.5 mm; FRC2, a = 1.5 mm, r =5.0 mm; FRC3, a = 3.0 mm, r = 0.0 mm.
X Z Y
ab c
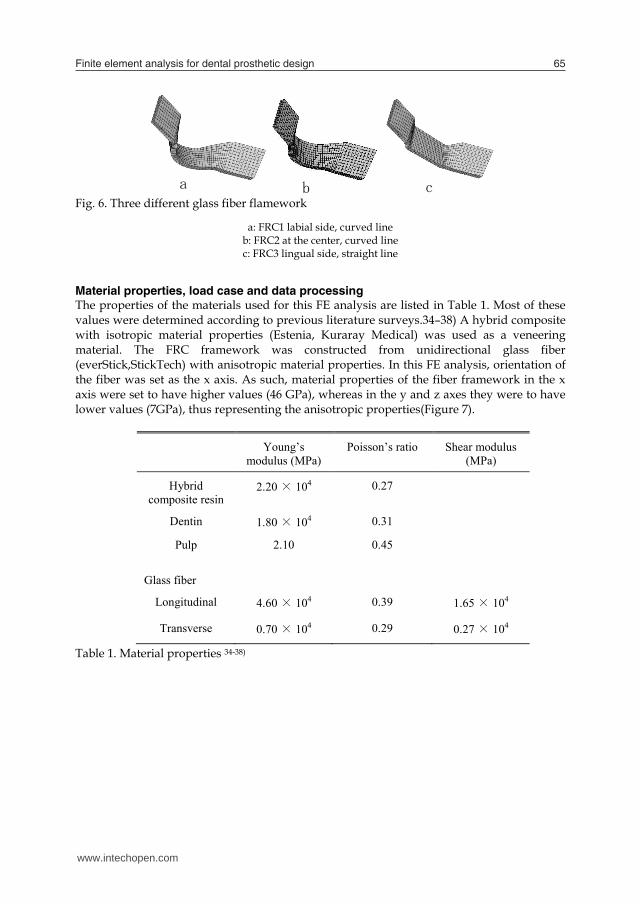
Fig. 6. Three different glass fiber flamework
a: FRC1 labial side, curved line b: FRC2 at the center, curved line c: FRC3 lingual side, straight line
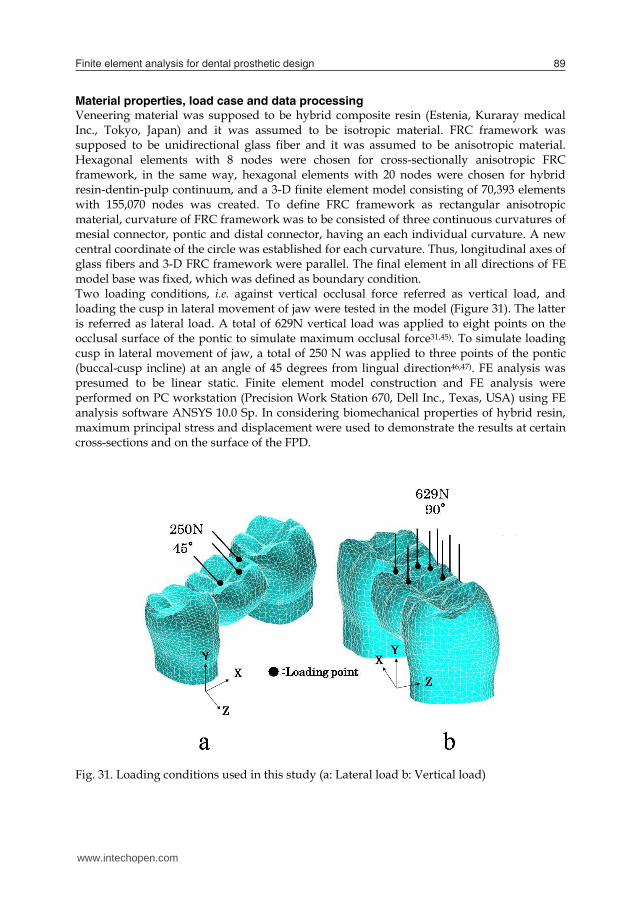
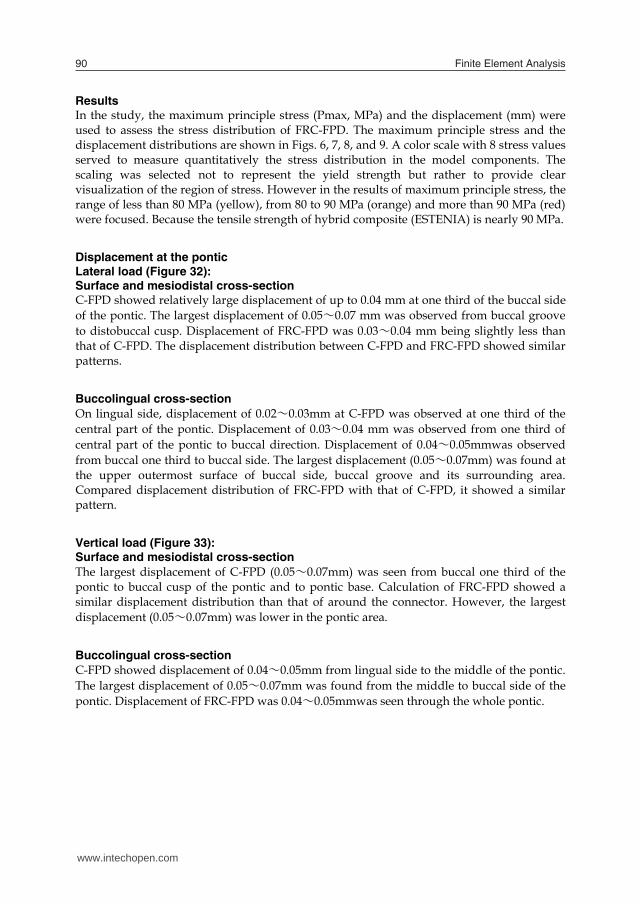
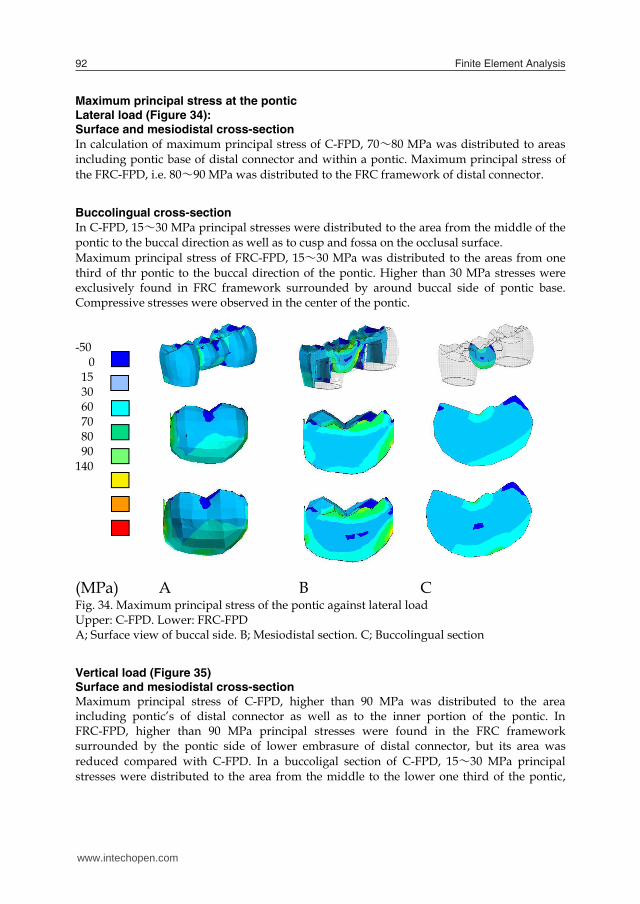
Material properties, load case and data processing The properties of the materials used for this FE analysis are listed in Table 1. Most of these values were determined according to previous literature surveys.34–38) A hybrid composite with isotropic material properties (Estenia, Kuraray Medical) was used as a veneering material. The FRC framework was constructed from unidirectional glass fiber (everStick,StickTech) with anisotropic material properties. In this FE analysis, orientation of the fiber was set as the x axis. As such, material properties of the fiber framework in the x axis were set to have higher values (46 GPa), whereas in the y and z axes they were to have lower values (7GPa), thus representing the anisotropic properties(Figure 7).
Young’s modulus (MPa)
Poisson’s ratio Shear modulus (MPa)
Hybrid composite resin
2.20 × 10⁴ 0.27
Dentin 1.80 × 10⁴ 0.31
Pulp 2.10 0.45
Glass fiber
Longitudinal 4.60 × 10⁴ 0.39 1.65 × 10⁴
Transverse 0.70 × 10⁴ 0.29 0.27 × 10⁴
Table 1. Material properties 34-38)
www.intechopen.com
Finite element analysis for dental prosthetic design 65
Fig. 4. External form of the FPD FE model (lingual view).
Preparation of the FRC-FPD FE Models The FRC-FPD FE models were composed of the C-FPD with an FRC framework (3.0 mm wide by 1.0 mm high). The mesiodistal distance of the FRC framework was constructed to extend from the mesial side of the central incisor distally to the canine, covering both of the abutment teeth. The distance between the labial side of mesiodistal center of the pontic and the fiber framework was defined as A. Figure 5 shows the radius of curvature (r) varied with the value of A and both connectors. Accordingly, three different FRC-FPD FE models were constructed depending on the radius of curvature obtained: FRC1 (A = 0.5 mm, r = 3.5 mm, labial side, curved line), FRC2 (A = 1.5 mm, r = 5.0mm, at the center, curved line), and FRC3 (A = 3.0 mm, r = 0.0 mm, lingual side, straight line). Figure 6 demonstrates three different curvatures of the FRC framework in the pontic of the FE model (ie, labially, at the center, and lingually).
A=0.5 mm r=3.5 mm
(curved line)
A=1.5mm r=5.0 mm
(curved line)
A=3.0 mm r=∞
(straight line)
FRC1 FRC2FRC3
Fig. 5. Design of the FRC framework (horizontal cross section).
FRC1, a = 0.5 mm, r = 3.5 mm; FRC2, a = 1.5 mm, r =5.0 mm; FRC3, a = 3.0 mm, r = 0.0 mm.
X Z Y
ab c
Fig. 6. Three different glass fiber flamework
a: FRC1 labial side, curved line b: FRC2 at the center, curved line c: FRC3 lingual side, straight line
Material properties, load case and data processing The properties of the materials used for this FE analysis are listed in Table 1. Most of these values were determined according to previous literature surveys.34–38) A hybrid composite with isotropic material properties (Estenia, Kuraray Medical) was used as a veneering material. The FRC framework was constructed from unidirectional glass fiber (everStick,StickTech) with anisotropic material properties. In this FE analysis, orientation of the fiber was set as the x axis. As such, material properties of the fiber framework in the x axis were set to have higher values (46 GPa), whereas in the y and z axes they were to have lower values (7GPa), thus representing the anisotropic properties(Figure 7).
Young’s modulus (MPa)
Poisson’s ratio Shear modulus (MPa)
Hybrid composite resin
2.20 × 10⁴ 0.27
Dentin 1.80 × 10⁴ 0.31
Pulp 2.10 0.45
Glass fiber
Longitudinal 4.60 × 10⁴ 0.39 1.65 × 10⁴
Transverse 0.70 × 10⁴ 0.29 0.27 × 10⁴
Table 1. Material properties 34-38)
www.intechopen.com
Finite Element Analysis66
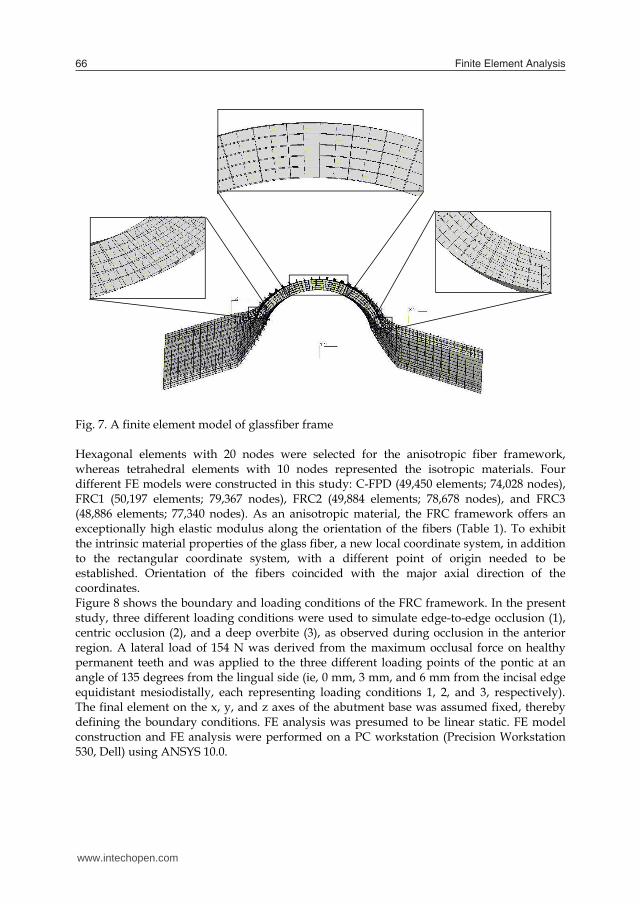
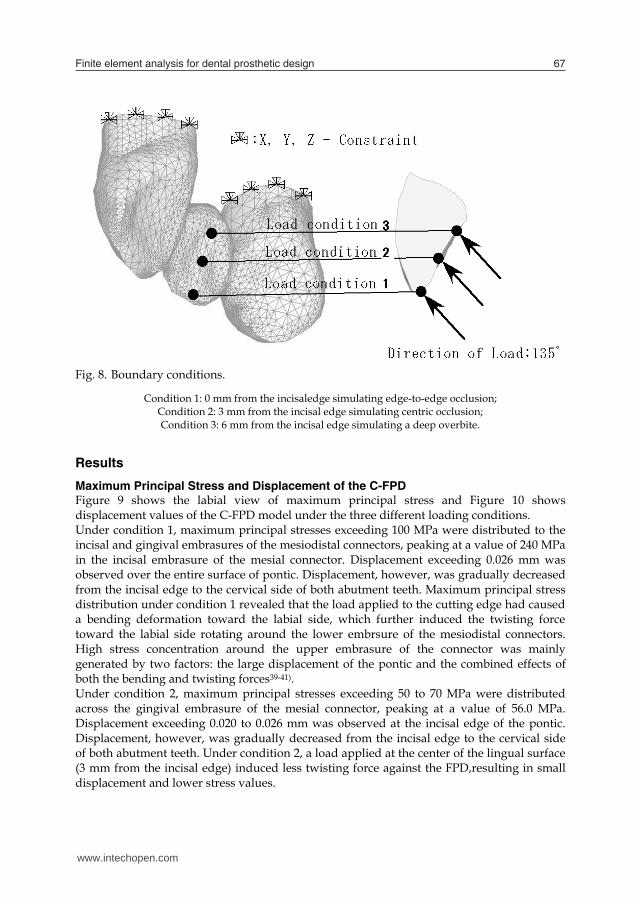
Fig. 7. A finite element model of glassfiber frame Hexagonal elements with 20 nodes were selected for the anisotropic fiber framework, whereas tetrahedral elements with 10 nodes represented the isotropic materials. Four different FE models were constructed in this study: C-FPD (49,450 elements; 74,028 nodes), FRC1 (50,197 elements; 79,367 nodes), FRC2 (49,884 elements; 78,678 nodes), and FRC3 (48,886 elements; 77,340 nodes). As an anisotropic material, the FRC framework offers an exceptionally high elastic modulus along the orientation of the fibers (Table 1). To exhibit the intrinsic material properties of the glass fiber, a new local coordinate system, in addition to the rectangular coordinate system, with a different point of origin needed to be established. Orientation of the fibers coincided with the major axial direction of the coordinates. Figure 8 shows the boundary and loading conditions of the FRC framework. In the present study, three different loading conditions were used to simulate edge-to-edge occlusion (1), centric occlusion (2), and a deep overbite (3), as observed during occlusion in the anterior region. A lateral load of 154 N was derived from the maximum occlusal force on healthy permanent teeth and was applied to the three different loading points of the pontic at an angle of 135 degrees from the lingual side (ie, 0 mm, 3 mm, and 6 mm from the incisal edge equidistant mesiodistally, each representing loading conditions 1, 2, and 3, respectively). The final element on the x, y, and z axes of the abutment base was assumed fixed, thereby defining the boundary conditions. FE analysis was presumed to be linear static. FE model construction and FE analysis were performed on a PC workstation (Precision Workstation 530, Dell) using ANSYS 10.0.
Fig. 8. Boundary conditions.
Condition 1: 0 mm from the incisaledge simulating edge-to-edge occlusion; Condition 2: 3 mm from the incisal edge simulating centric occlusion; Condition 3: 6 mm from the incisal edge simulating a deep overbite.
Results
Maximum Principal Stress and Displacement of the C-FPD Figure 9 shows the labial view of maximum principal stress and Figure 10 shows displacement values of the C-FPD model under the three different loading conditions. Under condition 1, maximum principal stresses exceeding 100 MPa were distributed to the incisal and gingival embrasures of the mesiodistal connectors, peaking at a value of 240 MPa in the incisal embrasure of the mesial connector. Displacement exceeding 0.026 mm was observed over the entire surface of pontic. Displacement, however, was gradually decreased from the incisal edge to the cervical side of both abutment teeth. Maximum principal stress distribution under condition 1 revealed that the load applied to the cutting edge had caused a bending deformation toward the labial side, which further induced the twisting force toward the labial side rotating around the lower embrsure of the mesiodistal connectors. High stress concentration around the upper embrasure of the connector was mainly generated by two factors: the large displacement of the pontic and the combined effects of both the bending and twisting forces39-41). Under condition 2, maximum principal stresses exceeding 50 to 70 MPa were distributed across the gingival embrasure of the mesial connector, peaking at a value of 56.0 MPa. Displacement exceeding 0.020 to 0.026 mm was observed at the incisal edge of the pontic. Displacement, however, was gradually decreased from the incisal edge to the cervical side of both abutment teeth. Under condition 2, a load applied at the center of the lingual surface (3 mm from the incisal edge) induced less twisting force against the FPD,resulting in small displacement and lower stress values.
www.intechopen.com
Finite element analysis for dental prosthetic design 67
Fig. 7. A finite element model of glassfiber frame Hexagonal elements with 20 nodes were selected for the anisotropic fiber framework, whereas tetrahedral elements with 10 nodes represented the isotropic materials. Four different FE models were constructed in this study: C-FPD (49,450 elements; 74,028 nodes), FRC1 (50,197 elements; 79,367 nodes), FRC2 (49,884 elements; 78,678 nodes), and FRC3 (48,886 elements; 77,340 nodes). As an anisotropic material, the FRC framework offers an exceptionally high elastic modulus along the orientation of the fibers (Table 1). To exhibit the intrinsic material properties of the glass fiber, a new local coordinate system, in addition to the rectangular coordinate system, with a different point of origin needed to be established. Orientation of the fibers coincided with the major axial direction of the coordinates. Figure 8 shows the boundary and loading conditions of the FRC framework. In the present study, three different loading conditions were used to simulate edge-to-edge occlusion (1), centric occlusion (2), and a deep overbite (3), as observed during occlusion in the anterior region. A lateral load of 154 N was derived from the maximum occlusal force on healthy permanent teeth and was applied to the three different loading points of the pontic at an angle of 135 degrees from the lingual side (ie, 0 mm, 3 mm, and 6 mm from the incisal edge equidistant mesiodistally, each representing loading conditions 1, 2, and 3, respectively). The final element on the x, y, and z axes of the abutment base was assumed fixed, thereby defining the boundary conditions. FE analysis was presumed to be linear static. FE model construction and FE analysis were performed on a PC workstation (Precision Workstation 530, Dell) using ANSYS 10.0.
Fig. 8. Boundary conditions.
Condition 1: 0 mm from the incisaledge simulating edge-to-edge occlusion; Condition 2: 3 mm from the incisal edge simulating centric occlusion; Condition 3: 6 mm from the incisal edge simulating a deep overbite.
Results
Maximum Principal Stress and Displacement of the C-FPD Figure 9 shows the labial view of maximum principal stress and Figure 10 shows displacement values of the C-FPD model under the three different loading conditions. Under condition 1, maximum principal stresses exceeding 100 MPa were distributed to the incisal and gingival embrasures of the mesiodistal connectors, peaking at a value of 240 MPa in the incisal embrasure of the mesial connector. Displacement exceeding 0.026 mm was observed over the entire surface of pontic. Displacement, however, was gradually decreased from the incisal edge to the cervical side of both abutment teeth. Maximum principal stress distribution under condition 1 revealed that the load applied to the cutting edge had caused a bending deformation toward the labial side, which further induced the twisting force toward the labial side rotating around the lower embrsure of the mesiodistal connectors. High stress concentration around the upper embrasure of the connector was mainly generated by two factors: the large displacement of the pontic and the combined effects of both the bending and twisting forces39-41). Under condition 2, maximum principal stresses exceeding 50 to 70 MPa were distributed across the gingival embrasure of the mesial connector, peaking at a value of 56.0 MPa. Displacement exceeding 0.020 to 0.026 mm was observed at the incisal edge of the pontic. Displacement, however, was gradually decreased from the incisal edge to the cervical side of both abutment teeth. Under condition 2, a load applied at the center of the lingual surface (3 mm from the incisal edge) induced less twisting force against the FPD,resulting in small displacement and lower stress values.
www.intechopen.com
Finite Element Analysis68
Under condition 3, maximum principal stresses exceeding100 MPa were distributed to the gingival embrasure of the mesiodistal connectors, peaking at avalue of 189 MPa in the gingival embrasure of the mesial connector. Displacement exceeding 0.026 mm was observed on the pontic base. Displacement, how-ever, was gradually decreased toward the incisal edge. Under condition 3, a large displacement was observed around the pontic base, which was mainly induced by the turning behavior of the pontic when it rotated around the upper embrasure of the mesiodistal connectors. High stress concentrations around the lower embrasure of the connector might be induced by the twisting behavior with the connector as a fixed point. Concerning displacement of both abutment teeth, displacementwas found to occur only on the side adjacent to the edentulous space. In the C-FPD, a localized high stress concentration was observed in the connector area under all loading conditions, which might be attributable to the isotropic properties of the hybrid composite resin and the intrinsic morphology of the anterior FPD. To meet esthetic and biomechanical requirements, an anterior FPD inevitably possesses irregular and high stress concentrations around the area of the connector.
Load condition 1
Load condition 2
Load condition 3
0 5 10 20 30 50 70 100 270 (MPa) Fig. 9. Maximum principal stress distributions of FPDs. (Labial view) The highest stress distribution was admitted in load condition 1, and the lowest stress distribution was admitted in load condition 3
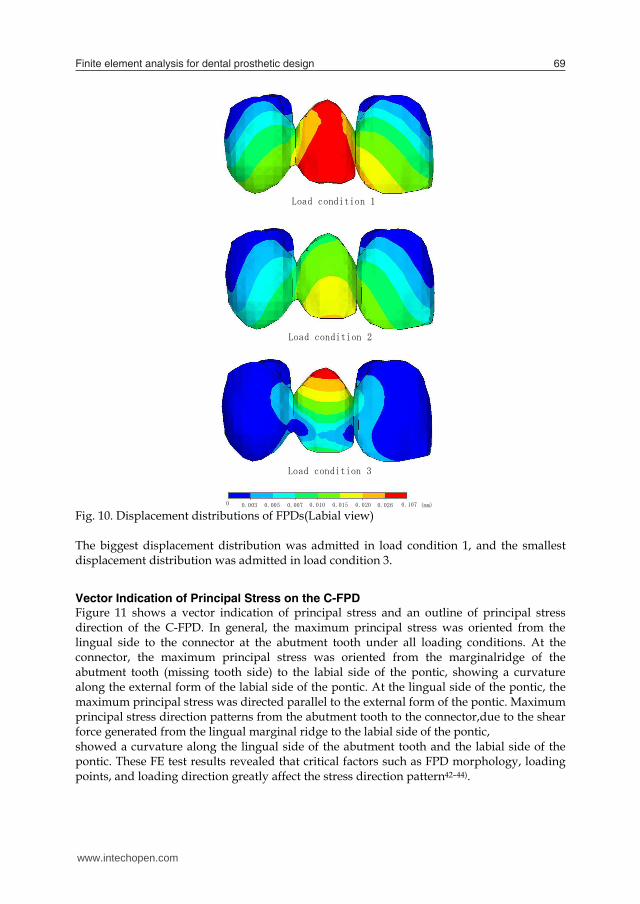
Fig. 10. Displacement distributions of FPDs(Labial view) The biggest displacement distribution was admitted in load condition 1, and the smallest displacement distribution was admitted in load condition 3.
Vector Indication of Principal Stress on the C-FPD Figure 11 shows a vector indication of principal stress and an outline of principal stress direction of the C-FPD. In general, the maximum principal stress was oriented from the lingual side to the connector at the abutment tooth under all loading conditions. At the connector, the maximum principal stress was oriented from the marginalridge of the abutment tooth (missing tooth side) to the labial side of the pontic, showing a curvature along the external form of the labial side of the pontic. At the lingual side of the pontic, the maximum principal stress was directed parallel to the external form of the pontic. Maximum principal stress direction patterns from the abutment tooth to the connector,due to the shear force generated from the lingual marginal ridge to the labial side of the pontic, showed a curvature along the lingual side of the abutment tooth and the labial side of the pontic. These FE test results revealed that critical factors such as FPD morphology, loading points, and loading direction greatly affect the stress direction pattern42–44).
www.intechopen.com
Finite element analysis for dental prosthetic design 69
Under condition 3, maximum principal stresses exceeding100 MPa were distributed to the gingival embrasure of the mesiodistal connectors, peaking at avalue of 189 MPa in the gingival embrasure of the mesial connector. Displacement exceeding 0.026 mm was observed on the pontic base. Displacement, how-ever, was gradually decreased toward the incisal edge. Under condition 3, a large displacement was observed around the pontic base, which was mainly induced by the turning behavior of the pontic when it rotated around the upper embrasure of the mesiodistal connectors. High stress concentrations around the lower embrasure of the connector might be induced by the twisting behavior with the connector as a fixed point. Concerning displacement of both abutment teeth, displacementwas found to occur only on the side adjacent to the edentulous space. In the C-FPD, a localized high stress concentration was observed in the connector area under all loading conditions, which might be attributable to the isotropic properties of the hybrid composite resin and the intrinsic morphology of the anterior FPD. To meet esthetic and biomechanical requirements, an anterior FPD inevitably possesses irregular and high stress concentrations around the area of the connector.
Load condition 1
Load condition 2
Load condition 3
0 5 10 20 30 50 70 100 270 (MPa) Fig. 9. Maximum principal stress distributions of FPDs. (Labial view) The highest stress distribution was admitted in load condition 1, and the lowest stress distribution was admitted in load condition 3
Fig. 10. Displacement distributions of FPDs(Labial view) The biggest displacement distribution was admitted in load condition 1, and the smallest displacement distribution was admitted in load condition 3.
Vector Indication of Principal Stress on the C-FPD Figure 11 shows a vector indication of principal stress and an outline of principal stress direction of the C-FPD. In general, the maximum principal stress was oriented from the lingual side to the connector at the abutment tooth under all loading conditions. At the connector, the maximum principal stress was oriented from the marginalridge of the abutment tooth (missing tooth side) to the labial side of the pontic, showing a curvature along the external form of the labial side of the pontic. At the lingual side of the pontic, the maximum principal stress was directed parallel to the external form of the pontic. Maximum principal stress direction patterns from the abutment tooth to the connector,due to the shear force generated from the lingual marginal ridge to the labial side of the pontic, showed a curvature along the lingual side of the abutment tooth and the labial side of the pontic. These FE test results revealed that critical factors such as FPD morphology, loading points, and loading direction greatly affect the stress direction pattern42–44).
www.intechopen.com
Finite Element Analysis70
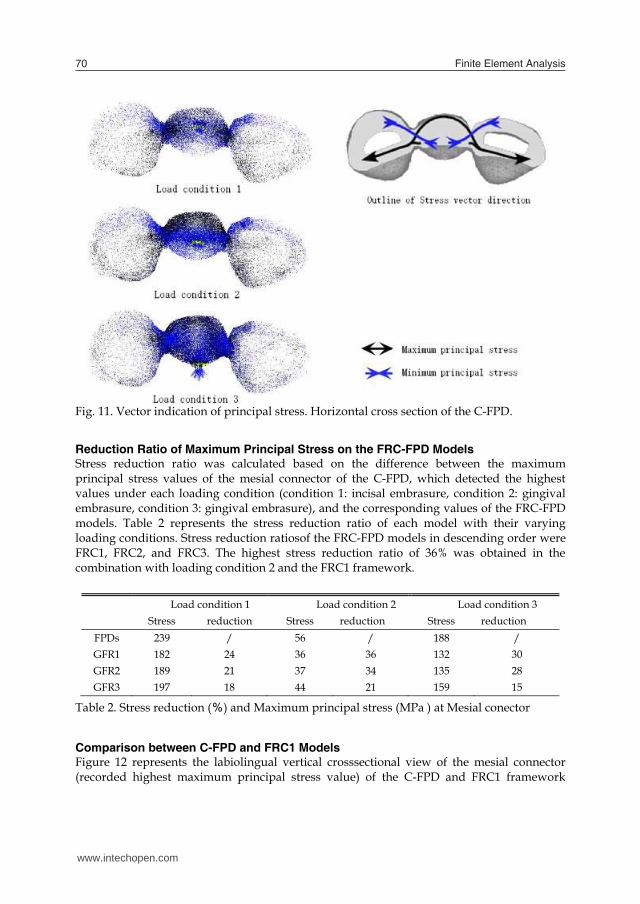
Fig. 11. Vector indication of principal stress. Horizontal cross section of the C-FPD.
Reduction Ratio of Maximum Principal Stress on the FRC-FPD Models Stress reduction ratio was calculated based on the difference between the maximum principal stress values of the mesial connector of the C-FPD, which detected the highest values under each loading condition (condition 1: incisal embrasure, condition 2: gingival embrasure, condition 3: gingival embrasure), and the corresponding values of the FRC-FPD models. Table 2 represents the stress reduction ratio of each model with their varying loading conditions. Stress reduction ratiosof the FRC-FPD models in descending order were FRC1, FRC2, and FRC3. The highest stress reduction ratio of 36% was obtained in the combination with loading condition 2 and the FRC1 framework.
Table 2. Stress reduction (%) and Maximum principal stress (MPa ) at Mesial conector
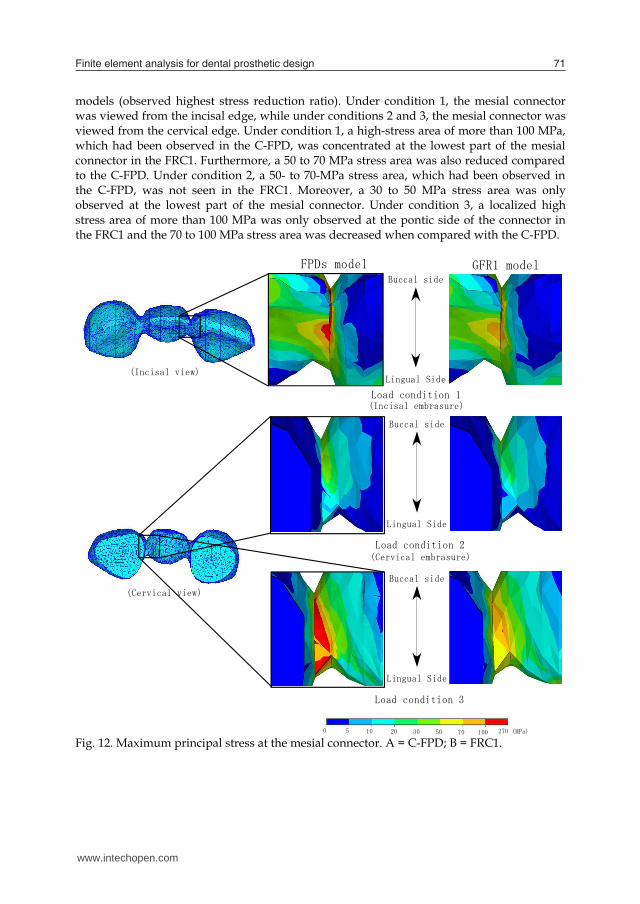
Comparison between C-FPD and FRC1 Models Figure 12 represents the labiolingual vertical crosssectional view of the mesial connector (recorded highest maximum principal stress value) of the C-FPD and FRC1 framework
models (observed highest stress reduction ratio). Under condition 1, the mesial connector was viewed from the incisal edge, while under conditions 2 and 3, the mesial connector was viewed from the cervical edge. Under condition 1, a high-stress area of more than 100 MPa, which had been observed in the C-FPD, was concentrated at the lowest part of the mesial connector in the FRC1. Furthermore, a 50 to 70 MPa stress area was also reduced compared to the C-FPD. Under condition 2, a 50- to 70-MPa stress area, which had been observed in the C-FPD, was not seen in the FRC1. Moreover, a 30 to 50 MPa stress area was only observed at the lowest part of the mesial connector. Under condition 3, a localized high stress area of more than 100 MPa was only observed at the pontic side of the connector in the FRC1 and the 70 to 100 MPa stress area was decreased when compared with the C-FPD.
Load condition 1
Load condition 2
Load condition 3
FPDs model GFR1 model
(Incisal embrasure)
(Cervical embrasure)
0 5 10 20 30 50 70 100270 (MPa)
Buccal side
Lingual Side
Buccal side
Lingual Side
Buccal side
Lingual Side
(Incisal view)
(Cervical view)
Fig. 12. Maximum principal stress at the mesial connector. A = C-FPD; B = FRC1.
www.intechopen.com
Finite element analysis for dental prosthetic design 71
Fig. 11. Vector indication of principal stress. Horizontal cross section of the C-FPD.
Reduction Ratio of Maximum Principal Stress on the FRC-FPD Models Stress reduction ratio was calculated based on the difference between the maximum principal stress values of the mesial connector of the C-FPD, which detected the highest values under each loading condition (condition 1: incisal embrasure, condition 2: gingival embrasure, condition 3: gingival embrasure), and the corresponding values of the FRC-FPD models. Table 2 represents the stress reduction ratio of each model with their varying loading conditions. Stress reduction ratiosof the FRC-FPD models in descending order were FRC1, FRC2, and FRC3. The highest stress reduction ratio of 36% was obtained in the combination with loading condition 2 and the FRC1 framework.
Table 2. Stress reduction (%) and Maximum principal stress (MPa ) at Mesial conector
Comparison between C-FPD and FRC1 Models Figure 12 represents the labiolingual vertical crosssectional view of the mesial connector (recorded highest maximum principal stress value) of the C-FPD and FRC1 framework
models (observed highest stress reduction ratio). Under condition 1, the mesial connector was viewed from the incisal edge, while under conditions 2 and 3, the mesial connector was viewed from the cervical edge. Under condition 1, a high-stress area of more than 100 MPa, which had been observed in the C-FPD, was concentrated at the lowest part of the mesial connector in the FRC1. Furthermore, a 50 to 70 MPa stress area was also reduced compared to the C-FPD. Under condition 2, a 50- to 70-MPa stress area, which had been observed in the C-FPD, was not seen in the FRC1. Moreover, a 30 to 50 MPa stress area was only observed at the lowest part of the mesial connector. Under condition 3, a localized high stress area of more than 100 MPa was only observed at the pontic side of the connector in the FRC1 and the 70 to 100 MPa stress area was decreased when compared with the C-FPD.
Load condition 1
Load condition 2
Load condition 3
FPDs model GFR1 model
(Incisal embrasure)
(Cervical embrasure)
0 5 10 20 30 50 70 100270 (MPa)
Buccal side
Lingual Side
Buccal side
Lingual Side
Buccal side
Lingual Side
(Incisal view)
(Cervical view)
Fig. 12. Maximum principal stress at the mesial connector. A = C-FPD; B = FRC1.
www.intechopen.com
Finite Element Analysis72
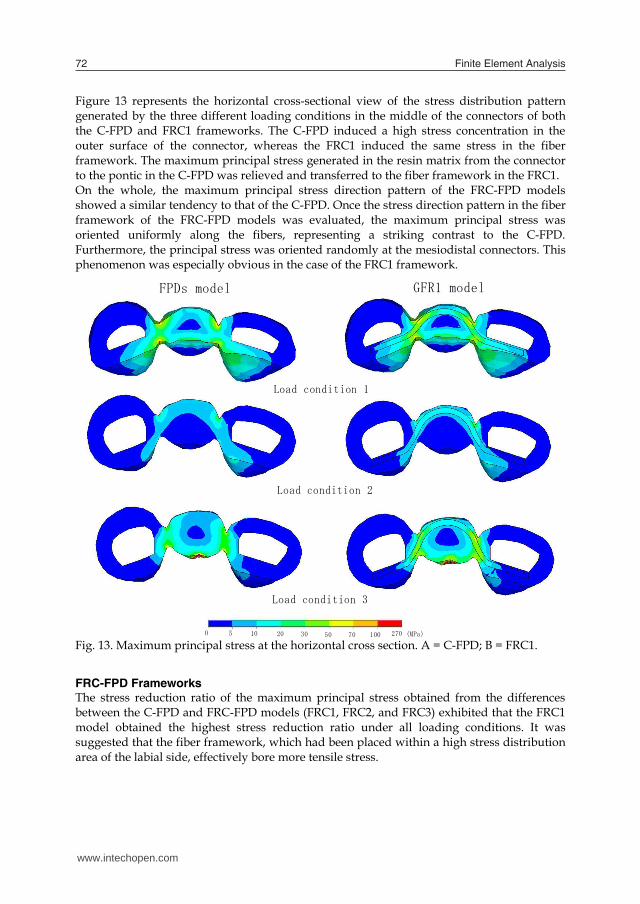
Figure 13 represents the horizontal cross-sectional view of the stress distribution pattern generated by the three different loading conditions in the middle of the connectors of both the C-FPD and FRC1 frameworks. The C-FPD induced a high stress concentration in the outer surface of the connector, whereas the FRC1 induced the same stress in the fiber framework. The maximum principal stress generated in the resin matrix from the connector to the pontic in the C-FPD was relieved and transferred to the fiber framework in the FRC1. On the whole, the maximum principal stress direction pattern of the FRC-FPD models showed a similar tendency to that of the C-FPD. Once the stress direction pattern in the fiber framework of the FRC-FPD models was evaluated, the maximum principal stress was oriented uniformly along the fibers, representing a striking contrast to the C-FPD. Furthermore, the principal stress was oriented randomly at the mesiodistal connectors. This phenomenon was especially obvious in the case of the FRC1 framework.
FPDs model GFR1 model
Load condition 1
Load condition 2
Load condition 3
0 5 10 20 30 50 70 100270 (MPa)
Fig. 13. Maximum principal stress at the horizontal cross section. A = C-FPD; B = FRC1.
FRC-FPD Frameworks The stress reduction ratio of the maximum principal stress obtained from the differences between the C-FPD and FRC-FPD models (FRC1, FRC2, and FRC3) exhibited that the FRC1 model obtained the highest stress reduction ratio under all loading conditions. It was suggested that the fiber framework, which had been placed within a high stress distribution area of the labial side, effectively bore more tensile stress.
ConcerninFRCC2 and FRC3, inappropriate positioning of the fiber framework placement only affected the stress distribution pattern and not the stress reduction ratio, indicating a small reduction ratio. When investigating the influence of the fiber framework on displacement, it was reduced only at the pontic of the FRC1. When evaluating the displacement distribution pattern of the abutment teeth and connectors, no significant differences were found among the C-FPD and models reinforced with a fiber framework. As for the direction of maximum principal stress on the whole, no significant differences were found among the C-FPD and models reinforced with a fiber framework. At the fiber framework, however, maximum principal stress tended to be directed along the orientation of the fiber and the direction of the fiber framework and maximum principal stress partially coincided with one another. This demonstrated a striking contrast to the C-FPD model, of which the principal stress was oriented randomly at the mesiodistal connectors.
Optimum Design of the Fiber Framework For prostheses to function successfully for a long time in a rigorous oral environment, it is highly critical to make the most of the anisotropic nature of the fiber framework (ie, having an exceptionally high Young’s and elastic modulus along the orientation of the fibers). Continuous unidirectional glass fiber is used as the reinforcinFRCamework in an FPD. Obtaining the maximum reinforcement effects of the fiber frame-work and avoiding high irregular stress concentration are very important when designing an FPD. Esthetic treatment for the anterior tooth region often requires utilization of materials with varying color shades. Extensive space is needed to place different combinations of composite shades, especially in the incisal edge region of anterior teeth. In order to achieve good esthetics when working with anterior teeth, a labial space of 0.5 mm is considered to be the minimum for layered veneering composites with different color shades. FRC materials are practical in achieving the natural tooth color with both the layering as well as with the staining technique. Fiber-reinforced anterior FPDs were investigated from a biomechanical and structural point of view and it was found that the optimal fiber reinforcement effect is achieved with a curved FRC extendinFRCom the lingual side of both abutment teeth to the labial side of the pontic base.
Conclusions 1. Localized high stress concentration was observed around the connectors under all loading conditions. 2. In all FRC–FPD models, the fiber framework bore the stress generated, showing the stress-bearing capacity of the FRC framework. The highest stress reduction ratio was obtained with a curved FRC ex-tendinFRCom the lingual side of both abutment teeth to the labial side of the pontic base. 3. Fiber reinforcement also enabled the reduction of the quantified displacement.
3. Mechanical approach for designing of a posterior FRC FPD
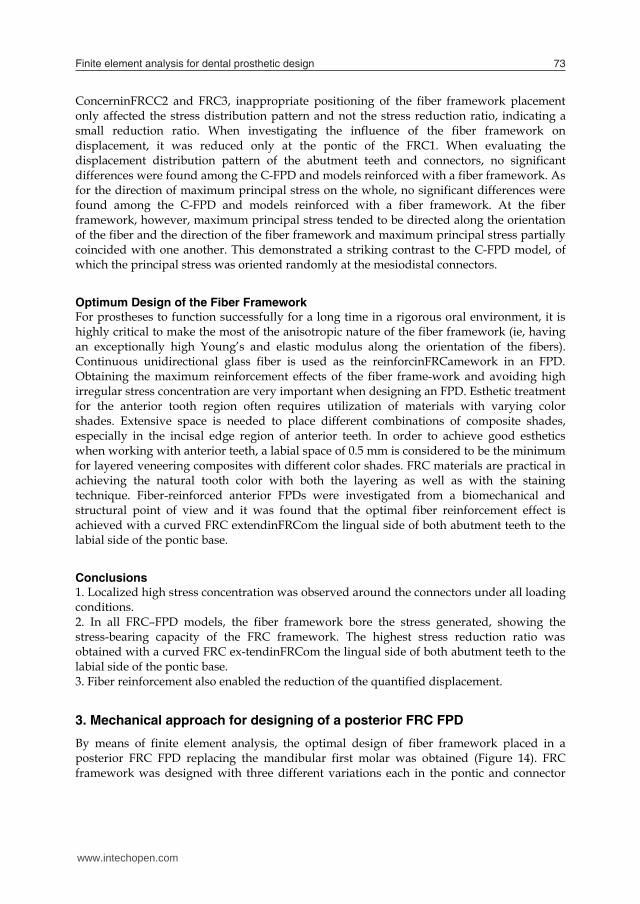
By means of finite element analysis, the optimal design of fiber framework placed in a posterior FRC FPD replacing the mandibular first molar was obtained (Figure 14). FRC framework was designed with three different variations each in the pontic and connector
www.intechopen.com
Finite element analysis for dental prosthetic design 73
Figure 13 represents the horizontal cross-sectional view of the stress distribution pattern generated by the three different loading conditions in the middle of the connectors of both the C-FPD and FRC1 frameworks. The C-FPD induced a high stress concentration in the outer surface of the connector, whereas the FRC1 induced the same stress in the fiber framework. The maximum principal stress generated in the resin matrix from the connector to the pontic in the C-FPD was relieved and transferred to the fiber framework in the FRC1. On the whole, the maximum principal stress direction pattern of the FRC-FPD models showed a similar tendency to that of the C-FPD. Once the stress direction pattern in the fiber framework of the FRC-FPD models was evaluated, the maximum principal stress was oriented uniformly along the fibers, representing a striking contrast to the C-FPD. Furthermore, the principal stress was oriented randomly at the mesiodistal connectors. This phenomenon was especially obvious in the case of the FRC1 framework.
FPDs model GFR1 model
Load condition 1
Load condition 2
Load condition 3
0 5 10 20 30 50 70 100270 (MPa)
Fig. 13. Maximum principal stress at the horizontal cross section. A = C-FPD; B = FRC1.
FRC-FPD Frameworks The stress reduction ratio of the maximum principal stress obtained from the differences between the C-FPD and FRC-FPD models (FRC1, FRC2, and FRC3) exhibited that the FRC1 model obtained the highest stress reduction ratio under all loading conditions. It was suggested that the fiber framework, which had been placed within a high stress distribution area of the labial side, effectively bore more tensile stress.
ConcerninFRCC2 and FRC3, inappropriate positioning of the fiber framework placement only affected the stress distribution pattern and not the stress reduction ratio, indicating a small reduction ratio. When investigating the influence of the fiber framework on displacement, it was reduced only at the pontic of the FRC1. When evaluating the displacement distribution pattern of the abutment teeth and connectors, no significant differences were found among the C-FPD and models reinforced with a fiber framework. As for the direction of maximum principal stress on the whole, no significant differences were found among the C-FPD and models reinforced with a fiber framework. At the fiber framework, however, maximum principal stress tended to be directed along the orientation of the fiber and the direction of the fiber framework and maximum principal stress partially coincided with one another. This demonstrated a striking contrast to the C-FPD model, of which the principal stress was oriented randomly at the mesiodistal connectors.
Optimum Design of the Fiber Framework For prostheses to function successfully for a long time in a rigorous oral environment, it is highly critical to make the most of the anisotropic nature of the fiber framework (ie, having an exceptionally high Young’s and elastic modulus along the orientation of the fibers). Continuous unidirectional glass fiber is used as the reinforcinFRCamework in an FPD. Obtaining the maximum reinforcement effects of the fiber frame-work and avoiding high irregular stress concentration are very important when designing an FPD. Esthetic treatment for the anterior tooth region often requires utilization of materials with varying color shades. Extensive space is needed to place different combinations of composite shades, especially in the incisal edge region of anterior teeth. In order to achieve good esthetics when working with anterior teeth, a labial space of 0.5 mm is considered to be the minimum for layered veneering composites with different color shades. FRC materials are practical in achieving the natural tooth color with both the layering as well as with the staining technique. Fiber-reinforced anterior FPDs were investigated from a biomechanical and structural point of view and it was found that the optimal fiber reinforcement effect is achieved with a curved FRC extendinFRCom the lingual side of both abutment teeth to the labial side of the pontic base.
Conclusions 1. Localized high stress concentration was observed around the connectors under all loading conditions. 2. In all FRC–FPD models, the fiber framework bore the stress generated, showing the stress-bearing capacity of the FRC framework. The highest stress reduction ratio was obtained with a curved FRC ex-tendinFRCom the lingual side of both abutment teeth to the labial side of the pontic base. 3. Fiber reinforcement also enabled the reduction of the quantified displacement.
3. Mechanical approach for designing of a posterior FRC FPD
By means of finite element analysis, the optimal design of fiber framework placed in a posterior FRC FPD replacing the mandibular first molar was obtained (Figure 14). FRC framework was designed with three different variations each in the pontic and connector
www.intechopen.com
Finite Element Analysis74
(total nine different models). The results were compared with the control model (hybrid composite FPD without fiber reinforcement) and FRC FPD. This term consists of (1) A main framework design of FRC FPD against vertical occlusal force using 2D FEM analysis (1st analysis). (2) The optimal thickness of a main framework for FRC FPD using 2D FEM analysis (2nd analysis). (3) Focused on the possible need of additional FRC support for the pontic. Two types of loading conditions, i.e. against vertical occlusal load, and loading the cusp in lateral movement of jaw, on mechanical behavior of the pontic of hybrid composite FPD (C-FPD) and FRC FPD (FRC-FPD) were studied by 3D FEM analysis (3rd analysis).
Fig. 14. FRC-FPD and FE model in the posterior region.
1st analysis: Introduction Hybrid composite is presumed to have the isotropic material properties. The glass-fibers On the other hand, is different from that. The characteristics of fiber are, first it tensile stress is strong in the direction parallel to the fibers. Second, it is weak not only the tensile stress in the direction perpendicular to the fibers but also compression. So we assume that the fiber will have to deal with the orthogonal anisotropic material properties on the stress analysis carried out. The aim was to study the effects of differences in the location of FRC in internal bridge structure on reinforcing effects. This was done by using stress analysis according to the FEM by designatinFRCC as an anisotropic material for the purpose of clinical application of FRC hybrid composite FPD.
Materials and Methods Definition of structures With a view to replacing the mandibular first molar, two-dimensional finite element models of three-unit bridge from mandibular second premolar to mandibular second molar were created. This model (FRC0) was the base model with no fiber framework reinforcement. FRC0 was to be in the middle of both buccolingual and mesiodistal distances and along the long axis of a crown. Crown contour based on anatomical measurements was obtained.
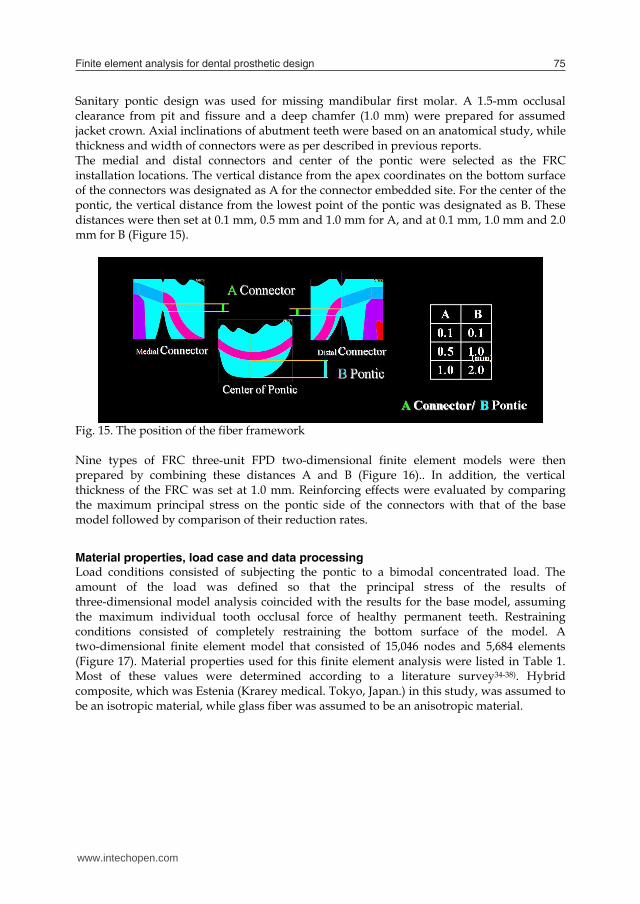
Sanitary pontic design was used for missing mandibular first molar. A 1.5-mm occlusal clearance from pit and fissure and a deep chamfer (1.0 mm) were prepared for assumed jacket crown. Axial inclinations of abutment teeth were based on an anatomical study, while thickness and width of connectors were as per described in previous reports. The medial and distal connectors and center of the pontic were selected as the FRC installation locations. The vertical distance from the apex coordinates on the bottom surface of the connectors was designated as A for the connector embedded site. For the center of the pontic, the vertical distance from the lowest point of the pontic was designated as B. These distances were then set at 0.1 mm, 0.5 mm and 1.0 mm for A, and at 0.1 mm, 1.0 mm and 2.0 mm for B (Figure 15).
Fig. 15. The position of the fiber framework
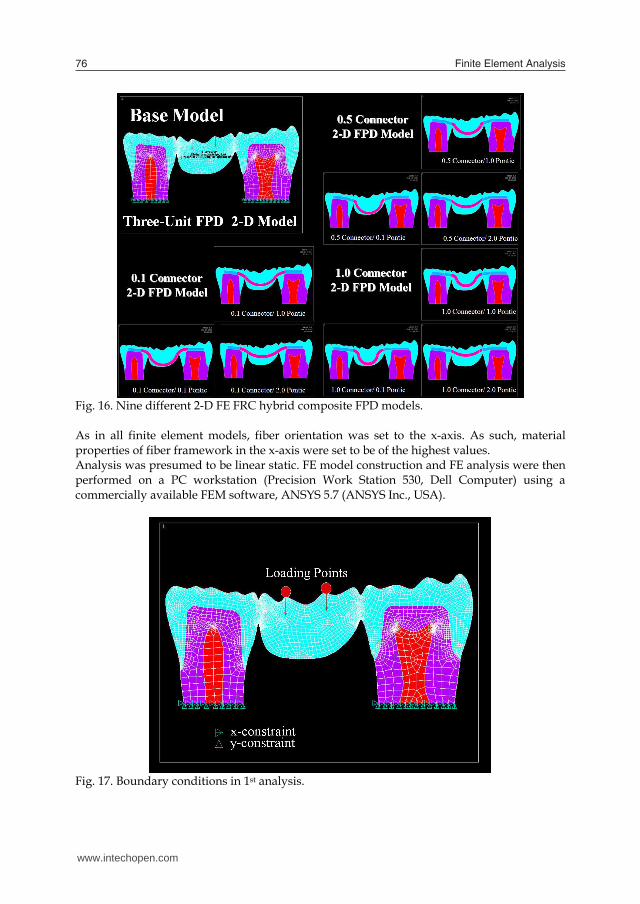
Nine types of FRC three-unit FPD two-dimensional finite element models were then prepared by combining these distances A and B (Figure 16).. In addition, the vertical thickness of the FRC was set at 1.0 mm. Reinforcing effects were evaluated by comparing the maximum principal stress on the pontic side of the connectors with that of the base model followed by comparison of their reduction rates.
Material properties, load case and data processing Load conditions consisted of subjecting the pontic to a bimodal concentrated load. The amount of the load was defined so that the principal stress of the results of three-dimensional model analysis coincided with the results for the base model, assuming the maximum individual tooth occlusal force of healthy permanent teeth. Restraining conditions consisted of completely restraining the bottom surface of the model. A two-dimensional finite element model that consisted of 15,046 nodes and 5,684 elements (Figure 17). Material properties used for this finite element analysis were listed in Table 1. Most of these values were determined according to a literature survey34-38). Hybrid composite, which was Estenia (Krarey medical. Tokyo, Japan.) in this study, was assumed to be an isotropic material, while glass fiber was assumed to be an anisotropic material.
www.intechopen.com
Finite element analysis for dental prosthetic design 75
(total nine different models). The results were compared with the control model (hybrid composite FPD without fiber reinforcement) and FRC FPD. This term consists of (1) A main framework design of FRC FPD against vertical occlusal force using 2D FEM analysis (1st analysis). (2) The optimal thickness of a main framework for FRC FPD using 2D FEM analysis (2nd analysis). (3) Focused on the possible need of additional FRC support for the pontic. Two types of loading conditions, i.e. against vertical occlusal load, and loading the cusp in lateral movement of jaw, on mechanical behavior of the pontic of hybrid composite FPD (C-FPD) and FRC FPD (FRC-FPD) were studied by 3D FEM analysis (3rd analysis).
Fig. 14. FRC-FPD and FE model in the posterior region.
1st analysis: Introduction Hybrid composite is presumed to have the isotropic material properties. The glass-fibers On the other hand, is different from that. The characteristics of fiber are, first it tensile stress is strong in the direction parallel to the fibers. Second, it is weak not only the tensile stress in the direction perpendicular to the fibers but also compression. So we assume that the fiber will have to deal with the orthogonal anisotropic material properties on the stress analysis carried out. The aim was to study the effects of differences in the location of FRC in internal bridge structure on reinforcing effects. This was done by using stress analysis according to the FEM by designatinFRCC as an anisotropic material for the purpose of clinical application of FRC hybrid composite FPD.
Materials and Methods Definition of structures With a view to replacing the mandibular first molar, two-dimensional finite element models of three-unit bridge from mandibular second premolar to mandibular second molar were created. This model (FRC0) was the base model with no fiber framework reinforcement. FRC0 was to be in the middle of both buccolingual and mesiodistal distances and along the long axis of a crown. Crown contour based on anatomical measurements was obtained.
Sanitary pontic design was used for missing mandibular first molar. A 1.5-mm occlusal clearance from pit and fissure and a deep chamfer (1.0 mm) were prepared for assumed jacket crown. Axial inclinations of abutment teeth were based on an anatomical study, while thickness and width of connectors were as per described in previous reports. The medial and distal connectors and center of the pontic were selected as the FRC installation locations. The vertical distance from the apex coordinates on the bottom surface of the connectors was designated as A for the connector embedded site. For the center of the pontic, the vertical distance from the lowest point of the pontic was designated as B. These distances were then set at 0.1 mm, 0.5 mm and 1.0 mm for A, and at 0.1 mm, 1.0 mm and 2.0 mm for B (Figure 15).
Fig. 15. The position of the fiber framework
Nine types of FRC three-unit FPD two-dimensional finite element models were then prepared by combining these distances A and B (Figure 16).. In addition, the vertical thickness of the FRC was set at 1.0 mm. Reinforcing effects were evaluated by comparing the maximum principal stress on the pontic side of the connectors with that of the base model followed by comparison of their reduction rates.
Material properties, load case and data processing Load conditions consisted of subjecting the pontic to a bimodal concentrated load. The amount of the load was defined so that the principal stress of the results of three-dimensional model analysis coincided with the results for the base model, assuming the maximum individual tooth occlusal force of healthy permanent teeth. Restraining conditions consisted of completely restraining the bottom surface of the model. A two-dimensional finite element model that consisted of 15,046 nodes and 5,684 elements (Figure 17). Material properties used for this finite element analysis were listed in Table 1. Most of these values were determined according to a literature survey34-38). Hybrid composite, which was Estenia (Krarey medical. Tokyo, Japan.) in this study, was assumed to be an isotropic material, while glass fiber was assumed to be an anisotropic material.
www.intechopen.com
Finite Element Analysis76
Fig. 16. Nine different 2-D FE FRC hybrid composite FPD models.
As in all finite element models, fiber orientation was set to the x-axis. As such, material properties of fiber framework in the x-axis were set to be of the highest values. Analysis was presumed to be linear static. FE model construction and FE analysis were then performed on a PC workstation (Precision Work Station 530, Dell Computer) using a commercially available FEM software, ANSYS 5.7 (ANSYS Inc., USA).
Fig. 17. Boundary conditions in 1st analysis.
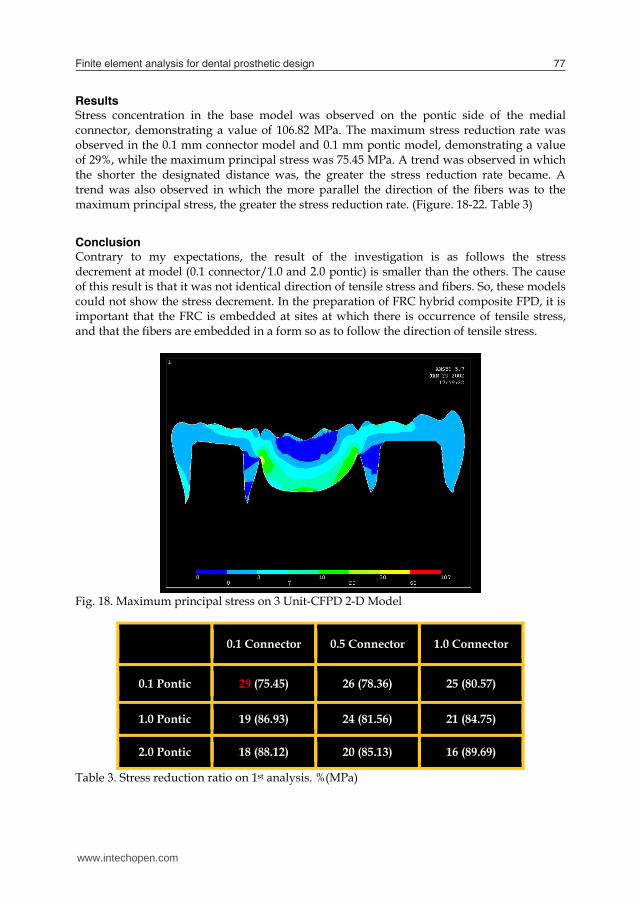
Results Stress concentration in the base model was observed on the pontic side of the medial connector, demonstrating a value of 106.82 MPa. The maximum stress reduction rate was observed in the 0.1 mm connector model and 0.1 mm pontic model, demonstrating a value of 29%, while the maximum principal stress was 75.45 MPa. A trend was observed in which the shorter the designated distance was, the greater the stress reduction rate became. A trend was also observed in which the more parallel the direction of the fibers was to the maximum principal stress, the greater the stress reduction rate. (Figure. 18-22. Table 3)
Conclusion Contrary to my expectations, the result of the investigation is as follows the stress decrement at model (0.1 connector/1.0 and 2.0 pontic) is smaller than the others. The cause of this result is that it was not identical direction of tensile stress and fibers. So, these models could not show the stress decrement. In the preparation of FRC hybrid composite FPD, it is important that the FRC is embedded at sites at which there is occurrence of tensile stress, and that the fibers are embedded in a form so as to follow the direction of tensile stress.
Fig. 18. Maximum principal stress on 3 Unit-CFPD 2-D Model
0.1 Connector 0.5 Connector 1.0 Connector
0.1 Pontic 29 (75.45) 26 (78.36) 25 (80.57)
1.0 Pontic 19 (86.93) 24 (81.56) 21 (84.75)
2.0 Pontic 18 (88.12) 20 (85.13) 16 (89.69)
Table 3. Stress reduction ratio on 1st analysis. %(MPa)
www.intechopen.com
Finite element analysis for dental prosthetic design 77
Fig. 16. Nine different 2-D FE FRC hybrid composite FPD models.
As in all finite element models, fiber orientation was set to the x-axis. As such, material properties of fiber framework in the x-axis were set to be of the highest values. Analysis was presumed to be linear static. FE model construction and FE analysis were then performed on a PC workstation (Precision Work Station 530, Dell Computer) using a commercially available FEM software, ANSYS 5.7 (ANSYS Inc., USA).
Fig. 17. Boundary conditions in 1st analysis.
Results Stress concentration in the base model was observed on the pontic side of the medial connector, demonstrating a value of 106.82 MPa. The maximum stress reduction rate was observed in the 0.1 mm connector model and 0.1 mm pontic model, demonstrating a value of 29%, while the maximum principal stress was 75.45 MPa. A trend was observed in which the shorter the designated distance was, the greater the stress reduction rate became. A trend was also observed in which the more parallel the direction of the fibers was to the maximum principal stress, the greater the stress reduction rate. (Figure. 18-22. Table 3)
Conclusion Contrary to my expectations, the result of the investigation is as follows the stress decrement at model (0.1 connector/1.0 and 2.0 pontic) is smaller than the others. The cause of this result is that it was not identical direction of tensile stress and fibers. So, these models could not show the stress decrement. In the preparation of FRC hybrid composite FPD, it is important that the FRC is embedded at sites at which there is occurrence of tensile stress, and that the fibers are embedded in a form so as to follow the direction of tensile stress.
Fig. 18. Maximum principal stress on 3 Unit-CFPD 2-D Model
0.1 Connector 0.5 Connector 1.0 Connector
0.1 Pontic 29 (75.45) 26 (78.36) 25 (80.57)
1.0 Pontic 19 (86.93) 24 (81.56) 21 (84.75)
2.0 Pontic 18 (88.12) 20 (85.13) 16 (89.69)
Table 3. Stress reduction ratio on 1st analysis. %(MPa)
www.intechopen.com
Finite Element Analysis78
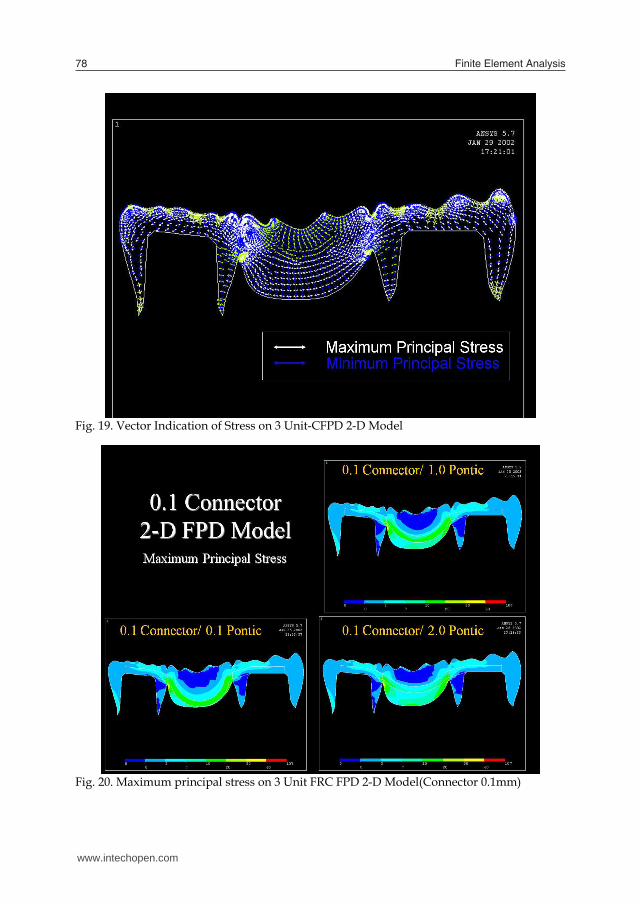
Fig. 19. Vector Indication of Stress on 3 Unit-CFPD 2-D Model
Fig. 20. Maximum principal stress on 3 Unit FRC FPD 2-D Model(Connector 0.1mm)
Fig. 21. Maximum principal stress on 3 Unit FRC FPD 2-D Model (Connector 0.5mm)
Fig. 22. Maximum principal stress on 3 Unit FRC FPD 2-D Model (Connector 1.0mm)
www.intechopen.com
Finite element analysis for dental prosthetic design 79
Fig. 19. Vector Indication of Stress on 3 Unit-CFPD 2-D Model
Fig. 20. Maximum principal stress on 3 Unit FRC FPD 2-D Model(Connector 0.1mm)
Fig. 21. Maximum principal stress on 3 Unit FRC FPD 2-D Model (Connector 0.5mm)
Fig. 22. Maximum principal stress on 3 Unit FRC FPD 2-D Model (Connector 1.0mm)
www.intechopen.com
Finite Element Analysis80
2nd analysis: Introduction 1st analysis demonstrated that maximum principal stress applied to mandibular first amolar was decreased from 106 MPa to 75 MPa (approximately 29% stress reduction) by maximizing fiber reinforcement effect. However, the effect of fiber quantity (i.e., vertical thickness of fiber framework) on magnitude and distribution of stress has not yet been fully investigated, which means there are no definite guidelines on this matter. Putting aside the lack of research and lack of guidelines, it is undeniably critical to clarify stress reduction mechanism (or stress-transferring mechanism), which is achieved by reinforcing with fiber framework placed within a limited occlusal clearance. 2nd analysis, preimpregnated, unidirectional, and anisotropic fiber-reinforced composite with high strength and stiffness in one direction was used to fabricate FPD. Then, from a structural and mechanical perspective, a finite element method was used to investigate the influence of the thickness of fiber framework on magnitude and distribution of stress, and thereby determine the optimal thickness of fiber framework.
Materials and Methods Definition of structures The base model using on 2nd analysis is same as 1st analysis. This model (FRC0) was the base model with no fiber framework reinforcement. To optimize reinforcement effect, the shape of fiber framework was as per that described in 1st analysis. Fiber framework (figure 23) was reinforced in the axial direction (or along y-axis). With due consideration for 1.5-mm occlusal clearance, a total of eight fiber framework models were constructed with a thickness of 0, 0.2, 0.4, 0.6, 0.8, 1.0, 1.2, or 1.4 mm (FRC0, FRC0.2, FRC0.4, FRC0.6, FRC0.8, FRC1.0, FRC1.2, FRC1.4) (figure 24).
Fig. 23. A finite element model of glass fiber framework
GFR0
GFR0.2 GFR1.4 Fig. 24. Two-dimensional models of 3-unite glass fiber reinforced fixed partial dentures Material properties, load case and data processing Finite element models consisting of 5,684 elements with 15,046 nodes were created for plane stress analysis. Quadrilateral elements with eight nodes were chosen because they are more regular than triangular elements. The geometric conditions and materials properties are same as 1st analysis. Figure 25 shows the outline of the model and its boundary conditions.
25 N 25 N
Y
:X, Y-Constraint X ●:Loading Points
Fig. 25. Boundary conditions of finite element models (GFR1.0)
www.intechopen.com
Finite element analysis for dental prosthetic design 81
2nd analysis: Introduction 1st analysis demonstrated that maximum principal stress applied to mandibular first amolar was decreased from 106 MPa to 75 MPa (approximately 29% stress reduction) by maximizing fiber reinforcement effect. However, the effect of fiber quantity (i.e., vertical thickness of fiber framework) on magnitude and distribution of stress has not yet been fully investigated, which means there are no definite guidelines on this matter. Putting aside the lack of research and lack of guidelines, it is undeniably critical to clarify stress reduction mechanism (or stress-transferring mechanism), which is achieved by reinforcing with fiber framework placed within a limited occlusal clearance. 2nd analysis, preimpregnated, unidirectional, and anisotropic fiber-reinforced composite with high strength and stiffness in one direction was used to fabricate FPD. Then, from a structural and mechanical perspective, a finite element method was used to investigate the influence of the thickness of fiber framework on magnitude and distribution of stress, and thereby determine the optimal thickness of fiber framework.
Materials and Methods Definition of structures The base model using on 2nd analysis is same as 1st analysis. This model (FRC0) was the base model with no fiber framework reinforcement. To optimize reinforcement effect, the shape of fiber framework was as per that described in 1st analysis. Fiber framework (figure 23) was reinforced in the axial direction (or along y-axis). With due consideration for 1.5-mm occlusal clearance, a total of eight fiber framework models were constructed with a thickness of 0, 0.2, 0.4, 0.6, 0.8, 1.0, 1.2, or 1.4 mm (FRC0, FRC0.2, FRC0.4, FRC0.6, FRC0.8, FRC1.0, FRC1.2, FRC1.4) (figure 24).
Fig. 23. A finite element model of glass fiber framework
GFR0
GFR0.2 GFR1.4 Fig. 24. Two-dimensional models of 3-unite glass fiber reinforced fixed partial dentures Material properties, load case and data processing Finite element models consisting of 5,684 elements with 15,046 nodes were created for plane stress analysis. Quadrilateral elements with eight nodes were chosen because they are more regular than triangular elements. The geometric conditions and materials properties are same as 1st analysis. Figure 25 shows the outline of the model and its boundary conditions.
25 N 25 N
Y
:X, Y-Constraint X ●:Loading Points
Fig. 25. Boundary conditions of finite element models (GFR1.0)
www.intechopen.com
Finite Element Analysis82
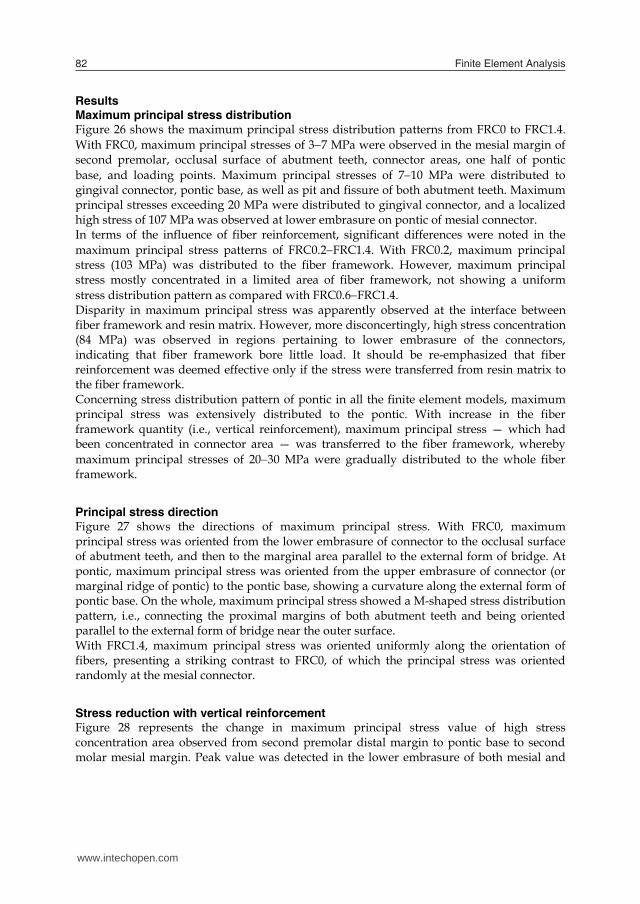
Results Maximum principal stress distribution Figure 26 shows the maximum principal stress distribution patterns from FRC0 to FRC1.4. With FRC0, maximum principal stresses of 37 MPa were observed in the mesial margin of second premolar, occlusal surface of abutment teeth, connector areas, one half of pontic base, and loading points. Maximum principal stresses of 710 MPa were distributed to gingival connector, pontic base, as well as pit and fissure of both abutment teeth. Maximum principal stresses exceeding 20 MPa were distributed to gingival connector, and a localized high stress of 107 MPa was observed at lower embrasure on pontic of mesial connector. In terms of the influence of fiber reinforcement, significant differences were noted in the maximum principal stress patterns of FRC0.2FRC1.4. With FRC0.2, maximum principal stress (103 MPa) was distributed to the fiber framework. However, maximum principal stress mostly concentrated in a limited area of fiber framework, not showing a uniform stress distribution pattern as compared with FRC0.6FRC1.4. Disparity in maximum principal stress was apparently observed at the interface between fiber framework and resin matrix. However, more disconcertingly, high stress concentration (84 MPa) was observed in regions pertaining to lower embrasure of the connectors, indicating that fiber framework bore little load. It should be re-emphasized that fiber reinforcement was deemed effective only if the stress were transferred from resin matrix to the fiber framework. Concerning stress distribution pattern of pontic in all the finite element models, maximum principal stress was extensively distributed to the pontic. With increase in the fiber framework quantity (i.e., vertical reinforcement), maximum principal stress — which had been concentrated in connector area — was transferred to the fiber framework, whereby maximum principal stresses of 2030 MPa were gradually distributed to the whole fiber framework.
Principal stress direction Figure 27 shows the directions of maximum principal stress. With FRC0, maximum principal stress was oriented from the lower embrasure of connector to the occlusal surface of abutment teeth, and then to the marginal area parallel to the external form of bridge. At pontic, maximum principal stress was oriented from the upper embrasure of connector (or marginal ridge of pontic) to the pontic base, showing a curvature along the external form of pontic base. On the whole, maximum principal stress showed a M-shaped stress distribution pattern, i.e., connecting the proximal margins of both abutment teeth and being oriented parallel to the external form of bridge near the outer surface. With FRC1.4, maximum principal stress was oriented uniformly along the orientation of fibers, presenting a striking contrast to FRC0, of which the principal stress was oriented randomly at the mesial connector.
Stress reduction with vertical reinforcement Figure 28 represents the change in maximum principal stress value of high stress concentration area observed from second premolar distal margin to pontic base to second molar mesial margin. Peak value was detected in the lower embrasure of both mesial and
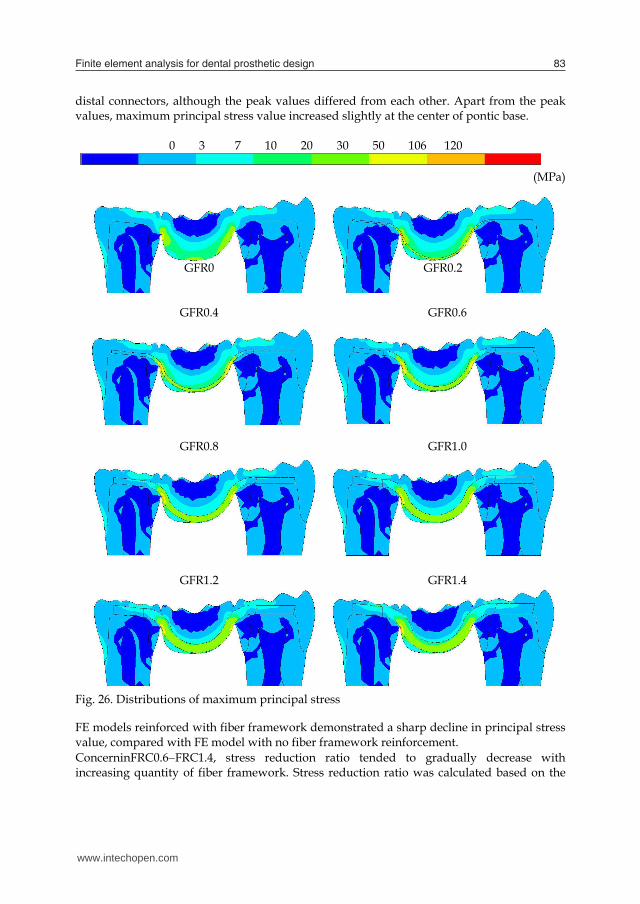
distal connectors, although the peak values differed from each other. Apart from the peak values, maximum principal stress value increased slightly at the center of pontic base.
0 3 7 10 20 30 50 106 120
(MPa)
GFR0 GFR0.2
GFR0.4 GFR0.6
GFR0.8 GFR1.0
GFR1.2 GFR1.4
Fig. 26. Distributions of maximum principal stress
FE models reinforced with fiber framework demonstrated a sharp decline in principal stress value, compared with FE model with no fiber framework reinforcement. ConcerninFRC0.6FRC1.4, stress reduction ratio tended to gradually decrease with increasing quantity of fiber framework. Stress reduction ratio was calculated based on the
www.intechopen.com
Finite element analysis for dental prosthetic design 83
Results Maximum principal stress distribution Figure 26 shows the maximum principal stress distribution patterns from FRC0 to FRC1.4. With FRC0, maximum principal stresses of 37 MPa were observed in the mesial margin of second premolar, occlusal surface of abutment teeth, connector areas, one half of pontic base, and loading points. Maximum principal stresses of 710 MPa were distributed to gingival connector, pontic base, as well as pit and fissure of both abutment teeth. Maximum principal stresses exceeding 20 MPa were distributed to gingival connector, and a localized high stress of 107 MPa was observed at lower embrasure on pontic of mesial connector. In terms of the influence of fiber reinforcement, significant differences were noted in the maximum principal stress patterns of FRC0.2FRC1.4. With FRC0.2, maximum principal stress (103 MPa) was distributed to the fiber framework. However, maximum principal stress mostly concentrated in a limited area of fiber framework, not showing a uniform stress distribution pattern as compared with FRC0.6FRC1.4. Disparity in maximum principal stress was apparently observed at the interface between fiber framework and resin matrix. However, more disconcertingly, high stress concentration (84 MPa) was observed in regions pertaining to lower embrasure of the connectors, indicating that fiber framework bore little load. It should be re-emphasized that fiber reinforcement was deemed effective only if the stress were transferred from resin matrix to the fiber framework. Concerning stress distribution pattern of pontic in all the finite element models, maximum principal stress was extensively distributed to the pontic. With increase in the fiber framework quantity (i.e., vertical reinforcement), maximum principal stress — which had been concentrated in connector area — was transferred to the fiber framework, whereby maximum principal stresses of 2030 MPa were gradually distributed to the whole fiber framework.
Principal stress direction Figure 27 shows the directions of maximum principal stress. With FRC0, maximum principal stress was oriented from the lower embrasure of connector to the occlusal surface of abutment teeth, and then to the marginal area parallel to the external form of bridge. At pontic, maximum principal stress was oriented from the upper embrasure of connector (or marginal ridge of pontic) to the pontic base, showing a curvature along the external form of pontic base. On the whole, maximum principal stress showed a M-shaped stress distribution pattern, i.e., connecting the proximal margins of both abutment teeth and being oriented parallel to the external form of bridge near the outer surface. With FRC1.4, maximum principal stress was oriented uniformly along the orientation of fibers, presenting a striking contrast to FRC0, of which the principal stress was oriented randomly at the mesial connector.
Stress reduction with vertical reinforcement Figure 28 represents the change in maximum principal stress value of high stress concentration area observed from second premolar distal margin to pontic base to second molar mesial margin. Peak value was detected in the lower embrasure of both mesial and
distal connectors, although the peak values differed from each other. Apart from the peak values, maximum principal stress value increased slightly at the center of pontic base.
0 3 7 10 20 30 50 106 120
(MPa)
GFR0 GFR0.2
GFR0.4 GFR0.6
GFR0.8 GFR1.0
GFR1.2 GFR1.4
Fig. 26. Distributions of maximum principal stress
FE models reinforced with fiber framework demonstrated a sharp decline in principal stress value, compared with FE model with no fiber framework reinforcement. ConcerninFRC0.6FRC1.4, stress reduction ratio tended to gradually decrease with increasing quantity of fiber framework. Stress reduction ratio was calculated based on the
www.intechopen.com
Finite Element Analysis84
difference between maximum principal stress values of FRC0 and FRC0.2FRC1.4 observed at lower embrasure of mesial connector. On this note, Figure 29 shows the stress reduction ratios observed at mesial connector. Compared with FRC0 (107 MPa), FRC1.4 demonstrated the highest reduction ratio of 34% (70 MPa), while FRC0.2 demonstrated the lowest reduction ratio of 21% (84 MPa).
Minimum Maximum
FPDs
Minimum Maximum
GFR1.4
GFR FPDs Fig. 27. Depiction of stress vector
0
20
40
60
80
100
120
(MPa)
GFR0
GFR1.4 Fig. 28. Path plots of maximum principal stress on the bottom surface in all models
Fig. 29. Reduction ratios of maximum principal stress values observed at mesial connector
www.intechopen.com
Finite element analysis for dental prosthetic design 85
difference between maximum principal stress values of FRC0 and FRC0.2FRC1.4 observed at lower embrasure of mesial connector. On this note, Figure 29 shows the stress reduction ratios observed at mesial connector. Compared with FRC0 (107 MPa), FRC1.4 demonstrated the highest reduction ratio of 34% (70 MPa), while FRC0.2 demonstrated the lowest reduction ratio of 21% (84 MPa).
Minimum Maximum
FPDs
Minimum Maximum
GFR1.4
GFR FPDs Fig. 27. Depiction of stress vector
0
20
40
60
80
100
120
(MPa)
GFR0
GFR1.4 Fig. 28. Path plots of maximum principal stress on the bottom surface in all models
Fig. 29. Reduction ratios of maximum principal stress values observed at mesial connector
www.intechopen.com
Finite Element Analysis86
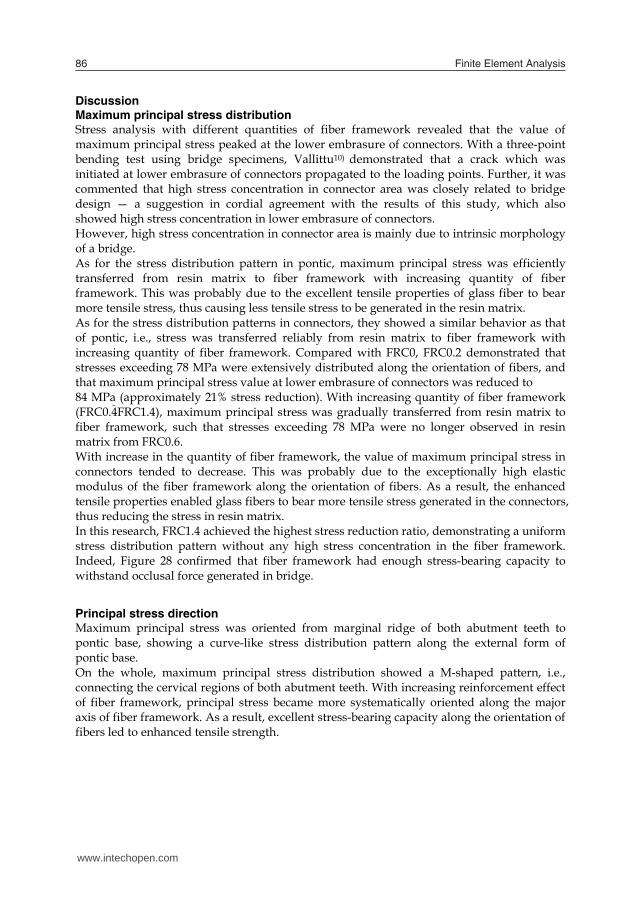
Discussion Maximum principal stress distribution Stress analysis with different quantities of fiber framework revealed that the value of maximum principal stress peaked at the lower embrasure of connectors. With a three-point bending test using bridge specimens, Vallittu10) demonstrated that a crack which was initiated at lower embrasure of connectors propagated to the loading points. Further, it was commented that high stress concentration in connector area was closely related to bridge design — a suggestion in cordial agreement with the results of this study, which also showed high stress concentration in lower embrasure of connectors. However, high stress concentration in connector area is mainly due to intrinsic morphology of a bridge. As for the stress distribution pattern in pontic, maximum principal stress was efficiently transferred from resin matrix to fiber framework with increasing quantity of fiber framework. This was probably due to the excellent tensile properties of glass fiber to bear more tensile stress, thus causing less tensile stress to be generated in the resin matrix. As for the stress distribution patterns in connectors, they showed a similar behavior as that of pontic, i.e., stress was transferred reliably from resin matrix to fiber framework with increasing quantity of fiber framework. Compared with FRC0, FRC0.2 demonstrated that stresses exceeding 78 MPa were extensively distributed along the orientation of fibers, and that maximum principal stress value at lower embrasure of connectors was reduced to 84 MPa (approximately 21% stress reduction). With increasing quantity of fiber framework (FRC0.4FRC1.4), maximum principal stress was gradually transferred from resin matrix to fiber framework, such that stresses exceeding 78 MPa were no longer observed in resin matrix from FRC0.6. With increase in the quantity of fiber framework, the value of maximum principal stress in connectors tended to decrease. This was probably due to the exceptionally high elastic modulus of the fiber framework along the orientation of fibers. As a result, the enhanced tensile properties enabled glass fibers to bear more tensile stress generated in the connectors, thus reducing the stress in resin matrix. In this research, FRC1.4 achieved the highest stress reduction ratio, demonstrating a uniform stress distribution pattern without any high stress concentration in the fiber framework. Indeed, Figure 28 confirmed that fiber framework had enough stress-bearing capacity to withstand occlusal force generated in bridge.
Principal stress direction Maximum principal stress was oriented from marginal ridge of both abutment teeth to pontic base, showing a curve-like stress distribution pattern along the external form of pontic base. On the whole, maximum principal stress distribution showed a M-shaped pattern, i.e., connecting the cervical regions of both abutment teeth. With increasing reinforcement effect of fiber framework, principal stress became more systematically oriented along the major axis of fiber framework. As a result, excellent stress-bearing capacity along the orientation of fibers led to enhanced tensile strength.
The Optimum thickness of fiber framework In clinical scenarios with a typically limited occlusal clearance, it is highly critical that reinforcement effect be optimized with a relatively small quantity of fiber framework. In this connection, it has been reported — from a structural and mechanical perspective — that fiber framework be reinforced with 0.61.4 mm thickness for 1.5-mm occlusal clearance. Moreover, the higher the quantity of fiber framework, the greater was the reinforcement effect. However, when reinforcement exceeded 0.6 mm, stress-bearing capacity did not improve significantly; on the contrary, a lower stress reduction ratio was yielded. Therefore, it did not seem necessary for fiber framework thickness to be more than 0.6 mm to withstand an average adult’s masticatory force in the molar region. Moreover, from esthetic and biomechanical standpoints, at least 0.5 mm of occlusal surface must be overlaid with a veneering composite with highly filled ceramic particles — otherwise, esthetics will be compromised. Putting both stress reduction findings and esthetic/biomechanical considerations together, 0.61.0 mm thickness seemed to be both adequate and appropriate to achieve the desired reinforcement effect, with more than one third of occlusal clearance placed with fiber framework.
Conclusions 1. Results of finite element analysis showed that for all fiber-reinforced models, the fiber framework bore the maximum principal stress. With FRC0, maximum principal stress of 107 MPa was observed at lower embrasure of connectors. With FRC1.4, on the other hand, only a maximum principal stress of 70 MPa was observed, indicating approximately 34% stress reduction. 2. In terms of quantified displacement, an area of displacement peaking at 0.02 mm was distributed extensively from occlusal surface to pontic base in FRC0, but which was reduced to a limited area of occlusal surface in FRC1.4. By increasing the quantity of fiber framework, quantified displacement at pontic was reduced, thereby improving significantly the rigidity of bridge. 3. Significant stress reduction was found in FRC0.2FRC0.6 models, but stress reduction seemingly remained unchanged in FRC0.6FRC1.4. The present test results revealed that magnitude and distribution of stress were influenced by the thickness of fiber framework, whereby 0.6 mm of vertical reinforcement was deemed both necessary and adequate from a structural and mechanical perspective.
3rd analysis: Introduction For successful function of the FRC FPD for a long period of time, it is important to clarify biomechanical behavior of posterior FPD, in terms of magnitude of stress, stress distribution pattern and displacement under functional loading. Biomechanical information related to occlusal conditions will be useful in preparing guidelines for clinical applications of FRC FPD. 3rd analysis focused to the design of the FPD, especially on the possible need of additional FRC support for the pontic. Two types of loading conditions, i.e. against vertical occlusal load, and loading the cusp in lateral movement of jaw, on mechanical behavior of the pontic
www.intechopen.com
Finite element analysis for dental prosthetic design 87
Discussion Maximum principal stress distribution Stress analysis with different quantities of fiber framework revealed that the value of maximum principal stress peaked at the lower embrasure of connectors. With a three-point bending test using bridge specimens, Vallittu10) demonstrated that a crack which was initiated at lower embrasure of connectors propagated to the loading points. Further, it was commented that high stress concentration in connector area was closely related to bridge design — a suggestion in cordial agreement with the results of this study, which also showed high stress concentration in lower embrasure of connectors. However, high stress concentration in connector area is mainly due to intrinsic morphology of a bridge. As for the stress distribution pattern in pontic, maximum principal stress was efficiently transferred from resin matrix to fiber framework with increasing quantity of fiber framework. This was probably due to the excellent tensile properties of glass fiber to bear more tensile stress, thus causing less tensile stress to be generated in the resin matrix. As for the stress distribution patterns in connectors, they showed a similar behavior as that of pontic, i.e., stress was transferred reliably from resin matrix to fiber framework with increasing quantity of fiber framework. Compared with FRC0, FRC0.2 demonstrated that stresses exceeding 78 MPa were extensively distributed along the orientation of fibers, and that maximum principal stress value at lower embrasure of connectors was reduced to 84 MPa (approximately 21% stress reduction). With increasing quantity of fiber framework (FRC0.4FRC1.4), maximum principal stress was gradually transferred from resin matrix to fiber framework, such that stresses exceeding 78 MPa were no longer observed in resin matrix from FRC0.6. With increase in the quantity of fiber framework, the value of maximum principal stress in connectors tended to decrease. This was probably due to the exceptionally high elastic modulus of the fiber framework along the orientation of fibers. As a result, the enhanced tensile properties enabled glass fibers to bear more tensile stress generated in the connectors, thus reducing the stress in resin matrix. In this research, FRC1.4 achieved the highest stress reduction ratio, demonstrating a uniform stress distribution pattern without any high stress concentration in the fiber framework. Indeed, Figure 28 confirmed that fiber framework had enough stress-bearing capacity to withstand occlusal force generated in bridge.
Principal stress direction Maximum principal stress was oriented from marginal ridge of both abutment teeth to pontic base, showing a curve-like stress distribution pattern along the external form of pontic base. On the whole, maximum principal stress distribution showed a M-shaped pattern, i.e., connecting the cervical regions of both abutment teeth. With increasing reinforcement effect of fiber framework, principal stress became more systematically oriented along the major axis of fiber framework. As a result, excellent stress-bearing capacity along the orientation of fibers led to enhanced tensile strength.
The Optimum thickness of fiber framework In clinical scenarios with a typically limited occlusal clearance, it is highly critical that reinforcement effect be optimized with a relatively small quantity of fiber framework. In this connection, it has been reported — from a structural and mechanical perspective — that fiber framework be reinforced with 0.61.4 mm thickness for 1.5-mm occlusal clearance. Moreover, the higher the quantity of fiber framework, the greater was the reinforcement effect. However, when reinforcement exceeded 0.6 mm, stress-bearing capacity did not improve significantly; on the contrary, a lower stress reduction ratio was yielded. Therefore, it did not seem necessary for fiber framework thickness to be more than 0.6 mm to withstand an average adult’s masticatory force in the molar region. Moreover, from esthetic and biomechanical standpoints, at least 0.5 mm of occlusal surface must be overlaid with a veneering composite with highly filled ceramic particles — otherwise, esthetics will be compromised. Putting both stress reduction findings and esthetic/biomechanical considerations together, 0.61.0 mm thickness seemed to be both adequate and appropriate to achieve the desired reinforcement effect, with more than one third of occlusal clearance placed with fiber framework.
Conclusions 1. Results of finite element analysis showed that for all fiber-reinforced models, the fiber framework bore the maximum principal stress. With FRC0, maximum principal stress of 107 MPa was observed at lower embrasure of connectors. With FRC1.4, on the other hand, only a maximum principal stress of 70 MPa was observed, indicating approximately 34% stress reduction. 2. In terms of quantified displacement, an area of displacement peaking at 0.02 mm was distributed extensively from occlusal surface to pontic base in FRC0, but which was reduced to a limited area of occlusal surface in FRC1.4. By increasing the quantity of fiber framework, quantified displacement at pontic was reduced, thereby improving significantly the rigidity of bridge. 3. Significant stress reduction was found in FRC0.2FRC0.6 models, but stress reduction seemingly remained unchanged in FRC0.6FRC1.4. The present test results revealed that magnitude and distribution of stress were influenced by the thickness of fiber framework, whereby 0.6 mm of vertical reinforcement was deemed both necessary and adequate from a structural and mechanical perspective.
3rd analysis: Introduction For successful function of the FRC FPD for a long period of time, it is important to clarify biomechanical behavior of posterior FPD, in terms of magnitude of stress, stress distribution pattern and displacement under functional loading. Biomechanical information related to occlusal conditions will be useful in preparing guidelines for clinical applications of FRC FPD. 3rd analysis focused to the design of the FPD, especially on the possible need of additional FRC support for the pontic. Two types of loading conditions, i.e. against vertical occlusal load, and loading the cusp in lateral movement of jaw, on mechanical behavior of the pontic
www.intechopen.com
Finite Element Analysis88
and connecter of hybrid composite FPD and FRC FPD were studied. Stress and displacement generated within the FPD was studied by 3-D FE method.
Material and methods Definition of structures Figure 30 shows a three-dimensional model of three-unit FPD from mandibular second premolar to mandibular second molar replacing the mandibular first molar. To create a finite element model, a FPD replica was fabricated. The geometry of the abutment replica has been described by Wheeler. Sanitary pontic design was chosen for missing mandibular first molar. The thickness and width of connectors of the FPD were followed described in other author’s report. A replica was measured with 0.75 mm intervals using 3-D coordinate measuring machine (Micro Scribe 3D, Micro Scribe Inc., San Jose, USA), captured data was plotted on 3-D CAD (Mechanical Desktop R2.0, Auto Desk Inc., California, USA) to construct 3-D solid model. The model was inputted into FE analysis software (ANSYS 10.0 Sp, ANSYS Inc., Houston, USA). A 1.8mm occlusal clearance from pit and fissure, 1.0mm cervical clearance and shoulder margin were prepared for assumed jacket crown. The FRC framework used in this study was 0.7mm in height and 2.1mm in width, and consisted of three continuous curvatures of mesial connector, pontic and distal connector, having an each individual curvature. The FRC framework was placed as well as from mesial side of mandibular second premolar to distal side of mandibular second molar.
Fig. 30. Structure of the FRC-FPD used in this study
Material properties, load case and data processing Veneering material was supposed to be hybrid composite resin (Estenia, Kuraray medical Inc., Tokyo, Japan) and it was assumed to be isotropic material. FRC framework was supposed to be unidirectional glass fiber and it was assumed to be anisotropic material. Hexagonal elements with 8 nodes were chosen for cross-sectionally anisotropic FRC framework, in the same way, hexagonal elements with 20 nodes were chosen for hybrid resin-dentin-pulp continuum, and a 3-D finite element model consisting of 70,393 elements with 155,070 nodes was created. To define FRC framework as rectangular anisotropic material, curvature of FRC framework was to be consisted of three continuous curvatures of mesial connector, pontic and distal connector, having an each individual curvature. A new central coordinate of the circle was established for each curvature. Thus, longitudinal axes of glass fibers and 3-D FRC framework were parallel. The final element in all directions of FE model base was fixed, which was defined as boundary condition. Two loading conditions, i.e. against vertical occlusal force referred as vertical load, and loading the cusp in lateral movement of jaw were tested in the model (Figure 31). The latter is referred as lateral load. A total of 629N vertical load was applied to eight points on the occlusal surface of the pontic to simulate maximum occlusal force31,45). To simulate loading cusp in lateral movement of jaw, a total of 250 N was applied to three points of the pontic (buccal-cusp incline) at an angle of 45 degrees from lingual direction46,47). FE analysis was presumed to be linear static. Finite element model construction and FE analysis were performed on PC workstation (Precision Work Station 670, Dell Inc., Texas, USA) using FE analysis software ANSYS 10.0 Sp. In considering biomechanical properties of hybrid resin, maximum principal stress and displacement were used to demonstrate the results at certain cross-sections and on the surface of the FPD.
Fig. 31. Loading conditions used in this study (a: Lateral load b: Vertical load)
www.intechopen.com
Finite element analysis for dental prosthetic design 89
and connecter of hybrid composite FPD and FRC FPD were studied. Stress and displacement generated within the FPD was studied by 3-D FE method.
Material and methods Definition of structures Figure 30 shows a three-dimensional model of three-unit FPD from mandibular second premolar to mandibular second molar replacing the mandibular first molar. To create a finite element model, a FPD replica was fabricated. The geometry of the abutment replica has been described by Wheeler. Sanitary pontic design was chosen for missing mandibular first molar. The thickness and width of connectors of the FPD were followed described in other author’s report. A replica was measured with 0.75 mm intervals using 3-D coordinate measuring machine (Micro Scribe 3D, Micro Scribe Inc., San Jose, USA), captured data was plotted on 3-D CAD (Mechanical Desktop R2.0, Auto Desk Inc., California, USA) to construct 3-D solid model. The model was inputted into FE analysis software (ANSYS 10.0 Sp, ANSYS Inc., Houston, USA). A 1.8mm occlusal clearance from pit and fissure, 1.0mm cervical clearance and shoulder margin were prepared for assumed jacket crown. The FRC framework used in this study was 0.7mm in height and 2.1mm in width, and consisted of three continuous curvatures of mesial connector, pontic and distal connector, having an each individual curvature. The FRC framework was placed as well as from mesial side of mandibular second premolar to distal side of mandibular second molar.
Fig. 30. Structure of the FRC-FPD used in this study
Material properties, load case and data processing Veneering material was supposed to be hybrid composite resin (Estenia, Kuraray medical Inc., Tokyo, Japan) and it was assumed to be isotropic material. FRC framework was supposed to be unidirectional glass fiber and it was assumed to be anisotropic material. Hexagonal elements with 8 nodes were chosen for cross-sectionally anisotropic FRC framework, in the same way, hexagonal elements with 20 nodes were chosen for hybrid resin-dentin-pulp continuum, and a 3-D finite element model consisting of 70,393 elements with 155,070 nodes was created. To define FRC framework as rectangular anisotropic material, curvature of FRC framework was to be consisted of three continuous curvatures of mesial connector, pontic and distal connector, having an each individual curvature. A new central coordinate of the circle was established for each curvature. Thus, longitudinal axes of glass fibers and 3-D FRC framework were parallel. The final element in all directions of FE model base was fixed, which was defined as boundary condition. Two loading conditions, i.e. against vertical occlusal force referred as vertical load, and loading the cusp in lateral movement of jaw were tested in the model (Figure 31). The latter is referred as lateral load. A total of 629N vertical load was applied to eight points on the occlusal surface of the pontic to simulate maximum occlusal force31,45). To simulate loading cusp in lateral movement of jaw, a total of 250 N was applied to three points of the pontic (buccal-cusp incline) at an angle of 45 degrees from lingual direction46,47). FE analysis was presumed to be linear static. Finite element model construction and FE analysis were performed on PC workstation (Precision Work Station 670, Dell Inc., Texas, USA) using FE analysis software ANSYS 10.0 Sp. In considering biomechanical properties of hybrid resin, maximum principal stress and displacement were used to demonstrate the results at certain cross-sections and on the surface of the FPD.
Fig. 31. Loading conditions used in this study (a: Lateral load b: Vertical load)
www.intechopen.com
Finite Element Analysis90
Results In the study, the maximum principle stress (Pmax, MPa) and the displacement (mm) were used to assess the stress distribution of FRC-FPD. The maximum principle stress and the displacement distributions are shown in Figs. 6, 7, 8, and 9. A color scale with 8 stress values served to measure quantitatively the stress distribution in the model components. The scaling was selected not to represent the yield strength but rather to provide clear visualization of the region of stress. However in the results of maximum principle stress, the range of less than 80 MPa (yellow), from 80 to 90 MPa (orange) and more than 90 MPa (red) were focused. Because the tensile strength of hybrid composite (ESTENIA) is nearly 90 MPa.
Displacement at the pontic Lateral load (Figure 32): Surface and mesiodistal cross-section C-FPD showed relatively large displacement of up to 0.04 mm at one third of the buccal side of the pontic. The largest displacement of 0.05~0.07 mm was observed from buccal groove to distobuccal cusp. Displacement of FRC-FPD was 0.03~0.04 mm being slightly less than that of C-FPD. The displacement distribution between C-FPD and FRC-FPD showed similar patterns.
Buccolingual cross-section On lingual side, displacement of 0.02~0.03mm at C-FPD was observed at one third of the central part of the pontic. Displacement of 0.03~0.04 mm was observed from one third of central part of the pontic to buccal direction. Displacement of 0.04~0.05mmwas observed from buccal one third to buccal side. The largest displacement (0.05~0.07mm) was found at the upper outermost surface of buccal side, buccal groove and its surrounding area. Compared displacement distribution of FRC-FPD with that of C-FPD, it showed a similar pattern.
Vertical load (Figure 33): Surface and mesiodistal cross-section The largest displacement of C-FPD (0.05~0.07mm) was seen from buccal one third of the pontic to buccal cusp of the pontic and to pontic base. Calculation of FRC-FPD showed a similar displacement distribution than that of around the connector. However, the largest displacement (0.05~0.07mm) was lower in the pontic area.
Buccolingual cross-section C-FPD showed displacement of 0.04~0.05mm from lingual side to the middle of the pontic. The largest displacement of 0.05~0.07mm was found from the middle to buccal side of the pontic. Displacement of FRC-FPD was 0.04~0.05mmwas seen through the whole pontic.
0
0.002 0.005 0.01 0.02 0.03 0.04 0.05
0.07
(mm) A B C Fig. 32. Displacement of the pontic against lateral load Upper: C-FPD. Lower: FRC-FPD. A; Surface view of buccal side. B; Mesiodistal section. C; Buccolingual section 0
0.002 0.005 0.01 0.02 0.03 0.04 0.05
0.07
(mm) A B C
Fig. 33. Displacement of the pontic against vertical load Upper: C-FPD. Lower: FRC-FPD A; Surface view of buccal side. B; Mesiodistal section. C; Buccolingual section
www.intechopen.com
Finite element analysis for dental prosthetic design 91
Results In the study, the maximum principle stress (Pmax, MPa) and the displacement (mm) were used to assess the stress distribution of FRC-FPD. The maximum principle stress and the displacement distributions are shown in Figs. 6, 7, 8, and 9. A color scale with 8 stress values served to measure quantitatively the stress distribution in the model components. The scaling was selected not to represent the yield strength but rather to provide clear visualization of the region of stress. However in the results of maximum principle stress, the range of less than 80 MPa (yellow), from 80 to 90 MPa (orange) and more than 90 MPa (red) were focused. Because the tensile strength of hybrid composite (ESTENIA) is nearly 90 MPa.
Displacement at the pontic Lateral load (Figure 32): Surface and mesiodistal cross-section C-FPD showed relatively large displacement of up to 0.04 mm at one third of the buccal side of the pontic. The largest displacement of 0.05~0.07 mm was observed from buccal groove to distobuccal cusp. Displacement of FRC-FPD was 0.03~0.04 mm being slightly less than that of C-FPD. The displacement distribution between C-FPD and FRC-FPD showed similar patterns.
Buccolingual cross-section On lingual side, displacement of 0.02~0.03mm at C-FPD was observed at one third of the central part of the pontic. Displacement of 0.03~0.04 mm was observed from one third of central part of the pontic to buccal direction. Displacement of 0.04~0.05mmwas observed from buccal one third to buccal side. The largest displacement (0.05~0.07mm) was found at the upper outermost surface of buccal side, buccal groove and its surrounding area. Compared displacement distribution of FRC-FPD with that of C-FPD, it showed a similar pattern.
Vertical load (Figure 33): Surface and mesiodistal cross-section The largest displacement of C-FPD (0.05~0.07mm) was seen from buccal one third of the pontic to buccal cusp of the pontic and to pontic base. Calculation of FRC-FPD showed a similar displacement distribution than that of around the connector. However, the largest displacement (0.05~0.07mm) was lower in the pontic area.
Buccolingual cross-section C-FPD showed displacement of 0.04~0.05mm from lingual side to the middle of the pontic. The largest displacement of 0.05~0.07mm was found from the middle to buccal side of the pontic. Displacement of FRC-FPD was 0.04~0.05mmwas seen through the whole pontic.
0
0.002 0.005 0.01 0.02 0.03 0.04 0.05
0.07
(mm) A B C Fig. 32. Displacement of the pontic against lateral load Upper: C-FPD. Lower: FRC-FPD. A; Surface view of buccal side. B; Mesiodistal section. C; Buccolingual section 0
0.002 0.005 0.01 0.02 0.03 0.04 0.05
0.07
(mm) A B C
Fig. 33. Displacement of the pontic against vertical load Upper: C-FPD. Lower: FRC-FPD A; Surface view of buccal side. B; Mesiodistal section. C; Buccolingual section
www.intechopen.com
Finite Element Analysis92
Maximum principal stress at the pontic Lateral load (Figure 34): Surface and mesiodistal cross-section In calculation of maximum principal stress of C-FPD, 70~80 MPa was distributed to areas including pontic base of distal connector and within a pontic. Maximum principal stress of the FRC-FPD, i.e. 80~90 MPa was distributed to the FRC framework of distal connector.
Buccolingual cross-section In C-FPD, 15~30 MPa principal stresses were distributed to the area from the middle of the pontic to the buccal direction as well as to cusp and fossa on the occlusal surface. Maximum principal stress of FRC-FPD, 15~30 MPa was distributed to the areas from one third of thr pontic to the buccal direction of the pontic. Higher than 30 MPa stresses were exclusively found in FRC framework surrounded by around buccal side of pontic base. Compressive stresses were observed in the center of the pontic. -50
0 15 30 60 70 80 90
140
(MPa) A B C Fig. 34. Maximum principal stress of the pontic against lateral load Upper: C-FPD. Lower: FRC-FPD A; Surface view of buccal side. B; Mesiodistal section. C; Buccolingual section
Vertical load (Figure 35) Surface and mesiodistal cross-section Maximum principal stress of C-FPD, higher than 90 MPa was distributed to the area including pontic’s of distal connector as well as to the inner portion of the pontic. In FRC-FPD, higher than 90 MPa principal stresses were found in the FRC framework surrounded by the pontic side of lower embrasure of distal connector, but its area was reduced compared with C-FPD. In a buccoligal section of C-FPD, 15~30 MPa principal stresses were distributed to the area from the middle to the lower one third of the pontic,
and to cusp and fossa in the occlusal surface. Maximum principal stress of FRC-FPD was 15~30 MPa in the middle to lower one third of the pontic, in the cusp and fossa, demonstrating similar stress distribution pattern of that of C-FPD. Compressive stress was observed in the middle of the pontic. -50
0 15 30 60 70 80 90
140
(MPa) A B C Fig. 35. Maximum principal stress of the pontic against vertical load Upper: C-FPD. Lower: FRC-FPD A; Surface view of buccal side. B; Mesiodistal section. C; Buccolingual section
Displacement at the connecter Lateral load: Surface and mesiodistal cross-section Figure 36 C-FPD showed the largest displacement of 0.05-0.07 mm and was observed at the buccal groove to the distobuccal cusp around loading points. Displacement of the FRC-FPD was 0.03-0.04 mm being slightly less than that for the C-FPD. The displacement distribution between C-FPD and FRC-FPD showed similar patterns.
Buccolingual cross section of mesial connector Figure 37 Displacement for C-FPD was 0.01-0.02 mm and the displacement area was located in the middle of connector base and on lingual side. Displacement of FRC-FPD was 0.01-0.02 mm and the displacement area was found in the middle part of the connector base and the stress at the lingual side was lower compared with C-FPD.
Buccolingul cross section of distal connector Figure 37 Displacement for C-FPD was 0.03-0.04 mm and the displacement area was at the buccal side of the distal connector. Displacement distribution pattern of FRC-FPD as whole was close to that of C-FPD.
www.intechopen.com
Finite element analysis for dental prosthetic design 93
Maximum principal stress at the pontic Lateral load (Figure 34): Surface and mesiodistal cross-section In calculation of maximum principal stress of C-FPD, 70~80 MPa was distributed to areas including pontic base of distal connector and within a pontic. Maximum principal stress of the FRC-FPD, i.e. 80~90 MPa was distributed to the FRC framework of distal connector.
Buccolingual cross-section In C-FPD, 15~30 MPa principal stresses were distributed to the area from the middle of the pontic to the buccal direction as well as to cusp and fossa on the occlusal surface. Maximum principal stress of FRC-FPD, 15~30 MPa was distributed to the areas from one third of thr pontic to the buccal direction of the pontic. Higher than 30 MPa stresses were exclusively found in FRC framework surrounded by around buccal side of pontic base. Compressive stresses were observed in the center of the pontic. -50
0 15 30 60 70 80 90
140
(MPa) A B C Fig. 34. Maximum principal stress of the pontic against lateral load Upper: C-FPD. Lower: FRC-FPD A; Surface view of buccal side. B; Mesiodistal section. C; Buccolingual section
Vertical load (Figure 35) Surface and mesiodistal cross-section Maximum principal stress of C-FPD, higher than 90 MPa was distributed to the area including pontic’s of distal connector as well as to the inner portion of the pontic. In FRC-FPD, higher than 90 MPa principal stresses were found in the FRC framework surrounded by the pontic side of lower embrasure of distal connector, but its area was reduced compared with C-FPD. In a buccoligal section of C-FPD, 15~30 MPa principal stresses were distributed to the area from the middle to the lower one third of the pontic,
and to cusp and fossa in the occlusal surface. Maximum principal stress of FRC-FPD was 15~30 MPa in the middle to lower one third of the pontic, in the cusp and fossa, demonstrating similar stress distribution pattern of that of C-FPD. Compressive stress was observed in the middle of the pontic. -50
0 15 30 60 70 80 90
140
(MPa) A B C Fig. 35. Maximum principal stress of the pontic against vertical load Upper: C-FPD. Lower: FRC-FPD A; Surface view of buccal side. B; Mesiodistal section. C; Buccolingual section
Displacement at the connecter Lateral load: Surface and mesiodistal cross-section Figure 36 C-FPD showed the largest displacement of 0.05-0.07 mm and was observed at the buccal groove to the distobuccal cusp around loading points. Displacement of the FRC-FPD was 0.03-0.04 mm being slightly less than that for the C-FPD. The displacement distribution between C-FPD and FRC-FPD showed similar patterns.
Buccolingual cross section of mesial connector Figure 37 Displacement for C-FPD was 0.01-0.02 mm and the displacement area was located in the middle of connector base and on lingual side. Displacement of FRC-FPD was 0.01-0.02 mm and the displacement area was found in the middle part of the connector base and the stress at the lingual side was lower compared with C-FPD.
Buccolingul cross section of distal connector Figure 37 Displacement for C-FPD was 0.03-0.04 mm and the displacement area was at the buccal side of the distal connector. Displacement distribution pattern of FRC-FPD as whole was close to that of C-FPD.
www.intechopen.com
Finite Element Analysis94
Vertical load: Surface and mesiodistal cross-section Figure 38 The largest displacement of C-FPD (0.05-0.07 mm) was seen from buccal one third of the pontic to buccal cusp of the pontic and to the pontic base. Calculation of the FRC-FPD showed a similar displacement distribution around the connectors.
Buccolingul cross section of mesial connector Figure 39 Displacement of C-FPD was 0.02-0.03 mm and the displacement area was located from middle to lower part of the connector, whereas other areas showed 0.03-0.04 mm displacement. A similar displacement distribution pattern was observed between the FRC-FPD and the C-FPD.
Buccolingul cross section of distal connector Figure 39 In C-FPD, the largest displacement of 0.05-0.07 mm was seen at the outermost surface of the buccal side. Displacement of FRC-FPD was 0.05-0.07 mm. Although the displacement of FRC-FPD was similar to that of C-FPD, displacement quantification showed significant reduction.
Maximum principal stress at the connecter Lateral load: Surface and mesiodistal cross-section Figure 36 By calculating the maximum principal stress for C-FPD, a stress of 70-80 MPa was distributed to areas including pontic the of distal connector and also inside the pontic. Maximum principal stress of the FRC-FPD, 80-90 MPa, was distributed to the FRC framework of distal connector.
Buccolingual cross section of mesial connector Figure 37 Maximum principal stresses were above 90 MPa and they were distributed to the upper line angle of buccal side of the connector. Maximum principal stress was above 90 MPa and it located in the upper buccal side of connector.
Buccolingul cross section of distal connector Figure 37 Maximum principal stress was above 90 MPa. Displacement of FRC-FPD was 0.02-003 mm and the displacement area was minor compared with C-FPD. Maximum principal stress was higher than 90 MPa and the stresses were distributed to the bottom of fiber framework, indicating that stress of the distal connector was transferred to fiber framework.
Vertical load: Surface and mesiodistal cross-section Figure 38 Maximum principal stress of C-FPD was above 90 MPa and it was distributed to the area including pontic’s distal connector as well as to the inner portion of the pontic. In FRC-FPD, maximum principal stresses higher than 90 MPa were found in the FRC framework around the pontic side of lower embrasure of distal connector.
Buccolingul cross section of mesial connector Figure 39 When evaluated maximum principal stress, stresses higher than 90 MPa were distributed to the upper line angle of the buccal side of mesial connector. In addition, localized highest stress concentration of up to 120 MPa was observed in the same area (upper line angle of buccal side of mesial connector. In the maximum principal stress analysis, higher stresses than 90 MPa were observed in the outermost surface of the fiber framework of the lower connector. Comparison to the C-FPD demonstrated stresses being distributed more extensively from the lower part of the mesial connector to the buccal side of the mesial connector. Peak stress was found in the occlusal line angles and they were transferred from the hybrid composite matrix to the fiber framework.
Buccolingul cross section of distal connector Figure 39 In maximum principal stress calculation, higher than 90 MPa stresses were observed in the line angle of the lower lingual side as well as in the lingual and buccal sides of the central part of connector. When evaluated maximum principal stress, stresses higher than 90 MPa were found and they were distributed in the middle part of the distal connector in the C-FPD with a concentration to the bottom part of the fiber framework. This is suggesting stress-transferring mechanism of anisotropic fiber framework which enable distribute stress uniformly.
Fig. 36. Lateral load at a surface and mesiodistal cross section a: C-FPD. b: FRC-FPD
www.intechopen.com
Finite element analysis for dental prosthetic design 95
Vertical load: Surface and mesiodistal cross-section Figure 38 The largest displacement of C-FPD (0.05-0.07 mm) was seen from buccal one third of the pontic to buccal cusp of the pontic and to the pontic base. Calculation of the FRC-FPD showed a similar displacement distribution around the connectors.
Buccolingul cross section of mesial connector Figure 39 Displacement of C-FPD was 0.02-0.03 mm and the displacement area was located from middle to lower part of the connector, whereas other areas showed 0.03-0.04 mm displacement. A similar displacement distribution pattern was observed between the FRC-FPD and the C-FPD.
Buccolingul cross section of distal connector Figure 39 In C-FPD, the largest displacement of 0.05-0.07 mm was seen at the outermost surface of the buccal side. Displacement of FRC-FPD was 0.05-0.07 mm. Although the displacement of FRC-FPD was similar to that of C-FPD, displacement quantification showed significant reduction.
Maximum principal stress at the connecter Lateral load: Surface and mesiodistal cross-section Figure 36 By calculating the maximum principal stress for C-FPD, a stress of 70-80 MPa was distributed to areas including pontic the of distal connector and also inside the pontic. Maximum principal stress of the FRC-FPD, 80-90 MPa, was distributed to the FRC framework of distal connector.
Buccolingual cross section of mesial connector Figure 37 Maximum principal stresses were above 90 MPa and they were distributed to the upper line angle of buccal side of the connector. Maximum principal stress was above 90 MPa and it located in the upper buccal side of connector.
Buccolingul cross section of distal connector Figure 37 Maximum principal stress was above 90 MPa. Displacement of FRC-FPD was 0.02-003 mm and the displacement area was minor compared with C-FPD. Maximum principal stress was higher than 90 MPa and the stresses were distributed to the bottom of fiber framework, indicating that stress of the distal connector was transferred to fiber framework.
Vertical load: Surface and mesiodistal cross-section Figure 38 Maximum principal stress of C-FPD was above 90 MPa and it was distributed to the area including pontic’s distal connector as well as to the inner portion of the pontic. In FRC-FPD, maximum principal stresses higher than 90 MPa were found in the FRC framework around the pontic side of lower embrasure of distal connector.
Buccolingul cross section of mesial connector Figure 39 When evaluated maximum principal stress, stresses higher than 90 MPa were distributed to the upper line angle of the buccal side of mesial connector. In addition, localized highest stress concentration of up to 120 MPa was observed in the same area (upper line angle of buccal side of mesial connector. In the maximum principal stress analysis, higher stresses than 90 MPa were observed in the outermost surface of the fiber framework of the lower connector. Comparison to the C-FPD demonstrated stresses being distributed more extensively from the lower part of the mesial connector to the buccal side of the mesial connector. Peak stress was found in the occlusal line angles and they were transferred from the hybrid composite matrix to the fiber framework.
Buccolingul cross section of distal connector Figure 39 In maximum principal stress calculation, higher than 90 MPa stresses were observed in the line angle of the lower lingual side as well as in the lingual and buccal sides of the central part of connector. When evaluated maximum principal stress, stresses higher than 90 MPa were found and they were distributed in the middle part of the distal connector in the C-FPD with a concentration to the bottom part of the fiber framework. This is suggesting stress-transferring mechanism of anisotropic fiber framework which enable distribute stress uniformly.
Fig. 36. Lateral load at a surface and mesiodistal cross section a: C-FPD. b: FRC-FPD
www.intechopen.com
Finite Element Analysis96
Fig. 37. Lateral load at buccolingual cross section of mesial and distal connector a: C-FPD. b: FRC-FPD
Fig. 38. Vertical load at a surface and mesiodistal cross section a: C-FPD. b: FRC-FPD
Fig. 39. Vertical load at buccolingul cross section of mesial and distal connector a: C-FPD. b: FRC-FPD
Discussion In this modeling study, it was demonstrated that there are some differences in mechanical behavior of isotropic particulate composite resin and anisotropic FRC FPDs. Also, the stress distribution variation by changing the loading condition was seen. This is important because it has been reported that there might occur delamination of veneering composite from the FRC framework because at undesirable loading conditions (lateral load) with some framework design.
Mechanical behavior of the FPD under lateral load When taking into consideration the displacement distribution, no significant difference was found between C-FPD and FRC-FPD, showing a similar distribution pattern in all reference cross sections. Lateral load applied to incline of buccal-cusp from lingual direction caused bending force and it was concentrated at buccal side of the pontic. This is probably due to FRC framework placed on the bottom of the pontic could not exhibit good load-bearing capability and buccal-cusp was not veneered with high enough quantity of hybrid resin (insufficient thickness), which is most likely inducing delamination of the composite veneers. When compared maximum principal stress distribution of C-FPD with that of FRC-FPD, higher stress concentrations were not found at the pontics. Stress generated in the pontic of C-FPD was transferred from the areas to the bottom of the FRC framework with higher Young’s modulus material (horizontal cross-section) in the FRC-FPD. No significant
www.intechopen.com
Finite element analysis for dental prosthetic design 97
Fig. 37. Lateral load at buccolingual cross section of mesial and distal connector a: C-FPD. b: FRC-FPD
Fig. 38. Vertical load at a surface and mesiodistal cross section a: C-FPD. b: FRC-FPD
Fig. 39. Vertical load at buccolingul cross section of mesial and distal connector a: C-FPD. b: FRC-FPD
Discussion In this modeling study, it was demonstrated that there are some differences in mechanical behavior of isotropic particulate composite resin and anisotropic FRC FPDs. Also, the stress distribution variation by changing the loading condition was seen. This is important because it has been reported that there might occur delamination of veneering composite from the FRC framework because at undesirable loading conditions (lateral load) with some framework design.
Mechanical behavior of the FPD under lateral load When taking into consideration the displacement distribution, no significant difference was found between C-FPD and FRC-FPD, showing a similar distribution pattern in all reference cross sections. Lateral load applied to incline of buccal-cusp from lingual direction caused bending force and it was concentrated at buccal side of the pontic. This is probably due to FRC framework placed on the bottom of the pontic could not exhibit good load-bearing capability and buccal-cusp was not veneered with high enough quantity of hybrid resin (insufficient thickness), which is most likely inducing delamination of the composite veneers. When compared maximum principal stress distribution of C-FPD with that of FRC-FPD, higher stress concentrations were not found at the pontics. Stress generated in the pontic of C-FPD was transferred from the areas to the bottom of the FRC framework with higher Young’s modulus material (horizontal cross-section) in the FRC-FPD. No significant
www.intechopen.com
Finite Element Analysis98
difference in the displacement distribution pattern was noted between C-FPD and FRC-FPD. This may suggest that longitudinal FRC along the direction of framework does not provide any support for the veneer over the regular veneering composite.
Mechanical behavior of a bridge under vertical load Viewed from buccolingual cross section, the stress found in the side and the bottom of the pontic was transferred to the FRC framework, and relatively low stress of 30~60 MPa was found in the buccal side of the pontic base which was transferred to FRC framework, demonstrating good load-bearing capacity that FRC framework can withstand.
Occlusal contact and guideline for FRC framework design In this analysis, a total of 629N vertical load was applied to eight points on the occlusal surface of the pontic to simulate maximum occlusal force, and a total of 250N lateral load was applied to three points on buccal-cusp incline of the pontic at an angle of 45 degrees from lingual direction to simulate lateral movement of jaw. This can be considered as worst-case scenario loading condition when there is no cuspid protection available and teeth are loaded laterally. The most effective way to reduce stress concentration in mesiodistal connectors and buccal side of the pontic is to decrease magnitude or avoid occlusal contacts of buccal side of the pontic. Technically, the pontic can be reinforced by additional fibers on the main framework. It was suggested that in order to get better stress distribution to the FRC-FPD, the framework design should contain FRC perpendicular to that of main framework. To obtain optimal hygiene, function and esthetics, a wide variety of pontic design are proposed. As for occlusal morphology, buccolingual diameter of a pontic should be 2/3~3/4 smaller than that of a missing tooth, and as for occlusal contact, centric stop is defined as an important occlusal contact. Rudo48) et al suggested in his study that to resist twisting force generated in pontic, orthotropic FRC framework is more effective to anisotropic, unidirectional FRC framework with high strength and stiffness in one direction. Rudo48) et al also suggested the placement of FRC on the outermost surface of a bridge where crack might initiate. In considering plaque accumulation and esthetics, however, placinFRCC on the outermost surface of a bridge can be difficult. There are evidence that exposed fibers, especially polyethylene fibers adheres significant quantities of oral pathogens on the surface49-52). The authors suggest that it is more appropriate to place FRC framework to the bottom of the pontic, where crack might initiate. The results of this study indicate that high stress concentration in the connectors can be reduced by weakening contacts of buccal cusp When applied 250 N lateral loads to simulate loading the cusp in lateral movement of jaw, localized high stress concentrated in upper line angle of buccal side of mesial connector in C-FPD was disappeared by the reinforcement of FRC framework, avoiding high stress concentration. Peak stress value of 80 MPa is not likely to cause fracture or delamination of the veneer. When applying 629 N vertical load to simulate maximum occlusal force, higher than 90MPa stress were concentrated in upper line angle of the buccal side of the mesial connector and from lingual side to the bottom of the distal connector in C-FPD. The high stress concentration in the mesiodistal connectors was thought to have been caused by twisting moment imposed on the pontic. With the FRC-FPD, this localized high stress concentration area was subsequently transferred to be carried by the FRC framework, and
thus avoiding the high stress concentrations. In addition to stress-transfer mechanism, the FRC framework reinforcement also improved the rigidity of the FPD. FRC framework bore more than 90MPa of stress, but considering superb flexure strength and load-bearing capacity of the FRC framework, it corresponds to one seventh of flexure strength FRC framework exhibits. These test results confirmed that correctly designed FRC reinforced composite system possesses adequate strength and safety to withstand maximum occlusal force.
Conclusion These results clarified the magnitude, distribution of stress and displacement generated in C-FPD and FRC-FPD of pontic caused by two different loading conditions. The results suggested that in order to get better stress distribution to the FRC-FPD, the framework design should contain additional pontic FRC perpendicular to that of main framework.
4. References
Korioth TW, Versluis A. Modeling the mechanical behavior of the jaws and their related structures by finite element (FE) analysis. Crit Rev Oral Biol Med 1997; 8: 90-104.
Ausiello P, Apicella A, Davidson CL, Rengo S. 3D-finite element analyses of cusp movements in a human upper premolar, restored with adhesive resin-based composites. J Biomech 2001; 34: 1269-1277.
Ausiello P, Apicella A, Davidson CL. Effect of adhesive layer properties on stress distribution in composite restorations a 3D finite element analysis. Dent Mater 2002; 18: 295-303.
Ausiello P, Rengo S, Davidson CL, Watts DC. Stress distributions in adhesively cemented ceramic and resin-composite class II inlay restorations: a 3D-FEA study. Dent Mater 2004; 20: 862-872.
Cattaneo PM, Dalstra M, Frich LH. A three-dimensional finite element model from computed tomography data: a semi-automated method. Proc Inst Mech Eng [H] 2001; 215: 203-213.
Cattaneo PM, Dalstra M, Melsen B. The transfer of occlusal forces through the maxillary molars: a finite element study. Am J Orthod Dentofacial Orthop 2003; 123: 367-373.
Shinya K, Shinya A, Nakahara R, Nakasone Y, Shinya A. Characteristics of the Tooth in the Initial Movement: The Influence of the Restraint Site to the Periodontal Ligament and the Alveolar Bone. The Open Dentistry Journal 2009; 3: 61-67.
Ootaki M, Shinya A, Gomi H, Shinya A. Optimum design for fixed partial dentures made of hybrid resin with glass fiber reinforcement on finite element analysis: Effect of vertical reinforced thickness to fiber frame. Dent Mater J 2007; 26: 280-289.
Versluis A, Tantbirojn D, Pintado MR, DeLong R, Douglas WH. Residual shrinkage stress distributions in molars after composite restoration. Dent Mater 2004; 20: 554-564.
Vallittu PK. The effect of glass fiber reinforcement on the fracture resistance of a provisional fixed partial denture. J Prosthet Dent 1998; 79: 125-130.
Vallittu PK, Sevelius C. Resin-bonded, glass fiber-reinforced composite fixed partial dentures: A clinical study. J Prosthet Dent 2000; 84: 413418.
Bae JM, Kim KN, Hattori M, Hasegawa K, Yoshinari M, Kawada E, Oda Y. The flexural properties of fiber-reinforced composite with light-polymerized polymer-matrix. Int J Prosthodont 2001; 14: 3339.
www.intechopen.com
Finite element analysis for dental prosthetic design 99
difference in the displacement distribution pattern was noted between C-FPD and FRC-FPD. This may suggest that longitudinal FRC along the direction of framework does not provide any support for the veneer over the regular veneering composite.
Mechanical behavior of a bridge under vertical load Viewed from buccolingual cross section, the stress found in the side and the bottom of the pontic was transferred to the FRC framework, and relatively low stress of 30~60 MPa was found in the buccal side of the pontic base which was transferred to FRC framework, demonstrating good load-bearing capacity that FRC framework can withstand.
Occlusal contact and guideline for FRC framework design In this analysis, a total of 629N vertical load was applied to eight points on the occlusal surface of the pontic to simulate maximum occlusal force, and a total of 250N lateral load was applied to three points on buccal-cusp incline of the pontic at an angle of 45 degrees from lingual direction to simulate lateral movement of jaw. This can be considered as worst-case scenario loading condition when there is no cuspid protection available and teeth are loaded laterally. The most effective way to reduce stress concentration in mesiodistal connectors and buccal side of the pontic is to decrease magnitude or avoid occlusal contacts of buccal side of the pontic. Technically, the pontic can be reinforced by additional fibers on the main framework. It was suggested that in order to get better stress distribution to the FRC-FPD, the framework design should contain FRC perpendicular to that of main framework. To obtain optimal hygiene, function and esthetics, a wide variety of pontic design are proposed. As for occlusal morphology, buccolingual diameter of a pontic should be 2/3~3/4 smaller than that of a missing tooth, and as for occlusal contact, centric stop is defined as an important occlusal contact. Rudo48) et al suggested in his study that to resist twisting force generated in pontic, orthotropic FRC framework is more effective to anisotropic, unidirectional FRC framework with high strength and stiffness in one direction. Rudo48) et al also suggested the placement of FRC on the outermost surface of a bridge where crack might initiate. In considering plaque accumulation and esthetics, however, placinFRCC on the outermost surface of a bridge can be difficult. There are evidence that exposed fibers, especially polyethylene fibers adheres significant quantities of oral pathogens on the surface49-52). The authors suggest that it is more appropriate to place FRC framework to the bottom of the pontic, where crack might initiate. The results of this study indicate that high stress concentration in the connectors can be reduced by weakening contacts of buccal cusp When applied 250 N lateral loads to simulate loading the cusp in lateral movement of jaw, localized high stress concentrated in upper line angle of buccal side of mesial connector in C-FPD was disappeared by the reinforcement of FRC framework, avoiding high stress concentration. Peak stress value of 80 MPa is not likely to cause fracture or delamination of the veneer. When applying 629 N vertical load to simulate maximum occlusal force, higher than 90MPa stress were concentrated in upper line angle of the buccal side of the mesial connector and from lingual side to the bottom of the distal connector in C-FPD. The high stress concentration in the mesiodistal connectors was thought to have been caused by twisting moment imposed on the pontic. With the FRC-FPD, this localized high stress concentration area was subsequently transferred to be carried by the FRC framework, and
thus avoiding the high stress concentrations. In addition to stress-transfer mechanism, the FRC framework reinforcement also improved the rigidity of the FPD. FRC framework bore more than 90MPa of stress, but considering superb flexure strength and load-bearing capacity of the FRC framework, it corresponds to one seventh of flexure strength FRC framework exhibits. These test results confirmed that correctly designed FRC reinforced composite system possesses adequate strength and safety to withstand maximum occlusal force.
Conclusion These results clarified the magnitude, distribution of stress and displacement generated in C-FPD and FRC-FPD of pontic caused by two different loading conditions. The results suggested that in order to get better stress distribution to the FRC-FPD, the framework design should contain additional pontic FRC perpendicular to that of main framework.
4. References
Korioth TW, Versluis A. Modeling the mechanical behavior of the jaws and their related structures by finite element (FE) analysis. Crit Rev Oral Biol Med 1997; 8: 90-104.
Ausiello P, Apicella A, Davidson CL, Rengo S. 3D-finite element analyses of cusp movements in a human upper premolar, restored with adhesive resin-based composites. J Biomech 2001; 34: 1269-1277.
Ausiello P, Apicella A, Davidson CL. Effect of adhesive layer properties on stress distribution in composite restorations a 3D finite element analysis. Dent Mater 2002; 18: 295-303.
Ausiello P, Rengo S, Davidson CL, Watts DC. Stress distributions in adhesively cemented ceramic and resin-composite class II inlay restorations: a 3D-FEA study. Dent Mater 2004; 20: 862-872.
Cattaneo PM, Dalstra M, Frich LH. A three-dimensional finite element model from computed tomography data: a semi-automated method. Proc Inst Mech Eng [H] 2001; 215: 203-213.
Cattaneo PM, Dalstra M, Melsen B. The transfer of occlusal forces through the maxillary molars: a finite element study. Am J Orthod Dentofacial Orthop 2003; 123: 367-373.
Shinya K, Shinya A, Nakahara R, Nakasone Y, Shinya A. Characteristics of the Tooth in the Initial Movement: The Influence of the Restraint Site to the Periodontal Ligament and the Alveolar Bone. The Open Dentistry Journal 2009; 3: 61-67.
Ootaki M, Shinya A, Gomi H, Shinya A. Optimum design for fixed partial dentures made of hybrid resin with glass fiber reinforcement on finite element analysis: Effect of vertical reinforced thickness to fiber frame. Dent Mater J 2007; 26: 280-289.
Versluis A, Tantbirojn D, Pintado MR, DeLong R, Douglas WH. Residual shrinkage stress distributions in molars after composite restoration. Dent Mater 2004; 20: 554-564.
Vallittu PK. The effect of glass fiber reinforcement on the fracture resistance of a provisional fixed partial denture. J Prosthet Dent 1998; 79: 125-130.
Vallittu PK, Sevelius C. Resin-bonded, glass fiber-reinforced composite fixed partial dentures: A clinical study. J Prosthet Dent 2000; 84: 413418.
Bae JM, Kim KN, Hattori M, Hasegawa K, Yoshinari M, Kawada E, Oda Y. The flexural properties of fiber-reinforced composite with light-polymerized polymer-matrix. Int J Prosthodont 2001; 14: 3339.
www.intechopen.com
Finite Element Analysis100
Lastumaki TM, Kallio TT, Vallittu PK. The bond strength of light-curing composite resin to finally polymerzed and aged glass fiber-reinforced composite substrate. Biomaterials 2002; 23: 4533-4539.
Handa I, Shinya A, Gomi H, Sailynoja ES. Bending strength of fiber reinforced posterior hybrid resin material. J J Dent Mater 2003; 22:171180.
Sailynoja ES, Shin-ya A, Gomi H, Ishii Y. The effect of immersion temperature on the flexural strength of a pre-coated fiber reinforced composite resin. Prosthodont Res Pract 2003; 2:110.
Nakamura T, Waki T, Kinuta S, Tanaka H. Strength and elastic modulus of fiber-reinforced composites used for fabricating FPDs. Int J Prosthodont 2003; 16:549553.
Drummond JL, Bapna MS. Static and cyclic loading of fiber-reinforced dental resin. Dent Mater 2003; 19:226231.
Tezvergil A, Lassila LVJ, Vallittu PK. Composite-composite repair bond strength. Effectof adhesion primers. J Dent 2003; 31: 521-525.
Tezvergil A, Lassila LVJ, Vallittu PK. Strength of adhesive-bonded fiber-reinforced composites to enamel and dentin substrates. J Adhes Dent 2003; 5: 301-311.
Vallittu PK. Survival rates of resin-bonded, glass fiber-reinforced composite fixed partial dentures with a mean follow-up of 42 months: A pilot study. J Prosthet Dent 2004; 91:241246.
Sailynoja ES, Shin-ya A, Koskinen MK, Salonen JI, Masuda T, Shin-ya A et al. Heat curing of UTMA-based hybrid resin: Effects on the degree of conversion and cytotoxicity. Odontology 2004; 92: 2735.
Shimizu K, Shinya A, Gomi H, Nakasone Y. Fatigue properties of hybrid resin with glass fiber reinforcement ; The influence of cyclic loading, glass fiber reinforcement and test environments. J J Dent Mater 2004; 23:294305.
Bae JM, Kim KN, Hattori M, Hasegawa K, Yoshinari M, Kawada E, et al. Fatigue strengths of particulate filler composites reinforced with fibers. Dent Mater J 2004; 23:166174.
Lassila LVJ, Tezvergil A, Lahdenpera M, Alander P, Shin-ya A, Shin-ya A, et al. Evaluation of some properties of two fiber-reinforced composite materials. Acta Odontol Scand 2005; 63:196204.
Nakamura T, Ohyama T, Waki T, Kinuta S, Wakabayashi K, Takano N,et al. Finite element analysis of fiber-reinforced fixed partial dentures. Dent Mater J 2005; 24:275279.
Fennis WM, Tezvergil A, Kuijs RH, Lassila LVJ, Kreulen CM, Creugers NH, et al. In vitro fracture resistance of fiber reinforced cusp-replacing composite restorations. Dent Mater 2005; 21: 565-572.
Waki T, Nakamura T, Nakamura T, Kinuta S, Wakabayashi K, Yatani H. Fracture resistance of inlay-retained fixed partial dentures reinforced with fiber-reinforced composite. Dent Mater J 2006; 25:16.
Shinya A, Matsuda T, Shinya A, Nakasone Y. Hybrid resin fixed partial dentures reinforced with glass fiber: Optimum posterior fiber frame design with finite element analysis. J J Dent Mater 2004; 23: 183192.
Fujita T. Textbook of Dental Anatomy, ed 22. Tokyo; Kanehara,1995:75–104. el-Ebrashi MK, Craig RG, Peyton FA. Experimental stress analysis of dental restorations. VII:
Structural design and stress analysis of fixed partial dentures. J Prosthet Dent 1970;23:177–186.
Krejci I, Reich T, Lutz F, Albertoni M. An in vitro test procedure for evaluating dental restoration systems. 1. A computer-controlled mastication simulator [in German]. Schweiz Monatsschr Zahnmed 1990;100:953–960.
Belvedere PC. Single-sitting, fiber-reinforced fixed bridges for the missing lateral or central incisors in adolescent patients. Dent Clin North Am 1998;42:665–682.
Göhring TN, Mörmann WH, Lutz F. Clinical and scanning electron microscopic evaluation of fiber-reinforced inlay fixed partial den-tures: Preliminary results after one year. J Prosthet Dent 1999;82:662–668.
Shinya A, Matsuda T, Shinya A, Nakasone Y. Hybrid resin fixed partial dentures reinforced with glass fiber -Optimum posterior fiber frame design with finite element analysis-. J J Dent Mater 2004;23:186-192.
Farah JW, Craig RG, Merouel KA. Finite element analysis of a mandibular model. J Oral Rehabil 1988;15:615-624.
Farah JW,Craig RG. Finite element stress analysis of a restored axisymmetric first molar.J Dent Res 1974;53:859-866.
Rubin C,Krishnamurthy N,Capilouto E.Stress analysis of the human tooth using a three-dimensional finite element model. J Dent Res 1983;62:82-86.
Aydin AK, Tekkaya AE. Stresses induced by different loadings around weak abutments. J Prosthet Dent 1992;68:879-884.
Freilich MA, Meiers JC, Duncan JP, Goldberg AJ. Fiber-reinforced composites in clinical dentistry. Chicago: Quintessence, 2000:1–21.
Rosentritt M, Behr M, Lang R, Handel G. Experimental design of FPD made of all-ceramics and fiber-reinforced composite. Dent Mater 2000;16:159–165.
Magne P, Perakis N, Belser UC, Krejci I. Stress distribution of inlay-anchored adhesive fixed partial dentures: A finite element analy-sis of the influence of restorative materials and abutment prepa-ration design. J Prosthet Dent 2002;87:516–527.
Yang HS, Lang LA, Felton DA. Finite element analysis on the ef-fect of splinting in fixed partial dentures. J Prosthet Dent 1999;81:721–728.
Kelly JR, Tesk JA, Sorensen JA. Failure of all-ceramic fixed partial dentures in vitro and in vivo: Analysis and modeling. J Dent Res 1995;74:1253–1258.
Meiers JC, Kazemi RB, Donadio M. The influence of fiber rein-forcement of composites on shear bond strengths to enamel. J Prosthet Dent 2003;89:388–393.
Bakke M, Holm B, Jensen BL, Michler L, Möller E. Unilateral, isometric bite force in 8-68-year-old women and men related to occlusal factors. Scand J Dent Res 1990;98:149-58
Tortopidis D, Lyons MF, Baxendale RH, Gilmour WH. The variability of bite force measurement between sessions, in different positions within the dental arch. J Oral Rehabil 1998;25:681-686.
Lundn D, Laurell L. Occlusal force pattern during chewing and biting in dentitions restored with fixed bridges of cross-arch extension. I. Bilateral end abutments. J Oral Rehabil 1986;13:57-71.
Rudo DN, Karbhari VM. Physical behaviors of fiber reinforcement as applied to tooth stabilization Dent Clin Noth Am 1999;43:7-35.
Tanner J, Carlén A, Söderling E, Vallittu PK. Adsorption of parotid saliva proteins and adhesion of Streptococcus mutans ATCC 21752 to dental fiber-reinforced composites. J Biomed Mater Res 2003;15:391-398
www.intechopen.com
Finite element analysis for dental prosthetic design 101
Lastumaki TM, Kallio TT, Vallittu PK. The bond strength of light-curing composite resin to finally polymerzed and aged glass fiber-reinforced composite substrate. Biomaterials 2002; 23: 4533-4539.
Handa I, Shinya A, Gomi H, Sailynoja ES. Bending strength of fiber reinforced posterior hybrid resin material. J J Dent Mater 2003; 22:171180.
Sailynoja ES, Shin-ya A, Gomi H, Ishii Y. The effect of immersion temperature on the flexural strength of a pre-coated fiber reinforced composite resin. Prosthodont Res Pract 2003; 2:110.
Nakamura T, Waki T, Kinuta S, Tanaka H. Strength and elastic modulus of fiber-reinforced composites used for fabricating FPDs. Int J Prosthodont 2003; 16:549553.
Drummond JL, Bapna MS. Static and cyclic loading of fiber-reinforced dental resin. Dent Mater 2003; 19:226231.
Tezvergil A, Lassila LVJ, Vallittu PK. Composite-composite repair bond strength. Effectof adhesion primers. J Dent 2003; 31: 521-525.
Tezvergil A, Lassila LVJ, Vallittu PK. Strength of adhesive-bonded fiber-reinforced composites to enamel and dentin substrates. J Adhes Dent 2003; 5: 301-311.
Vallittu PK. Survival rates of resin-bonded, glass fiber-reinforced composite fixed partial dentures with a mean follow-up of 42 months: A pilot study. J Prosthet Dent 2004; 91:241246.
Sailynoja ES, Shin-ya A, Koskinen MK, Salonen JI, Masuda T, Shin-ya A et al. Heat curing of UTMA-based hybrid resin: Effects on the degree of conversion and cytotoxicity. Odontology 2004; 92: 2735.
Shimizu K, Shinya A, Gomi H, Nakasone Y. Fatigue properties of hybrid resin with glass fiber reinforcement ; The influence of cyclic loading, glass fiber reinforcement and test environments. J J Dent Mater 2004; 23:294305.
Bae JM, Kim KN, Hattori M, Hasegawa K, Yoshinari M, Kawada E, et al. Fatigue strengths of particulate filler composites reinforced with fibers. Dent Mater J 2004; 23:166174.
Lassila LVJ, Tezvergil A, Lahdenpera M, Alander P, Shin-ya A, Shin-ya A, et al. Evaluation of some properties of two fiber-reinforced composite materials. Acta Odontol Scand 2005; 63:196204.
Nakamura T, Ohyama T, Waki T, Kinuta S, Wakabayashi K, Takano N,et al. Finite element analysis of fiber-reinforced fixed partial dentures. Dent Mater J 2005; 24:275279.
Fennis WM, Tezvergil A, Kuijs RH, Lassila LVJ, Kreulen CM, Creugers NH, et al. In vitro fracture resistance of fiber reinforced cusp-replacing composite restorations. Dent Mater 2005; 21: 565-572.
Waki T, Nakamura T, Nakamura T, Kinuta S, Wakabayashi K, Yatani H. Fracture resistance of inlay-retained fixed partial dentures reinforced with fiber-reinforced composite. Dent Mater J 2006; 25:16.
Shinya A, Matsuda T, Shinya A, Nakasone Y. Hybrid resin fixed partial dentures reinforced with glass fiber: Optimum posterior fiber frame design with finite element analysis. J J Dent Mater 2004; 23: 183192.
Fujita T. Textbook of Dental Anatomy, ed 22. Tokyo; Kanehara,1995:75–104. el-Ebrashi MK, Craig RG, Peyton FA. Experimental stress analysis of dental restorations. VII:
Structural design and stress analysis of fixed partial dentures. J Prosthet Dent 1970;23:177–186.
Krejci I, Reich T, Lutz F, Albertoni M. An in vitro test procedure for evaluating dental restoration systems. 1. A computer-controlled mastication simulator [in German]. Schweiz Monatsschr Zahnmed 1990;100:953–960.
Belvedere PC. Single-sitting, fiber-reinforced fixed bridges for the missing lateral or central incisors in adolescent patients. Dent Clin North Am 1998;42:665–682.
Göhring TN, Mörmann WH, Lutz F. Clinical and scanning electron microscopic evaluation of fiber-reinforced inlay fixed partial den-tures: Preliminary results after one year. J Prosthet Dent 1999;82:662–668.
Shinya A, Matsuda T, Shinya A, Nakasone Y. Hybrid resin fixed partial dentures reinforced with glass fiber -Optimum posterior fiber frame design with finite element analysis-. J J Dent Mater 2004;23:186-192.
Farah JW, Craig RG, Merouel KA. Finite element analysis of a mandibular model. J Oral Rehabil 1988;15:615-624.
Farah JW,Craig RG. Finite element stress analysis of a restored axisymmetric first molar.J Dent Res 1974;53:859-866.
Rubin C,Krishnamurthy N,Capilouto E.Stress analysis of the human tooth using a three-dimensional finite element model. J Dent Res 1983;62:82-86.
Aydin AK, Tekkaya AE. Stresses induced by different loadings around weak abutments. J Prosthet Dent 1992;68:879-884.
Freilich MA, Meiers JC, Duncan JP, Goldberg AJ. Fiber-reinforced composites in clinical dentistry. Chicago: Quintessence, 2000:1–21.
Rosentritt M, Behr M, Lang R, Handel G. Experimental design of FPD made of all-ceramics and fiber-reinforced composite. Dent Mater 2000;16:159–165.
Magne P, Perakis N, Belser UC, Krejci I. Stress distribution of inlay-anchored adhesive fixed partial dentures: A finite element analy-sis of the influence of restorative materials and abutment prepa-ration design. J Prosthet Dent 2002;87:516–527.
Yang HS, Lang LA, Felton DA. Finite element analysis on the ef-fect of splinting in fixed partial dentures. J Prosthet Dent 1999;81:721–728.
Kelly JR, Tesk JA, Sorensen JA. Failure of all-ceramic fixed partial dentures in vitro and in vivo: Analysis and modeling. J Dent Res 1995;74:1253–1258.
Meiers JC, Kazemi RB, Donadio M. The influence of fiber rein-forcement of composites on shear bond strengths to enamel. J Prosthet Dent 2003;89:388–393.
Bakke M, Holm B, Jensen BL, Michler L, Möller E. Unilateral, isometric bite force in 8-68-year-old women and men related to occlusal factors. Scand J Dent Res 1990;98:149-58
Tortopidis D, Lyons MF, Baxendale RH, Gilmour WH. The variability of bite force measurement between sessions, in different positions within the dental arch. J Oral Rehabil 1998;25:681-686.
Lundn D, Laurell L. Occlusal force pattern during chewing and biting in dentitions restored with fixed bridges of cross-arch extension. I. Bilateral end abutments. J Oral Rehabil 1986;13:57-71.
Rudo DN, Karbhari VM. Physical behaviors of fiber reinforcement as applied to tooth stabilization Dent Clin Noth Am 1999;43:7-35.
Tanner J, Carlén A, Söderling E, Vallittu PK. Adsorption of parotid saliva proteins and adhesion of Streptococcus mutans ATCC 21752 to dental fiber-reinforced composites. J Biomed Mater Res 2003;15:391-398
www.intechopen.com
Finite Element Analysis102
Tanner J, Robinson C, Söderling E, Vallittu PK. Early plaque formation on fiber reinforced composites in vivo. Clin Oral Invest 2005;9:154-160.
Tanner J, Vallittu PK, Söderling E. Effect of water storage of E-glass fiber-reinforced composite on adhesion of Streptococcus mutans. Biomaterials 2001;22:1613-1618.
Tanner J, Vallittu PK, Söderling E. Adherence of Streptococcus mutans to an E-glass fiber -reinforced composite and conventional restorative materials used in prosthetic dentistry. J Biomed Mater Res 2000;49:250-256.
www.intechopen.com
Finite Element AnalysisEdited by David Moratal
ISBN 978-953-307-123-7Hard cover, 688 pagesPublisher SciyoPublished online 17, August, 2010Published in print edition August, 2010
InTech ChinaUnit 405, Office Block, Hotel Equatorial Shanghai No.65, Yan An Road (West), Shanghai, 200040, China
Phone: +86-21-62489820 Fax: +86-21-62489821
Finite element analysis is an engineering method for the numerical analysis of complex structures. This bookprovides a bird's eye view on this very broad matter through 27 original and innovative research studiesexhibiting various investigation directions. Through its chapters the reader will have access to works related toBiomedical Engineering, Materials Engineering, Process Analysis and Civil Engineering. The text is addressednot only to researchers, but also to professional engineers, engineering lecturers and students seeking to gaina better understanding of where Finite Element Analysis stands today.
How to referenceIn order to correctly reference this scholarly work, feel free to copy and paste the following:
Akikazu Shinya and Daiichiro Yokoyama (2010). Finite Element Analysis for Dental Prosthetic Design, FiniteElement Analysis, David Moratal (Ed.), ISBN: 978-953-307-123-7, InTech, Available from:http://www.intechopen.com/books/finite-element-analysis/finite-element-analysis-for-dental-prosthetic-design