Finite element analysis of a deep excavation: A case study from the Bangkok MRT Suched Likitlersuang a,n , Chanaton Surarak b,d , Dariusz Wanatowski c , Erwin Oh d , Arumugam Balasubramaniam d a Department of Civil Engineering, Faculty of Engineering, Chulalongkorn University, Bangkok, Thailand b Command and General Staff College, Royal Thai Army, Thailand c Faculty of Science and Engineering, University of Nottingham Ningbo, China d School of Engineering, Griffith University, Gold Coast Campus, Queensland, Australia Received 9 November 2012; received in revised form 26 June 2013; accepted 24 July 2013 Available online 24 September 2013 Abstract The Bangkok metropolitan area, located on a thick river soft clay deposit, has recently started a construction project on a mass rapid transit underground railway (MRT). This paper presents a finite element study on the Bangkok MRT underground construction project. The excavation of Sukhumvit Station was selected as the case study for the FEM numerical modelling in this paper. The numerical study focuses on the initial input on the ground conditions and the constitutive soil models. The geotechnical parameters were selected based on the soil investigation reports carried out for the purpose of the construction. The parameters selected for the constitutive models used in the FEM analysis were calibrated against the laboratory testing results. Finally, all the FEM simulations were compared with the data from field investigations. & 2013 The Japanese Geotechnical Society. Production and hosting by Elsevier B.V. All rights reserved. Keywords: Deep excavation; Finite element method; Mass rapid transit; Bangkok clay 1. Introduction Geotechnical design and construction on/in soft to very soft soils are usually associated with substantial difficulties. Since these types of soils are sensitive to deformations and possess low shear strength, their use may lead to structural damage during construction as well as throughout the life of the projects. This can come from (i) excessive settlements or the tilting of the newly constructed building structures, (ii) entrainment settle- ments of old structures near the newly erected structures and/or (iii) the adverse effect of excavations on nearby structures (Kempfert and Gebreselassie, 2006). In Thailand, there is a large river deposit in the Central Plain region called the Chao Praya Delta. It is well-known that the delta consists of a broad basin filled with sedimentary soils, especially a thick soft to very soft clay layer deposited on the top. Importantly, the Bangkok metropolis – one of the largest commercial cities in South-East Asia – is also located on the low flat Chao Praya Delta in the Central Plain region of Thailand. There have been several construction projects to improve the quality of the infrastructure over the past 50 years. The Japanese Geotechnical Society www.sciencedirect.com journal homepage: www.elsevier.com/locate/sandf Soils and Foundations 0038-0806 & 2013 The Japanese Geotechnical Society. Production and hosting by Elsevier B.V. All rights reserved. http://dx.doi.org/10.1016/j.sandf.2013.08.013 n Corresponding author. E-mail addresses: [email protected] (S. Likitlersuang), [email protected] (C. Surarak), [email protected] (D. Wanatowski), e.oh@griffith.edu.au (E. Oh), a.bala@griffith.edu.au (A. Balasubramaniam). Peer review under responsibility of The Japanese Geotechnical Society. Soils and Foundations 2013;53(5):756–773
aDepartment of Civil Engineering, Faculty of Engineering, Chulalongkorn University, Bangkok, ThailandbCommand and General Staff College, Royal Thai Army, Thailand
cFaculty of Science and Engineering, University of Nottingham Ningbo, ChinadSchool of Engineering, Griffith University, Gold Coast Campus, Queensland, Australia
Received 9 November 2012; received in revised form 26 June 2013; accepted 24 July 2013Available online 24 September 2013
Abstract
The Bangkok metropolitan area, located on a thick river soft clay deposit, has recently started a construction project on a mass rapid transitunderground railway (MRT). This paper presents a finite element study on the Bangkok MRT underground construction project. The excavationof Sukhumvit Station was selected as the case study for the FEM numerical modelling in this paper. The numerical study focuses on the initialinput on the ground conditions and the constitutive soil models. The geotechnical parameters were selected based on the soil investigation reportscarried out for the purpose of the construction. The parameters selected for the constitutive models used in the FEM analysis were calibratedagainst the laboratory testing results. Finally, all the FEM simulations were compared with the data from field investigations.& 2013 The Japanese Geotechnical Society. Production and hosting by Elsevier B.V. All rights reserved.
Keywords: Deep excavation; Finite element method; Mass rapid transit; Bangkok clay
1. Introduction
Geotechnical design and construction on/in soft to very softsoils are usually associated with substantial difficulties. Sincethese types of soils are sensitive to deformations and possess
3 The Japanese Geotechnical Society. Production and hosting by0.1016/j.sandf.2013.08.013
g author.sses: [email protected] (S. Likitlersuang),l.com (C. Surarak),ottingham.edu.cn (D. Wanatowski),.au (E. Oh),u.au (A. Balasubramaniam).der responsibility of The Japanese Geotechnical Society.
low shear strength, their use may lead to structural damageduring construction as well as throughout the life of the projects.This can come from (i) excessive settlements or the tilting of thenewly constructed building structures, (ii) entrainment settle-ments of old structures near the newly erected structures and/or(iii) the adverse effect of excavations on nearby structures(Kempfert and Gebreselassie, 2006).In Thailand, there is a large river deposit in the Central Plain
region called the Chao Praya Delta. It is well-known that thedelta consists of a broad basin filled with sedimentary soils,especially a thick soft to very soft clay layer deposited on thetop. Importantly, the Bangkok metropolis – one of the largestcommercial cities in South-East Asia – is also located on thelow flat Chao Praya Delta in the Central Plain region ofThailand. There have been several construction projects toimprove the quality of the infrastructure over the past 50 years.
Fig. 2. Excavation depths and D-wall lengths of Bangkok MRT Blue Linestations (after Phienwej 2008).
S. Likitlersuang et al. / Soils and Foundations 53 (2013) 756–773 757
One of the most recent mega construction projects in Bangkokis the Bangkok Mass Rapid Transit (MRT) UndergroundRailway. This project involves significant geotechnical works,particularly foundations and excavations.
Nowadays, some commercial FEM codes, written especiallyfor geotechnical problems, are used to analyse stability andground movement due to excavations. Various constitutive soilmodels, from a simple elastic model to mathematicallycomplex non-linear elasto-plastic models, have been developedto explain the strength and the deformation behaviour of softsoils. However, there is still a problem with predicting themovements in and around an excavation using numericalmethods. The results of a numerical analysis may be influ-enced by many factors, such as simplified geometry andboundary conditions, mesh generation, the initial input of theground conditions and the constitutive relationship chosen tomodel the behaviour of the soils. An example of a recent finiteelement study is the analysis of the behaviour of a mechani-cally stabilized earth wall (Bourgeois et al., 2012).
This paper aims to present a simplified two-dimensionalfinite element study of a deep excavation in soft clays. TheFEM code, PLAXIS, is selected as the numerical tool and theBangkok MRT underground construction project is chosen asthe case study. The analysis focuses on the initial input of theground conditions and the constitutive soil models. All theFEM simulations are compared with the data from fieldinvestigations.
1.1. Bangkok MRT project
The first phase of the Bangkok Metropolitan Rapid Transit(MRT) Underground Railway, named the Chaloem Ratchamong-khon (or the Blue Line), runs between Hua Lamphong and BangSue; it was completed in 2004. It comprises approximately 20 kmof tunnels, constructed with tunnel boring machines (TBM). Theroute of the MRT Blue Line project is presented in Fig. 1. Theproject was constructed along highly congested roads in the heartof Bangkok City. The tunnel alignment, which is 22 km inlength, includes 18 cut-and-cover underground stations, and isdivided into two major sections, i.e., North and South (see Fig. 1(a) and refer to Table 1). The underground stations are typicallycomposed of three levels of structure, namely, the CentrePlatform, the Side Platform and the Stacked Platform, as shownin Fig. 1(b). The stations are up to 230 m long and approximately25 m wide, and are excavated up to a depth of 16–32 m belowthe ground surface. The station perimeter was constructed ofdiaphragm walls (D-walls), 1.0–1.2 m thick and 20–46 m deep.The tunnel lining consists of twin bored single-track tunnels.Each tube has a concrete segmental lining with an outer diameterof 6.3 m and an inner diameter of 5.7 m.
A total of 18 underground stations were constructed using theTop-Down construction technique, together with diaphragm walls(D-walls) and concrete slabs as excavation supports. A total tunnellength of 20 km was created using eight Earth Pressure Balance(EPB) shields. The excavation depths and D-wall lengths areplotted in Fig. 2. The stacked platform stations (S2, S3 and S4) hadgreater excavation depths and D-wall lengths than the centre and
side-by-side platform stations. The majority of the centre and side-by-side platform stations (except stations S1 and N9) had similarexcavation depths (about 21–22 m). However, the embedded depthof the D-walls differed between the North and South contracts dueto the different design criteria (Phienwej, 2008). More details onthe construction methods for tunnels and underground stations ofthe existing MRT Blue Line project can be found in Suwansawat(2002) and Suwansawat et al. (2007).
Fig. 4. Types of wall movement and ground surface settlement (after Hsiehand Ou, 1998; Ou, 2006).
0 1 2 3 4
δ v/δ
vm
0.0
0.5
1.0
0.1
a
b
c
d / He
0.5d
PIZ SIZ
Fig. 5. Estimation of ground concave surface settlement (after Hsieh and Ou,1998).
S. Likitlersuang et al. / Soils and Foundations 53 (2013) 756–773758
1.2. Geological conditions of the central plain of Thailand
Bangkok subsoil forms a part of the larger Chao Phraya Plainand consists of a broad basin filled with sedimentary soildeposits. These deposits form alternate layers of sand, and clay.Field exploration and laboratory tests from the MRT Blue Lineproject show that the subsoils, down to a maximum drillingdepth of approximately 60–65 m, can be roughly divided into(1) Made Ground at 0–1 m, (2) Soft to Medium Stiff Clays at1–14 m, (3) Stiff to Very Stiff Clays at 14–26 m, (4) First DenseSand at 26–37 m, (5) Very Stiff to Hard Clays at 37–45 m, (6)Second Dense Sand at 45–52 m and then (7) Very Stiff to HardClays (see Figs. 3 and 7). The aquifer system beneath the cityarea is very complex and the deep well pumping from theaquifers, over the last 50 years, has caused substantial piezo-metric drawdown in the upper soft and highly compressible claylayers, as presented in Fig. 3.
2. Retaining wall movements and ground settlementsinduced by excavations
2.1. Models for retaining wall displacements and groundsettlements
The patterns of the retaining wall movements are governedby many factors, such as the type of subsoil encountered, thesupport system of the retaining wall (i.e., braced or anchored),the quality of the workmanship. Ou (2006) categorised thetypes of wall movements as cantilever or deep inward (orbraced) excavations, as illustrated in Fig. 4. At the initial stageof excavation, or when the encountered soil is predominantlysandy, a cantilever type of movement tends to occur. As the
excavation proceeds further, especially in soft soils, a deepinward movement is more likely to be encountered.Furthermore, the ground surface settlements induced by the
excavations can be divided into two groups. According toHsieh and Ou (1998), these are (i) the spandrel type, in whichthe maximum surface settlement is located near the wall and(ii) the concave type, in which the maximum surface settle-ment occurs at a distance away from the wall. Ou (2006)suggested that the spandrel surface settlement profile is likelyto occur with the cantilever pattern of wall movements, whilethe concave surface settlement profile is likely to occur withthe deep inward movement pattern.
2.2. Empirical predictions for excavation-induced groundmovements
The first empirically based method to predict ground settle-ments, induced by excavations, was proposed by Peck (1969).Using a monitoring database of many case histories, Peckestablished a relationship between ground surface settlements,
Sukhumvit Station Asoke Road
Sukh
umvi
t Roa
d
N
1
B1-2
Inclinometer
Surface settlement array
Building number 1 with 2 storeys
Borehole
Fig. 6. Plan view of Sukhumvit Station and its instrumentations.
Soil profile
Dep
th (m
)
0
5
10
15
20
25
30
35
40
45
Made Ground (MG)
Bangkok Soft Clay (BSC)
Medium Clay (MC)
First Stiff Clay (1 st SC)
Clayey Sand (CS)
Second Stiff Clay (2 nd SC)
Hard Clay (HC)
Fig. 7. Soil profile at the Sukhumvit Station location.
S. Likitlersuang et al. / Soils and Foundations 53 (2013) 756–773 759
soil types, excavated depths and workmanship quality.The monitoring data were obtained mainly from steel sheetpiles or soldier piles; these piles are quite different from thoseused in more recent construction methods (i.e., diaphragm wallswith braced or anchored supports). Indeed, Ou (2006) stated thatPeck's method may not necessarily be applicable to all excava-tion types. Similar to Peck's (1969) method, Clough andO’Rourke (1990) proposed a more refined set of surfacesettlement envelopes induced by an excavation. The shapeand magnitude of the surface settlement envelopes depend onthe type of soil, the excavation depth (He) and the maximumwall deflection (δhm).
Hsieh and Ou (1998) further refined Clough and O’Rourke's(1990) method by introducing two zones of influence, namely,the Primary Influence Zone (PIZ) and the Secondary Influence
Zone (SIZ). The depth of the excavation (He) was set as thenormalised parameter to predict the length of each zone. Theconcave settlement profile was proposed as the bi-linearrelationship shown in Fig. 5. The surface settlements in thePIZ and SIZ are predicted using Eqs. (1) and (2), respectively:
δv ¼ �0:636
ffiffiffiffiffiffid
He
rþ1
� �δvm; if d=Her2 and ð1Þ
δv ¼ �0:171
ffiffiffiffiffiffid
He
rþ0:342
� �δvm; if 2rd=Her4 ð2Þ
where δv and δvm are the surface settlement and the maximumsurface settlement, respectively, of the soil at distance d fromthe wall. To continue the earlier work of Hsieh and Ou (1998),Ou and Hsieh (2011) suggested new surface settlementpatterns, which take into account not only the excavationdepth, but also the excavation width and the depth to the hardstratum.Unlike Peck (1969) and Clough and O’Rourke (1990), in
whose studies the shapes of the surface settlements aredistinguished primarily by soil types, Hsieh and Ou (1998)and Ou and Hsieh (2011) classified the shapes of the surfacesettlements as spandrel or concave, as presented earlier inFig. 4.
3. Bangkok MRT case study: Sukhumvit Station
Sukhumvit Station, located underneath Asok Road, next tothe Sukhumvit – Asok intersection, as shown in Fig. 6, wasselected for this study. The station box is located in acongested area surrounded by many commercial (3–4 stories)and residential buildings. Sukhumvit Station is also a connect-ing station between the MRT underground system and theBangkok Mass Transit System (BTS) – an elevated trainsystem at Asok Station. The soil profile consists of 2–3 m ofMade Ground (MG), underlain by approximately 9 m ofnormally consolidated Bangkok Soft Clay (BSC), with anundrained shear strength of about 20 kN/m2. The undrainedshear strength of this layer tends to increase with depth fromthe level below 7 m. Beneath the BSC layer, there are 2 m ofMedium Clay (MC), with an undrained shear strength of more
Table 1Summary of MRT station dimensions, excavation depths and D-wall lengths.
Notation Station Station dimensions Excavation depth, He (m) D-wall length, L (m)
S. Likitlersuang et al. / Soils and Foundations 53 (2013) 756–773760
than 60 kN/m2. A thin, but continuous, medium dense ClayeySand (CS) of 1.5 m is sandwiched between the First andSecond Stiff Clays (1st SC and 2nd SC), with thicknesses of6 m and 4 m, respectively. At a depth of 23–40 m, the HardClay (HC) layer (SPT N values of 30–40), with some sandlenses, is found. This HC layer is then underlain by the DenseSand (DS) layer, up to 60 m deep. The ground water level atthis location was found at 1.5 m below the ground surface. Aschematic diagram of the Sukhumvit Station soil profile isshown in Fig. 7. It is noted that this soil profile was simplifiedbased on a site investigation programme consisting of a seriesof four boreholes (Fig. 6).
23m
1.0m thick D-wall
1.8 diameterBored pile
Fig. 8. Geometry of Sukhumvit Station.
3.1. MRT underground station construction
Sukhumvit Station was constructed using the Top-Downconstruction method, with a configuration of the centre plat-form type. The station box had a width, length and depth of 23� 200 � 21 m. The reinforced concrete diaphragm walls(D-walls) were 1 m thick and 27.9 m deep; they were used forearth-retaining and permanent structures in the station. Theconcrete slabs of the first, second and third levels (Roof,Access and Concourse levels) were 1 m thick and the base slabwas 1.8 m thick; these slabs were the primary braced supportsystem for the D-walls. Figs. 6 and 8 show the plan view andthe cross section geometry of Sukhumvit Station, respectively.The construction sequences adopted in the station box con-struction simulation are summarised in Table 2.
3.2. Monitoring system
Extensive instrumentation programs were adopted to monitorthe deflection of the diaphragm walls and the ground settlementsinduced by the deep excavations. The instrumentation included
inclinometers installed in the D-walls, inclinometers combinedwith extensometers, surface settlement points and surfacesettlement arrays. Building settlement points, tilt metres andcrack metres were also installed to ensure that any damage toadjacent buildings would be kept within the design limitations.All instruments and adjacent borehole locations are depicted inFig. 6. These instruments are composed of eight sets ofinclinometers installed in the D-walls at various locations andone set of surface settlement arrays (SS1). The surface settle-ment (SS1) selection of this location was chosen because thesurface settlement arrays (SS1) were located in a bare areabetween buildings B3 and B4. Thus, the surface settlementmeasured from SS1 could be considered as close to a greenfieldcondition. Moreover, the location of SS1 was in the middle of
Table 2Construction sequences of Sukhumvit Station.
Sequences Construction activities
1 Construction of diaphragm walls2 Construction of bored piles3 Installation of steel columns, which were plunged into the top of bored piles to form pin piles4 Pre-excavation and placement of temporary steel decking supported by pin piles for traffic diversion5 Excavation to level of underside of temporary prop and installation of temporary prop6 Excavation to level of underside of roof slab and construction of permanent concrete roof slab7 Removal of temporary prop8 Excavation to level of underside of second slab level9 Construction of second concrete slab10 Stages 8 and 9 were repeated for third and fourth (base) slabs11 Composite columns were installed12 Backfill roof slab and final road reinstatement
Fig. 9. Horizontal movement of diaphragm walls from inclinometers 4, 6 and 8.
S. Likitlersuang et al. / Soils and Foundations 53 (2013) 756–773 761
the North–South length of Sukhumvit Station, where the effectsof the corners were expected to be minimised. For this reason,inclinometer number 4 (IN4) will also be used in the presentstudy to verify the two-dimensional finite element analysis.
3.3. Diaphragm wall movements
The field observations from the inclinometers revealed thatthe cantilever pattern developed after the first excavation stage.As the excavation proceeded to a greater depth, the D-wallsshowed braced excavation patterns with a bulge in the first stiffclay layer. Fig. 9 shows the four stages of the diaphragm wallmovements from inclinometers 4, 6 and 8 (IN4, 6 and 8). Theseinclinometers were located approximately 95, 45 and 11 m fromthe nearest corner of the excavation box. A significant cornereffect occurred on the short side of the excavation box; the
maximum wall deflection of IN8 was reduced by half comparedto IN4. In contrast, the wall movements of IN6 at all stages onlyshowed a slight reduction (less than 15%) compared to themovements of IN4. In the Sukhumvit Station box, the excava-tion depth in Stage 4 was 21 m. Fig. 10 illustrates the maximumwall movements after the Stage 4 excavation for all eightinclinometers. It also shows that the corner effect, along bothlong sides (East: IN2, 5 and 7 and West: IN3, 4 and 6), wasrelatively small compared to that of the short sides (North: IN8and South: IN1).
3.4. Ground surface settlements
The measured data of the surface settlement at SukhumvitStation from the surface settlement array (SS1) are plotted inFig. 11. The predicted settlement profiles from empirical methods
S. Likitlersuang et al. / Soils and Foundations 53 (2013) 756–773762
(Clough and O’Rourke, 1990; Hsieh and Ou, 1998; Ou andHsieh, 2011) are also presented in Fig. 11. All three empiricalmethods exhibit similar surface settlement envelopes and they arein good agreement with the field measurements. However, oneexception is that Clough and O’Rourke (1990) method cannotpredict the surface settlements in the Secondary Influence Zone(SIZ). Additionally, the field surface settlements did not appear toextend far enough from the wall to enable the measurement of thesurface settlements in the SIZ. As a result, the findings fromfurther studies on surface settlements, using finite elementanalyses, will be compared with both the field measurements(within PIZ) and the predicted surface settlement envelope fromthe empirical estimation (within SIZ).
4. Finite element modelling
The 2D plane strain finite analysis approach, using PLAXISv.9 software (PLAXIS 2D v.9, 2009), was adopted in thisstudy. As the ratio of the length (L) to width (B) of theSukhumvit Station box was high (L/B¼8.7), the 3D effectalong the long sides of the station (see Fig. 6) was small; thus,the 2D plane strain approach was considered appropriate. Onlythe right half of the station box (at the cross section of IN4 andIN5) was modelled because the station configuration was
Fig. 10. Maximum horizontal movement of D-walls after stage 4 excavation.
Table 3Input parameters for structure components.
ParameterDiaphragm wall(1 m thick)
Platform slab(1 m thick)
Base(1.8
Axial stiffness, EA (MN/m) 28000 28000 5040Flexural rigidity, EI (MN/m2/m) 2333 2333 1360Weight, w (kN/m2) 16.5 25 4Poisson's ratio, ν 0.15 0.15
Distance from wall, d (m)0 10 20 30 40 50 60 70 80 90
Fig. 11. Comparison between measured and predicted surface settlements.
symmetric. A seven-layer soil profile (shown in Fig. 7) wasadopted. Importantly, four soil models (i.e., Mohr–ColumnModel (MCM), Soft Soil Model (SSM), Hardening Soil Model(HSM) and Hardening Soil Model with Small-Strain Stiffness(HSS)) were used to evaluate their performances in the deepexcavation modelling. All soil layers were modelled using 15-node elements. For the structural components (i.e., diaphragmwalls, platform slabs, base slab, columns and piles), non-volume plate elements were used. The soil-diaphragm wallinteraction was modelled by the zero-thickness interfaceelement. The interface element stiffness values were in therange of 0.7–0.9, depending on the soil profile, to simulate theground disturbance. The stiffness of the concrete was alsoreduced by 20% to take into account the possibility of cracking(Schweiger, 2009). Table 3 presents the input parameters ofthe structural components.
4.1. Mesh generation
Prior to the study on the soil constitutive models, it wasdecided that the mesh refinement of the finite element modelconstructed here should be clarified. The finite element modeland the mesh generation are shown in Fig. 12. The model hasan average element size of 2.53 m and a total element numberof 649. A finer mesh generation, with an average mesh size of1.42 m and a total of 2054 elements, was also adopted in thestudy. For example, in the case of the HSM analysis, thepredicted lateral wall movements and the ground surfacesettlements reveal almost identical wall movement profilesand surface settlement envelopes for both models. Therefore,the model with 649 elements was selected for this analysis inorder to reduce the computational time.
slabm thick)
Column(0.8 m dia. at 11.4 spacing)
Pile(1.8 m dia. at 11.4 m spacing)
0 1712 38528 91.3 10405 25 250.15 0.15 0.15
80m11.5m
45m
Number of elements : 649Average element size : 2.53m
Fig. 12. Finite element model and mesh generation.
Wall movement, δh (mm)
0 20 40 60 80
Dep
th (m
)
0
5
10
15
20
25
30
35
Stage 4
Inclinometer 4 (IN4)
Distance from wall, d (m)0 10 20 30 40 50 60 70 80 90
Surf
ace
settl
emen
t, δ v (m
m)
05
101520253035404550
Measured - Base Level: Stage 4Plaxis - DrawdownPlaxis - Hydrostatic
Fig. 13. Comparison of finite element predictions from drawdown and hydrostatic cases.
S. Likitlersuang et al. / Soils and Foundations 53 (2013) 756–773 763
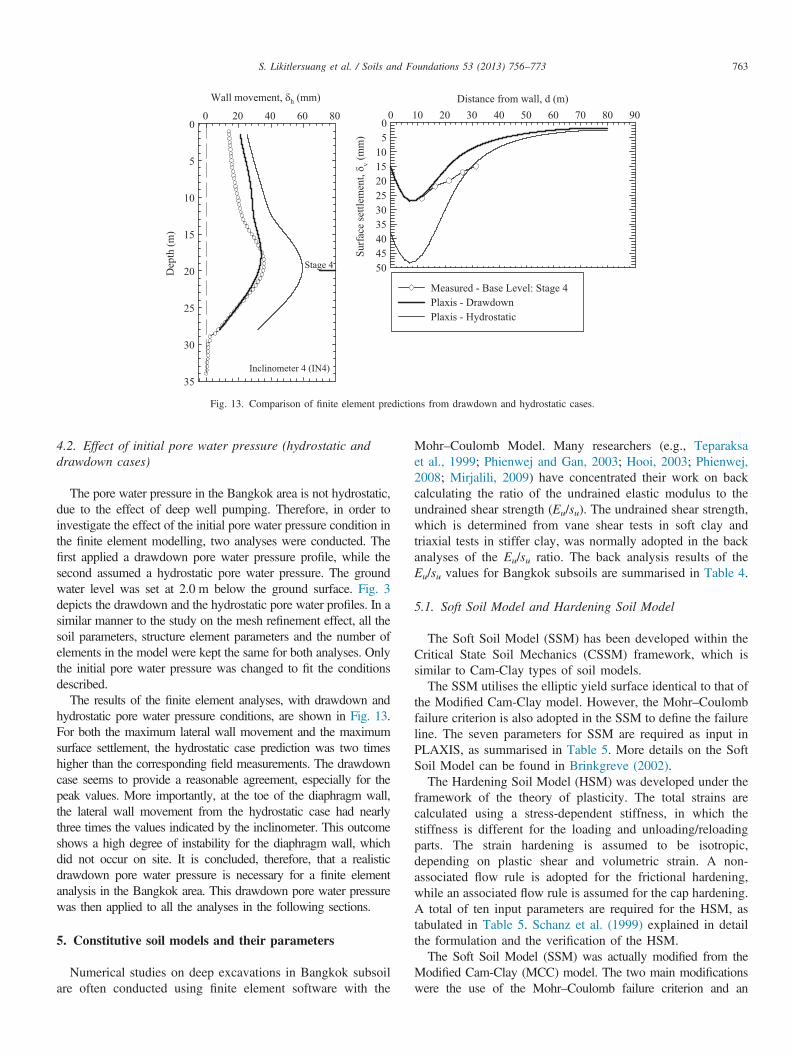
4.2. Effect of initial pore water pressure (hydrostatic anddrawdown cases)
The pore water pressure in the Bangkok area is not hydrostatic,due to the effect of deep well pumping. Therefore, in order toinvestigate the effect of the initial pore water pressure condition inthe finite element modelling, two analyses were conducted. Thefirst applied a drawdown pore water pressure profile, while thesecond assumed a hydrostatic pore water pressure. The groundwater level was set at 2.0 m below the ground surface. Fig. 3depicts the drawdown and the hydrostatic pore water profiles. In asimilar manner to the study on the mesh refinement effect, all thesoil parameters, structure element parameters and the number ofelements in the model were kept the same for both analyses. Onlythe initial pore water pressure was changed to fit the conditionsdescribed.
The results of the finite element analyses, with drawdown andhydrostatic pore water pressure conditions, are shown in Fig. 13.For both the maximum lateral wall movement and the maximumsurface settlement, the hydrostatic case prediction was two timeshigher than the corresponding field measurements. The drawdowncase seems to provide a reasonable agreement, especially for thepeak values. More importantly, at the toe of the diaphragm wall,the lateral wall movement from the hydrostatic case had nearlythree times the values indicated by the inclinometer. This outcomeshows a high degree of instability for the diaphragm wall, whichdid not occur on site. It is concluded, therefore, that a realisticdrawdown pore water pressure is necessary for a finite elementanalysis in the Bangkok area. This drawdown pore water pressurewas then applied to all the analyses in the following sections.
5. Constitutive soil models and their parameters
Numerical studies on deep excavations in Bangkok subsoilare often conducted using finite element software with the
Mohr–Coulomb Model. Many researchers (e.g., Teparaksaet al., 1999; Phienwej and Gan, 2003; Hooi, 2003; Phienwej,2008; Mirjalili, 2009) have concentrated their work on backcalculating the ratio of the undrained elastic modulus to theundrained shear strength (Eu/su). The undrained shear strength,which is determined from vane shear tests in soft clay andtriaxial tests in stiffer clay, was normally adopted in the backanalyses of the Eu/su ratio. The back analysis results of theEu/su values for Bangkok subsoils are summarised in Table 4.
5.1. Soft Soil Model and Hardening Soil Model
The Soft Soil Model (SSM) has been developed within theCritical State Soil Mechanics (CSSM) framework, which issimilar to Cam-Clay types of soil models.The SSM utilises the elliptic yield surface identical to that of
the Modified Cam-Clay model. However, the Mohr–Coulombfailure criterion is also adopted in the SSM to define the failureline. The seven parameters for SSM are required as input inPLAXIS, as summarised in Table 5. More details on the SoftSoil Model can be found in Brinkgreve (2002).The Hardening Soil Model (HSM) was developed under the
framework of the theory of plasticity. The total strains arecalculated using a stress-dependent stiffness, in which thestiffness is different for the loading and unloading/reloadingparts. The strain hardening is assumed to be isotropic,depending on plastic shear and volumetric strain. A non-associated flow rule is adopted for the frictional hardening,while an associated flow rule is assumed for the cap hardening.A total of ten input parameters are required for the HSM, astabulated in Table 5. Schanz et al. (1999) explained in detailthe formulation and the verification of the HSM.The Soft Soil Model (SSM) was actually modified from the
Modified Cam-Clay (MCC) model. The two main modificationswere the use of the Mohr–Coulomb failure criterion and an
Table 5Soil models input parameters.
Input parameters for Parameters Description Parameter evaluation
Soft Soil Model(SSM)
Hardening SoilModel (HSM)
Hardening Soil Modelwith Small StrainStiffness (HSS)
✓ ✓ ✓ ϕ′ Internal friction angleSlope of failure line from Mohr–Coulombfailure criterion
✓ ✓ ✓ c' Cohesiony-intercept of failure line fromMohr–Coulomb failure criterion
✓ ✓ Rf Failure ratio (s1�s3)f/(s1�s3)ult✓ ✓ ✓ ψ Dilatancy angle Ratio of dεv
p and dεsp
✓ λn Modified compression indexSlope of primary loading curve ln p′versus εv space
✓ κn Modified swelling indexSlope of unloading/reloading curve ln p′versus εv space
✓ ✓ Eref50
Reference secant stiffness fromdrained triaxial test
S. Likitlersuang et al. / Soils and Foundations 53 (2013) 756–773764
improvement in the volumetric yield surface. Parameters λn andκn, as used in the MCC, remain the same in the SSM. Twoadditional parameters, namely, νur and Κnc
o , were introduced. Theinfluence of both parameters on the triaxial (q versus εa and qversus p′) behaviour and the oedometer (εv versus log p′)behaviour, resulting from the parametric study, has been dis-cussed in Surarak et al. (2012). Table 6 presents the parametersfrom the SSM analysis for the BSC, MC, 1st SC, 2nd SC and HClayers. The HSM was applied to the MG and CS layers instead ofthe SSM. The critical state soil model, which forms the basis ofthe MCC and SSM models, was developed especially to simulatesoft clay behaviour. Therefore, the SSM is not suitable for the
MG or CS layers. Also, soil movements owing to the excavationof the MG and CS layers are relatively small compared to theBSC, 1st SC and 2nd SC layers. Consequently, using the HSMinstead of the SSM in the MG and CS layers will have anegligible influence on this analysis. Parameters λn and κn wereobtained from the consolidation characteristics of Bangkok clays.Hence, νur and Κnc
o are set according to the results of theparametric studies. Table 7 presents the parameters from theHSM analysis for the MG, BSC, MC, 1st SC, CS, 2nd SC andHC layers. All soil layers are assumed to have no dilatancy(ψ¼ 0ο). More details on the parametric studies of Bangkok clayscan be seen in Surarak et al. (2012).
Table 6Parameters for Soft Soil Model (SSM) analysis.
1. The strength parameters (ϕ′ and c′), dilatancy angle (ψ) and bulk unit weight for the SSM analysis are the same as those for the HSManalysis (Table 7).
2. HSM is adopted for the Made Ground (MG) and Clayey Sand (CS) layers.
S. Likitlersuang et al. / Soils and Foundations 53 (2013) 756–773 765
5.2. Hardening Soil Model with Small Strain Stiffness (HSS)
The Hardening Soil Model with Small Strain Stiffness(HSS) is a modification of the HSM, incorporating the smallstrain stiffness of soils (Benz, 2006). The model employs amodified hyperbolic law for the stiffness degradation curve(Hardin and Drnevich, 1972; Santos and Correia, 2001) as inthe following equation:
G
Gmax¼ 1
1þaj γγ0:7
j ð3Þ
Two additional parameters, namely, the small strain shearmodulus (Gmax), where G=0.722Gmax, and the reference shearstrain (γ0.7), are utilised to govern the soil stiffness at a smallstrain level. The input parameters for the HSM, presented inTable 7, remain the same for the HSS analysis. All inputparameters for the HSM are carried over to the HSS model,with the two additional parameters, Gmax and γ0.7 (seeTable 5). However, knowledge of the small strain parametersfor the MG, SC and HC layers is very limited. Additionally,the expected soil movements arising from these layers aresmall in comparison to the BSC, MC, 1st SC and 2nd SClayers. Therefore, the HSM is used in the MG, CS and HClayers. The HSS is only applied to the predominant layers, i.e.,BSC, MC, 1st SC and 2nd SC.
Detailed studies of small strain parameters Gmax and γ0.7 ofthe Bangkok clays were studied by Likitlersuang, et al.,(2013). The shear modulus at a small strain (Gmax) wasobtained from both the in situ tests (down-hole and seismiccone tests) and the laboratory tests using bender elements.Hence, parameter Gmax is considered to be reliable and isselected straight from the test results, as listed in Table 8.Parameter γ0.7 is, on the other hand, considered to have morevariation. The two empirically based methods (Ishibashi andZhang, 1993; Vucetic and Dobry, 1991) are used to calculatethe γ0.7 of the Bangkok clays, as shown in Fig. 14. Bothmethods estimated similar results for the Bangkok Soft Claylayer, which also coincide with the results of the benderelement tests on the Bangkok soft clay (Teachavorasinskun
et al., 2002). The two sets of Hardening Soil Models withSmall Strain Stiffness analyses (HSS 1 and HSS 2) areconsidered herein. For the HSS 1 analysis, the average valuesof γ0.7 for the BSC and MC layers from both methods, namely,Ishibashi and Zhang (1993) and Vucetic and Dobry (1991), areused (see Fig. 14). Details on the small strain stiffnessparameters for Bangkok clays can be found in Likitlersuang,et al., (2013).
5.3. Mohr–Coulomb model (MCM)
The concept of the total stress analysis (ϕ¼0) with theMohr–Coulomb Model (MCM) for clayey soils has beenwidely used in geotechnical engineering practice. One of themajor advantages of this concept is that the soil parameters areeasy to obtain, as only undrained shear strength (su) andundrained elastic modulus (Eu) are needed for the rapidloading conditions. The undrained shear strength of theBangkok subsoils, obtained from the vane shear and triaxialtests, will be used to govern the strength of the Bangkok SoftClay (BSC), Medium Clay (MC), 1st Stiff Clay (1st SC), 2ndStiff Clay (2nd SC) and Hard Clay (HC). Back analyses of thedeep excavation problems in Bangkok subsoils (Teparaksaet al., 1999; Phienwej and Gan, 2003) have shown that the Eu/su ratios of 500 and 1000–2000 give a reasonable agreementbetween the measured and the predicted wall movements.In the current study, a Eu/su of 500 was adopted in the BSC,MC and 1st SC layers. Higher values of Eu/su=600 and 1000were used for the 2nd SC and HC layers. These values for Eu/su were selected based on the previous studies, as summarisedin Table 4. The MG and CS layers were modelled usingdrained analyses. The drained moduli were estimated from theSPT N values from the adjacent boreholes. Table 9 summarisesall the parameters used in the MCM analysis.
5.4. Calibrations of soil parameters
The stiffness and strength parameters for the SSM and HSMof soft and stiff Bangkok clays have been numerically studied
Table 7Parameters for Hardening Soil Model (HSM) analysis.
1. The strength parameters (ϕ′ and c′), dilatancy angle (ψ) and bulk unit weight for the SSM analysis are the same as those for the HSM analysis (Table 7).2. HSM is adopted for the Made Ground (MG), Clayey Sand (CS) and Hard Clay (HC) layers.
S. Likitlersuang et al. / Soils and Foundations 53 (2013) 756–773766
using PLAXIS finite element software (Surarak et al., 2012;Likitlersuang et al., 2013). The numerical study was based on acomprehensive set of experimental data on Bangkok subsoilsfrom oedometer and triaxial tests carried out at the AsianInstitute of Technology as well as the cyclic triaxial testscarried out at Chulalongkorn University. The determined HSMparameters are the Mohr–Coulomb effective stress strengthparameters together with the stiffness parameters, namely,tangent stiffness for primary oedometer loading, secant stiff-ness in undrained and drained triaxial tests, unloading/reload-ing stiffness and the power for stress-level dependency ofstiffness. Details can be found in Surarak et al. (2012).In addition, the small strain stiffness parameters for the HSSmodel of Bangkok clays were recently published inLikitlersuang et al. (2013).
6. Finite element analysis result for Sukhumvit Station
A finite element analysis of the Sukhumvit Station excava-tion is studied in this section. Due to symmetrical geometry,one half of the station was modelled (as shown in Fig. 12). Thecalculation steps followed the construction sequences, astabulated in Table 2. The four stages of the FEM results,where the excavation depths were at 1.5, 7.5, 12.5 and 21 m(Fig. 8), were compared with the monitoring data. Note that allthe measured data were recorded within one week after the
excavation reached the desired levels in order to retain theundrained condition.
6.1. Results and discussions on FEA with Mohr–Coulombmodel (MCM)
Fig. 15 shows the measured and predicted lateral wallmovements and ground surface settlements for the SukhumvitStation box excavation using MCM. The ground surfacesettlement predicted by Hsieh and Ou (1998) at the Stage 4excavation was also included for comparison. The predictionsgiven by the MCM analysis slightly underpredict the lateralwall movements at all stages of the excavation. The maximumlateral movement of the wall at the final excavation stage isabout 15% lower that the measured value. Contrary to thelateral movement, the MCM analysis shows a much shallowerand wider surface settlement profile, when compared to thefield measurement and empirical prediction. The predictedmaximum surface settlement at the final excavation stage wasless than one half of the field measurement. Similar trends insurface settlement profiles of the MCM prediction of surfacesettlements can be found in the literature (Kung et al., 2009;Schweiger, 2009).It should be pointed out that wider settlement envelopes, as
predicted by the MCM, lead to the overprediction of thesurface settlements in the Secondary Influence Zone (SIZ).Nevertheless, a flatter settlement envelope is expected to lead
Table 9Parameters for Mohr–Coulomb Model (MCM) analysis.
Layer Soil type Depth (m) γb (kN/m3) su (kPa) c′ (kPa) ϕ′ (o) ψ (o) Eu (MPa) E′ (MPa) ν Analysis type
Ishibashi & Zhang (1993)Vucetic & Dobry (1991)γ0.7 used in HSS 1 & 2
γ0.7 used in HSS 1
γ0.7 used in HSS 2
Fig. 14. Parameter γ0.7 as used in HSS 1 and HSS 2 models.
S. Likitlersuang et al. / Soils and Foundations 53 (2013) 756–773 767
to less predicted differential settlements for the buildingslocated at the transition of the PIZ and SIZ.
6.2. Results and discussions on FEA with Soft Soil Model(SSM)
The predicted lateral wall movement profiles and surfacesettlement envelopes were predicted from the SSM analysis areshown in Fig. 16. Furthermore, these predicted lateral wallmovements at Stages 1–3 are fairly close to the fieldmeasurements. The maximum lateral wall movement at thefinal stage slightly underpredicted the measured values byapproximately 15% (similar to MCM predictions). In terms ofthe ground surface settlement predictions, the SSM gave bettertrends for the settlement envelope compared to the MCM.
Nevertheless, the same general trend of shallower and widersettlement envelopes was observed.
6.3. Results and discussions on FEA with Hardening SoilModel (HSM)
The strength and stiffness parameters from the study bySurarak et al. (2012) are used as inputs for the HSM analysis inthis section. The input parameters listed in Table 7 are theresults of the parametric studies and the undrained triaxial testseries back-calculations. More specifically, the followingprocedure was adopted:
(a)
The Eref50 used in the analyses of the drained materials (MG
Fig. 16. Measured and predicted lateral wall movements and surface settlements from SSM analysis.
S. Likitlersuang et al. / Soils and Foundations 53 (2013) 756–773768
the adjacent boreholes. The ratios of Erefoed ¼Eref
50 andErefur ¼ 3Eref
50 were suggested by Brinkgreve (2002).
(b) For BSC, MC, 1st SC, 2nd SC and HC, the procedure for
the triaxial and oedometer modelling was adopted. Thetriaxial and oedometer test results from samples taken fromthe adjacent boreholes were used in the stiffness moduliback-calculation.
(c)
Parameters νur, m and Rf were kept as 0.2, 1 and 0.9,respectively. These values were suggested in Surarak et al.(2012).
Fig. 17 compares the measured lateral wall movements andthe ground surface settlements with those predicted by theHSM. The predicted lateral wall movements at all excavationstages within the BSC layer (depths of 2.5–12 m) were slightly
higher than the field measurements. This overestimationextends further into the deeper layers for excavation Stages1–3. The maximum lateral movement in the last excavationstage (located in the 1st and 2nd SC layers) agrees well withthe measured values. In the case of the ground surfacesettlement comparison, the HSM predicted better settlementenvelopes than MCM or SSM. However, the settlementswithin the SIZ were still slightly larger than the predictionsusing the Hsieh and Ou (1998) method.
6.4. Results and discussions on FEA using Hardening SoilModel with Small Strain Stiffness (HSS)
The results from the HSS 1 analysis are shown in Fig. 18. TheHSS 1 analysis improved the lateral wall movement prediction,
Fig. 18. Measured and predicted lateral wall movements and surface settlements from HSS 1 analysis.
S. Likitlersuang et al. / Soils and Foundations 53 (2013) 756–773 769
when compared to those predicted by the HSM for all excavationstages in the BSC and MC layers. However, the predictions forthe deeper layers (1st SC, CS and 2nd SC) were much smallerthan in the HSM analysis. Indeed, the predicted maximum lateralwall movement was only one half of the measured magnitude.The corresponding surface settlements were also underpredicted bythe HSS 1 analysis. This outcome confirmed that the parameters(γ0.7) calculated by the Ishibashi and Zhang (1993) and the Vuceticand Dobry (1991) methods for the BSC and MC layers are valid.This conclusion was not true, however, for the Stiff Clay layers.However, there is no information on the laboratory γ0.7 availablefor Bangkok Stiff Clay. It is suggested that a more refined analysiswould be appropriate before any definite conclusion can be madeon the values for the small strain stiffness of Bangkok Stiff Clay,especially when a better set of laboratory and field data is available.
For the purpose of this study, it was decided that a back-fittedvalue of γ0.7 should be adopted.In the second HSS analysis (HSS 2), only parameter γ0.7 in
1st SC and 2nd SC was adjusted to obtain the best fit results.The best fit value of γ0.7 for both layers was obtained as 0.002%(see also Table 8 and Fig. 19). The predictions of the wallmovements and the surface settlements, obtained by the HSS 2analysis, are depicted in Fig. 19. As far as the results in the finalstage are concerned, both the predicted lateral wall movementsand the surface settlements agree well with the measured data.
7. Comparisons of FEM results
In this section, the results from the MCM, SSM, HSM andHSS 2 analyses are compared according to the stage construction.
Fig. 19. Measured and predicted lateral wall movements and surface settlements from HSS 2 analysis.
Distance from wall, d (m)0 10 20 30 40 50 60 70 80 90
Wall movement, δh (mm)
Dep
th (m
)
0
5
10
15
20
25
30
35
0
5
10
15
20
25
30
35
Surf
ace
settl
emen
t, δ v (m
m)
Fig. 20. Measured and predicted lateral wall movements and surface settlements at Stage 1 from MCM, SSM, HSM and HSS 2 analyses.
S. Likitlersuang et al. / Soils and Foundations 53 (2013) 756–773770
Figs. 20–23 show the measured and the predicted lateral wallmovements and surface settlements arising from Stages 1 to 4 ofthe excavation, respectively. As far as the wall movements afterthe first stage construction are concerned, the SSM, HSM andHSS 2 provide reasonably good predictions compared to themeasured data, while the MCM give a slightly underpredictedmovement. The surface settlement profiles from all four analysesare smaller than the field measurements. The maximum surfacesettlements from the largest to the smallest are in the followingorder: the SSM, HSM, HSS 2 and MCM. The same trend is seenfor the predicted wall movements and the ground surfacesettlements from the Stages 2 and 3 analyses. The predictedwall movements from the SSM, HSM and HSS 2 analyseshad very similar magnitudes. Their predictions agree with the
measurements at the top part of the D-wall, but slightly over-predicted the wall movements from the depth of excavation to thelower end of the D-wall. The MCM prediction, on the other hand,matches well with the measurements at the depth of excavation.However, the MCM analysis yields a smaller prediction at the toppart of the D-wall. The predicted surface settlements at Stages 2and 3 from the SSM, HSM and HSS 2 analyses are nearlyidentical. The shapes of their predicted settlement profiles aremuch steeper than that of the MCM analysis. For Stage 4 of theexcavation, all four models produce generally good predictions ofthe wall movements. However, the HSS 2 analysis shows the bestprediction of the maximum wall movement compared to the fielddata. For the surface settlements, the HSM and HSS 2 shownearly identical settlement profiles. Their results, at the final stage,
Fig. 22. Measured and predicted lateral wall movements and surface settlements at Stage 3 from MCM, SSM, HSM and HSS 2 analyses.
S. Likitlersuang et al. / Soils and Foundations 53 (2013) 756–773 771
also agree with the field data. The MCM's settlement profile ismuch shallower and wider than the measured surface settlement.Its maximum surface settlement is lesser than half of themeasured data. The settlement prediction from the SSM lies inbetween the results of the MCM and HSM analyses.
8. Concluding remarks
This paper investigates the behaviour of D-wall movementsand ground surface settlements by means of empirical andnumerical analyses. An underground station excavation of theBangkok MRT Blue Line project was used as a case study.Based on the results of the study, the most important points aresummarised as follows.
(1)
Inclinometer measurements from Sukhumvit Station showedthat the 3D effects on the long sides of the D-wall are smallcompared to the effects on the short sides. This evidenceconfirmed other studies on the 3D effects of deep excavations(Ou et al., 1993).
(2)
The predicted surface settlement profiles coincided withthe observed data within the Primary Influence Zone.However, the ground surface settlement measurementsdid not extend far enough to make a comparison in theSecondary Influence Zone.
(3)
Considerable differences were found from the FEManalyses with hydrostatic and drawdown pore waterconditions. The case of more realistic drawdown porepressure predicted closer lateral wall movements andground surface settlements compared to field observations.
Fig. 23. Measured and predicted lateral wall movements and surface settlements at Stage 4 from MCM, SSM, HSM and HSS 2 analyses.
S. Likitlersuang et al. / Soils and Foundations 53 (2013) 756–773772
(4)
In general, better lateral wall movements and groundsurface settlements were obtained from higher degrees ofsophistication of constitutive models in the followingorder, i.e., MCM, SSM, HSM and HSS. Nonetheless, nosalient differences between the results of axial force, shearforce and bending moment predictions were observed.
(5)
Back-calculated Eu/su ratios from the literature can be usedreasonably well for lateral movement predictions withMCM. However, accurate ground surface settlements werenot obtained.
(6)
SSM and HSM analyses with soil parameters interpretedfrom laboratory and in situ tests (Surarak et al., 2012),provided better agreement with lateral wall movements andsurface settlement field observations.
(7)
Results from the HSS analysis confirmed the values of γ0.7in BSC, as predicted by Ishibashi and Zhang (1993) andVucetic and Dobry (1991). In the case of the Stiff Clay,however, a back-calculated γ0.7 of 0.002% is necessaryfor better lateral wall movements and surface settlementpredictions.
(8)
As a consequence of this study, it can be stated that nomatter what analysis or numerical method is employed, agood prediction of the ground movements cannot beachieved unless relevant parameters are selected. In thecase of FEM, a suitable simulation process also needs to beadopted.
Acknowledgements
The authors wish to thank the late president of the MassRapid Transit Authority of Thailand (MRTA), Mr. ChukiatPhota-yanuvat, and the MRTA engineers for their kindness inencouraging us and providing relevant data for carrying outthe academic research activities related to this important work.
The first author would also like to extend his appreciation forthe research funding from the Stimulus Package 2 (SP2) of theMinistry of Education, Thailand under the theme of GreenEngineering for Green Society. The second author wouldlike to thank Professor Suchatvee Suwansawat, of the KingMongkut's Institute of Technology, Ladkrabang, Thailand, forhis kind assistance during the data collection.
References
Benz, T., 2006. Small-Strain Stiffness of Soils and its Numerical Conse-quences. Doctoral Thesis, Institute of Geotechnical Engineering, Universityof Stuttgart, Stuttgart.
Bourgeois, E., Kouby, A.L., Soyez, L., 2012. Influence of the strip-backfillinteraction model in the analysis of the behavior of a mechanical stabilizedearth wall. Soils and Foundations 52 (3), 550–561.
Clough, G.W., O’Rourke, T.D., 1990. Construction-Induced Movements of Insitu Walls, Design and Performance of Earth Retaining Structure. 2. ASCESpecial Publication 439–470.
Hardin, B.O., Drnevich, V.P., 1972. Shear modulus and damping in soils:design equations and curves. Journal of Soil Mechanics and FoundationsDivision, 98; 667–692.
Hooi, Y.K., 2003. Ground Movements Associated with Station Excavation ofthe First Bangkok MRT subway. Masters Thesis, Asian Institute ofTechnology, Thailand.
Hsieh, P.G., Ou, C.Y., 1998. Shape of ground surface settlement profilescaused by excavation. Canadian Geotechnical Journal 35 (6), 1004–1017.
Ishibashi, I., Zhang, X., 1993. Unified dynamic shear moduli and dampingratios of sand and clay. Soils and Foundations 33 (1), 182–191.
Kempfert, H., Gebreselassie, B., 2006. Excavations and Foundations in SoftSoils. Springer-Verlag, Berlin, Heidelberg, Germany.
Kung, G.T., Ou, C.Y., Juang, C.H., 2009. Modelling small-strain behaviour ofTaipei clays for finite element analysis of braced excavations. Computerand Geotechnics 36 (1–2), 304–319.
Likitlersuang, S., Teachavorasinskun, S., Surarak, C., Oh, E., Balasubrama-niam, A.S., 2013. Small Strain Stiffness and Stiffness Degradation Curveof Bangkok Clays. Soils and Foundations 53 (4), 498–509.
S. Likitlersuang et al. / Soils and Foundations 53 (2013) 756–773 773
Mirjalili, R., 2009. Performance of Deep Excavations in MRT Stations:Bangkok MRT as a Case Study. Masters Thesis, Griffith University,Australia.
Ou, C.Y., 2006. Deep excavation: Theory and Practice. Taylor & Francis,London, UK.
Ou, C.Y., Hsieh, P.G., 2011. A simplified method for predicting groundsettlement profiles induced by excavation in soft clay. Computers andGeotechnics 38 (12), 987–997.
Ou, C.Y., Hsieh, P.G., Chiou, D.C., 1993. Characteristics of ground surfacesettlement during excavation. Canadian Geotechnical Journal 30, 758–767.
Peck, R.B., 1969. Deep excavations and tunnelling in soft ground. In: Proceedingof the 7th International Conference on Soil Mechanics and FoundationsEngineering. Mexico City, State of the Art Volume, pp. 225–290.
Phienwej, N., 2008. Ground movement in station excavations of Bangkok firstMRT. In: Proceedings of the 6th International Symposium on Tunnelling forUrban Development (IS-Shanghai 2008), Shanghai, China, pp. 181–186.
Phienwej, N., Gan, C.H., 2003. Characteristics of ground movement in deepexcavations with concrete diaphragm walls in Bangkok soils and theirprediction. Journal of the Southeast Asian Geotechnical Society 34 (3),167–175.
PLAXIS 2D v.9, 2009, Reference Manual.Santos, J.A., Correia, A.G., 2001. Reference threshold shear strain of soil: its
application to obtain a unique strain-dependent shear modulus curve forsoil. In: Proceedings of the 15th International Conference on SoilMechanics and Geotechnical Engineering, vol. 1, Istanbul, A.A. Balkema,pp. 267–270.
Schanz, T., Vermeer, P.A., Bonnier, P.G., 1999. The Hardening Soil Model:Formulation and Verification. Beyond 2000 in Computational Geotechnics.Taylor & Francis, Rotterdam.
Schweiger, H.F., 2009. Influence of constitutive model and EC7 designapproach in FEM analysis of deep excavations. In: Proceeding of ISSMGEInternational Seminar on Deep Excavations and Retaining Structures,Budapest, pp. 99–114.
Surarak, C., Likitlersuang, S., Wanatowski, D., Balasubramaniam, A., Oh, E.,Guan, H., 2012. Stiffness and strength parameters for hardening soil modelof soft and stiff Bangkok clays. Soils and Foundations 52 (4), 682–697.
Suwansawat, S., 2002. Earth Pressure Balance (EPB) Shield Tunnelling inBangkok: Ground Response and Prediction of Surface Settlements UsingArtificial Neural Networks. Doctoral Thesis, Massachusetts Institute ofTechnology, USA.
Suwansawat, S., Chaiwonglek, C., Horny, U., 2007. Design aspects of NATMand cut and cover underground stations for the Bangkok MRTA Blue LineExtension. In: Proceedings of the 7th International Symposium onTunnelling for Urban Development (IS-Pattaya 2007), Pattaya City,Thailand, pp. 64–75.
Teachavorasinskun, S., Thongchim, P., Lukkunaprasit, P., 2002. Shearmodulus and damping of soft Bangkok clays. Canadian GeotechnicalJournal 39 (5), 1201–1208.
Teparaksa, W., Thasananipan, N., Tanseng, P., 1999. Analysis of lateral wallmovement for deep braced excavation of bangkok subsoils. In: Proceedingof the Civil and Environmental Engineering Conference, Bangkok, Thai-land, pp. 67–76.
Vucetic, M., Dobry, R., 1991. Effect of soil plasticity on cyclic response.Journal of Geotechnical Engineering 117 (1), 89–107.