Date post: | 01-Jul-2018 |
Category: |
Documents |
Upload: | truongkien |
View: | 228 times |
Download: | 0 times |
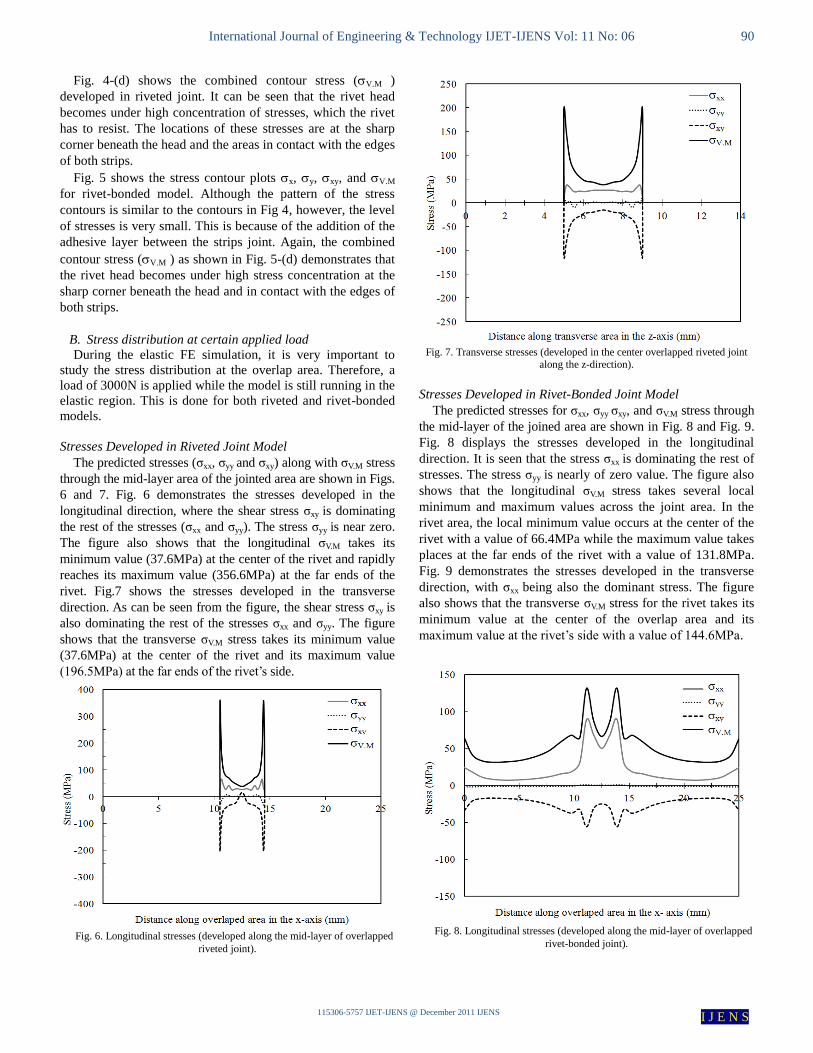
International Journal of Engineering & Technology IJET-IJENS Vol: 11 No: 06 86
115306-5757 IJET-IJENS @ December 2011 IJENS I J E N S
Abstract— A three-dimensional finite element modeling is
developed using ABAQUS® software. This includes riveted and
rivet-bonded joints models. Both models undergo thermal heat
caused by hot-driven rivet process and then are subjected to a
constant velocity at one of its strip edges to simulate the shear
tensile test up to the failure point. The developed FE models were
based on elastic-plastic properties and ductile fracture limit
criteria. In addition, the adhesive layer was modeled based on
traction separation. Detailed experiments were conducted to
evaluate these material properties and provide the FE developed
models with these necessary data. The thermal stresses developed
in riveted and rivet-bonded joints are assessed and reported. The
present work shows that introducing an adhesive layer to riveted
joints vastly reduces the stresses developed in these joints. In
addition, the complete load-displacement curve for each joining
model is obtained and compared with the finite element models
without including the effect of thermal analysis.
Index Term— Adhesive Layer, Load-Displacement Curve,
Rivet, Rivet-Bonded, Thermal Stresses.
I. INTRODUCTION
Rivets are used in many design applications such as joining
together two plates. A full understanding of these joints is
essential in most of automobile and aerospace industries.
When a rivet is heated before being placed in the hole, it is
identified as hot-driven rivet. After the rivet colds, it presses
the connected parts strongly and the rivet pole expands to fill
the hole. Thus, the rivet head becomes under high
concentration of stresses, which the rivet has to resist. The
sharp corner beneath the head may cause the head to be failed.
Tearing between the rivet holes, shearing, or crushing of the
rivet and/ or the joined material are considered to be the major
tension connection failures.
Using an adhesive material as bonding is another way of
joining two different parts. It is used to adhere a wide range of
materials structure such as metal to metal or metal to non-metal.
It has the advantages of reducing stress concentration, resisting
fatigue, and the capability of joining two different thickness
materials as well as joining two dissimilar materials. Bonded
structure could be used alone or together with a mechanical
This work was supported by College of Engineering Research Center,
King Saud University. Essam A. Al-Bahkali is with the Mechanical Engineering Department,
King Saud University, P.O. Box 800, Riyadh 11421, Saudi Arabia (phone:
+9661-4676675; fax: +9661-67-6652; e-mail: [email protected]).
connection. The bonded with a mechanical connection type may
include weld-bonded and rivet-bonded connections.
Barron [1] investigated the effect of clamping forces and grip
on the fatigue strength of rivets in butt joints. Hoffer [2]
determined the load-bearing capacity of a riveted joint by using
statistical analysis. He also evaluated the type of the joint
failures. Schvechkov [3] studied experimentally the effects of
adhesive mechanical properties along with the geometry of
butted sheets on the point of failure and cycle longevity on
rivet-bonded joints.
Fung and Smart [4] examined countersunk and snap riveted
single lap joints experimentally and numerically. They studied
the failures metallurgically to determine the cause of failure and
then they analyzed the joints using the finite element method.
They found that the stress concentration for this joint occurred
at a point away from the point of failure of a riveted joint. They
also determined the stress patterns around the rivet. Bedaira and
Eastaugh [5] proposed a numerical procedure for the analysis of
riveted lap joints taking into account the effect of the secondary
out of plane bending and plates/rivet interaction. Their results
showed that the secondary bending largely affects the maximum
tensile and compressive stresses within the joint with difference
might reach up to 39%. They also presented an experimental
comparison using photo-elastic test.
Gomeza et al. [6] presented a mechanical model to
reproduce the behavior of a structural hybrid adhesive/riveted
single lap joint. They used the Bond-Graph technique in order
to obtain the equations of the model. These equations
depended on four parameters considered to be the
characteristics of the joint. Their model reproduced the
experimental curves with great precision. Sadowski et al. [7]
carried out an experimental investigations of steel adhesive
double lap joints reinforced by rivets. They monitored the
deformation process of the hybrid joint using digital image
correlation system. They also studied the model numerically
and analyzed the whole model behavior up to failure point.
They found that adding a rivet to the adhesive joint led to very
significant energy absorption by about 35% in comparison to a
simple adhesive.
Moroni et al. [8] evaluated the beneficial of using hybrid
weld-, rivet- or clinch-bonded joints in comparison with
simple adhesive, spot-welded, riveted or clinched joints. They
conducted experimental analysis using the design of
experiments methodology. The influence of the material,
geometrical factors, and environment on static strength,
stiffness and energy absorption was assessed through the
Finite Element Modeling for Thermal Stresses
Developed in Riveted and Rivet-Bonded Joints
Essam A. Al-Bahkali
International Journal of Engineering & Technology IJET-IJENS Vol: 11 No: 06 87
115306-5757 IJET-IJENS @ December 2011 IJENS I J E N S
analysis of variance. They compared the hybrid and simple
joints in terms of mechanical response under the various
conditions tested.
Al-Bahkali [9] developed three-dimensional finite element
modeling for spot welded and weld-bonded joints models for
austenitic stainless steel AISI 304 annealed condition sheets of
1.0 mm thickness. In his studied, each model underwent
thermal heat caused by spot welding process and then was
subjected to an axial load up to the failure point. He defined
the properties of elastic and plastic regions, fracture limit,
weld nugget and heat affected zones around the spot welding.
He also obtained the load-displacement curve for each joining
model theoretically and experimentally. The results obtained
for both spot welded and weld-bonded joints affected by
thermal process showed an excellent agreement with the
experimental data.
Although several studies on riveted joints have been carried
out, however, these studies focused on the failure and strength
at room temperature. In the present work, three-dimensional
finite element analysis is considered to calculate the thermal
stresses caused by hot driven rivet for both riveted and rivet-
bonded models. In addition, the stress distribution for each
model at certain load is determined. Finally, the load-
displacement curves for both models with and without
including the effect of thermal analysis are calculated and
compared.
II. MODEL
A. Geometry
The art of the finite element (FE) analysis lies in the
representation of a real structure and its loading by a
mathematical model, which can be analyzed by the particular
analysis program used. An accurate and efficient idealization
can be as similar as possible to the real structure from the
geometric and loading view points. Two finite element models
are considered in the present work. The considered models are a
single lap riveted model and a single lap hybrid rivet-bonded
model. Fig. 1 shows the configurations, dimensions, constraints,
and loading conditions for both models (riveted and rivet-
bonded models).
Throughout the analysis, the following assumptions are
considered:
1) The analysis is based on three dimensional FE model.
2) Each model is subjected to thermal analysis, then to an
elastic analysis. During the thermal analysis, the hot driven
rivet is assumed to be at 160oC uniform temperature, then
it cools until it reaches room temperature. During the
elastic analysis, both models are subjected to a constant
Velocity that the model is subjected to at the right edge of
the right strip to simulate the shear tensile test.
3) A thin isotropic adhesive layer is considered.
4) The line of action force is not initially parallel to the
adhesive layer. Thus, as the load increases the overlap
area bends and therefore the adhesive layer peel at its
ends.
Fig. 1. (a) Riveted, and (b) Rivet-Bonded Models
B. Finite Element Mesh
The finite element computation is carried out using
ABAQUS software [10]. Fig. 2 shows the FE mesh for a
portion of the hyper rivet-bonded model.
Fig. 2. 3D partial finite element mesh of Rivet-Bonded Model
The selection of the mesh size is based on the ability to
represent each model accurately and obtaining the results in
reasonable time. The element type is specified based on the
ability to represent the variation of temperature and the
mechanical behavior of the model. Therefore, the meshes for
International Journal of Engineering & Technology IJET-IJENS Vol: 11 No: 06 88
115306-5757 IJET-IJENS @ December 2011 IJENS I J E N S
each model are generated using eight-node trilinear
displacement and temperature reduced integration with
hourglass control (C3D8RT) for the strips and rivet, and three
dimensional cohesive elements type (COH3D8) for the
adhesive layer. The numbers of elements for both models that
are used in the current study after several refined meshes to
insure the conversion of FE results, are given in Table I.
TABLE I
Elements number used in different models
Model Riveted Model Rivet-Bonded Model
Strip A 3360 3360
Strip B 3360 3360
Adhesive Layer ----- 928
Rivet 4448 4448
C. Model Analysis
In this research, the analysis of each model is divided into
two stages. These stages are thermal analysis and elastic
analysis. In the thermal analysis (first stage), stresses caused
by cooling the rivet from 160oC to room temperature are
determined. In the elastic analysis (second stage), each model
is subjected to a constant velocity (V) at the right edges of
strip (B). Out of this analysis, the stresses at certain load and
the load-displacement curves are determined for each model.
Fig. 3 shows the basic algorithm steps for the analysis
models. Where Ti is initial temperature, To is the room
temperature, V is the velocity that the model is subjected to at
the right edge to simulate the shear tensile test, and hair is the
convection heat transfer coefficient.
Fig. 3. The basic algorithm steps for the analysis model
D. Boundary Conditions
1. Thermal Boundary Conditions
A heat transfer analysis is preformed first to cool the rivet
part until it reaches room temperature. This can be done by
considering a convection heat transfer process as a thermal
boundary condition. Hence, it is assumed that heat is
exchanged with the environment through a convection heat
transfer coefficient hair as:
( ) (1)
2. Elastic Boundary Conditions
The mechanical boundary conditions associated with each
finite element model can be summarized as the following:
1) On the left edges at x = 0, clamped boundary conditions
are imposed. Thus, the displacements ux, uy, and uz are
equal to zero.
2) Both strips are subjected to a fixed y-direction boundary
condition (uy = 0) at the beginning 30 mm segment of
strip A (x = 0 to 30mm) and at the end 30mm segment of
strip B (x = 145 to 175mm).
3) In the overlap area for the rivet-bonded model, tie
constraints are imposed between components of bonded
joints; i.e. both strips and adhesive layer. By doing so, the
translational and rotational boundary conditions of tied
surfaces are made identical, regardless of the way these
parts are meshed.
4) The model is subjected to a constant velocity (V = 1
mm/min.) at the right edges of right base metal strip to
simulate the shear tensile test.
E. Material Properties
Detailed experiments were conducted to evaluate the
material properties and provide the FE developed models with
these necessary data. These data are given in Table 2. The
ductile fracture limits are also defined in terms of stress
triaxiality and corresponding equivalent strain for steel [11-
17]. The corresponding equivalent strain is obtained from the
tensile test of notched specimen and the stress triaxiality is
evaluated using numerical simulation [18-19]. The adhesive
layer is defined based on traction separation mode.
TABLE II
Material properties for steel and adhesive
Material Adhesive Steel
Young’s Modulus (GN/m2) 1.9 193.7
Possion’s Ratio, 0.37 0.30
Yield Stress Sy (MPa) 32 277.3
Ultimate Stress Sut (MPa) 60.4 729.2
Specific heat (J/kg oC) 1667.2 458.48
Thermal expansion (C-1) 60 12
Thermal conductivity (W/moK) 0.7 35
III. RESULT
The results of riveted and rivet-bonded FE simulations
including both thermal and elastic analyses are determined. At
first, the stresses resulted from thermal analysis are obtained.
Secondly, the stresses at certain load during the elastic
analysis are determined. Finally, the load-displacement curves
International Journal of Engineering & Technology IJET-IJENS Vol: 11 No: 06 89
115306-5757 IJET-IJENS @ December 2011 IJENS I J E N S
are obtained and compared with the same models but without
including the thermal analysis which reflect the case of cold-
driven rivet
A. Thermal stress
The results of riveted and rivet-bonded FE models after
running thermal analysis are determined and shown in Fig. 4
and Fig. 5, respectively. Both FE models undergo a heat
transfer analysis until they reach room temperature starting
from temperature Ti=160oC.
Fig. 4. Thermal Stress Contours for Riveted Model
Fig. 4 shows the contour plots for riveted model for the
normal stresses (x & y), the shear stress (xy), and the Von
Mises stress (V.M). While the normal stress x has high stress
concentration underneath the rivet head and in contact with the
strips edges at the top and bottom of the rivet hole as shown in
Fig. 4-(a), the normal stress y has high stress at the rivet
center and in contact with the strips as shown in Fig. 4-(b). On
the other hand, the shear stress contour (see Fig 4-(c))
illustrates that the high stress level (tension and compression)
takes a diagonal shape starting from the contact edge between
strips and underneath the rivet head toward the surface of the
rivet head.
Fig. 5. Thermal Stress Contours for Rivet-Bonded Model
International Journal of Engineering & Technology IJET-IJENS Vol: 11 No: 06 90
115306-5757 IJET-IJENS @ December 2011 IJENS I J E N S
Fig. 4-(d) shows the combined contour stress (V.M )
developed in riveted joint. It can be seen that the rivet head
becomes under high concentration of stresses, which the rivet
has to resist. The locations of these stresses are at the sharp
corner beneath the head and the areas in contact with the edges
of both strips.
Fig. 5 shows the stress contour plots x, y, xy, and V.M
for rivet-bonded model. Although the pattern of the stress
contours is similar to the contours in Fig 4, however, the level
of stresses is very small. This is because of the addition of the
adhesive layer between the strips joint. Again, the combined
contour stress (V.M ) as shown in Fig. 5-(d) demonstrates that
the rivet head becomes under high stress concentration at the
sharp corner beneath the head and in contact with the edges of
both strips.
B. Stress distribution at certain applied load
During the elastic FE simulation, it is very important to
study the stress distribution at the overlap area. Therefore, a
load of 3000N is applied while the model is still running in the
elastic region. This is done for both riveted and rivet-bonded
models.
Stresses Developed in Riveted Joint Model
The predicted stresses (σxx, σyy and σxy) along with σV.M stress
through the mid-layer area of the jointed area are shown in Figs.
6 and 7. Fig. 6 demonstrates the stresses developed in the
longitudinal direction, where the shear stress σxy is dominating
the rest of the stresses (σxx and σyy). The stress σyy is near zero.
The figure also shows that the longitudinal σV.M takes its
minimum value (37.6MPa) at the center of the rivet and rapidly
reaches its maximum value (356.6MPa) at the far ends of the
rivet. Fig.7 shows the stresses developed in the transverse
direction. As can be seen from the figure, the shear stress σxy is
also dominating the rest of the stresses σxx and σyy. The figure
shows that the transverse σV.M stress takes its minimum value
(37.6MPa) at the center of the rivet and its maximum value
(196.5MPa) at the far ends of the rivet’s side.
Fig. 6. Longitudinal stresses (developed along the mid-layer of overlapped
riveted joint).
Fig. 7. Transverse stresses (developed in the center overlapped riveted joint
along the z-direction).
Stresses Developed in Rivet-Bonded Joint Model
The predicted stresses for σxx, σyy σxy, and σV.M stress through
the mid-layer of the joined area are shown in Fig. 8 and Fig. 9.
Fig. 8 displays the stresses developed in the longitudinal
direction. It is seen that the stress σxx is dominating the rest of
stresses. The stress σyy is nearly of zero value. The figure also
shows that the longitudinal σV.M stress takes several local
minimum and maximum values across the joint area. In the
rivet area, the local minimum value occurs at the center of the
rivet with a value of 66.4MPa while the maximum value takes
places at the far ends of the rivet with a value of 131.8MPa.
Fig. 9 demonstrates the stresses developed in the transverse
direction, with σxx being also the dominant stress. The figure
also shows that the transverse σV.M stress for the rivet takes its
minimum value at the center of the overlap area and its
maximum value at the rivet’s side with a value of 144.6MPa.
Fig. 8. Longitudinal stresses (developed along the mid-layer of overlapped
rivet-bonded joint).
International Journal of Engineering & Technology IJET-IJENS Vol: 11 No: 06 91
115306-5757 IJET-IJENS @ December 2011 IJENS I J E N S
Fig. 9. Transverse stresses (developed in the center overlapped rivet-
bonded joint along the z-direction).
Figs. 8 and 9 show that the Von Mises stresses developed in
rivet-bonded joints are nearly of low and uniform value
compare to the riveted model. They also show that the V. M.
stresses of riveted joints are reduced by 63% in the
longitudinal direction and by 26.4% in the transverse direction
when the adhesive layer is introduced.
C. Load-displacement Curve
The results of riveted and rivet-bonded FE simulations
including the effect of thermal analysis are determined. The
results are compared with the same FE models but without
including the effect of the thermal analysis.
Fig. 10 Load-displacement curves for rivet and rivet-bonded models with
or without including the thermal analysis.
Fig. 10 shows four load-displacement curves obtained from
the FE riveted and rivet-bonded models. These four curves
are: riveted model runs at room temperature, riveted model
runs at temperature Ti =160oC, rivet-bonded model runs at
room temperature, and rivet-bonded model runs at temperature
Ti=160oC. By comparing all curves, it is clear that both riveted
models with and without including the effect of thermal
analysis have the same trend. However, for the riveted model
with thermal analysis, the maximum load is increased by 9%
and the displacement is increased by 25%. Similarly, both
rivet-bonded models with and without including the effect of
thermal analysis are alike in general, but the maximum load
and displacement of the rivet-bonded model with thermal
analysis are increased by almost the same amount of 9% and
23%, respectively.
By comparing the trend of the obtained load-displacement
curves with other pervious published work such as Birch et al.
[20], these curves show, in general, a very good agreement
with their results.
IV. SUMMARY AND CONCLUSION
A three-dimensional FE riveted and rivet-bonded models
are developed. Both models undergo thermal analysis caused
by hot-driven rivet and then are subjected to a constant
velocity at one of its strip edges to simulate shear tensile test.
The two-step analysis is used to include the effect of residual
stresses cased by high initial temperature. In addition, stresses
at certain load and load-displacement curve for each joining
model are successfully obtained. The results show that
introducing the adhesive layer to riveted joints increases the
joint strength and significantly reduces the stresses developed in
riveted joints. It is found that, adding the thermal analysis to
the solution seems to have an effect on the steel structure.
During the cooling cycle from Ti=160oC to room temperature,
carbides precipitate more uniformly throughout the steel
structure which improves the strength by at least 9% and the
displacement by 23%.
The analysis in this paper has been executed by running the
Abaqus/Standard procedure. To fully understand the dynamic
behavior of the joints and the failure modes, this study can be
extended by running Abaqus/Explicit procedure to include the
time-domain in the analysis. This will help investigating the
influences of different parameters on riveted and rivet-bonded
joints such as the sensitivity of the strain rate and the fracture
limits. It is recommended to carry out some experimental
works to verify the results.
REFERENCES
[1] K. Hoffer,” Rivet Joints in Aluminum Structural components I and II
Aluminum,” p. 391, p. 473, 1983. [2] F. Barron and E. W. Larson, “ Comparison of Bolted and Riveted Joints, “
Trans. Am. Soc. Civil Eng., 1955, pp. 1322.
[3] E. I. Schvechkov,” Failure Patterns and Cycle Longevity of Rivet-Bonded Joints,” Masinovedenie, 1984, p. 71.
International Journal of Engineering & Technology IJET-IJENS Vol: 11 No: 06 92
115306-5757 IJET-IJENS @ December 2011 IJENS I J E N S
[4] C-P Fung and J. Smart,” An experimental and numerical analysis of
riveted single lap joints,” Proceedings of the Institution of Mechanical Engineers, Vol. 208, No. G2, 1994, pp.79-90.
[5] O. K. Bedaira and G. F. Eastaugh,” A numerical model for analysis of
riveted splice joints accounting for secondary bending and plates/rivet interaction,” Thin-Walled Structures, Vol. 45, 2007, pp. 251–258.
[6] S. Gomeza, J. Onoro, and J. Pecharroman,” A simple mechanical model
of a structural hybrid adhesive/riveted single lap joint,” International Journal of Adhesion and Adhesives, Vol. 27, 2007, pp. 263-267.
[7] T. Sadowski, M.Knec´, and P.Golewski,” Experimental investigations
and numerical modeling of steel adhesive joints reinforced by rivets,” International Journal of Adhesion & Adhesives, Vol. 30, 2010, 338-346.
[8] F. Moroni, A.Pirondi, and F.Kleiner,” Experimental analysis and comparison
of the strength of simple and hybrid structural joints,” International Journal of Adhesion & Adhesives, Vol. 30, 2010, pp. 367-379.
[9] E. Al-Bahkali,” Effect of Including Thermal Process on Spot Welded
and Weld-Bonded Joints,” World Academy of Science, Engineering and Technology, Vol. 80, 2011, pp. 142-146.
[10] ABAQUS, User’s Manual, Version 6.9, 2010.
[11] H. Hooputra, H. Gese, H. Dell, and H. Werner,” A comprehensive failure model for crashworthiness simulation of aluminum extrusions,”
International Journal of Crash, Vol. 9, No. 5, 2004, pp. 449-463.
[12] E. El-Magd, H. Gese, R. Tham, H. Hooputra, and H. Werner,” Fracture criteria for automobile crashworthiness simulation of wrought aluminum
alloy components,” Material wissenschaft und Werkstoftechnik, Vol. 32,
No. 9, 2001, pp. 712-724. [13] Y. Bao,” Dependence of ductile crack formation in tensile tests on stress
triaxiality stress and strain ratios,” Journal of Engineering Fracture Mechanics, Vol. 72, 2005, pp. 502-522.
[14] D. Holland, X. Kong, N. Schluter, and W. Dahl,” Investigations
concerning quantitative determination of local damage in ductile materials,” Journal of Steel Research, Vol. 63, No. 8, 1992, pp. 361-367.
[15] M. Alves, and N. Jones,” Influence of hydrostatics stress on failure of
axi-symmetric notched specimens,” Journal of the Mechanics and Physics of Solids, Vol. 47, 1999, pp. 643-667.
[16] A. C. Mackenzie, J. W. Hancock, and D. K. Brown,” On the influence of
state of stress on ductile failure initiation in high strength steels,” Journal of Engineering Fracture Mechanics, Vol. 9, 1977, pp. 167-188.
[17] J. W. Hancock, and A. C. Mackenzie,” On the mechanism of ductile
failure in high-strength steels subjected to multi-axial stress-states,” Journal of the Mechanics and Physics of Solids, Vol. 24, 1976, pp. 147-
169.
[18] E. Al-Bahkali, M. Es-Saheb, and J. Herwan,” Finite Element Modeling of Weld-Bonded Joint,” The 4th International Conference on Advanced
Computational Engineering and Experimenting, Paris, France, 2010.
[19] J. Herwan, “Load-Displacement Curve Prediction of Weld Bonded Stainless Steel Using Finite Element Method,” M.S. dissertation, Dept.
of Mech. Eng., King Saud University, Riyadh, Saudi Arabia, 2010.
[20] R. S. Birch, L. Vendrasco, M. D. White, M. Mahe,” Modelling the dynamic failure of riveted joints in aerospace fuselages,” WIT
Transactions on Engineering Sciences, Vol. 49, 2005, pp. 121-134.