Finite Element Modeling of Intermediate Crack Debonding in FRP-Plated RC Beams G.M. Chen 1 ; J.G. Teng 2 ; and J.F. Chen 3 Abstract: Intermediate crack induced debonding (IC debonding) is a common failure mode of RC beams strengthened with externally bonded FRP reinforcement. Although extensive research has been carried out on IC debonding, much work is still needed to develop a better understanding of the failure mode and a more reliable strength model. This paper presents an advanced finite element (FE) model based on the smeared crack approach for predicting IC debonding failure. Existing FE models of the same type are generally deficient in capturing localized cracks (both their pattern and widths). This deficiency is overcome in the proposed FE model through the accurate modeling of interfaces between the concrete and both the internal steel and the external FRP reinforcements. The capability and accuracy of the proposed model are demonstrated through comparisons of its predictions with selected test results. The importance of accurate modeling of localized cracking is also explained using numerical results obtained from the FE model. CE Database subject headings: Fiber reinforced polymer; Reinforced Concrete; Concrete beams; Cracking; Bonding; Interfaces; Shear stress; Strain distribution; Flexural strength; Finite element method. ___________________________________ 1 PhD Candidate, Department of Civil and Structural Engineering, The Hong Kong Polytechnic University, Hong Kong, China 2 Chair Professor of Structural Engineering., Department of Civil and Structural Engineering, The Hong Kong Polytechnic University, Hong Kong, China (Corresponding author); Email: [email protected]3 Reader, Institute for Infrastructure and Environment, Joint Research Institute for Civil and Environmental Engineering, School of Engineering, The University of Edinburgh, Edinburgh, United Kingdom 1 This is the Pre-Published Version.
Transcript
Finite Element Modeling of Intermediate Crack Debonding in FRP-Plated RC Beams
G.M. Chen1; J.G. Teng2; and J.F. Chen3
Abstract: Intermediate crack induced debonding (IC debonding) is a common failure mode of RC beams strengthened with externally bonded FRP reinforcement. Although extensive research has been carried out on IC debonding, much work is still needed to develop a better understanding of the failure mode and a more reliable strength model. This paper presents an advanced finite element (FE) model based on the smeared crack approach for predicting IC debonding failure. Existing FE models of the same type are generally deficient in capturing localized cracks (both their pattern and widths). This deficiency is overcome in the proposed FE model through the accurate modeling of interfaces between the concrete and both the internal steel and the external FRP reinforcements. The capability and accuracy of the proposed model are demonstrated through comparisons of its predictions with selected test results. The importance of accurate modeling of localized cracking is also explained using numerical results obtained from the FE model. CE Database subject headings: Fiber reinforced polymer; Reinforced Concrete; Concrete beams; Cracking; Bonding; Interfaces; Shear stress; Strain distribution; Flexural strength; Finite element method. ___________________________________ 1 PhD Candidate, Department of Civil and Structural Engineering, The Hong Kong Polytechnic University, Hong Kong,
China
2 Chair Professor of Structural Engineering., Department of Civil and Structural Engineering, The Hong Kong
Polytechnic University, Hong Kong, China (Corresponding author); Email: [email protected]
3 Reader, Institute for Infrastructure and Environment, Joint Research Institute for Civil and Environmental Engineering,
School of Engineering, The University of Edinburgh, Edinburgh, United Kingdom
It is now a common practice to bond fiber-reinforced polymer (FRP) reinforcement in the form of pultruded or wet-layup plates to the tension face of reinforced concrete (RC) beams (i.e. FRP-plated RC beams) to increase their flexural load-carrying capacity. Such strengthened beams often fail by debonding in two types of modes (e.g. Buyukozturk et al. 2004; Hollaway and Teng 2008; Teng and Chen 2009): (a) intermediate crack (IC) induced debonding in which debonding is initiated at a major flexural crack and propagates towards a plate end; and (b) plate end debonding (including a number of distinct modes) in which debonding initiates at the plate end. Debonding failures involve complex mechanisms and are still a topic of intensive current research (Teng and Chen 2009). An extensive review of existing studies on the numerical modeling of debonding failures in FRP-plated RC members has recently been conducted by Chen (2010) from the perspective of the modeling approaches used. A summary of the main studies after year 2000 is given in Table 1, while further details of the review are available in Chen (2010). The present paper presents a more advanced and more accurate finite element (FE) approach based on the popular and versatile smeared crack approach for the prediction of IC debonding failure. Table 1 shows that existing finite element (FE) models based on the smeared crack approach except Niu and Karbhari (2008) generally do not include an appropriate model for the bond behavior between concrete and internal steel reinforcement. The FE model of Niu and Karbhari (2008), which does depict this bond behavior, is not a predictive model because in their FE model, the important parameters for defining bond behavior between concrete and FRP, such the interfacial fracture energy, need to be identified from experimental data. The lack of attention to the modeling of bond behavior between concrete and internal steel reinforcement has been due to both the need for researchers to focus on the more pressing issues (e.g. bond behavior between concrete and externally bonded FRP reinforcement) in the past and the inadequate appreciation of its importance to the prediction of IC debonding failure in FRP-plated RC beams. It is important to note that IC debonding failure is driven by the appearance and widening of the main cracks, so the accurate prediction of crack paths and widths are a pre-requisite for the accurate prediction of debonding failures; the latter depends on the accurate modeling of bond behavior between concrete and internal steel reinforcement. In the proposed FE model, the interfaces between the concrete and both the internal steel and the external FRP reinforcements are accurately captured using interfacial elements with appropriate bond-slip properties, eliminating the above-mentioned deficiency in existing FE models. The capability and accuracy of the proposed FE model are demonstrated through comparisons of its predictions with selected test results.
EXISTING FE STUDIES ON IC DEBONDING FAILURE Discrete-Crack Approach versus Smeared-Crack Approach The two common approaches for modeling concrete cracking (ACI 446.3R 1997), the
2
discrete-crack model and the smeared crack model, have both been used to model IC debonding (see Table 1). The former simulates a crack as a geometrical identity so discontinuities arising from cracking are physically modeled. By contrast, the smeared crack model treats cracked concrete as a continuum and captures the deterioration process of cracked concrete using a constitutive relationship and hence smears cracks over the continuum. When the discrete crack approach is implemented in an FE model, the cracks are commonly defined along element boundaries. This inevitably introduces mesh bias (ACI 446.3R 1997). Attempts have been made to solve this problem by developing automatic re-meshing algorithms (e.g. Yang et al. 2003), but overcoming computational difficulties associated with topology changes due to re-meshing is still a challenge (de Borst et al. 2004). The smeared crack approach has its drawbacks too. The main drawback is the strain localization phenomenon: the energy consumed during crack propagation approaches zero when the element size approaches zero; as a result, the results are not mesh-objective. Various mathematical devices (i.e. localization limiters) have been proposed to overcome this mesh non-objectivity problem. One of the successful localization limiters is the crack band model (Bazant and Planas 1998), which relates the element size to the constitutive law of concrete so that the fracture energy is independent of element size. When the crack band model is adopted, the discrete crack model and the smeared crack model yield about the same results if the crack opening displacement wt in the discrete crack model is taken as the cracking strain εcr accumulated over the width hc of the crack band in a smeared crack model (Bazant and Planas 1998):
ch
crt dhwc
∫= ε (1)
The above discussion provides the necessary background to the summary of the main existing studies on the numerical (mainly FE) modeling of debonding failures in FRP-plated RC members and for the present work. In the FE model presented in this paper, the smeared crack approach is adopted within the framework of the crack band model. The smeared crack approach has also been adopted by most existing FE models which are capable of predicting IC debonding failures with reasonable success (e.g. Neale et al. 2006; Lu et al. 2007). Accuracy of the Smeared Crack Approach For the accurate modeling of IC debonding failure, accurate modeling of localized flexural cracking is essential. To predict localized cracks accurately, an FE model based on the smeared crack approach must include the following three elements: (a) an accurate constitutive model for modeling cracked concrete, especially the post-cracking behavior of concrete; (b) an accurate bond-slip model for the bond behavior between concrete and external FRP reinforcement; and (c) an accurate bond-slip model for bond behavior between concrete and internal steel reinforcement. Among the existing FE models based on the smeared crack approach, none [except Niu and Karbhari’s (2008) model which is not a predictive model as discussed above] has included all three elements and the most advanced models (e.g. Lu et al. 2007) are generally inadequate in including the third element (Table 1). The bond-slip behavior between steel bars and surrounding concrete has an important
3
effect on concrete cracking behavior as demonstrated by previous studies (e.g. Rot 1988; Rots and Blaauwendraad 1989; Cervenka et al. 2003; Jendele and Cervenka 2006; Yang and Chen 2005). Therefore, if element (c) mentioned above is not included in an FE model, the cracks as well as the debonding failure cannot be accurately predicted. As a result, Lu et al. (2007) had to resort to a dual debonding criterion first explained in Teng et al. (2004), which enabled IC debonding to be accurately predicted; a similar approach was used by Neale (2006) as explained later by Baky et al. (2007). However, the cracks predicted by such an FE model are still inaccurate due to the perfect bond assumption made for steel tension bars, as further discussed later in the paper.
PROPOSED FE MODEL In the present study, efforts were made to develop an FE model which takes the three elements mentioned above all into proper account. The proposed model is a two-dimensional FE model and has been implemented in ABAQUS (ABAQUS 6.5, 2004). It is based on the smeared cracked approach so that the crack paths need not be pre-defined and employs the crack band model to overcome the mesh sensitivity problem associated with the conventional smeared crack model. The bond-slip behavior between concrete and reinforcements (both internal steel bars and external FRP plates) is modeled using appropriate bond-slip models. Further details of the FE model are described below.
Modeling of Concrete The concrete is modeled using the plane stress element CPS4 in ABAQUS (ABAQUS 6.5 2004). The crack band model is defined within the framework of the concrete damaged plasticity model [see Lubliner et al. (1989) and Lee (1996) for more details] in ABAQUS. For concrete under uniaxial compression, the equation suggested by Saenz (1964) is adopted following Chen (1982):
( )[ ]( ) ( )221 ppppaa
εεεεσεεσ
+−+= (2)
in which σ and ε are the compressive stress and the compressive strain respectively, σp and εp are respectively the experimentally determined maximum stress and its corresponding strain, and α is an experimentally determined coefficient representing the initial tangent modulus. In the present study, α was set to be equal to the elastic modulus of the concrete Ec and the ACI 318 (2002) equation was used to estimate Ec from the cylinder compressive strength (i.e. '4730 cc fE = in MPa); σp and εp were set to be equal to fc
’ and 0.002 respectively. For concrete under uniaxial tension, the tension-softening curve of Hordijk (1991) which was derived on the basis of an extensive series of tensile tests of concrete is employed following Jendele and Cervenka (2006):
( ) ( )22 3
1
3
1 11 c
cr
twwc
cr
t
t
t ecwwe
wwc
fcr
t
−⎟⎟⎠
⎞⎜⎜⎝
⎛−
+−⎥⎥⎦
⎤
⎢⎢⎣
⎡⎟⎟⎠
⎞⎜⎜⎝
⎛+=
σ
(3)
t
Fcr f
Gw 14.5= (4)
where wt is the crack opening displacement, wcr is the crack opening displacement at the complete release of stress or fracture energy, σt is the tensile stress normal to the crack
4
direction, and ft is the concrete uniaxial tensile strength. GF is the fracture energy required to create a stress-free crack over a unit area, and c1=3.0 and c2=6.93 are constants determined from tensile tests of concrete. In FE simulations, if no test data are available, ft and GF may be estimated from the following CEB-FIP (1993) equations:
32
'
1084.1 ⎟⎟⎠
⎞⎜⎜⎝
⎛ −= c
tff (5)
7.0'2
10)265.00469.0( ⎟⎟
⎠
⎞⎜⎜⎝
⎛+−= c
aaFfddG (6)
where da is the maximum aggregate size. In this study, it is assumed that da = 20 mm if information on the maximum aggregate size is not available. It should be noted that in Eq (6), if '
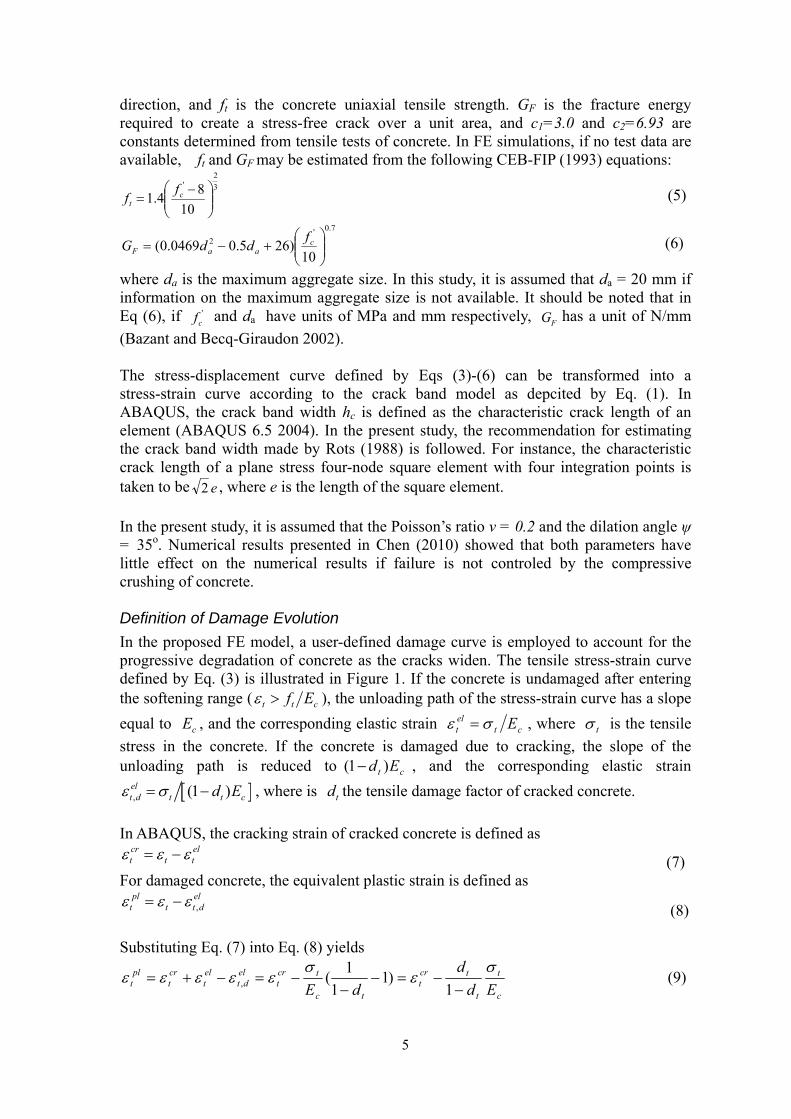
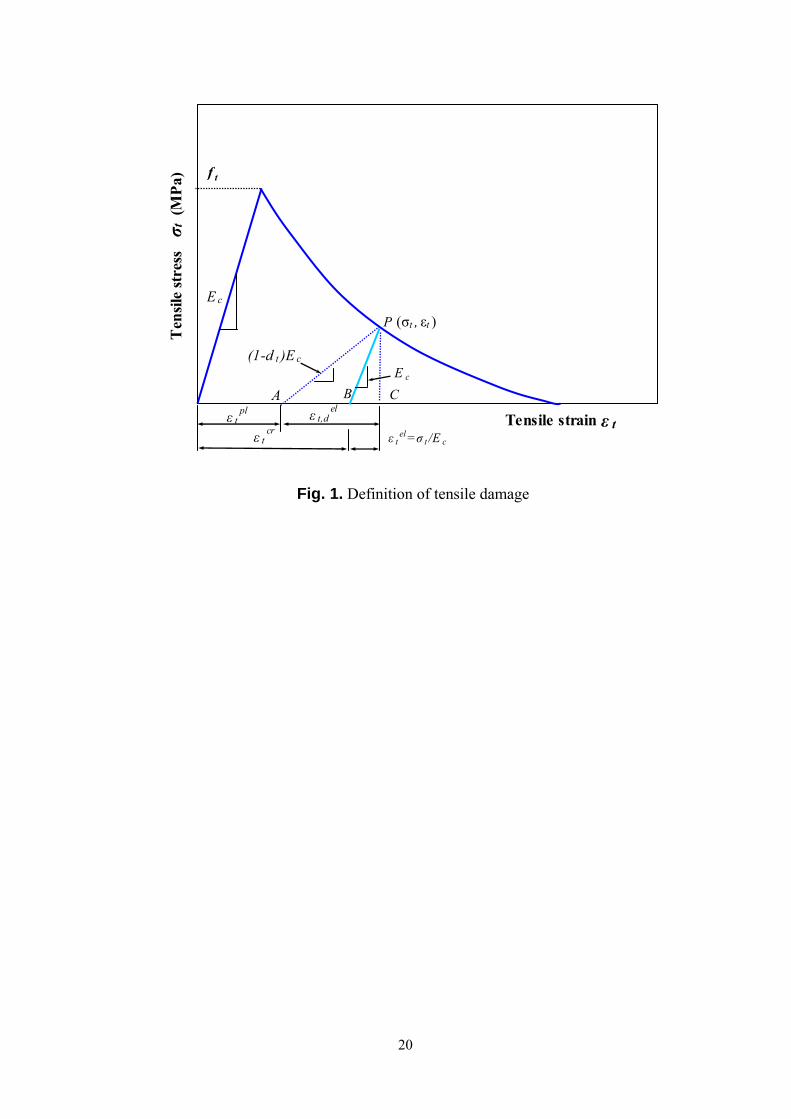
cf and da have units of MPa and mm respectively, FG has a unit of N/mm (Bazant and Becq-Giraudon 2002). The stress-displacement curve defined by Eqs (3)-(6) can be transformed into a stress-strain curve according to the crack band model as depcited by Eq. (1). In ABAQUS, the crack band width hc is defined as the characteristic crack length of an element (ABAQUS 6.5 2004). In the present study, the recommendation for estimating the crack band width made by Rots (1988) is followed. For instance, the characteristic crack length of a plane stress four-node square element with four integration points is taken to be e2 , where e is the length of the square element. In the present study, it is assumed that the Poisson’s ratio ν = 0.2 and the dilation angle ψ = 35o. Numerical results presented in Chen (2010) showed that both parameters have little effect on the numerical results if failure is not controled by the compressive crushing of concrete. Definition of Damage Evolution In the proposed FE model, a user-defined damage curve is employed to account for the progressive degradation of concrete as the cracks widen. The tensile stress-strain curve defined by Eq. (3) is illustrated in Figure 1. If the concrete is undamaged after entering the softening range ( ctt Ef>ε ), the unloading path of the stress-strain curve has a slope equal to , and the corresponding elastic strain cE ct
elt Eσε = , where tσ is the tensile
stress in the concrete. If the concrete is damaged due to cracking, the slope of the unloading path is reduced to ct Ed )1( − , and the corresponding elastic strain
[ ], (1 )elt d t t cd Eε σ= − , where is the tensile damage factor of cracked concrete. td
In ABAQUS, the cracking strain of cracked concrete is defined as
eltt
crt εεε −= (7)
For damaged concrete, the equivalent plastic strain is defined as el
dttpl
t ,εεε −= (8) Substituting Eq. (7) into Eq. (8) yields
c
t
t
tcrt
tc
tcrt
eldt
elt
crt
plt Ed
ddE
σε
σεεεεε
−−=−
−−=−+=
1)1
11(, (9)
5
One method to define tensile damage is to assume that for all post-cracking values of
0=pltε
tσ , which means that the unloading path of the stress-strain curve passes through the origin of the coordinate system as depicted by Figure 1. According to Bazant and Planas (1998), the crack opening displacement wt can be taken as the cracking strain accumulated over the width hcr
tε c of the crack band [see Eq. (1)]. If it is further assumed that the cracking strain is constant over the width of the crack band so that the following expression can be obtained:
crtε
c
ct
t
tt
plt E
hd
dww
σ−
−=1
(10)
in which is the equivalent ‘plastic’ crack width corresponding to the equivalent plastic strain within the framework of the crack band model. As a result, the above assumption of is equivalent to . By assumping , the following expression can be deduced for :
pltw
pltε
0=pltε 0=pl
tw 0=pltw
td
( )t
tt c t c
wdw h Eσ
=⎡ ⎤+⎣ ⎦
(11)
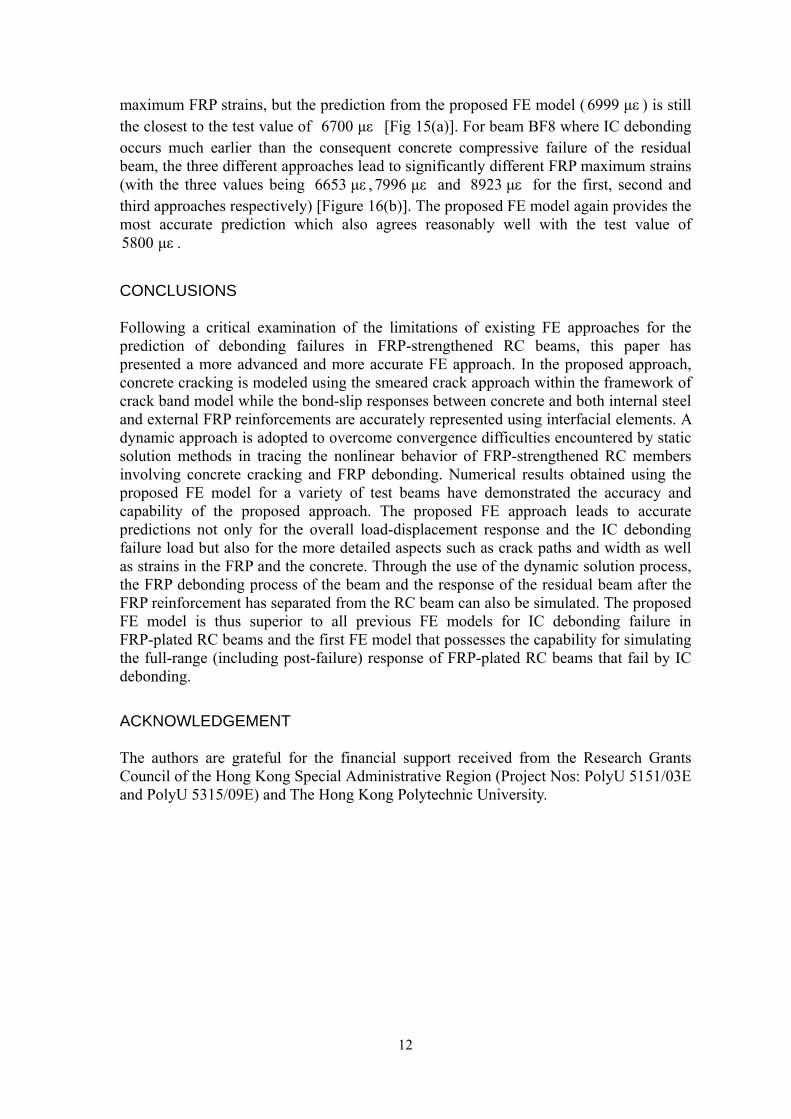
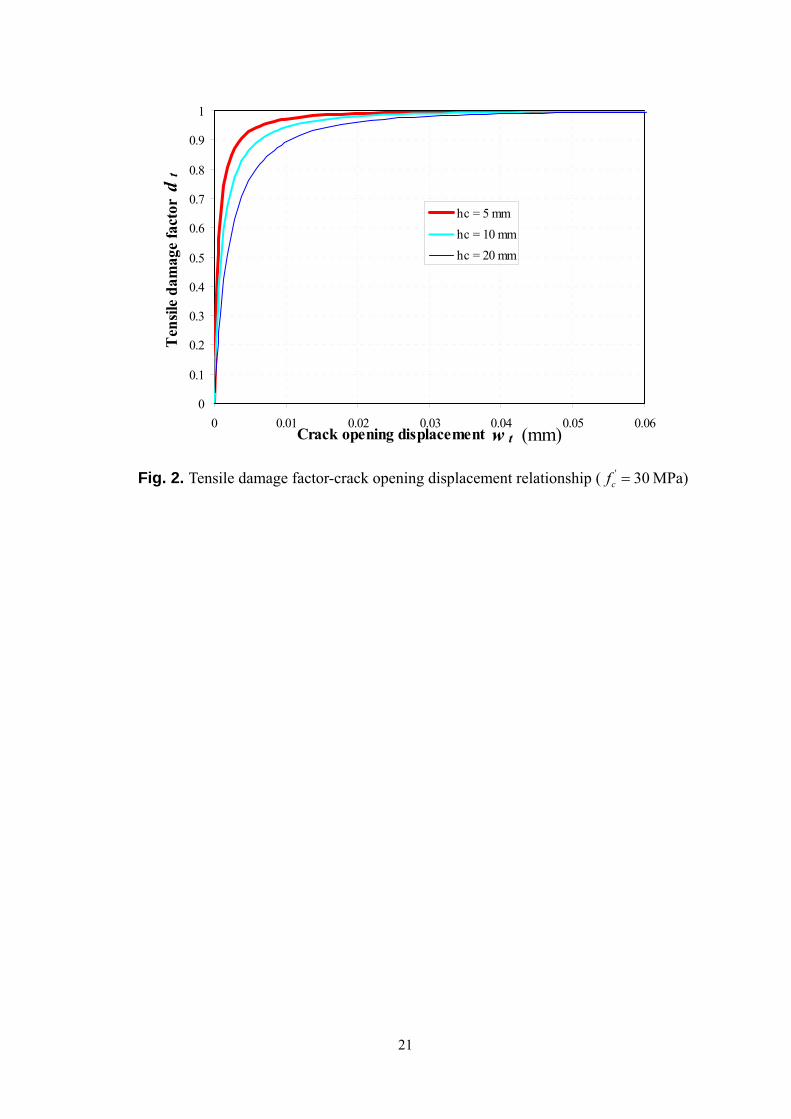
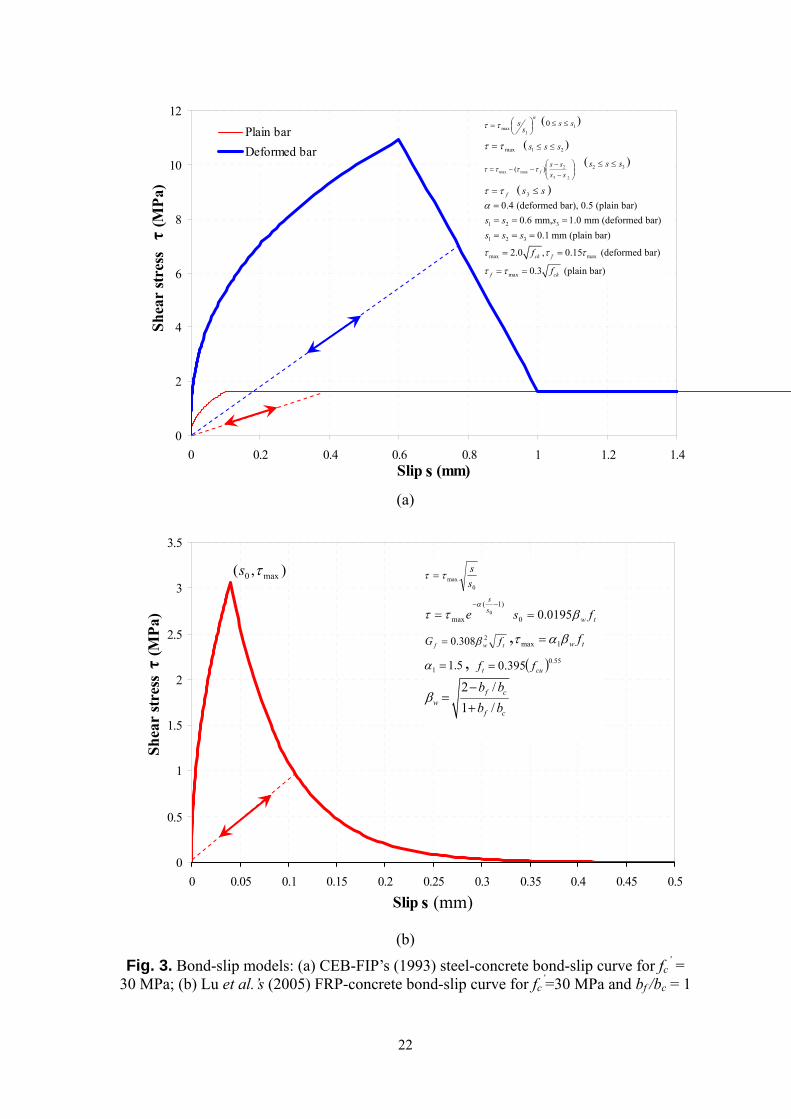
It should be noted that, according to the above definition of tensile damage of concrete, the damage evolution law is directly determined by the post-cracking tension-softening law, such as that depicted by Eq. (3). An example of the dt-wt curve determined by the above method is shown in Figure 2. This tensile damage model also leads to a reasonable model for the shear resistance degradation of cracked concrete; as a result, the cracking behavior (e.g. crack paths and widths ) of FRP-plated RC beams can be accuratly predicted as demostrated next. Modeling of Steel, FRP and Bond Behavior In the proposed FE model, both the steel and the FRP reinforcements are modeled using truss elements. The steel reinforcement is assumed to be elastic-perfectly plastic and the FRP reinforcement is assumed to be linear-elastic-brittle. The bond behavior between internal steel (both longitudinal bars and stirrups) and concrete is modeled using the interfacial element COH2D4 in ABAQUS. In the direction parallel to the steel-concrete interface, the properties of the interfacial elements are defined using the CEB-FIP (1993) bond-slip model. An example curve of the CEB-FIP (1993) steel-concrete bond-slip model is shown in Figure 3(a) for fc
’ = 30 MPa. It should be noted that the CEB-FIP (1993) model includes specification of the unloading branch for cyclic loading which is not used in the present FE model; instead, the unloading branch is defined to go through the origin [Fig. 3(a)] following the defined damage evolution law. This different treatment of unloading behavior does not have a significant effect on the numerical results until the peak load of the beam is reached as the steel-concrete interface is unlikely to experience any unloading before the peak load is attained (Chen 2010). In the direction normal to the interface, it is assumed that there is no relative displacement between the steel reinforcement and the concrete. The bond behavior between FRP and concrete is also represented using the same interfacial element in ABAQUS (ABAQUS 6.5 2004). Parallel to the interface, the
6
properties of the interfacial elements are defined using the simplified bond-slip model for FRP externally bonded to concrete developed by Lu et al. (2005). Based on the study of Chen et al. (2007), the bond-slip curve is assumed to unload linearly through the origin [Figure 3(b)] when the interface is in the softening range. Normal to the interface, the interface elements are assumed to behave linear-elastically with their stiffness being the stiffness of the adhesive layer. The FRP-concrete interfacial behavior so defined means that interaction between the two directions (i.e. normal and shear directions) is assumed to be insignificant and is ignored in the FE model. That is, it is assumed that IC debonding depends only on the bond-slip behavior parallel to the FRP-to-concrete bonded interface. This simple assumption is based on the following considerations: 1) both closed-form analytical solutions (e.g. Smith and Teng 2001) and careful linear elastic finite analyses (e.g. Teng et al. 2002a) have shown that the interfacial normal stress of the FRP-to-concrete bondline away from the plate ends is very small compared to the interfacial shear stress, implying that the effect of normal stress on IC debonding is insignificant; 2) existing laboratory tests showed that IC dedonding generally propagates along the FRP-to-concrete bondline (e.g. Brena et al. 2003; Matthys 2000). Numerical results not presented here showed that the normal stresses generally remain at relatively low values compared to either the concrete tensile strength or the maximum interfacial shear stress
tf
maxτ [Figure 3(b)] during the loading/debonding process, further justifying this simple assumption. Solution Strategy Convergence difficulties are often encountered when standard static solution methods [e.g. the displacement control strategy and the arc-length method; refer to Crisfield (1991, 1997) for more details] are employed to solve nonlinear deformation problems of FRP-plated RC beams involving concrete cracking and FRP debonding. In the present study, a dynamic approach (Chen et al. 2009) is employed for the numerical solution of the FE model. In this dynamic approach, an essentially static nonlinear deformation problem is treated as a dynamic problem and solved using the Hilber-Hughes-Taylor α method (Hilber 1976) available in ABAQUS 6.5 (2004), which is an implicit time integration method. A salient feature of the dynamic solution method is that the static solution can be obtained with satisfactory accuracy, while convergence difficulties associated concrete cracking and FRP debonding are overcome. In addition, the local dynamic processes associated with concrete cracking and FRP debonding can be captured. A detailed description of the dynamic solution strategy, including its validity and advantages, is given in Chen (2010).
VERIFICATION OF THE PROPOSED FE MODEL A number of laboratory tests on IC debonding failure of FRP-plated RC beams/slabs from various sources have been successfully simulated using the proposed FE approach. The test specimens covered a large range of the following parameters: (a) specimen dimensions including different shear span ratios; (b) material properties; and (c) strengthening configurations (e.g. different width ratios between the FRP plate and the RC beam). The FE model has also been employed to predict the crack pattern and widths of several test specimens with or without FRP strengthening, which showed that the present FE model is capable of accurate prediction of cracking behavior. Due to space limitation, only the numerical results for eight test specimens from two
7
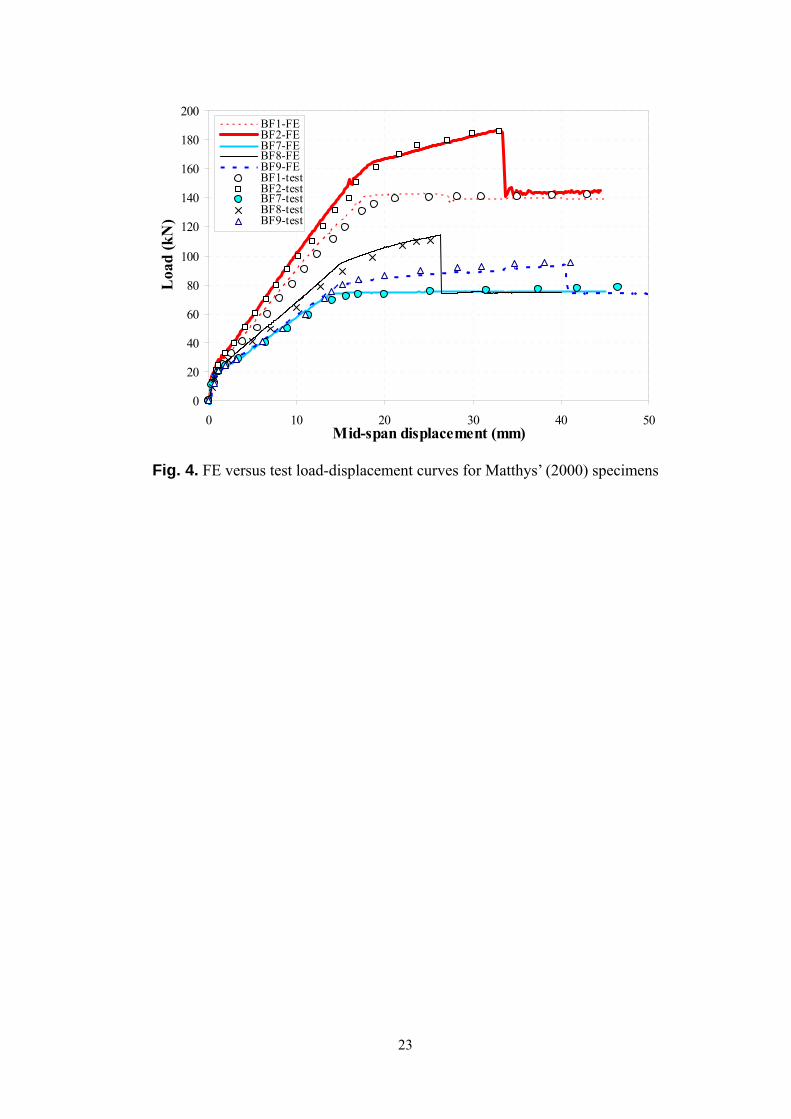
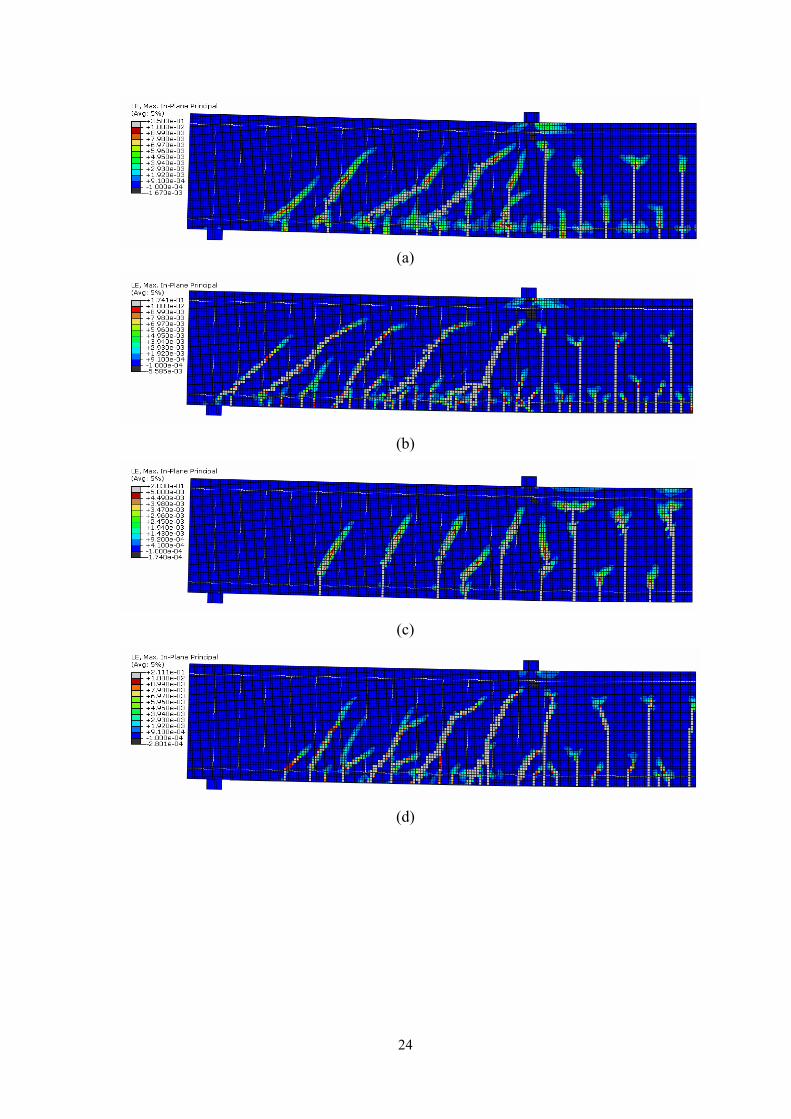
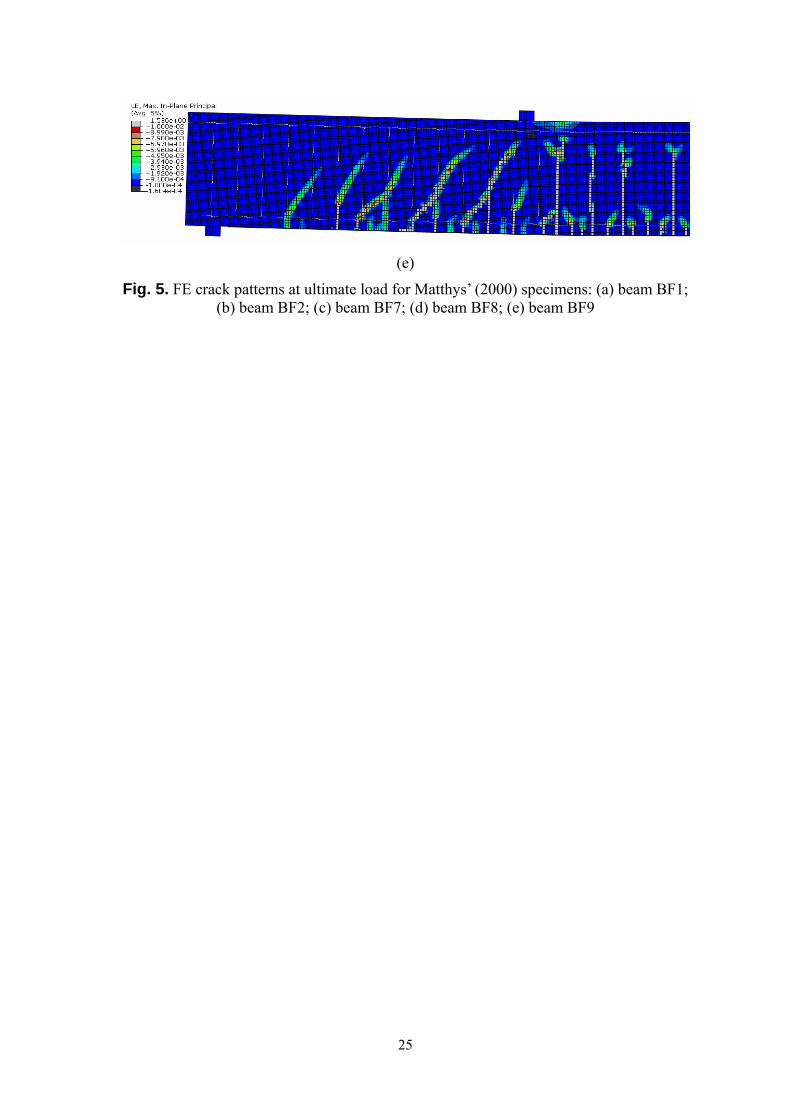
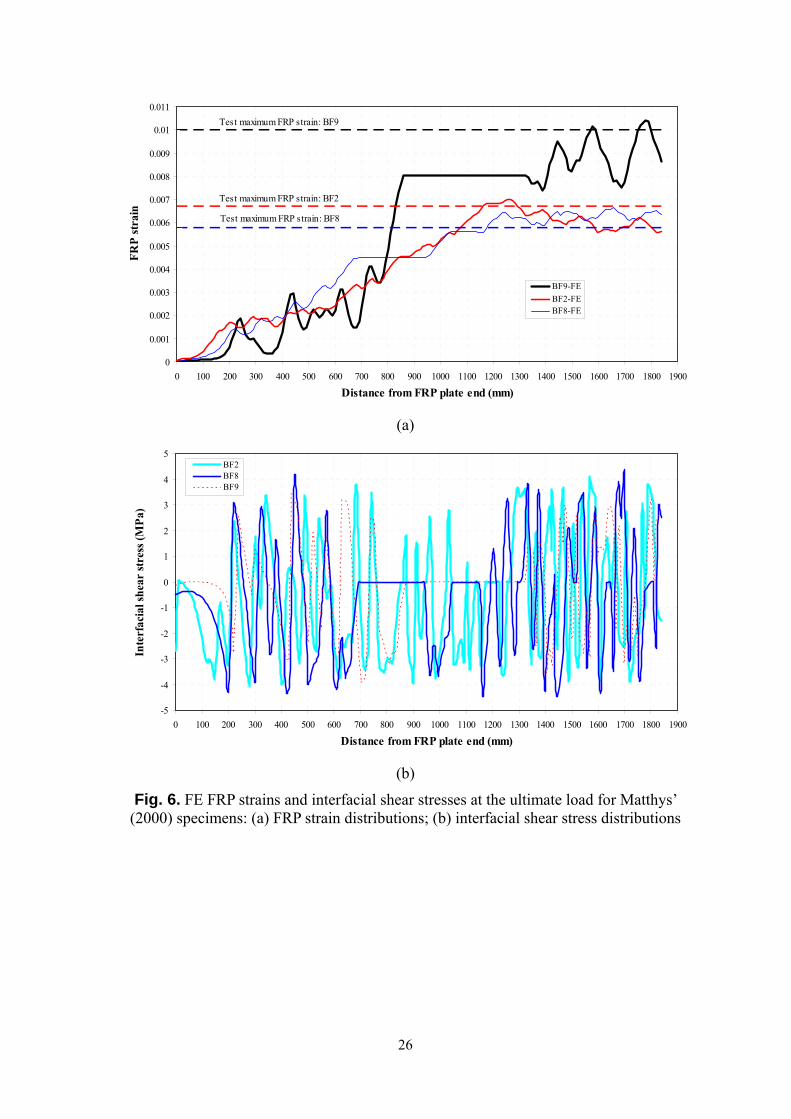
independent sources are presented to demonstrate the accuracy of proposed FE approach for IC dedonding failure. Five of the specimens are from Matthys (2000) which include two control RC beams and three FRP-plated RC beams that failed by IC debonding, while the other three specimens are from Brena et al. (2003) including one control RC beam and two FRP-plated RC beams that failed by IC debonding. These specimens were chosen for comparison because the necessary test data of these beams are clearly reported in the publications. It should be noted that all beams presented in Matthys (2000) that failed by IC debonding were simulated to ensure reliable comparison; from Brena et al.’s (2003) study, only two of the FRP-plated RC beams (i.e. C2 and D2) were simulated as the other beams tested by Brena et al. (2003) involved aspects beyond the scope of the present study. More numerical simulations of FRP-plated RC beams/slabs that failed by IC debonding are presented in Chen (2010). Specimens of Matthys (2000) Matthys (2000) tested two control beams (BF1 and BF7) and seven beams strengthened in flexure with FRP (BF2-BF6, BF8 and BF9). Beams BF4, BF5 and BF6 were pre-cracked, preloaded or anchored at the plate ends respectively; FE modeling of these beams is beyond the scope of the present study. Therefore, only the two control beams (BF1 and BF7) and the four FRP-plated beams, namely BF2, BF3, BF8 and BF7, were simulated using the FE model to verify the accuracy of the proposed FE model in predicting IC dedonding failure. The numerical results of BF3 are not presented herein because both the test behavior and the predicted behavior are nearly identical to that of BF2. Details of beams BF1, BF2, BF7, BF8 and BF9 are given in Table 2. For each of the five beams, only half of the specimen was modeled by taking advantage of symmetry. Results of a mesh convergence study not presented here showed that the numerical results (e.g. the load-displacement curve, crack pattern and the FRP debonding strain) changed very slightly when the maximum concrete element size was less than 20 mm. As a result, a maximum element size of 10 mm was used for the concrete in modeling the five beams tested by Matthys (2000). Matching element sizes were chosen to represent the FRP and the steel bars. Figure 4 shows that the test load-displacement curves are accurately predicted by the proposed FE model. The predicted ultimate loads of beams BF1, BF2, BF7, BF8 and BF9 are 142.6 kN, 186.7 kN, 75.51 kN, 114.6 kN and 94.06 kN respectively, which are close to the corresponding test values of 144.2 kN, 185.0 kN, 80.7 kN, 111.3 kN and 95.08 kN (Matthys 2000); the percentage differences are only 1.1%, 0.91%, 6.4%, 2.9% and 1.8% respectively. The predicted displacements at the ultimate load are also very close to the test values. Figures 5(a)-5(e) show the predicted crack patterns at the ultimate load for beams BF1, BF2, BF7, BF8 and BF9 respectively, which match closely the test crack patterns given in Matthys (2000). Figure 6(a) shows the strain distributions in FRP at the ultimate load for beams BF2, BF8 and BF9, while the corresponding interfacial shear stress distributions are shown in Figure 6(b). The test maximum values of the FRP strain are also shown in Fig. 6(a) as dashed lines for comparison. The predicted maximum FRP strain values of beams BF2, BF8, BF9 are , and 10392 respectively, which are close to the test maximum strain values of , 5800 and 10000 . The predicted maximum FRP strain value is always slightly larger than the corresponding test value, which is
7008 με 6653 με με6700 με με με
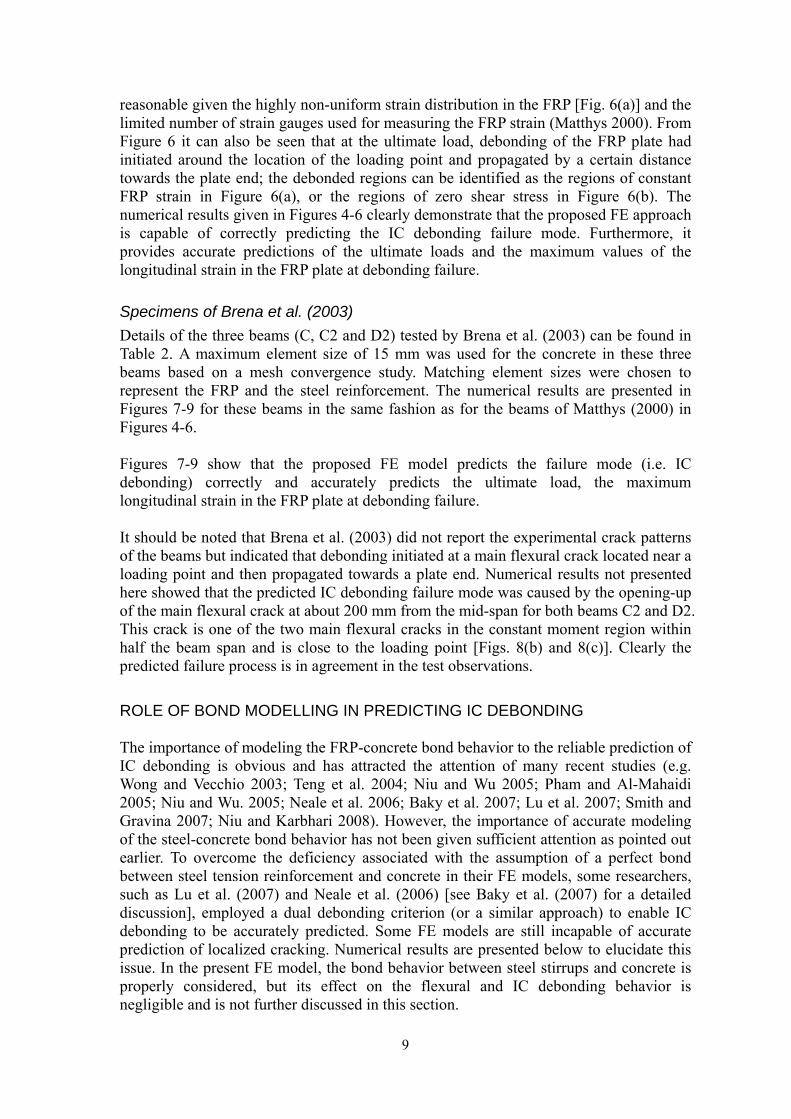
8
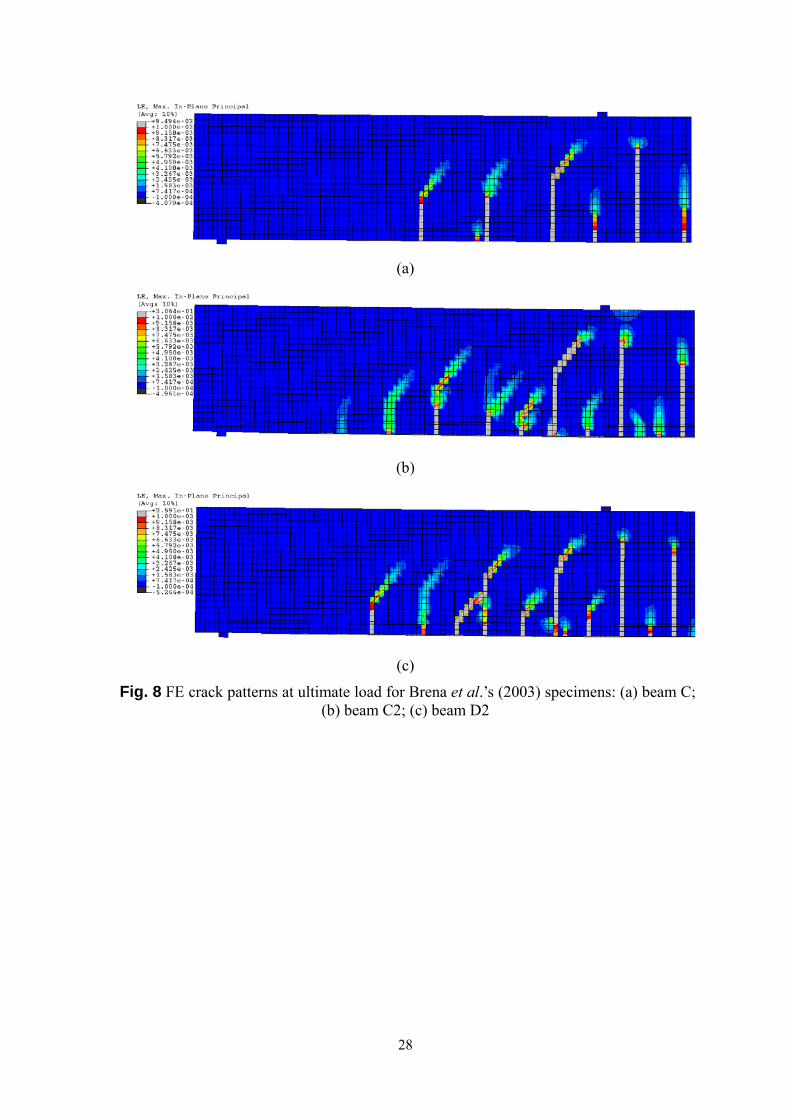
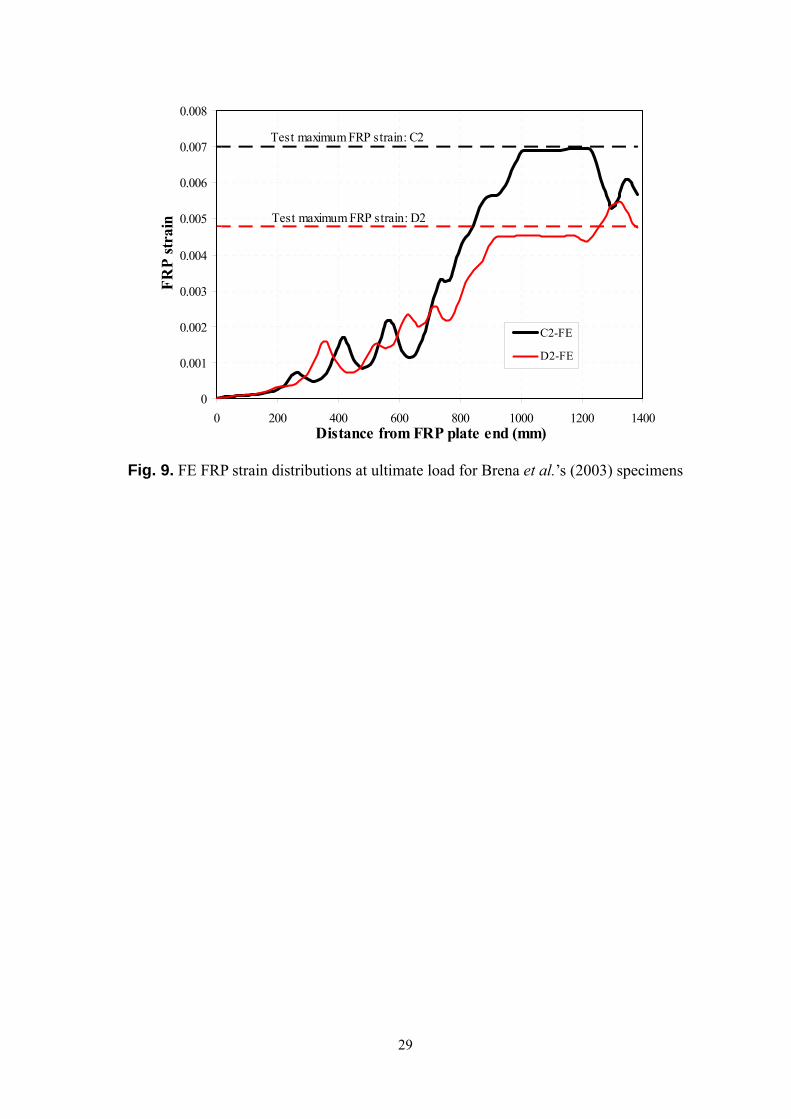
reasonable given the highly non-uniform strain distribution in the FRP [Fig. 6(a)] and the limited number of strain gauges used for measuring the FRP strain (Matthys 2000). From Figure 6 it can also be seen that at the ultimate load, debonding of the FRP plate had initiated around the location of the loading point and propagated by a certain distance towards the plate end; the debonded regions can be identified as the regions of constant FRP strain in Figure 6(a), or the regions of zero shear stress in Figure 6(b). The numerical results given in Figures 4-6 clearly demonstrate that the proposed FE approach is capable of correctly predicting the IC debonding failure mode. Furthermore, it provides accurate predictions of the ultimate loads and the maximum values of the longitudinal strain in the FRP plate at debonding failure. Specimens of Brena et al. (2003) Details of the three beams (C, C2 and D2) tested by Brena et al. (2003) can be found in Table 2. A maximum element size of 15 mm was used for the concrete in these three beams based on a mesh convergence study. Matching element sizes were chosen to represent the FRP and the steel reinforcement. The numerical results are presented in Figures 7-9 for these beams in the same fashion as for the beams of Matthys (2000) in Figures 4-6. Figures 7-9 show that the proposed FE model predicts the failure mode (i.e. IC debonding) correctly and accurately predicts the ultimate load, the maximum longitudinal strain in the FRP plate at debonding failure. It should be noted that Brena et al. (2003) did not report the experimental crack patterns of the beams but indicated that debonding initiated at a main flexural crack located near a loading point and then propagated towards a plate end. Numerical results not presented here showed that the predicted IC debonding failure mode was caused by the opening-up of the main flexural crack at about 200 mm from the mid-span for both beams C2 and D2. This crack is one of the two main flexural cracks in the constant moment region within half the beam span and is close to the loading point [Figs. 8(b) and 8(c)]. Clearly the predicted failure process is in agreement in the test observations.
ROLE OF BOND MODELLING IN PREDICTING IC DEBONDING The importance of modeling the FRP-concrete bond behavior to the reliable prediction of IC debonding is obvious and has attracted the attention of many recent studies (e.g. Wong and Vecchio 2003; Teng et al. 2004; Niu and Wu 2005; Pham and Al-Mahaidi 2005; Niu and Wu. 2005; Neale et al. 2006; Baky et al. 2007; Lu et al. 2007; Smith and Gravina 2007; Niu and Karbhari 2008). However, the importance of accurate modeling of the steel-concrete bond behavior has not been given sufficient attention as pointed out earlier. To overcome the deficiency associated with the assumption of a perfect bond between steel tension reinforcement and concrete in their FE models, some researchers, such as Lu et al. (2007) and Neale et al. (2006) [see Baky et al. (2007) for a detailed discussion], employed a dual debonding criterion (or a similar approach) to enable IC debonding to be accurately predicted. Some FE models are still incapable of accurate prediction of localized cracking. Numerical results are presented below to elucidate this issue. In the present FE model, the bond behavior between steel stirrups and concrete is properly considered, but its effect on the flexural and IC debonding behavior is negligible and is not further discussed in this section.
9
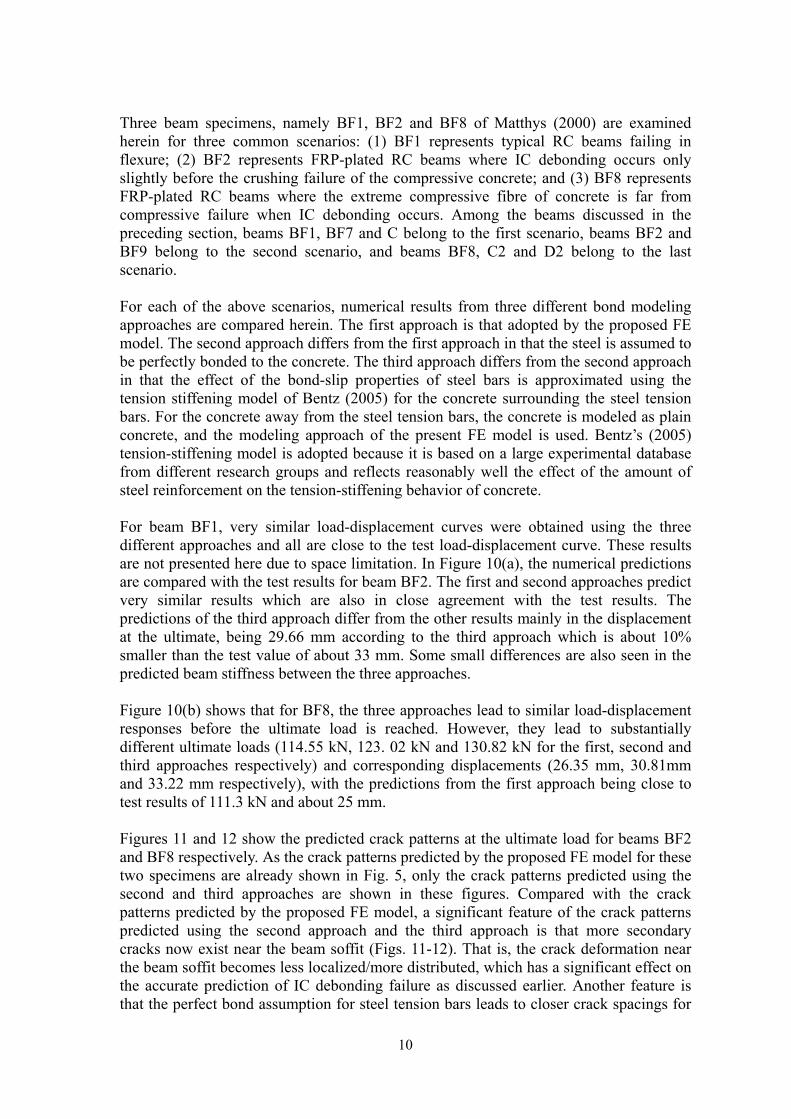
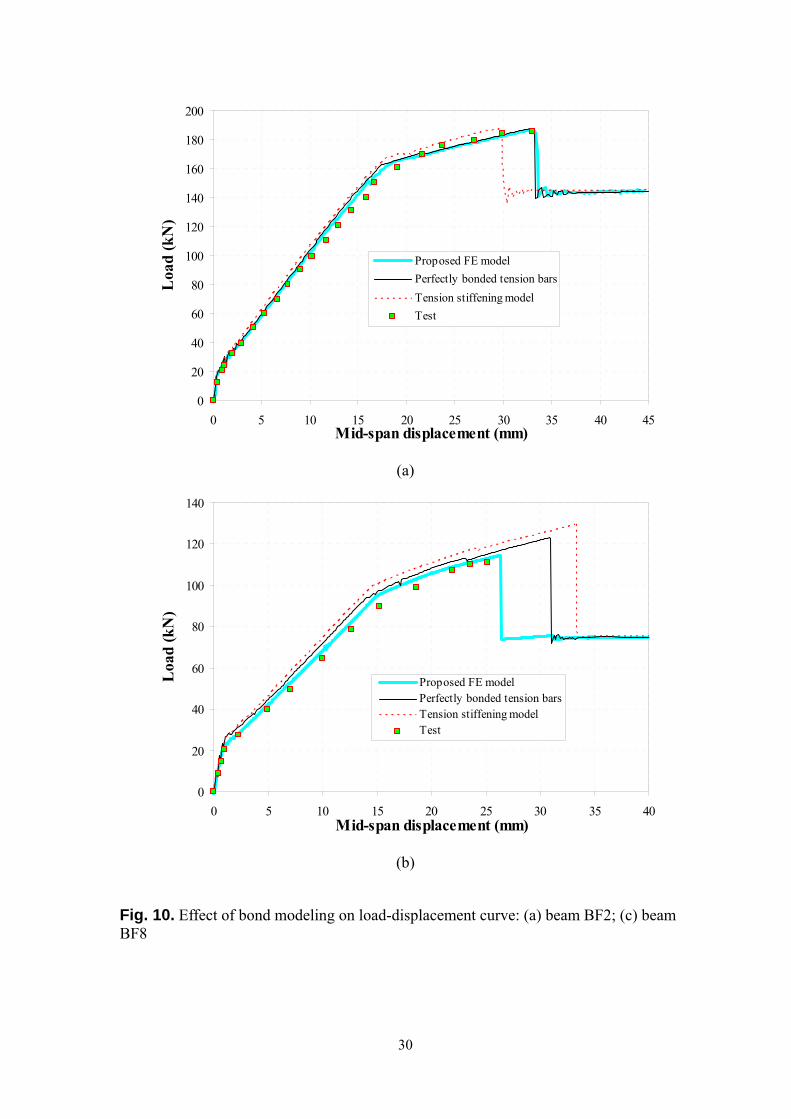
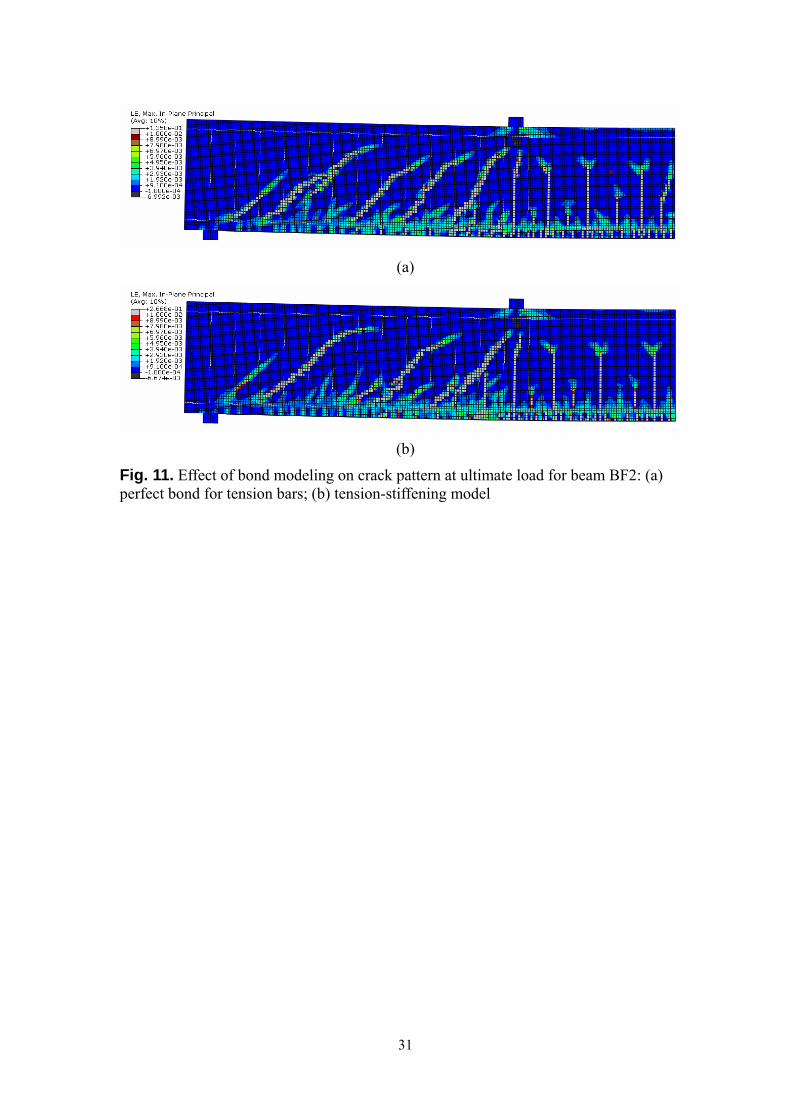
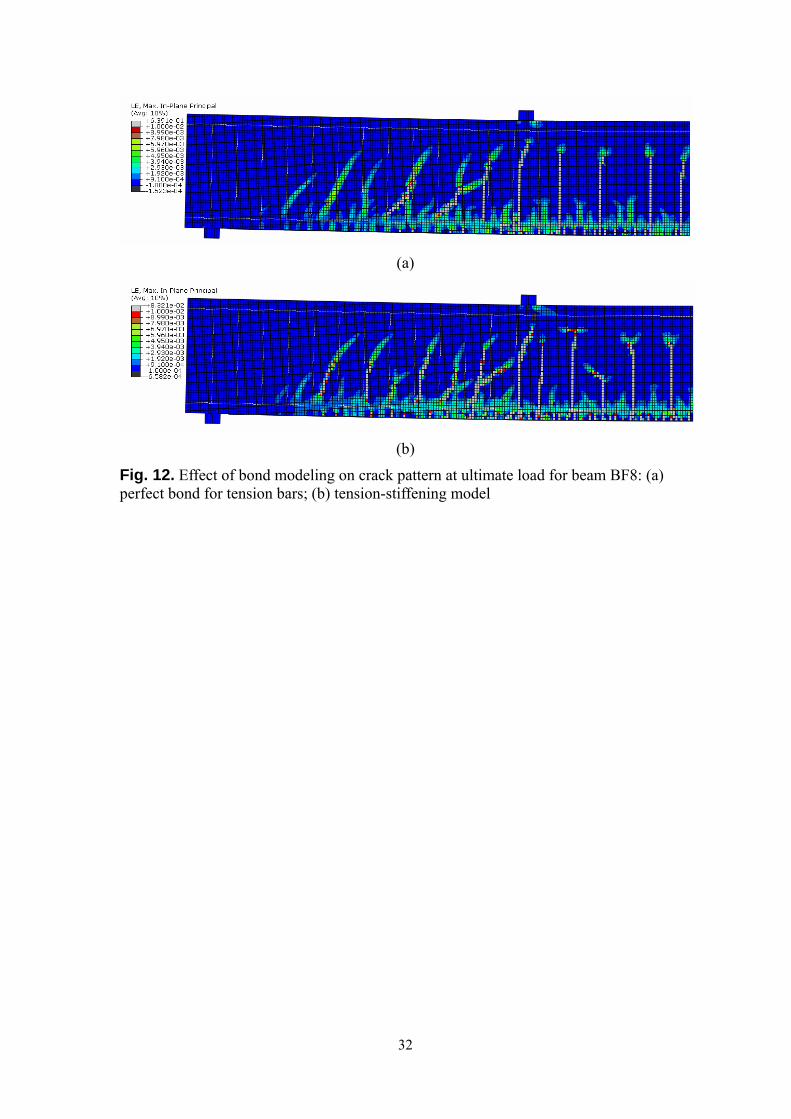
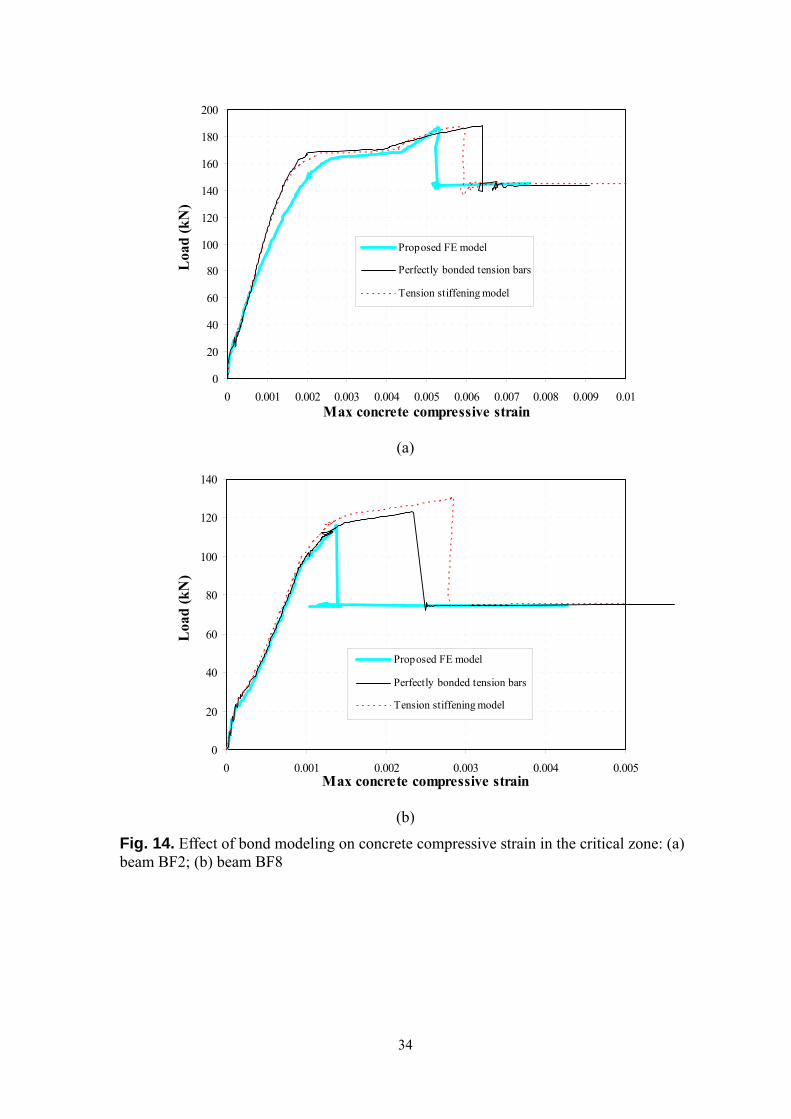
Three beam specimens, namely BF1, BF2 and BF8 of Matthys (2000) are examined herein for three common scenarios: (1) BF1 represents typical RC beams failing in flexure; (2) BF2 represents FRP-plated RC beams where IC debonding occurs only slightly before the crushing failure of the compressive concrete; and (3) BF8 represents FRP-plated RC beams where the extreme compressive fibre of concrete is far from compressive failure when IC debonding occurs. Among the beams discussed in the preceding section, beams BF1, BF7 and C belong to the first scenario, beams BF2 and BF9 belong to the second scenario, and beams BF8, C2 and D2 belong to the last scenario. For each of the above scenarios, numerical results from three different bond modeling approaches are compared herein. The first approach is that adopted by the proposed FE model. The second approach differs from the first approach in that the steel is assumed to be perfectly bonded to the concrete. The third approach differs from the second approach in that the effect of the bond-slip properties of steel bars is approximated using the tension stiffening model of Bentz (2005) for the concrete surrounding the steel tension bars. For the concrete away from the steel tension bars, the concrete is modeled as plain concrete, and the modeling approach of the present FE model is used. Bentz’s (2005) tension-stiffening model is adopted because it is based on a large experimental database from different research groups and reflects reasonably well the effect of the amount of steel reinforcement on the tension-stiffening behavior of concrete. For beam BF1, very similar load-displacement curves were obtained using the three different approaches and all are close to the test load-displacement curve. These results are not presented here due to space limitation. In Figure 10(a), the numerical predictions are compared with the test results for beam BF2. The first and second approaches predict very similar results which are also in close agreement with the test results. The predictions of the third approach differ from the other results mainly in the displacement at the ultimate, being 29.66 mm according to the third approach which is about 10% smaller than the test value of about 33 mm. Some small differences are also seen in the predicted beam stiffness between the three approaches. Figure 10(b) shows that for BF8, the three approaches lead to similar load-displacement responses before the ultimate load is reached. However, they lead to substantially different ultimate loads (114.55 kN, 123. 02 kN and 130.82 kN for the first, second and third approaches respectively) and corresponding displacements (26.35 mm, 30.81mm and 33.22 mm respectively), with the predictions from the first approach being close to test results of 111.3 kN and about 25 mm. Figures 11 and 12 show the predicted crack patterns at the ultimate load for beams BF2 and BF8 respectively. As the crack patterns predicted by the proposed FE model for these two specimens are already shown in Fig. 5, only the crack patterns predicted using the second and third approaches are shown in these figures. Compared with the crack patterns predicted by the proposed FE model, a significant feature of the crack patterns predicted using the second approach and the third approach is that more secondary cracks now exist near the beam soffit (Figs. 11-12). That is, the crack deformation near the beam soffit becomes less localized/more distributed, which has a significant effect on the accurate prediction of IC debonding failure as discussed earlier. Another feature is that the perfect bond assumption for steel tension bars leads to closer crack spacings for
10
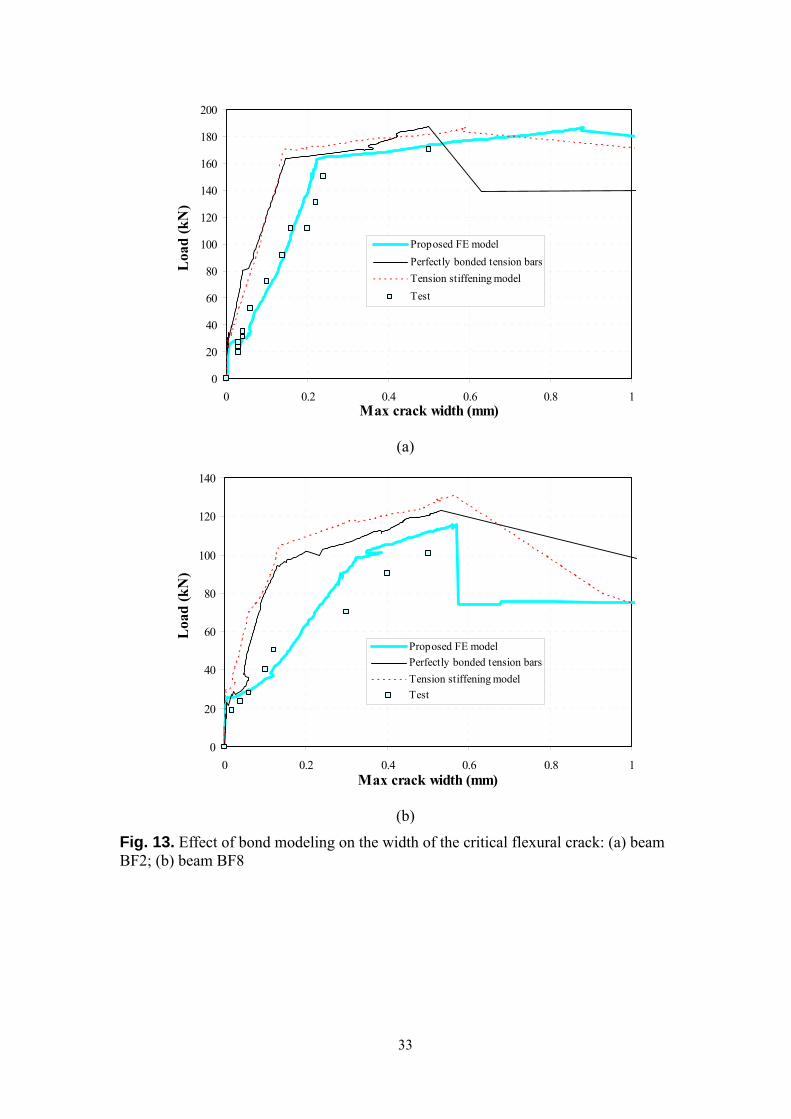
the main flexural cracks [Fig. 11(a) versus Fig 5(b); Fig. 12(a) versus Fig 5(d)], which also has a significant effect on the prediction of IC debonding according to the studies of Teng et al. (2006) and Chen et al. (2007). Numerical results not presented here showed that the perfect bond assumption for steel tension bars have a similar effect on the predicted crack pattern of beam BF1. Figures 13(a) and 13(b) show that the crack width development curves of the critical flexural crack from the proposed FE model are very close to the test curves for both beams BF2 and BF8 (Matthys 2000). The crack width curves obtained using the second and third approaches differ substantially from the test curves; both approaches predict much slower crack width development than the prediction of the proposed FE model. These differences exist because the perfect bond assumption and the tension-stiffening model tend to spread crack formation over a finite region (in the form of secondary cracks) and thus do not lead to accurate prediction of localized crack formation (Figures 11-12). Numerical results not presented here showed that the proposed FE model is capable of accurate prediction of crack width development in beam BF1. The bond assumptions of the second and third approaches mean that they cannot provide accurate predictions of IC debonding failure which is directly driven by the widening of the critical flexural crack; they always over-estimate both the ultimate loads and the corresponding displacements as seen in Fig. 10(b), except for cases where the IC debonding failure load is only slightly lower than the failure load of concrete compressive crushing or FRP tensile rupture. For the latter situation, the three different modeling approaches lead to very similar predictions for both the ultimate load and the corresponding displacement as seen in Figure 10(a). It is of interest to note that at IC debonding failure, the width of the critical flexural crack [Figures 13(a) and 13(b)] is nearly double the ultimate slip of the bond-slip curve at which the bond stress is almost reduced to zero [Figs. 3(b)]. This is, however, only a qualitative observation because the IC debonding failure is affected not only by the crack width but also by many other factors [e.g. the crack spacing and the width of adjacent flexural cracks as shown by Teng et al. (2006) and Chen et al. (2007)]. The slips between FRP and concrete at the two faces of the crack are also not necessarily the same. Figures 14(a) and 14(b) show the predicted development of the concrete compressive strain in the critical zone for beams BF2 and BF8 respectively. Figure 14(a) indicates that for beam BF2, all three bond modeling approaches predict a large maximum concrete compressive strain (e.g. ) at the ultimate load of IC debonding failure, after which this strain increases rapidly, leading to compressive crushing of concrete .
5000 με>
For beam BF8, IC debonding is followed by concrete compression failure of the residual RC beam [Figure 14(b)]. At IC debonding failure, the proposed FE model predicts a maximum concrete compressive strain of about1400 , which is much less than the limit for concrete compression failure. For beam BF1, numerical results not presented here showed that the failure process involves yielding of tension bars followed by concrete compressive failure, which is a typical of conventional RC beams.
με
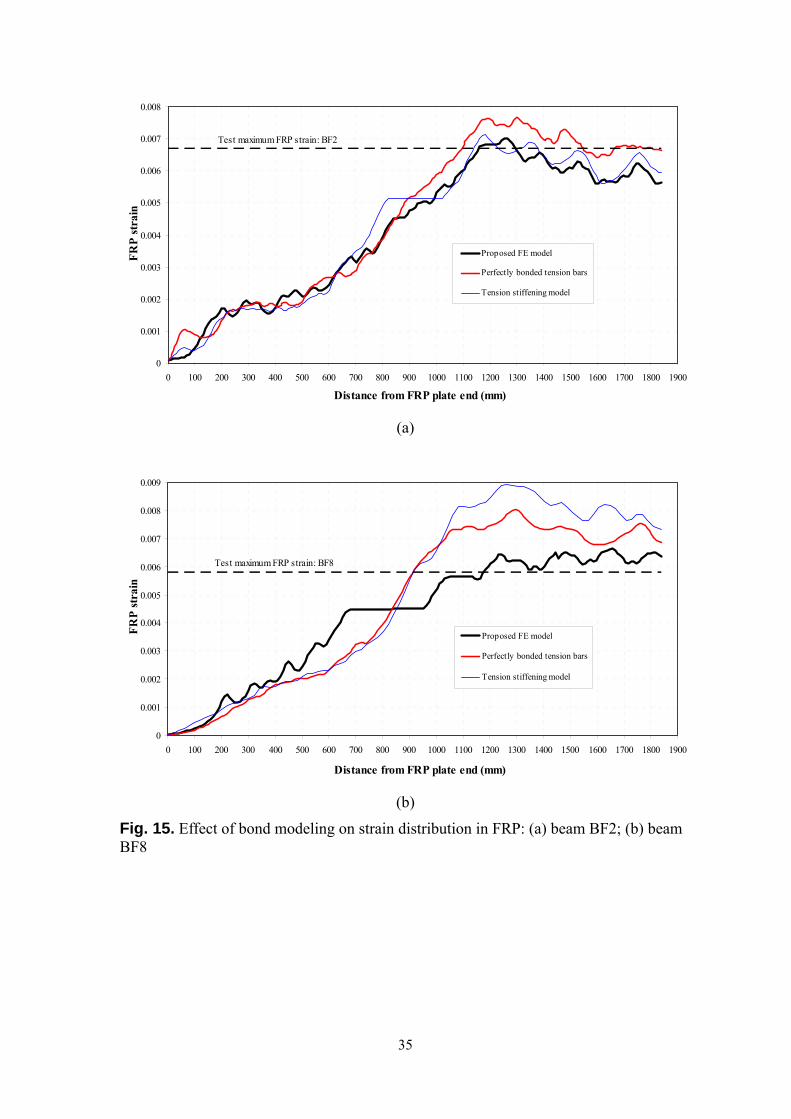
Figures 15(a) and 15(b) show the predicted FRP strain distributions at the ultimate load for beams BF2 and BF8 respectively. For beam BF2 where concrete compressive failure dominates the failure process, the three bond modeling approaches lead to very similar
11
maximum FRP strains, but the prediction from the proposed FE model ( ) is still the closest to the test value of [Fig 15(a)]. For beam BF8 where IC debonding occurs much earlier than the consequent concrete compressive failure of the residual beam, the three different approaches lead to significantly different FRP maximum strains (with the three values being , 7 and 8923 for the first, second and third approaches respectively) [Figure 16(b)]. The proposed FE model again provides the most accurate prediction which also agrees reasonably well with the test value of
.
6999 με6700 με
6653 με 996 με με
5800 με
CONCLUSIONS Following a critical examination of the limitations of existing FE approaches for the prediction of debonding failures in FRP-strengthened RC beams, this paper has presented a more advanced and more accurate FE approach. In the proposed approach, concrete cracking is modeled using the smeared crack approach within the framework of crack band model while the bond-slip responses between concrete and both internal steel and external FRP reinforcements are accurately represented using interfacial elements. A dynamic approach is adopted to overcome convergence difficulties encountered by static solution methods in tracing the nonlinear behavior of FRP-strengthened RC members involving concrete cracking and FRP debonding. Numerical results obtained using the proposed FE model for a variety of test beams have demonstrated the accuracy and capability of the proposed approach. The proposed FE approach leads to accurate predictions not only for the overall load-displacement response and the IC debonding failure load but also for the more detailed aspects such as crack paths and width as well as strains in the FRP and the concrete. Through the use of the dynamic solution process, the FRP debonding process of the beam and the response of the residual beam after the FRP reinforcement has separated from the RC beam can also be simulated. The proposed FE model is thus superior to all previous FE models for IC debonding failure in FRP-plated RC beams and the first FE model that possesses the capability for simulating the full-range (including post-failure) response of FRP-plated RC beams that fail by IC debonding.
ACKNOWLEDGEMENT The authors are grateful for the financial support received from the Research Grants Council of the Hong Kong Special Administrative Region (Project Nos: PolyU 5151/03E and PolyU 5315/09E) and The Hong Kong Polytechnic University.
12
REFERENCES
ACI 318 (2002). Building Code Requirements for Structural Concrete and Commentary, ACI Committee 318.
ACI.446.3R (1997). Finite Element Analysis of Fracture in Concrete Structures: State-of-the-Art, ACI Committee 446.
ABAQUS 6.5 (2004). ABAQUS User's Manual, ABAQUS, Inc., Rising Sun Mills, 166 Valley Street, Providence, RI 02909-2499, USA
Baky, H.A., Ebead, U.A. and Neale, K.W. (2007). “Flexural and international behaviour of FRP-strengthened reinforced concrete beams”, Journal of Composite for Construction, Vol. 11, No. 6, pp. 629-639.
Bazant, Z.P. and Planas, J. (1998). Fracture and Size Effect in Concrete and Other Quasibrittle Materials, CRC Press.
Bazant, Z.P. and Becq-Giraudon, E. (2002). “Statistical prediction of fracture parameters of concrete and implications for choice of testing standard”, Cement and Concrete Research, Vol. 32, pp. 529-556.
Barbato, M. (2009). “ Efficient finite element modelling of reinforced concrete beams retrofitted with fibre reinforced polymers”, Computers and Structures, Vol. 87, No. 3-4 , pp. 167-176.
Brena, S.F., Bramblett, R.M., Wood, S.L. and Kreger, M.E. (2003). “Increasing flexural capacity of reinforced concrete beams using carbon fiber-reinforced polymer composites”, ACI Structural Journal, Vol. 100, No. 1, pp. 36-46.
Bentz, E.C. (2005). “Explaining the riddle of tension stiffening models for shear pannel experiments”, Journal of Structural Engineering, ASCE, Vol. 131, No. 9, pp. 1422-1425.
Buyukozturk, O. Gunes, O. and Karaca, E. (2004). “Progress on understanding debonding problems in reinforced concrete and steel members strengthened using FRP composites”, Construction and Building Materials, Vol. 18, No. 1, pp. 9-19.
CEB-FIP (1993). CEB-FIP Model Code 90, Thomas Telford Ltd., London. Camata,G., Spacone, E. and Zarnic, R. (2007). “Experimental and nonlinear finite
element studies of RC beams strengthened with FRP plates”, Composite: Part B, Vol. 38, pp. 277-288.
Cervenka, V., Cervenka, J. and Jendele, L. (2003). “Bond in finite element modelling of reinforced concrete”, Proceedings of the EURO-C Conference: Computaional Modelling of Concrete Structures, Bicanic, N. De Borst, R. Mang, H. and Meschke, G. (eds), pp. 189-194.
Cervenka, J., Kishen, J.M.C. and Saouma, V.E. (1998). “Mixed mode fracture of cementitious bimaterial interfaces; Part II: Numerical simulation”, Engineering Fracture Mechanics, Vol. 60, No. 1, pp. 95-107
Chen, G.M. (2010). Shear Behaviour and Strength of RC Beams Shear-Strengthened with Externally Bonded FRP Reinforcement, PhD Thesis, Department of Civil and Structural Engineering, The Hong Kong Polytechnic University, Hong Kong. China, under review.
Chen, G.M., Chen, J.F. and Teng, J.G. (2007). “Behavior of FRP-to-concrete interface between two adjacent cracks in FRP-plated concrete members: a numerical investigation”, Asia-Pacific Conference on FRP in Structures (APFIS 2007), S.T. Smith (ed.), 12-15, Dec. Hong Kong. pp. 683-687.
Chen, G.M., Teng, J.G. and Chen, J.F. (2009). “Finite element simulation of IC debonding in FRP-plated RC beams: a dynamic approach”, 9th International
Symposium on Fiber Reinforced Polymer Reinforcement for Concrete Structures (FRPRCS-9), Sydney, Australia, July 13-15.
Chen, J.F., Yuan, H. and Teng, J.G. (2007). “Debonding failure along a softening FRP-to-concrete interface between two adjacent cracks in concrete members”, Engineering Structures, Vol. 29, No. 2, pp. 259-270.
Chen, W.F. (1982). Plasticity in Reinforced Concrete, McGraw-Hill, New York. Coronado, C.A. and Lopez, M.M. (2006). “Sensitivity analysis of reinforced concrete
beams strengthened with FRP laminates”, Cement & Concrete Composites, Vol. 28 pp. 102–114.
Crisfield, M.A. (1991). Non-linear Finite Element Analysis of Solids and Structures, Vol. 1, Essentials, John Wiley & Sons Ltd, Chichester, England, UK.
Crisfield, M.A. (1997). Non-linear Finite Element Analysis of Solids and Structures, Volume 2: Advanced Topics, John Wiley& Sons, Chichester, England, UK.
De Borst, R., Remmers, J.J.C., Needleman, A. and Abellan, M.A. (2004). “Discrete vs smeared crack models for concrete fracture: bridging the gap”, International Journal for Numerical and Analytical Methods in Geomechanics, Vol. 28, No. 7-8, pp. 583-607.
Hilber, H.M. (1976). Analysis and Design of Numerical Integration Methods in Structural Dynamics, Report No. EERC 76-79, College of Engineering, University of California, Berkeley, California.
Hollaway, L.C. and Teng, J.G. (2008). Strengthening and Rehabilitation of Civil Infrastructures Using Fibre-reinforced Polymer (FRP) Composites, Woodhead Publishing Limited, Cambridge, UK.
Hordijk, D.A. (1991). Local Approach to Fatigue of Concrete, PhD thesis, Delft University of Technology.
Jendele, L. and Cervenka, J. (2006). “Finite element modelling of reinforcement with bond”, Computers and Structures, Vol. 84, No. 28, pp. 1780-1791.
Kishi, N., Zhang, G.F. and Mikami, H. (2005). “Numerical cracking and debonding analysis of RC beams reinforced with FRP sheet”, Journal of Composites for Construction, ASCE, Vol. 9, No. 6, pp. 507-514.
Kotynia, R., Baky, H.A., Neale, K.W. and Ebead, U.A. (2008). “Flexural strengthening of RC beams with externally bonded CFRP systems: test results and 3D nonlinear FE analysis”, Journal of Composite for Construction, ASCE, Vol. 12, No. 2, pp. 190-201.
Lubliner, J., Oliver, J., Oller, S., and Oñate, E. (1989). “A plastic-damage model for concrete”, International Journal of Solids and Structures, Vol. 25, No. 3, pp.299–329.
Lee, J. (1996). Theory and Implementation of Plastic-damage Model for Concrete Structures under Cyclic and dynamic, PhD Dissertation, Department of Civil and Environmental Engineering, University of Berkeley, California, USA.
Lu, X.Z., Teng, J.G., Ye, L.P. and Jiang, J.J. (2005). “Bond-slip models for FRP sheets/plates bonded to concrete”, Engineering Structures, Vol. 27, No. 6, pp. 920-937.
Lu, X.Z., Teng, J.G., Ye, L.P. and Jiang, J.J. (2007). “Intermediate crack debonding in FRP-strengthened RC beams: FE analysis and strength model”, Journal of Composite for Construction, ASCE, Vol. 11, No. 2, pp. 161-174.
Massicotte, B., Nour, A., Ben Ftima, M. and Yildiz, E. (2007). EPM3D-A User-supplied Constitutive Model for the Nonlinear Finite Element Analysis of Reinforced Concrete Structures, Ecole Polytechnique de Montreal, Montreal, Que. Report SR07-10.
Matthys, S. (2000). Structural Behaviour and Design of Concrete Members Strengthened with Externally Bonded FRP Reinforcement, PhD thesis, University of Ghent,
Belgium. Morita, S., Muguruma, H. and Tomita, K. (1967). “Fundamental study on bond between
steel and concrete”, Transaction of the Architecture Institute of Japan (in Japanese), Vol. 131, No. 1, pp. 1–8.
Neale, K.W., Ebead, U.A., Baky, H.M.A., Elsayed, W.E. and Godat, A. (2006). “Analysis of the load-deformation behaviour and debonding for FRP-strengthened concrete structures”, Advances in Structural Engineering, Vol. 9, No. 6, pp. 751-763.
Niu, H.D. and Karbhari, V. M. (2008). “FE investigation of material and preload parameters on FRP strengthening performance of RC beams, I: model development”, Journal of Reinforced Plastics and Composite, Vol. 27, No. 5, pp. 507-3522.
Niu, H.D. and Wu, Z. S. (2005). “Numerical analysis of debonding mechanisms in FRP- strengthened RC beams”, Computer-Aided Civil and Infrastructure Engineering, Vol. 22,
No. 5, pp. 354-368. Nour, A., Massicotte, B., Yildiz, E. and Koval, V. (2007). “Finite element modelling of
concrete structures reinforced with internal and external fibre-reinforced polymers”, Canadian Journal of Civil Engineering, Vol. 34, pp. 340-354.
Pham, H.B. and Al-Mahaidi, R. (2005). “Finite element modelling of RC beams retrofitted with CFRP fabrics”, 7th International Symposium on Fiber-Reinforced (FRP) Polymer Reinforcement for Concrete Structures (ACI Symposium Publication 230), Kansas City, Missouri ,November 6-10. pp.499-513.
Pham, H.B., Al-Mahaidi, R. and Saouma,V. (2006). “Modelling of CFRP-concrete bond using smeared and discrete cracks”, Composite Structures, Vol. 75, pp. 145-150.
Rots, J. G. (1988). Computational Modeling of Concrete Fracture, PhD thesis, Delft University of Technology.
Rots, J. G., and Blaauwendraad, J. (1989). “Crack models for concrete: discrete or smeared? Fixed, multi-directional or rotating?”, Heron, Vol. 34, No. 1.
Saenz, L.P. (1964). “Discussion of equation for the stress-strain curve of concrete - by Desayi, P. and Krishan, S.”, ACI Journal, Vol. 61, No. 9, pp. 1229-1235.
Smith, S.T. and Gravina, R.J. (2007). “Modeling debonding failure in FRP flexurally strengthened RC members using a local deformation model”, Journal of Composites for Construction, ASCE, Vol. 11, No. 2, pp. 184-191.
Smith, S.T. and Teng, J.G. (2001). “Interfacial stresses in plated beams”, Engineering Structures, Vol. 23, No. 7, pp. 857-871.
Teng, J.G. and Chen, J.F. (2009), “Mechanics of debonding in FRP-plated RC beams”, Proceedings of the Institution of Civil Engineers – Structures and Buildings, in press.
Teng, J.G., Zhang, J.W. and Smith, S.T. (2002a). “Interfacial stresses in reinforced concrete beams bonded with a soffit plate: a finite element study”, Construction and Building Materials, Vol. 16, No. 1, pp. 1-14.
Teng, J.G., Chen, J.F., Simth, S.T., and Lam, L. (2002b). FRP-strengthened RC Structures, John Wiley & Sons, UK.
Teng, J.G., Lu, X.Z., Ye, L.P., and Jiang, J.J. (2004). “Recent research on intermediate crack-induced debonding in FRP-strengthened RC beams”, Proceedings, 4th International Conference Advanced Composite Materials in Bridges and Structures, ACMBS IV, M. El-Badry and L. Dunaszegi, eds., Calgary, Alberta, Canada, pp. 1–12.
Teng, J.G., Yuan, H, and Chen, J.F. (2006). “FRP-to-concrete interfaces between two adjacent cracks: Theoretical model for debonding failure”, International Journal of Solids and Structures, Vol. 43, No. 18-19, pp. 5750-5778.
Vecchio, F. J., and Collins, M.P. (1986). “The modified compression field theory for reinforced concrete elements subjected to shear”, Journal of the American Concrete Institute, Vol. 83, No. 2, pp. 219-231.
Wong, R.S.Y., and Vecchio, F.J. (2003). “Towards modeling of reinforced concrete members with externally bonded fiber-reinforced polymer composites”, ACI Structural Journal, Vol. 100, No. 1, pp. 47-55.
Yang, Z.J., Chen, J.F., and Proverbs, D. (2003). “Finite element modelling of concrete cover separation failure in FRP plated RC beams”, Construction and Building Materials, Vol. 17, No. 1, pp. 3-13.
Yang, Z.J., and Chen, J.F. (2005). “Finite element modelling of multiple cohesive discrete crack propagation in reinforced concrete beams”, Engineering Fracture Mechanics, Vol. 72, No. 14, pp. 2280-2297.
Table 1. Existing Studies on the Numerical Modeling of Debonding Failure in FRP-Plated RC Members
Modeling of concrete cracking and bond behavior Numerical modeling approach Reference Post-cracking behavior of concrete
FRP-concrete bond behavior
steel-concrete bond behavior
Capability/Remarks
Finite difference method, beam model with local deformation at grid points
Smith and Gravina (2007) One-dimensional; brittle Lu et al.’s (2005) model
CEB-FIP (1993) Close predictions till the onset of debonding
FEM, beam model Barbato (2009) One-dimensional; nonlinearly reducing stresses
Perfect bond Perfect bond Unable to predict debonding failure
Wong and Vecchio (2003) B(a)-MCFT (Vecchio and Collins 1986)
Linear-elastic & elastic-plastic (e)
B(a) Mesh-sensitive
Teng et al. (2004) and Lu et al. (2007)
A(a) -Linear softening model Lu et al.’s (2005) model
Perfect bond Dual debonding criterion needed
Pham and Al-Mahaidi (2005)
A(a)-Hordijk’s model (1991) Bilinear model(f) Perfect bond Non-predictive
Coronado and Lopez (2006)
A(a) -Bilinear model Perfect bond Perfect bond NA
Neale et al. (2006), Baky et al. (2007) and Kotynia et al. (2008)
B(a)-Bilinear model Lu et al.’s (2005) model
B(a) Mesh-sensitive
Nour et al. (2007) B(a) -Massicotte et al.’s (2007) model
Perfect bond B(a) Mesh-sensitive
FEM, smeared crack approach
Niu and Karbhari (2008) A(a) -Linear softening model Bilinear model(c) CEB-FIP (1993) Non-predictive FEM, discrete crack approach Yang et al. (2003) LEFM Crudely modeled Crudely modeled Difficulties due to re-meshing FEM, discrete crack approach, Pre-defined main flexural cracks
Niu and Wu (2005) Linearly reducing stresses Bilinear model(b) Morita et al.’s (1967) model
Non-predictive
Kishi et al. (2005) Smeared cracks- A(a); discrete cracks-LEFM
Linear-elastic–brittle model(d)
CEB-FIP (1993) Non-predictive FEM, combined use of discrete & smeared crack approaches, pre-defined main cracks based on test observations Pham et al. (2006) and
Camata et al. (2007) Smeared cracks- A(a); discrete cracks-bilinear model
Cervenka et al.’s (1998) model(c)
Perfect bond Non-predictive
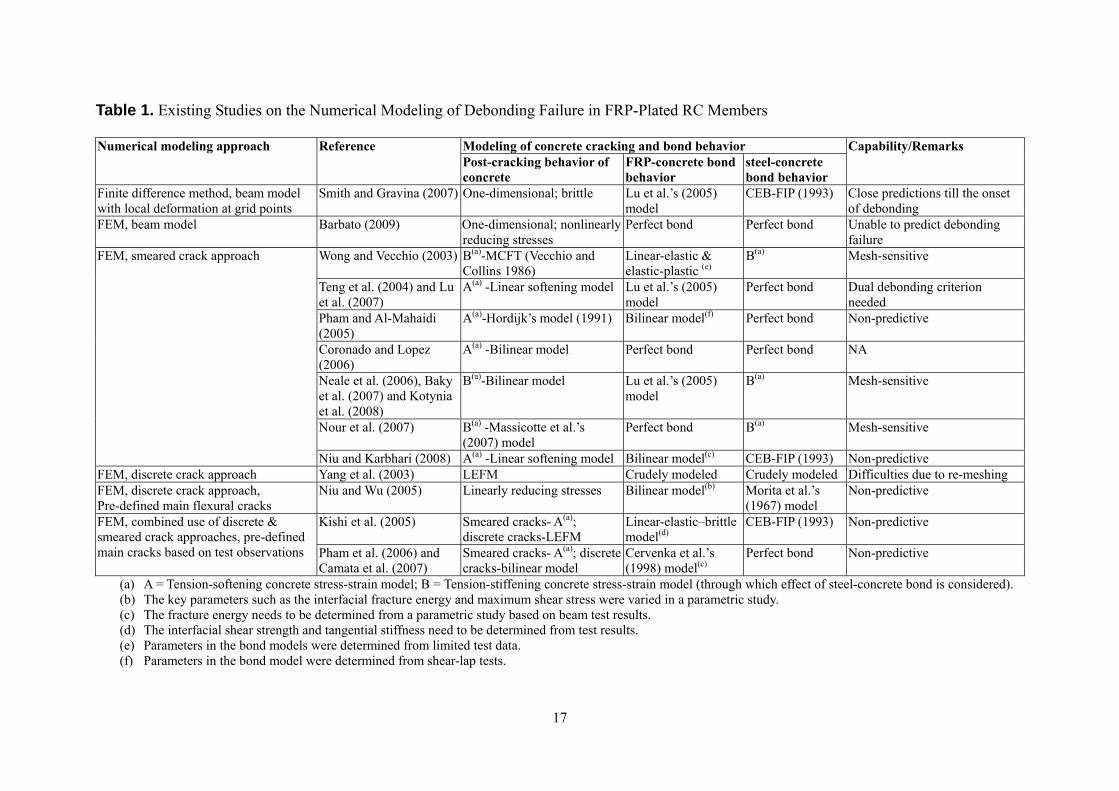
(a) A = Tension-softening concrete stress-strain model; B = Tension-stiffening concrete stress-strain model (through which effect of steel-concrete bond is considered). (b) The key parameters such as the interfacial fracture energy and maximum shear stress were varied in a parametric study. (c) The fracture energy needs to be determined from a parametric study based on beam test results. (d) The interfacial shear strength and tangential stiffness need to be determined from test results. (e) Parameters in the bond models were determined from limited test data. (f) Parameters in the bond model were determined from shear-lap tests.
17
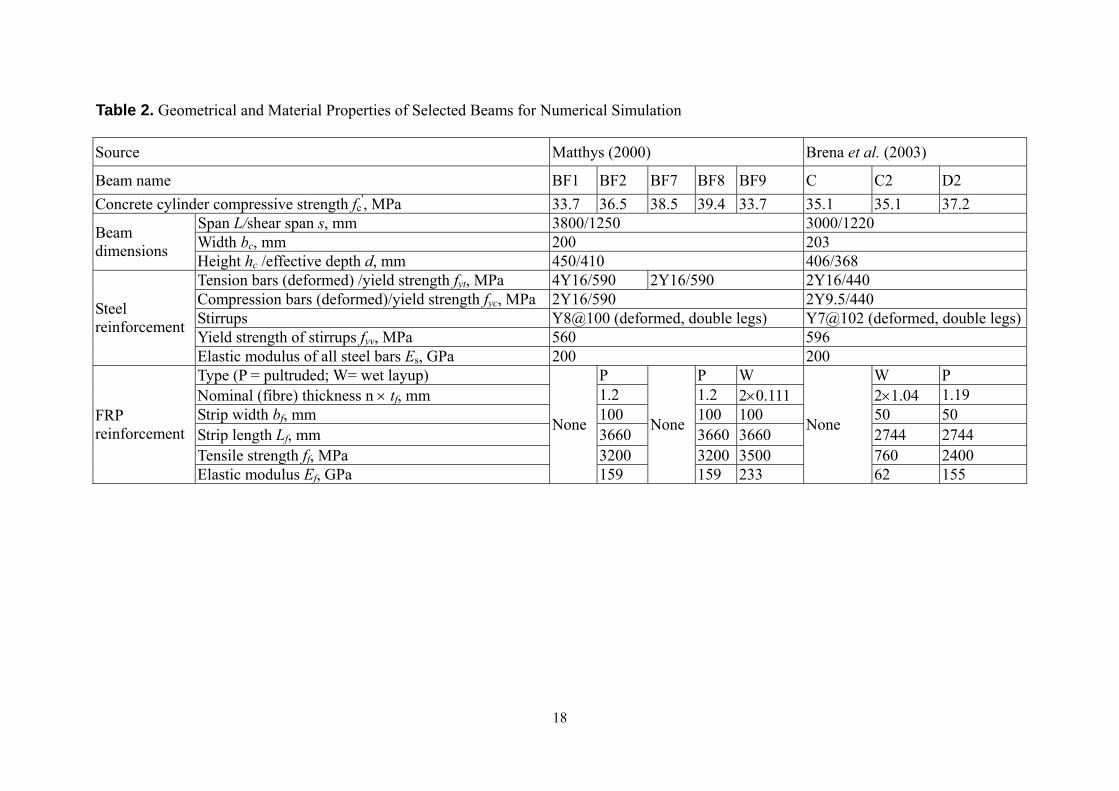
Table 2. Geometrical and Material Properties of Selected Beams for Numerical Simulation
Source Matthys (2000) Brena et al. (2003)
Beam name BF1 BF2 BF7 BF8 BF9 C C2 D2 Concrete cylinder compressive strength fc
Elastic modulus of all steel bars Es, GPa 200 200 Type (P = pultruded; W= wet layup) P P W W P Nominal (fibre) thickness n × tf, mm 1.2 1.2 2×0.111 2×1.04 1.19 Strip width bf, mm 100 100 100 50 50 Strip length Lf, mm 3660 3660 3660 2744 2744 Tensile strength ff, MPa 3200 3200 3500 760 2400
FRP reinforcement
Elastic modulus Ef, GPa
None
159
None
159 233
None
62 155
18
LIST OF FIGURES Fig. 1. Definition of tensile damageFig. 2. Tensile damage factor-crack opening displacement relationship ( MPa) Fig. 3. Bond-slip models: (a) CEB-FIP’s (1993) steel-concrete bond-slip curve for fc
’ = 30 MPa; (b) Lu et al.’s (2005) FRP-concrete bond-slip curve for fc
’=30 MPa and bf /bc = 1
Fig. 4. FE versus test load-displacement curves for Matthys’ (2000) specimens Fig. 5. FE crack patterns at ultimate load for Matthys’ (2000) specimens: (a) beam BF1;
(b) beam BF2; (c) beam BF7; (d) beam BF8; (e) beam BF9 Fig. 6. FE FRP strains and interfacial shear stresses at the ultimate load for Matthys’
Fig. 7. FE and test load-displacement curves for Brena et al.’s (2003) specimens Fig. 8. FE crack patterns at ultimate load for Brena et al.’s (2003) specimens: (a) beam C;
(b) beam C2; (c) beam D2 Fig. 9. FE FRP strain distributions at ultimate load for Brena et al.’s (2003) specimens Fig. 10. Effect of bond modeling on load-displacement curve: (a) beam BF2; (c) beam
BF8 Fig. 11. Effect of bond modeling on crack pattern at ultimate load for beam BF2: (a)
perfect bond for tension bars; (b) tension-stiffening model Fig. 12. Effect of bond modeling on crack pattern at ultimate load for beam BF8: (a)
perfect bond for tension bars; (b) tension-stiffening model Fig. 13. Effect of bond modeling on the width of the critical flexural crack: (a) beam BF2;
(b) beam BF8 Fig. 14. Effect of bond modeling on concrete compressive strain in the critical zone: (a)
beam BF2; (b) beam BF8 Fig. 15. Effect of bond modeling on strain distribution in FRP: (a) beam BF2; (b) beam
BF8
19
0
0
Ten
sile
stre
ss σ
t (M
Pa)
E c
(1-d t )E c
ε tpl
ε tcr
E c
ε tel =σ t /E c
f t
(σt , εt )
Tensile strain ε t
A B C
P
ε t,del
Fig. 1. Definition of tensile damage
20
0
0.1
0.2
0.3
0.4
0.5
0.6
0.7
0.8
0.9
1
0 0.01 0.02 0.03 0.04 0.05 0.06Crack opening displacement w t (mm)