Abstract When a reinforced concrete (RC) column needs to be repaired or strengthen, the use of steel caging is a common practice. From a series of experimental tests, this paper presents a finite element model of a RC column strengthened with steel caging subjected to bending moments and axial loads. The model is used to obtain the N-M diagrams, studying the difference between fitting and not capitals at the end of the strengthened RC column, next to the beam-column joint. In addition the model is used to perform a parametric study in which it is investigated the influence of several parameters, some related to the steel cage and others related to the column itself. Keywords: reinforced concrete columns, strengthening, steel caging, finite element modelling, bending moment, axial force. 1 Introduction The need to repair or strengthen the columns of a building is increasing. One of the most widely used techniques in the world [1,2,3,4,5,6] is steel caging. This strengthening technique has shown to be effective, economical and easy to apply [1,2,7]. Steel caging involves the use of longitudinal angle sections fixed to the corners of the column, to which transverse steel strips are welded. The space between cage and column is filled with cement or epoxy mortar. Capitals can be welded to the ends of the cage in contact with the beam in order to allow the direct transmission of loads to the strengthening.
There are several researches that study the behaviour of a RC column strengthening with steel caging subjected to axial load, both experimentally [4,8,9,10] and numerically [1,11,12,13]. The influence of the beam-column joint was studied experimentally and numerically by Adam et al. [14,15], who showed
Paper 161 Finite Element Modelling of Steel-Caged Reinforced Concrete Columns subjected to Combined Bending and Axial Loads J. Garzón-Roca, J.M. Adam, L. Pallarés and P.A. Calderón ICITECH Universidad Politecnica de Valencia, Spain
that the beam–column joint is often the element that determines the failure of the RC strengthened column. Montuori and Piluso [6] made experimental studies on the effects of eccentric compression loads on isolated columns and proposed a calculation procedure. The combination of a bending moment that could act along the axial load was studied experimentally by Garzón-Roca et al. [16,17], taking into account the influence of the beam-column joint and several possible ways of solving the strengthening in the zone nearest to the joint.
This paper presents an analysis by the finite element method (FEM) of a group of specimens tested by Garzón-Roca et al. [16]. Specifically, it is modelled the specimens with capitals, as this is the most common way to construct a steel caging strengthening. The work is a continuation of previous studies carried out in the Institute of Concrete Science and Technology (ICITECH) at the Universitat Politècnica de València [1,8,9,11,12,14,15,16,17,18]. To perform the finite element model, the finite element software ABAQUS v. 6.8 [19] is used. The model is validated from the experimental results, proving that there is a good match between them in the following issues: behaviour and failure patterns, maximum applied load value and the evolution of the stresses on the angle pieces used in the strengthening.
Then, the model is used to obtain the axial load-bending moment (N-M) diagrams of a specimen, in order to study the improved resistance provided by the strengthening and to compare two different ways of connecting the cage to the beam-column joint: with capitals and without any connection element. Finally, the model is used to carry out a parametric study with which it is studied the influence of the following factors: angle-piece dimensions, number of strips, yield stress of the steel used in the strengthening, dimensions of the capitals placed at both ends of the steel cage, the concrete strength and the size of the reinforcement used in the columns. To make the study, it was needed around 160 finite element models.
2 Summary of previous experimental work In order to simulate the beam-column joint area of a typical building frame in full scale, the specimens were designed with the geometry shown in Figure 1a, consisting of two lengths of RC column with a central transverse element representing a beam, so that the beam–column joint was situated at the centre of the specimen. The experimental work was carried out in the ICITECH laboratories at the Universitat Politècnica de València, testing four strengthened specimens.
With the aim of simulating a column with low compressive strength in need of strengthening, the concrete compressive strength value was set to 12 MPa. Regarding the reinforcement of the column lengths, it was slightly greater than that recommended by most of international codes [20, 21]. Beam reinforcement was determined by the normal residential-building slab design requirements. Steel yield stress used was 500 MPa.
Steel caging geometry can be seen in Figure 1b. Steel capitals (made using 70x70x7 steel angles) were attached at the ends of the strengthening, welded to the end strips and in contact with the beam-column joint. Steel yield stress of all strengthening elements was 275 MPa.
3
Specimens were subjected first to an axial load of 300 or 1000 kN. Then, a shear load was applied to the beam, keeping constant the axial load. This shear load was introduced as a displacement gradually increased until the specimen failed.
Experimental results are deeply analyzed in Garzón-Roca et al. [16]. It is noteworthy that in this work another connection solution with the beam-column joint was studied: the use of steel tube hollow sections joining the strengthening on both sides of the joint. Although this solution proved to be very effective, it is not a common practice use, since it tends to complicate the construction of the strengthening (it requires drilling fairly large holes in the slab or beam), and is less viable if the width of the beam be greater than that of the column.
Figure 1: (a) Specimen geometry and reinforcement; (b) Steel cage (dimensions in mm)
60
100
382,
514
018
2,5
100
100
140
10
1050
Angles L60.6
Strips 230 x 140 x 8
Strips 230 x 100 x 8
1275
1275
400
350 260 350
Steel box
Cross-section BBeam
Cross-section AColumn
260
260
2Ø12
2Ø12
StirrupsØ6/200
4Ø12
4Ø12
StirrupsØ6/100
400
260
A A
B
B
60
100
382,
514
018
2,5
100
100
140 10
1050
Angles L60.6
(a) (b)
4
3 Finite element model The FEM model was carried out using the ABAQUS v. 6.8 [19] software. In order to accurately simulate the behaviour of the steel-caged columns, the FEM model took into account the second-order geometric effects, the non-linear behaviour of concrete and steel (in both cage and rebar) and the existence of a steel cage- concrete interface. 3.1 Description of the finite elements used, boundary conditions
and loads applied As shown in Figure 2, due to the existence of double symmetry, it was only necessary to model a quarter of the specimen, applying symmetry conditions at the corresponding planes. To simulate the specimen join to the test frame, a special piece was included at the ends of the specimens and boundary conditions for simple support were imposed. To allow the axial load to be applied, this special piece can move along the axis of the column. Shear load, orthogonal to the axis of the column, was introduced into the model as displacement control on the entire upper section of the beam after applying the axial load.
Figure 2: FE model geometry, boundary conditions and loads
Shear load
Axial load
Symmetry planes
Special piece
5
Every element in the model, except for the rebar and the special piece, was modelled using hexahedral elements with eight nodes and three degrees of freedom per node, with reduced integration and hourglass control, C3D8R [19]. The rebar was modelled using two-node truss elements linear displacement, which can transmit only axial force, T2D3 [19]. Rebar was introduced into the concrete with the ABAQUS option *ELEMENT EMBEDDED [19], which allows to embed one element into another, assuming perfect bond between both (steel and the concrete in this case). For the special piece, three-dimensional four-node linear tetrahedron solid elements, C3D4 [19], was used.
Due to the nonlinear nature of the models analyzed, the standard Newton method procedure (Newton–Raphson method) in ABAQUS [19] was used to solve the equation systems. This method solves the nonlinear equation incrementally and iteratively by using the tangent stiffness matrix. 3.2 Constitutive models The behaviour of the steel (rebar, steel cage and capitals) is assumed to be elastic perfectly plastic and identical under both tensile and compressive stresses. As elastic modulus and yield stress, values of 200000 MPa and 500 MPa were taken in the case of the reinforcement and 210000 MPa and 275 MPa in the case of the other elements. Poisson‘s ratio for both steel models was assumed to be 0.3.
The concrete was modelled with the “Concrete Damage Plasticity” model [19]. This model is a continuum, plasticity-based, damage model for concrete. It assumes that the main two material failure mechanisms are tensile cracking and compressive crushing [19]. The yield surface is based on the function proposed by Lubliner et al. [24] and elaborated by Lee and Fenves [25] to account for different strength evolution under tension and compression. The model assumes a non-associated potential flow rule and isotropic damage. The flow potential used for this model is based on the Drucker-Prager hyperbolic function.
The "Concrete Damage Plasticity" model allows having a different material curve in tension and compression. Under uniaxial tension, the stress-strain response follows a linear elastic relationship until the value of the failure stress is reached. The failure stress corresponds to the onset of micro-cracking in the concrete material. Beyond the failure stress the formation of micro-cracks is represented macroscopically with a softening stress-strain response, which induces strain localization in the concrete structure [19]. As softening stress-strain response, a parabolic curve was chosen [24], passing through the concrete cracking point and arriving to concrete maximum tensile point for a value equal to ten times cracking strain [19]. Poisson ratio was set to 0.2. Elastic modulus and concrete tension strength was calculated according to ACI 318-08 [25].
To define the uniaxial compression behaviour, the stress–strain relationship proposed by Saenz [26] was used.
6
3.3 Interfaces The steel cage–concrete interface was simulated in ABAQUS [19] by two matching surfaces. Behaviour in the normal direction was modelled as “hard” contact. With this model, no penetration is allowed between the two surfaces and there is no limit to the magnitude of contact pressure that can be transmitted when the surfaces are in contact. Behaviour in the tangential direction was modelled with the classical isotropic Coulomb friction model, defining the friction coefficient as 0.20. No contact cohesion was considered.
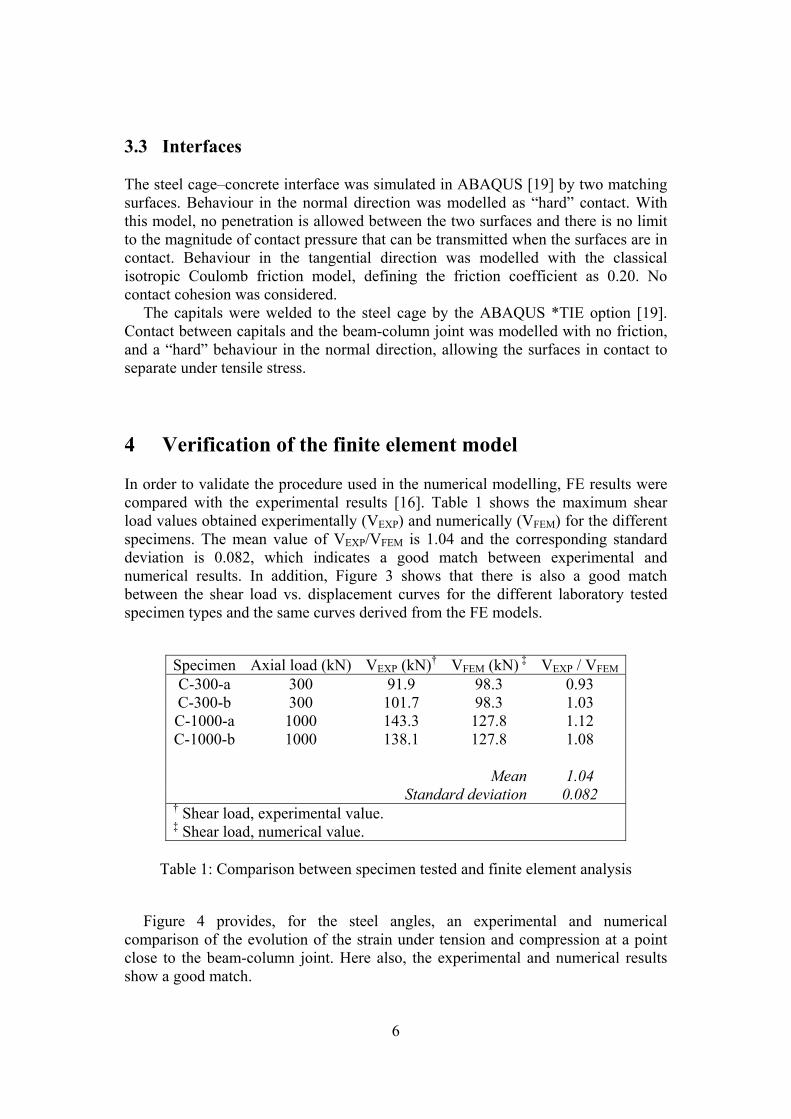
The capitals were welded to the steel cage by the ABAQUS *TIE option [19]. Contact between capitals and the beam-column joint was modelled with no friction, and a “hard” behaviour in the normal direction, allowing the surfaces in contact to separate under tensile stress. 4 Verification of the finite element model In order to validate the procedure used in the numerical modelling, FE results were compared with the experimental results [16]. Table 1 shows the maximum shear load values obtained experimentally (VEXP) and numerically (VFEM) for the different specimens. The mean value of VEXP/VFEM is 1.04 and the corresponding standard deviation is 0.082, which indicates a good match between experimental and numerical results. In addition, Figure 3 shows that there is also a good match between the shear load vs. displacement curves for the different laboratory tested specimen types and the same curves derived from the FE models.
Table 1: Comparison between specimen tested and finite element analysis
Figure 4 provides, for the steel angles, an experimental and numerical comparison of the evolution of the strain under tension and compression at a point close to the beam-column joint. Here also, the experimental and numerical results show a good match.
7
Figure 3: Verification of the FE model; shear load vs. displacement
Figure 4: Verification of the FE model; evolution of the strain under tension and compression of the angles at a point close to the beam-column joint; (a) C-300
specimens; (b) C-1000 specimens
5 N-M diagrams The FE model was used to obtain the axial load – bending moment diagram (N-M diagram) of a RC column strengthened with steel caging. Three configurations were tested: FEM-0, simulating a RC column without strengthening; FEM-S, which simulates a strengthened RC column with the steel cage alone, it is said, without capitals or other elements; and, FEM-C, a strengthened RC column with steel caging and capitals. For all models, concrete compressive strength was set to 12 MPa.
0
40
80
120
160
0 10 20 30 40 50 60
Shea
r loa
d (k
N)
Displacement (mm)
C-300-a EXP C-300-a FEM
C-1000-a EXP C-1000-a FEM
-2.5
-2
-1.5
-1
-0.5
0
0.5
1
0 10 20 30 40 50 60
Stra
in (m
m/m
)
Displacement (mm)
C-1000-a EXP C-1000 FEM C-1000-b EXP-2.5
-2
-1.5
-1
-0.5
0
0.5
1
0 10 20 30 40 50 60
Stra
in (m
m/m
)
Displacement (mm)
C-300-a EXP C-300-b EXP C-300 FEM
(a) (b)
8
5.1 N-M diagrams analysis Figure 5 shows the N-M diagrams obtained. In these diagrams, the bending moment is the value of the moment in the last section of the column, next to the beam-column joint. As it can be seen, both FEM-S and FEM-C specimens increase the bearing capacity of the RC column (FEM-0). However, the enhancement is greater in the case of FEM-C specimens.
It is interesting to note that the effectiveness of the strengthening highly depends on the value of axial load applied to the column. If the axial load is low, steel caging alone (FEM-S) does not significantly increase the maximum bending moment. On the other hand, when axial load is medium or high, this configuration does provide a significant improvement in the maximum bending moment. When capitals are used (FEM-C specimens), even though the strengthening is noticeable in the entire N-M diagram, the more axial load, the more the effectiveness is.
Figure 5: N-M diagrams 5.3 Performance of the strengthening Figure 6 shows the strain evolution under tensile and compressive stresses of angles at a point close to the beam-column joint, for FEM-S and FEM-C specimens, in three axial load levels: 200, 1000 and 1400 kN. As can be seen, the greater the axial load the better the performance of the strengthening (steel angles receive more load).
At the three axial load levels under study, the angles bear a greater load when capitals are used (FEM-C). In the case of strengthening without capitals (FEM-S) the strain is quite low under compressive and tensile stresses, both for low and high
0
20
40
60
80
100
120
0 500 1000 1500 2000
Ben
ding
mom
ent M
(kN
·m)
Axial load N (kN)
FEM-0 FEM-S FEM-C
9
axial loads. It can be observed that maximum strain is 0.5% in angles during both compressive and tensile stresses, corresponding to stresses of approximately 100 MPa, far removed from the yield stress of the steel used (275 MPa). When capitals are fitted at the end of the strengthening (FEM-C), steel angles reach a strain of 0.6% (125 MPa) for an axial load of 200 kN. In case of axial loads of 1000 and 1400 kN, angles under compressive stresses yield.
Figure 6: Strain evolution under tensile and compressive stresses of steel angles at a
point close to the beam-column joint, for FEM-S (a) and FEM-C (b) specimens 6 Parametric study A parametric study was carried out using the developed FE model. With this study it was investigated the influence of various parameters on the behaviour of the strengthened column, including some related to the steel cage and others related to the column itself. These parameters were: angle-piece dimensions, number of strips, yield stress of the steel used in the strengthening, dimensions of the capitals placed at both ends of the steel cage, the concrete strength and the size of the reinforcement used in the columns.
Table 2 summarizes the characteristics of the specimens analysed in this parametric study. More than 160 numerical models were necessary (each N-M diagram has at least 12 N-M points). Figures 7-12 show the N-M diagrams obtained in this study. Its results are discussed below. 6.1 Steel angle dimension As can be seen from Figure 7, the larger the size of the steel angles the greater the resistance of a strengthened RC column. However, when axial load is low the effect of changing the steel angle is scarcely remarkable.
Specially, for specimens without capitals (S specimens), increasing the area of the steel angles does not involve a significant increase in the maximum bending moment, since the angles in this type of strengthening bear very little load (see Section 5.3).
6.2 Steel yield stress Figure 8 shows that the steel yield stress (fyL) does not have influence if the axial load level is not high. Moreover, in case the strengthened does not have capitals (S specimens), the difference between using 275 MPa and 355 MPa yield stress is imperceptible. Once again, the reason for this is due to the minor role played by the steel cage, as was seen previously in Section 5.3.
If capitals are used (C Specimens), the increase in the steel yield stress of the steel cage causes a slight increase in bending resistance for high loads.
S); (b) Specimens with capitals (type C) 6.3 Number of strips According to Figure 9, when the second strip from the beam-column joint is removed, a drop in the bending resistance of the strengthened RC column is observed.
In specimens without capitals (S specimens) the loss of bending resistance is due to the reduced confinement effect of the steel cage on the column concrete. With fewer strips, confinement is reduced so that the concrete has lower compressive strength, which also affects its resistance to bending.
In case of specimens with capitals (C specimens) the lower bending resistance is due to the buckling of the steel angles under compressive stresses as a result of the greater distance between the strips. 6.4 Capital dimension As Figure 10 shows, varying the capital dimensions does not notably increase the bending resistance of RC columns strengthened by steel caging. For example, the increased resistance provided to a specimen by using a 50x50x5 profile (C-C50 specimen) instead of 70x70x7 profile as capital (C-Ref specimen) is approximately 3%. The same increase can be achieved by changing a 70x70x7 profile (C-Ref specimen) for a 90x90x9 profile (C-C90 specimen).
0
20
40
60
80
100
120
140
160
0 500 1000 1500 2000 2500
M (k
N·m
)
N (kN)
Ref S S-fyL355
0
20
40
60
80
100
120
140
160
0 500 1000 1500 2000 2500
M (k
N·m
)
N (kN)
Ref-C C-fyL355
(a) (b)
12
Figure 9: Parametric study; number of strips; (a) Specimens without capitals (type
S); (b) Specimens with capitals (type C)
Figure 10: Parametric study; capital dimension; specimens with capitals (type C)
6.5 Concrete strength The concrete compressive strength (fc) in the column has a considerable influence on the bending resistance of the strengthened RC column, as shown in Figure 11. Increasing the concrete compressive strength also improves the N-M diagram. In all cases, greater concrete compressive strength implies higher resistance. However, at low axial loads the concrete compressive strength is seen to have less influence. The higher the axial load applied to the column, the greater the increase in resistance. 6.6 Size of reinforcement bars As can be seen from Figure 12, the greater the quantity of the reinforcement, the higher the bending resistance. This increase is nearly constant throughout the N-M diagram and is therefore independent of the axial load applied, since having more reinforcement not only does it allow to bear more tension stresses (important with
0
20
40
60
80
100
120
140
160
0 500 1000 1500 2000 2500
M (k
N·m
)
N (kN)
Ref S S-3strips
0
20
40
60
80
100
120
140
160
0 500 1000 1500 2000 2500
M (k
N·m
)
N (kN)
Ref-C C-3strips
(a) (b)
0
20
40
60
80
100
120
140
160
0 500 1000 1500 2000
M (k
N·m
)
N (kN)
Ref-C
C-C50
C-C90
13
low axial loads and bending moments), but it allows to bear more compression stresses also (important with high axial loads).
7 Conclusion This paper has developed a FE model of a RC column strengthened with steel caging subjected to bending moments and axial loads. The FE model was carried out using the software ABAQUS and validated using the results of previous experimental tests. The FE model took into account the second-order geometric effects, the non-linear behaviour of concrete and steel (in both cage and rebar) and the existence of a steel cage- concrete interface.
The model has been used to obtain the N-M diagram of a RC column strengthened with steel caging, placing or not capitals at the end of the column and in contact with the beam-column joint. The N-M diagrams have shown that steel caging improve the behaviour of a RC column, increasing both the maximum moment and the maximum axial load. If capitals are used, the effects of steel caging are higher, and the performance of the strengthening is higher too.
0
20
40
60
80
100
120
140
160
0 500 1000 1500 2000 2500 3000
M (k
N·m
)
N (kN)
Ref-SS-fc20S-fc30
0
20
40
60
80
100
120
140
160
0 500 1000 1500 2000 2500 3000
M (k
N·m
)
N (kN)
Ref-C
C-fc20
C-fc30
(a) (b)
0
20
40
60
80
100
120
140
160
0 500 1000 1500 2000 2500
M (k
N·m
)
N (kN)
Ref S S-As10
S-As16 S-As20
0
20
40
60
80
100
120
140
160
0 500 1000 1500 2000 2500
M (k
N·m
)
N (kN)
Ref-C C-As10
C-As16 C-As20
(a) (b)
14
The FE model was also used to carry out a parametric study. This study has investigated the influence of six factors: angle-piece dimensions, number of strips, yield stress of the steel used in the strengthening, dimensions of the capitals placed at both ends of the steel cage, the concrete strength and the size of the reinforcement used in the columns. Acknowledgements The authors wish to express their gratitude for the financial support received from the Spanish Ministry of Science and Innovation (Research Project BIA 2008-06268) and to the Generalitat Valenciana (Project GVPRE/2008/153). Mr. Garzón–Roca is also grateful to the latter and to the Universitat Politècnica de València for the scholarship awarded to him to complete his doctorate studies. He also wants to express his gratitude to the Universidade do Minho, where he has made a stay of six months. Specially, he thanks Dr. Isabel Valente for her support in this research. References [1] J.M. Adam, S. Ivorra, F.J. Pallarés, E. Giménez, P.A. Calderón, “Axially
loaded RC columns strengthened by steel caging. Finite element modelling”, Construction and Building Materials, 20(6), 2265–2276, 2009.
[2] H.S. Oey, C.J. Aldrete, “Simple method for upgrading an existing reinforced concrete structure”, Practice Periodical on Structural Design and Construction ASCE, 1(1), 47–50, 1996.
[3] H. Fukuyama, S. Sugano, “Japanese seismic rehabilitation of concrete buildings after the Hyogoken–Nanbu earthquake”, ement & Concrete Composites, 22, 59–79, 2000.
[4] L. Cirtek, “RC columns strengthened with bandage—experimental programme and design recommendations”, Construction and Building Materials, 15(8), 341–349, 2001.
[5] J. Li, J. Gong, L. Wang “Seismic behavior of corrosion-damaged reinforced concrete columns strengthened using combined carbon fiber-reinforced polymer and steel jacket”, Construction and Building Materials, 23, 2653–2663, 2009.
[6] R. Montuori, V. Piluso, “Reinforced concrete columns strengthened with angles and battens subjected to eccentric load”, Engineering Structures, 3, 539–550, 2009.
[7] CEB-FIB, “Seismic assessment and retrofit of reinforced concrete buildings”, Bulletin no. 24, Task Group 7.1, 2003.
[8] E. Giménez, J.M. Adam, S. Ivorra, J.J. Moragues, P.A. Calderón, “Full-scale testing of axially loaded RC columns strengthened by steel angles and strips”, Advance Structural Engineering, 12(2), 169–181 , 2009.
[9] E. Giménez, J.M. Adam, S. Ivorra, P.A. Calderón, “Influence of strips configuration on the behaviour of axially loaded RC columns strengthened by steel angles and strips”, Materials and Design, 30, 4103–4111, 2009.
15
[10] J.L. Ramírez, “Ten concrete column repair methods”, Construction and Building Materials, 10(3), 195–202, 1996.
[11] J.M. Adam, S. Ivorra, E. Giménez, J.J. Moragues, P. Miguel, C. Miragall, P.A. Calderón, “Behaviour of axially loaded RC columns strengthened by steel angles and strips”, Steel and Composite Structures, Vol. 7, No. 5, 405-419, 2007.
[12] J.M. Adam, S. Ivorra, F.J. Pallarés, E. Giménez, P.A. Calderón, “Axially loaded RC columns strengthened by steel caging”, Proc. ICE - Structures & Buildings, 162(3), 199–208, 2009.
[13] L. Cirtek “Mathematical model of RC banded column behaviour”, Construction and Building Materials, 15(8), 351–359, 2001.
[14] J.M Adam, E. Giménez, P.A. Calderón, F.J. Pallarés, S. Ivorra, “Experimental study of beam–column joints in axially loaded RC columns strengthened by steel angles and strips”, Steel and Composite Structures, 8(4), 329–342, 2008.
[15] J.M. Adam, S. Ivorra, F.J. Pallarés, E. Giménez, P.A. Calderón “Column-joint assembly in RC columns strengthened by steel caging”, Proc. ICE - Structures & Buildings, 161(6), 337–348, 2008.
[16] J. Garzón-Roca, J.M. Adam, P.A. Calderón “Behaviour of RC columns strengthened by steel caging under combined bending and axial loads”, Construction and Building Materials, 25(5), 2402–2412, 2011.
[17] J. Garzón-Roca, J. Ruiz-Pinilla, J.M. Adam, P.A. Calderón, “An experimental study on steel-caged RC columns subjected to axial force and bending moment”, Engineering Structures, 33(2), 580–590, 2011.
[18] P.A. Calderón, J.M. Adam, S. Ivorra, F.J. Pallarés, E. Giménez, “Design strength of axially loaded RC columns strengthened by steel caging”, Materials and Design, 30(10), 4069–4080, 2009.
[20] CEN, “EN 1992-1-1 Eurocode 2: design of concrete structures. Part 1: general rules and rules for buildings”, Brussels, 2004.
[21] CEB-FIB, “Model Code 90”, Laussane, 1991. [22] J. Lubliner, J. Oliver, S. Oller, E. Oñate, “A plastic-damage model for
concrete”, International Journal of Solids and Structures, 25(3), 299-326, 1989.
[23] J. Lee, G.L. Fenves, “Plastic-damage model for cyclic loading of concrete structures”, Journal of Engineering Mechanics, ASCE, 124(8), 892-900, 1998.
[24] K.E. Barth, W. Haiyong, “Efficient nonlinear finite element modeling of slab on steel stringer bridges” Finite Elements in Analysis and Design, 42(14-15), 1304–1313, 2006.
[25] ACI Committee 318, “Building code requirements for structural concrete and commentary (ACI 318-08)”, American Concrete Institute, Farmington Hills, MI, 2008.
[26] L.P. Saenz, “Discussion of «Equation for the stress-strain curve of concrete» by Desayi P, Krishnan S”, ACI Journal, 61, 1229–1235, 1964.