Page 1
Information on LULUCF actions
FINLAND
30.6.2014
Reporting based on Article 10 of DECISION No 529/2013/EU OF THE EUROPEAN
PARLIAMENT AND OF THE COUNCIL of 21 May 2013 on accounting rules on greenhouse
gas emissions and removals resulting from activities relating to land use, land-use change and
forestry and on information concerning actions relating to those activities
Page 2
CONTENTS
Introduction ..................................................................................................................................... 1
1. National circumstances ........................................................................................................... 2
2. Past emissions and removals ................................................................................................. 10
3. Projections for emissions and removals for the accounting period ...................................... 15
4. An analysis of the potential to limit or reduce emissions and to maintain or increase
removals ........................................................................................................................................ 17
5. A list of national measures related to forestry ...................................................................... 20
6. Existing and planned policies and their impact .................................................................... 22
7. Literature and links ................................................................................................................... 29
Page 3
1
Introduction
This report responds to the information requirements set out in Article 10 of Decision
(529/2013/EU) on accounting rules on greenhouse gas emissions and removals resulting from
activities relating to land use, land-use change and forestry and on information concerning
actions relating to those activities (“LULUCF decision”).
The report is divided into six different chapters. Chapter 1 provides an overview of Finland´s
national circumstances which affect climate actions taken in the LULUCF sector. Chapter 2
describes past emissions and removals from four different activities (afforestation, reforestation,
deforestation and forest management) based on the latest greenhouse gas inventory submission
and covering years 1990-2012. Chapter 4 proceeds to describe projections for the accounting
period 2013-2020. Chapter 5 provides an overview of national measures taken in the forestry
sector. And finally, Chapter 6 describes the existing and planned policies in the LULUCF and
agriculture sectors and their expected effect on both emissions and removals.
The report has been prepared by experts at the Ministry of Agriculture and Forestry, together
with other relevant ministries and research institutions (Finnish Forest Research Institute and
MTT Agrifood Research Finland). The information provided in this report is mainly based on
Finland´s 6th
National Communication, the 1st Biennial Report and the 2014 National Inventory
Report to the UNFCCC and the Kyoto Protocol. Various stakeholders from both forestry and
agriculture sectors have been consulted in the preparation process and the final report will be
made available to the public.
Helsinki, June 2014
Ministry of Agriculture and Forestry
Page 4
2
1. National circumstances
The population of Finland was 5.4 million at the end of 2011, and according to projections, it
will increase to 6.0 million by 2040. The average population density is 18 inhabitants per km².
Finland is situated at a latitude between 60 and 70 degrees north, with a quarter of the country
extending north of the Arctic Circle. With a total area of 338,432 km2, it is Europe’s seventh
largest country. Nearly all of Finland is situated in the boreal coniferous forest zone, and 72 per
cent of the total land area is classified as forest land, while only some 8 per cent is farmed.
Finland has more than 34,300 km2 of inland water systems, which represents approximately 10
per cent of its total area. There are some 190,000 lakes and 180,000 islands.
The climate of Finland displays features of both maritime and continental climates, depending on
the direction of air flow. Considering its northern location, the mean temperature in Finland is
several degrees higher than in most other areas at these latitudes. The temperature is higher due
to the Baltic Sea, because of the inland waters and, above all, as a result of air flows from the
Atlantic Ocean, which are warmed by the Gulf Stream. The mean annual temperature is
approximately 5.5°C in south-western Finland and decreases towards the northeast. The average
annual temperature has increased during the last 150 years by slightly more than one degree.
Forests (trees and soil) absorb a significant proportion of the carbon dioxide (CO2) emissions.
The forest sink varied between 22.4 and 48.2 million tonnes CO2 equivalent (CO2 eq.) during the
years 1990–2012, which represents 20–60 per cent of Finland’s total emissions (Figure 1). The
proportion has varied considerably due to fluctuating trends in emissions and forestry activity.
Figure 1. Finland´s greenhouse gas emissions and removals 1990-2012, with (orange line) and
without (blue bars) the LULUCF sector sink, based on UNFCCC reporting. (Source: Statistics
Finland 2014)
Page 5
3
Changes in land use since 1990 are shown in Table 1. Forest land dominates Finland´s land area,
followed by wetlands and croplands. Overall land use changes have been quite small, with the
exception of the increase in settlement areas, while the areas of forest land, cropland, grassland
and wetlands have decreased.
Table 1.
Forestry
In Finland, forestry land covers 26 million hectares, or 77 per cent of the total area (incl. inland
waters). Land classified as forestry land consists of the subcategories of forest land, poorly
productive land and unproductive land. Of the total land area, 20 million hectares is classified as
forest land according to the national definition, which is based on annual tree growth, or 22
million hectares according to the FAO definition, which is also used in the national greenhouse
gas inventory. Within the EU, the significance of forests for the national economy and society at
large has been the greatest in Finland.
There are approximately twenty indigenous tree species growing in Finland. The most common
ones are the Scots pine (Pinus silvestris), Norway spruce (Picea abies) and silver and pubescent
birches (Betula pendula and B. pubescens). Usually, two or three tree species dominate a forest
stand. More than one half of the forest land area consists of mixed stands.
Finland’s forest policy aims at sustainable forest management. The objective is to ensure welfare
that is founded on the sustainable management and use of forests and diversity of the forest
nature. Policy measures include the Forest Act and other legislation, Finland’s National Forest
Programme 2015, financing, and public forest advisory organizations.
Finnish forests are managed in a sustainable manner. About one third of the forests are
regenerated naturally, while two thirds are generated artificially by using indigenous tree species
with local provenance. According to the Forest Act, a new seedling stand has to be established
within three years after the end of felling. Natural regeneration is based on seeding from trees
Page 6
4
already growing on the site, usually by leaving a number of seed trees standing at the time of
felling. In artificial regeneration, a new stand is established on a clear-felled area, either through
seeding or planting, which accounts for approximately 118,000 hectares annually. Every year,
160 million seedlings are planted in the forests.
The total volume of Finland’s forest stock amounts to 2,306 million m3. The growing stock
volume has been increasing for a long time, mainly because the growth in forest volume has
exceeded the harvesting volumes and natural drain (Figure 2). In 2011, the total drain was 71
million m³, while the total increment of the growing stock was 104 million m³. The total drain
includes cutting removals, harvesting losses and natural mortality. Of the total area undergoing
felling annually, thinning accounts for roughly one half, while other cutting, e.g. clear felling and
seed and shelter wood felling, accounts for the other half.
Figure 2.
The growing stock has increased by 80 per cent since the 1960s due to investments made in
sustainable forest management. Pine has contributed the most to the increase due to the large
number of young stands at a rapid growth stage. The draining of mires in the 1960s and 1970s
improved the growing conditions for trees in peatlands, which has also added to the increase in
the growing stock.
More than 50 per cent of Finland’s forests are owned by private individuals, 35 per cent by the
state, about 8 per cent by private forest companies and the rest by other owners. The average size
Page 7
5
of a forest holding owned by private individuals is small, approximately 30 hectares. About one
in every six Finns is a forest owner (920,000 owners and 440,000 holdings). The forest
management associations provide the forest owners with advisory services on forest management
and felling.
Approximately EUR 200 million is invested every year in forest regeneration, young stand
management and other silvicultural practices. More than two thirds of this amount is financed by
private, non-industrial owners and the rest is covered by state subsidies. The raw material value
of wood harvested annually was between EUR 1,200 and 2,500 million in the period 2007–2012,
of which approximately 81 per cent was paid to private forest owners as stumpage earnings.
More than 95 per cent of Finland’s forests are certified according to the national forest
certification standard.
In 2011, the total use of roundwood (raw, unmanufactured timber) in Finland was 70.6 million
m³. Approximately 90 per cent (61.6 million m³) of this was used in the forest industry and 9.0
million m³ was used for energy production (Figure 3).
Figure 3. (Source: Finnish Forest Research Institute)
Forests (trees and soil) absorb a significant proportion of Finland’s carbon dioxide (CO2)
emissions. The forest sink varied between 22.4 and 48.2 million tonnes CO2 eq. during the years
1990–2012, which represents 20–60 per cent of Finland’s total emissions. The proportion has
varied considerably due to fluctuating trends in emissions and forestry activity.
During the past few decades, forest protection and biodiversity in managed forests have received
special attention. Numerous protection programmes and decisions have contributed to a threefold
increase in the area of protected forests over the last 30 years.
Page 8
6
Thirteen per cent of the forest area (forest land and poorly productive forest land), a total of 2.9
million hectares, is protected or in restricted forestry use. Most of this, 2.5 million hectares, is in
northern Finland, where the protected areas altogether account for 22 per cent of the forest area.
In the south, the protected area is approximately 0.5 million hectares, which is 4 per cent of the
forest area. Almost 70 per cent (more than 2.0 million hectares) of the areas that are protected or
in restricted forestry use are completely excluded from felling, i.e. under strict conservation.
Their share of the total forest area is approximately 9 per cent.
The National Forest Programme 2015 and national policies on nature and biodiversity
conservation are mutually supportive and consistent with each other. The Forest Biodiversity
Programme for Southern Finland 2008–2016 (METSO) targets both private and state-owned
lands. It combines the protection and commercial use of forests. Funding for the programme was
EUR 144 million for 2008–2012.
Agriculture
The current farming practices in Finland are made possible by the warming effect of the Gulf
Stream, which results in 3–4°C higher temperatures than would otherwise be expected at these
latitudes. As Finland is nearly 1,100 kilometres long from north to south, there are considerable
regional variations in the climate. The average total precipitation in the summer months is
between 180 and 220 mm. The thermal growing season (the period with an average daily
temperature of more than +5°C) varies from nearly six months in the south to between two and
three months in the north. The growing season in Finland is too short for many cultivars grown
elsewhere and therefore frost-resistant varieties have been developed. Because of the short
growing season, the yield levels of the field crop species are considerably lower in Finland than
in Central Europe. The harsh winters also reduce productivity, as they restrict the cultivation of
winter cereals.
Climatic conditions are a decisive factor affecting the possibilities for crop production.
Cultivation of wheat and oilseed plants is restricted to southern Finland, whereas barley, oats,
grass and potatoes can be cultivated in most parts of the country. In many parts of Finland,
livestock farming, especially dairy farming, is the only profitable form of agricultural
production.
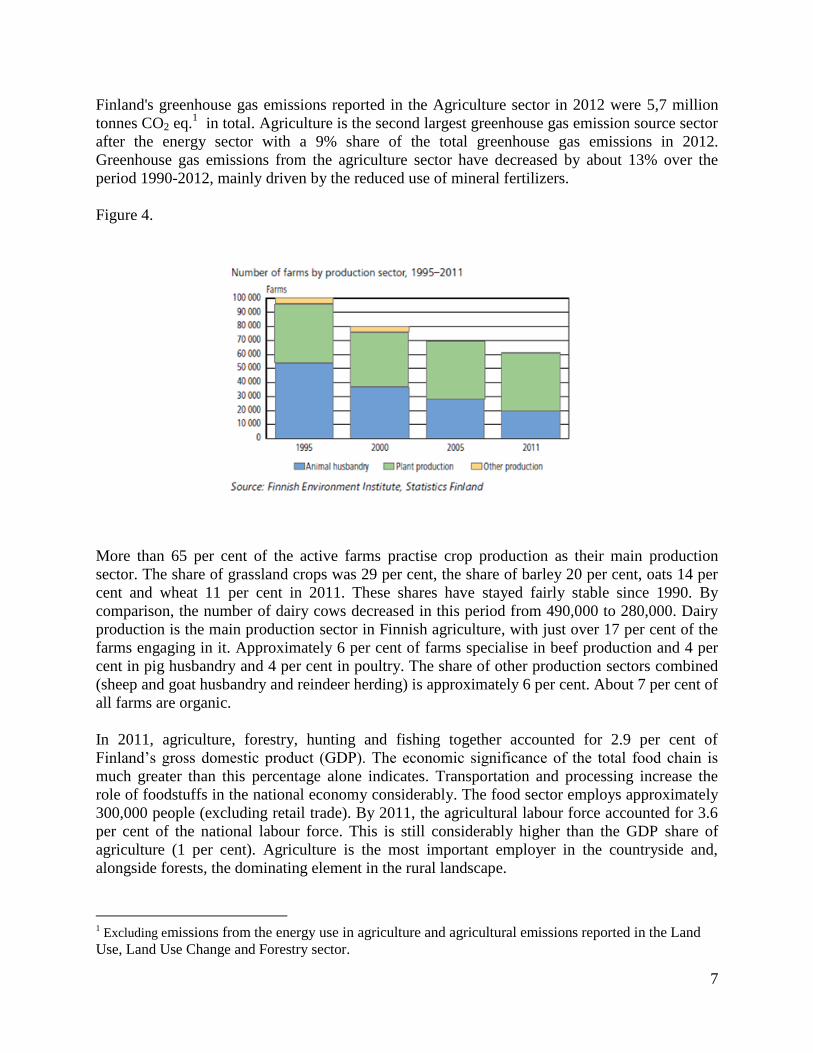
Finnish agriculture is based on family farms. In 2011, private persons owned more than 88 per
cent of the farms, while heirs and family companies owned more than 10 per cent of farms and
the state, municipalities and other communities about 1 per cent of farms. Between 1990 and
2011, the number of active farms fell from 130,000 to 62,000 (Figure 4). At the same time, the
average farm size increased from 17 to 37 arable hectares and a general reduction in the livestock
numbers occurred. Total agricultural production has stayed at almost the same level since 1990.
The area cultivated as arable land has decreased by about 5 per cent since 1990. In 2011, the
cultivated arable land area was 22,490 km2, which is approximately 7.4 per cent of the total land
area.
Page 9
7
Finland's greenhouse gas emissions reported in the Agriculture sector in 2012 were 5,7 million
tonnes CO2 eq.1 in total. Agriculture is the second largest greenhouse gas emission source sector
after the energy sector with a 9% share of the total greenhouse gas emissions in 2012.
Greenhouse gas emissions from the agriculture sector have decreased by about 13% over the
period 1990-2012, mainly driven by the reduced use of mineral fertilizers.
Figure 4.
More than 65 per cent of the active farms practise crop production as their main production
sector. The share of grassland crops was 29 per cent, the share of barley 20 per cent, oats 14 per
cent and wheat 11 per cent in 2011. These shares have stayed fairly stable since 1990. By
comparison, the number of dairy cows decreased in this period from 490,000 to 280,000. Dairy
production is the main production sector in Finnish agriculture, with just over 17 per cent of the
farms engaging in it. Approximately 6 per cent of farms specialise in beef production and 4 per
cent in pig husbandry and 4 per cent in poultry. The share of other production sectors combined
(sheep and goat husbandry and reindeer herding) is approximately 6 per cent. About 7 per cent of
all farms are organic.
In 2011, agriculture, forestry, hunting and fishing together accounted for 2.9 per cent of
Finland’s gross domestic product (GDP). The economic significance of the total food chain is
much greater than this percentage alone indicates. Transportation and processing increase the
role of foodstuffs in the national economy considerably. The food sector employs approximately
300,000 people (excluding retail trade). By 2011, the agricultural labour force accounted for 3.6
per cent of the national labour force. This is still considerably higher than the GDP share of
agriculture (1 per cent). Agriculture is the most important employer in the countryside and,
alongside forests, the dominating element in the rural landscape.
1 Excluding emissions from the energy use in agriculture and agricultural emissions reported in the Land
Use, Land Use Change and Forestry sector.
Page 10
8
As a member of the EU, Finland follows the Common Agricultural Policy (CAP). The CAP is
implemented nationally and aims to develop the agricultural production of the European Union
in a balanced way, while taking the environment, climate and animal welfare into consideration.
One important aim of the CAP is also to promote the viability of rural areas.
Peatlands
Pristine peatlands are carbon accumulating ecosystems in the long term. Depending on the
weather conditions, a particular peatland can vary on a year-to-year basis from a net sink to a net
source of emissions. It is estimated that since the last ice age peatlands have accumulated some
5,400 million tonnes of carbon, forming the largest soil carbon stock in Finland.
Peatlands cover one third of the total land area in Finland, approximately 9.3 million hectares.
Regional differences in the coverage and drainage are considerable (Figure 5). The majority of
the peatlands are located in the north (Lapland and Ostrobothnia-Kainuu), while only 7 per cent
are in southern Finland. Conversely, most of the drainage has occurred in southern Finland.
Approximately 6.3 million hectares of peatlands have been drained for forestry and about 0.3
million hectares for agriculture. The total area of undrained peatlands is approximately 4 million
hectares.
Peat is a domestically important fuel source, one that currently represents approximately 6 per
cent of the total primary energy supply. In view of its employment impact, it is also significant
from the regional policy perspective. The area used for the harvesting of energy and
environmental peat is approximately 75,000 hectares. In 2011, the emissions from peat
extraction areas were a source of 2.1 million tonnes CO2 eq., mostly consisting of CO2.
Almost 13 per cent of Finnish peatlands — amounting to 1.2 million hectares — are protected.
They consist mainly of areas under the national mire protection programme, areas in national
parks and nature reserves, and old-growth forest conservation programme and wilderness areas.
In 2012, the Finnish Government approved a resolution on the sustainable and responsible use
and protection of mires and peatlands. The resolution directs human activities to peatlands that
have been drained or whose natural state has otherwise been significantly changed and lays the
foundation for implementing sectoral policies and measures for sustainable use as well as for
improving the status of the existing network of protected peatlands. As a part of the resolution, a
long-term peatland protection and restoration programme will be carried out by 2025.
Page 12
10
2. Past emissions and removals
The LULUCF sector as a whole is a net sink in Finland. The sink has varied from approximately
20 per cent to 60 per cent of the annual GHG emissions from other sectors during 1990-2012.
Most of the removals in the LULUCF sector come from tree biomass growth. The annual volume
increment has grown quite steadily, which means that the CO2 uptake has also grown. According
to the National Forest Inventory, the annual increment of growing stock has been increasing
since the 1970s, reaching its current level of 104 million cubic metres, of which 97 million cubic
metres is in commercially managed forests.
The LULUCF sector has been a net sink during the whole time series beginning from 1990
(Figure 6). Forest land has been a net sink, whereas the other land-use categories have comprised
net sources. The level, trend and the interannual variability in the sink for the whole LULUCF
sector are determined by the forest land sink.
Figure 6. (Source: Statistics Finland).
The total drain depends a great deal on commercial roundwood fellings and the global market
situation. Due to the falling domestic roundwood markets, the commercial roundwood removals
in 2009 were only 41 million m3. This was 20 per cent smaller than in the previous year. The
global economic downturn had a considerable negative effect on the demand for forest-based
industrial products in 2009. In 2010, the production of the forest industry started to recover and
wood products industry production came back closer to its normal level as the demand increased
both domestically and in the export markets. The demand for pulp and paper recovered as well.
Thus, roundwood fellings in Finland increased in 2010 almost to the normal level: commercial
Page 13
11
fellings totalled 52 million m3, which is almost 25 per cent more than in the previous year.
Felling also increased due to the severe storms in late July and early August 2010, which felled
trees with a total volume of approximately 8 million m3. Most of the storm-felled trees were used
as raw material in the recovering forest industry. Increased fellings caused most of the decrease
in the biomass C stock sinks compared to the previous year.
In 2011, the growth rate of the Finnish national economy was modest. Forest industry production
was one-fifth lower than in the peak production year 2007. The total drain was 70.9 million m3,
of which the commercial roundwood removals were 52,4 million m3. This is about at the same
level as in the previous year. The drain also includes the 3,5 million m3 of wood damaged or
felled by the storms in December 2011.
Articles 3.3 and 3.4 of the Kyoto Protocol concern emissions and removals from land use, land-
use change and forestry (LULUCF) activities. Article 3.3 activities (afforestation, reforestation
and deforestation) are based on land-use changes, and reporting these activities is mandatory for
the Parties to the Kyoto Protocol. Under Article 3.4, the selection of activities (forest
management, cropland management, grazing land management and revegetation) was voluntary
for the Parties during the first commitment period. For the second commitment period forest
management has become a compulsory activity, while others still remain voluntary.
The Finnish Government decided to apply Article 3.4 of the Kyoto Protocol regarding forest
management (FM) in the first commitment period. This enables Finland to compensate for net
emissions resulting from Article 3.3 activities and to provide removal units (RMUs) worth up to
0,59 million tonnes CO2 eq. per year. The accounting for the emissions and removals under
Article 3, paragraphs 3 and 4 was done at the end of the commitment period. Finland did not
select other art. 3.4. activities for the first commitment period of the Kyoto Protocol.
Based on a study by the Finnish Forest Research Institute (Metla), Article 3.3 activities were
estimated to cause net emissions for the period 2008–2012. This is due to land-use changes as a
result of converting forest land to other land uses as well as low carbon sequestration rates in
areas afforested or reforested since 1990. During the period 2008–2011, the emissions were, on
average, 3,6 million tonnes CO2 eq. per year. Net emissions from Article 3.3 activities were 2,3
million tonnes CO2 eq. in 2012. Afforestation and reforestation were a net sink of 0,1 million
tonnes CO2 eq. while deforestation resulted in a net emission of 2,4 million tonnes CO2 eq.. The
area subject to AR was 167,284 ha at the end of the first commitment period. During 1990-2012
AR areas have steadily declined from an average of 12,000 ha in the 1990s to an average of
3,600 ha in the 2000s.
Page 14
12
Figure 7. (Source: Statistics Finland)
Yearly deforestation areas increased from 6,800 ha in 1990 until 2004, when deforestation
reached its maximum, 22,500 ha per year. Since then, yearly D areas have been in steady
decline. D area in 2012 was approximately 7,700 ha. At the end of 2012, the total area deforested
since 1 January 1990 was 324,378 ha. The transition from forest to built-up land and
infrastructure, that is, the land-use changes from forest land to settlements, has been the most
important activity in deforestation. The emissions and removals from ARD lands vary
substantially between the years. This variation is due to the fact that the timing and quantity of
land-use changes vary depending on the economy and different incentives.
Land-use change from forest land to other land uses is difficult to avoid in a country where
forests cover 72 per cent of the land area. Most of the change is driven by settlements and
infrastructure (e.g. roads and transmission lines). The estimations still include high degrees of
uncertainty and will become more accurate as the calculation methods are further developed.
Page 15
13
Figure 8. (Source: Statistics Finland)
In line with Article 3.4, the FM net sink between 2008 and 2012 has been approximately 39,6
million tonnes CO2 eq. per year. Net removals from forest management vary significantly based
on the overall economic situation. In 2009, the sink was 47 million tonnes CO2 eq., whereas in
2008 it was 36 million tonnes CO2 eq. The National Forest Program 2015 (NFP) estimates that
the annual carbon sink of forests (incl. trees and soil) will remain at a level of at least 10–20
million tonnes CO2 eq. by 2015 if logging increases by 10–15 million cubic metres a year, as is
currently projected. The policy defined in the NFP regarding the increase in industrial
roundwood and energy wood is consistent with the National Climate and Energy Strategy (2013)
and it will help to achieve the target set by the directive on promoting the use of energy from
renewable sources.
Page 16
14
Figure 9. (Source: Statistics Finland)
Figure 10. Net emissions and removals (totals) from the FM activities under Article 3.4 and AR
and D activities under Article 3.3. between 1990-2012, million tonnes CO2eq. (Source: Statistics
Finland)
-60
-50
-40
-30
-20
-10
0
10
1990
1992
1994
1996
1998
2000
2002
2004
2006
2008
2010
2012
Ne
t e
mis
sio
ns/
rem
ova
ls m
ill.t
. C
O2 e
q.
FM
AR
D
Page 17
15
Table 2. (Source: Statistics Finland)
The emissions by sources and removals by sinks and non-CO2 emissions for ARD and FM were
estimated with the same principles and methods as for the UNFCCC reporting. The same
QA/QC-procedures were also implemented. For the 2015 submission, the methodologies
included in the IPCC 2006 Guidelines and the KP Supplement will be implemented and the
reporting will also be developed to fulfil the requirements of the Kyoto Protocol reporting in the
second commitment period.
3. Projections for emissions and removals for the accounting period
For the second commitment period of the Kyoto Protocol (2013-2020), forest management is a
compulsory activity and the accounting will be based on a reference level (RL) approach.
Finland´s RL is an average value of the projected removals and emissions for the period 2013–
2020 and it is based on the long-term Climate and Energy Strategy as well as the National Forest
Programme (NFP 2015). The FMRL (forest management reference level)for 2013–2020 is –
19.30 million tonnes CO2 eq. and –20.4., including harvested wood products (HWP).
The projection of the carbon stock changes has been developed based on the results of two
models, the SF-GTM forest sector model and the MELA forestry model, which were used to
produce the scenario based on the national forest inventory (NFI) data. Projections of emissions
from nitrogen (N) fertilization and biomass burning were estimated based on the emissions
reported in the GHG inventory. For the projection of CO2 emissions/removals from HWP the
data from the FAOSTAT database, national forestry statistics and from the Long-term Climate
and Energy Strategy were used.
Page 18
16
Projections of emissions and removals from Forest Management for 2013–2020 were produced
to construct a Forest Management Reference Level. For that purpose, separate projections
compatible with FMRL for activities Afforestation, Reforestation and Deforestation were not
produced. However, to estimate the FM area in 2013-2020, the deforestation area was predicted
based on the historical deforestation rate. A detailed description of the different elements of the
Reference Level (etc. policies included, pools, gases, approaches, methods and models) can be
found in Finland´s FMRL submission to the UNFCCC (see Chapter 7).
Cropland and grazing land management has not been accounted by Finland under the first
commitment period of the Kyoto Protocol and the figures relating to this are not yet available. In
practice the calculation of cropland management under the KP would be done using the same
methods as in the present LULUCF calculations for the purposes of the Convention reporting,
and the surface area would also be the same. At present the reporting covers changes in carbon
stocks, emissions from the decomposition of peat and emissions from liming as well as nitrous
oxide emissions from arable land cleared from forest for a period of one year.
For Finland grazing land management will be a new activity for accounting as well under the
LULUCF decision. The areas now reported as grassland are mostly abandoned arable lands, not
grazing lands. The current grassland areas under the Convention reporting are not in line with the
accounting for grazing land management for the second period of the Kyoto Protocol. The
definition of grazing lands in the IPCC guidelines covers lands that are clearly linked to livestock
production (”…all lands predominantly used for livestock production, based on criteria decided
upon and explicitly described by the country. Note that not all grasslands are necessarily grazing
lands”).
Pastures that are included in crop rotation are to be included under cropland management. There
are two different figures which could be utilised in the accounting. In the statistics the
pasture/grazing land area is about 80 000 ha but, these are grasses sown less than five years ago,
it is to be assumed that only a small share of these is permanent grazing land. According to the
IPCC definition, permanent grasslands - between 15,000 and 33,000 hectares in Finland - could
be considered as grazing lands. Statistics on these are available from 1995, but the figure for the
baseline year 1990 is lacking.
Page 19
17
4. An analysis of the potential to limit or reduce emissions and to maintain or increase
removals
Land use, land-use change and forestry (LULUCF sector) contributes to the mitigation of climate
change in three different ways:
By protecting and increasing existing carbon storages and sinks
By creating new carbon storages and sinks
By replacing fossil-based energy, raw materials and products with biomass
The LULUCF sector as a whole acts as a net sink in Finland because the emissions under this
sector are smaller than the removals. This net sink can vary greatly from one year to the next: in
the period 1990–2011 it was between 14,5 and 22,1 million tonnes CO2 eq. In 2012, the net sink
was 25,9 million tonnes CO2 eq. The variation is mainly due to changes in forest harvesting
levels.
The studies by Metla indicate that Finnish forests will probably act as a net sink in the future,
too. The objective for the forest carbon sink (incl. trees and soil) set out in the National Forest
Programme (NFP 2015) is to maintain the sink at a level of at least 10–20 million tonnes CO2 eq.
per year up to 2015. The harvesting of wood is targeted to increase by 10–15 million cubic
metres a year in the NFP 2015. The objectives and measures in the Long-term Energy and
Climate Strategy are consistent with the policy defined in the NFP 2015 regarding the increase in
the use of industrial roundwood and energy wood, and they will help achieve the target set by the
directive on promoting the use of energy from renewable sources. The current global economic
downturn will impact on the achievements of the NFP 2015.
In Finland forests are managed and used in a sustainable manner – forests yield many different
benefits and products at the same time and contribute to reaching multiple objectives in a
balanced way. Forest policy, including climate policy relating to forests, is implemented by
means of forest programmes. The strategic goals of the Forest Policy Report 2050 include that
forests are in active, sustainable and diverse use. As regards diverse use it is stated that diverse
management and use of forests contribute to climate change adaptation and control the carbon
balance in forests. Relating to this, one of the measures in the Forest Policy report is to secure the
diversity of forest nature, ecosystem services and ecological and social sustainability of forests.
There is also a measure which aims to increase the use of wood-based energy. The new National
Forest Strategy 2025 to be drawn up during 2014 based on the Forest Policy Report will replace
the National Forest Programmes implemented in the past couple of decades.
At the moment the Finnish forests are growing very strongly and the carbon sink in the growing
stock is also on the increase. Active management and use of forests maintains their growth
potential and carbon sequestration capacity. Wood harvesting and forest management have direct
impacts on the development of forest carbon sinks, with the level and structure of wood
harvesting as the most significant factor. This is why in assessing the trend in the forest carbon
Page 20
18
sink attention is drawn, in particular, to the impact of the different harvesting levels on the size
of the carbon sink. Typically the sink in the forest soil develops in line with that in the growing
stock. Historically mineral soils have been a sink and peatlands a source of carbon. As a whole
forest land soil has in recent years been either a minor source of emissions or almost emissions
neutral. The emission and sink figures for the soil involve a great deal of uncertainty, including
the changes caused by the future climate.
Finnish agricultural policy is based on the view that the competitive disadvantage due to natural
conditions (such as the short growing period, low temperatures, frosts and problematic drainage
conditions) must be compensated for in order to have profitable domestic production and to
make agriculture sustainable and multifunctional. The objectives of sustainable and
multifunctional agriculture include taking into account greenhouse gas emissions, the possible
need for adaptation measures and other environmental and socio-economic aspects. These
objectives can be reached through the Common Agricultural Policy (CAP) of the EU as well as
through national measures.
The potential of mitigation in cropland management and grazing land management activities has
been assessed by the MTT Agrifood Research.2 MTT estimates that CO2 emissions from
agricultural soils are increasing. However, uncertainties associated with estimations of soil CO2
emissions and removals and non-CO2 emissions are still significant. So far studies indicate that
the most efficient measure to reduce emissions from cropland would be to reduce the area of
cultivated organic soils by afforestation. The increase in tree biomass and loss of C from the
afforested peat soil was taken into account in the estimate.
In 2011 the total arable land area in Finland was about 2.4 million ha. Of this 2.1 million ha was
mineral soil and 364,458 ha was organic soil. In 2000 about 15,000 hectares of new arable land
was cleared, of which 18% was peatland. The total area cleared has decreased but the share of
peatland in the cleared area has grown, reaching a peak level of 40% in 2005 (14,000 ha). Since
then the clearing of new arable land has decreased considerably to only 3 – 4 000 hectares a year,
of which about a third has been peatland.
The observed increase in farmland area in central and western parts of Finland is linked to targets
of increasing farm size and productivity in Finnish agriculture, and to developments in the
Common Agricultural Policy (CAP) since 2000, which have resulted in increasing farmland
prices. On the basis of the EU Accession Treaty of Finland, national aid is paid per litre of milk
and per livestock unit, in addition to other CAP payments, of which approx. 90% are payments
per hectare of farmland, and only 10% is linked to livestock production. The national payments
for milk and cattle animals are higher in the more northern regions where the conditions for
production are more difficult than in the southern parts of the country. Milk production has
remained quite stable in the central and northern parts of the country but it has gradually
decreased in southern Finland, while structural change in other livestock farms has been rapid in
all regions (number of livestock farms has approx. halved in 10 years). The proportion of peat
soils is also high in northern regions. The aid payments, together with investment aid paid from
2 Based on the results of MTT Agrifood Research project - Greenhouse gas scenarios for agriculture, forestry and
other land use (GAF), 2013.
Page 21
19
EU Structural Funds, have encouraged the farms to increase their animal numbers, which leads
to a need for additional arable area.
National and EU environmental requirements limit the amount of manure applied on a hectare of
land, which means that a growing farm needs more land not only for feed production but also for
manure spreading. If soil phosphorus (P) status is already high, a livestock farm may need more
farmland area for manure spreading than for feed production, since P fertilization is tightly
restricted by the agri-environmental support scheme implemented in Finland. The differences in
local farmland prices are due to increasing livestock densities. The need for clearing new
farmland area is also related to a short land supply on local farmland markets and small arable
parcel size and scattered location of the parcels, which are obstacles to benefiting from
economies scale even on large dairy farms. Enlarging dairy farms typically suffer from
increasing logistic costs of roughage feed and manure spreading. Land has become more
expensive due to CAP reforms which have increased hectare payments and decreased aid
payments per head of cattle. This, in turn, has resulted in higher land prices and rents and has
inhibited access to land on farmland markets.
Increase in grass cultivation (from 40 to 80 per cent) on the current area of organic cropland
would also be an option to reduce emissions. Since the need for fodder in the country scale is not
increasing, the motivation to increase grass cultivation could arise from growing markets of
bioenergy (grass for biogas production). This could be achieved e.g. by subsidising bioenergy
production from grass biomass.
Subirrigation would lower the emissions efficiently in the beginning, but the increase in the total
area would turn the trend upwards after a few years since the modest mitigation by raised water
table is not enough to counteract the effect of the growing area. Subirrigation could be the easiest
way to reduce the emissions since there are already payments to support it and it is widely
accepted by the farmers. The effect of subirrigation can be estimated for grass area where the
bearing capacity of the peat is the best and the crops are the most flood resistant. However, it
would be possible to use the same technique on the area of annual crops as well if the water table
were lowered before field operations.
Some of the mitigation measures selected for the agriculture sector have potential effects on the
emissions from cropland. The effect of increased rapeseed cultivation (based on the fat increment
for livestock) on soil C stocks is estimated by modelling with the Yasso07 soil carbon model.
The soil C stocks were estimated to increase because the amount of C returned to soils in crop
residues is higher for rapeseed than for barley or silage, which rapeseed mainly replaced in the
scenario used.
Currently the measurements of C stocks of croplands show a decreasing trend and organic
materials suitable for fertilizing mineral soils could be used to reverse this development. The
MTT Agrifood Research used Yasso07 model to estimate the potential of food processing waste
and municipal biowaste to increase mineral soil C stocks. In addition, the use of mineral
fertilizers could be reduced and the emissions from fertilizer industry could diminish. However,
the decrease in domestic consumption is easily compensated for by export of fertilizer products,
and emission savings in the industrial sector were not calculated.
Page 22
20
Biogas production or manure separation together with transport of phosphorus containing the dry
fractions of manure would reduce the need to clear new lands for manure spreading, and this
would show as emission reduction in croplands. However, the effect in 2013-2020 would be
modest since the increase in the area was assumed to stop only from 2015 onwards.
None of the above-mentioned mitigation options would reduce the emissions enough to gain a
net reduction in the period 2013-2020 compared to 1990. Measures on organic soils (area
reduction, grass cultivation and subirrigation) would, however have a significant effect.
Table 3. Predicted net effect of the different mitigation measures in Cropland management in
2013-2020, million tonnes CO2 eq.3
8 x emissions in
1990
Sum of emissions
2013-2020
Net result for the
accounting period
2013-2020
Baseline 45.26 59.04 +13.78
All measures on organic
soils
45.26 53.11 +7.85*
Fat increment for dairy
cows (=increased area of
rapeseed)
45.26 58.88 +13.62
Extensive use of biowaste
as fertilizer
45.26 58.56 +13.30
Biogas/manure separation 45.26 58.57 +13.31
*Since the afforested area is reallocated to forest land the emissions from forest land would increase
by 0.2 Mt on average per year.
5. A list of national measures related to forestry
The sustainable management of forests in Finland is based on legislation, good practices and soft
law instruments such as guidelines for good forest management and certification. Maintaining
the forest carbon sink is part of sustainable forest management, and it is also required as a means
of conforming to the forest management reference level (–19.30 Mt CO2) set for Finland for the
second commitment period of the Kyoto Protocol (2013–2020).
The means for steering the use of forests include legislation, Finland’s National Forest
Programme 2015 (NFP), financing and public forest advisory organisations.
Forest legislation is the most important means of forest policy for ensuring sustainable forestry.
The key acts include the Forest Act and the Act on the Financing of Sustainable Forestry. There
3 Ibid.
Page 23
21
is also legislation on the prevention of forest damage and trade in forest reproductive material,
timber measurement, jointly-owned forests and organisations in the forestry sector. The drafting
of statutes on timber measurement and jointly-owned forests as well as on certain forest
organisations is currently under way in Finland.
The Forest Act sets requirements for felling, as well as for regeneration and the conservation of
certain habitats. For instance, a new seedling stand must be established within three years of the
end of felling. The Forest Act is complemented with guidelines for good forest management and
silviculture, which have been compiled and promoted by public forest advisory organisations.
The drafting of a new Forest Act is under way. The new act is expected to allow for more
diversified management methods, such as uneven aged forest management, and to encourage the
natural regeneration of forests. The guidelines for the sustainable management of forests will be
renewed, parallel to the Forest Act process.
Finland’s National Forest Programme (NFP) is designed to meet the demands set by
international forest policy, and it will have far-reaching effects in Finland. NFP consists of
prioritised goals and actions. NFP actions are connected to renewable energy as well as to
mitigation of and adaptation to climate change, including maintaining the forest carbon sink, and
they have close links to the National Energy and Climate Strategy.
Finland’s National Forest Programme 2015 is based on three objectives
1. Strengthening forest-based business and increasing the value of production;
2. Improving the profitability of forestry; and
3. Strengthening forest biodiversity, environmental benefits, and welfare implications.
The attainment of these objectives is supported by means of several cross-cutting themes:
diversifying and strengthening forest sector know-how; and increasing contributions to
international and EU-level forest policy development.
The NFP is implemented and monitored in broad cooperation between the public and private
sectors. The Ministry of Agriculture and Forestry, supported by the Forest Council, has the
overall responsibility for the programme. The Forest Council includes representatives from
different administrative sectors, industries, NGOs and specialist organisations.
In addition, regional forest programmes include development plans for the whole forest sector of
the regions concerned. They define the needs and objectives for the management of forests,
forest-based businesses and the multiple uses of and protection of forests, and they also suggest
the measures and necessary funding for reaching the objectives.
With regard to contributing to the conservation of biodiversity and the sustainable use of natural
resources, the most important instruments are section 10 of the Forest Act (on preserving
diversity and habitats of special importance) and the policies and measures outlined in the Forest
Biodiversity Programme for Southern Finland 2008–2016 (the METSO Programme), both of
which are an integral part of the range of instruments in the NFP to protect biological diversity of
forests in the future.
Page 24
22
The METSO programme is being implemented jointly by the Ministry of Agriculture and
Forestry and the Ministry of the Environment. In southern Finland, 72 per cent of the forests are
owned by private persons. METSO therefore targets both private and state-owned land, and it
covers the protection and commercial use of forests. The aim is to halt the decline in forest
habitats and species and to establish stable and favourable conditions for forest biodiversity in
southern Finland by 2016. The programme is being implemented through ecologically efficient,
voluntary and cost-effective means. A new Government resolution is being drafted and it will set
goals for METSO up to 2020.
Forestry is a significant income source for forest owners, while it also provides benefits to
society at large. Private and public organisations provide guidance and advisory services for
forest owners. The provision of these services will be facilitated by a new act, which is currently
being drafted. A private forest owner may also receive financial support from the state for forest
management and improvement work. State support encourages measures with long-term impacts.
Managing the natural environment in commercial forests is promoted through environmental
support and forest nature management projects. Public funding for forestry is based on the Act
on the Financing of Sustainable Forestry.
Environmental aid may be granted for additional costs and income losses due to the preservation
and management of habitats of special value. The state also finances forest nature management
projects. The works to be designed and implemented in these projects are defined in further
detail in the legislation. Most of the forest nature management projects have special regional
importance. Apart from habitats of special value, they may concern landscape management,
preventing damage to waters and the restoration of ditched areas.
6. Existing and planned policies and their impact
Existing policies in forestry
The National Forest Programme (NFP) guides national forest policy. The aim of the National
Forest Programme is to meet domestic and international requirements in order to develop
sustainable forest management and protection in such a way that Finland’s forests will provide
its population with as much sources of livelihood as possible. At the same time, the aim is that
Finland’s forests remain healthy, vital and diverse and provide spiritual and physical recreation
for the Finnish people.
Under the NFP 2015, the promotion of sustainable forest management will continue. The role of
forestry in climate change mitigation includes increasing and preserving sinks and substituting
fossil raw materials with renewable ones, especially by increasing the use of renewable energy.
Metla has used MELA and SF-GTM models for calculations. In the NFP 2015 it is estimated that
the carbon sink of forests (incl. trees and soil) will remain at a level of at least 10-20 million
tonnes CO2 eq. per annum by 2015, if logging increases by 10-15 million cubic metres a year as
is targeted and the use of wood for bioenergy will continue as defined in the National Climate
and Energy Strategy and the NFP.
Page 25
23
The Act on the Financing of Sustainable Forestry (1094/1996) entered into force on 1 January
1997. It lays down the provisions on state funding for measures to promote the sustainable
management and use of private forests as specified in the Forest Act (1093/1996). The act and
statutes issued under it have been amended several times. Funding under the Act on the
Financing of Sustainable Forestry has been divided into four groups: securing sustainable wood
production, maintaining forest biodiversity, forest nature management projects, and other
measures in support of these actions.
In 2011–2013 the state supported the promotion of sustainable forest management through
silviculture and forest improvement measures by 76–83 million euros a year. Of this 13–14
million euros were used for planning and feasibility studies 63–71 million euros for the costs of
the works undertaken. Of the annual appropriation more than 40% has been used for the tending
of young stands and harvesting and chipping of energy wood. The total amounts of financial
support for the harvesting and chipping of energy wood have increased considerably starting in
2008. By 2012 the amount of support paid for this has doubled from the amount in the beginning
of this millennium. The support for chipping was applicable for a fixed term, and the last
decisions on granting this were made at the end of 2012. Over the past three years the amount
used for environmental support and nature management projects has fallen to about a half. In
2013 a total of 4.385 million euros were used for environmental support and 1.312 million for
nature management projects.
In 2008–2012 heat and power plants used, on average, six million cubic metres of forest chips,
which corresponds to 12 TWh of energy. Forest chips have substituted for the use of peat, in
particular, and to some extent also coal. As a whole the share of chips from small diameter wood
accounted for 47% of the chips used in heat and power plants in 2012. In 2013 a total of 1.7
million cubic metres of small diameter wood were harvested by means of support under the Act
on the Financing of Sustainable Forestry, and a total of 12 million euros were granted as support
for this purpose. The impact of the growing use of forest chips on the reduction of carbon
dioxide emissions can be assessed relative to the use of fossil energy sources. When looking at
the statistics from 2011 and 2012, for example, we can see that, while the use of forest chips has
been growing, the use of fossil fuels has decreased. Carbon dioxide emissions from energy
production and use fell by about 11% from 2011 to about 46.4 million tonnes CO2 eq. The
decrease in the emissions was partly due to the decrease in the use of fossil fuels in electricity
and heat production.
In addition, the government and stakeholders continue to carry out joint initiatives to promote the
use of wood as a renewable material, thus also contributing to climate change mitigation. The
impact of Harvested Wood Products varies annually. The estimation of the impact of Harvested
Wood Products (HWP) in the 2009 inventory was 1,76 million tonnes CO2 eq. source and in the
2010 inventory 0,41 million tonnes CO2 eq source.
According to the National Forest Inventory, the annual increment of the growing stock has been
increasing since the 1970s to its current level of 104 million cubic metres, of which 97 million
cubic metres is in commercially managed forests.
The national measures set out in the NFP 2015, which are consistent with the Energy and
Page 26
24
Climate Strategy, include implementing the following measures in order to secure the climatic
benefits provided by forests and to ensure the availability of renewable raw materials:
Producing forecasts of the forest damage risks associated with climate change,
developing the forest damage monitoring system, improving preparedness plans for forest
and other damages, and coordinating efforts among the authorities;
Factoring in the effects of the carbon sink and measures for improving harvesting
conditions, and including the vitality of forests in revised forest management
recommendations and guidelines as well as in the provision of advice and guidance;
Implementing the Functioning of Forest Ecosystems and Use of Forest Resources in
Changing Climate Research Programme (concluded 2012) and the Finnish Research
Programme on Climate Change (FICCA) 2011–2014;
Exploring models of operation for trading or leasing carbon sinks as well as for other
means of increasing carbon sequestration in forests;
Promoting the carbon sink effects of forests and the carbon stored in wood products in
negotiations on the UNFCCC.
The current NFP will be revised in 2014 based on a report on forest policy and long-term
strategic guidelines given by the Parliament. The report will contain future images and scenarios
along with a long-term vision and strategic objectives towards 2050.
Implementation of Articles 3.3 and 3.4 of the Kyoto Protocol
Articles 3.3 and 3.4 of the Kyoto Protocol concern emissions and removals from land use, land-
use change and forestry (LULUCF) activities. Article 3.3 activities (afforestation, reforestation
and deforestation) are based on land-use changes, and reporting these activities is mandatory for
the Kyoto Protocol Parties. Under Article 3.4, the selection of activities (forest management,
cropland management, grazing land management and revegetation) is voluntary for the Parties
during the first commitment period. The Finnish Government has decided to apply Article 3.4 of
the Kyoto Protocol regarding forest management (FM) in the first commitment period. This
enables Finland to compensate for net emissions resulting from Article 3.3 activities and to
provide removal units (RMUs) worth up to 0,59 million tonnes CO2 eq. per year. The accounting
for the emissions and removals under Article 3, paragraphs 3 and 4 will be done at the end of the
commitment period.
Based on a study by Metla, Article 3.3 activities are estimated to cause net emissions for the
period 2008–2012. This is due to land-use changes as a result of converting forest land to other
land uses as well as low carbon sequestration rates in areas afforested or reforested since 1990.
During the period 2008–2011, the emissions were, on average, 3,6 million tonnes CO2 eq. per
year. Net emissions from Article 3.3 activities were 2,3 million tonnes CO2 eq. in 2012.
Land-use change from forest land to other land uses is difficult to avoid in a country where
forests cover 73 per cent of the land area. The change is mostly driven by settlements and
infrastructure (e.g. roads and transmission lines). The estimations still include high degrees of
uncertainty and will become more accurate as the calculation methods are further developed.
Page 27
25
In line with Article 3.4, the FM net sink between 2008 and 2012 has been approximately 39.6
million tonnes CO2 eq. per year. Net removals from forest management vary significantly based
on the overall economic situation. In 2009, the sink was 47 million tonnes, whereas in 2008 it
was 36 million tonnes. The NFP 2015 estimates that the annual carbon sink of forests (incl. trees
and soil) will remain at a level of at least 10–20 million tonnes CO2 eq. by 2015 if logging
increases by 10–15 million cubic metres a year, as is currently projected. The policy defined in
the NFP regarding the increase in industrial roundwood and energy wood is consistent with the
climate and energy strategy and it will help to achieve the target set by the directive on
promoting the use of energy from renewable sources.
It is estimated that forest management will be a sink for the entire duration of the first
commitment period and, therefore, Finland expects to receive a total of 2.95 million tonnes
worth of RMU units (0.59 million tonnes/year, i.e. the maximum cap).
The potential of cropland management and grazing land management activities has been assessed
by the MTT Agrifood Research. It estimates that CO2 emissions from agricultural soils are
increasing. However, uncertainties associated with estimations of soil CO2 emissions and
removals and non-CO2 emissions are still significant and, therefore, agricultural activities under
Article 3.4 were not selected for the period 2008–2012.
The information provided in Chapter 5 regarding how the Forest Act and METSO Programme
contribute to the conservation of biodiversity and the sustainable use of natural resources is also
applicable to lands under Articles 3.3 and 3.4 of the Kyoto Protocol. Detailed information on
Kyoto Protocol activities under Articles 3.3 and 3.4 is presented in Finland’s latest National
Inventory Report under the UNFCCC and the Kyoto Protocol.
For the second commitment period of the Kyoto Protocol, forest management will become a
compulsory activity and the accounting will be based on a reference level (RL) approach.
Finland´s RL is an average value of the projected removals and emissions for the period 2013–
2020 and it is based on the Climate and Energy Strategy as well as the National Forest
Programme (NFP 2015). The FMRL for 2013–2020 is –19.30 million tonnes CO2 eq. and –20.4
million tonnes CO2 eq., including harvested wood products (HWP).
Planned policies in forestry
A new national forest strategy 2025
A new National Forest Strategy is being prepared during 2014. The measures under the strategy
extend until 2025. The objectives of the strategy preparation include specification of the
objectives for the use of wood, improving the health and productive capacity of forests through
diverse management and use, and increasing the use of wood for energy.
The financing of sustainable forestry is being revised. In the preparation the new EU State aid
guidelines have been taken into account to the extent this has been possible on the basis of the
draft guidelines available during the preparation process. Based on the results so far, the
envisaged measures to be supported include forest regeneration, tending of young stands,
Page 28
26
remedial fertilization, preventing annosus root rot, management of peatland forests, private road
improvement and construction of new forest roads. Funding could also be granted for
environmental support and nature management projects as well as support for nature values, if
this will be allowed by the new State aid guidelines.
The government and stakeholders will continue to carry out joint initiatives to promote the use of
wood as a renewable material that also contributes to climate change mitigation. The impact of
harvested wood products on emissions varies annually. In the most recent inventory, harvested
wood products were estimated to be a source of 0,65 million tonnes CO2eq. In the reference level
calculations for the second commitment period of the Kyoto Protocol, the harvested wood
products are a sink of 1,1 million tonnes CO2 eq.
Existing policies in agriculture
Finnish agricultural policy is based on the view that the competitive disadvantage due to natural
conditions (such as the short growing period, low temperatures, frosts and problematic drainage
conditions) must be compensated for in order to have profitable domestic production and to
make agriculture sustainable and multifunctional. The objectives of sustainable and
multifunctional agriculture include taking into account greenhouse gas emissions, the possible
need for adaptation measures and other environmental and socio-economic aspects. These
objectives can be reached through the Common Agricultural Policy (CAP) of the EU as well as
through national measures. According to conclusions also made by the European Council,
agricultural production should continue in all areas of the Community.
The most effective climate policy measures can conflict with agricultural policy objectives and
measures, such as securing the availability of food and animal welfare and reducing the load on
waters. If Finnish consumption patterns remain unchanged, a reduction in domestic agricultural
production would probably not reduce global greenhouse gas emissions because domestic
production would be replaced by production elsewhere.
There are measures in the CAP to reduce greenhouse gas emissions. Agri-environmental
payment is an essential tool for promoting sustainable development in agriculture.
Approximately 90 per cent of Finnish farmers have participated in the support scheme. Agri-
environmental payment is part of the Rural Development Programme for Mainland Finland
2007–2013, which is based on a Council regulation. The objectives of the programme are to
decrease nutrient load on the environment, especially on surface waters and groundwater, and to
preserve biodiversity and the rural landscape. The measures also aim to maintain or improve the
productive capacity of agricultural land and reduce greenhouse gas emissions to meet these
targets. The Rural Development Programme for Mainland Finland is being renewed for the time
period 2014–2020. Similar actions as were taken in the period 2007–2013 will be planned for the
next programming period.
Planned policies in agriculture
Finnish agricultural policy is guided by the Common Agricultural Policy (CAP) of the EU as
well as national measures. The Rural Development Programme for Mainland Finland 2014-2020
Page 29
27
is an essential tool for promoting sustainable development in agriculture. Agri-environmental
payment is a part of the programme. Approximately 90 per cent of Finnish farmers have
participated in the support scheme.
As from 2015 new environmental requirements will be incorporated into the single payments
under the Common Agricultural Policy of the EU. 30 per cent of the direct payments are tied to
the so-called greening. There are three greening measures that the farmers must implement in
their eligible area.
1) Crop diversification: at least two cultivated crops on farms with an area of 10-30 hectares of
arable land and three crops on farms with over 30 hectares of arable land. By derogation, only
two crops are required on farms with over 10 ha on farms located in support area C. The rule
does not concern farms with over 75 per cent of grass and/or fallow if the arable area in use is
not more than 30 hectares.
2) Preserving permanent grassland; in the whole country the area of permanent grassland may
not decrease by more than 5%; also preservation requirement for grasslands in the Natura areas.
3) Requirement concerning ecological focus area: the minimum of 5% of the area of the farm
must be so-called ecological focus area (e.g. fallow, nitrogen-fixing plants and short-rotation
energy wood). The required share may increase to 7% in 2018. Possible derogations for areas
and farms that meet certain requirements (e.g. areas dominated by forest and farms with mostly
grassland and/or fallow).
Rural Development Programme
A draft for the Rural Development Programme for Mainland Finland 2014-2020 has been sent to
the Commission this spring. In the draft programme there are several measures for climate
change mitigation and adaptation: environment payment for incorporation of slurry, recycling of
nutrients and organic matter, environment management grassland, plant cover on arable land in
winter and use of organic mulch for horticulture crops and seed potato increase the amount of
carbon in arable soil. Agricultural investment aid may be targeted to controlled subsurface
drainage and more efficient handling, storage and use of manure. Whether there is enough
funding available for the different purposes depends on the numbers of applications submitted.
Page 30
28
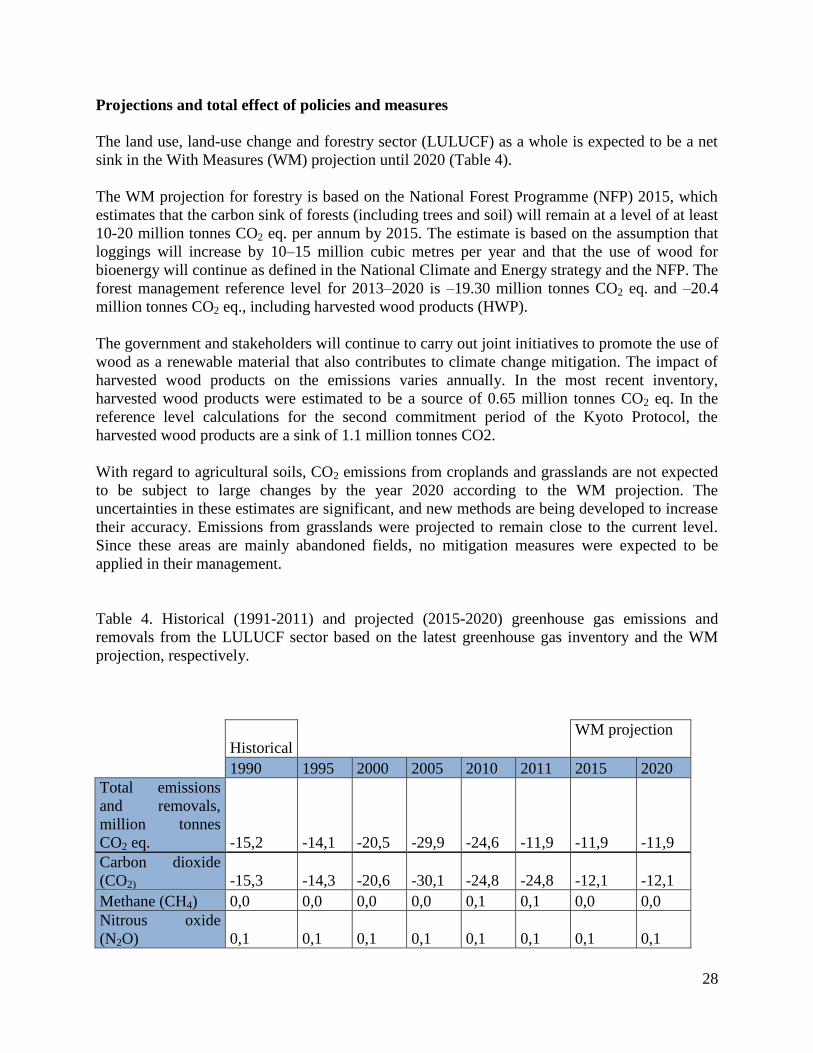
Projections and total effect of policies and measures
The land use, land-use change and forestry sector (LULUCF) as a whole is expected to be a net
sink in the With Measures (WM) projection until 2020 (Table 4).
The WM projection for forestry is based on the National Forest Programme (NFP) 2015, which
estimates that the carbon sink of forests (including trees and soil) will remain at a level of at least
10-20 million tonnes CO2 eq. per annum by 2015. The estimate is based on the assumption that
loggings will increase by 10–15 million cubic metres per year and that the use of wood for
bioenergy will continue as defined in the National Climate and Energy strategy and the NFP. The
forest management reference level for 2013–2020 is –19.30 million tonnes CO2 eq. and –20.4
million tonnes CO2 eq., including harvested wood products (HWP).
The government and stakeholders will continue to carry out joint initiatives to promote the use of
wood as a renewable material that also contributes to climate change mitigation. The impact of
harvested wood products on the emissions varies annually. In the most recent inventory,
harvested wood products were estimated to be a source of 0.65 million tonnes CO2 eq. In the
reference level calculations for the second commitment period of the Kyoto Protocol, the
harvested wood products are a sink of 1.1 million tonnes CO2.
With regard to agricultural soils, CO2 emissions from croplands and grasslands are not expected
to be subject to large changes by the year 2020 according to the WM projection. The
uncertainties in these estimates are significant, and new methods are being developed to increase
their accuracy. Emissions from grasslands were projected to remain close to the current level.
Since these areas are mainly abandoned fields, no mitigation measures were expected to be
applied in their management.
Table 4. Historical (1991-2011) and projected (2015-2020) greenhouse gas emissions and
removals from the LULUCF sector based on the latest greenhouse gas inventory and the WM
projection, respectively.
Historical
WM projection
1990 1995 2000 2005 2010 2011 2015 2020
Total emissions
and removals,
million tonnes
CO2 eq. -15,2 -14,1 -20,5 -29,9 -24,6 -11,9 -11,9 -11,9
Carbon dioxide
(CO2) -15,3 -14,3 -20,6 -30,1 -24,8 -24,8 -12,1 -12,1
Methane (CH4) 0,0 0,0 0,0 0,0 0,1 0,1 0,0 0,0
Nitrous oxide
(N2O) 0,1 0,1 0,1 0,1 0,1 0,1 0,1 0,1
Page 31
29
7. Literature and links
6th National Communication of Finland to the UNFCCC
http://unfccc.int/national_reports/annex_i_natcom/submitted_natcom/items/7742.php
First Biennial Report of Finland to the UNFCCC
https://unfccc.int/national_reports/biennial_reports_and_iar/submitted_biennial_reports/items/75
50.php
2014 National Inventory Report under the UNFCCC and the Kyoto Protocol
http://unfccc.int/national_reports/annex_i_ghg_inventories/national_inventories_submissions/ite
ms/8108.php
Submission of information on forest management reference levels by Finland
http://unfccc.int/files/meetings/ad_hoc_working_groups/kp/application/pdf/awgkp_finland_2011
.pdf
Finland´s National Forest Programme (NFP) 2015
http://www.mmm.fi/en/index/frontpage/forests2/nfp.html
Governments´s Forest Policy Report 2050 to Parliament on 6 February. Currently only
available in Finnish.
http://www.mmm.fi/attachments/metsat/metsapoliittinen_selonteko/eWot83KZh/Metsapol_selon
teko_netti_suomi.pdf
National Energy and Climate Strategy (2013). Government Report to Parliament on 20
March 2013
https://www.tem.fi/files/36292/Energia-
_ja_ilmastostrategia_nettijulkaisu_ENGLANNINKIELINEN.pdf
Draft for The Rural Development Programme for Mainland Finland 2014-2020
http://www.maaseutu.fi/attachments/ohjelmakausi_2014-2020/WCzWJXipB/Luonnos4_Manner-
Suomen_maaseudun_kehittamisohjelmaksi_2014-2020_15.4.2014.pdf
Greenhouse gas scenarios for agriculture, forestry and other land use (GAF) – project
2013. MTT Agrifood Research Finland.
Page 32
30
https://portal.mtt.fi/portal/page/portal/mtt/tutkimus/Hankehaku/Hankkeentiedot?p_kieliko
odi=FI&p_hanke_seqno=381664
Page 33
31
Annex. Summary of the policies and measures in the LULUCF and agriculture sectors as
described in Finland´s 6th
National Communication.