61
Market Perspectives November 2016 Nov. 16 th , 2016 www.finlightresearch.com “There is nothing more dangerous than a market of fully invested bears.”
| Date post: | 15-Apr-2017 |
| Category: |
Economy & Finance |
| Upload: | finlight-research |
| View: | 26 times |
| Download: | 0 times |

Market PerspectivesNovember 2016
Nov. 16th, 2016
www.finlightresearch.com
“There is nothing more dangerous than a market of
fully invested bears.”

“Patience is not just about waiting for
something… it's about how you wait, or
your attitude while waiting.”– Joyce Meyer
2FinLight Research | www.finlightresearch.com

Executive Summary: Global Asset Allocation
� The passing of the US election has taken a key event risk off the table.But markets continue to digest the implications of Mr Trumps surprisevictory.
� Trump’s victory has triggered a global sell-off in equities, credit and oil,and a jump in volatility. All these moves have been short lived andreversed the day after.
� Market optimism was driven by the prospect of large fiscal stimulus,infrastructure spending and a Republican control of both Houses. Noone seems warried anymore about the downside risk from an escalationin protectionism and global populist backlash.
� On the surface, the global economy is getting better. But, investorsshould avoid complacency in such an uncertain environment
� Our focus is 3Q earnings season, rising wages and their impact onmargins, expected inflation and volatile volatility.
� Earnings had already been on an improving trend, with a number of keysectors showing a dramatic turnaround. Expected inflation is ticking up.Global bond yields too.
� Not much has changed in our expectations, except for Govies andenergy
� We summarize our views as follows �
3FinLight Research | www.finlightresearch.com
MACRO VIEW
� The Good� US Election uncertainty is over.� US 3Q GDP has grown 2.9%, well above the 1.1% average growth of 1H-2016.� Global Manufacturing PMI reports improved across the board in October, going against all
recession talks. China's manufacturing PMI for the month of October recorded its highest level in 2 years (51.2)
� Personal income and spending were up 0.3% and 0.5% respectively� Michigan sentiment is getting better with a reading of 91.6
� The Bad� Industrial Production in China slipped to 6.1%, from an expected 6.8%� Durable goods orders appear extremely weak, pointing to a late-cycle economic stage.
� The Ugly � Main systemic risk resides in China: Chinese debt bomb is ticking. Debt is used to create the
illusion of growth. The Chinese banking sector is going to end up needing a bailout.� The hard Brexit risk should be monitored closely.� Something huge is probably gathering in Japan: Abenomics has failed! Contrary to every
economic theory, debt accumulation, debt monetization and record amounts of currency creation have resulted in a rising yen and falling prices.
4FinLight Research | www.finlightresearch.com

5FinLight Research | www.finlightresearch.com
The Big Four Economic Indicators
� The current picture is characterized by relatively strong Employment and Income, a weak Industrial Production (probably in recovery mode since its Mar ‘16 lows) and Real Retail Sales hovering around a flat line.
� The average of these indicators has been trending lower since Nov. ‘14, suggesting that the economy is still moving sideways. Industrial Production has been the weakest link in the economic recovery since the GFC. But the picture has been getting mildly better since June.

6FinLight Research | www.finlightresearch.com
GS – Global Leading Indicator (GLI)
� The October Final GLI came inat 3.0% yoy (up from 2.8% inSeptember). Its MoMmomentum came at 0.29%(slightly down from its lastmonth’s 0.31%)
� The October GLI reading is back in economic slowdown area.
� Seven of the ten underlying components of the GLI improved in August.
� Despite the better shape ofGLI momentum, we continueto think that the accelerationwe’ve been witnessing sinceJan. ‘15 is quite modest fora typical expansion phase
7FinLight Research | www.finlightresearch.com
US GDP Growth
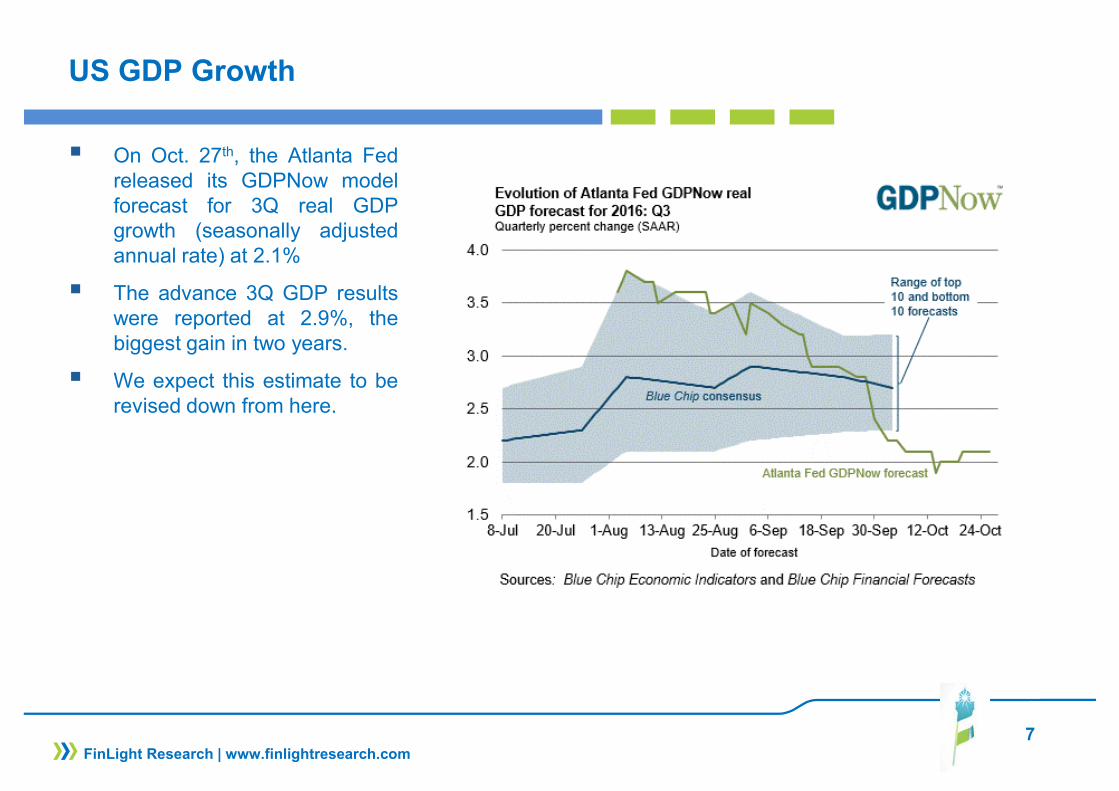
� On Oct. 27th, the Atlanta Fedreleased its GDPNow modelforecast for 3Q real GDPgrowth (seasonally adjustedannual rate) at 2.1%
� The advance 3Q GDP resultswere reported at 2.9%, thebiggest gain in two years.
� We expect this estimate to berevised down from here.
8FinLight Research | www.finlightresearch.com
US Capital Goods Orders
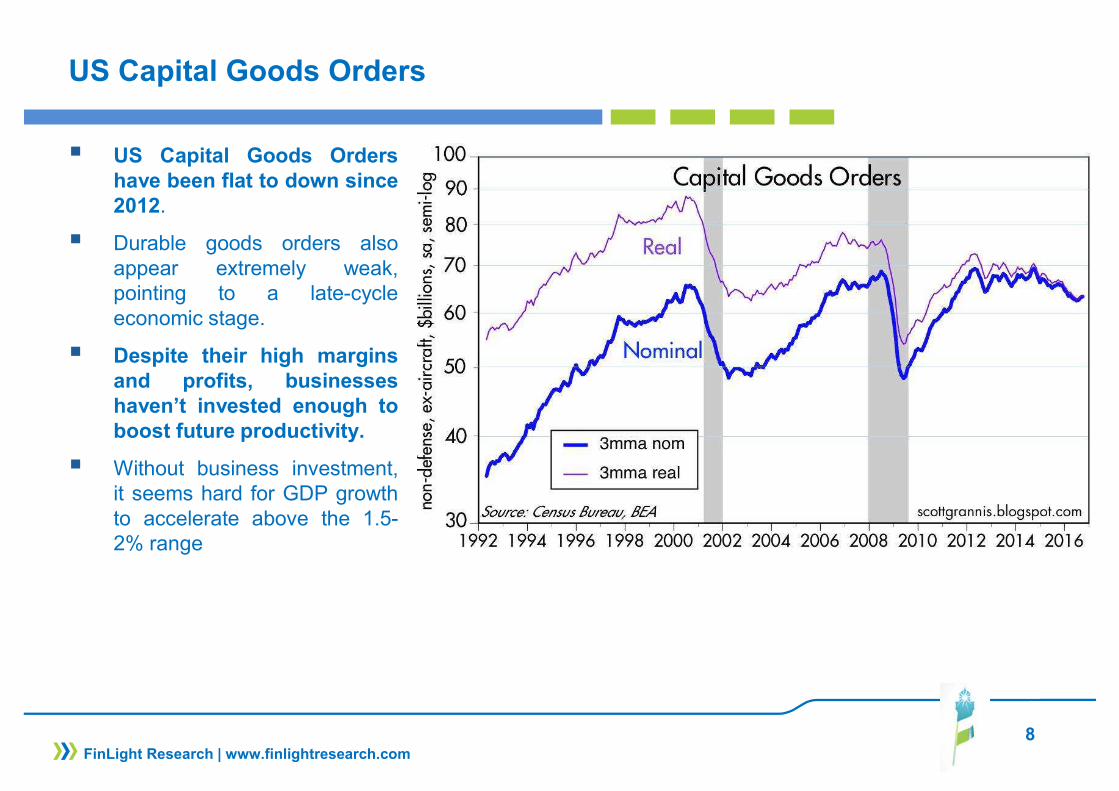
� US Capital Goods Ordershave been flat to down since2012.
� Durable goods orders alsoappear extremely weak,pointing to a late-cycleeconomic stage.
� Despite their high marginsand profits, businesseshaven’t invested enough toboost future productivity.
� Without business investment,it seems hard for GDP growthto accelerate above the 1.5-2% range
9FinLight Research | www.finlightresearch.com
US Employment
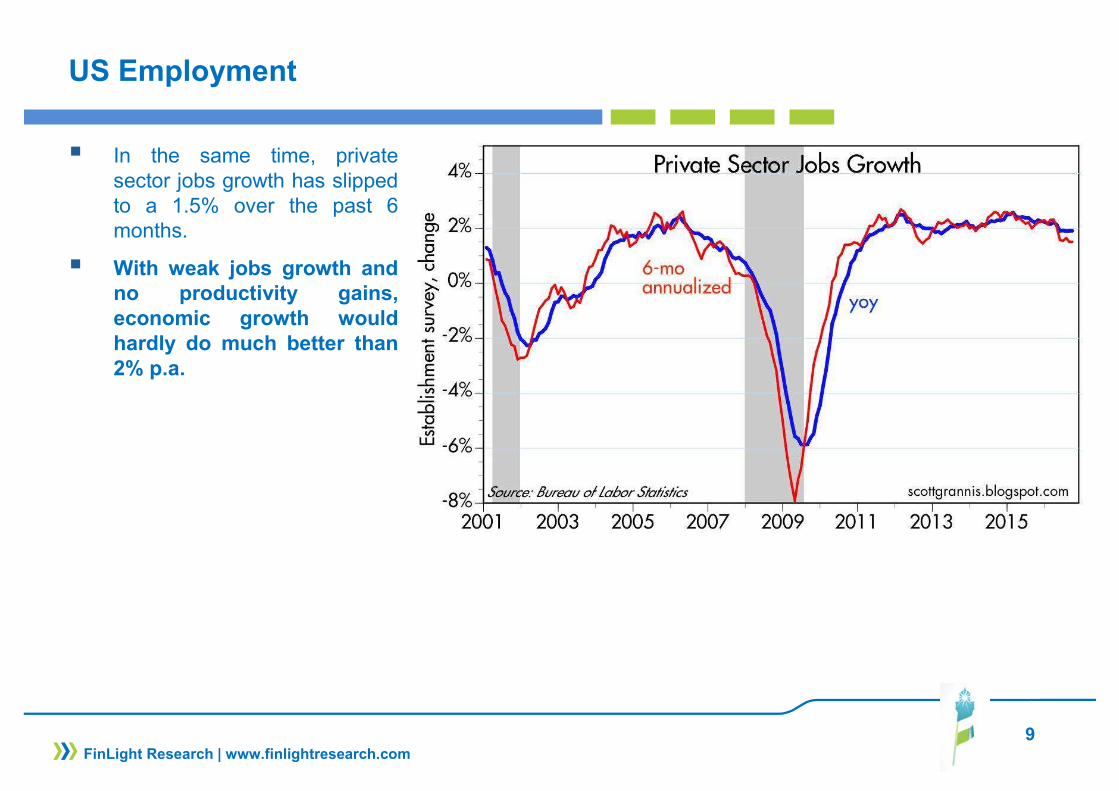
� In the same time, privatesector jobs growth has slippedto a 1.5% over the past 6months.
� With weak jobs growth andno productivity gains,economic growth wouldhardly do much better than2% p.a.

10FinLight Research | www.finlightresearch.com
US Labor Cost
� The US labor market is late in the cycle and should drive wages up.
� YoY growth in average hourly earnings rose to 2.8% in October, its highest level since May 2009!
� Higher labor costs would weigh on corporate margins and already stagnating productivity.
� Inflation is probably the next indicator to watch at.

11FinLight Research | www.finlightresearch.com
Inflation Expectations
� Forward inflation has picked up in recent weeks.
� The move has been accentuated by the surprise victory of Mr. Trump, given his announced policy of fiscal spending and trade protectionism.
� The policy mix has shifted in the direction of more inflation
� The reflation trade is finally back!

12FinLight Research | www.finlightresearch.com
EQUITY
� Our equity outlook remains cautious. We see the market more vulnerable than ever to growth,earnings and policy disappointments.
� The US equity valuation picture has hardly changed since last quarter. Whatever metrics we consider, US stocks look expensive, making the pressure to deliver a positive earnings growth very substantial
� Trump’s victory has triggered a global sell-off in equities, credit and oil, and a jump in volatility. All these moves have been short lived and reversed the day after
� Earnings momentum is picking up in Q3. The earnings picture, while slightly worsened by energy, looks fine, even if many firms have commented on the potential risk to profit margins from higher wages
� US equities seem priced for a rebound in earnings growth, but hardly for a stronger dollar, nor for higher treasury yields…
� Equity risk premium for US stocks has declined with Trump’s victory, which seems at odds with the lack of certainty we have on the new president’s economic plans…
� We still think that key fundamental data will eventually matter… in a BIG BIG way. For now, investorsare buying the rumor of better future earnings. One day, they will be selling the news of bad effectiveearnings.

13FinLight Research | www.finlightresearch.com
EQUITY
� We remain Neutral on S&P 500 but with a bearish bias as we see headwinds from the resumption ofthe Fed rate hike cycle and a strong Dollar.
� We remain UW Europe into year-end because of elevated political uncertainty (from Brexit and theItalian referendum) and uncertainty on ECB policy
� Nevertheless, we believe equities are likely to outperform bonds over the next 12 months

14FinLight Research | www.finlightresearch.com
EQUITY
� The main question: Is the market consolidating gains, or is that a top forming?
� Our scenarios are unchanged.
� Our main scenario from here (70% chance) : A massive top forming around 2170-2190� Equities remain expensive, earnings growth poor and profit margins are showing increasing
evidence of peaking. On Price/Sales metric, equities are trading at the top of the historical range. � A resumption of earnings growth going into 2017 will be necessary for equities to move higher.
� Our alternative scenario (30% chance) : The S&P500 breaks the 2170-2190 resistance, opening the way to 2225 - 2300. Such a breakout would need a new round of stimulus and/or a new impulse to macro fundamentals
� A pull back below 2060 is needed in order to confirm our primary scenario!� Above 2200-2225, we’ll be obliged to recognize the alternative scenario is in.

15FinLight Research | www.finlightresearch.com
EQUITY
� Bottom line :� De-risking should continue. A higher allocation to cash is sensible in this late-stage stock bull.� We adjust our positioning rules on the S&P 500 as follows:
� We remain Neutral above 2090� To switch to OW again, we need a material break higher than 2170 - 2190� We will switch to UW as soon as the 2090 level is materially broken to the downside. � Any clean break below the ‘09 trend would make us move massively UW
� We like the low US beta. We remain Neutral Japan and UW Europe vs. US.
� We remain UW in US small caps vs large caps. � We expect the rising trend in bond yields and inflation to hurt defensives and support the
outperformance of cyclicals. But given their relative valuation, we choose to stay OW defensives vs. cyclicals
� We also move Neutral value vs growth stocks.
� In our previous report, we expressed the view that low vol/min vol stocks are increasingly vulnerable. We maintain this view.
� A stronger USD, rising yields and a potential headwind to global trade (with more protectionism) are expected to hurt the relative performance of EM. LatAm is the most vulnerable EM region to these factors, specially US dollar strengthening. We remain UW EMs vs DMs.

16FinLight Research | www.finlightresearch.com
US Earnings
� The S&P500 is finally getting out of its earnings recession.
� For Q3 2016, the blended earnings growth rate for the S&P 500 is 2.9% (+6.2% if the Energy sector is excluded). If the index reports growth in earnings for the quarter, it will mark the first time the index has seen year-over-year growth in earnings since Q1 2015 (0.5%).
� For all of 2016, the estimated S&P 500 growth rate is now projected at +0.2% for earnings and +2.2% for revenues
� The forward 12-month P/E ratio is now 16.7, which is well above the 5-year (15.0) and 10-year (14.3) averages.
� Analysts still expect earnings growth to return in Q4 2016

17FinLight Research | www.finlightresearch.com
US Earnings
� The earnings picture, while slightly blemished by energy, seems to be on a good trend from here.

18FinLight Research | www.finlightresearch.com
S&P500 – A Long-Term Perspective
� Equity markets still appear at lofty valuations on virtually any and every historical valuation metric
� At the end of October, the average of the 4 indicators we use stands at 71%, not far below its interim peak of 78% in Feb. ‘15
� All these indicators suggest a cautious long-term outlook and weak long-term return expectations � These measures are consistent with flat (0%) 12 year S&P 500 nominal total returns

19FinLight Research | www.finlightresearch.com
S&P500 – A Long-Term Perspective
� Indicators like P/E10 ratio (26.5) and Real S&P distance from its LT trend (85%) are also pointing to sky high valuations;

20FinLight Research | www.finlightresearch.com
S&P500 – Equity Risk Premium
� The only long-term relative value measure that is still (seemingly) bullish is provided by the gap between dividend yields and treasury yields
� If government yields increase (which is our main scenario), the S&P 500 is bound to decline in order to continue offering the same risk premium. Higher interest rates will clearly lower the demand for high-yielding stocks.
� Equity risk premium for US stocks has declined since Trump’s victory. We feel concerned about this drop given the uncertainties surrounding Trump’s economic plans.

21FinLight Research | www.finlightresearch.com
S&P500 – A Medium-Term Perspective
� The run up in S&P500 since just before US elections, has been impulsive.in nature.
� In a few days, the index was able to break its series of lower highs since August
� The levels to watch from here are : the trendline through the lows since Feb. ‘16 (currently around 2180) and the 200-dma (currently around 2090).
� Reintegrating the uptrend since Feb lows would give a clearly bullish signal.

22FinLight Research | www.finlightresearch.com
S&P500 – A Short-Term Perspective
� After a long period of inactivity, our prop. Short-Term trading model has switched to mildly short since Nov 7 (@ 2131).
� 5 systems are targeting a break below 2103, 2083 and 2062. Next level to watch on the upside: 2189� Bottom line: Mildly bearish
0
0.25
0.5
0.75
1
1900.0
1950.0
2000.0
2050.0
2100.0
2150.0
2200.0
2250.0
2300.0
11
2
37
5
35
6
10
0
22
4
34
3
32
8
33
3
35
1
26
9
17
2
34
0
27
1
37
3
25
0
28
5
16
5
16
4
21
7
25
4
17
7
40
0
34
31
Up
Pro
ba
& N
ex
t M
ove
(1
=U
p / 0
=D
ow
n)
Lo
we
r/U
pp
er
Bo
un
d
System ID
LowerBound
UpperBound
Next Digit UpProba
600.0
800.0
1000.0
1200.0
1400.0
1600.0
1800.0
2000.0
2200.0
2400.0
39000.0
41000.0
43000.0
45000.0
47000.0
49000.0
51000.0
53000.0
janv.-06 sept.-08 juin-11 mars-14 déc.-16
S&
P 5
00
NA
V
Quant Model
S&P500

23FinLight Research | www.finlightresearch.com
S&P500 – Short-Term Breadth
� As a result of the US election, the downtrend line in 50-dma breadth has been broken to the upside. This is unambiguously a bullish ST signal.

24FinLight Research | www.finlightresearch.com
US Stocks – VIX Indicators
� Our long volpositioning hasproved to beprofitable.
� The VIX is now backto its “relaxed” levels.
� The same is true forthe VXV-VIX ratio: thefutures curve slopehas rebounded fromits lows (panic levels),but hasn’t reached yeteuphoric levels.
� The Trump’s victoryinduced move is goingtoo high to fast.
� We keep an eye onboth indicators,looking forcomplacency.
25FinLight Research | www.finlightresearch.com
US Stocks – Tail Risk Hedging
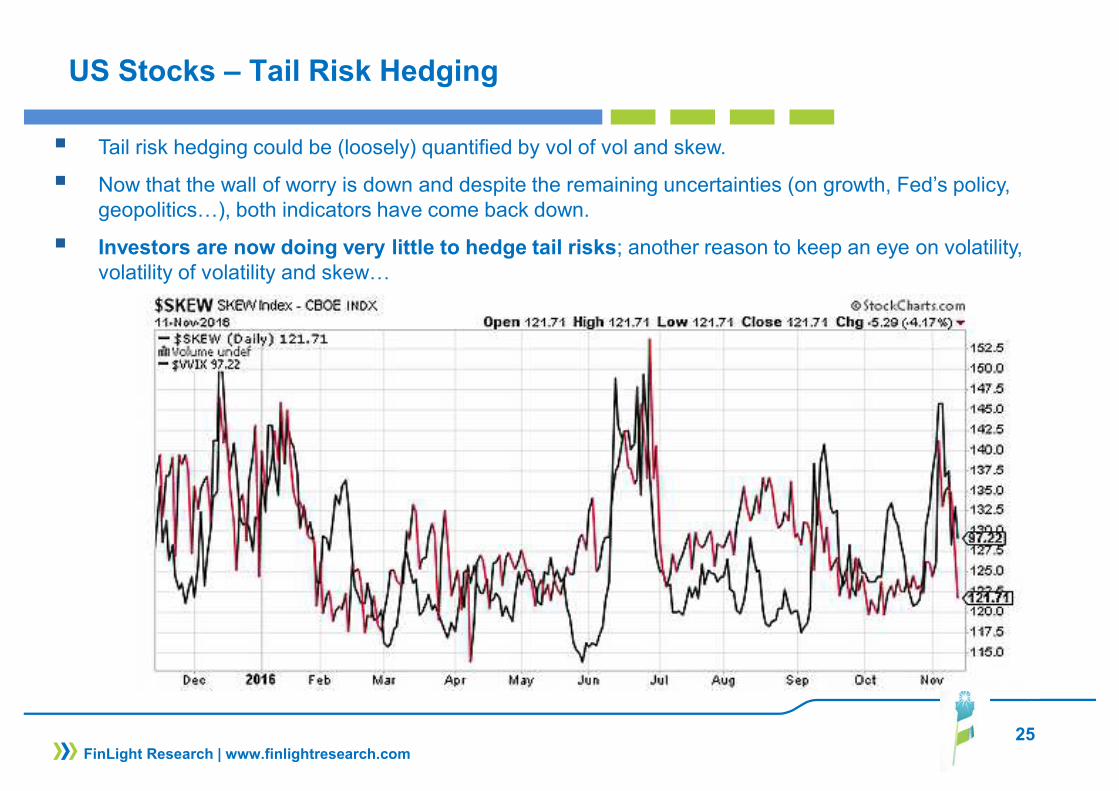
� Tail risk hedging could be (loosely) quantified by vol of vol and skew.
� Now that the wall of worry is down and despite the remaining uncertainties (on growth, Fed’s policy, geopolitics…), both indicators have come back down.
� Investors are now doing very little to hedge tail risks; another reason to keep an eye on volatility, volatility of volatility and skew…

26FinLight Research | www.finlightresearch.com
Stocks, Earnings and IPOs
� In the past 2 years, more than 70% of companies that went into IPOs had negative earnings.
� Its similar to the 2000 bubble, but fortunately on lower volumes.
� Most of this distortion is due to the biotech sector.

27FinLight Research | www.finlightresearch.com
US Stocks – Growth vs Value
� Value stocks have been outperforming Growth stocks since Feb. ‘16
� Market-neutral value factor has posted its best month since 2014
� This is typical of optimistic times with investors becoming more positive on the economy and the market.
� We are now more cautious about this move as we see a lot of question marks around growth, yields, US dollar and Fed’s policy.
� We move from OW to Neutral on value stocks vs growth stocks.
Source: Goldman Sachs

28FinLight Research | www.finlightresearch.com
US Stocks – Cyclicals vs Defensives
� The rally in Cyclicals that began mid-year has been accentuated by Trump’s surprise election.
� The move was driven by Financials versus Utilities.
� The move may be explained by rising inflation expectations, rising interest rates, better growth perspectives, more fiscal spending and potentially reduced regulation under Trump’s administration.
Source: Goldman Sachs

29FinLight Research | www.finlightresearch.com
US Stocks – Cyclicals vs Defensives
� Looking forward, Cyclicals outperformance may persist.
� However, and given Cyclicals relative (extreme) over-valuation vs. Defensives, we stay OW defensives vs. cyclicals
Source: Goldman Sachs

30
FIXED INCOME & CREDIT
GOVIES
� Bonds had their worst month in a while. Ten-year US Treasury yields jumped by nearly 40 bp this week and now yield 2.2%, up from 1.8% at the end of last week.
� Yields were led by a bounce in inflationary expectations, a more resilient economic growth, and the potential for an increase in the volume of debt issuance needed to fund more planned fiscal spending. Expectations of a more hawkish Fed have also lifted real rates.
� We continue to expect the Fed to hike in December, followed by two or three hikes in 2017
� We’ve turned to UW on 10y-USTs since the 1.85 resistance was breached.
� The sell-off in Govies should continue as bond valuations are still stretched, inflation is expected to rise, and Central Banks outlook appears less supportive for duration. ECB/BoJ QE programs may be replaced by fiscal policies.
� We also expect the curve to steepen. We did right by getting out of our long flatteners positions, a month ago.
� Trump’s victory should increase the focus on political risk in Europe as it provides another evidence of a global populist backlash. The rise in the US would likely exert upward pressure on other European yields.
� We remain Underweight US 10-year bonds vs. Germany as reflation pressures are much more focused on the US.
FinLight Research | www.finlightresearch.com

31
FIXED INCOME & CREDIT
INFLATION-LINKED
� Wage pressures have affected inflation expectations. Since late June, 10-year breakeven inflation has jumped from 1.3% to 1.7%.
� We remain to OW 10y-TIPS. We are bullish on US breakevens given the supportive macroeconomic backdrop and record retail demand for TIPS
� We remain Neutral HICP Inflation as we see breakevens trading sideways
FinLight Research | www.finlightresearch.com

32
FIXED INCOME & CREDIT
CORPORATE CREDIT
� Credit is expensive relative to the fundamentals . fundamentals continue to deteriorate, with EBITDA growth continuing to decline and net leverage rising further (especially in the US). But central bank QE from Europe and Japan remains a support.
� We still see significant demand for US spread products given the low level of Euro HG credit yields. Surprisingly, the demand for USD credit remains strong, despite the rising cost of FX risk hedging, suggesting appetite for unhedged exposure
� Concerns around European banks, combined with a hard Brexit stance from the UK make European credit markets riskier than their US counterparties.
� We remain overweight US vs EUR credit (more on IG than HY) because of our fundamentally bearish view on European credit, the relative yield disadvantage and the fact that the re-leveraging cycle looks more mature in the US.
� In high yield, we keep our bias towards higher quality. Any unpriced rate hike (and/or dollar strengthening) would weigh on low quality bonds (High Yield and EM debt). We remain UW on HY and Neutral on IG.
FinLight Research | www.finlightresearch.com

33
FIXED INCOME & CREDIT
EM DEBT
� The dollar strengthening is on track and would weigh on EM debt
� We remain Neutral on EM bonds, because of all the macro challenges facing the EM economies at a time when the Fed is likely to be more hawkish
� Bottom line : UW Govies, UW US vs Eurozone Govies, long steepeners on the US yield curve, remain short duration in 2y USTs, UW credit mainly through HY and Neutral on IG (duration hedged), UW Eurozone vs US in IG & HY credit, OW 10y-TIPS breakevens and Neutral HICP Inflation, UW High Yield vs High Grade, Neutral on EM sovereigns with a little preference for hard currencies bonds.
FinLight Research | www.finlightresearch.com
34
US Govies – 10y UST
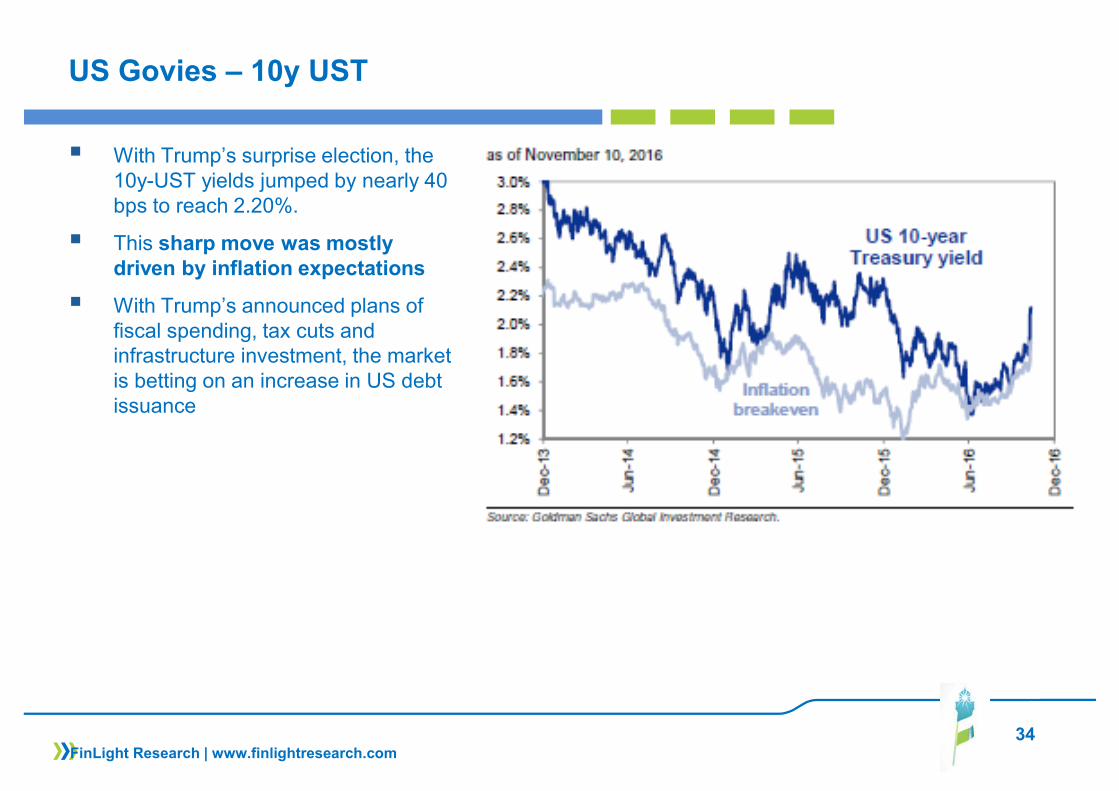
� With Trump’s surprise election, the 10y-UST yields jumped by nearly 40 bps to reach 2.20%.
� This sharp move was mostly driven by inflation expectations
� With Trump’s announced plans of fiscal spending, tax cuts and infrastructure investment, the market is betting on an increase in US debt issuance
FinLight Research | www.finlightresearch.com

35
US Govies – 10y UST
� The rise in yields will induce a substantial loss in real wealth.
� According to a Goldman Sachs estimate, a 100bp increase in 10y yields would translate into a $1.1tn market value loss for the US Aggregate Bond Market Index
� Such a rise would no doubt have an impact on yields in the Eurozone, specially in high debt markets (Italy, for instance).
� We expect the JGB market to remain immune, at this stage.
FinLight Research | www.finlightresearch.com

36
US Govies – 10y UST
� According to our positioningrule, we’ve moved fromNeutral to UW 10y USTs asthe 10y yield breached 1.80.
� With Trump’s surprise victory,the 10y-UST yield has brokenthrough the January ‘14downtrend and reached 2.23
� The downside move seemsdamaged.
� Our positioning rules areadjusted a follows:� Remain UW above 2.00� Neutral between 1.65 and
2.00� OW below 1.65� Move to Neutral again
around 1.25-1.28
� The next important level to watch is 2.23
FinLight Research | www.finlightresearch.com

37
US Govies – 10y UST
� 3-month correlation between bondfutures and equity prices is typicallynegative
� Bond-equity correlation turnedpositive in September, and hasremained in positive territory sincethen.
� Last times we’ve seen this positivecorrelation, bond markets sold off.
FinLight Research | www.finlightresearch.com

38
US Credit - Fundamentals
� US balance sheet fundamentals and credit quality continue to deteriorate. We see more debt when earnings and revenues are struggling
� Net leverage ratios are now at levels similar to those reached in the late 1990s.
� The picture is concerning but in some way smoothed by the still high interest coverage .
� With rising yields, focus would eventually go back to balance sheet fundamentals
� This picture is US specific. Despite the CSPP, we see no sign of releveraging in European non-financials.
FinLight Research | www.finlightresearch.com

39
US Credit – HY Default Rate
� The 12-month trailing HY default rate continues to increase. But most of its move is due to Oil & Gas and Metals & Mining
� When these sectors are excluded, the default rate seems more flattish around 1.9%.
� Any contagion from Energy, Metals and Mining to the rest of the HY market looks improbable as far as the recession risk remains under control.
FinLight Research | www.finlightresearch.com

40
US Credit – HY Default Rate
� The 5-year cumulative default rate is just above its lows, and should continue its move higher towards 2008/2009 peaks.
FinLight Research | www.finlightresearch.com

41
US Credit – Rating Drift
� The rating drift for US / European issuers has shown some signs of improvement with downgrades slowing over the last months.
FinLight Research | www.finlightresearch.com

42
US / EUR Credit
� The compression we’ve seen in the HY/IG spread ratios seems to be exhausted.
� The CSPP impact is already in prices.
� We continue to prefer IG to HY on a risk-adjusted basis, even in the EUR credit complex
FinLight Research | www.finlightresearch.com

43
EXCHANGE RATES
� Central banks remain the key driver of foreign exchange, We remain structural Dollar bulls. Ourrationale was that divergence would drive rate differentials in favor of the Dollar.
� As expected, the dollar is now supported by the Fed’s hawkish rhetoric and bets on a rate hike in Dec‘16. But it is not soaring as it should be.
� Dollar Looks Bullish, But Needs To Break Out� The DXY index is now close to its 15’ highs, coming into significant resistance near 100
� Our first target of 1.07 has been reached on EUR-USD. The spot is now testing the critical support area of 1.07-1.06
� We remain UW for the moment. We will move to Neutral above 1.14, and to OW if the spot breaksabove the 1.15 resistance (the ceil of the triangle pattern formed since Mar. ‘15) to target 1.18
� Our positioning rules remain unchanged:� Move to Neutral within the 1.14 - 1.15 range� Move to OW if the spot breaks above the 1.15 resistance to target 1.18� Remain UW below 1.14.
� Over the medium-term (Q4-2016 and H1-2017), we maintain our downside projections towards1.04-parity. For that, we need a clean break through the strong support area of 1.06 (the floor of thetriangle pattern).
FinLight Research | www.finlightresearch.com

44
EXCHANGE RATES
� On USD-JPY, we’ve moved from Neutral to OW around 104 on Oct. 11, targeting 104.8 and 108� Our target is already reached and exceeded. Next levels to watch: 111 and 113
� We adjust our positioning rules on USD-JPY as follows:� Remain OW above 108� Move to Neutral below 108� Only a break below the downtrend from Jan. ‘16 and bearish momentum, would make us move to
UW
� EM currencies have weakened since the middle of August as Fed risks have been repriced. � We maintain our view that pressure on EM currencies will resume and continue until we see a more
constructive / fundamental improvement for global growth and commodities supply/demand imbalances.
� We remain UW EM and Commodity FX
FinLight Research | www.finlightresearch.com

45
US Dollar
� The Dollar continues to be driven by 2-year rate US vs G10 differential.
� The difference between the inflation picture in US vs Europe and Japan is also playing for US dollar.
� Thus, we maintain our view of more dollar upside from here.
FinLight Research | www.finlightresearch.com
46
US Dollar
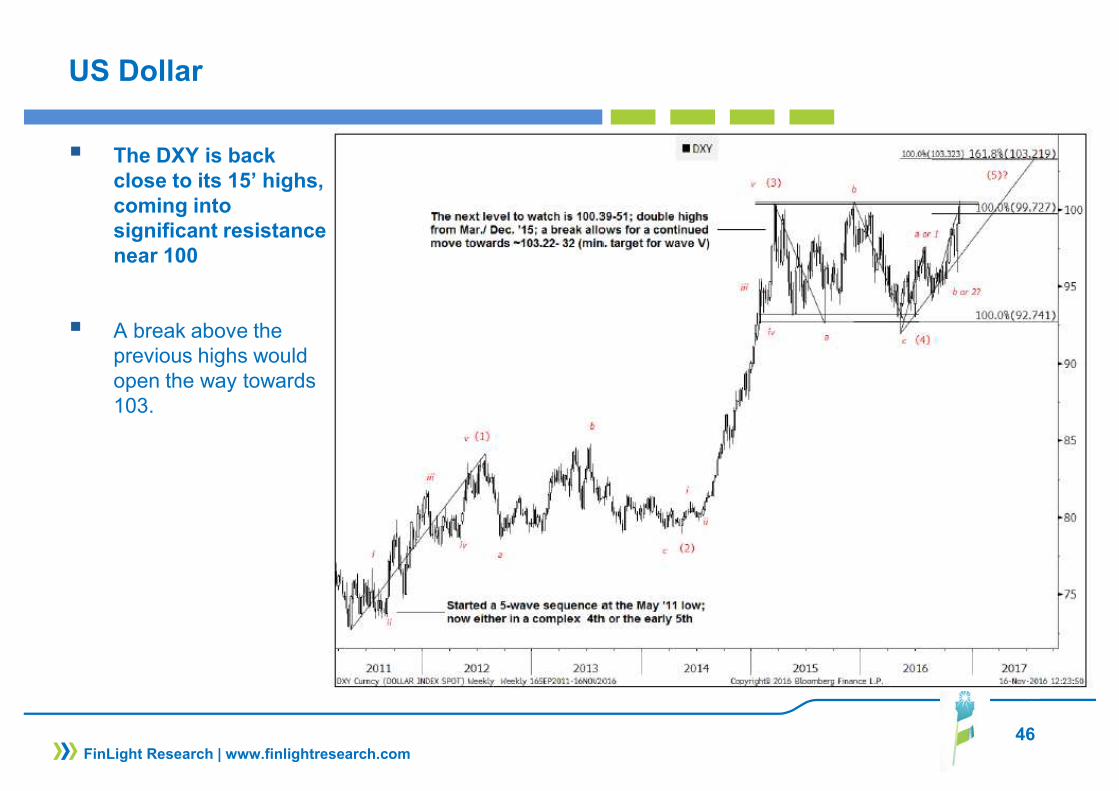
� The DXY is back close to its 15’ highs, coming into significant resistance near 100
� A break above the previous highs would open the way towards 103.
FinLight Research | www.finlightresearch.com

47
EUR-USD
� Our first target of 1.07 has been reached on EUR-USD.
� The spot is now testing the critical support area of 1.07-1.06
� We remain UW for the moment.We will move to Neutral above1.14, and to OW if the spotbreaks above the 1.15 resistance(the ceil of the triangle patternformed since Mar. ‘15) to target1.18
� Over the medium-term (Q4-2016and H1-2017), we maintain ourdownside projections towards1.04-parity. For that, we need aclean break through the strongsupport area of 1.06 (the floor ofthe triangle pattern).
FinLight Research | www.finlightresearch.com

48
USD-JPY
� We’ve moved fromNeutral to OW around 104on Oct. 11, targeting 104.8and 108 (Please see ourprevious reports)
� Our target is alreadyreached and exceeded.Next levels to watch: 111and 113
� We adjust our positioningrules on USD-JPY asfollows:� Remain OW above 108� Move to Neutral below� Only a break below the
downtrend from Jan.‘16 and bearishmomentum, wouldmake us move to UW
FinLight Research | www.finlightresearch.com

49
COMMODITY
� We continue to view upward moves since Jan. ‘16 more as technical adjustments than as a fundamentally-driven ones.
� The collapsing cost of many commodities is still driving prices downward� We don’t see any sustainable recovery without a pick-up in global growth or a material
tightening on the supply side. It is likely that supply destruction (due to pull-back in capital investment) will be the main catalyst for the next sustainable recovery in prices.
� We also expect a considerable volatility along the way
� We remain UW commodities over 3-6 months� The supply side has adjusted but still has a way to go in many commodities before erasing
current imbalances. In order to get more cuts in supply, we think there needs another legdown in prices to force capitulation
� US dollar strengthening should weigh on prices. Dollar will dictate both direction and velocityin commos. We expect the stronger dollar to put downward pressure on commodities despitesupportive fundamentals for some of them
FinLight Research | www.finlightresearch.com
50
COMMODITY
� Bottom Line :Energy:
� Crude oil prices have given back all of their recent gains as cracks appear in the Algerian deal, calling into question the planned production cuts. OPEC output jumped.
� EIA numbers were even more bearish, as they showed a massive build in inventories.
� We think that the bottom is in for oil, but we don’t expect a significant rally from here. Any growing evidence that the downtrend in U.S. crude production is ending, would induce another sharp drop in prices. Crude prices path will remain bumpy!
� $40-$50 per barrel is the range for WTI over the short-term. Only an unexpected exogenous event could cause oil to break out of it, on one side or the other..
� We actually expect the spot to test again the 25-30 area before putting in a permanent rebound. At this stage, we watch a few key levels ($40, $36, $31, $25). We need to see how the price behaves around these levels to make our projections.
� Our bearish bias is still intact. Only a material break above 52.5 would open scope for a rally.
� According to our positioning rules, we turned from Neutral to UW on WTI as the spot broke bellow the$49.8-$50 area
� Our tactical rules are adjusted as follows:� Remain UW below $49.8-$50� Turn Neutral when the triangle formed since June is reintegrated� Move to OW above $52.5 (to target 60 – 65) or below $29 (to play the rebound).
FinLight Research | www.finlightresearch.com

51
COMMODITY
Precious Metals:
Outlook for precious metals continues to be dominated by Fed rhetoric, macroeconomic and political uncertainties and the subsequent impact on US dollar, real yields and sovereign credit.
� Our baseline outlook for gold / silver prices has not changed. We are bullish precious metals over the long-term , no matter what happens (on US dollar, China, growth…)!
� From a long-term perspective,we don't think gold has fully from its historical highs. A 4-year correction doesn’t seem proportional to the previous bear market of 1980-2000.
� Thus, we still think that lower lows can be seen before the next bullish phase takes place.
� Over the short-term, we expect the precious metal to trade lower over the next months as US dollar rates go higher. Gold prices could head towards $1,100-1,150 ($12.5 - $13 for silver)
� Applying our positioning rules (please have a look to our previous Reports), we remain Neutral on Goldas long as the spot stays between 1200 and 1300
� Our positioning rules remain unchanged:� Remain Neutral between 1200 and 1300� Go OW above 1300, targeting 1380 and even 1430� Turn UW if the spot breaks below 1200 and go OW again below 1070
FinLight Research | www.finlightresearch.com

52
COMMODITY
Base Metals: .
� The rally in industrial metals was much stronger than anticipated. Our UW positioning has proved dramatically wrong.
� A series of Chinese activity data showed a surprising strength, pulling all the base complex higher. Copper prices in particular have experienced a strong week (with more than 11%).
� We do not think that Trump’s announced fiscal / infrastructure spending would be a fundamental game changer to industrial metals.
� Despite the recent impressive rally, we remain UW on base metals on continuing excess supply, weak prospects for demand and cost deflation.
� We believe that lower prices are still needed to induce more supply adjustments.
� From a longer-term point of view, we believe that metals prices are headed for multi-year declinesas the current China-driven super-cycle appears to have peaked
Agriculture:
� The technical rebound in grain prices (2-4% in October, despite the fact that we’re entering peak harvest season) may be partially due to money investors stopping their shorts at the end of 3Q.
� Despite more evidence of consumption growth, sizable inventories should keep grain prices in a low trading range through the winter. Grains prices are, however, nearing a floor
� We choose to remain Neutral on Agris, as we have no conviction at this stage and given biguncertainties around forecasts for 2016-17
FinLight Research | www.finlightresearch.com

53
Gold – Vs Dollar and USTs
� At end-October, the comparison between gold and 30yr T-bonds divided by the dollar wasshowing a short-term divergence
� Given the move in UST yields and US dollar, closing the gap would clearly need a goldretracement.
FinLight Research | www.finlightresearch.com

54
Gold – Tech. Perspective
� Applying our positioning rules(please have a look to ourprevious Reports), we remainNeutral on Gold as long as thespot stays between 1210 and1300
� Our positioning rules remainunchanged:� Remain Neutral between
1200 and 1300� Go OW above 1300,
targeting 1380 and even1430
� Turn UW if the spot breaksbelow 1200 and go OWagain below 1070
� The next level to watch is1203. We may see a baseforming there. But a breakthrough would open the way toanother leg down (target ~1100– 1150).
FinLight Research | www.finlightresearch.com

55
Gold – Vs Silver
� The Gold-to-Silver ratio reached its highs in Feb. ‘16. Since then, it has receded and broken from the primary uptrend from the Nov. ‘12 lows
� Technically, the ratio seems ready for another impulsive decline in Silver’s favor
FinLight Research | www.finlightresearch.com

56
Crude – Tech. Perspective
� According to our positioningrules, we’ve turned fromNeutral to UW on WTI as thespot broke below $49.8-$50
� Next level to watch: 42.60.Breaching this level wouldincrease the likelihood of amove lower towards $40.0
� Our tactical rules are adjustedas follows:� Remain UW below
$49.8-$50� Turn Neutral when the
triangle formed sinceJune is reintegrated
� Move to OW above$52.5 (to target 60 – 65)or below $29 (to play therebound).
FinLight Research | www.finlightresearch.com

57
Copper – Tech. Perspective
� In our previous report, we said:“… from a technical perspective,we think the metal will soon finda near-term support around4620 (the floor of the currenttriangle pattern). We switch toNeutral with a bullish bias, fornow. We’ll move to OW if thespot breaks up (above 4950,target ~5400 where we’ll movemassively UW) and to UW againif it breaks down (below 4620)”
� The move on Copper wasimpulsive.
� As stated above, we’ve movedto OW as the spot broke above4950, reached our target of 5400and moved to UW again
� Next important levels to watch :5330 and 5950!
FinLight Research | www.finlightresearch.com

Bottom Line: Global Asset Allocation
� The passing of the US election has taken a key event risk off the table.But markets continue to digest the implications of Mr Trumps surprisevictory.
� Trump’s victory has triggered a global sell-off in equities, credit and oil,and a jump in volatility. All these moves have been short lived andreversed the day after.
� Market optimism was driven by the prospect of large fiscal stimulus,infrastructure spending and a Republican control of both Houses. Noone seems warried anymore about the downside risk from an escalationin protectionism and global populist backlash.
� On the surface, the global economy is getting better. But, investorsshould avoid complacency in such an uncertain environment
� Our focus is 3Q earnings season, rising wages and their impact onmargins, expected inflation and volatile volatility.
� Earnings had already been on an improving trend, with a number of keysectors showing a dramatic turnaround. Expected inflation is ticking up.Global bond yields too.
� Not much has changed in our expectations, except for Govies andenergy.
� We summarize our views as follows �
58FinLight Research | www.finlightresearch.com

59
Disclaimer
FinLight Research | www.finlightresearch.com
This writing is for informational purposes only and does not constitute an
offer to sell, a solicitation to buy, or a recommendation regarding any
securities transaction, or as an offer to provide advisory or other services
by FinLight Research in any jurisdiction in which such offer, solicitation,
purchase or sale would be unlawful under the securities laws of such
jurisdiction. The information contained in this writing should not be
construed as financial or investment advice on any subject matter.
FinLight Research expressly disclaims all liability in respect to actions
taken based on any or all of the information on this writing.
About Us…
� FinLight Research is a research-centric company focused on Asset Allocation from a top-down perspective, on Portfolio Construction, and all related quantitative aspects and risk management issues.
� Our expertise expands along 3 axes:
� Asset Allocation with risk control and/or risk budgeting techniques
� Allocation to alternative investments : Hedge funds, rule-based strategies (momentum, value, carry, volatility), real assets (real estate, infrastructure, farmland, timberland and natural resources). Private equity and venture capital should be the next step…
� Allocation with a factorial approach built on the understanding (profiling) of the risk/return drivers of the different asset classes
� FinLight Research is an innovation-oriented company. We target to fill the gap between the academic research and the investment community, especially on real assets and alternatives. We survey on a continuous basis the academic literature for interesting published and working papers related to quantitative investing, non-linear profiling, asset allocation, real assets...
60FinLight Research | www.finlightresearch.com
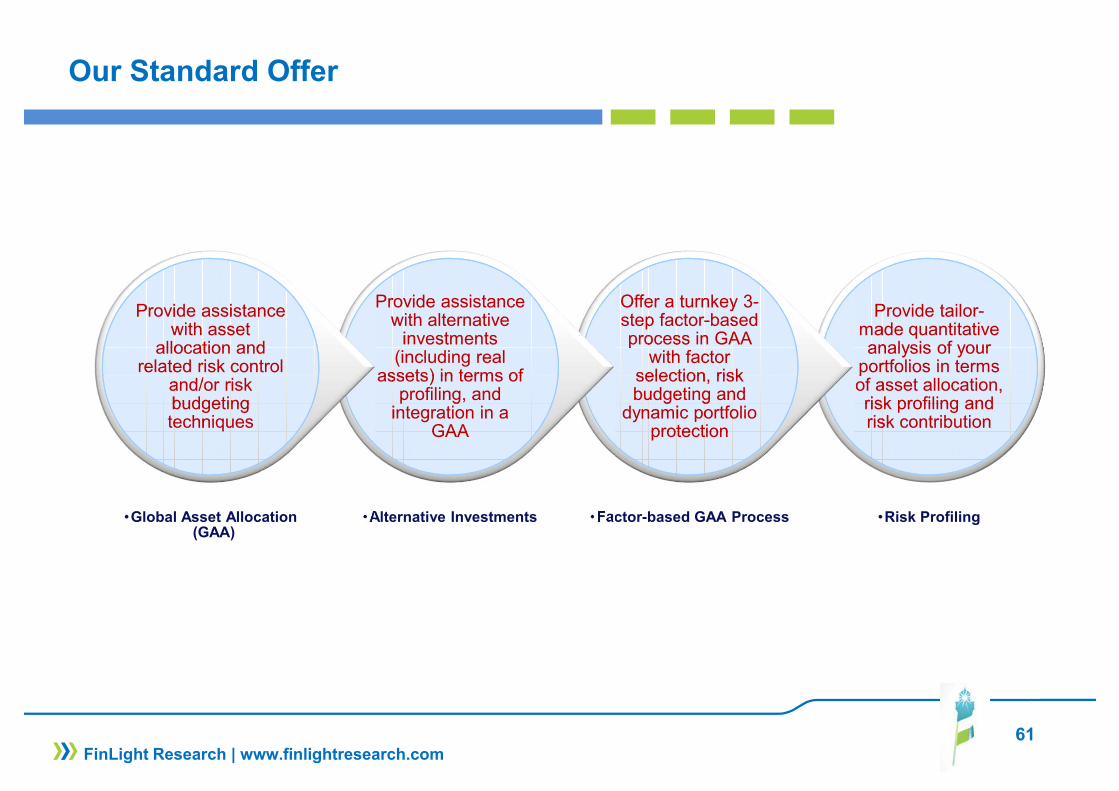
Our Standard Offer
Provide tailor-made quantitative analysis of your
portfolios in terms of asset allocation, risk profiling and risk contribution
Provide tailor-made quantitative analysis of your
portfolios in terms of asset allocation, risk profiling and risk contribution
•Risk Profiling
Offer a turnkey 3-step factor-based process in GAA
with factor selection, risk budgeting and
dynamic portfolio protection
Offer a turnkey 3-step factor-based process in GAA
with factor selection, risk budgeting and
dynamic portfolio protection
•Factor-based GAA Process
Provide assistance with alternative
investments (including real
assets) in terms of profiling, and
integration in a GAA
Provide assistance with alternative
investments (including real
assets) in terms of profiling, and
integration in a GAA
•Alternative Investments
Provide assistance with asset
allocation and related risk control
and/or risk budgeting techniques
Provide assistance with asset
allocation and related risk control
and/or risk budgeting techniques
•Global Asset Allocation (GAA)
61FinLight Research | www.finlightresearch.com


