1 Second Quarter 2006 Results August 8, 2006 Finning Announces Record Second Quarter Results Highlights • Second quarter revenues were the highest ever for any quarter • Basic earnings per share of $0.63 is up 21% from the second quarter of 2005 • Cash flow after working capital changes is up more than 60% in the quarter • Record order backlog of almost $1.1 billion Three months ended June 30 Six months ended June 30 C$ millions, except per share data 2006 2005 Change 2006 2005 Change Revenue 1,299.7 1,271.5 2.2% 2,543.9 2,424.9 4.9% Earnings before interest and taxes 94.1 80.5 16.9% 188.3 149.9 25.6% Net income 56.6 45.6 24.1% 113.5 83.0 36.7% Basic Earnings Per Share $ 0.63 $ 0.52 21.2% $ 1.27 $ 0.94 35.1% Diluted Earnings Per Share $ 0.63 $ 0.51 23.5% $ 1.26 $ 0.93 35.5% Cash flow after working capital changes 189.6 117.4 61.5% 325.6 161.8 101.2% Vancouver, Canada - Finning International Inc. (Finning) today reported 2006 second quarter revenue of $1,299.7 million, an increase of 2.2% over the second quarter of 2005. Second quarter net income was $56.6 million or $0.63 per share, an increase of 21.2% in earnings per share compared with the second quarter of 2005. “Our second quarter results were once again at record levels, with our western Canadian operations leading the growth”, said Doug Whitehead, President and CEO of Finning, “These results build on a very good first quarter and we expect a strong second half of the year as well”. “The western Canadian economy continues to operate at very high levels and business is very strong”, said Mike Waites, Executive Vice President and CFO of Finning. “As well, our South American operations are on track with our expectations for 2006 with higher parts and service revenues driving higher margins. In the UK, our operations are effectively managing costs in a very competitive market”.
Transcript
1
Second Quarter 2006 Results August 8, 2006
Finning Announces Record Second Quarter Results
Highlights
• Second quarter revenues were the highest ever for any quarter • Basic earnings per share of $0.63 is up 21% from the second quarter of 2005 • Cash flow after working capital changes is up more than 60% in the quarter • Record order backlog of almost $1.1 billion Three months ended June 30 Six months ended June 30 C$ millions, except per share data 2006 2005 Change 2006 2005 Change Revenue 1,299.7 1,271.5 2.2% 2,543.9 2,424.9 4.9% Earnings before interest and taxes 94.1 80.5 16.9% 188.3 149.9 25.6% Net income 56.6 45.6 24.1% 113.5 83.0 36.7% Basic Earnings Per Share $ 0.63 $ 0.52 21.2% $ 1.27 $ 0.94 35.1% Diluted Earnings Per Share $ 0.63 $ 0.51 23.5% $ 1.26 $ 0.93 35.5% Cash flow after working capital
changes 189.6 117.4 61.5%
325.6 161.8 101.2% Vancouver, Canada - Finning International Inc. (Finning) today reported 2006 second quarter revenue of $1,299.7 million, an increase of 2.2% over the second quarter of 2005. Second quarter net income was $56.6 million or $0.63 per share, an increase of 21.2% in earnings per share compared with the second quarter of 2005.
“Our second quarter results were once again at record levels, with our western Canadian operations leading the growth”, said Doug Whitehead, President and CEO of Finning, “These results build on a very good first quarter and we expect a strong second half of the year as well”. “The western Canadian economy continues to operate at very high levels and business is very strong”, said Mike Waites, Executive Vice President and CFO of Finning. “As well, our South American operations are on track with our expectations for 2006 with higher parts and service revenues driving higher margins. In the UK, our operations are effectively managing costs in a very competitive market”.
Finning International Inc. Second Quarter 2006 Results
2
Second Quarter Results Finning’s revenues in the second quarter were $1,299.7 million, up 2.2% from the second quarter of 2005 reflecting continued strength in equipment spending by resource-based businesses and general construction markets in Canada and growth in customer support services both in Canada and South America. Strong commodity prices and good overall economic conditions are supporting these businesses and management believes these conditions are likely to continue.
Finning’s global order book (the retail value of equipment units ordered by customers for future deliveries) of $1,094 million at the end of the second quarter of 2006 remains strong and is at record levels.
Earnings Before Interest and Taxes (EBIT) for the quarter was $94.1 million, compared with $80.5 million in the second quarter of 2005, an increase of 16.9%.
Second quarter EBIT in the Canadian reporting segment increased from $41.2 million in 2005 to $57.7 million in 2006, a 40% increase. The increase in 2006 was primarily the result of strong volumes in all lines of business.
EBIT for Finning’s South American operations in the second quarter of 2006 of $23.7 million was relatively unchanged from the 2005 second quarter notwithstanding lower revenues in the second quarter of 2006. Finning South America’s EBIT in the second quarter of 2006 reflects a shift from equipment sales to customer support services, which is a higher margin business, offset by the negative foreign exchange translation impact of a stronger Canadian dollar.
For Finning (UK), EBIT increased 17.4% in the second quarter of 2006 to $10.8 million compared to $9.2 million in the second quarter of 2005, reflecting a higher contribution from the Power Systems Division, partially offset by the unfavourable foreign exchange translation impact of a stronger Canadian dollar.
Second quarter EBIT for Hewden of $6.9 million decreased 53.1% over 2005 levels primarily due to fewer business days in the second quarter of 2006 and process reengineering and restructuring costs. Hewden’s EBIT was also affected by continued competitive pressures in the U.K. marketplace and the unfavourable foreign exchange translation impact of a stronger Canadian dollar. In local currency and on a year-to-date basis, Hewden’s EBIT decreased 7.9%.
Finning’s net income for the quarter was $56.6 million compared with $45.6 million in 2005. Basic Earnings Per Share (EPS) for the quarter was $0.63 in 2006 compared with $0.52 in the second quarter of 2005. 2006 results were higher than in 2005 primarily due to a very strong quarterly performance from the Company’s Canadian operations and improved results from the Company’s UK operations.
Cash flow after working capital changes was $189.6 million for the second quarter of 2006, compared with $117.4 million for the same period last year. This was primarily due to management’s focus on working capital requirements, improving cash cycle times and operating efficiencies.
Year-to-Date Results Revenue for the six months ended June 30, 2006 was $2,543.9 million, up 4.9% from the prior year. EBIT of $188.3 million and basic earnings per share of $1.27 for the first half of 2006 are up 25.6% and 35.1% respectively. Year-to-date trends are similar to the quarterly trends noted above.
Year-to-date revenue is up 28.5% at the Company’s Canadian operations, reflecting strong equipment sales to resource-based businesses and the general construction markets. EBIT margin (EBIT divided by revenue) for the Canadian operations of 8.9% is up from 8.0% in the prior year reflecting higher volumes and margins from most lines of business.
Revenues decreased 10.7% at the Company’s South American operations, but only decreased 3.0% in local currency. However, as a percentage of revenue, gross profit increased in the first half of 2006 as the
Finning International Inc. Second Quarter 2006 Results
3
South American operations experienced a significant revenue mix shift from equipment sales to higher margin customer support services. Year-to-date EBIT of $49.6 million was at a similar level compared to the same period last year, but in local currency EBIT improved 7.5%.
On a year-to-date basis, revenues from the Company’s UK operations decreased 11.6%, but in local currency total revenue was at a similar level to that reported in the first six months of 2005. EBIT improved 40.6% compared to the same period last year, and in local currency EBIT improved 58.5% with improved contributions from all divisions and reflecting lower expenses as a result of various initiatives and management’s focus on realizing cost efficiencies.
Hewden’s revenues decreased 12.8%, but in local currency revenues were only slightly lower than the same period in 2005. EBIT decreased 18.8% compared to the first six months of 2005, and in local currency EBIT decreased 7.9%. EBIT as a percentage of revenues decreased from 6.3% last year to 5.9% in 2006 partially due to lower volumes in a very competitive rental market as well as higher project costs.
Important New Contracts In the second quarter of 2006, Finning secured the sale of 23 new Caterpillar 797B mining trucks to Canadian Natural Resources Limited for the Horizon Oil Sands Project, north of Fort McMurray. The transaction, valued at approximately $264 million, includes the sale of the 23 trucks scheduled to be delivered in 2008, together with a multi-year product support agreement.
Executive and Director Appointments Juan Carlos Villegas, currently Vice President, Power Systems of Finning (Canada) has been
appointed President, Finning South America effective August 1, 2006. In his new role, Juan Carlos will have overall responsibility for Finning’s operations in Chile, Argentina, Bolivia and Uruguay.
Brian Bell, currently President of Finning South America, will assume the role of Executive Vice President, Corporate Strategy & Customer Solutions for Finning International Inc. effective September 1, 2006. In his new role, Brian will be responsible for the development of the Company’s corporate strategy and for enhancing the effectiveness, efficiency and profitability of Finning’s growing global parts and service business.
Two new individuals have joined the Finning Board of Directors:
At Finning’s most recent annual general meeting in May 2006, Mr. John Reid was elected to the Board of Directors. Mr. Reid is a corporate director and resident of Canada and most recently was President and Chief Executive Officer of Terasen Inc., a Canadian energy pipeline and utility company. Prior to his appointment as Terasen’s CEO, Mr. Reid was Chief Financial Officer at Terasen Inc. Mr. Reid is a chartered accountant and has been appointed to Finning's Audit Committee and has been designated the "financial expert" on the Audit Committee.
At Finning’s board meeting today, Mr. Bruce Turner was appointed to the Board of Directors. Mr. Turner is a corporate director and resident of Chile and recently was President of Minera Escondida Ltd, the company that operates the large Escondida copper mine in northern Chile. Mr. Turner is a mining engineer and a large portion of his career was spent working in progressively more senior roles at BHP Billiton Limited, a large global mining and energy company.
Finning International Inc. Second Quarter 2006 Results
4
Common Share Dividend The Board of Directors approved the Company’s quarterly dividend at $0.13 per common share, payable on September 5 2006, to shareholders of record on August 22 2006.
Second Quarter Conference Call Management will hold an investor conference call on Tuesday, August 8, 2006 at 11:30 am Eastern Time. Dial-in numbers:
1-877-888-3490 (anywhere within Canada and the US) (416) 695-9757 (for participants dialing from Toronto and overseas)
The call will be webcast live at http://www.finning.com/investors/investors.aspx and subsequently archived on the Finning website. Playback recording will be available at 1-888-509-0081 from 2:30 pm Eastern Time on August 8, 2006 until the end of business day on August 15, 2006. The passcode to access the playback recording is 626587 followed by the number sign.
About Finning International
Finning International Inc. sells, rents, finances and provides customer support services for Caterpillar equipment and engines, and complementary equipment, in Western Canada (Alberta, British Columbia, the Northwest Territories and the Yukon Territory and a portion of Nunavut), the U.K. and South America (Argentina, Bolivia, Chile and Uruguay). Headquartered in Vancouver, B.C., Canada, Finning International Inc. (www.finning.com) is a widely held, publicly traded corporation, listed on the Toronto Stock Exchange (symbol FTT). Complete financial statements and Management’s Discussion and Analysis can be accessed at www.finning.com.
Forward-Looking Disclaimer
This report (including the attached Management’s Discussion and Analysis) contains forward-looking statements and information, which reflect the current view of Finning International Inc. with respect to future events and financial performance. Any such forward-looking statements are subject to risks and uncertainties and Finning's actual results of operations could differ materially from historical results or current expectations. Finning assumes no obligation to publicly update or revise its forward-looking statements even if experience or future changes make it clear that any projected results expressed or implied therein do not materialize.
Refer to Finning's annual report, management information circular, annual information form and other filings with Canadian securities regulators, which can be found at www.sedar.com, for further information on risks and uncertainties that could cause actual results to differ materially from forward-looking statements contained in this report.
Next Quarterly Results November 14, 2006
Finning International’s third quarter results for 2006 will be released and an investor conference call will be held on November 14, 2006.
Finning International Inc. Second Quarter 2006 Results
5
MANAGEMENT’S DISCUSSION AND ANALYSIS This discussion and analysis of Finning International Inc. (Finning or the Company) should be read in conjunction with the interim consolidated financial statements and accompanying notes. The results reported herein have been prepared in accordance with Canadian generally accepted accounting principles (GAAP) and are presented in Canadian dollars unless otherwise stated. For additional information, please refer to Finning’s financial statements and accompanying notes and the Management’s Discussion and Analysis included in the Company’s 2005 annual report.
Results of Operations Second Quarter Overview Q2 2006 Q2 2005 Q2 2006 Q2 2005 ($ millions) (% of revenue)Revenue $ 1,299.7 $ 1,271.5 Gross profit 382.0 364.3 29.4% 28.6% Selling, general & administrative expenses 283.1 281.3 21.8% 22.1% Other expenses (income) 4.8 2.5 0.4% 0.2% Earnings before interest and taxes (EBIT) 94.1 80.5 7.2% 6.3% Finance costs 19.7 21.5 1.5% 1.7% Provision for income taxes 17.8 13.4 1.4% 1.0% Net income $ 56.6 $ 45.6 4.3% 3.6% Revenue by Operation ($ millions) Three months ended June 30
509.
5
274.
3
313.
3
174.
4254.
9
147.
6
216.
2
681.
0
0
200
400
600
800
Canada SouthAmerica
UK Hewden
2005 2006
Second quarter consolidated revenues of $1,299.7 million were the highest quarterly revenues in the Company’s history, driven by revenue growth of 33.7% from the Company’s Canadian operation. In spite of the negative impact of the strong Canadian dollar in the translation of foreign currency based revenues, consolidated revenues increased 2.2% from the record levels set in the second quarter of 2005. EBIT increased 16.9% to $94.1 million and consolidated net income increased by 24.1% to $56.6 million. Basic Earnings Per Share (EPS) for the quarter was $0.63 compared with $0.52 in the same period last year.
Revenue was higher in the second quarter of 2006 in the Company’s Canadian operations as a result of robust activity bolstered by high commodity prices and an increase in infrastructure spending. This was offset by lower revenue in Canadian dollars and local currency in the Company’s operations in South America and the U.K., year over year, with lower mining equipment deliveries in South America, aggressive competition in the U.K. marketplace and fewer rental billing days in the period compared to the same period last year.
Finning’s business is geographically diversified and the Company conducts business in multiple currencies, the most significant of which are the U.S. dollar, the Canadian dollar and the U.K. pound sterling. The most significant foreign exchange impact on the Company’s net income is the translation of foreign currency based earnings into Canadian dollars. Excluding the impact of foreign exchange when translating results, revenues in local currency decreased by 12.4% in South America, 8.5% in the UK operations and 4.7% in Hewden when compared to last year’s quarter.
Finning International Inc. Second Quarter 2006 Results
6
The growth in consolidated revenues occurred in spite of the negative foreign exchange translation impact of approximately $100 million on revenues due to a stronger Canadian dollar in the quarter relative to the U.K. pound sterling (11.2% strengthening) and the U.S. dollar (9.8% strengthening), year over year.
Revenue by Line of Business ($ millions) Three months ended June 30
1.3
362.
6
258.
5
108.
5
104.
4
436.
2
3.5
96.4
234.
9
93.3
407.
2
464.
4
0
200
400
600
NewEquip
Power &Energy
UsedEquip
EquipRental
CSS Other
2005 2006
In the second quarter of 2006, strong demand for new equipment in Canada and customer support services in both Canada and South America was partially offset by lower rental revenues from the UK Materials Handling business and Hewden and lower used equipment sales when compared to last year’s quarter. On a consolidated basis, the quarterly revenue mix was similar to that experienced in the second quarter of 2005, although certain operating units experienced a change in revenue mix.
Finning’s global order book or backlog (the retail value of equipment units ordered by customers for future deliveries) remained strong and achieved a level of $1,094 million at the end of the second quarter of 2006 which is up from the previous record level experienced in the first quarter of 2006 of $1,019 million and the December 2005 level of $968 million.
The Company is dependent on Caterpillar for the timely supply of parts and equipment to fulfill its deliveries and meet the requirements of the Company’s service maintenance contracts. With supply constraints, Caterpillar continues to have certain of their medium and large machine models under managed distribution. Caterpillar continues to work with their suppliers and within their factories to remove bottlenecks and increase production for its products. Finning continues to work closely with Caterpillar and customers to ensure that demand for parts and equipment can be met. Where supply constraints occur, the Company has been supplementing its new equipment inventory by utilizing its rental assets and used equipment to meet demand.
Gross profit of $382.0 million in the quarter increased 4.9% over the same period last year. As a percentage of revenue, gross profit increased slightly over last year with stronger margins achieved by each line of business.
Finning International Inc. Second Quarter 2006 Results
7
EBIT by Operation ($ millions) Three months ended June 30
24.3
41.2
9.2 14.7
6.910
.8
23.7
57.7
0
20
40
60
Canada South America UK Hewden
2005 2006
EBIT of $94.1 million increased 16.9% year over year, primarily due to the strong performance of the Company’s Canadian operations. Higher earnings were also experienced in Finning (UK) in the second quarter of 2006, reflecting higher margins and lower selling, general and administrative (SG&A) expenses as a result of cost saving initiatives. South America’s contribution to EBIT was slightly lower than the second quarter of 2005 primarily due to foreign exchange translation. Hewden’s contribution to EBIT was lower than the prior year’s quarter primarily due to two fewer business days in the second quarter of 2006 compared with the same period in the prior year. This was anticipated following very positive first quarter results due to three more business days in 2006 compared to the first quarter of 2005.
EBIT for the second quarter was reduced by approximately $15 million compared to the second quarter of 2005 when translating foreign currency based earnings with a stronger Canadian dollar relative to both the U.S. dollar and the U.K. pound sterling.
Other expenses incurred in the quarter were mainly represented by project costs at Hewden which includes process reengineering costs related to the implementation of its new information technology system as well as costs associated with restructuring efforts and closing non-performing depots in the U.K.
Net income improved 24.1% in the second quarter of 2006 reflecting the solid second quarter activity noted above.
Cash Flow (after working capital changes) ($ millions) Three months ended June 30
117.
4
189.
6
0
100
200
300
2005
2006
Cash flow after changes in working capital for the quarter was $189.6 million, a significant improvement from cash flow of $117.4 million generated in the same period last year. While cash flow strengthened modestly from the higher operating results in the quarter, the overall increase was primarily due to stabilizing working capital requirements to meet customer demand and continued management focus on improving cash cycle times and operating efficiencies. In the second quarter of 2006, the Company continued to invest in parts inventories to support strong customer demand, a growing portfolio of customer support maintenance contracts and to manage product availability issues.
The Company made a net investment in rental assets of $98.9 million during the second quarter of 2006, a decrease of $42.5 million from the same period in 2005. Rental fleets continued to be replenished in the second quarter of 2006, although at a lower rate than the prior year, largely in Canada as rental assets were used in 2005 to support customer demand and offset product availability issues. Continuing the 2005 trend, fewer rental assets were purchased in 2006 by the UK Materials Handling division due to lower demand and an increase in external customer financing. Likewise, expenditures on Hewden’s rental assets have been deferred as rental utilization rates have declined.
As a result of these items, cash flow from operating activities was $81.3 million in the second quarter of 2006 compared to a use of cash of $22.2 million in the second quarter of 2005.
Finning International Inc. Second Quarter 2006 Results
8
Year-to-Date Overview YTD 2006 YTD 2005 YTD 2006 YTD 2005 ($ millions) (% of revenue)Revenue $ 2,543.9 $ 2,424.9 Gross profit 738.8 692.2 29.0% 28.5% Selling, general & administrative expenses 555.1 539.7 21.8% 22.2% Other expenses (income) (4.6) 2.6 (0.2)% 0.1% Earnings before interest and taxes (EBIT) 188.3 149.9 7.4% 6.2% Finance costs 38.0 42.1 1.5% 1.8% Provision for income taxes 36.8 24.8 1.4% 1.0% Net income $ 113.5 $ 83.0 4.5% 3.4% Revenue by Operation ($ millions) Six months ended June 30
997.
1
501.
5
589.
3
337.
0521.
2
293.
9447.
9
1,28
0.9
0
400
800
1,200
1,600
Canada SouthAmerica
UK Hewden
2005 2006
Revenue by Line of Business ($ millions) Six months ended June 30
3.1
694.
4
506.
5
215.
9
188.
5
816.
5
6.9
195.
9
466.
3
203.
6
799.
5
871.
7
0
400
800
1,200
NewEquip
Power &Energy
UsedEquip
EquipRental
CSS Other
2005 2006
Year-to-date revenues of $2,543.9 million increased 4.9%, year over year, as a result of the strong contribution from the Company’s Canadian operations.
Foreign exchange translation had a negative impact of approximately $190 million on revenues due to the stronger Canadian dollar in the first half of 2006 relative to the U.K. pound sterling (11.9% strengthening) and the U.S. dollar (7.9% strengthening), year over year. In local currency, the Company’s UK and Hewden operations contributed revenues at a similar level to that of the first six months of 2005, while South American operations were 3.0% below the 2005 level.
From a line of business perspective, the strong demand for new equipment was surpassed by the growth in customer support services in the first six months of 2006. Customer support services are viewed by management as a major potential growth area and related revenues are anticipated to comprise a larger percentage of total revenues going forward. Customer support services generally contribute a higher EBIT as a percentage of revenue. The rental revenue shortfall is mainly related to the translation of foreign sourced revenues but also reflects lower rental revenues from the UK Materials Handling business. Used equipment revenues are lower than the prior year and typically will vary depending on product availability, customer buying preferences and exchange rate considerations. As new equipment is currently in high demand and certain models are in short supply, customers are utilizing their older units longer and as such, availability of used equipment is low.
Gross profit of $738.8 million in the first half of the year increased 6.7% over the same period last year and increased as a percentage of revenue. Strong overall demand led to improved margins for equipment sales, partially offset by higher costs incurred to manage product availability issues and costs related to growth throughout the dealership operations.
Finning International Inc. Second Quarter 2006 Results
9
EBIT by Operation ($ millions) Six months ended June 30
50.1
79.4
13.3
21.3
17.3
18.7
49.6
114.
4
0
40
80
120
Canada South America UK Hewden
2005 2006
EBIT increased 25.6% to $188.3 million and consolidated net income increased by 36.7% to $113.5 million in spite of the negative impact of foreign exchange translation in 2006. EBIT for the six months ended June 30, 2006 was reduced by approximately $20 million compared to the same period in 2005 as a result of the stronger Canadian dollar relative to both the U.S. dollar and the U.K. pound sterling.
Basic EPS for the six months ended June 30, 2006 was $1.27 compared with $0.94 in the same period last year. Results from the six months ended June 30, 2006 include the gains of approximately $0.10 per share recorded in the first quarter on the disposal of surplus properties in Canada and a portion of OEM Remanufacturing’s business.
OEM sold its railroad and non-Caterpillar engine component remanufacturing business to Caterpillar. Caterpillar and OEM have signed an initial two-year agreement under which OEM will provide remanufacturing services to Caterpillar for these lines of business. Caterpillar will provide all sales and marketing functions and OEM will perform the remanufacturing work for the initial term of the agreement. OEM continues to provide remanufacturing services under a long-term contract to Finning (Canada) in support of their customers in western Canada.
The increase in net income year over year was primarily due to the continued strong performance of the Company’s Canadian operations and the gains from the disposition of surplus properties and a portion of the OEM business noted above. Efforts are ongoing to improve efficiencies in our operations in the U.K. together with the implementation of a new information technology system at Hewden. Excluding the gains recorded in the first quarter of 2006 from the dispositions noted above, net income would have been $105.1 million and basic EPS would have been $1.17.
Cash Flow (after working capital changes) ($ millions) Six months ended June 30
161.
8
325.
6
0
100
200
300
400
2005
2006
Cash flow after changes in working capital for the six months ended June 30, 2006 of $325.6 million, more than doubled from $161.8 million generated in the same period last year as a result of stabilizing working capital requirements to meet customer demand and continued management focus on improving cash cycle times and operating efficiencies.
The Company’s net spending on rental assets decreased by 14.9% with a net investment of $179.5 million in the first half of 2006 (six months ended June 30, 2005: $210.8 million).
Cash flow from operating activities for the first six months of 2006 was $133.1 million compared to a $47.2 million use of cash in the same period of 2005.
Finning International Inc. Second Quarter 2006 Results
10
Results by Business Segment The Company and its subsidiaries operate primarily in one principal business, that being the selling, servicing, renting and financing of heavy equipment and related products in various markets worldwide as noted below.
Operating units are as follows:
• Canadian operations: British Columbia, Alberta, the Yukon Territory, the Northwest Territories, and a portion of Nunavut.
• South American operations: Chile, Argentina, Uruguay and Bolivia. • UK operations: England, Scotland, Wales, Falkland Islands and the Channel Islands • Hewden operations: Equipment rental in England, Scotland, Wales and Jersey. • Other operations: corporate head office.
Finning International Inc. Second Quarter 2006 Results
11
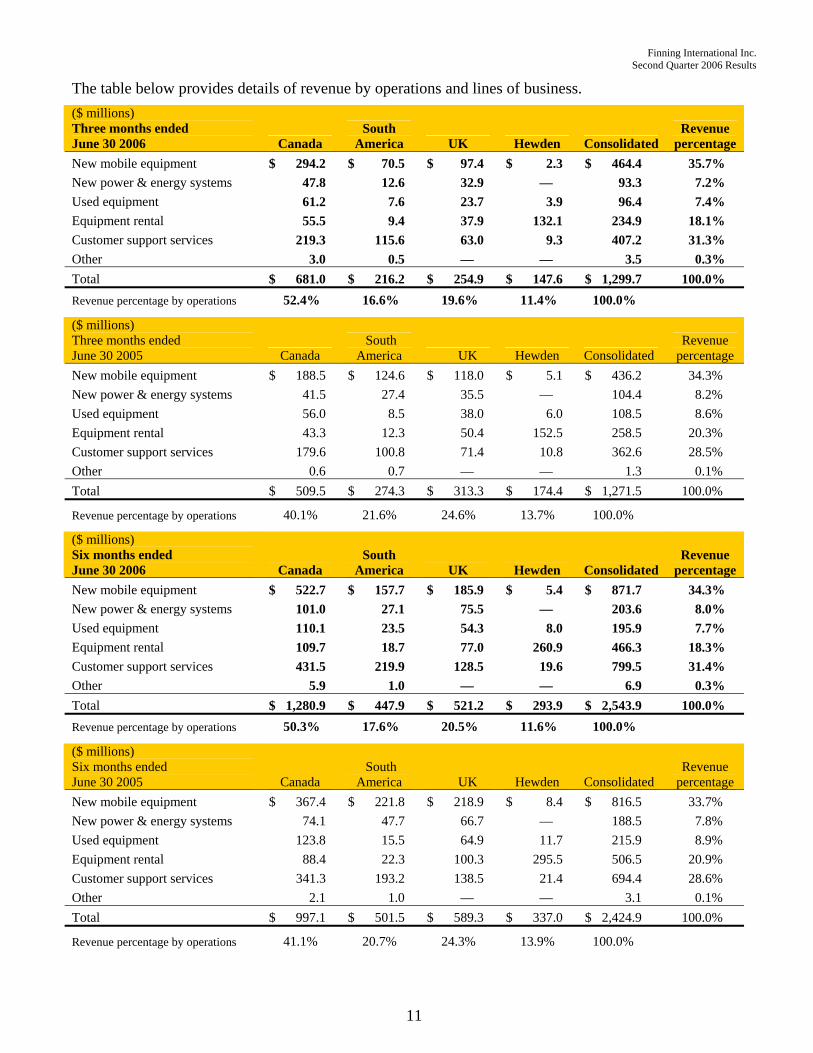
The table below provides details of revenue by operations and lines of business. ($ millions) Three months ended June 30 2006 Canada
South America UK Hewden Consolidated
Revenue percentage
New mobile equipment $ 294.2 $ 70.5 $ 97.4 $ 2.3 $ 464.4 35.7% New power & energy systems 47.8 12.6 32.9 — 93.3 7.2% Used equipment 61.2 7.6 23.7 3.9 96.4 7.4% Equipment rental 55.5 9.4 37.9 132.1 234.9 18.1% Customer support services 219.3 115.6 63.0 9.3 407.2 31.3% Other 3.0 0.5 — — 3.5 0.3% Total $ 681.0 $ 216.2 $ 254.9 $ 147.6 $ 1,299.7 100.0% Revenue percentage by operations 52.4% 16.6% 19.6% 11.4% 100.0%
($ millions) Three months ended June 30 2005 Canada
South America UK Hewden Consolidated
Revenue percentage
New mobile equipment $ 188.5 $ 124.6 $ 118.0 $ 5.1 $ 436.2 34.3% New power & energy systems 41.5 27.4 35.5 — 104.4 8.2% Used equipment 56.0 8.5 38.0 6.0 108.5 8.6% Equipment rental 43.3 12.3 50.4 152.5 258.5 20.3% Customer support services 179.6 100.8 71.4 10.8 362.6 28.5% Other 0.6 0.7 — — 1.3 0.1% Total $ 509.5 $ 274.3 $ 313.3 $ 174.4 $ 1,271.5 100.0%
Revenue percentage by operations 40.1% 21.6% 24.6% 13.7% 100.0%
($ millions) Six months ended June 30 2006 Canada
South America UK Hewden Consolidated
Revenue percentage
New mobile equipment $ 522.7 $ 157.7 $ 185.9 $ 5.4 $ 871.7 34.3% New power & energy systems 101.0 27.1 75.5 — 203.6 8.0% Used equipment 110.1 23.5 54.3 8.0 195.9 7.7% Equipment rental 109.7 18.7 77.0 260.9 466.3 18.3% Customer support services 431.5 219.9 128.5 19.6 799.5 31.4% Other 5.9 1.0 — — 6.9 0.3% Total $ 1,280.9 $ 447.9 $ 521.2 $ 293.9 $ 2,543.9 100.0% Revenue percentage by operations 50.3% 17.6% 20.5% 11.6% 100.0%
($ millions) Six months ended June 30 2005 Canada
South America UK Hewden Consolidated
Revenue percentage
New mobile equipment $ 367.4 $ 221.8 $ 218.9 $ 8.4 $ 816.5 33.7% New power & energy systems 74.1 47.7 66.7 — 188.5 7.8% Used equipment 123.8 15.5 64.9 11.7 215.9 8.9% Equipment rental 88.4 22.3 100.3 295.5 506.5 20.9% Customer support services 341.3 193.2 138.5 21.4 694.4 28.6% Other 2.1 1.0 — — 3.1 0.1% Total $ 997.1 $ 501.5 $ 589.3 $ 337.0 $ 2,424.9 100.0%
Revenue percentage by operations 41.1% 20.7% 24.3% 13.9% 100.0%
Finning International Inc. Second Quarter 2006 Results
12
Canadian Operations The Canadian operating segment primarily reflects the results of the Company’s operating division, Finning (Canada). This reporting segment also includes the Company’s interest in OEM Remanufacturing Company Inc. (OEM), which became fully operational late in the second quarter of 2005. OEM is a component rebuild facility based in Edmonton, Alberta.
The table below provides details of the results from the Canadian operating segment:
Three months ended
June 30 Six months ended
June 30
($ millions) 2006 2005 2006 2005 Revenue from external sources $ 681.0 $ 509.5 $ 1,280.9 $ 997.1 Operating costs 589.1 442.3 1,109.7 863.8 Depreciation and amortization 34.2 26.0 66.8 53.4 Other expenses (income) — — (10.0) 0.5 Earnings before interest and taxes $ 57.7 $ 41.2 $ 114.4 $ 79.4 Earnings before interest and taxes - as a percentage of revenue 8.5% 8.1% 8.9% 8.0% - as a percentage of consolidated earnings before interest and taxes 61.3% 51.2% 60.8% 53.0% Canada – Revenue ($ millions) Three months ended June 30
509.
5 681.
0
0
400
800
2005 2006
Canada – Revenue ($ millions) Six months ended June 30
997.
1 1,28
0.9
0
800
1,600
2005 2006
Record quarterly results were achieved in the Company’s Canadian operations in the second quarter of 2006. Revenues, which were the strongest quarterly revenues ever recorded, increased 33.7% over the 2005 levels to $681.0 million. This reflects continued strength in Alberta and British Columbia based operations. The increase in revenues was attributable to significant strength in the mining, petroleum and construction sectors driven by strong commodity and energy prices as well as higher levels of infrastructure spending. Power and energy systems revenues were also strong in the quarter primarily due to deliveries into major shipbuilding projects.
Finning International Inc. Second Quarter 2006 Results
13
Canada – Revenue by Line of Business ($ millions) Three months ended June 30
188.
5
41.5
56.0
43.3
179.
6
0.6
294.
2
219.
3
47.8
55.5
61.2
3.0
0
100
200
300
New Equip Power &Energy
UsedEquip
EquipRental
CSS Other
2005 2006
Canada – Revenue by Line of Business ($ millions) Six months ended June 30
367.
4
74.1 12
3.8
88.4
341.
3
2.1
522.
7
431.
5
101.
0
109.
7
110.
1
5.9
0
200
400
600
New Equip Power &Energy
UsedEquip
EquipRental
CSS Other
2005 2006
A 9.8% strengthening of the Canadian dollar relative to the U.S. dollar in the second quarter of 2006 over the prior year had a negative impact of approximately $25 million on Finning (Canada)’s revenues when translating its U.S. dollar based revenues. In spite of this, revenues from all lines of business in Canada increased over second quarter 2005 levels, most notably in new equipment. In the second quarter of 2006, over 300 additional new equipment units were delivered than in the same period of 2005 to meet the extremely strong market demand. Finning (Canada) also experienced higher revenues in customer support services mostly due to higher demand for parts, price realization and the incremental revenues related to fuel and lubricant sales from the Company’s alliance with Shell. This alliance contributed approximately 46% of the quarterly 2006 increase in customer support service revenues, albeit at lower margins than that of the traditional dealership parts business. Rental revenues increased over the 2005 comparable period as a result of a higher investment in rental assets due to increased customer demand for both rental purchase options on equipment packages and rentals on smaller machinery units offered by the Cat Rental Stores. In the second quarter of 2006, Finning (Canada) added one additional rental location to help meet customer demand and now operates 28 Cat Rental Stores.
New equipment orders from customers continue to outpace prior year volumes and as a result, backlog remains strong due to the record number of sales orders. Backlog reflects the strong activity in the mining, petroleum, and construction sectors where the Canadian operations operate.
On a year-to-date basis, revenues increased 28.5% to $1,280.9 million, in spite of the negative foreign exchange impact of approximately $45 million.
In Canada, higher gross profits were achieved due to strong customer demand and price realization. Gross profit as a percentage of revenue declined slightly from that achieved in the second quarter of 2005. The Canadian operations experienced a modest shift in the mix of revenues in 2006 towards equipment sales, which attract a lower margin than the customer support services business. In addition, customer support services margins were lower in 2006 due to the Shell alliance business. Finning (Canada) experienced improved equipment margins and improved rental margins from the Cat Rental Store due to strong demand.
Finning International Inc. Second Quarter 2006 Results
14
Canada – EBIT ($ millions) Three months ended June 30
41.2
57.7
0
20
40
60
2005 2006
Canada – EBIT ($ millions) Six months ended June 30
79.4
114.
4
0
40
80
120
2005 2006
The Canadian operations experienced higher SG&A costs in the second quarter of 2006 largely due to a higher number of employees to support record activity levels and meeting customer demands. This was offset by cost efficiencies resulting from the implementation of various projects. As a percentage of revenue, SG&A is lower in the second quarter of 2006 compared with the same period last year, reflecting cost containment.
Key factors affecting the SG&A increase in 2006 compared with 2005 for the Company’s Canadian operations include:
Customer service demand increased as a result of servicing a higher number of maintenance contracts and higher activity as equipment was prepared for delivery to customers. As a result of this increased demand, the Canadian operations added revenue-generating employees and support staff and incurred additional costs for recruitment, relocation and training. Headcount for Finning (Canada) increased by approximately 490 or 16% compared to June 2005 and as a result, higher salaries, benefit and pension costs were incurred in the second quarter of 2006.
Higher costs incurred by OEM which was not in full production until the latter part of the second quarter of 2005. These higher costs supported the increased activity and higher gross profit earned by OEM in 2006.
Lower long-term incentive plan (LTIP) costs reflecting the positive mark to market adjustment in the second quarter of 2006 reflecting the movement of the Company’s share price.
Record revenues due to strong demand and activity in the Canadian operations, partially offset by higher SG&A costs, translated into a strong contribution by the Company’s Canadian operating segment achieving an EBIT of $57.7 million in the second quarter of 2006 compared with $41.2 million in the same period in 2005. This reflects an improved EBIT margin (EBIT divided by revenues) of 8.5% in the second quarter of 2006, up from 8.1% last year.
Quarterly trends noted above also hold for the year-to-date results of the Company’s Canadian operations. Excellent returns from the Canadian operations, together with gains on sale of property and businesses in the first quarter of 2006 resulted in an EBIT of $114.4 million for the six months ended June 30 2006, compared with $79.4 million for the same period in the prior year, an increase of 44.1%.
Finning International Inc. Second Quarter 2006 Results
15
South America The Company’s South American operations include the results of its Caterpillar dealerships in Chile, Argentina, Uruguay and Bolivia.
The table below provides details of the results from the South American operations:
Three months ended
June 30 Six months ended
June 30
($ millions) 2006 2005 2006 2005 Revenue from external sources $ 216.2 $ 274.3 $ 447.9 $ 501.5 Operating costs 186.5 243.1 385.9 438.9 Depreciation and amortization 6.0 6.9 12.4 12.5 Earnings before interest and taxes $ 23.7 $ 24.3 $ 49.6 $ 50.1 Earnings before interest and taxes - as a percentage of revenue 11.0% 8.9% 11.1% 10.0% - as a percentage of consolidated earnings before interest and taxes 25.2% 30.2% 26.3% 33.4% South America – Revenue ($ millions) Three months ended June 30
274.
3
216.
2
0
200
400
2005 2006
South America – Revenue ($ millions) Six months ended June 30
501.
5
447.
9
0
200
400
600
2005 2006
Revenues for the second quarter of 2006 at $216.2 million were lower than the 2005 level by 21.2%, reflecting the negative impact of a 9.8% strengthening of the Canadian dollar relative to the U.S. dollar. In local currency (U.S. dollar), Finning South America revenues decreased 12.4% reflecting lower new equipment revenues in 2006 partially offset by higher customer support services revenues. The strong commodity cycle and near record high metal prices, together with strong economic growth in the countries in which Finning South America operates, continues to fuel the demand for investment. Infrastructure spending is commencing after a period of indecision following the election of a new government in Chile. Growth experienced in customer support services is a result of servicing the numerous mining maintenance and repair contracts entered into over the past couple of years. As a result, South American operations experienced a significant revenue mix shift from equipment sales towards higher margined customer support services.
New equipment order backlog continues to be strong and is higher than March 2006, December 2005 and June 2005 levels.
On a year-to-date basis, revenues decreased 10.7% to $447.9 million. Excluding the foreign currency translation impact of a stronger Canadian dollar, revenue decreased by only 3.0% in local currency.
Finning International Inc. Second Quarter 2006 Results
16
South America – Revenue by Line of
Business ($ millions) Three months ended June 30
124.
6
27.4
8.5 12.3
100.
8
0.7
70.5
115.
6
12.6
9.4
7.6
0.5
0
50
100
150
New Equip Power &Energy
Used Equip Equip Rental CSS Other
2005 2006
South America – Revenue by Line of
Business ($ millions) Six months ended June 30
221.
8
47.7
15.5
22.3
193.
2
1.0
157.
7 219.
9
27.1
18.7
23.5
1.0
0
100
200
300
New Equip Power &Energy
Used Equip Equip Rental CSS Other
2005 2006
South America – EBIT ($ millions) Three months ended June 30
24.3
23.7
0
20
40
2005 2006
South America – EBIT ($ millions) Six months ended June 30
50.1
49.6
0
20
40
60
2005 2006
In local currency, gross profit increased in the second quarter of 2006 in absolute terms and as a percentage of revenue. This occurred due to the revenue mix shift towards customer support services and by stronger margins in all lines of business, partially through price realization. Higher costs were incurred to manage the higher number of long-term maintenance and repair contracts and to meet customer demand as certain parts are in short supply. Management continues to work with Caterpillar to reduce supply constraints on certain key parts in order to reduce costs and improve customer service.
Finning South America has implemented certain initiatives and has numerous other initiatives underway to reduce SG&A costs. From these, Finning South America is continuing to get good results and savings. Although SG&A costs were lower in the second quarter of 2006 compared with 2005 in Canadian dollar terms, in local currency these costs were at a comparable level. Lower variable equipment costs were offset by higher customer support services variable costs. As a result of the increased customer service demand due to a higher number of service maintenance contracts, additional revenue-generating employees and support staff of 368 have been hired, representing a 9.3% increase over June 2005. As a result, higher salaries and benefit costs were incurred in the second quarter of 2006.
In local currency, EBIT improved 9.4% in the second quarter of 2006 compared to the prior year. When translated into Canadian dollars, EBIT of $23.7 million in 2006 was 2.5% lower than the same period in 2005. EBIT as a percentage of revenue for Finning South America at 11.0% was up from 8.9% in 2005 and continued at the highest contribution rate of all operations.
Year-to-date, EBIT of $49.6 million was at a similar level compared to the same period last year, but in local currency, EBIT improved 7.5%. Quarterly trends noted above are similar for the year-to-date results.
Finning International Inc. Second Quarter 2006 Results
17
United Kingdom (“UK”) Group The UK Group includes the Company’s UK Operations and Hewden Operations, described below.
UK Operations The Company’s UK Operations include the results of Finning (UK) which operates the Caterpillar dealership in the U.K. (Construction Equipment and Power Systems divisions) and the UK Materials Handling business. Also included in the UK Operations is Diperk UK, sole distributor of Perkins engines in the U.K. marketplace.
The table below provides details of the results from the UK Operations:
Three months ended
June 30 Six months ended
June 30
($ millions) 2006 2005 2006 2005 Revenue from external sources $ 254.9 $ 313.3 $ 521.2 $ 589.3 Operating costs 227.5 284.2 468.3 535.4 Depreciation and amortization 16.2 20.2 32.8 41.0 Other expenses (income) 0.4 (0.3) 1.4 (0.4) Earnings before interest and taxes $ 10.8 $ 9.2 $ 18.7 $ 13.3 Earnings before interest and taxes - as a percentage of revenue 4.2% 2.9% 3.6% 2.3% - as a percentage of consolidated earnings before interest and taxes 11.5% 11.4% 9.9% 8.9% UK – Revenue ($ millions) Three months ended June 30
313.
3
254.
9
0
200
400
2005 2006
UK – Revenue ($ millions) Six months ended June 30
589.
3
521.
2
0
400
800
2005 2006
Revenues in the second quarter of 2006 of $254.9 million were down by 18.6% from the prior year. Excluding the impact of foreign currency translation resulting from the 11.2% strengthening of the Canadian dollar relative to the U.K. pound sterling, revenues in the UK Operations decreased 8.5% in local currency over the prior year. This reflected lower revenues from the Construction Equipment and Materials Handling divisions, partially offset by a stronger performance in the Power Systems division.
On a year-to-date basis, revenues decreased 11.6% to $521.2 million. In local currency, total revenue was at a similar level to that reported in the first six months of 2005. Construction Equipment revenues for the first six months of 2006 were at a similar level as that achieved in 2005 with stronger customer support service activity offsetting the lower equipment sales which has been somewhat affected by product availability and allocations of product supply. Power Systems revenues increased 26% in local currency, supported by the completion of a number of large power generation projects, which more than offset the 11% shortfall in revenues experienced by the Materials Handling division.
Finning International Inc. Second Quarter 2006 Results
18
UK – Revenue by Line of Business ($ millions) Three months ended June 30
118.
0
35.5
38.0 50
.4 71.497
.4
63.0
32.9
37.9
23.7
0
50
100
150
New Equip Power &Energy
Used Equip Equip Rental CSS
2005 2006
UK – Revenue by Line of Business ($ millions) Six months ended June 30
218.
9
66.7
64.9 10
0.3
138.
5
185.
9
128.
5
75.5
77.0
54.3
0
100
200
300
New Equip Power &Energy
Used Equip Equip Rental CSS
2005 2006
UK – EBIT ($ millions) Three months ended June 30
9.2 10
.8
0
10
20
2005 2006
UK – EBIT ($ millions) Six months ended June 30
13.3
18.7
0
10
20
2005 2006
Revenues, in local currency, were lower across all lines of business in the second quarter of 2006 compared to one year ago. In spite of increased new equipment unit deliveries to customers by the Construction Equipment division, the majority of deliveries were generally smaller units leading to lower sales revenue. However, strong activity in the mining sector continued from the first quarter of 2006 with higher coal prices driving increased extraction activity in the U.K. and was higher than the second quarter of 2005. Sales revenue for new power and energy systems benefited from a strong performance in the pleasure craft sector in the second quarter of 2006. New order backlog at June 2006 eroded slightly from March 2006 levels but continues to be up from December 2005 levels.
Used equipment revenues for both Construction Equipment and Materials Handling divisions were lower in the second quarter of 2006 from that achieved in 2005 due to the lack of used equipment being available for sale. Customer support services in the UK operation were similar to those achieved in the same quarter last year.
In local currency, revenue for the second quarter of 2006 from the Materials Handling division of the UK Operations was 19.2% lower than the same period last year and reflects lower revenues in both rental revenues and equipment sales. Downward trends experienced in the materials handling rental activity in 2005 continued into 2006, and as a result, rental revenues were lower on a smaller rental fleet.
Gross profit in the second quarter of 2006 for the UK Operations was lower in absolute terms compared with the same period last year due to the stronger Canadian dollar. In local currency, gross profit decreased 2.4% over last year’s second quarter due primarily to lower volumes. Gross profit margin as a percentage of revenue was higher than 2005 due to gross profit margin improvements.
Finning International Inc. Second Quarter 2006 Results
19
SG&A costs decreased in the second quarter of 2006 compared to the same period of 2005 partially as a result of lower volumes but also as a result of various initiatives and management’s focus on realizing cost efficiencies. Key factors affecting SG&A costs include:
Lower costs in the Materials Handling division of approximately 15% reflecting headcount reductions in 2005
Lower information system charges totalling over $1.4 million Lower LTIP costs of $1.1 million Lower pension costs of $1.6 million as changes to employee pensionable benefits announced in the
fourth quarter of 2005 were implemented
For the second quarter, the UK Operations contributed $10.8 million of EBIT in 2006, 17.4% higher than the EBIT of $9.2 million recorded in 2005, reflecting improvements in the Construction Equipment and particularly in the Power Systems Division. EBIT as a percentage of revenue also increased to 4.2% in the second quarter of 2006 from 2.9% in the comparative period last year.
Year-to-date, EBIT improved 40.6% compared to the same period last year, and in local currency, EBIT improved 58.5% with improved contributions from all divisions.
Finning International Inc. Second Quarter 2006 Results
20
Hewden Operations Hewden is an equipment rental and associated services operation in the United Kingdom.
The table below provides details of the results from Hewden:
Three months ended
June 30 Six months ended
June 30
($ millions) 2006 2005 2006 2005 Revenue from external sources $ 147.6 $ 174.4 $ 293.9 $ 337.0 Operating costs 104.9 121.1 210.1 240.6 Depreciation and amortization 31.4 35.8 62.5 70.8 Other expenses (income) 4.4 2.8 4.0 4.3 Earnings before interest and taxes $ 6.9 $ 14.7 $ 17.3 $ 21.3 Earnings before interest and taxes - as a percentage of revenue 4.7% 8.4% 5.9% 6.3% - as a percentage of consolidated earnings before interest and taxes 7.3% 18.3% 9.2% 14.2% Hewden – Revenue ($ millions) Three months ended June 30
174.
4
147.
6
0
100
200
2005 2006
Hewden – Revenue ($ millions) Six months ended June 30
337.
0
293.
9
0
200
400
2005 2006
Hewden revenues decreased 15.4% to $147.6 million for the second quarter of 2006 compared with 2005, and in local currency, revenues decreased 4.7%. The decrease in revenues is mainly attributed to two fewer business days in the second quarter of 2006 than the same period of the prior year, continued competitive pressures in the U.K. rental marketplace and lower ex-rental asset disposals. In addition, a sales force re-structure, focused on improving the efficiency of the sales organization, began in the first quarter of 2006 and has had a short term effect on revenues. This restructuring was completed during the second quarter of 2006.
On a year-to-date basis, revenues decreased 12.8% to $293.9 million. In local currency, revenues were at similar levels to those reported in the first six months of 2005.
Gross profit for the second quarter of 2006 decreased in absolute terms in both volume and margins, consistent with the decrease in rental revenues, lower recovery of consumables and fuel costs compared to the same period last year.
In local currency, Hewden’s SG&A costs increased 4.4% in the second quarter of 2006 and were affected by:
Higher costs associated with credit and collection functions, primarily reflecting a continuing higher level of business failures being experienced in the U.K. construction industry.
Higher employee costs due to inflation partially offset by employee headcount reductions as a result of cost-saving initiatives.
Finning International Inc. Second Quarter 2006 Results
21
Hewden – Revenue by Line of Business ($ millions) Three months ended June 30
5.1
6.0
152.
5
10.8
2.3 3.9 9.3
132.
1
0
100
200
New Equip Used Equip Equip Rental CSS
2005 2006
Hewden – Revenue by Line of Business ($ millions) Six months ended June 30
8.4
11.7
295.
5
21.4
5.4
8.0 19
.6
260.
9
0
200
400
New Equip Used Equip Equip Rental CSS
2005 2006
Hewden – EBIT ($ millions) Three months ended June 30
14.7
6.9
0
10
20
2005 2006
Hewden – EBIT ($ millions) Six months ended June 30
21.3
17.3
0
20
40
2005 2006
The U.K. market is extremely competitive, especially in the plant and tool hire businesses. This is clearly evident in Hewden’s results where utilization rates have declined. Efforts are underway to improve revenues and operational results. Hewden continues to focus on various inter-related projects to improve financial performance and efficiencies in meeting the needs of a core customer base. These projects, in conjunction with Hewden’s new information technology system, are expected to increase asset utilization and reduce costs. Project costs relating to these initiatives are expected to continue thoughout 2006 and 2007. In the second quarter of 2006, $3.8 million of costs included in other expenses relate to these projects. Progress on projects continued in the quarter, albeit slower in some areas while focus was placed on Hewden’s new information technology system which will simplify business processes and provide a lower cost per transaction.
In July 2006, to better serve its customers and improve returns, Hewden announced the restructuring of its Cranes business model from a widespread rental depot approach to an approach centered in three regions with management focus on each region. Projects such as this may result in a short term adverse impact on revenues as resources and management are deployed in the implementation of these initiatives to generate long-term benefits.
Hewden contributed $6.9 million of EBIT in the second quarter of 2006 compared with $14.7 million in 2005, a 53.1% decrease, reflecting the impact on revenues, margins and SG&A and other items discussed above, and the adverse impact of a stronger Canadian dollar when translating Hewden’s results from U.K. pound sterling. EBIT as a percentage of revenues decreased from 8.4% last year to 4.7% in 2006.
Year-to-date, EBIT decreased 18.8% compared to the same period last year. In local currency, EBIT decreased 7.9% compared to that reported in the first six months of 2005. EBIT as a percentage of revenues decreased from 6.3% last year to 5.9% in 2006.
Finning International Inc. Second Quarter 2006 Results
Operating costs of $5.0 million in the second quarter of 2006 were 43.8% lower than the second quarter of 2005, largely due to lower LTIP costs as a result of a positive mark to market adjustment in 2006 reflecting the movement in the Company’s share price.
For the six months ended June 30 2006, operating costs were $11.7 million, compared with $16.0 million for the same period in 2005 reflecting lower LTIP costs and improved equity returns from the Company’s investment in Energyst. In 2005, the Company reported a $1.8 million gain on sale of its investment in Maxim Power Corp.
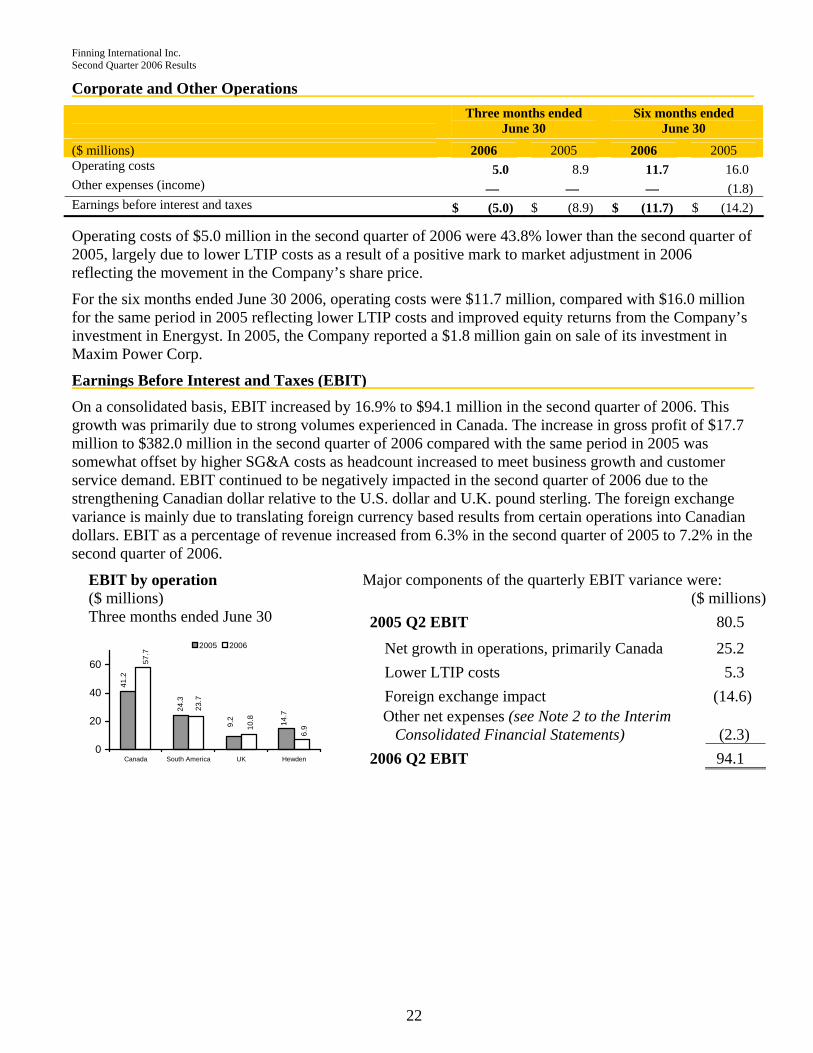
Earnings Before Interest and Taxes (EBIT) On a consolidated basis, EBIT increased by 16.9% to $94.1 million in the second quarter of 2006. This growth was primarily due to strong volumes experienced in Canada. The increase in gross profit of $17.7 million to $382.0 million in the second quarter of 2006 compared with the same period in 2005 was somewhat offset by higher SG&A costs as headcount increased to meet business growth and customer service demand. EBIT continued to be negatively impacted in the second quarter of 2006 due to the strengthening Canadian dollar relative to the U.S. dollar and U.K. pound sterling. The foreign exchange variance is mainly due to translating foreign currency based results from certain operations into Canadian dollars. EBIT as a percentage of revenue increased from 6.3% in the second quarter of 2005 to 7.2% in the second quarter of 2006.
EBIT by operation ($ millions) Three months ended June 30
24.3
41.2
9.2 14.7
6.910
.8
23.7
57.7
0
20
40
60
Canada South America UK Hewden
2005 2006
Major components of the quarterly EBIT variance were: ($ millions) 2005 Q2 EBIT 80.5
Net growth in operations, primarily Canada 25.2 Lower LTIP costs 5.3 Foreign exchange impact (14.6) Other net expenses (see Note 2 to the Interim
Finning International Inc. Second Quarter 2006 Results
23
Year-to-date, EBIT increased by 25.6% to $188.3 million primarily due to the strong demand and activity at the Company’s Canadian operations. In addition, improvements were evident in the UK Operations due to the realization of cost efficiencies. EBIT was negatively impacted in 2006 due to the strengthening Canadian dollar relative to the U.S. dollar and U.K. pound sterling. EBIT as a percentage of revenue increased from 6.2% in the first half of 2005 to 7.4% in the first six months of 2006. The increase in EBIT was also partially due to the gains realized in the first quarter of 2006 on the disposal of surplus properties in Canada and a portion of OEM Remanufacturing’s business. Excluding these gains, EBIT would have been $177.9 million. This growth reflects similar variances as the quarterly impacts above.
EBIT by operation ($ millions) Six months ended June 30
50.1
79.4
13.3
21.3
17.3
18.7
49.6
114.
4
0
100
200
Canada South America UK Hewden
2005 2006
Major components of the year to date EBIT variance were: ($ millions) 2005 YTD EBIT 149.9
Net growth in operations, primarily Canada 49.2 Gain on sale of OEM’s railroad and non-Cat remanufacturing business
5.3
Gain on sale of surplus properties in Canada 5.1 Lower LTIP costs 4.8 Foreign exchange impact (22.9) Other net expenses (see Note 2 to the Interim
Finance Costs Finance costs for the three months ended June 30, 2006 of $19.7 million were 8.4% lower than the comparable period last year primarily due to the following:
• Favourable foreign exchange impact of translating U.K. pound sterling and U.S. denominated finance costs in 2006 with a stronger Canadian dollar, and
• Lower average short-term debt levels.
These decreases were partially offset by higher short-term interest rates. Debt levels decreased in most operations in the second quarter of 2006 as cash was generated from operations and certain spending was deferred.
Year-to-date, finance costs decreased by $4.1 million to $38.0 million.
Provision for Income Taxes Income tax expense for the current quarter was $17.8 million (23.9% effective tax rate) compared with $13.4 million (22.7% effective tax rate) for the same period in 2005. The increase in the effective tax rate is primarily due to a change in the geographic mix of profits with increased income and earnings originating in the higher Canadian tax jurisdiction than in the second quarter of 2005.
The year-to-date income tax expense was $36.8 million (24.5% effective tax rate) compared with $24.8 million (23.0% effective tax rate), also reflecting the change in the earnings mix noted above.
Finning International Inc. Second Quarter 2006 Results
24
Net Income Net income increased 24.1% to $56.6 million in the second quarter of 2006 compared with $45.6 million in the comparative period in 2005 reflecting the strong contributions from the Canadian operation, improved margins, controlled spending and lower LTIP costs. Second quarter 2006 results were tempered by the unfavourable foreign exchange impact of approximately $9.0 million after-tax, primarily due to translating foreign currency based earnings with a stronger Canadian dollar. Basic earnings per share increased to $0.63 in the second quarter of 2006 compared with $0.52 in the comparative period last year.
Year-to-date, net income increased by 36.7% to $113.5 million, reflecting the strength in the Canadian operations, realization of cost efficiencies and gain on sales of surplus properties and business divestitures in Canada in the first quarter of 2006. Basic earnings per share increased to $1.27 from $0.94 in the first half of 2005. Excluding gains on the sale of surplus properties in Canada and a portion of the OEM remanufacturing business, earnings per share would have been $1.17.
Liquidity and Capital Resources
Cash flow after working capital changes($ millions)
117.
4
161.
8
325.
6
189.
6
0
200
400
Q2 YTD
2005
2006
Cash Flow from Operating Activities For the three months ended June 30 2006, cash flow after working capital changes was $189.6 million, compared with cash flow of $117.4 million generated in the same period last year. While cash flow strengthened modestly from the higher operating results in the quarter, the increase was primarily due to stabilizing working capital requirements to meet customer demand, managing product availability issues and continued management focus on improving cash cycle times and operating efficiencies.
For the six months ended June 30 2006, cash flow after working capital changes was $325.6 million, more than double the cash flow generated in the same period last year. In addition to the benefits of operating efficiencies noted above, cash was reduced in 2006 due to higher income tax payments made in Canada relating to 2005 and 2006 tax years.
The Company made a net investment in rental assets of $98.9 million during the second quarter of 2006 (2005: $141.4 million), and a year-to-date net investment of $179.5 million (2005: $210.8 million). Continuing the 2005 trend, fewer rental assets were purchased by the UK Materials Handling business due to lower demand and higher external customer financing. Likewise, expenditures on Hewden’s rental assets have been deferred as rental utilization rates have declined. The gross expenditure of $51.9 million by Hewden on new rental assets for the first six months of 2006 is less than half that experienced in 2005. Rental expenditures increased in Canada as rental fleets are being replenished in 2006, as a result of rental assets being utilized in 2005 to support customer demand and help offset product availability issues.
As a result of these items, cash flow from operating activities was $81.3 million in the second quarter of 2006 (year-to-date: cash flow of $133.1 million) compared to a use of cash of $22.2 million in the second quarter of 2005 (year-to-date 2005: cash use of $47.2 million).
Cash Used For Investing Activities Net cash invested in the second quarter of 2006 totalled $38.6 million (year-to-date 2006: $30.5 million) compared with $30.2 million in the same period in 2005 (year-to-date 2005: $27.6 million). Gross capital additions for the three months ended June 30, 2006 were $18.6 million (year-to-date 2006: $37.6 million) compared with $23.5 million for the three months ended June 30, 2005 (year-to-date 2005: $41.5 million). The capital additions in the first half of 2006 reflect general capital spending to support operations and
Finning International Inc. Second Quarter 2006 Results
25
also included the capitalization of certain costs related to the development of Hewden’s new information system. The capital additions in the first half of 2005 related primarily to cash invested in OEM’s new component rebuild facility which became fully operational late in the second quarter of 2005.
Other investing activities included:
2006:
Payment of the $22.4 million (U.S.$ 20.0 million) purchase price adjustment as a result of meeting performance criteria by the Argentina business acquired in 2003
Proceeds of $13.7 million were received on the settlement of foreign currency forwards that hedged foreign subsidiary investments
Proceeds of $5.3 million were received on the divestiture of a portion of the OEM Remanufacturing business to Caterpillar Inc.
2005
Additional $9.5 million investment in Energyst B.V.
$16.0 million of proceeds were received on the sale of the Company’s investment in Maxim Power Corp.
Financing Activities The Company’s short and long-term borrowings totalled $1,195.6 million, a decrease of $36.1 million or 2.9% since December 31, 2005 primarily due to reductions in borrowings in most operations.
Dividends paid to shareholders were $11.6 million, $1.9 million higher than the second quarter of 2005 due to an increase in the quarterly dividend rate from $0.11 to $0.13 per share announced in early 2006. Similarly, dividends paid to shareholders for the six months ended June 30, 2006 increased 19.1% to $23.2 million.
Risk Management Finning and its subsidiaries are exposed to market, financial and other risks in the normal course of their business activities. The Company has adopted an Enterprise Risk Management approach in identifying and evaluating risks. This risk management approach assists the Company in managing business activities and risks associated with those activities.
The Company is dedicated to a strong risk management culture to protect and enhance shareholder value. The processes within Finning’s risk management function are designed to ensure that risks are properly identified, managed and reported.
The Company discloses all of its key risks in its most recent Annual Information Form (AIF) with key financial risks also included in the Company’s Annual Management’s Discussion & Analysis (MD&A). On a quarterly basis, the Company assesses all of its key risks and any changes to key financial or business risks are disclosed in the Company’s quarterly MD&A. For further details on the management of liquidity and capital resources, financial derivatives and financial risks and uncertainties, please refer to the Company’s AIF and MD&A for the year ended December 31, 2005.
There have been no significant changes or new key risks identified from the key risks as disclosed in the Company’s AIF for the year ended December 31 2005, which can be found at www.sedar.com and www.finning.com.
Finning International Inc. Second Quarter 2006 Results
26
Sensitivity to variances in foreign exchange rates The Company is geographically diversified, with significant investments in several different countries. Finning transacts business in multiple currencies, the most significant of which are the Canadian dollar, the U.S. dollar (USD), the U.K. pound sterling (GBP), the Chilean peso (CHP), and the European euro (EUR). As a result, the Company has a foreign currency exposure with respect to items denominated in foreign currencies. The functional currency of our U.K. based operations is the GBP, the functional currency of our South American based operations is the USD and the functional currency of our Canadian operations is the Canadian dollar. The three main types of foreign exchange risk of the Company are investment in foreign operations, transaction exposure and translation exposure. These are explained further in the 2005 annual MD&A.
The sensitivity of the Company’s net earnings to fluctuations in average annual foreign exchange rates is summarized in the table below. The table assumes that the Canadian dollar strengthens 5% against the currency noted, for a full year relative to the June 2006 month end rates, without any change in local currency volumes or hedging activities.
Currency June 30, 2006 month end rates Increase (decrease) in annual net income
The sensitivities noted above ignore the impact of exchange rate movements on other macroeconomic variables, including overall levels of demand and relative competitive advantages. If it were possible to quantify these impacts, the results would likely be different from the sensitivities shown above.
Description of Non-GAAP Measure EBIT is defined herein as earnings before interest expense, interest income and income taxes and is an alternative measure of performance utilized by management to measure and evaluate the financial performance of its operating segments. It is also a standard measure that is commonly reported and widely used in the industry to assist in understanding and comparing operating results. EBIT is not a defined term under generally accepted accounting principles (GAAP). Accordingly, this measure should not be considered as a substitute or alternative for net earnings or cash flow, in each case as determined in accordance with GAAP.
Finning International Inc. Second Quarter 2006 Results
27
Selected Quarterly Information $ millions, except for share and option data
(1) Earnings per share for each quarter has been computed based on the weighted average number of shares issued and outstanding during the respective quarter; therefore, quarterly amounts may not add to the annual total. Outstanding Share Data As at August 8, 2006 Common shares outstanding 89,389,212 Options outstanding 2,165,363
Finning International Inc. Second Quarter 2006 Results
28
Market Outlook The outlook for Finning's business in western Canada continues to be strong. The region's resource based industries continue to expand and customers' capital expenditures for equipment remain robust. General construction activity continues at very high levels and spending on infrastructure remains strong.
Business in the Company's South American operations also continues at good levels and the outlook remains attractive. The mining industry continues to operate at record levels of profitability. While capital investment in equipment has moderated in the first half of 2006, the expectations for 2007 and 2008 are for continued incremental investment in new equipment by both the mining and general construction businesses.
In the United Kingdom, construction activity continues at reasonable levels and modest expansion is occurring. The UK construction equipment supply and rental businesses remains very competitive with many competitors active in these markets. Equipment sale and rental margins are comparatively tight and rental equipment utilization rates are lower compared to other rental markets. The Company's UK operations are competitive in this marketplace and they continue to focus on high quality customer service and increasing operational efficiencies to improve results.
The Company is being challenged in some instances by a constrained supply for certain types of equipment and engines, as well as some parts. Finning is working closely with Caterpillar, its key supplier, to manage supply constraints and Caterpillar is working to improve availability. Large mining equipment and certain parts for this equipment is in shortest supply. An improvement in availability of some models of construction equipment is beginning to occur.
Finning’s financial results are negatively impacted by a stronger Canadian dollar compared to the U.S. dollar and the U.K. pound sterling in the translation of its foreign currency earnings. The Company’s remaining 2006 results will continue to be negatively impacted as a result of translating foreign currency based earnings should the strength of the Canadian dollar continue against the U.S. dollar and the U.K. pound sterling. Notwithstanding the stronger Canadian dollar, the Company has been successful in improving its profitability.
The Company wide cost reduction plan to reduce costs by $60 million by the end of 2006 remains on track and Finning expects to attain the target by January 1, 2007. To date, projects have been completed that will generate over $50 million of cost savings.
Finning's key customers continue to be very active and are growing their businesses. The current economic conditions and commodity pricing environment supports further profitable operations for customers and a positive outlook for Finning's medium and long term growth opportunities.
August 8, 2006
Finning International Inc. Second Quarter 2006 Results
Interim Consolidated Financial Statements
29
INTERIM CONSOLIDATED STATEMENTS OF INCOME AND RETAINED EARNINGS (unaudited)
Three months ended
June 30 Six months ended
June 30 ($ thousands, except share and per share amounts) 2006 2005 2006 2005 Revenue
New mobile equipment $ 464,353 $ 436,145 $ 871,713 $ 816,491 New power and energy systems 93,328 104,417 203,549 188,511 Used equipment 96,362 108,457 195,945 215,894 Equipment rental 234,837 258,509 466,281 506,486 Customer support services 407,223 362,651 799,490 694,444 Finance, operating leases and other 3,566 1,354 6,907 3,093
Total revenue 1,299,669 1,271,533 2,543,885 2,424,919 Cost of sales 917,677 907,288 1,805,094 1,732,701 Gross profit 381,992 364,245 738,791 692,218 Selling, general and administrative expenses 283,132 281,229 555,148 539,678 Other expenses (income) (Note 2) 4,783 2,489 (4,683) 2,626 Earnings before interest and taxes 94,077 80,527 188,326 149,914 Finance costs (Note 3) 19,710 21,491 38,024 42,116 Income before provision for income taxes 74,367 59,036 150,302 107,798 Provision for income taxes 17,780 13,391 36,780 24,793 Net income $ 56,587 $ 45,645 $ 113,522 $ 83,005 Retained earnings, beginning of period $ 1,020,590 $ 877,936 $ 975,254 $ 850,321 Net income 56,587 45,645 113,522 83,005 Dividends on common shares (11,621) (9,754) (23,220) (19,499) Retained earnings, end of period $ 1,065,556 $ 913,827 $ 1,065,556 $ 913,827 Earnings per share
Weighted average number of shares outstanding 89,384,069 88,699,778 89,311,262 88,614,905 The accompanying Notes to the Interim Consolidated Financial Statements are an integral part of these statements.
Finning International Inc. Second Quarter 2006 Results Interim Consolidated Financial Statements
Total shareholders’ equity 1,505,200 1,412,978 $ 3,900,233 $ 3,736,388 The accompanying Notes to the Interim Consolidated Financial Statements are an integral part of these statements.
Finning International Inc. Second Quarter 2006 Results
Interim Consolidated Financial Statements
31
INTERIM CONSOLIDATED STATEMENTS OF CASH FLOW (unaudited)
Three months ended
June 30 Six months ended
June 30 ($ thousands) 2006 2005 2006 2005 OPERATING ACTIVITIES
Net income $ 56,587 $ 45,645 $ 113,522 $ 83,005 Add items not affecting cash
Depreciation and amortization 87,808 88,908 174,519 177,649 Future income taxes 2,093 5,286 268 3,267 Stock-based compensation (152) 5,110 3,036 7,812 Other (24) (735) (12,928) (3,097)
146,312 144,214 278,417 268,636 Changes in working capital items
Accounts receivable and other (5,432) 11,868 (44,957) (84,314) Inventories – on-hand equipment 30,894 (15,318) 29,178 (40,094) Inventories – parts and supplies (16,985) (6,794) (36,221) (30,409) Instalment notes receivable (2,106) (7,460) (1,556) 6,930 Accounts payable and accruals 33,061 (8,465) 120,173 32,568 Income taxes 3,899 (617) (19,401) 8,474
Cash provided after changes in working capital items 189,643 117,428 325,633 161,791 Rental equipment, net of disposals (98,890) (141,356) (179,522) (210,768) Equipment leased to customers, net of disposals (9,470) 1,755 (13,021) 1,813
Net additions to capital assets (16,217) (20,734) (27,232) (34,078) Payment of contingent consideration (Note 10) (22,350) — (22,350) — Net proceeds on sale of equity investment — — — 16,000 Investment in equity investment — (9,479) — (9,479) Proceeds on sale of business — — 5,331 — Proceeds on settlement of foreign currency forwards — — 13,723 —
Increase (decrease) in short-term debt (40,945) 57,678 (39,337) 89,388 Repayment of long-term debt (896) (2,199) (2,011) (3,566) Issue of common shares on exercise of stock options 299 4,029 2,811 6,507 Dividends paid (11,621) (9,754) (23,220) (19,499)
Cash provided by (used in) financing activities (53,163) 49,754 (61,757) 72,830 Currency translation adjustments 1,119 (1,270) 298 (1,381) Increase (decrease) in cash and cash equivalents (9,328) (3,902) 41,103 (3,272) Cash and cash equivalents, beginning of period 78,114 16,473 27,683 15,843 Cash and cash equivalents, end of period $ 68,786 $ 12,571 $ 68,786 $ 12,571 Cash flows include the following elements
The accompanying Notes to the Interim Consolidated Financial Statements are an integral part of these statements.
Finning International Inc. Second Quarter 2006 Results
Notes to Interim Consolidated Financial Statements
32
1. SIGNIFICANT ACCOUNTING POLICIES The accompanying unaudited Interim Consolidated Financial Statements have been prepared in accordance with Canadian generally accepted accounting principles on a basis consistent with those disclosed in the most recent audited annual financial statements. These unaudited Interim Consolidated Financial Statements do not include all the information and note disclosures required by generally accepted accounting principles for annual financial statements and therefore should be read in conjunction with the December 31, 2005 audited annual consolidated financial statements and the notes below.
The unaudited Interim Consolidated Financial Statements follow the same accounting policies and methods of computation as the most recent annual consolidated financial statements.
Certain comparative figures have been reclassified to conform to the 2006 presentation.
2. OTHER EXPENSES (INCOME) Other expenses (income) include the following items:
Three months ended
June 30 Six months ended
June 30 ($ thousands) 2006 2005 2006 2005 (Gain) loss on sale of surplus properties in Canada $ — $ 26 $ (5,088) $ 26 Gain on sale of railroad and non-Cat remanufacturing
business in Canada (a)
—
(5,331) — Restructuring and project costs 4,959 3,224 7,199 7,550 Gain on sale of other surplus properties (176) (761) (1,463) (3,123) Gain on sale of equity investment (b) — — — (1,827) 4,783 2,489 (4,683) 2,626 Tax recovery (expense) on net other expenses 1,443 744 (21) 1,192 Other expenses (income), net of tax $ 3,340 $ 1,745 $ (4,662) $ 1,434
(a) In March 2006, the Company sold its railroad and non-Cat engine component remanufacturing business resulting in a pre-tax gain of approximately $5.3 million.
(b) In March 2005, the Company sold its 36% interest in Maxim Power Corporation for cash of $16.0 million, resulting in a pre-tax gain of approximately $1.8 million.
3. SHORT-TERM AND LONG-TERM DEBT
Finance Expense Finance costs as shown on the consolidated statement of income is comprised of the following elements:
Three months ended
June 30 Six months ended
June 30 ($ thousands) 2006 2005 2006 2005 Interest on debt securities:
Finning International Inc. Second Quarter 2006 Results
Notes to Interim Consolidated Financial Statements
33
4. SHARE CAPITAL Common shares issued and outstanding are:
Six months ended
June 30 2006 Twelve months ended
December 31 2005 ($ thousands, except share amounts) Shares Amount Shares Amount Balance, beginning of period 89,201,664 $ 568,121 88,389,881 $ 557,740 Issued – stock options 187,548 2,909 811,783 10,381 Balance, end of period 89,389,212 $ 571,030 89,201,664 $ 568,121
5. STOCK-BASED COMPENSATION PLANS The Company has a number of stock-based compensation plans, which are described below.
Stock Options Details of the stock option plans are as follows:
Six months ended
June 30 2006 Twelve months ended
December 31 2005
Options
Weighted Average
Exercise Price Options
Weighted Average
Exercise Price Options outstanding, beginning of period 1,474,293 $ 19.54 2,016,058 $ 15.08 Issued 884,700 $ 39.50 290,800 $ 32.47 Exercised / cancelled (193,630) $ 18.29 (832,565) $ 13.26 Options outstanding, end of period 2,165,363 $ 27.82 1,474,293 $ 19.54
Exercisable at period end 1,041,484 $ 17.02 1,043,383 $ 14.64
In May 2006, the Company issued 884,700 common share options to senior executives and management of the Company (May 2005: 290,800 common share options). In 2006, long term incentives for executives and senior management were all made in the form of stock options. It is the Company’s practice to grant and price stock options only when it is felt that all material information has been disclosed to the market.
The Company determines the cost of all stock options granted since January 1, 2002 using the fair value-based method of accounting for stock options. This method of accounting uses an option-pricing model to determine the fair value of stock options granted which is amortized over the vesting period. The fair value of the options granted in 2006 has been estimated on the date of grant using the Black-Scholes option-pricing model with the following weighted-average assumptions:
Dividend yield 1.16% Expected volatility 21.32% Risk-free interest rate 4.21% Expected life 5.5 years
Total stock option expense in the second quarter was $1.1 million (2005: $0.5 million) and for the six-month period was $1.7 million ($0.8 million).
Finning International Inc. Second Quarter 2006 Results
Notes to Interim Consolidated Financial Statements
34
Other Stock-Based Compensation Plans Directors Directors’ Deferred Share Unit Plan A (DDSU) The Company offers a Deferred Share Unit Plan (DDSU) for members of the Board of Directors. Under the DDSU Plan, non-employee Directors of the Company may elect to allocate all or a portion of their annual compensation as deferred share units. These units are fully vested upon issuance. These units accumulate dividend equivalents in the form of additional units based on the dividends paid on the Company’s common shares. Units are redeemable for cash or shares only following termination of service on the Board of Directors and must be redeemed by December 31st of the year following the year in which the termination occurred. The value of the deferred share units when converted to cash will be equivalent to the market value of the Company’s common shares at the time the conversion takes place.
Non-employee Directors of the Company were allocated a total of 11,476 share units in May 2006 (May 2005: 14,886 share units), to be issued to the Directors and expensed equally over the 2006 calendar year.
Executive Deferred Share Unit Plan B (DSU-B) Under the DSU-B Plan, executives of the Company may be awarded performance based deferred share units as approved by the Board of Directors. This plan utilizes notional units that become vested partially on December 30th of the year following the year of retirement, death or disability or at specified percentages if the Company’s common share price exceeds specified levels, for ten consecutive days, the common share price at the date of grant. Vested deferred share units are redeemable for a period of 30 days after termination of employment, or by December 31st of the year following the year of retirement, death or disability. The notional deferred share units that have not vested within five years from the date that they were granted expire. Only vested units accumulate dividend equivalents in the form of additional units based on the dividends paid on the Company’s common shares.
Executives of the Company were not awarded any deferred share units in 2006 (six months ended June 30, 2005: 125,400 deferred share units).
There was no vesting activity in the first six months of 2006. In the first six months of 2005, the Company’s share price increased to levels that resulted in the vesting of two tranches of the DSU-B plan. Details of the deferred share unit plans, which reflect the vestings in the period as well as mark-to-market adjustments, for the six-month period ended June 30, as are follows:
Six months ended June 30 2006 2005 Units DSU-A DSU-B DDSU Total DSU-A DSU-B DDSU Total Outstanding, beginning of period 51,783 755,086 158,479 965,348 52,716 723,301 163,072 939,089 Additions during period 346 4,045 9,534 13,925 336 128,503 12,104 140,943 Exercised/cancelled during period — (71,087) — (71,087) — (52,662) — (52,662) Outstanding, end of period 52,129 688,044 168,013 908,186 53,052 799,142 175,176 1,027,370 Vested, beginning of period 51,783 668,761 158,479 879,023 52,716 388,050 163,072 603,838 Vested during period 346 4,045 9,534 13,925 336 126,039 12,104 138,479 Exercised/cancelled during period — (63,087) — (63,087) — (43,658) — (43,658) Vested, end of period 52,129 609,719 168,013 829,861 53,052 470,431 175,176 698,659
Liability ($ thousands) Balance, beginning of period $ 1,923 $24,838 $ 5,886 $ 32,647 $ 1,844 $13,578 $ 5,706 $ 21,128 Expensed during period 16 317 364 697 73 4,960 627 5,660 Exercised/cancelled during period — (2,473) — (2,473) — (1,531) — (1,531) Balance, end of period $ 1,939 $22,682 $ 6,250 $ 30,871 $ 1,917 $17,007 $ 6,333 $ 25,257
Finning International Inc. Second Quarter 2006 Results
Notes to Interim Consolidated Financial Statements
35
Management Share Appreciation Rights Plan (SAR) In 2006, there were no SAR units issued to management. In the second quarter of 2005, 244,120 SAR units were granted to management in the U.K. and Canada at a grant price of $32.44. Details of the SAR plans are as follows: Six months ended June 30 Units 2006 2005 Outstanding, beginning of year 715,000 649,367 Additions during period — 244,120 Exercised/cancelled during period (67,891) (35,998) Outstanding, end of period 647,109 857,489 Vested, beginning of year 286,700 205,073 Vested during period 206,694 217,540 Exercised/cancelled during period (63,974) (33,164) Vested, end of period 429,420 389,449
Liability ($ thousands) Balance, beginning of year 4,655 3,520 Expensed during period 688 1,357 Exercised/cancelled during period (802) (318) Balance, end of period 4,541 4,559
Strike price ranges: $26.05 - $32.44 Changes in the value of all deferred share units and share appreciation rights as a result of fluctuations in the Company’s common share price and the impact of new issues, including stock options, during the current quarter was income of $0.2 million (2005: $5.1 million expense) and during the six-month period was an expense of $3.0 million (2005: $7.8 million). This amount was recognized in selling, general and administrative expenses on the consolidated statement of income.
6. EARNINGS PER SHARE Basic earnings per share is calculated by dividing net income available to common shareholders by the weighted average number of common shares outstanding during the periods. Diluted earnings per share is calculated to reflect the dilutive effect of exercising outstanding stock options by applying the treasury stock method.
($ thousands, except share and per share amounts) Three months ended June 30
Six months ended June 30
2006 Income Shares Per Share Income Shares Per Share Basic earnings per share: net income $ 56,587 89,384,069 $ 0.63 $ 113,522 89,311,262 $ 1.27 Effect of dilutive securities: stock options
— 634,420
—
— 630,418 —
Diluted earnings per share: net income and assumed conversions $ 56,587 90,018,489 $ 0.63
$ 113,522 89,941,680 $ 1.26
2005 Basic earnings per share: net income $ 45,645 88,699,778 $ 0.52 $ 83,005 88,614,905 $ 0.94 Effect of dilutive securities: stock options
— 812,709
—
— 817,628 —
Diluted earnings per share: net income and assumed conversions $ 45,645 89,512,487 $ 0.51
$ 83,005 89,432,533 $ 0.93
Finning International Inc. Second Quarter 2006 Results
Notes to Interim Consolidated Financial Statements
36
7. CURRENCY RATES The Company operates in three functional currencies: Canadian dollars, U.K. pound sterling and U.S. dollars.
The exchange rates of the Canadian dollar against the following foreign currencies were as follows:
Exchange rate as at June 30
2006 December 31
2005 June 30
2005 U.S. dollar 1.1150 1.1659 1.2256 U.K. pound sterling 2.0614 2.0036 2.1973
Average exchange rates three months ended June 30 U.S. dollar 1.1213 1.2438 U.K. pound sterling 2.0505 2.3080
Average exchange rates six months ended June 30 U.S. dollar 1.1382 1.2354 U.K. pound sterling 2.0374 2.3135
8. EMPLOYEE FUTURE BENEFITS The expense for the Company’s benefit plans, primarily for pension benefits, is as follows: Three months ended June 30 2006 2005 ($ thousands) Canada UK Hewden Total Canada UK Hewden Total Defined contribution plans $ 3,129 $ 252 $ 59 $ 3,440 $ 2,521 $ 227 $ 104 $ 2,852 Defined benefit plans 3,315 3,036 1,948 8,299 2,319 4,615 1,763 8,697 Total benefit plan expense $ 6,444 $ 3,288 $ 2,007 $11,739 $ 4,840 $ 4,842 $ 1,867 $11,549 Six months ended June 30 2006 2005 ($ thousands) Canada UK Hewden Total Canada UK Hewden Total Defined contribution plans $ 6,144 $ 497 $ 120 $ 6,761 $ 4,939 $ 428 $ 174 $ 5,541 Defined benefit plans 6,486 6,014 3,871 16,371 4,491 9,388 3,581 17,460 Total benefit plan expense $12,630 $ 6,511 $ 3,991 $23,132 $ 9,430 $ 9,816 $ 3,755 $23,001
Finning International Inc. Second Quarter 2006 Results
Notes to Interim Consolidated Financial Statements
37
9. SEGMENTED INFORMATION The Company and its subsidiaries operate primarily in one industry, that being the selling, servicing, renting and financing of heavy equipment and related products.
The reportable operating segments are:
Three months ended June 30 2006 ($ thousands) Canada
10. COMMITMENTS AND CONTINGENCIES In January 2003, the Company acquired 100% of the voting shares of Macrosa Del Plata S.A. (subsequently renamed Finning Argentina S.A.) and Servicios Mineras S.A. (subsequently renamed Finning Soluciones Mineras S.A.), the Caterpillar dealerships in Argentina. As part of this agreement, the sellers are entitled to additional future consideration based on the realization of certain performance criteria over a six-year period ending December 31, 2008 for the Argentina operations. Any additional consideration is payable only if certain performance criteria are achieved and maintained for a stipulated period. The strong performance of the dealership in Argentina since acquisition to date indicates the maximum future consideration criteria will likely be met, and was recorded in 2005 in accordance with the agreement as $24.7 million (U.S. $21.2 million) to goodwill.
In June 2006, a provisional payment of approximately $14.8 million (U.S. $13.2 million) was paid directly to the sellers, and an additional $7.6 million (U.S. $6.8 million) was paid in trust as partial security and will be paid upon achievement of the performance criteria.