40
Jean Lorber The Nature Conservancy May 2016 Fire effects monitoring on the George Washington/Jefferson National Forest and Strategies for analyzing monitoring data

Jean LorberThe Nature Conservancy
May 2016
Fire effects monitoring on the George Washington/Jefferson National Forest
and
Strategies for analyzing monitoring data

GW Plan ‘Creating diverse conditions’ is a recurring theme
Fire management strategies support a variety of desired conditions and objectives across the GWNF (e.g., to establish, maintain, control or restore forest vegetation, wildlife openings, open woodlands).
Forest and woodland ecological systems support a diversity of tree ages, from regeneration to old growth, providing a relatively stable mix of ecological conditions across the landscape over time.
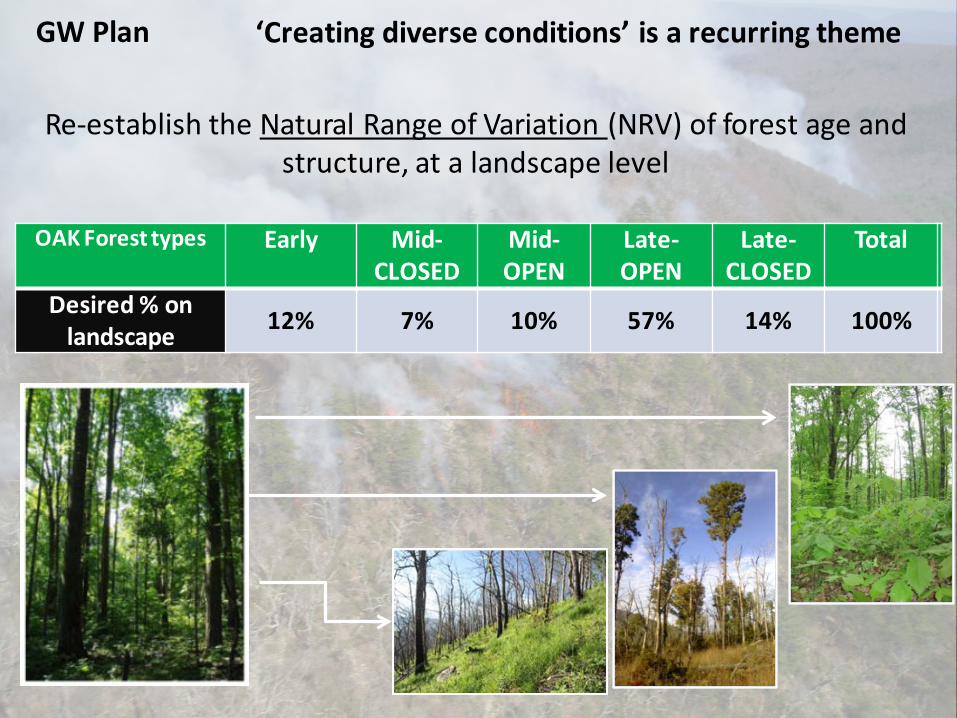
Re-establish the Natural Range of Variation (NRV) of forest age and structure, at a landscape level
OAK Forest types Early Mid-CLOSED
Mid-OPEN
Late-OPEN
Late-CLOSED
Total
Desired % on landscape 100%
GW Plan ‘Creating diverse conditions’ is a recurring theme
OAK Forest types Early Mid-CLOSED
Mid-OPEN
Late-OPEN
Late-CLOSED
Total
Desired % on landscape 12% 7% 10% 57% 14% 100%

Photos of an OPEN gap – canopy cover 30-50%

Photos of an EARLY gap – canopy cover <30%

Photo of a weasel riding a woodpecker

GW-Jeff Plan ‘Creating diverse conditions’ is a recurring theme
Burn Plan objectives:
- Where it occurs, maintain canopy cover of 40%-70%.
- In closed canopy forest, create canopy gaps and cavity trees by non-uniformly killing 10-30% of overstory hardwoods.
- Top kill 30-80% of all small trees and shrubs less than 1”’ DBH

Vegetation Monitoring Program
Started in 2008, consists of 370 plots today• Program designed by TNC, USFS as an FLN project• Program implemented by USFS, with some support
from TNC• Currently drafting report of results
Sampling intensity
• Most units sampled twice: a “baseline” and a “post-burn” sample
• 220 plots
• A few units sampled three times, covering two burn events
• 60 plots

Vegetation Monitoring Dataset issues
Lots of variability in burn unit history, prior to sampling
• Is “baseline” a useful category?
• Recently re-categorized burn units based on burn history:
“baseline” sample event is re-named • Number of burns prior to sampling• Time since last burn
Burn01 Year01
Trade-off: loss of sample size vs better sense of veg response

Vegetation Monitoring Dataset
The effects of a 2nd burn 35 plots in 3 units*
(Burn1 Year5 vs Burn2 Year1)
*includes a unit that burned REALLY hot
The effects of a 1st burn 85 plots in 8 units
(Burn0 Year0 vs Burn1 Year1)

Sampling strata Pre-burn Post 1st burn, year 1
OVE
R-ST
ORY Live basal area (ft2/acre) 84 72 SS
Canopy cover >5ft tall (%) 83% 77% SS
The effects of a 1st burn (n=80)M
ID-
STO
RY Live woody stems/acre (1-4” dbh)shrub species only 125 43 SS
Tree species only 342 126 SS
UN
DER
STO
RY
Live woody stems/acre (<1”dbh and>3.3ft tall) shrub species 1,121 302 SS
tree species 487 986 SS
oaks 108 164maples 138 308 SS
Live woody stems/acre (0.5-3.3 ft. tall)
shrub species only 28,568 63,165 SS
tree species only 7,238 13,340 SS
oak species only 2,419 3,462 SS
maple species only 1,283 2,722Vegetative cover (<3.3ft)
Forbs, grass, vines 6% 13% SS
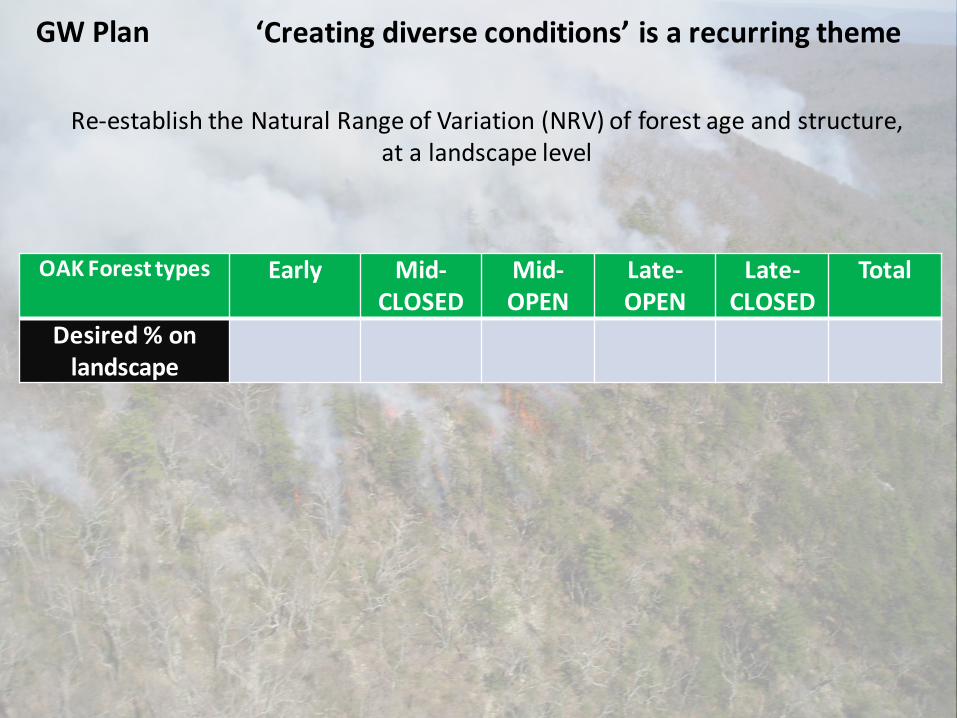
Re-establish the Natural Range of Variation (NRV) of forest age and structure, at a landscape level
OAK Forest types Early Mid-CLOSED
Mid-OPEN
Late-OPEN
Late-CLOSED
Total
Desired % on landscape
GW Plan ‘Creating diverse conditions’ is a recurring theme


There are multiple goals for burning AND multiple conditions arising from burning
Vegetation Monitoring Analysis
Stratification of dataset can address heterogeneity
Stratify based on post-burn condition, using:
• Plot data itself
• Other methodology that categorizes burn unit condition
Represent results using a single average?***
Not the best way to capture and quantify fire’s variable effects

Vegetation Monitoring Analysis
Stratify by plot-level data
• Group all plots according to an important indicator of condition (e.g. basal area)1. All plots with post-burn BA of <30ftsq = EARLY2. All plots with post-burn BA of 30-60 ftsq = OPEN (woodlands)3. All plots with post-burn BA of >60 ftsq = CLOSED
• For any summary, calculate separate average for each category
Drawback: lots of variability in data at plot level, is it a true reflection of the category?
Alternative: stratify by other methodology

• included ~40 large burn units, each burned in late winter/early spring, in 1 day.• Most burns from 1999-2015• Looked a multiple years of leaf-on imagery
Methodology for delineating canopy “gaps”
Part 1. Quantify the extent of canopy mortality resulting from a prescribed fire
• delineated areas where canopy cover had been impacted by burning (aka “gaps”)
from GWNF Plan: EARLY <30% canopy cover OPEN 30-50% canopy cover
Minimum mapping size of ~ 1/4 acreConstant 1:5,000 scale

Two classes of canopy cover (CC) from GWNF PlanOPEN 30-50% CC
EARLY <30% CC
Methodology for delineating canopy “gaps”
17 acres

Canopy gaps after 1 burn

Sampling strata EARLY (n=10)
OPEN (n=10)
CLOSED (n=60)
OVE
R-ST
ORY Live basal area (ft2/acre) 18 a 56 b 83 c
Canopy cover >5ft tall (%) 26 a 68 b 87 c
MID
-ST
ORY Live woody stems/acre (1-4” dbh)
shrub species only 0 0 A 64 ATree species only 11 AB 0 B 214 A
UN
DER
STO
RY
Live woody stems/acre (<1”dbh and>3.3ft tall) shrub species 0 a 0 a 474 a
tree species 1,800 a 2,180 a 648 boaks 1,056 a 270 b 53 b
maples 155 a 890 b 291 aLive woody stems/acre (0.5-3.3 ft. tall) ---Nearest thousand---
shrub species only 143,000 a 129,000 a 38,000 btree species only 26,000 a 21,000 a 9,000 boak species only 13,000 a 4,000 b 2,000 b
maple species only 1,000 a 5,000 a 2,000 bVegetative cover (<3.3ft)
Forbs, grass, vines 9 A 7 A 1 a
The effects of a 1st burn (n=85) P O S T- b u r n s t a t u s

Sampling strata EARLY (n=10)
OPEN (n=10)
CLOSED (n=60)
OVE
R-ST
ORY Live basal area (ft2/acre) 18 A 56 B 83 C
Canopy cover >5ft tall (%) 26 A 68 B 87 C
MID
-ST
ORY Live woody stems/acre (1-4” dbh)
shrub species only 0 a 0 a 64 aTree species only 11 ab 0 a 214 b
UN
DER
STO
RY
Live woody stems/acre (<1”dbh and>3.3ft tall) shrub species 0 a 0 a 474 a
tree species 1,800 a 2,180 a 648 boaks 1,056 a 270 b 53 b
maples 155 a 890 b 291 aLive woody stems/acre (0.5-3.3 ft. tall) ---Nearest thousand---
shrub species only 143,000 a 129,000 a 38,000 btree species only 26,000 a 21,000 a 9,000 boak species only 13,000 a 4,000 b 2,000 b
maple species only 1,000 a 5,000 a 2,000 bVegetative cover (<3.3ft)
Forbs, grass, vines 9 A 7 A 1 a
The effects of a 1st burn (n=85) P O S T- b u r n s t a t u s

Sampling strata EARLY (n=10)
OPEN (n=10)
CLOSED (n=60)
OVE
R-ST
ORY Live basal area (ft2/acre) 18 A 56 B 83 C
Canopy cover >5ft tall (%) 26 A 68 B 87 C
MID
-ST
ORY Live woody stems/acre (1-4” dbh)
shrub species only 0 0 A 64 ATree species only 11 AB 0 B 214 A
UN
DER
STO
RY
Live woody stems/acre (<1”dbh and>3.3ft tall) shrub species 0 a 0 a 474 a
tree species 1,800 b 2,180 b 648 aoaks 1,056 b 270 a 53 a
maples 155 a 890 b 291 aLive woody stems/acre (0.5-3.3 ft. tall) ---Nearest thousand---
shrub species only 143,000 a 129,000 a 38,000 btree species only 26,000 a 21,000 a 9,000 boak species only 13,000 a 4,000 b 2,000 b
maple species only 1,000 a 5,000 a 2,000 bVegetative cover (<3.3ft)
Forbs, grass, vines 9 A 7 A 1 a
The effects of a 1st burn (n=85) P O S T- b u r n s t a t u s

Sampling strata EARLY (n=10)
OPEN (n=10)
CLOSED (n=60)
OVE
R-ST
ORY Live basal area (ft2/acre) 18 A 56 B 83 C
Canopy cover >5ft tall (%) 26 A 68 B 87 C
MID
-ST
ORY Live woody stems/acre (1-4” dbh)
shrub species only 0 0 A 64 ATree species only 11 AB 0 B 214 A
UN
DER
STO
RY
Live woody stems/acre (<1”dbh and>3.3ft tall) shrub species 0 a 0 a 474 a
tree species 1,800 a 2,180 a 648 boaks 1,056 a 270 b 53 b
maples 155 a 890 b 291 aLive woody stems/acre (0.5-3.3 ft. tall) ---Nearest thousand/acre---
shrub species only 143,000 a 129,000 a 38,000 btree species only 26,000 a 21,000 a 9,000 boak species only 13,000 a 4,000 b 2,000 b
maple species only 1,000 a 5,000 a 2,000 bVegetative cover (<3.3ft)
Forbs, grass, vines 9 A 7 A 1 a
The effects of a 1st burn (n=85) P O S T- b u r n s t a t u s

SUMMARY
Re-examining how we’re thinking about and analyzing monitoring data
• More attention paid to burn unit history prior to monitoring
• Report out results that address multiple fire and restoration targets
• Use other methodologies to cross-reference/stratify monitoring dataset

Relate results to new GWNF goals:
Re-establish the Natural Range of Variation (NRV) of forest age and structure, at a landscape level
Oak Forest types EARLY Mid-CLOSED
Mid-OPEN
Late-OPEN
Late-CLOSED
Total
Desired % on landscape 12% 7% 10% 57% 14% 100%
EARLY successional forest
OPEN forest, all ages
12% of acreage67% of acreage
Part 1. Quantify the extent of canopy mortality resulting from prescribed fire

EARLY successional forest (% of acreage)
OPEN forest, all ages (% of acreage)
12%67%
Actual result (1 burn)
4%5%
GW target (oak system)
20%11%
Actual result (3+ burns)
Relate results to new GWNF goals:
Part 1. Quantify the extent of canopy mortality resulting from prescribed fire

Canopy Gaps within Burn Units, after 1 burn
N=28 % OPEN acres % EARLY acres % all gapsAverage 6.2% 6.5% 13%95% C.I. ± 2% ± 3% ± 4%
0%
5%
10%
15%
20%
25%
30%
35%
40%
45%
50%
Big C
obbl
er
Elkh
orn
Grin
dsto
ne
Mor
ris H
ill
Hall s
prin
g
Little
Fork
North
Riv
er
Heav
ener
Dunk
le K
nob
Gaul
ey R
idge
Little
Nea
l…
New
Roa
d Ru
n
Mid
dle
Mtn
Jack
son
Rive
r
Fore
Mou
ntai
n
North
Shor
t…
Gum
Lick
Big W
ilson
…
Brus
hy R
idge
Mar
e Ru
n
Mill
Mou
ntai
n
Cubv
ille
Big W
ilson
Sou
th
Big B
ranc
h
Neal
Run
Little
Schl
oss
Big W
ilson
Lick
…
Fenw
ick M
ines
% o
f bur
n un
it
EARLYOPEN
Questions?CENTRAL APPALACHIANS
Thanks to GWNF staff Lindsay Curtin, Steve Croy, John Moncure and many others


Sampling strata Pre-burn Post 1st burn, year 1
OVE
R-ST
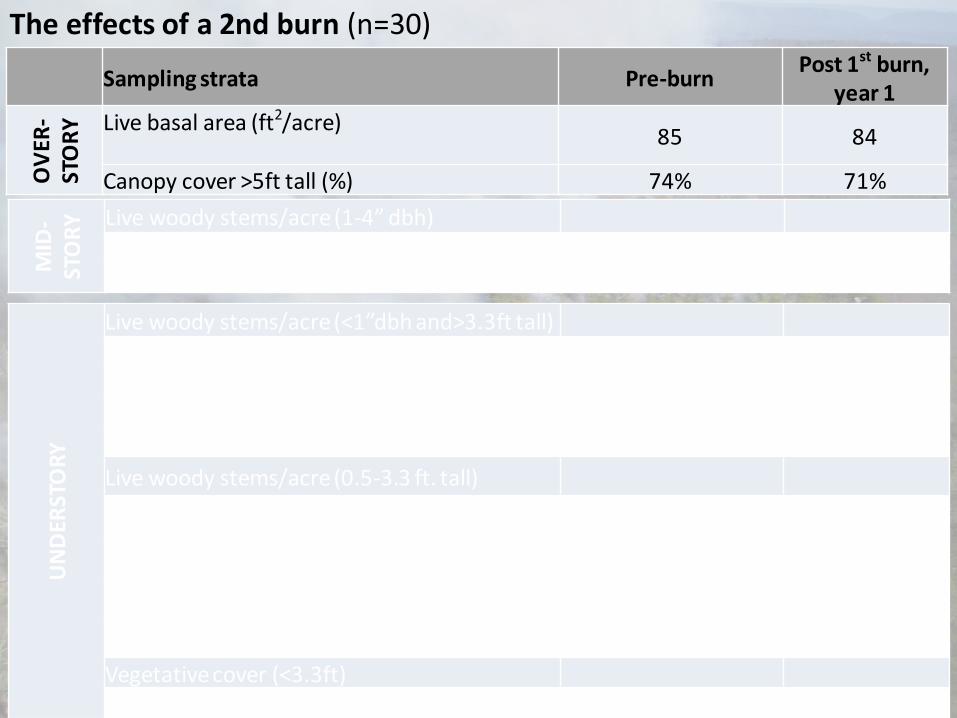
ORY Live basal area (ft2/acre) 85 84
Canopy cover >5ft tall (%) 74% 71%
The effects of a 2nd burn (n=30)M
ID-
STO
RY Live woody stems/acre (1-4” dbh)shrub species only 125 43 SS
Tree species only 342 126 SS
UN
DER
STO
RY
Live woody stems/acre (<1”dbh and>3.3ft tall) shrub species 1,121 302 SS
tree species 487 986 SS
oaks 108 164maples 138 308 SS
Live woody stems/acre (0.5-3.3 ft. tall)
shrub species only 28,568 63,165 SS
tree species only 7,238 13,340 SS
oak species only 2,419 3,462 SS
maple species only 1,283 2,722Vegetative cover (<3.3ft)
Forbs, grass, vines 6% 13% SS

Sampling strata Pre-burn Post 1st burn, year 1
OVE
R-ST
ORY Live basal area (ft2/acre) 84 72 SS
Canopy cover >5ft tall (%) 83% 77% SS
The effects of a 2nd burn (n=30)M
ID-
STO
RY Live woody stems/acre (1-4” dbh)shrub species only 45 12
Tree species only 121 50
UN
DER
STO
RY
Live woody stems/acre (<1”dbh and>3.3ft tall) shrub species 1,121 302 SS
tree species 487 986 SS
oaks 108 164maples 138 308 SS
Live woody stems/acre (0.5-3.3 ft. tall)
shrub species only 28,568 63,165 SS
tree species only 7,238 13,340 SS
oak species only 2,419 3,462 SS
maple species only 1,283 2,722Vegetative cover (<3.3ft)
Forbs, grass, vines 6% 13% SS

Sampling strata Pre-burn Post 1st burn, year 1
OVE
R-ST
ORY Live basal area (ft2/acre) 84 72 SS
Canopy cover >5ft tall (%) 83% 77% SS
The effects of a 2nd burn (n=30)M
ID-
STO
RY Live woody stems/acre (1-4” dbh)shrub species only 125 43 SS
Tree species only 342 126 SS
UN
DER
STO
RY
Live woody stems/acre (<1”dbh and>3.3ft tall) shrub species 1,984 133 SS
tree species 596 403oaks 206 190
maples 118 115Live woody stems/acre (0.5-3.3 ft. tall)
shrub species only 28,568 63,165 SS
tree species only 7,238 13,340 SS
oak species only 2,419 3,462 SS
maple species only 1,283 2,722Vegetative cover (<3.3ft)
Forbs, grass, vines 6% 13% SS


