Page 1
Fire suppressant impacts on flora
of the Swan Coastal Plain
David R. Leach BAppSc (Hons)
This thesis is presented for the degree of Doctor of Philosophy
of The University of Western Australia
School of Plant Biology
The University of Western Australia
Botanic Gardens and Parks Authority
2013
Page 3
i
Abstract
Fire suppressants are now accepted in Australia and worldwide as a useful tool in the
control of wildfires. However, the impacts of fire suppressant chemicals on flora are
poorly understood. Previous research is limited with few suppressant products trialled
on individual aspects of environmental impacts. The purpose of this doctoral thesis is to
cohesively expand knowledge of the off-target impacts of suppressants on native and
introduced flora, thus facilitating best environmental practices during fire suppression
activities. Conducted upon the biodiverse flora of Banksia Woodland on the Swan
Coastal Plain, Western Australia, this research is the most comprehensive study yet
conducted for understanding the impacts of suppressants on plant growth, populations,
and biodiversity.
Experimental trials investigated impacts of ten fire suppressant products on; 1) soil
nutrient content, 2) seeds and seedling emergence, 3) seedling mortality and growth,
and 4) biodiversity and plant populations within Banksia woodland. The selected fire
suppressants comprised of seven short-term foams (Chemguard First Class, Hydrex AR
FFFP, Jet-X Foam, FireAde 2000, Silv-Ex Foam, Ansul3% Fluoroprotein Foam, and
Virtual Training Foam), two polymer gels (Barricade Fire Blocking Gel and ClearETI
Fire Gel), and one long-term retardant (Phos-Chek G75F).
Nutrient content analysis found fire suppressants varied greatly amongst suppressant
products and by suppressant type (foam/gel/retardant). Sulphur (S) was common to
short-term foams (45 to 912 mg/kg). While ammonium (NH4+), S, and phosphorus (P)
were very high within the retardant (28775, 21180, 8586 mg/kg, respectively). Field
trials demonstrate suppressants can significantly elevate soil nutrient concentrations;
Phos-Chek elevated S, NH4+, and P by 19-fold, 18-fold, and 9-fold, respectively. While
soil persistence rarely exceeded three months for foams and gels, Phos-Chek retardant
exhibited persistence of up to 12 months.
Effects of fire suppressants on emergence from seeds was significant and both species-
specific and product-specific, correlating strongly with S and P concentration.
Suppressants often delayed germination and significantly reduced final emergence. In
contrast, emergence of weed species was significantly enhanced.
Page 4
ii
Responses of seedlings to fire suppressants were also species-specific and product-
specific. Seedling mortality was strongly correlated with suppressant S and sodium (Na)
concentration. A fertiliser effect of increased growth and biomass for surviving
seedlings was evident for suppressants with higher nutrient content.
Under two separate field conditions (with fire and without fire) native species
biodiversity remained largely unchanged by fire suppressants. However, suppressants
(particularly Phos-Chek retardant) significantly affected populations of individual
species resulting in altered species composition, with post-fire vegetation more
susceptible. The greatest changes occurred for weed species 12-months after
application, indicating fire suppressant are altering soil seed bank composition.
Overall, experimental trials consistently demonstrate that fire suppressants can affect
flora and alter Banksia woodland communities with potential to similarly affect other
mediterranean ecosystems. Selecting products with reduced nutrient content and
avoiding non-emergency application of suppressants would greatly reduce potential
impacts. Acknowledgedly, the use of suppressant chemicals needs to be balanced
against their operational and financial effectiveness and efficiency, within the aim of
protecting life and property. It is recommended that ecological impacts of fire
suppressants found within this research be appropriately reviewed as part of the
environmental responsibilities of fire control agencies.
Page 7
v
Table of Contents
GENERAL INTRODUCTION
Preliminary Information ............................................................................................ 1
1.0 Introduction to Fire Suppressants .................................................................... 1
2.0 Research Context ............................................................................................... 2
3.0 Scope of Research .............................................................................................. 3
4.0 Brief Overview of the Swan Coastal Plain ........................................................ 4
5.0 Thesis Structure ................................................................................................. 6
5.0 References .......................................................................................................... 7
CHAPTER 1
Nutrient content of fire suppressants and the impact on soil .................................. 11
1.0 Introduction ..................................................................................................... 11
2.0 Methods............................................................................................................ 13
2.1 Analysis of Fire Suppressant Nutrient Content................................................... 13
2.2 Field Site Details ............................................................................................... 13
2.3 Fire Suppressant Treatments .............................................................................. 14
2.4 Fire Suppressant Application ............................................................................. 16
2.5 Soil Sampling .................................................................................................... 17
2.6 Soil Analysis...................................................................................................... 18
2.7 Statistical Analysis............................................................................................. 19
3.0 Results .............................................................................................................. 20
3.1 Fire Suppressant Nutrient Content ..................................................................... 20
3.2 Fire Suppressants and Soil Nutrients .................................................................. 20
4.0 Discussion ......................................................................................................... 27
4.1 Fire Suppressant Nutrient Content ..................................................................... 27
4.2 Fire Suppressant Impact on Soil......................................................................... 28
4.3 Recommendations.............................................................................................. 31
4.4 Conclusion......................................................................................................... 32
5.0 References ........................................................................................................ 34
CHAPTER 2
Assessment of fire suppressant impact on seedling emergence ............................... 39
1.0 Introduction ..................................................................................................... 39
2.0 Methods............................................................................................................ 43
Page 8
vi
2.1 Ex Situ Trials .....................................................................................................43
2.2 In Situ Trials ......................................................................................................46
3.0 Results ..............................................................................................................53
3.1 Ex Situ Trials .....................................................................................................53
3.2 In Situ Trials ......................................................................................................67
4.0 Discussion .........................................................................................................73
4.1 Final Seedling Emergence..................................................................................73
4.2 Emergence Inhibition Patterns............................................................................76
4.3 In Situ Seedling Emergence ...............................................................................78
4.4 Recommendations..............................................................................................80
4.5 Conclusion.........................................................................................................81
5.0 References ........................................................................................................82
CHAPTER 3
Assessment of fire suppressant impact on plant survival and biomass...................85
1.0 Introduction .....................................................................................................85
2.0 Methods ............................................................................................................88
2.1 Seed Selection and Preparation ..........................................................................88
2.2 Propagation of Seedlings....................................................................................89
2.3 Fire Suppressant Treatments ..............................................................................89
2.4 Monitoring Methods ..........................................................................................90
2.5 Biomass Assessment ..........................................................................................90
2.6 Statistical Analysis.............................................................................................90
3.0 Results ..............................................................................................................92
3.1 Seedling Survival...............................................................................................92
3.2 Leading Shoot Length........................................................................................99
3.3 Biomass .............................................................................................................99
4.0 Discussion ....................................................................................................... 101
4.1 Survival ........................................................................................................... 101
4.2 Biomass ........................................................................................................... 102
4.3 Promotion of Weed Species ............................................................................. 103
4.4 Recommendations............................................................................................ 104
4.5 Conclusion....................................................................................................... 105
5.0 References ...................................................................................................... 107
Page 9
vii
CHAPTER 4
Assessment of fire suppressant impacts on two field communities ....................... 111
1.0 Introduction ................................................................................................... 111
2.0 Methods.......................................................................................................... 113
2.1 Field Site Details ............................................................................................. 113
2.2 Fire Suppressant Treatments ............................................................................ 114
2.4 Fire Suppressant Application ........................................................................... 115
2.4 Monitoring Methods ........................................................................................ 117
2.5 Statistical Analysis........................................................................................... 117
3.0 Results ............................................................................................................ 120
3.1 Biodiversity Assessment .................................................................................. 120
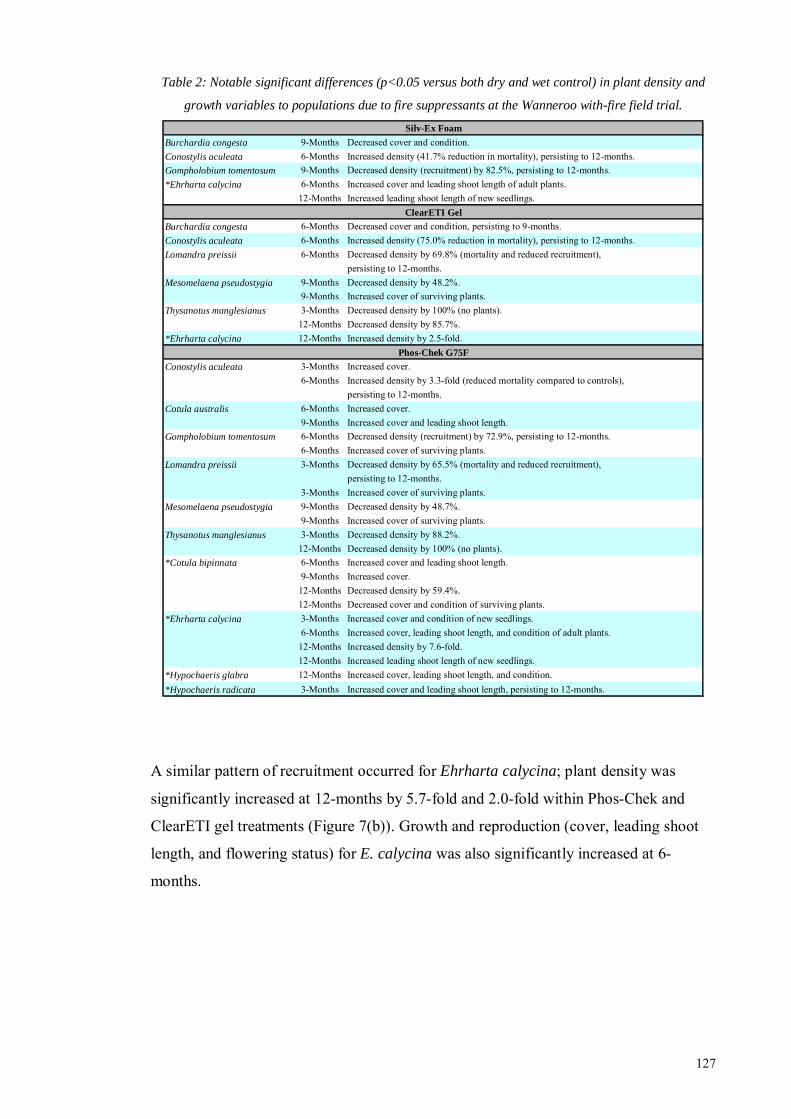
3.2 Population Assessment .................................................................................... 125
4.0 Discussion ....................................................................................................... 129
4.1 Impacts to Biodiversity .................................................................................... 129
4.2 Native Species Populations .............................................................................. 130
4.3 Soil Seed Banks and Weeds ............................................................................. 130
4.4 Recommendations............................................................................................ 131
4.5 Conclusion....................................................................................................... 132
5.0 References ...................................................................................................... 133
GENERAL CONCLUSION
Summary of fire suppressant impacts on flora ...................................................... 137
1.0 Overview of Findings ..................................................................................... 137
2.0 Management Implications ............................................................................. 138
2.1 Considerations for Suppressant Use ................................................................. 138
2.2 Limiting Impacts.............................................................................................. 138
3.0 Suppressant Regulation/Approval ................................................................ 139
4.0 Further Research ........................................................................................... 140
Page 11
ix
List of Appendices
APPENDIX A
Overview of the study fire suppressants…………………………………………… 145
APPENDIX B
Nutrient content and properties of the fire suppressants…………………………… 149
APPENDIX C
Statistical Analyses Output: Suppressant Impact on Soil Nutrient Content……….. 153
APPENDIX D
Statistical Analyses Output: Suppressant Impact on Seedling Emergence………... 169
APPENDIX E
Statistical Analyses Output: Suppressant Impact on Survival of Juvenile Plants…. 175
APPENDIX F
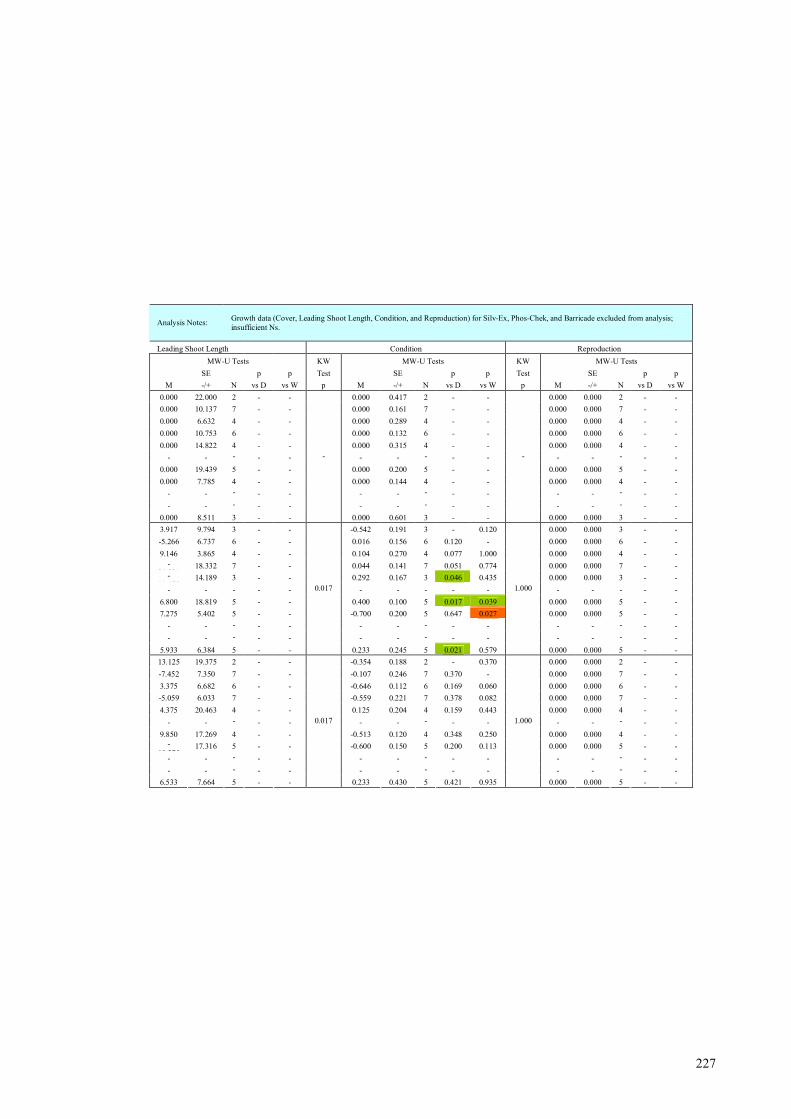
Statistical Analyses Output:
Suppressant Impact on Juvenile Plant Leading Shoot Length……………………... 179
APPENDIX G
Statistical Analyses Output: Suppressant Impact on Juvenile Plant Biomass……... 183
APPENDIX H
Statistical Analyses Output: Suppressant Impact on Plant Communities………….. 193
Page 13
xi
Acknowledgements
I thank my supervisors Dr Deanna Rokich, and Prof Kingsley Dixon for their guidance
and support throughout all aspects of my research. Additionally, thanks to Dr Jason
Stevens for the editing and constructive criticism of the thesis. Thank you to Dr Rohan
Sadler of the University of Western Australia for kindly providing statistical advice.
Your help is all deeply appreciated.
FESA (Fire & Emergency Services Authority) of Western Australia provided all project
funds and postgraduate scholarship for this research. Thank you to Ralph Smith and
David Lamont of FESA for their support and project assistance.
This research was conducted as a project of the Botanic Gardens & Parks Authority,
Western Australia. I am grateful for the opportunity to undertake my studies at Kings
Park; a great research organisation due to its people. Thank you to the diverse collection
of unique individuals at Kings Park who kept almost every moment interesting. An
extra thank you to those coffee break philosophers and debaters (willing and
intentionally provoked) who repeatedly waded into rarely usual discussion.
Thank you to all who selflessly volunteered their time to assist with field work despite
the challenging conditions. Special thanks to Giuseppe Messina, Judy Glencross, Ratna
Sulastin, and Carol Woodcock who assisted with the bulk of the field work, often
insisting on ‘one more plot’.
I feel very fortunate to have the opportunity to attain such a high level of education and
am therefore grateful for the support provided by my family throughout all stages of my
studies. I thank Dad for teaching by example and for the camping trips to Deep Creek
where I was first inspired to explore and learn about the natural environment. I thank
Mum for teaching me creativity and imparting to me a rare and unique view of the
world. I thank my Brother for keeping in contact with me while I was away; you helped
me feel close to my first home.
Finally, I thank all who gave their friendship (all flavours) during my doctoral years,
and wonderful Siying for her patience.
Page 15
1
GENERAL INTRODUCTION
Preliminary Information
1.0 Introduction to Fire Suppressants
Fire suppressants as additives to water have been increasingly used worldwide since
research began in the 1930s (Giminez et al. 2004). Suppressants are now accepted in
Australia and worldwide as a useful tool in the control of wildfires to assist in the
protection of life and property. However, as reviewed by Backer et al. (2004), fire
suppression activities do have ecological impacts on natural communities. Of these, the
impact of fire suppressant chemicals on flora is poorly investigated. The small
collection of studies in this field test few suppressant products on individual aspects of
environmental impacts. The purpose of this doctoral thesis is to cohesively expand
knowledge of the impacts of fire suppressant chemicals on flora, thus facilitating best
environmental practices during fire suppression activities.
Generally, three types of fire suppressants are now recognised; short-term foams, long-
term retardants, and polymer gels (the latter also known as ‘water enhancers’). Foams
are typically composed of surfactants to assist water penetration into fuel, and foaming
agents to produce a physical foam barrier to fuel (Foam Task Group 1993). They are
effective against fire until the water evaporates. Retardants are primarily composed of
ammonium phosphates and ammonium sulphates which create a thin salt crust on fuel
which remains effective even once water evaporates. If in contact with fire, the salts are
converted to phosphoric and sulphuric acid which hinder the complete oxidation of
organic carbon (Gould et al. 2000). Gels are a recent class of suppressant which may
have a reduced environmental impact relative to foams and retardants due to being
composed of inert polymers. They act by providing a physical gel barrier on fuels to
heat and flame, which diminishes as water content in the gel is gradually evaporated.
The use and effectiveness of fire suppressants are summarised within Foam Task Force
et al. (1993), Gould et al. (2000), and Gimenez et al. (2004). Fire suppressants are
typically available as liquid concentrates with some retardants and gels in powder or
fine crystal form. They are added to water prior to use, with mix rates ranging from 1%
to 15%, depending on the suppressant type, product, and intended use. Fire suppressants
Page 16
2
can be used for all stages of fire fighting; prior to fire to form a firebreak, directly on
fire to extinguish flame, and after fire during mop-up activities to prevent reignition.
Additionally, all suppressant types can potentially be used by both ground and air units
and be used in all stages of firefighting. However, long-term retardants are primarily
used by air units for direct attack or to create suppressant containment lines for
approaching fires due to their continued effectiveness once water evaporates. Foams are
used by both air and ground units for a variety of tasks, but are also typically used
during mop-up activities by ground units. With such flexibility of use, suppressants of
all types may be applied to unburnt, burning, and previously burnt vegetation during
suppression operations.
2.0 Research Context
This doctoral research’s aim is to evaluate the impact of fire suppressants on the flora of
the Swan Coastal Plain, southwest Australia. The research was sponsored wholly by the
Fire & Emergency Services Authority of Western Australia and performed jointly by
the Botanic Gardens & Parks Authority and the University of Western Australia.
This research is the first comprehensive study performed worldwide for the impact of
fire suppressants on flora. Previous studies are restricted to three (or less) fire
suppressants with a focus on only one aspect of impacts to flora. The research expands
research to simultaneously test the impacts of ten fire suppressants, on four areas of
import to flora; soil, seeds, seedlings, and in situ populations. The findings are of local
conservation importance, being conducted within the biodiversity hot spot of Southwest
Australia (as defined by Myers et al. 2000).
Regulatory conditions for the use of fire suppressants in Australia are currently limited.
The Australasian Fire & Emergency Service Authority Council states that “only fire
(suppressants) approved for use by the United States’ Department of Agriculture (are)
recommended for use by member agencies in Australia and New Zealand” (AFAC
2011). No additional testing of fire suppressant chemicals is required within Australia.
The USDA’s environmental approval of fire suppressant requires the suppressant to; a)
not contain any listed ‘unacceptable ingredients’, b) adhere to ‘chemicals of concern’
legislation and policy, and c) abide by maximum thresholds to mammal and fish
Page 17
3
toxicity (USDAFS 2007a, 2007b, 2007c). Additionally, short-term foam suppressants
(but not retardants or gels) are required to be “either readily biodegradable or
biodegradable” (USDAFS 2007c), with no minimal standard stated. Importantly, the
USDA’s approval requirements are entirely lab-based with no requirement of fire
suppressants to meet any specific plant toxicity thresholds or field trials.
3.0 Scope of Research
This research investigates the impacts of a range of ten suppressants on flora of the
Swan Coastal Plain. The listed suppressants (Table 1 & Appendix A) were selected by
FESA in 2005 for inclusion to the research as they were either in use, or being
considered for use, to control bushland fires in Western Australia. Short term foams as a
class compose a majority of the suppressants as these are currently widely used and also
Table 1: Overview of fire suppressant products included within experimental trials. Details
as supplied by product manufacturers, and represent the undiluted/concentrate form of the product.
Suppressant Manufacturer Type Composition
Chemguard First Class Chemguard Inc Foam
Water 60-75%, Hexylene glycol 3-7% (by weight). Proprietary mixture of alkyl sulfates, ethoxylates, amphoterics, solvents, and corrosive inhibitors.
Hydrex AR FFFP Sabo Foam srl Foam Ethanediol 1-10%, Fluorosurfactants 0.5-5%.
Jet-X Foam Ansul Incorporated Foam
Ethanol (4%). Mix of sodium and ammonium salts of fatty alcohol sulfates or ether sulfates (C8-C18), higher alcohols, inorganic salts, and water (all >95%).
FireAde 2000 Fire Service Plus Inc Foam Proprietary blend.
Silv-Ex Foam Ansul Incorporated Foam
Proprietary mixture; sodium and ammonium salts of fatty alcohol ether sulfates (C8-C18), higher alcohols, and water (all >70%.). Diethylene glycol monobutyl ether (18%). Ethanol (8%).
Ansul 3% Fluoroprotein Foam
Ansul Incorporated Foam
Hexylene glycol (6.5%). Dichlorophene (0.02%). Proprietary mixture of protein hydrolysate, fluoro-surfactants, inorganic salths, and water (all <90%).
Virtual Foam Buckeye Fire Equipment Company
Foam (Training)
Based on 1% concentration: Water (<59%), Sucrose (>40%), proprietary mixture of bactericide and inorganic salts (>1%).
Phos-Chek G75F ICL Performance Products LP Retardant
Diammonium Sulfate (>65%), Monoammonium Phosphate (>20%), Diammonium Phosphate (<5%), Guar Gum or derivative (<5%), performance additives (<5%).
Barricade Fire Blocking Gel
Barricade International Inc
Gel Polymer Anionic water soluble polymer.
ClearETI Firegel MVP Clear Pty Ltd Gel Polymer Grafted sodium polyacrylate.
Page 18
4
underrepresented in scientific literature. Only a single long-term retardant was included
as a comparative product to the foams, as retardants are similar in composition and
better represented within scientific literature. Two gel products (a relatively new class
of fire suppressant, first USDA approved in 1999) were included as a potential
environmentally friendly alternative to traditional foam and retardant suppressants.
While common flora of the Swan Coastal Plain are the focus species within this study,
results may be relevant throughout Australia; particularly in areas that share southwest
Australia’s mediterranean climate, woodland ecosystem structure, and low fertility
soils. The findings of this research may also be relevant to other fire-prone landscapes
outside of Australia.
It is important to note that the scope of this study is restricted to evaluating what impact
fire suppressants have on flora and to discuss the ecological implications. The ‘whys’
and ‘hows’ of suppressant impacts on flora are not the focus of this research, though
such questions have been touched upon within discussion sections of this thesis.
Additionally, this research does not evaluate the firefighting effectiveness of
suppressants (individually or as a class) against wildland fires. Neither does this
research attempt to weigh the benefits of fire suppressant use against their
environmental and conservation impacts, nor against the legal requirement to protect
life and property. Such investigations are a worthwhile ‘next step’ to this research once
fire suppressant impacts are better understood. But arguably, such investigations are
also best performed by managers, policy writers, and legal practitioners armed with the
knowledge produced from such research as this doctoral thesis.
4.0 Brief Overview of the Swan Coastal Plain
The Swan Coastal Plain (SCP) measures approximately 400 km long and generally less
than 30 km wide, bounded on the west by the Indian Ocean and to the east by the
faulted Yilgarn block (McArthur & Bettenay 1960). Soils of the Plain formed from the
erosion of the Yilgarn block by rivers and streams, and by sea deposition in the west
that included material originally derived from the erosion of the Yilgarn block (Bolland
1998). These soils are predominantly sandy, leached, and generally poor to very poor in
Page 19
5
nutrients (Bolland 1998). Further detail on soils of the SCP is availably within
McArthur (1991).
The climate of the Swan Coastal plain is mediterranean with warm dry summers of five
to six months and winter precipitation ranging between 700 and 1000 mm (Gibson et al.
1994, Figure 1).
The SCP holds the state capital of Perth, the surrounding metropolitan area, and several
major towns that combined contain most of Western Australia’s population. Dominant
land use of the area includes dry land agriculture, conservation, unallocated crown land,
crown reserves, urban, and rural residential (Mitchell et al. 2002).
The dominant vegetation of the SCP is composed of open-canopy Banksia low
woodlands and Tuart woodlands on sandy soil, Allocasuarina obesa on outwash plains,
and paperbark (Melaleuca) in swampy areas (Environment Australia 2000). Banksia
woodlands are a defining plant community of the SCP. A relatively small number of
Banksia species are the dominant trees while the associated understories are diverse and
vary greatly in composition, with low shrubs, herbs, sedges, and grasses typically
containing 72-85% of species (Keighery 2011). The vegetation of the SCP is fire
adapted with flora generally adopting ‘resprouter’ or ‘reseeder’ response strategies. As
an indicator of flora of the SCP, the proportion of resprouters in the south-western
Western Australia plant communities range from 66% to 80% (Bell 2001).
0
20
40
60
80
100
120
140
160
Jan Feb Mar Apr May Jun Jul Aug Sep Oct Nov Dec
Rai
nfal
l (m
m)
0
5
10
15
20
25
30
35
40
Tem
pera
ture
(oC
)
Mean Rainfall
Mean Maximum Temperature
Mean Minimum Temperature
Figure 1: Climate data summary for Perth, located toward the centre of the Swan Coastal Plain, Western
Australia. Data source: Bureau of Meteorology (2012).
Page 20
6
5.0 Thesis Structure
This thesis has been written as a series of four self contained papers, supported by this
preliminary chapter and a concluding summary chapter. Each of the four experimental
chapters has a focus on one area of fire suppressant impacts on flora of the Swan
Coastal Plain. Chapter 1 investigates nutrient content of the fire suppressants and
subsequent impact on in situ soil nutrient content. Chapter 2 examines the impact of
suppressants on seeds and seedling emergence as an indicator of potential impact on
recruitment. Chapter 3 focuses on the impact of suppressants on seedling survival and
growth as an indicator of potential impacts to existing plants. Chapter 4 explores the
impact of suppressants during a twelve month period on species population changes
within a burnt and an unburnt Banksia woodland community.
Page 21
7
5.0 References
AFAC (Australasian Fire & Emergency Service Authority Council) (2011) USDA
Forest Service Wildland Fire Chemicals. Online accessed 18/07/2011, URL
http://knowledgeweb.afac.com.au/research/fire_management/chemicals/usda_fo
rest_service_wildland_fire_chemicals.
Backer, DM, Jensen SE, McPherson GR (2004) Impacts of fire-suppression activities
on natural communities. Conservation Biology 18(4), 937-946.
Bell T (2001) Ecological response syndromes in the flora of southwestern Western
Australia: fire resprouters versus reseeders. The Botanical Review 67, 417-440.
Bolland M (1998) Soils of the Swan Coastal Plain. Department of Agriculture,
Government of Western Australia.
Bureau of Meteorology (2012) Climate data online. Online accessed 27/12/2012, URL
http://bom.gov.au/climate/data/.
Environment Australia (2000) Revision of the interim biogeographic regionalisation for
Australia (IBRA) and development of version 5.1 – Summary Report.
Department of Environment and Heritage, Canberra.
Foam Task Group, Fire Equipment Working Team, National Wildfire Coordinating
Group (1993) Foam vs fire; class A foam for wildland fires (2nd edition).
National Wildfire Coordinating Group, United States of Amercia.
Gibson N, Keighery BJ, Keighery GJ, Burbidge AH, Lyons MN (1994) A floristic
survey of the southern Swan Coastal Plain. Unpublished report for the
Australian Heritage Commission prepared by Department of Conservation and
Land Management and the Conservation Commission of Western Australia,
Australia.
Gimenez A, Pastor E, Zarate L, Planas E, Arnaldos J (2004) Long-term forest fire
retardants: a review of quality, effectiveness, application and environmental
considerations. International Journal of Wildland Fire 13, 1-15.
Gould JS, Khanna PK, Hutchings PT, Cheney NP, Raison RJ (2000) Assessment of the
effectiveness and environmental risk of the use of retardants to assist in wildfire
control in Victoria (CSIRO Forestry and Forest Products Research Report No.
50), Department of Natural Resources and Environment, Victoria, Australia.
Keighery B (2011) Below the knees biodiversity and how we survey it. In ‘Perth’s
Banksia woodlands: precious and under threat. Proceedings of a symposium on
the ecology of these ancient woodlands and their need for protection from
Page 22
8
neglect and destruction’. K Sarti (ed.), pp. 59-64. Urban Bushland Council
(WA), West Perth.
McArthur WM (1991) Reference soils of south-western Australia. Australian Soil
Science Society of Australia Inc., Western Australia.
McArthur WM, Bettenay E (1960) The development and distribution of the soils of the
Swan Coastal Plain, Western Australia. CSIRO Soil Publication No. 16. SCIRO,
Melbourne.
Mitchell D, Williams K, Desmond A (2002) Swan Coastal Plain 2 (SWA2 – Swan
Coastal Plain subregion). In ‘A Biodiversity Audit of Western Australia’s 53
Biogeographical Subregions in 2002’. JE May, NL McKenzie (eds.), pp. 606-
623. Department of Conservation and Land Management, Perth.
Myers N, Mittermeier RA, Mittermeier CG, da Fonseca GAB, Kents J (2000)
Biodiversity hotspots for conservation priorities. Nature 403, 853-858.
USDAFS (US Department of Agriculture Forest Service) (2007a, amended 2010)
Specification 5100-304c: Long-term retaradant, wildland firefighting. United
States Department of Agriculture, United States of America.
USDAFS (US Department of Agriculture Forest Service) (2007b, amended 2010)
Specification 5100-306a: Specification for water enhancers (gels) for wildland
firefighting. United States Department of Agriculture, United States of America.
USDAFS (US Department of Agriculture Forest Service) (2007c, amended 2010)
Specification 5100-307a: Specification for fire suppressant foam for wildland
firefighting (Class A foam). United States Department of Agriculture, United
States of America.
Page 25
11
CHAPTER 1
Nutrient content of fire suppressants and the impact on soil
1.0 Introduction
Previous research into the environment impacts of suppressants has focused on the
direct effects upon aquatic organisms, fauna, plants, and invertebrates (Hamilton et al.
1998, Adams & Simmons 1999, Gould et al. 2000, Gimenez et al. 2004). Within such
research it was recognised that fire suppressants (predominantly retardants) often
contain appreciable concentrations of nutrients with the potential to affect ecosystems
(Dodge 1977, Bradstock et al 1987, Larson et al. 1999), particularly those with nutrient
poor soils (Gill 1977, Hopmans & Bickford 2003), as are found on the Swan Coastal
Plain.
However, direct assessment of suppressant impacts on soil is limited with only four
published studies (five papers) performed: Basanta et al. 2002, Hopmans & Bickford
2003, Pappa et al. 2006, Couto-Vazquez & Gonzalez-Prieto 2006, and Garcia-Marco &
Gonzalez-Prieto 2008. Additionally, these studies are limited to only five suppressant
products (Auxquimica RFC-88 foam, Firesorb gel, and the retardants Fire-Trol 931, FR
Cross, and Phos-Chek D75-R), with a marked focus on the retardants. With a vast range
of suppressant products now on the market, an expansion of research to cover a greater
range of suppressant products is needed.
Significant impacts on soil properties were found within all four studies; yet the
research focus amongst the studies varied making direct comparisons difficult. Basanta
et al. (2002) found that Firesorb gel stimulated the soil microbial population,
significantly reduced nitrified N in unheated soil, and caused a slight but significant
reduction in ammonified N in heated soil. Pappa et al. (2006) demonstrated that P from
Fire-Trol 931 retardant leaches through soil profiles under laboratory conditions and
that a small amount of P is absorbable by plants. Related, Hooda & Weston (1999)
found altered P content in foliage four years following fertilizer application to a
Eucalypt plantation, which suggests ecological impacts may occur following fire
suppressant application.
Page 26
12
Different fire suppressant products may have differing impacts on soil. However, only
one study investigating soil impacts has been conducted with multiple fire suppressants.
Couto-Vazquez and Gonzalez-Prieto (2006) and Garcia-Marco and Gonzalez-Prieto
(2008) trialled the impact of a foam (Auxquimica RFC-88), a gel (Firesorb), and a
retardant (FR Cross) on soil properties after a fire. They found no significant differences
in soil’s total C, total N, NH4+, NO3
-, or available Ca, Cu, K, Mg, Mn, Na, P, and Zn
from application of the foam or the gel. But in contrast the FR Cross retardant
dramatically increased soil NH4+ and available P upon application and increased NO3
-
over time due to active nitrification.
The effects of fire suppressants on soil may also be site-dependent. Hopmans and
Bickford (2003) found that increases in labile soil N, P, and S due to an application of
Phos-Chek D75-R retardant were appreciable greater at one of their two field sites. The
sites differed in species composition (wet coastal heath vs. sandy heath) and soil (sandy
coastal dune system vs. sandy clay flat plains). In contrast, Basanta et al. (2002) trialled
in a laboratory the effects of Firesorb gel and simulated fire-heat on biochemical
properties of two different soils (a loamy sand and a sandy loam). They found no
significant difference due to soil type.
In consideration of the past research, further investigation of suppressant is warranted to
better understand the impacts on soils and to assess possible ecological impacts.
Additionally there is a need to expand the range of suppressant products trialled within
research. For a range of nine suppressant products, the following hypotheses were
tested: (i) fire suppressants vary in nutrient content, (ii) fire suppressants alter soil
nutrients and properties, (iii) alteration of soil nutrients and properties differ amongst
suppressant types and individual suppressant products, and (iv) fire suppressant
alteration of soil nutrients and properties is persistent.
Page 27
13
2.0 Methods
2.1 Analysis of Fire Suppressant Nutrient Content
A sample of each fire suppressant was prepared for nutrient content analysis by CSBP
Soil and Plant Analysis Laboratory. Each sample was mixed with triple filtered
deionised water to the maximum rate appropriate for us on class A fires, as per product
directions. A sample of deionised water was also submitted as a control to ensure
accuracy of each suppressant’s nutrient content.
Samples were tested for conductivity, pH (H20), NO3-, NH4
+, and plant available
concentrations of B, Ca, Cl, Cu, Fe, K, Mg, Mn, Na, P, S, and Zn. Table 1 summarises
CSBP’s methods and references for the analysis of the fire suppressants.
Table 1: Summary of methods used by CSBP to analyse solutions of fire suppressant.
Nutrient / Property Analysis Method
NO3-, NH4
+ Measured simultaneously using a Lachat Flow Injection Analyser. Reference: Searle (1984).
B, Ca, Cl, Cu, Fe, K, Mg, Mn, Na, P, S, Zn
Multi-element analysis carried out on liquid samples on the Inductively Coupled Plasma spectrometry.
Conductivity, pH(H2O) Conductivity and pH(H2O) measured using a combination pH electrode calibrated against 0.01M KCl.
2.2 Field Site Details
2.2.1 Whiteman Park
A mature Banksia woodland community in good condition was identified at Whiteman
Park (Cullacabardee block) (-31.804370, 115.897195, GDA94) to trial the effects of fire
suppressants. The community consisted of open Banksia menziesii R.Br. woodland over
a shrubland of Xanthorrhoea preissii Endl., Hibbertia hypericoides (DC) Benth., and
Eremaea pauciflora Endl. over mixed herbs/grasses. This site had not been burnt within
the previous ~20 years and thus enabled investigation of fire suppressants on flora and
Page 28
14
community composition without the confounding factor of recent fire. The soil of
Cullacabardee is within the Bassendean Sand soil association, containing little silt or
clay, very low levels of nutrient elements, and with any nutrient element content
associated with organic matter (Bolland 1998).
2.2.2 Wanneroo
A mixed Banksia/Jarrah/Marri woodland community within the City of Wanneroo was
sourced for use as a “with-fire” community trial (-31.748487, 115.805705, GDA94).
The community consisted of a Banksia menziesii, Eucalyptus marginata Sm., and
Corymbia calophylla (Lindl.) K.D.Hill & L.A.S.Johnson overstorey above a shrubland
of Xanthorrhoea preissii Endl., Hibbertia hypericoides, and Petrophile macrostachya
R.Br. over mixed herbs/grasses. Soil at the Wanneroo site is classed as pale grey
Karrakatta sand (Bolland 1998), limited in nutrient elements but not to the extent of
Bassendean Sand at the Whiteman Park field site. The site was selected as it was
scheduled for a fuel reduction burn that coincided with the research schedule.
Unfortunately, short notice of the fire’s date and exact location (weather and logistics
dependant) and the fire’s behaviour on the day, resulted in an inability to collect pre-fire
soil data. Analysis of soil nutrient data at the with-fire trial is therefore limited to the
direct impacts of fire suppressants themselves and cannot consider suppressant/fire
interactions.
2.3 Fire Suppressant Treatments
2.3.1 Whiteman Park
Treatments consisted of all ten fire suppressants (Appendix A), a wet control (water
only), and a dry control (no water or suppressant). Experimental plots were installed
along one side of a fire access track, where fire suppressants would typically be used by
ground units during fire fighting operations. Three replicate sets of plots were installed,
each replicate set placed within relatively homogeneous vegetation. Treatments were
sequentially assigned to plots prior to establishment to ensure even spatial dispersal of
replicate plots throughout the study area. Plots measured 7 m wide and 10 m deep from
Page 29
15
the access track, with buffers of 3 m. Suppressant treatments were applied at Whiteman
Park on the 5th and 6th of April 2006 (autumn).
2.3.2 Wanneroo
Prior to analysis, observational assessment of the Whiteman Park without-fire treatment
plots revealed minimal differences in impact on vegetation within the three suppressant
types (foam, gel, retardant). Therefore, only three representative suppressants (in
addition to dry and wet controls) were applied at Wanneroo. Reducing suppressant
treatments at this field site also enabled plant community monitoring (chapter 4) to be
completed within a short time; deemed necessary to reduce plant growth disparity given
rapid regrowth after fire. To represent a range of suppressant types, one short-term foam
(Silv-Ex), one gel product (ClearETI), and the long term retardant (Phos-Chek) were
selected for the trial. Silv-Ex was chosen as the short-term foam due to its current
widespread use. ClearETI was selected to represent gel suppressants (Barricade was the
preferred gel product but was excluded as the concentrate had separated during storage
and could not be adequately mixed on site). Phos-Chek retardant was selected due to its
high nutrient content and relatively high impact observed amongst other trials within
this research.
The Wanneroo site was burned on the 28th of May 2008 for fuel reduction purposes and
in preparation for the trial. The burn was conducted jointly by FESA (Fire &
Emergency Services Authority) and the City of Wanneroo personnel. Three replicates
plots of each treatment were installed within the centre of the burn area, away from fire
breaks and tracks to avoid areas where suppressants were used to control the prescribed
fire. As at the Whiteman site, treatments were sequentially assigned to plots prior to
establishment to ensure even spatial dispersal of replicate plots throughout the study
area. Plots measured 7 m wide and 10 m deep, with buffers of 3 m. Suppressant
treatments were applied at Wanneroo in autumn on the 29th and 30th of May 2008 (the
two days following the fire).
Page 30
16
2.4 Fire Suppressant Application
2.4.1 Equipment
Four-wheel-drive light tanker vehicles were used to mix and apply fire suppressants to
trial plots at both the Whiteman Park and Wanneroo field sites. Light tankers typically
possessed a water tank (up to 550 L), 9 hp auxiliary motor, hose, and nozzle with fog to
straight stream capability (similar to Figure 1).
Flow rate from the hose nozzle varied amongst the multiple suppressant treatments due
to differences in suppressant viscosity and changes in the throttle of the pump’s motor.
To correct for this, the flow rate was re-calculated prior to each suppressant’s
application by recording the time taken to fill a 20 L bucket. The time required to apply
suppressant to plots was then calculated accordingly to ensure a consistent application
rate of 1.5 Lm-2 to all plots of all suppressant treatments.
2.4.2 Preparation
Mixing rates of each fire suppressant were obtained from manufacturer’s directions, and
are summarised in Appendix A. Sufficient suppressant to allow all three replicate plots
to be applied at one time was prepared by adding suppressant concentrate into the
Figure 1: Example of a light tanker vehicle, similar to those used to apply fire suppressants to both field
sites. Photo by Nachoman-au; http://commons.wikimedia.org/wiki/User:Nachoman-au.
Page 31
17
prefilled water tank on the light tanker vehicle. The fire suppressant mix was then
circulated through the hose and back into the top of the tank to ensure the suppressant
was thoroughly mixed. Barricade gel, Clear ETI Fire Gel, and Phos-Chek retardant
required additional manual mixing using a shovel handle to ensure concentrate clots
were removed from tank baffles and properly dissolved. Potable water obtained from
the mains water network (via hydrants) was used at all times to prepare all fire
suppressants. Between applications of each suppressant product the fire unit’s tank and
hose were thoroughly cleaned using potable mains water.
2.4.3 Application
Suppressant treatments were applied at Whiteman Park on the 5th and 6th of April 2006,
and at Wanneroo on the 29th and 30th of May 2008 (the two days following the fire).
Suppressants were applied at a rate of 1.5 Lm-2 to each 7 m x 10 m plot (thus 105 L per
plot) matching the application rate used by trained personnel in previous test plots.
Suppressants were applied evenly with additional emphasis upon fire hazard features
such as tree trunks and dense vegetation. This method simulates how suppressants are
used a) during direct attack on flames, b) to create a suppressant fire-break in unburned
vegetation, and c) to target smouldering fuel during mop-up activities.
2.5 Soil Sampling
At Whiteman Park soil samples were taken immediately pre and post suppressant
application, and at 3 and 12 months following application. Soil samples at Wanneroo
were taken immediately following the fire and the suppressant application, and at 3, 6,
and 12 months following application.
For both field sites an aggregate soil sample was taken from every 7 m x 10 m plot at
every monitoring period. This resulted in three replicate soil samples per suppressant
treatment for each of the monitoring periods. Three sub-samples were taken from each
plot and aggregated into the one sample bag to help reduce soil spatial variability. Sub-
samples were consistently taken in a diagonal pattern across each plot; one sample from
the centre and a sample 2 m within each plot's opposite corners. During soil sample
Page 32
18
collection coarse litter was scraped from the soil surface and a 10 x 10 x 10 cm cube of
soil taken. To assist with consistent collection a soil scoop was crafted from tin sheet
metal, the edges of which were fine and easily cut through roots and other organic
matter. Each sample bag was manually mixed to ensure sub-samples were adequately
combined to form a single soil sample.
2.6 Soil Analysis
All soil samples were analysed for texture and nutrient content by CSBP Soil and Plant
Analysis Laboratory. Samples were tested for; conductivity, pH (H2O and CaCl2), total
organic carbon, NH4+, NO3
-, and plant available concentrations of P, K, and S. Table 2
summarises CSBP’s methods and references for the analysis of soil samples.
Table 2: Summary of methods used by CSBP to analyse soil samples.
Nutrient / Property Analysis Method
NO3-, NH4
+ Measured simultaneously using a Lachat Flow Injection Analyser. Reference: Searle (1984).
Total Nitrogen Soil samples combusted at 950 C in oxygen using a Leco FP-428 Nitrogen Analyser.
Total Organic Carbon
Concentrated sulfuric acid is added to soil wetted with dichromate solution. Heat of dilution is used to induce oxidation of soil organic matter. Amount of chromic ions produced is proportional to the organic carbon oxidised and is measured colorimetrically at 600 nm. Reference: Walkley & Black (1934).
Phosphorus, Potassium
Utilising Colwell method. Soils tumbled with 0.5 M sodium bicarbonate solution adjusted to pH 8.5 for 16 hours at 25 C employing a soil:solution ration of 1:100. Acidified extract is treated with ammonium molybdate/antimony trichloride reagent and concentration of phosphorus measured colorimetrically at 880 nm. Concentration of potassium determined using a flame atomic absorption spectrophotometer at 766.5 nm. References: Colwell (1965), Rayment & Higginson (1922).
Sulphur Soils are extracted at 40 C for 3 hours with 0.25 M potassium chloride and the sulphate sulfur is measured by Inductively Coupled Plasma spectrometry. Reference: Blair et al. (1991).
Conductivity, pH(H2O), pH (CaCl2)
Soil:Solution ration of 1:5. pH(H2O) measured using a combination pH electrode calibrated against 0.01M KCl. Calcium chloride solution is added to produce a concentration of 0.01 M CaCl2 and pH(CaCl2) determined using a combination pH electrode.
Page 33
19
2.7 Statistical Analysis
2.7.1 Nutrient Content of Fire Suppressants
A single sample of each fire suppressant was analysed for nutrient content for
informative and data interpretation purposes only. No statistical analysis was performed
on the nutrient content concentrations within each suppressant.
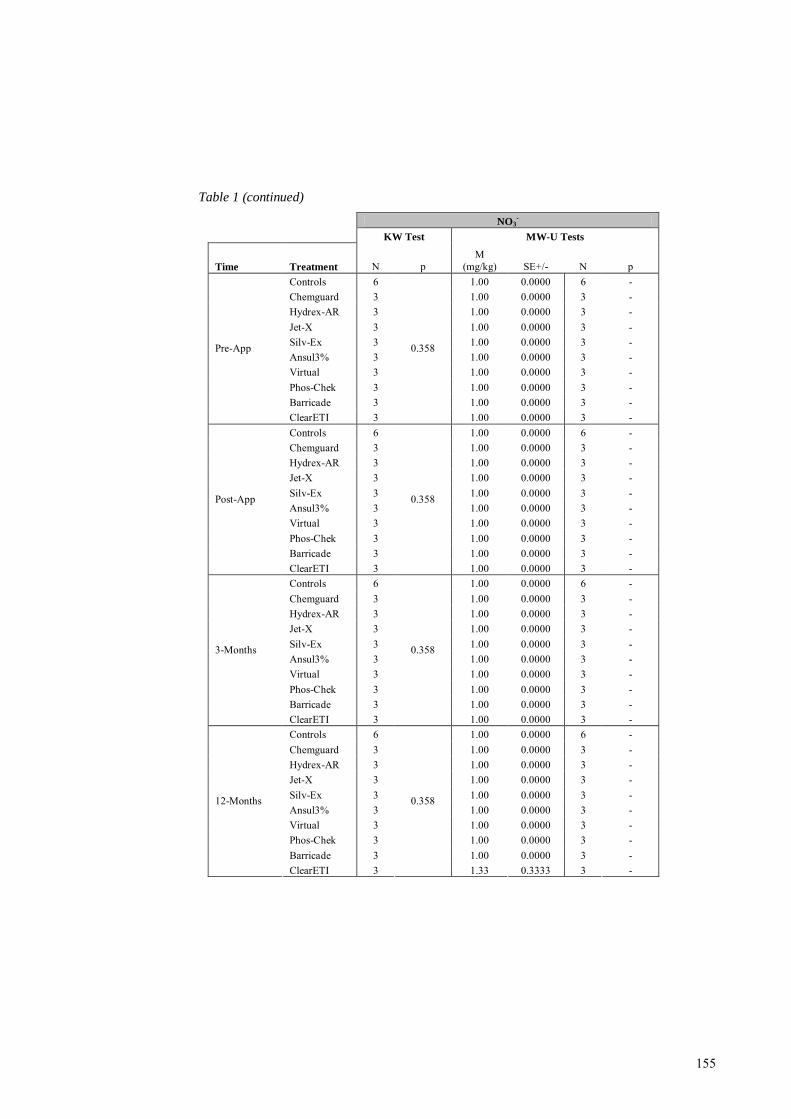
2.7.2 Impact of Suppressants on Soil Nutrient Content
Soil pH data were log transformed to linear scale in order to validly perform statistical
analysis. Analysis output of linear pH means were subsequently transformed back to the
pH logarithmic scale prior to data interpretation.
SPSS 11.5 was used to conduct all statistical analysis. Soil nutrient concentration data
for the dry and wet control treatments were pooled into a single control treatment to
enable effective statistical analysis. Kolmogorov-Smirnov tests were performed prior to
data pooling to confirm data were not dissimilar (p≥0.05). Additionally, soil samples
taken prior to suppressant application were tested (Kruskal-Wallis tests, one way
analysis of variance by ranks) to verify no significant differences (p≥0.05) in soil
properties existed before treatments were applied.
As data was non-normally distributed and possessed heterogeneous variances and skew
amongst treatments, parametric statistical tests were deemed inappropriate.
Additionally, various data transformations failed to correct the data distributions.
Therefore, Kruskal-Wallis tests (one way analysis of variance by ranks) were utilised to
test if fire suppressant treatments affected soil nutrient content at each monitoring
period. Where a Kruskal-Wallis test returned a significant difference (p<0.05) in soil
nutrient content amongst suppressant treatments, planned pairwise comparisons were
performed using Mann-Whitney U tests. Planned comparisons were conducted only
between fire suppressant treatments and the control treatment. No planned comparisons
between individual fire suppressant products were performed.
Page 34
20
3.0 Results
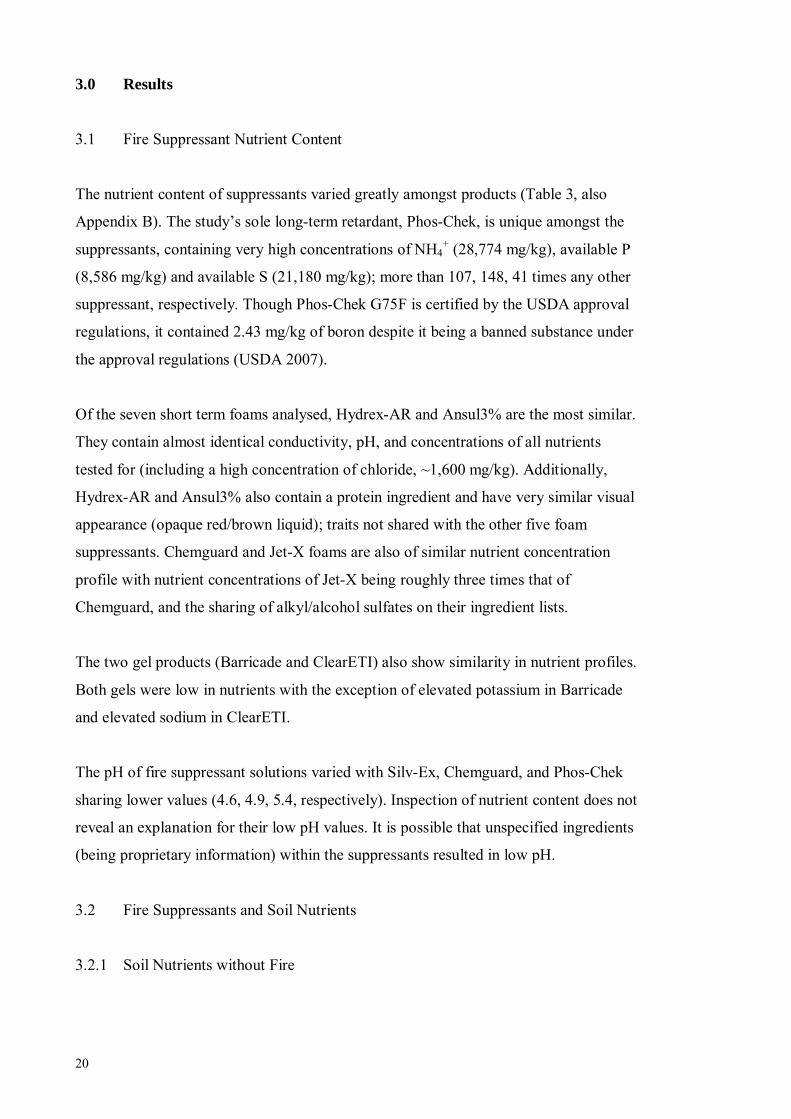
3.1 Fire Suppressant Nutrient Content
The nutrient content of suppressants varied greatly amongst products (Table 3, also
Appendix B). The study’s sole long-term retardant, Phos-Chek, is unique amongst the
suppressants, containing very high concentrations of NH4+ (28,774 mg/kg), available P
(8,586 mg/kg) and available S (21,180 mg/kg); more than 107, 148, 41 times any other
suppressant, respectively. Though Phos-Chek G75F is certified by the USDA approval
regulations, it contained 2.43 mg/kg of boron despite it being a banned substance under
the approval regulations (USDA 2007).
Of the seven short term foams analysed, Hydrex-AR and Ansul3% are the most similar.
They contain almost identical conductivity, pH, and concentrations of all nutrients
tested for (including a high concentration of chloride, ~1,600 mg/kg). Additionally,
Hydrex-AR and Ansul3% also contain a protein ingredient and have very similar visual
appearance (opaque red/brown liquid); traits not shared with the other five foam
suppressants. Chemguard and Jet-X foams are also of similar nutrient concentration
profile with nutrient concentrations of Jet-X being roughly three times that of
Chemguard, and the sharing of alkyl/alcohol sulfates on their ingredient lists.
The two gel products (Barricade and ClearETI) also show similarity in nutrient profiles.
Both gels were low in nutrients with the exception of elevated potassium in Barricade
and elevated sodium in ClearETI.
The pH of fire suppressant solutions varied with Silv-Ex, Chemguard, and Phos-Chek
sharing lower values (4.6, 4.9, 5.4, respectively). Inspection of nutrient content does not
reveal an explanation for their low pH values. It is possible that unspecified ingredients
(being proprietary information) within the suppressants resulted in low pH.
3.2 Fire Suppressants and Soil Nutrients
3.2.1 Soil Nutrients without Fire
Page 35
Ta
ble
3: N
utrie
nt c
onte
nt a
nd p
rope
rties
of f
ire
supp
ress
ant s
olut
ions
mix
ed w
ith d
e-io
nise
d wa
ter a
t the
max
imum
dir
ecte
d ra
te fo
r use
on
Cla
ss A
fire
s.
* D
esig
nate
s pla
nt a
vaila
ble
nutri
ent.
Chemguard
Hydrex-AR
Jet-X
Fire-Ade
Silv-Ex
Ansul3%
Virtual
Phos-Chek
Barricade
ClearETI
NO
3- m
g/L
0.
00
0.50
0.
00
0.00
0.
00
1.12
0.
00
0.00
0.
00
0.00
N
H4+
mg/
L
54.6
4 15
4.46
26
6.70
0.
46
61.3
0 16
5.28
2.
90
2877
4.58
10
.44
10.2
4 B
* m
g/L
0.
00
0.47
0.
00
0.00
0.
00
0.50
0.
00
2.43
0.
00
0.00
C
a*
mg/
L
0.30
53
.10
0.61
0.
30
0.45
66
.47
0.77
32
4.00
0.
00
0.00
C
l*
mg/
L
0.00
15
54.6
2 0.
00
0.00
0.
00
1696
.13
86.8
7 0.
00
0.00
0.
00
Cu*
m
g/L
0.
00
0.00
0.
00
0.00
0.
00
0.00
0.
00
0.00
0.
00
0.00
Fe
* m
g/L
0.
00
56.0
1 0.
29
0.00
0.
00
64.1
2 0.
53
1.01
0.
14
0.22
K
* m
g/L
1.
36
84.5
5 3.
11
1.99
1.
67
87.6
9 9.
97
6.99
12
0.90
0.
45
Mg*
m
g/L
0.
00
124.
60
0.52
0.
09
0.11
13
1.80
0.
53
4.16
0.
00
0.00
M
n*
mg/
L
0.00
0.
33
0.00
0.
00
0.00
0.
51
0.00
0.
00
0.00
0.
00
Na*
m
g/L
21
.41
670.
00
65.4
5 37
.01
89.8
2 75
1.10
75
9.40
37
.62
0.17
36
.23
P*
mg/
L
9.47
0.
84
57.6
6 0.
26
0.07
0.
88
6.37
85
86.0
0 0.
30
0.06
S*
m
g/L
12
1.60
13
6.10
51
1.00
44
.69
267.
40
128.
50
912.
40
2118
0.00
1.
08
5.40
Z
n*
mg/
L
0.00
15
4.00
0.
63
0.11
0.
19
178.
20
0.46
0.
07
0.00
0.
00
Con
duct
ivity
dS
/m
0.56
8 5.
023
1.08
3 0.
187
0.45
3 5.
903
1279
.993
15
7.59
3 0.
575
0.30
3 pH
(H2 O
)
4.9
6.2
6.6
6.7
4.6
6.2
7.2
5.4
6.8
7.4
davidleach
Typewritten Text
21
Page 36
22
Fire suppressants in the without-fire field trial at Whiteman Park significantly increased
soil nutrient concentrations immediately upon application (Appendix C). Of the
nutrients tested for in soil samples, only NH4+, available P, and available S were
significantly affected (Figure 1). No statistically significant changes in soil
concentrations occurred for NO3-, K, or organic carbon. Additionally, no changes in
conductivity or pH (H2O or CaCl2) were detected. Soil texture was uniformly classed as
sand.
Of all suppressants Phos-Chek retardant caused the most dramatic increases to multiple
nutrient concentrations following application and beyond. Immediately after application
Phos-Chek significantly increased; NH4+ from the control of 1.67 mg/kg to 31.00 mg/kg
(18.6-fold increase), available P from 2.00 mg/kg to 13.33 mg/kg (6. 7-fold increase),
and available S from 2.50 mg/kg to 38.1 mg/kg (15.2-fold increase) (p<0.05) (Figure 1).
Three months post application the concentration of soil phosphorus within the Phos-
Chek treatment was much reduced but still significantly higher than the control
treatment (p=0.005); 4.67 mg/kg, a 2.3-fold increase. At three months post application
concentrations of NH4+ and available S were also higher than controls, but not to a
statistically significant level (all p≥0.05); NH4+ at 5.67 mg/kg (3.4-fold increase), and
available S at 6.53 mg/kg (1.9-fold increase). By the next nutrient monitoring period at
12 months post application there was no difference in soil NH4+, P, or S (p≥0.05).
Of the six foams tested at the without-fire field trial Jet-X, Silv-Ex, and Virtual
significantly increased soil concentrations of available S immediately following
application, compared to the control treatment (p<0.05). Compared to the control with
2.50 mg/kg of available S, Silv-Ex treated soil contained 7.83 mg/kg (3.1-fold increase),
Virtual contained 3.83 mg/kg (1.5-fold increase), and Jet-X contained 3.33 mg/kg (1.3-
fold increase). At three months after application, no increase in available soil S
concentrations were detectable compared to the control treatment for these foams
(p≥0.05).
Analysis of ClearETI fire gel solution shows it contains almost no available P (0.06
mg/kg). However, while there was no increase in soil P immediately after an application
of ClearETI, available soil P was increased three months later at 8.67 mg/kg (4.33-fold
increase) compared to the control of 2.00 mg/kg (p=0.034).
Page 37
23
NH4+ *
*
0
10
20
30
40
50
Pre-App Post-App 3-Months 12-Months
Con
cent
ratio
n (m
g/kg
)
Available P
**
*
*
0
5
10
15
20
25
Pre-App Post-App 3-Months 12-Months
Con
cent
ratio
n (m
g/kg
)
Available S
*
*
*
*
0
10
20
30
40
50
60
Pre-App Post-App 3-Months 12-Months
Con
cent
ratio
n (m
g/kg
)
Control Chemguard Hydrex-AR Jet-X Silv-Ex
Ansul3% Virtual Phos-Chek Barricade ClearETI
Figure 1: Impact of fire suppressants on NH4+, available P, and available S in the 0-10 cm soil layer at
the without-fire trial. Significant differences compared to the control treatment are denoted by *.
Page 38
24
Virtual foam exhibited a similar result to ClearETI. Despite containing little available P
(6.37 mg/kg) and causing no increase in available soil P concentrations after
application, three months later soil P was significantly higher in Virtual foam plots
(3.33 mg/kg) than the control treatment (2.00 mg/kg) (p=0.005). Additionally, a
significant increase in NH4+ (5.33 mg/kg) compared to the control treatment (1.67
mg/kg) occurring immediately after the application of Barricade gel (p=0.017), even
though Barricade contains low amounts of NH4+ (only 10.44 mg/L). Three fire
suppressants (Chemguard, Hydrex-AR, and Ansul3%) had had no statistical impact on
soil nutrient concentrations tested within the without-fire field trial.
3.2.2 Soil Nutrients after a Fire
Fire suppressants in the with-fire field trial at Wanneroo significantly increased soil
nutrient concentrations immediately upon application (Appendix C). Of the nutrients
tested for in soil samples NH4+, NO3
-, available P, and available S were significantly
affected (Figure 2). No statistically significant changes in soil concentrations occurred
for available K, or organic carbon. Soil texture was uniformly classed as sand.
Phos-Chek had the greatest impact to multiple soil nutrient concentrations. Immediately
after application Phos-Chek significantly increased; NH4+ from the control of 10.00
mg/kg to 83.00 mg/kg (8.3-fold increase), NO3- from 0.75 mg/kg to 2.33 mg/kg (3.1-
fold increase), phosphorus from 4.50 mg/kg to 40.00 mg/kg (8.9-fold increase), and
sulphur from 6.62 mg/kg to 126.83 mg/kg (19.2-fold increase) (p<0.05). By three
months post application there was no significant difference from the control treatment
for any of these nutrients (p≥0.05). However, at six months post application soil
concentrations of NH4+ and P in the Phos-Chek treatment were once again higher than
the control; soil concentrations of NH4+ decreased to 4.50 mg/kg in the control
treatment and significantly increased to 8.67 mg/kg within the Phos-Chek treatment
(p=0.021). Phosphorus followed the same pattern, decreasing to 2.00 mg/kg in the
control treatment while significantly increasing to 7.67 mg/kg in the Phos-Chek
treatment (p=0.018). The higher concentrations of soil phosphorus were maintained at
12 months after application (p=0.015).
ClearETI gel did not significantly affect soil nutrient concentrations at the with-fire
Page 39
25
NH4+
*
*
0
10
20
30
40
50
60
70
80
90
100
110
Pre-App Post-App
3-Months
6-Months
12-Months
Con
cent
ratio
n (m
g/kg
)
No3-
*
0
1
2
3
4
5
6
7
8
9
Pre-App Post-App
3-Months
6-Months
12-Months
Con
cent
ratio
n (m
g/kg
)
Available P
*
*
* *
0
10
20
30
40
50
60
Pre-App Post-App
3-Months
6-Months
12-Months
Con
cent
ratio
n (m
g/kg
)
Available S
*
0
25
50
75
100
125
150
175
Pre-App Post-App
3-Months
6-Months
12-Months
Con
cent
ratio
n (m
g/kg
)
Control Silv-Ex Phos-Chek ClearETI
Figure 2: Impact of fire suppressants on NH4+, available P, and available S in the 0-10 cm soil layer at
the with-fire trial. Significant differences compared to the control treatment are denoted by *.
Page 40
26
trial. Similarly Silv-Ex foam had no significant impact on soil nutrients, except for a
minor increase in available P 12 months post application; 4.33 mg/kg compared to the
control of 3.33 mg/kg (p=0.0477).
Statistical analysis returned significant differences in soil pH due to fire suppressant
application at three and 12 months post application (Appendix C). However, this output
is inconclusive due to perfect homogeneity of pH data values within the control
treatment. All six replicates of pH data within the control treatment at 12 months are
identical (all pH 5.6), resulting in zero variance, and therefore providing a strong
possibility for type I error. Similarly, duplicate pH values amongst the six pieces of pH
data within the control treatment at three months also resulted in an inability to discount
type I error.
Page 41
27
4.0 Discussion
4.1 Fire Suppressant Nutrient Content
Analysis of fire suppressant solutions revealed that all ten suppressants tested (seven
foams, two gels, and one retardant) varied in their nutrient content available to plants.
As such, hypothesis (i) that fire suppressants vary in content is accepted. This extends
the knowledge on suppressant nutrient content beyond the products previously analysed
(Auxquimica RFC-88 foam, Firesorb gel, and the retardants Fire-Trol 931, FR Cross,
and Phos-Chek D75-R) by Basanta et al. (2002), Hopmans and Bickford (2003), Pappa
et al. (2006), Couto-Vazquez and Gonzalez-Prieto (2006), Garcia-Marco and Gonzalez-
Prieto (2008).
Of interest, fire suppressant nutrient content does not adequately explain the low pH
values of Silv-Ex, Chemguard, and Phos-Chek sharing lower values (4.6, 4.9, and 5.4,
respectively). Regardless, application of suppressants with such low pH may have a
negative impact on vegetation communities, depending on the relative pH value of the
soil. Additionally, a trend for short-term foams to contain appreciable concentrations of
available S has been newly identified, accompanied with a considerable variation in
other nutrients amongst the foams.
Of concern is the detection of 2.43 mg/kg of boron within the USDA approved Phos-
Chek G75F retardant. The USDA Fire Service specifications for fire suppressant
chemicals (USDA 2007, section 2.2) require “zero borate, or boron containing
ingredients”. The specifications do not state a reason for requiring no boron within
suppressants. However, the US Environmental Protection Authority (2008) review of
animal experimental trials found that boron reduces male and female fertility and
increases birth defects. The World Health Organization (2003) notes that boron content
in water is largely dependent on leaching of boron from surrounding geology and
wastewater discharge, and that boron is not removed from water by conventional
treatment methods. Presumably, the USDA requirement for zero borate within fire
suppressants is to prevent drinking water contamination and potential human health
impacts.
Page 42
28
Unfortunately, the presence of 2.43 mg/kg of boron within Phos-Chek G75F retardant
casts doubt over the USDA’s fire suppressant approvals process. Three events may have
occurred; 1) the USDA approval testing failed to detect boron in Phos-Chek G75F, 2)
the ingredients for Phos-Chek G75F has changed since the USDA approval, now
contains boron, and has not since been retested by the USDA, 3) a variant of Phos-Chek
G75F containing boron is supplied to Australia where the use of USDA approved
suppressants is recommended rather than required.
4.2 Fire Suppressant Impact on Soil
The analyses of soil samples from two in situ trials demonstrate that nutrients in
suppressant solutions can significantly affect available nutrient concentrations in soil.
Six of the nine suppressants applied at the field sites significantly altered soil chemistry
in some manner. These six suppressants included three of the six short term foams (Jet-
X, Silv-Ex, and Virtual), both of the gel suppressants (Barricade and ClearETI), and the
study’s long term retardant (Phos-Chek); also demonstrating that all three types of
suppressants are capable of altering soil chemistry. Hypothesis (ii), that fire
suppressants alter soil properties is therefore accepted. Additionally, hypothesis (iii),
that nutrient content differed by fire suppressant type (foam, gel, and retardant), and
also varied within each suppressant type is supported (as discussed below).
4.2.1 Foams
The three foams that significantly altered soil properties (Jet-X, Silv-Ex, and Virtual) all
significantly increased soil sulphur concentrations directly after application to field
plots. As a class, all six short term foams within the in situ trials contained appreciable
amounts of sulphur, ranging from 121 mg/kg up to 912 mg/kg; Jet-X, Silv-Ex, and
Virtual having the three highest sulphur content. However, at the with-fire trial Silv-Ex,
the single foam, did not significantly increase soil S as it did in the without-fire trial. It
appears that higher soil S at the with-fire trial reduced the relative difference in S
concentration between Silv-Ex and control plots, and returned a non significant result.
Unfortunately it is not possible to compare foam’s sulphur impact on soil to literature,
as no previous study tested for sulphur impacts by a foam suppressant.
Page 43
29
Some unexpected results were found following statistical analysis. Twelve months after
fire and suppressant application soil phosphorus within Silv-Ex plots was significantly
higher than the control plots (p=0.048), though Silv-Ex contains almost no phosphorus
– a slight difference only and a possible type I error. Additionally, even though several
foam suppressants contain appreciable concentrations of NH4+ (Jet-X, Ansul3%, and
Hydrex-AR with 266, 165, and 154 mg/kg, respectively), there was no significant
increase in soil NH4+ concentrations.
4.2.2 Gels
The two gel products, Barricade and ClearETI, had minor impacts only to soil
chemistry. Unexpectedly, Barricade temporarily increased NH4+ immediately following
application to 5.33 mg/kg compared to the control with 1.67 mg/kg (p=0.017). While
Barricade does contain some NH4+ (10.44 mg/L), it contains less NH4
+ than five of the
foam suppressants (containing 266, 165, 154, 61, and 54 mg/kg), none of which
significantly increase soil NH4+. It is unclear as to why Barricade significantly increased
soil NH4.
ClearETI had no significant impact on soil immediately following application at either
the without-fire or with-fire study sites. However, the 4.3-fold increase in available soil
P within ClearETI plots three months after application at the without-fire site was
unexpected. Analysis revealed ClearETI contains negligible amounts of P (0.06 mg/L)
and would not be expected to significantly impact on soil P directly. It is possible that
ClearETI gel may have adhered to foliage and triggered a delayed leaf fall thus allowing
for a release of P from leaf litter into the soil three months after application. While
retrospectively this cannot be confirmed within this research, it does speculatively
account for the absence of a similar soil P increase in ClearETI plots at the with-fire site
where almost all of the shrub canopy leaf matter was consumed by fire and not available
for a delayed leaf-fall. Regardless, the impacts of both Barricade and ClearETI to soil
properties were relatively minor and temporary. These findings for ClearETI gel
supports Couto-Vazquez and Gonzalez-Prieto (2006) finding that Firesorb gel had little
or no impact on soil properties.
Page 44
30
4.2.3 Retardant
Unlike short-term foam suppressants which vary in their ingredients (see Appendix B),
long term fire retardants products are similar in content being composed of salts of both
ammonium sulphates and ammonium phosphates (Hamilton et al. 1999, Gimenez et al.
2004). As such, retardants can be expected to impact on soil chemistry in a similar
manner to Phos-Chek retardant in this study. Results for Phos-Chek clearly indicate that
the retardant has a marked impact on soil nutrient concentrations over a period of three
months, and could potentially impact ecosystem processes, species composition, and
plant condition.
As was found with the retardant trialled by Couto-Vazquez and Gonzalez-Prieto (2006),
Phos-Chek dramatically increased soil NH4+ after application that rapidly decreased
with time. Since NH4+ toxicity can lead to suppression of growth and yield for sensitive
species (Britto & Kronzucker 2002) the sudden increase in soil NH4+ due to retardant is
of ecological importance. Couto-Vazquez and Gonzalez-Prieto (2006) also found
increasing soil NO3- over time coinciding with a reduction in NH4
+ due to active
nitrification. Since NO3- can also be toxic to plants (Chen et al. 2004), nitrification of
NH4+ from application of a retardant may also be of ecological importance. However, in
contrast, this research’s field trials found no significant increase in NO3- at the without-
fire trial and only a moderate increase at the with-fire trial immediately following
application. There are three possible explanations for this; 1) nitrification did not occur
or was minimal, 2) nitrification occurred but the resultant NO3- was concurrently
utilised by plants, and 3) nitrification occurred but the resultant NO3- was concurrently
leached from soil during the wet months of the first six months of the trials. It is
possible that all three explanations are plausible singularly or in combination.
As found by Couto-Vazquez and Gonzalez-Prieto (2006) and at one of the sites of
Hopmans and Bickford (2003), application of a retardant greatly increased available soil
P, followed by a rapid decrease over time. However, in contrast to the previous
research, available soil P decreased much quicker with no significant increase in P
twelve months after application. Winter rains in the first four months of the trial may be
responsible for the quicker reduction in soil P, as retardants were applied in dry
summers for the studies in Victoria (Hopmans & Bickford 2003) and Spain (Garcia-
Marco & Gonzalez-Prieto 2006). Additionally, the sand soil of the Swan Coastal Plain
Page 45
31
may have permitted faster leaching of P from soil compared to the previous studies.
Unfortunately, the research conducted in Spain did not specify soil type and limits
comparisons to this research.
One important difference was observed for soil P in Phos-Chek plots at the with-fire
trial; available soil P and NH4+ decreased rapidly to control levels within three months,
but increased slightly (but significantly) at six months. The increased soil P was
retained until 12 months while NH4+ returned to control levels. It’s possible that a
proportion of P from the retardant was initially taken up by vegetation (as demonstrated
by Pappa et al. 2006) during rapid post-fire regrowth and in later months re-released
back into the soil thus resulting in the increase in both P and NH4+. If this hypothesis is
valid, the impacts of Phos-Chek retardant on the P cycle could potentially be of a
medium to long term duration. Hypothesis (iv), that fire suppressants persistently alter
soil is therefore partially supported, especially in relation to Phos-Chek retardant (and
related retardant with similar composition).
4.3 Recommendations
It is important to highlight the difficulty of assessing potential impact of suppressants on
soils based upon controlled experimental trials. The actual amount of suppressant
chemical received per unit area is dependent on multiple user factors, disregarding
human error, including: 1) mix rates; some suppressants direct a range of mix rates with
water (for example, 0.1-1% for Silv-Ex and 2-6% for Barricade), 2) application rates;
different vegetation types and fire intensity require different amounts of suppressant
(Loane & Gould 1986), and 3) evenness of application; aerial application is
heterogeneous (0.5 – 4.0 Lm-1 ; Solarz & Jordan (2000)), and ground unit direct attack
and mop-up with suppressants are focused on burning and smouldering fuel creating
variability in application. Individually or combined these factors could lead to isolated
patches of soil receiving greater (or less) than the 1.5 Lm-2 of suppressant applied in this
research.
Within this research concentrations of macronutrients were monitored only. To fully
account for impacts on soil chemistry, future studies should also monitor fire
suppressant impacts on micronutrient concentrations, as was performed by Couto-
Page 46
32
Vazquez and Gonzalez-Prieto (2008), despite their finding of no significant impact.
Additionally, altered interactions amongst soil nutrients and properties due to
suppressant application were not explored within the trials or the available literature,
and remain an aspect yet to be investigated.
Fire suppressants at the with-fire trial at Wanneroo were applied after a fire event, as
was also the case for Couto-Vazquez and Gonzalez-Prieto 2006. However, it is
acknowledged that heat from fire chemically alters long term retardants resulting in a
release of phosphoric acid and sulphuric acid (Gimenez et al. 2000, Gould et al. 2000).
No information could be found on whether fire or heat alters the chemistry of short term
foams. Where fire and heat alter suppressant chemistry it is possible that the impact of
suppressants on soil properties may differ. There is therefore a need to conduct fire
suppressant trials where suppressants are applied directly to burning vegetation, though
such trials would be challenging to implement.
4.4 Conclusion
Overall, for the six short term foams trialled at the two field sites, three foams had no
impact on soil chemistry. Of the three foams that did impact on soil chemistry, none had
a persistent effect beyond three months. This indicates that short term foam
suppressants as a class are unlikely to be soil persistent beyond the short term. In
addition, the impact of the two gels was minor and temporary. However, the Phos-Chek
retardant, with its high nutrient content, demonstrated a potential for short and medium
term soil persistence in addition to longer term impact on the P cycle. Considering the
results from this research and in previous published research (Hopmans & Bickford
2003, Pappa et al. 2006, Couto-Vazquez & Gonzalez-Prieto 2006, Garcia-Marco &
Gonzalez-Prieto 2008), it appears soil persistence is strongly linked to higher nutrient
concentrations. Although, it should be noted that soil persistence can be expected to
vary dependent on application rate, soil type, vegetation type, and leaching through
rainfall.
This research has demonstrated the ability of fire suppressants to alter soil chemistry in
both burnt and unburnt vegetation. Specifically, some suppressants significantly
increased soil concentrations of available P, S, NH4+, and NO3
-, with varying
Page 47
33
persistence. It is therefore plausible that altered soil chemistry may further impact on
recruitment from seeds, plant mortality, and plant growth either through toxicity or
nutrient uptake. Additionally, the observed increases to soil nutrient content may
promote weed species over native species, a particularly concern within communities of
low soil fertility where weed invasion can be limited due to limited nutrient availability.
If the above does occur, it follows that fire suppressants could have a longterm impact
on the floristic composition and sustainability of native communities.
Page 48
34
5.0 References
Adams R & Simmons D (1999) Ecological effects of fire fighting foams and retardants
in ‘Australian Bushfire Conference, Albury, July 1999’ (Conference
Proceedings), Charles Sturt University, Victoria, Australia.
Basanta MR, Diaz-Ravina M, Gonzalez-Prieto SJ (2002) Biochemical properties of
forest soils as affected by a fire retardant. Biology and Fertility of Soils 36, 377-
383.
Blair GJ, Chinoim N, Lefroy RDB, Anderson GC, Crocker GJ (1991) A soil sulfur test
for pastures and crops. Australian Journal of Soil Research 29, 619-626.
Bolland M (1998) Soils of the Swan Coastal Plain. Department of Agriculture,
Government of Western Australia.
Bradstock R, Sanders J, Tegart A (1987) Short-term effects on the foliage of a eucalypt
forest after an aerial application of a chemical fire retardant. Australian Forestry
50(2), 71-80.
Britto DT, Kronzucker HJ (2002) NH4+ toxicity in higher plants; a critical review.
Journal of Plant Physiology 159, 567-584.
Chen BM, Wang ZH, Li SX, Wang GW, Song HX, Wang XN (2004) Effects of nitrate
supply on plant growth, nitrate accumulation, metabolic nitrate concentration
and nitrate reductase activity in three leafy vegetables. Plant Science 167, 635-
643.
Colwell JD (1965) An automatic procedure for the determination of phosphorus in
sodium hydrogen carbonate extracts of soils. Chemistry and Industry 10, 893-
895.
Couto-Vazquez A, Gonzalez-Prieto SJ (2006) Short- and medium-term effects of three
fire fighting chemicals on the properties of a burnt soil. Science of the Total
Environment 371(3), 353-361.
Dodge M (1970) Nitrate poisoning, fire retardants, and fertilizers – any connection?
Journal of Range Management 23, 244-247.
Garcia-Marco S, Gonzalez-Prieto S (2008) Short- and medium-term effects of fire and
fire-fighting chemicals on soil micronutrient availability. Science of the Total
Environment 407(1), 297-303.
Gill AM, Woinarsky JCZ, York A (1999) Australia’s Biodiversity – Responses to Fire:
Plants, birds, and invertebrates (Biodiversity Technical Paper No. 1),
Department of the Environment and Heritage, Canberra, ACT.
Page 49
35
Gimenez A, Pastor E, Zarate L, Planas E, Arnaldos J (2004) Long-term forest fire
retardants: a review of quality, effectiveness, application and environmental
considerations. International Journal of Wildfire 13(1), 1-15.
Gould JS, Khanna PK, Hutchings PT, Cheney NP, Raison RJ (2000) Assessment of the
effectiveness and environmental risk of the use of retardants to assist in wildfire
control in Victoria (CSIRO Forestry and Forest Products Research Report No.
50), Department of Natural Resources and Environment, Victoria, Australia.
Hamilton S, Larson D, Finger S, Poulton B, Vyas N, Hill E (1998) Ecological effects of
fire retardant chemicals and fire suppressant foams. Northern Prairie Wildlife
Research Centre Online, Jamestown ND.
Hooda N, Weston CJ (1999) Influence of site and fertiliser addition on nutrient cycling
in Eucalyptus globulus plantations in Gippsland, south-eastern Australia. I.
Foliage and litter quality. Australian Journal of Botany 47, 189-206.
Hopmans P, Bickford R (2003) Effects of fire retardant on soils of heathland in Victoria
(Research report no. 70). Department of Sustainability and Environment,
Victoria.
Larson DL, Newton WE, Anderson PJ, Stein SJ (1999) Effects of fire retardant
chemical and fire suppressant foam on shrub steppe vegetation in northern
Nevada. International Journal of Wildland Fire 9(2), 115-127.
Loane IT, Gould JS (1986) Aerial suppression of bushfires: cost-benefit study for
Victoria. CSIRO Publishing, Victoria.
Pappa A, Tzamtzis N, Koufopoulou S (2006) Effect of a fire retardant application on
phosphorus leaching from Mediterranean forest soil: short-term laboratory-scale
study. International Journal of Wildland Fire 15(3), 287-292.
Rayment GE, Higginson FR (1992) Australian Laboratory Handbook of Soil and
Chemical Methods. Inkata Press, Melbourne.
Searle PL (1984) The Berthelot or Indophenol reaction and its use in the analytical
chemistry of nitrogen. Analyst 109, 549-568.
Solarz P, Jordan C (2000) Ground pattern performance of the Snow Air Tractor with
constant flow tank. USDA Forest Service, Missoula, Montana.
USDAFS (US Department of Agriculture Forest Service) (2007, amended 2010)
Specification 5100-304c: Long-term retaradant, wildland firefighting. United
States Department of Agriculture, United States of America.
US Environmental Protection Agency (2008) Drinking water health advisory for boron.
US Environmental Protection Agency, Washington.
Page 50
36
Walkley A, Black IA (1934) An examination of the Degtjareff method for determining
soil organic matter, and a proposed modification of the chromic acid titration
method. Soil Science 37, 29-38.
World Health Organization (2003) Boron in drinking water; background document for
development of WHO guidelines for drinking-water quality. World Health
Organization, Geneva.
Page 53
39
CHAPTER 2
Assessment of fire suppressant impact on seedling emergence
1.0 Introduction
In temperate ecosystems such as the Swan Coastal Plain, recruitment from seed
predominantly occurs during the autumn/winter wet season (Merritt et al. 2007), and is
more prominent following summer and autumn fire events (Bell 1999, Whelan 1995).
The control of these fires through chemical suppressants can have a significant impact
on available soil nutrients with effects lasting from three months (chapter 1) and 12
months if applied in summer (Couto-Vazquez & Gonzalez-Prieto 2006). Application of
suppressants during a late season fire may therefore affect soil nutrient concentrations at
a time when recruitment from seed is both stimulated by fire and subsequent expected
rainfall. The shorter the delay between suppressant/fire application and rainfall, the
greater the likelihood of recruitment occurring in soil affected by suppressants.
However, since some suppressants are soil persistent, seeds may still be subjected to
imbibition within fire suppressant-impacted soil even when seasonal rainfall is delayed.
The impact of residual suppressants on seedling germination and emergence needs to be
determined to ensure preservation of biodiversity and community composition.
Direct assessment of the impact of suppressant on seeds is limited to four published
studies (Kennedy 2002, Angeler et al. 2005, Cruz et al. 2005, and Luna et al. 2007),
restricted to only three suppressant products (Angus ForExpan S short-term foam,
Amguard DSB Type R Mop-Up retardant, and Fire Trol 934 retardant). Kennedy in
2002 investigated effects of five concentrations of a foam (Angus ForExpan S) and a
retardant (Amguard DSB Type R Mop-Up) on the Petri dish germination of seven
widespread species of the Swan Coastal Plain, Western Australia. Kennedy found that
both the foam and retardant significantly affected all seven species trialled, with final
germination % generally decreasing as suppressant concentration increased. Similarly,
Cruz et al. (2005) also found Petri dish germination for nine Mediterranean shrub
species decreased as concentration of Fire Trol 934 retardant increased. Additionally,
Cruz et al. found that sensitivity to retardant varied across the nine species tested
(although the 10% concentrations caused complete or near complete inhibition of
germination). Angeler et al. 2004 found that Petri dish germination of the wetland
Page 54
40
species Typha domingensis Pers. was severely reduced after a 5 lm-2 application of Fire
Trol 934 retardant, but no significant change at lower application rates. Luna et al. 2007
investigated the effect on seed viability from three concentrations (0.02%, 0.2%, and
2% (note; directed rate is 20%)) of FireTrol 934 retardant in a Petri dish trial for 36
central-eastern species in Spain. They found a significant reduction in seed viability as
retardant concentration increased, with viability significantly reduced for “about half”
of the species subjected to the 2% concentration. Specific results for each species were
not provided.
Possible explanations for the reduction in germination by fire suppressants vary within
the literature. Angeler et al. (2004) suggested that the Fire Trol 934 retardant reached
levels which seemed to have exceeded a critical toxicity threshold (possibly of NH3),
thereby irreversibly damaging seeds (although this was not tested). Cruz et al. (2005)
suggested that some chemicals in the retardant (Fe, Mg, Si, Na, and SO4) may be toxic
to seeds. Related, a field trial by Garcia-Marco and Gonzalez-Prieto (2008) found no
significant increase of Co, Cu, Fe, Mn, and Zn in soil due to application of FR Cross
retardant, though Mg, Si, Na, and SO4 were not tested. However, short-term foam
suppressants can increase available S in soil (chapter 1) and could therefore be
responsible for reduced germination. Cruz et al. (2005) also suggests decreased
germination may be due to high salt concentration within Fire Trol 934 retardant which
may reduce the osmotic potential of solution surrounding seeds (cf. Henig-Server et al.
1996). Cruz et al.’s suggestion may be valid since multiple fire suppressants, including
foams, do contain Na and Cl and do increase electrical conductivity of solutions
(Appendix B and chapter 1).
Conversely, it is possible that a fire suppressant may enhance the germination of some
species. In Kennedy’s study (2002) Xanthorrhoea preissii exhibited an increased final
germination of 63% compared to the control treatment with 0% germination when
exposed to a very low concentrate (0.1%) of Amguard DSB Type R Mop-Up retardant.
Kennedy concluded that small amounts of some nutrients (unspecified) within retardant
may trigger germination. Indeed, nitrates are well known to promote seed germination
or break seed dormancy (Bell 1999, Giba et al. 2003, Perez-Fernandez & Rodriguez-
Echeverria 2003), including some species of the Swan Coastal Plain (Bell et al. 1999).
Germination stimulating nitrates may be relevant, considering fire suppressants contain
traces of NO3- and most fire suppressants within this study contain appreciable
Page 55
41
quantities of NH4+ (Appendix B, and chapter 1) that can convert to NO3
- through active
nitrification. Also, post-fire soil N and P are also known to stimulate germination
(Chambers & Attiwill 1994); the nutrient addition due to suppressant application
(chapter 1) may mimic post-fire N and P conditions and thus trigger germination for
some species.
In addition to decreased germination, a delay in the time until initial germination occurs
has been reported for some species and some fire suppressants. Kennedy (2002)
observed a delay in initial germination for three species (Acacia pulchella R.Br.,
Banksia attenuata R.Br., and Hakea lissocarpha R.Br.) of seven species tested, which
generally increased as foam and retardant concentrations increased. Although untested,
Angeler (2004) postulated that Fire Trol 934 retardant may inhibit seed germination for
the wetland species Typha domingensis until the suppressant is eliminated/degraded.
Seedling emergence trials and further germination trials are required to confirm or
discount fire suppressant inhibition of germination. It is possible that the same factors
proposed as responsible for reducing germination (high nutrient loads, salinity, and
reduced osmotic potential) may be responsible for suppressant inhibition of
germination.
In consideration of reduced seed germination and damage to adult plants due to fire
suppressants, Luna et al. (2007) and Larson and Newton (1996) caution that
suppressants may promote weedy exotic species that are less selective in their
germination requirements and better able to utilise resources. This is of especial
importance considering that fire suppressants are often applied along roads and
firebreaks during containment and mop-up; areas which are more subject to weed
invasion following fires (Milberg & Lamont 1995). To date no published study has
investigated the effects of fire suppressants on any key weed species of the Swan
Coastal Plain.
An important criticism of the described studies testing suppressant impacts on
germination is that they are all Petri dish germination trials. No studies on the impacts
of suppressants on seedling emergence within soil have been published. Similarly, no
field trials for seedling emergence have been published. Results of Petri dish
germination trials may not directly apply to field conditions as leaching of suppressant
chemicals through soil may be an important factor for germination and/or seedling
Page 56
42
emergence. Specifically, the impact of suppressants on seeds may in fact be reduced
when leaching of suppressant chemicals occurs. Other factors in addition to leaching
may include volatilization, photodecomposition, soil absorption, and microbial
degradation, as is the case for herbicides (Rao 2000). Therefore a need exists to conduct
both ex situ and in situ emergence trials to provide a better indication of ecological
impacts.
Given that research into fire suppressant impacts on seeds is restricted to three products
and confined to ex situ Petri dish trials, there is a need to expand the investigation.
Additional suppressants (that vary in inorganic components) should be trialled, with a
focus on seedling emergence. For a range of nine suppressant products and a selection
of species common to the Swan Coastal Plain the following hypotheses were tested
within ex situ and in situ trials: (i) fire suppressants reduce native seedling emergence,
(ii) seedling emergence of weedy exotic species is unaffected by the application of fire
suppressants, (iii) fire suppressants inhibit seed germination and thus delay initial
seedling emergence, and (iv) ex situ effects of fire suppressants on seedling emergence
is indicative of in situ effects on seedling recruitment.
Page 57
43
2.0 Methods
2.1 Ex Situ Trials
Investigation of fire suppressant impacts on seedling emergence was initially restricted
to native species of the Swan Coastal Plain. A subsequent trial on weed species seedling
emergence was performed to address concerns that weed species may be favoured over
native species by the application of fire suppressants. Combined, the ex situ seedling
emergence trials test the hypotheses that (i) fire suppressants reduce native seedling
emergence, (ii) seedling emergence of weedy exotic species is unaffected by the
application of fire suppressants, and (iii) fire suppressants inhibit seed germination and
thus delay initial seedling emergence.
2.1.1 Seed Selection and Preparation
2.1.1.1 Native Species
Nine native framework species common to Banksia woodland within the Swan Coastal
Plain were selected for this trial; Acacia pulchella R.Br., Allocasuarina humilis (Otto &
F.Dietr.) L.A.S.Johnson, Anigozanthos manglesii D.Don, Banksia menziesii R.Br,,
Conostylis aculeata R.Br., Eucalyptus marginata Sm., Gompholobium tomentosum
Labill., Melaleuca thymoides Labill., and Rhagodia baccata (Labill.) Moq.. These
species were selected as they represent common families and species in Banksia
woodland, and subject to seed merchant availability. All seed were purchased from
Seeds West Inc. and sourced by them from the vicinity of Wanneroo.
Some seed species were pretreated to overcome dormancy. Anigozanthos manglesii
seeds were oven heated at 100 oC for 3 hours (as per Sweedman & Merritt 2006).
Rhagodia baccata seeds were prepared using pectinase to dissolve the fruit flesh before
being washed, air dried, and then treated with smoke water (1:10 v/v) and gibberellic
acid (1000 ppm GA(3)) (as per D Merritt 2006 pers. comm.). Seed of the remaining
seven species were not pretreated as these species are reputedly non-dormant. To
maximise potential seedling emergence only mature and intact seeds, determined by
visual and tactile inspection, were selected for the trial.
Page 58
44
2.1.1.2 Weed Species
Four introduced species common to disturbed areas of Banksia woodland within the
Swan Coastal Plain were selected for this trial; Asparagus asparagoides (L.) Druce
(bridal creeper), Gladiolus caryophyllaceus (Burm.f.) Poir. (wild gladiolus), Ehrharta
calycina Sm. (perennial veldt grass), and Pelargonium capitatum (L.) L’Her. (rose
pelargonium). These species were selected due to their widespread distribution, their
invasive nature within Banksia woodland, and subject to seed availability. All weed
seed was collected from Bold Park in 2003, and in 2004 for Gladiolus caryophyllaceus.
Seeds were not pretreated to enhance germinability as these weed species germinate
readily. To maximise potential seedling emergence only full and intact seeds,
determined by visual and tactile inspection, were selected for the trial.
2.1.2 Seed Sowing
All seeds were sown into 138 x 80 x 46 mm punnets filled with dry nursery-grade, fine,
washed river sand (sourced from Avon Sands & Minerals). Each punnet contained 25
seeds of one individual species, except for Banksia menziesii; due to limited seed supply
12 seeds were sown per punnet. The corkscrewed tails/wings of Pelargonium capitatum
seeds were removed prior to sowing to avoid seeds rising above the sand during
imbibition. All seeds were sown to a depth of the seed's own dimensions.
All seeds within the native emergence and within the weed emergence trials were sown
at one time. Native seedling emergence was conducted within an accredited non-
temperature controlled glasshouse (late autumn ~15-30 oC). The weed seedling
emergence, performed at a later date and during midsummer, was conducted within a
regulated coolroom (15 oC with a 12 hour light and 12 hour dark cycle using cool white
fluorescent lights, 30 µmol.m-2s-1).
2.1.3 Fire Suppressant Treatments
Experimental treatments consisted of a water control (no fire suppressant) and the ten
fire suppressants used throughout the research. Each product was applied at the
Page 59
45
maximum recommended concentration (Appendix A). No water was applied to the
punnets prior to the application of the fire suppressant treatments. Three replicate
punnets of seed for each species were sown for each of the eleven treatments.
Treatments were randomly assigned to punnets within each species. Punnets were
systematically cycled along glasshouse benches every two weeks to reduce confounding
site/bench effects.
2.1.4 Fire Suppressant Application
Suppressants were applied to punnets at a rate of 1.5 Lm-2, determined as the typical
application rate used by trained personnel during field trial test plots. Each treatment
(except Clear ETI Fire Gel) was applied via 1 L pump spray bottle to all punnets within
a treatment at one time to assist consistent application across all punnets. Clear ETI Fire
Gel was also applied at 1.5 Lm-2 but due to the nature of the gel’s swollen crystals could
not pass through the nozzle of a pump spray bottle. Instead, Clear ETI Fire Gel was
manually applied though flicking finger-fulls of gel evenly over punnets.
Punnets were not watered for 48 hours after suppressant treatments were applied, after
which light watering commenced every 2-3 days to keep sand moist to facilitate
germination. Overhead mist watering was used to minimise disturbance to seeds and the
sand substrate, and to avoid removing the majority of fire suppressant from punnets
during the first initial watering.
2.1.5 Monitoring
Native and weed seed punnets were monitored for total seedling emergence and rate of
emergence every two weeks for a period of 12 weeks when no further seedlings
emerged. Emerged seedlings were retained in the punnets to observe the effects of fire
suppressants post emergence. Seedling mortality was tallied, with dead seedlings
removed to avoid fungal growth in the punnets that may affect nearby seeds or
seedlings.
Page 60
46
2.1.6 Statistical Analysis
Binomial Logistic Regression (SPSS11.5) was used to analyse the final number of
emerged seedlings at week 12 of the trial. Each species was analysed independently. As
explained within Appendix A, data for native seeds treated with FireAde short-term
foam have been excluded from this trial due to a mixing rate error. The error was
corrected for the weed species emergence trial, and that data is included within the
statistical analysis. Emergence under each fire suppressant treatment was compared
against the control treatment by using dummy variables as covariates. Rate of
emergence was assessed graphically and by consideration of time at which 0%, 50%,
and 100% of final seedling emergence occurs (t0%, t50%, and t100%, respectively,
with t0% representing the latest monitoring time at which no emergence was recorded).
2.2 In Situ Trials
In situ seedling emergence trials were conducted for native species of the Swan Coastal
Plain to test the first of the three hypotheses under field conditions: (i) fire suppressants
reduce native seedling emergence.
2.2.1 Field Site Details
Two field sites were used to observe the effects of fire suppressants on seedling
emergence under field conditions. The first site at Whiteman Park trialled the effects on
emergence within unburnt vegetation. The second field site at Wanneroo trialled the
effects on emergence directly following a prescribed fire.
2.2.1.1 Whiteman Park
A mature Banksia woodland community in good condition was identified at Whiteman
Park (Cullacabardee block) (-31.804370, 115.897195, GDA94) to trial the effects of fire
suppressants. The community consisted of open Banksia menziesii R.Br. woodland over
a shrubland of Xanthorrhoea preissii Endl., Hibbertia hypericoides (DC) Benth., and
Page 61
47
Eremaea pauciflora Endl. over mixed herbs/grasses. This site had not been burnt within
the previous ~20 years and thus enabled investigation of fire suppressants on flora and
community composition without the confounding factor of recent fire. The soil of
Cullacabardee is within the Bassendean Sand soil association, containing little silt or
clay, very low levels of nutrient elements, and with any nutrient element content
associated with organic matter (Bolland 1998).
2.2.1.2 Wanneroo
A mixed Banksia/Jarrah/Marri woodland community within the City of Wanneroo was
sourced for use as a “with-fire” community trial (-31.748487, 115.805705, GDA94).
The community consisted of a Banksia menziesii, Eucalyptus marginata Sm., and
Corymbia calophylla (Lindl.) K.D.Hill & L.A.S.Johnson overstorey above a shrubland
of Xanthorrhoea preissii Endl., Hibbertia hypericoides, and Petrophile macrostachya
R.Br. over mixed herbs/grasses. Soil at the Wanneroo site is classed as pale grey
Karrakatta sand (Bolland 1998), limited in nutrient elements but not to the extent of
Bassendean Sand at the Whiteman Park field site. The site was selected as it was
scheduled for a fuel reduction burn that coincided with the research schedule.
2.2.2 Fire Suppressant Treatments
2.2.2.1 Whiteman Park
Treatments consisted of all ten fire suppressants (Appendix A), a wet control (water
only), and a dry control (no water or suppressant). Experimental plots were installed
along one side of a fire access track, where fire suppressants would typically be used by
ground units during fire fighting operations. Three replicate sets of plots were installed,
each replicate set placed within relatively homogeneous vegetation. Treatments were
sequentially assigned to plots prior to establishment to ensure even spatial dispersal of
replicate plots throughout the study area. Plots measured 7 m wide and 10 m deep from
the access track, with buffers of 3 m. Suppressant treatments were applied at Whiteman
Park on the 5th and 6th of April 2006 (autumn).
Page 62
48
2.2.2.2 Wanneroo
Prior to analysis, observational assessment of the Whiteman Park without-fire treatment
plots revealed minimal differences in impact on vegetation within the three suppressant
types (foam, gel, retardant). Therefore, only three representative suppressants (in
addition to dry and wet controls) were applied at Wanneroo. Reducing suppressant
treatments at this field site also enabled plant community monitoring (chapter 4) to be
completed within a short time; deemed necessary to reduce plant growth disparity given
rapid regrowth after fire. To represent a range of suppressant types, one short-term foam
(Silv-Ex), one gel product (ClearETI), and the long term retardant (Phos-Chek) were
selected for the trial. Silv-Ex was chosen as the short-term foam due to its current
widespread use. ClearETI was selected to represent gel suppressants (Barricade was the
preferred gel product but was excluded as the concentrate had separated during storage
and could not be adequately mixed on site). Phos-Chek retardant was selected due to its
high nutrient content and relatively high impact observed amongst other trials within
this research (see previous chapters).
The Wanneroo site was burned on the 28th of May 2008 for fuel reduction purposes and
in preparation for the trial. The burn was conducted jointly by FESA (Fire &
Emergency Services Authority) and the City of Wanneroo personnel. Three replicates
plots of each treatment were installed within the centre of the burn area, away from fire
breaks and tracks to avoid areas where suppressants were used to control the prescribed
fire. As at the Whiteman site, treatments were sequentially assigned to plots prior to
establishment to ensure even spatial dispersal of replicate plots throughout the study
area. Plots measured 7 m wide and 10 m deep, with buffers of 3 m. Suppressant
treatments were applied at Wanneroo in autumn on the 29th and 30th of May 2008 (the
two days following the fire).
2.2.3 Emergence Plots
Each 7 m x 10 m suppressant plot contained three seedling emergence plots, each 30 x
30 cm. Each emergence plot contained 30 full seeds of each species. Emergence plots
were placed diagonally across the entire 7 m x 10 m suppressant plot, with one
emergence plot in the centre and the other two positioned 2 m within the plot’s opposite
Page 63
49
corners. Emergence plots were prepared by first removing any coarse litter then by
harrowing all seeds into the soil or fine organic layer using a hand rake. Emergence
plots at Whiteman Park were installed and sown one day prior to application of
suppressant treatments. Emergence plots at Wanneroo were installed and sown with
seed after the prescribed burn and immediately before application of suppressant
treatments.
2.2.4 Seed Selection and Preparation
Eighteen species common to Banksia woodland of the Swan Coastal Plain were selected
for the without-fire trial at Whiteman Park. Eleven species were sown at the
subsequently performed with-fire trial at Wanneroo due to limited seed supplies. These
11 species were selected due to availability and field emergence success in the
Whiteman Park emergence trial. Table 2 summarises the species included at both field
sites. These species were selected to represent common families and species in Banksia
woodland, and also subject to seed merchant availability. All seed was purchased from
Seeds West Inc. and sourced by them from the vicinity of Wanneroo.
Table 2: List of species sown within in situ seedling emergence plots at
the without-fire and with-fire field sites.
Species Family Whiteman
(Without-Fire) Wanneroo (With-Fire)
Brachyscome iberidifolia Benth. Asteraceae √ Olearia axillaris (DC.) Benth. Asteraceae √ Ozothamnus cordatus (DC.) Anderb. Asteraceae √ Allocasuarina humilis (Otto & F.Dietr.) L.A.S.Johnson Casuarinaceae √ √ Rhagodia baccata (Labill.) Moq. Chenopodiaceae √ √ Acacia pulchella R.Br. Fabaceae √ √ Bossiaea eriocarpa Benth. Fabaceae √ √ Gompholobium tomentosum Labill. Fabaceae √ √ Jacksonia furcellata (Bonpl.) DC. Fabaceae √ Anigozanthos manglesii D.Don Haemadoraceae √ √ Conostylis aculeata R.Br. Haemadoraceae √ √ Eremaea pauciflora (Endl.) Druce Myrtaceae √ √ Eucalyptus marginata Sm. Myrtaceae √ √ Hypocalymma robustum (Endl.) Lindl. Myrtaceae √ Melaleuca thymoides Labill. Myrtaceae √ √ Regelia inops (Schauer) Schauer Myrtaceae √ Banksia grandis Willd. Proteaeceae √ √
Banksia menziesii R.Br. Proteaeceae √
Page 64
50
Seeds of some species were pretreated to overcome dormancy. Anigozanthos manglesii
seeds were oven heated at 100 oC for 3 hours (as per Sweedman & Merritt 2006).
Regelia inops, Hypocalymma robustum, Ozothamnus cordatus seeds were pretreated
with smoke water (1:10 v/v). Rhagodia baccata seeds were prepared using pectinase to
dissolve the fruit flesh before being treated with smoke water (1:10 v/v) and gibberellic
acid (1000 ppm GA(3)) (as per D Merritt 2006 pers. comm.). Seed of the remaining
species were not pretreated as these species are non-dormant. To maximise potential
seedling emergence only mature and intact seeds, determined by visual and tactile
inspection, were selected for the trial.
2.2.5 Fire Suppressant Application
2.2.5.1 Equipment
Four-wheel-drive light tanker vehicles were used to mix and apply fire suppressants to
trial plots at both the Whiteman Park and Wanneroo field sites. Light tankers typically
possessed a water tank (up to 550 L), 9 hp auxiliary motor, hose, and nozzle with fog to
straight stream capability (similar to Figure 1).
Flow rate from the hose nozzle varied amongst the multiple suppressant treatments due
to differences in suppressant viscosity and changes in the throttle of the pump’s motor.
Figure 1: Example of a light tanker vehicle, similar to those used to apply fire suppressants to both field
sites. Photo by Nachoman-au; http://commons.wikimedia.org/wiki/User:Nachoman-au.
Page 65
51
To correct for this, the flow rate was re-calculated prior to each suppressant’s
application by recording the time taken to fill a 20 L bucket. The time required to apply
suppressant to plots was then calculated accordingly to ensure a consistent application
rate of 1.5 Lm-2 to all plots of all suppressant treatments.
2.2.5.2 Preparation
Mixing rates of each fire suppressant were obtained from manufacturer’s directions, and
are summarised in Appendix A. Sufficient suppressant to allow all three replicate plots
to be applied at one time was prepared by adding suppressant concentrate into the
prefilled water tank on the light tanker vehicle. The fire suppressant mix was then
circulated through the hose and back into the top of the tank to ensure the suppressant
was thoroughly mixed. Barricade gel, Clear ETI Fire Gel, and Phos-Chek retardant
required additional manual mixing using a shovel handle to ensure concentrate clots
were removed from tank baffles and properly dissolved. Potable water obtained from
the mains water network (via hydrants) was used at all times to prepare all fire
suppressants. Between applications of each suppressant product the fire unit’s tank and
hose were thoroughly cleaned using potable mains water.
2.2.5.3 Application
Suppressant treatments were applied at Whiteman Park on the 5th and 6th of April 2006,
and at Wanneroo on the 29th and 30th of May 2008 (the two days following the fire).
Suppressants were applied at a rate of 1.5 Lm-2 to each 7 m x 10 m plot (thus 105 L per
plot) matching the application rate used by trained personnel in previous test plots.
Suppressants were applied evenly with additional emphasis upon fire hazard features
such as tree trunks and dense vegetation. This method simulates how suppressants are
used a) during direct attack on flames, b) to create a suppressant fire-break in unburned
vegetation, and c) to target smouldering fuel during mop-up activities. Personnel
applying fire suppressants to plots were unaware of the location of seeds and emergence
plots, preventing any biased application.
Page 66
52
2.2.6 Seedling Harvesting
Six months after the application of fire suppressants, the above ground parts of
seedlings within each emergence plot were hand harvested. All seedlings from an
individual emergence plot were placed in the same collection bag. The number of alive
and dead seedlings for each species was tallied to assess final emergence totals.
Informal monitoring of seed plots found that while some seedling deaths occurred
within the latter period of the trial, stems and foliage of dead seedlings were retained.
Most dead seedling still retained foliage at harvest which easily permitting species
identification. Seedlings without foliage were still readily identified by comparison of
stems to live seedling specimens. No evidence for grazing of seedlings was found.
2.2.7 Statistical Analysis
Binomial Logistic Regression (SPSS 11.5) was utilised to test if fire suppressant
treatment had an impact on the final number of in situ emerged seedlings six months
after sowing. Each species was analysed independently. Emergence under each fire
suppressant treatment was compared against both the dry control and wet control
treatments by using dummy variables as covariates.
Page 67
53
3.0 Results
3.1 Ex Situ Trials
Statistical analyses output for both native and weed species ex situ emergence trials are
presented in Appendix D. The results for each species are summarised below.
3.1.1 Native Species
3.1.1.1 Acacia pulchella
A comparison of final emergence for Acacia pulchella under each treatment is
displayed in Figure 1. Final seedling emergence of Acacia pulchella within the control
treatment was 18.7%. Phos-Chek was the only suppressant to statistically affect final
emergence of this species, reducing emergence to 5.3% (p=0.018). Although emergence
under the ClearETI gel treatment increased to 25.3%, it was not statistically significant
compared to the control (p=0.326).
Table 1 presents time to 0%/50%/100% emergence (t0%/t50%/t100%) within each
treatment. Figure 1 presents the rate of seedling emergence (emergence curve) over the
twelve week trial. Compared to the control treatment Phos-Chek retardant delayed t0%
by 14 days and greatly delayed t50% by 25 days.
3.1.1.2 Allocasuarina humilis
A comparison of final emergence for Allocasuarina humilis under each treatment is
displayed in Figure 1. Final seedling emergence of Allocasuarina humilis within the
control treatment was 26.7%. Six of the nine suppressants significantly reduced
emergence compared to the control treatment; Chemguard, Hydrex, Silv-Ex, Ansul,
Virtual, and Phos-Chek (p < 0.05). Virtual foam had the greatest impact reducing final
emergence to 4.00%, an 85% reduction compared to the control treatment. Jet-X,
Barricade and ClearETI had no significant impact on final emergence (p ≥ 0.05).
Page 68
54
Table 1: Time in days to 0%/50%/100% seedling emergence (t0%/t50%/t100%) for native species seed
sown ex situ and then treated with fire suppressants.
Acacia pulchella Allocasuarina humilis Anigozanthos manglesii Treatment t0% t50% t100% t0% t50% t100% t0% t50% t100% Control 0.0 9.5 84.0 0.0 5.8 14.0 0.0 9.1 28.0 Chemguard 0.0 5.8 14.0 0.0 5.8 14.0 0.0 7.5 56.0 Hydrex 0.0 8.2 84.0 0.0 5.8 14.0 0.0 7.9 70.0 Jet-X 0.0 10.0 84.0 0.0 48.0 84.0 0.0 14.1 56.0 Silv-Ex 0.0 7.8 70.0 0.0 18.6 42.0 0.0 21.9 70.0 Ansul3% 0.0 7.9 56.0 0.0 8.7 42.0 0.0 9.9 42.0 Virtual 0.0 7.9 84.0 42.0 59.4 70.0 0.0 45.3 84.0 Phos-Chek 14.0 34.5 84.0 0.0 14.0 70.0 28.0 49.7 84.0 Barricade 0.0 7.4 84.0 0.0 7.2 56.0 0.0 17.6 56.0 ClearETI 0.0 7.4 84.0 0.0 6.6 42.0 0.0 10.8 56.0 Banksia menziesii Conostylis aculeata Eucalyptus marginata Control 0.0 8.9 42.0 0.0 10.3 84.0 0.0 5.8 14.0 Chemguard 0.0 14.5 70.0 0.0 11.8 84.0 0.0 8.1 70.0 Hydrex 0.0 9.4 42.0 14.0 49.6 70.0 0.0 7.1 56.0 Jet-X 0.0 12.8 56.0 0.0 35.9 84.0 0.0 14.1 84.0 Silv-Ex 0.0 50.8 84.0 0.0 0.0 0.0 0.0 44.1 84.0 Ansul3% 0.0 13.1 42.0 28.0 42.0 70.0 0.0 6.6 70.0 Virtual 14.0 56.1 84.0 28.0 46.1 56.0 0.0 20.3 70.0 Phos-Chek 0.0 32.2 70.0 28.0 44.2 56.0 0.0 7.9 84.0 Barricade 0.0 16.7 56.0 0.0 0.0 0.0 0.0 6.4 70.0 ClearETI 0.0 10.0 84.0 14.0 31.4 42.0 0.0 6.0 70.0 Gompholobium tomentosum Melaleuca thymoides Rhagodia baccata Control 0.0 7.6 28.0 0.0 5.9 28.0 0.0 6.9 56.0 Chemguard 0.0 12.5 56.0 0.0 12.6 70.0 0.0 6.5 42.0 Hydrex 0.0 45.9 84.0 0.0 17.4 56.0 14.0 24.8 56.0 Jet-X 0.0 11.4 42.0 0.0 11.2 70.0 14.0 59.0 84.0 Silv-Ex 14.0 64.0 84.0 0.0 0.0 0.0 0.0 34.2 84.0 Ansul3% 0.0 20.3 70.0 0.0 6.8 70.0 0.0 7.9 84.0 Virtual 28.0 52.5 84.0 14.0 21.8 70.0 0.0 7.9 84.0 Phos-Chek 0.0 56.1 70.0 0.0 13.6 28.0 0.0 12.3 70.0 Barricade 0.0 7.3 42.0 0.0 18.2 28.0 0.0 14.0 42.0 ClearETI 0.0 7.1 28.0 0.0 6.9 28.0 0.0 7.6 70.0
Page 69
55
Acacia pulchella
*
0%
5%
10%
15%
20%
25%
30%
0 10 20 30 40 50 60 70 80 90Time (days)
Emer
genc
e
Allocasuarina humilis
**
*
*
*
0%
5%
10%
15%
20%
25%
30%
0 10 20 30 40 50 60 70 80 90Time (days)
Emer
genc
e
Anigozanthos manglesii*
**
*
*
0%
10%
20%
30%
40%
50%
60%
70%
80%
90%
0 10 20 30 40 50 60 70 80 90Time (days)
Emer
genc
e
Control Chemguard Hydrex-AR Jet-X Silv-Ex
Ansul 3% Virtual Phos-Chek Barricade Clear ETI
Figure 1: Impact of fire suppressants on cumulative and final seedling emergence of native species.
Significant differences in final seedling emergence compared to the control treatment are denoted by *.
Page 70
56
Banksia menziesii
*
*
*
0%
20%
40%
60%
80%
100%
120%
0 10 20 30 40 50 60 70 80 90Time (days)
Emer
genc
e
Conostylis aculeata
**
*
*
*
*
0%
5%
10%
15%
20%
25%
30%
0 10 20 30 40 50 60 70 80 90Time (days)
Emer
genc
e
Eucalyptus marginata
*
***
0%
10%
20%
30%
40%
50%
60%
70%
0 10 20 30 40 50 60 70 80 90Time (days)
Emer
genc
e
Control Chemguard Hydrex-AR Jet-X Silv-Ex
Ansul 3% Virtual Phos-Chek Barricade Clear ETI
Figure 1 (continued): Impact of fire suppressants on cumulative and final seedling emergence of native
species. Significant differences in final seedling emergence compared to the control treatment are
denoted by *.
Page 71
57
Gompholobium tomentosum
**
0%
3%
6%
9%
12%
15%
18%
0 10 20 30 40 50 60 70 80 90Time (days)
Emer
genc
e
Melaleuca thymoides
*
**
*
*
**
*
0%
20%
40%
60%
80%
100%
0 10 20 30 40 50 60 70 80 90Time (days)
Emer
genc
e
Rhagodia baccata
*
0%
5%
10%
15%
20%
25%
0 10 20 30 40 50 60 70 80 90Time (days)
Emer
genc
e
Control Chemguard Hydrex-AR Jet-X Silv-Ex
Ansul 3% Virtual Phos-Chek Barricade Clear ETI
Figure 1 (continued): Impact of fire suppressants on cumulative and final seedling emergence of native
species. Significant differences in final seedling emergence compared to the control treatment are
denoted by *.
Page 72
58
Table 1 presents time to 0%/50%/100% emergence (t0%/t50%/t100%) within each
treatment. Figure 1 presents the rate of seedling emergence (emergence curve) over the
twelve week trial. Compared to the control treatment Virtual foam greatly delayed t0%
by 42 days and delayed t50% by 53.6 days. While Jet-X did not delay t0%, reduced
initial emergence numbers delayed t50% by 42.2 days. However, due to a second period
of delayed emergence during the second half of the trial, final emergence within the Jet-
X treatment was comparable to the control treatment.
3.1.1.3 Anigozanthos manglesii
A comparison of final emergence for Anigozanthos manglesii under each treatment is
displayed in Figure 1. Final seedling emergence of Anigozanthos manglesii within the
control treatment was 61.3%. Five suppressants significantly affected Anigozanthos
manglesii; Silv-Ex, Virtual, and Phos-Chek reduced emergence. Hydrex and ClearETI
significantly increased emergence for this species. Of the suppressants reducing
seedling emergence, Phos-Chek had a severe impact reducing emergence to only
13.33% (p=0.013), a 78.3% reduction from the control emergence of 61.3%. Silv-Ex
foam reduced emergence to 41.33% and Virtual foam reduced emergence to 44.0%
(p<0.05). Hydrex improved final emergence to 81.3% and ClearETI improved
emergence to 80.0%, compared to the control emergence of 61.3% (p<0.05).
Chemguard, Jet-X, Ansul3%, and Barricade had no significant impact on final
emergence (p ≥ 0.05).
Table 1 presents time to 0%/50%/100% emergence (t0%/t50%/t100%) within each
treatment. Figure 1 presents the rate of seedling emergence (emergence curve) over the
twelve week trial. Suppressants that increased emergence compared to the control
(Hydrex and ClearETI) did not change the shape of the emergence-curve. However,
suppressants that decreased final emergence (Silv-Ex, Virtual, and Phos-Chek) also
greatly decreased initial seedling emergence, and for Phos-Chek delayed t0% by 28
days. Compared to the control treatment, Silv-Ex, Virtual, and Phos-Chek also delayed
t50% by 12.8, 36.2, and 40.6 days, respectively. In addition to reduced initial
emergence and delayed t50%, Virtual, Phos-Chek, and to a lesser extent Silv-Ex
produced a second period of seedling mergence within days 42-56.
Page 73
59
3.1.1.4 Banksia menziesii
A comparison of final emergence for Banksia menziesii under each treatment is
displayed in Figure 1. Final seedling emergence of Banksia menziesii within the control
treatment was 94.4%. Three of the nine fire suppressants significantly reduced seedling
emergence of Banksia menziesii. Virtual foam had a severe impact, reducing final
emergence to 16.7% (p<0.001). Jet-X foam and Phos-Chek retardant had a moderate
impact, significantly reducing final emergence to 72.2% and 75.0%, respectively
(p<0.05).
Table 1 presents time to 0%/50%/100% emergence (t0%/t50%/t100%) within each
treatment. Figure 1 presents the rate of seedling emergence (emergence curve) over the
twelve week trial. Suppressants that decreased final emergence (Silv-Ex, Virtual, and
Phos-Chek) also greatly decreased initial seedling emergence, and additionally, for
Virtual foam delayed t0% by 28 days. Compared to the control treatment Silv-Ex,
Virtual, and Phos-Chek also delayed t50% by 41.9, 47.2, and 23.3 days, respectively.
After the initial delay, emergence under the Phos-Chek treatment progressed with a
similar, but delayed, curve to the control treatment. The Silv-Ex emergence curve is
exponential in shape, with emergence increasing over time until final emergence is
almost reached. Virtual foam’s emergence curve for Banksia menziesii is unusual
compared to other treatments, having a linear and steady trickle of emergence over time
and with a low final emergence.
3.1.1.5 Conostylis aculeata
A comparison of final emergence for Conostylis aculeata under each treatment is
displayed in Figure 1. Final seedling emergence of Conostylis aculeata within the
control treatment was 21.3%. Even with the low emergence rate of this species, seven of
the nine suppressants significantly further reduced emergence. No emergence occurred
under the Silv-Ex foam and Barricade gel treatments. ClearETI, Ansul, Hydrex, Jet-X,
and Virtual significantly reduced emergence of Conostylis aculeata to 4.0%, 5.3%,
6.7%, 8.0%, and 9.3%, respectively. An increase to 28% emergence occurred under
Chemguard foam, but this increase was not statistically significant (p=0.345). Phos-
Chek also did not significantly affect final seedling emergence (p ≥ 0.05).
Page 74
60
Table 1 presents time to 0%/50%/100% emergence (t0%/t50%/t100%) within each
treatment. Figure 1 presents the rate of seedling emergence (emergence curve) over the
twelve week trial. With the exception of Jet-X, suppressants that caused a significant
reduction in final emergence also increased t0% and t50%, and in some cases decreased
t100%, compared to the control treatment. Ansul3%, Phos-Chek, and Barricade delayed
t0% by 28 days while Hydrex and ClearETI delayed t0% by 14 days.
Hydrex, Jet-X, Ansul3%, Virtual, and ClearETI delayed t50% by 39.3, 25.6, 31.7, 35.8,
and 21.1 days, respectively. Though final emergence for Phos-Chek was not
significantly different from the control treatment, Phos-Chek did delayed t50% by 33.9
days. Additionally, t100% occurred earlier for Virtual, Phos-Chek and ClearETI at 56,
56, and 42 days, respectively, compared to the control treatment (84 days). Chemguard
was the only suppressant that had no appreciative impact on the seedling emergence
curve.
3.1.1.6 Eucalyptus marginata
A comparison of final emergence for Eucalyptus marginata under each treatment is
displayed in Figure 1. Final seedling emergence of Eucalyptus marginata within the
control treatment was 32.0%, and the reaction to fire suppressants was mixed. Five
suppressants had no effect, three significantly decreased final emergence, while one
suppressant significantly increased final emergence. Virtual, Ansul, and Silv-Ex more
than halved final seedling emergence with rates of 6.7%, 12.0%, and 14.7%,
respectively (p<0.05). Hydrex foam almost doubled seedling emergence of Eucalyptus
marginata with an increase to 60.0% of seeds (p=0.001).
Table 1 presents time to 0%/50%/100% emergence (t0%/t50%/t100%) within each
treatment. Figure 1 presents the rate of seedling emergence (emergence curve) over the
twelve week trial. All suppressants produced emergence curves similar in shape to the
control treatment. However, t50% was delayed by Silv-Ex and Virtual foams by 38.3
and 14.5 days, respectively, compared to the control treatment.
Page 75
61
3.1.1.7 Gompholobium tomentosum
A comparison of final emergence for Gompholobium tomentosum under each treatment
is displayed in Figure 1. Final seedling emergence of Gompholobium tomentosum
within the control treatment was low at 14.7%. Despite this, two fire suppressants
significantly reduced final emergence compared to the control treatment. Phos-Chek
retardant reduced final emergence to only 2.7%, an 81.8% reduction from the control
emergence rate. Silv-Ex foam reduced emergence to 4.0%, a 72.7% reduction from the
control final emergence rate.
Table 1 presents time to 0%/50%/100% emergence (t0%/t50%/t100%) within each
treatment. Figure 1 presents the rate of seedling emergence (emergence curve) over the
twelve week trial. Seven of the nine suppressants affected the seedling emergence curve
of Gompholobium tomentosum. Control treatment seedling emergence was rapid and
concluded after only 28 days. Two foams (Silv-Ex and Virtual) delayed t0% by 14 days
and 28 days, respectively. Hydrex, Silv-Ex, Virtual, and Phos-Chek all delayed t50% by
38.3, 56.4, 44.9, and 48.5 days, respectively. However, at 42 days delayed emergence
within Hydrex and Virtual treatments accelerated rapidly and approached the emergence
of the control treatment. In contrast, emergence within Silv-Ex and Phos-Chek
treatments remained poor. All suppressants excepting ClearETI delayed t100%;
Ansul3% and Phos-Chek t100% occurred at 70 days, while Hydrex, Silv-Ex, and
Virtual t100% occurred at 84 days when the trial was concluded.
3.1.1.8 Melaleuca thymoides
A comparison of final emergence for Melaleuca thymoides under each treatment is
displayed in Figure 1. Final seedling emergence of Melaleuca thymoides within the
control treatment was 88.0%. Final emergence was significantly reduced by eight of the
nine tested suppressants, making this species’ emergence the most sensitive to fire
suppressants. Ansul3% foam was the only suppressant that did not reduce emergence.
Emergence under Ansul increased slightly (96.0% of seeds) compared to the control
treatment (88.0%), although this increase was not statistically significant (p=0.085).
Page 76
62
Unlike all other species included in the trials, Melaleuca thymoides was the only species
to experience increased mortality after emergence due to a suppressant. Nineteen of the
twenty one seedlings emerging in the Barricade gel treatment died before week four of
the trial. The remaining two seedlings survived to the trial’s conclusion at twelve weeks.
Melaleuca thymoides seeds were ‘gentle germinators’ with cotyledons that emerged
slowly and laterally rather than upward. As such they were unable to push through the
film of Barricade gel on the sand’s surface. The gel appeared to act as a physical barrier
preventing air reaching the cotyledons resulting in seedlings rotting and permitting
fungal growth. It is important to note, however, that Barricade gel was not observed to
increase mortality of any other species tested in the trials.
Table 1 presents time to 0%/50%/100% emergence (t0%/t50%/t100%) within each
treatment. Figure 1 presents the rate of seedling emergence (emergence curve) over the
twelve week trial. Barricade delayed t0% by 14 days, the only suppressant to delay
initial emergence. Final seedling emergence was reached after only 28 days for the
control treatment and for Phos-Chek, Barricade, and ClearETI. With the exception of
Silv-Ex (no seedling emergence) all foam suppressants delayed t100%; until day 56 for
Hydrex and day 70 for Chemguard, Jet-X, Ansul3%, and Virtual.
3.1.1.9 Rhagodia baccata
A comparison of final emergence for Rhagodia baccata under each treatment is
displayed in Figure 1. Final seedling emergence of Rhagodia baccata within the control
treatment was 20.0%. A general reduction in final emergence rates was found under all
suppressant treatments. However, only Silv-Ex reduced final emergence significantly
with a final rate of 6.7% (p=0.022). Jet-X reduced emergence by almost half (9.3%)
compared to the control treatment, but was not statistically significant (p=0.071).
Table 1 presents time to 0%/50%/100% emergence (t0%/t50%/t100%) within each
treatment. Figure 1 presents the rate of seedling emergence (emergence curve) over the
twelve week trial. Hydrex and Jet-X foams delayed t0% of Rhagodia baccata by 14
days. These two foams also delayed t50% compared to the dry control by 17.9 and 52.1
days, respectively. Hydrex experienced a secondary emergence event after 56 days.
Page 77
63
Additionally, Silv-Ex, the only suppressant to significantly reduce final seedling
emergence, delayed t50% by 27.3 days.
3.1.2 Weed Species
3.1.2.1 Asparagus asparagoides
A comparison of final emergence for Asparagus asparagoides under each treatment is
displayed in Figure 4. Final seedling emergence of Asparagus asparagoides within the
control treatment was 54.7%. In contrast to all other species tested in the trial
Asparagus asparagoides final seedling emergence was enhanced by fire suppressants.
Seven of the nine suppressants significantly increased emergence (p<0.05) and the two
remaining suppressants (Hydrex and Phos-Chek) had no significant impact (p≥0.05).
The greatest increase occurred under Jet-X, Virtual, and ClearETI suppressants all of
which had a final emergence of 94.7%, a 73.2% increase compared to the control
treatment (p<0.05). Ansul3% had the next greatest increase with seedling emergence of
92.0% (p<0.05). Silv-Ex, Chemguard, and Barricade increased emergence to 89.3,
76.0%, and 73.3%, respectively (p<0.05).
Table 2 presents time to 0%/50%/100% emergence (t0%/t50%/t100%) within each
treatment. Figure 4 presents the rate of seedling emergence (emergence curve) over the
twelve week trial. The two suppressants that did not affect final emergence (Hydrex and
Phos-Chek) delayed t50% compared to the control treatment by 27.7 and 14.6 days,
respectively. Jet-X and FireAde also delayed t50% by 14.3 and 19.5, respectively, but
emergence increased in the second half of the trial and approached the control
treatment’s final emergence percentage.
3.1.2.2 Ehrharta calycina
A comparison of final emergence for Ehrharta calycina under each treatment is
displayed in Figure 4. Final seedling emergence of Ehrharta calycina within the control
treatment was 30.7%. Six of the ten fire suppressants had a statistically significant
impact on Ehrharta calycina final emergence. Silv-Ex, Virtual, and Phos-Chek all
Page 78
64
Table 2: Time in days to 0%/50%/100% seedling emergence (t0%/t50%/t100%) for weed species seed
sown ex situ and treated with fire suppressants.
Asparagus asparagoides Ehrharta calycina Treatment t0% t50% t100% t0% t50% t100% Control 0.0 24.1 84.0 0.0 8.1 28.0 Chemguard 0.0 24.4 84.0 0.0 17.6 56.0 Hydrex 14.0 51.8 84.0 0.0 7.4 56.0 Jet-X 0.0 38.4 84.0 14.0 31.4 42.0 FireAde 14.0 43.6 84.0 0.0 8.9 42.0 Silv-Ex 0.0 23.8 84.0 - - - Ansul3% 14.0 22.9 70.0 0.0 5.8 14.0 Virtual 14.0 27.9 56.0 - - - Phos-Chek 14.0 38.7 84.0 - - - Barricade 14.0 24.7 70.0 0.0 6.6 42.0 ClearETI 14.0 23.3 84.0 0.0 7.2 70.0 Gladiolus caryophyllaceus Pelargonium capitatum Control 14.0 21.6 56.0 0.0 7.6 56.0 Chemguard 14.0 22.2 56.0 0.0 14.8 56.0 Hydrex 14.0 24.7 84.0 0.0 9.4 42.0 Jet-X 14.0 21.1 42.0 0.0 11.5 56.0 FireAde 14.0 21.1 56.0 0.0 19.2 70.0 Silv-Ex 14.0 21.4 56.0 0.0 23.3 56.0 Ansul3% 14.0 22.5 56.0 0.0 7.0 28.0 Virtual 14.0 21.4 56.0 0.0 19.4 56.0 Phos-Chek 14.0 32.3 42.0 0.0 20.7 56.0 Barricade 14.0 21.9 42.0 0.0 10.6 84.0 ClearETI 14.0 21.3 56.0 0.0 10.8 56.0
reduced emergence to 0.0% (p<0.001). Jet-X and Barricade reduced emergence to 4.0%
and 10.7%, respectively (p<0.05). Surprisingly, ClearETI increased seedling emergence
of Ehrharta calycina to 65.3% (p=0.000), more than doubled the emergence of the
control treatment. Chemguard, Hydrex, FireAde, and Ansul3% had no significant
impact on final emergence.
Table 2 presents time to 0%/50%/100% emergence (t0%/t50%/t100%) within each
treatment. Figure 4 presents the rate of seedling emergence (emergence curve) over the
twelve week trial. While some suppressants significantly decreased or increased the
final emergence of Ehrharta calycina, the emergence curves of all treatments were
comparable in shape to the control treatment. Chemguard and Jet-X delayed t50% by
9.5 and 23.3 days, respectively, compared to the control treatment. Seedling emergence
of the control treatment reached t100% quickly at 28 days. ClearETI reached t100% at
70 days, Chemguard and Hydrex at 56 days, while Jet-X, FireAde, and Barricade
reached t100% at 42 days.
Page 79
65
Asparagus asparagoides
*
***
*
0%
20%
40%
60%
80%
100%
0 10 20 30 40 50 60 70 80 90Time (days)
Emer
genc
e
Ehrharta calycina
**
*
*
0%
15%
30%
45%
60%
75%
0 10 20 30 40 50 60 70 80 90Time (days)
Emer
genc
e
Gladiolus caryophyllaceus *
*
0%
20%
40%
60%
80%
100%
0 10 20 30 40 50 60 70 80 90Time (days)
Emer
genc
e
Control Chemguard Hydrex-AR Jet-X FireAde Silv-Ex
Ansul 3% Virtual Phos-Chek Barricade Clear ETI
Figure 2: Impact of fire suppressants on cumulative and final seedling emergence of weed species.
Significant differences in final seedling emergence compared to the control treatment are denoted by *.
Page 80
66
Pelargonium capitatum
0%
20%
40%
60%
80%
100%
0 10 20 30 40 50 60 70 80 90Time (days)
Emer
genc
e
Control Chemguard Hydrex-AR Jet-X FireAde Silv-Ex
Ansul 3% Virtual Phos-Chek Barricade Clear ETI
Figure 2 (continued): Impact of fire suppressants on cumulative and final seedling emergence of weed
species. Significant differences in final seedling emergence compared to the control treatment are
denoted by *.
3.1.2.3 Gladiolus caryophyllaceus
A comparison of final emergence for Gladiolus caryophyllaceus under each treatment is
displayed in Figure 5. Final seedling emergence of Gladiolus caryophyllaceus within
the control treatment was 97.3%. Phos-Chek retardant had the greatest impact with a
significant reduction of final emergence to 77.3% (p=0.002), a 20.6% reduction from
the control treatment. Hydrex foam reduced emergence to 85.3% (p=0.020), a 12.3%
reduction from the control treatment. Compared to the impact on other species, these
reductions in Gladiolus caryophyllaceus emergence by Phos-Chek and Hydrex are
relatively minor.
Table 2 presents time to 0%/50%/100% emergence (t0%/t50%/t100%) within each
treatment. Figure 5 presents the rate of seedling emergence (emergence curve) over the
twelve week trial. Suppressants had minimal impact to Gladiolus caryophyllaceus
emergence curves. Phos-Chek slightly delayed t50% compared to the control treatment
by 10.7 days, and the majority of emergents were delayed 14 days after the initiation of
emergence. Hydrex reached t100% at 84 days, compared to the control treatment at 56
days.
Page 81
67
3.1.2.4 Pelargonium capitatum
A comparison of final emergence for Pelargonium capitatum under each treatment is
displayed in Figure 5. Final seedling emergence of Pelargonium capitatum within the
control treatment was 80.0%. Pelargonium capitatum was the only species with final
emergence unaffected by any of the nine suppressants (p≥0.05).
Table 2 presents time to 0%/50%/100% emergence (t0%/t50%/t100%) within each
treatment. Figure 5 presents the rate of seedling emergence (emergence curve) over the
twelve week trial. FireAde, Silv-Ex, Virtual, and Phos-Chek fire suppressants all
reduced the quantity of initial seedling emergence of Pelargonium capitatum at week
two of the trial (as indicated by the t50% of 11.6, 15.7, 11.8, and 13.1, respectively)
compared to the control treatment. By week six, however, emergence under these
suppressants had recovered to the level of the control and other suppressant treatments.
3.2 In Situ Trials
3.2.1 Field Emergence with No Fire
Statistical analyses output for the without-fire impact of fire suppressants on seedling
emergence are summarised in Appendix D. Of the 18 species of seed sown in field
emergence plots, 11 species produced seedlings, six of those species in sufficient
numbers for statistical analysis. Results for species that emerged in numbers sufficient
for statistic analysis are presented in the sections below. Insufficient numbers of
seedlings emerged for; Jacksonia furcellata, Eremaea pauciflora, Allocasuarina
humilis, Conostylis aculeata, and Anigozanthos manglesii. No seedlings emerged during
the field trial for; Brachyscome iberidifolia, Eucalyptus marginata, Hypocalymma
robustum, Olearia axillaris, Ozothamnus cordatus, Regalia inops, and Rhagodia
baccata.
Page 82
68
3.2.1.1 Acacia pulchella
Seedling emergence within dry control and wet control treatments for Acacia pulchella
was 3.0% and 3.3%, respectively. Seedling emergence of Acacia pulchella from seed
increased under four fire suppressants, compared to both the dry control and wet control
treatments (p<0.05).
ClearETI gel induced the greatest increase compared to both control treatments with
15.9% seedling emergence (43 seedlings) (p<0.05). This was the highest rate of
seedling emergence for all fire suppressant treatments and for all species of seed sown
at the without-fire Whiteman Park field site. Virtual foam with 12.2% seedling
emergence (33 seedlings) produced the next greatest increase compared to both dry and
wet control treatments (p<0.05). Compared to dry and wet control treatments, both
Hydrex foam and Barricade gel also increased seedling emergence to 9.6% (26
seedlings) (p<0.05).
3.2.1.2 Banksia grandis
Seedling emergence within dry control and wet control treatments for Banksia grandis
was 5.2% and 5.6%, respectively. In situ seedling emergence of Banksia grandis from
seed was reduced by two fire suppressants, compared to both dry control and wet
control treatments. Phos-Chek retardant significantly reduced seedling emergence,
compared to both dry and wet controls, to 0.4% (one seedling) (p<0.05). Jet-X reduced
field seedling emergence to 1.1% (three seedlings) (p<0.05).
3.2.1.3 Banksia menziesii
Seedling emergence within dry control and wet control treatments for Banksia menziesii
was 3.3% and 4.1%, respectively. In situ seedling emergence of Banksia menziesii from
seed was increased by Chemguard, Hydrex, and ClearETI suppressants compared to the
dry control treatment (p<0.05). However, the increases by the three suppressants were
not statistically significant compared to the wet control treatment (p≥0.05). As such, it
is not conclusively possible to discount that the addition of water, rather than
Page 83
69
suppressant chemicals, is responsible for the increases in seedling emergence of
Banksia menziesii in this trial.
3.2.1.4 Bossiaea eriocarpa
Seedling emergence within dry control and wet control treatments for Bossiaea
eriocarpa was 1.5% and 2.2%, respectively. Only Phos-Chek made a significant
difference to seedling emergence of Bossiaea eriocarpa. With 4.8% seedling emergence
(13 seedlings), Phos-Chek increased emergence versus the dry control (p=0.036).
However, Phos-Chek did not statistically increase emergence compared to the wet
control (p=0.110). As such, it is not possible to conclusively discount that the addition
of water, rather than Phos-Chek, is responsible for the increases in seedling emergence
of Bossiaea eriocarpa in this trial.
3.2.1.5 Gompholobium tomentosum
Seedling emergence within dry control and wet control treatments for Gompholobium
tomentosum was 3.7% and 1.1%, respectively. Several fire suppressants increased
seedling emergence of Gompholobium tomentosum versus the wet control treatment
(p<0.05); Chemguard, Hydrex, Jet-X, Virtual, Barricade, and ClearETI. However, this
was an artefact of reduced emergence produced within the wet control treatment, rather
than an increase emergence due to fire suppressant treatments. Only Phos-Chek
retardant with 9.3% emergence (25 seedlings) significantly increased emergence versus
both dry and wet controls (p<0.05).
3.2.1.6 Melaleuca thymoides
Seedling emergence within dry control and wet control treatments for Melaleuca
thymoides was 1.5% and 2.6%, respectively. No fire suppressant statistically affected in
situ seedling emergence at the Whiteman without-fire field site (p≥0.05).
Page 84
70
2.2.2 Field Emergence with Fire
Statistical analyses output for the with-fire impact of fire suppressants on seedling
emergence are summarised in Appendix D. Of the 11 species of seed sown in field
emergence plots nine species produced seedlings, eight of which produced sufficient
numbers for statistical analysis. Results for species that emerged in numbers sufficient
for statistic analysis are presented in the sections below. Insufficient numbers of
seedlings for analysis were produced by Melaleuca thymoides. No seedlings emerged
during the field trial for Anigozanthos manglesii and Eremaea pauciflora. It is important
to note that only three fire suppressants (Silv-Ex, Phos-Chek, and ClearETI) were
trialled at the with-fire site, compared with nine suppressants at the without-fire trial at
Whiteman Park.
3.2.2.1 Acacia pulchella
Seedling emergence within dry control and wet control treatments for Acacia pulchella
was 11.1% and 11.5%, respectively. In situ seedling emergence of Acacia pulchella
from seed decreased under two of the three fire suppressants, compared to both the dry
control and wet control treatments. Phos-Chek retardant caused the greatest reduction in
emergence compared to both dry and wet controls (p<0.05), with 4.8% seedling
emergence (13 seedlings). ClearETI gel reduced significantly reduced emergence versus
both controls (p<0.05), with 5.9% seedling emergence (16 seedlings).
3.2.2.2 Allocasuarina humilis
Seedling emergence within dry control and wet control treatments for Allocasuarina
humilis was 3.7% and 7.0%, respectively. While the wet control treatment increased
seedling emergence compared to the dry control, the increase was not statistically
significant (p=0.091). In situ seedling emergence of Allocasuarina humilis from seed
was decreased by both Phos-Chek and ClearETI suppressants to 0.7% (two seedlings), a
significant decreased compared to both the dry and wet control treatments (p<0.05).
Page 85
71
3.2.2.3 Banksia grandis
Seedling emergence within dry control and wet control treatments for Banksia grandis
was 51.1% and 49.3%, respectively. In situ seedling emergence of Banksia grandis
from seed decreased under two of the three fire suppressants, compared to both the dry
control and wet control treatments. Phos-Chek retardant induced the greatest decrease
compared to both control treatments 19.3% seedling mergence (52 seedlings) (p<0.05).
ClearETI gel also reduced emergence compared to both controls with 40.7% seedling
emergence (110 seedlings) (p<0.05).
3.2.2.4 Bossiaea eriocarpa
Seedling emergence within dry control and wet control treatments for Bossiaea
eriocarpa was 14.1% and 21.1%, respectively. The wet control treatment increased
seedling emergence compared to the dry control (p=0.033), signifying that additional
water within an application of fire suppressant may increase emergence of Bossiaea
eriocarpa. Despite increased emergence from the addition of water, Phos-Chek
retardant still reduced emergence compared to both dry and wet control treatments to
5.2% (14 seedlings) (p<0.05). ClearETI gel reduced emergence compared to the wet
control treatment to 11.5% (p=0.003), counteracting the benefit of additional water.
3.2.2.5 Conostylis aculeata
Seedling emergence within dry control and wet control treatments for Conostylis
aculeata was 14.4% and 18.2%, respectively. In situ seedling emergence of Conostylis
aculeata from seed significantly decreased for all three fire suppressants compared to
both dry and wet controls. ClearETI reduced emergence compared to both dry and wet
controls to 5.6% (15 seedlings) (p<0.05). Silv-Ex reduced emergence compared to both
dry and wet controls to 5.2% (14 seedlings) (p<0.05). Phos-Chek further reduced
emergence compared to dry and wet controls to 2.2% (6 seedlings) (p<0.05).
Page 86
72
3.2.2.6 Eucalyptus marginata
Seedling emergence within dry control and wet control treatments for Eucalyptus
marginata was 27.8% and 23.3%, respectively. In situ seedling emergence of
Eucalyptus marginata from seed decreased under two of the three fire suppressants,
compared to both the dry control and wet control treatments. Phos-Chek retardant
caused the greatest reduction in emergence compared to both dry and wet controls to
5.9% (16 seedlings) (p<0.05). ClearETI gel significantly reduced emergence versus
both controls to 16.3% (44 seedlings) (p<0.05).
3.2.2.7 Gompholobium tomentosum
Seedling emergence within dry control and wet control treatments for Gompholobium
tomentosum was 7.8% and 9.3%, respectively. In situ seedling emergence of
Gompholobium tomentosum from seed was reduced significantly under Phos-Chek
retardant compared to both the wet and dry control treatments to 3.0% (8 seedlings)
(p<0.05). Silv-Ex and ClearETI both significantly reduced seedling emergence
compared to the wet control only, to 4.4% (12 seedlings), and 4.17% (11 seedlings),
respectively (p<0.05). Though not significant, p-values of Silv-Ex and ClearETI
compared to the dry control were close to significance, being p=0.110 and p=0.073,
respectively.
3.2.2.8 Rhagodia baccata
Seedling emergence within dry control and wet control treatments for Rhagodia baccata
was 3.0% and 5.2%, respectively. ClearETI seedling emergence was significantly
reduced to 1.9% (five seedlings) compared to the wet control (p<0.05). However, this
effect is most likely due to the elevated emergence of the wet control treatment rather
than the decrease of emergence within the ClearETI treatment. Although, the wet
control emergence was higher compared to the dry control, the difference was not
significantly different (p=0.197). Overall, the impact of fire suppressants on seedling
emergence of Rhagodia baccata was inconclusive.
Page 87
73
4.0 Discussion
4.1 Final Seedling Emergence
4.1.1 Native Species
Results of the ex situ seedling emergence trial demonstrate fire suppressants do have a
significant impact on seed of native species of the swan Coastal Plain. Final seedling
emergence for all nine native species were significantly affected by at least one fire
suppressant (p<0.05). Nine fire suppressants tested on nine native species results in a
matrix of 81 tests. Within this matrix 37 tests (46%) returned a significant difference to
final seedling emergence of the control treatment (similar to Luna et al. 2007). Thirty-
four of these tests (92%) returned a decrease and three (8%) returned an increase to final
seedling emergence. As such, the overall effect of the suppressants on native species
seedling emergence is negative. Hypothesis (i) that fire suppressants reduce native
species seedling emergence is therefore supported. This finding is in general agreement
with the findings of past published germination trials (Kennedy 2002, Cruz et al. 2005,
and Luna et al. 2007).
The impact of fire suppressants on native seedling emergence varied by species, as was
also found in germination trials by Kennedy 2002 (one foam, one retardant), Cruz et al.
2005 (one retardant), and Luna et al. 2007 (one retardant). However, amongst the nine
species trialled there was no clear pattern to indicate which species were more likely to
be affected. Melaleuca thymoides was most impacted, with emergence significantly
reduced by eight of the nine tested suppressants. Conostylis aculeata emergence was
significantly reduced by seven of the nine suppressants while Allocasuarina humilis
emergence was significantly reduced by six suppressants. Anigozanthos manglesii was
significantly affected by five of the nine suppressants; Silv-Ex, Virtual, and Phos-Chek
reduced emergence, while Hydrex and ClearETI actually improved emergence for this
species. Conversely, some species were more resistant to the range of suppressants
trialled. Acacia pulchella and Rhagodia baccata were resistant, with emergence of both
species significantly reduced by only one of the nine suppressants. Gompholobium
tomentosum emergence was significantly reduced by two of the suppressants. It appears
an insufficient range of species (from a range of families, genera, growth form, seed
Page 88
74
size, and seed type) were trialled to predict fire suppressant impacts on seedling
emergence for species not included within the study.
The impact of fire suppressants on native species was also product-specific. Certain
suppressants significantly affected seedling emergence for a greater range of species
than other fire suppressants (Table 5). Silv-Ex foam significantly reduced emergence
for seven of the nine species, Virtual foam and Phos-Chek retardant significantly
reduced emergence for six of the species. At the other end of the scale, Barricade gel
and Chemguard foam significantly reduced emergence for only two of the nine species.
While Ansul3% and Jet-X foams significantly reduced emergence for three of nine
species. While far from being a complete assessment, the ranking of fire suppressants in
Table 5 may be a useful indicator of which suppressants are likely to have a greater
impact on seedling emergence and thus overall recruitment within plant communities.
With nine fire suppressants, this is the first study to offer such a comparison on
germination/emergence impacts beyond two suppressant products simultaneously.
Barricade gel’s reduction of emergence for Melaleuca thymoides was a noteworthy
exception within the trial. The reduction appeared to be due to the gel’s physical impact
on newly emerged seedlings rather than a chemical suppression of emergence.
Melaleuca thymoides seeds were ‘gentle germinators’ with cotyledons that emerged
slowly and laterally rather than upward. As such they were unable to push through the
film of Barricade gel on the sand’s surface. The gel appeared to act as a physical barrier
preventing air reaching the cotyledons resulting in seedlings rotting and permitting
fungal growth. No similar occurrence of a physical barrier to seedling emergence by a
fire suppressant has been published within the literature. And of note, with the
Table 5: Ranking of fire suppressants by their impact on native species seedling
emergence within the ex situ trial.
Rank Suppressant Total Species Sig. Affected
Species with -‘ve Sig.
Emergence
Species with +’ve Sig.
Emergence 1 Silv-Ex 7 7 0
2.5 Virtual 6 6 0 2.5 Phos-Chek 6 6 0 4 Hydrex-AR 5 3 2
5.5 Jet-X 3 3 0 5.5 Ansul3% 3 3 0 7 ClearETI 3 2 1 8 Chemguard 2 2 0 9 Barricade 2 2 0
Page 89
75
exception of Barricade gel on Melaleuca thymoides, all other species treated by all
suppressants survived with no observational loss in vigour or health compared to
control treatments.
As fire suppressants differ in composition (chapter 1), the observed product-specific
effect on seedling emergence supports the idea that certain compounds or nutrients are
responsible (as postulated by Cruz et al. 2005). A post-trial statistical assessment
revealed a significant correlation between the number of species with reduced
emergence for each suppressant with S concentration (Spearman’s rho = 0.855,
p=0.003) and with Na concentration (Spearman’s rho = 0.684, p=0.042). Note that
Barricade gel’s physical (as opposed to nutrient/chemical) reduction in Melaleuca
thymoides emergence was excluded. NH4+, NO3
-, B, Ca, Cl, Cu, Fe, Mg, Mn, P, K, S,
Zn, electrical conductivity, or pH were not significantly correlated with the number of
species with reduced emergence for each suppressant (p≥0.05). None of the previous
published studies testing the effect of suppressants on seed germination were able to
identify specific nutrients or compounds responsible for reduced seed
germination/emergence. It is recommended that further experimental trials be conducted
to confirm the role of S and Na in fire suppressants as the cause of reduced seed
germination/emergence. Fire suppressants high in S and/or Na may need to be avoided
in order to preserve natural recruitment from seeds in plant communities.
4.1.2 Weed Species
Results for the ex situ weed species seedling emergence demonstrate that weeds are
affected by the application of fire suppressants, in contradiction of hypothesis (ii).
However, final seedling emergence for the four trialled weed species did differ to native
species. Ten fire suppressants tested upon seed of four weed species results in a matrix
of 40 tests. Within this matrix 17 tests (43%) returned a significant difference to final
seedling emergence of the control treatment, similar to the 46% of significant tests
found within the native species trial. However, within the weed test matrix, nine of
these tests (53%) returned a decrease and eight tests (47%) returned an increase to final
seedling emergence. This contrasts to the native species trial where 92% of tests
returned a reduction in emergence and 8% returned an increase to emergence. Therefore
the concern that weedy species may be favoured over native species (Luna et al. 2007,
Page 90
76
Larson & Newton 1996) is plausible; increasingly so considering that native species
emergence is simultaneously decreased.
A closer inspection reveals that fire suppressant effects on weed species emergence
were strongly species-specific. Seedling emergence for two of the four weed species
trialled was resistant to the entire range of ten fire suppressants. Pelargonium capitatum
emergence was unaffected by any of the suppressants. Gladiolus caryophyllaceus
emergence was significantly reduced by only two of the ten suppressants (Hydrex-AR
foam and Phos-Chek retardant), but even so, the reduction compared to the control was
minor (12% and 21%, respectively).
In contrast, Ehrharta calycina seedling emergence was sensitive to fire suppressants;
seven of the 10 suppressants had a significant effect. Six suppressants reduced
emergence and three completely inhibited emergence. However, ClearETI gel greatly
increased emergence by 113%, probably due to the gel’s continuous provision of
additional water. Again, in contrast (and worryingly), seedling emergence of Asparagus
asparagoides was strongly promoted by the range of fire suppressants. Eight of the ten
suppressants significantly increased seedling emergence. Clearly, at least in respect to
these four weed species, the potential for enhanced weed species recruitment due to fire
suppressants exists.
4.2 Emergence Inhibition Patterns
4.2.1 Native Species
Overall, fire suppressants demonstrated two main effects upon the rate of seedling
emergence (emergence curves) for the selected native species. The first effect was a
temporal delay in the initial emergence of seedlings. The delay in initial emergence was
typically of one monitoring period of two weeks. Importantly, in most cases where
initial seedling emergence was delayed, the number of seedlings emerging in that initial
period was also severely reduced compared to the control treatment. A similar initial
delay in germination due to fire suppressant was reported by Kennedy (2002) who
suggested elevated nutrient levels may have suppressed germination. The second effect
upon emergence curves was the appearance of a secondary emergence event several
Page 91
77
weeks after initial seedling emergence. This usually occurred only where numbers of
initial emergents were reduced by a suppressant: a period of little (or no) seedling
emergence would occur, followed by a significant increase in the rate of seedling
emergence. This phenomenon gave emergence curves a sigmoidal appearance compared
to the control treatment’s logarithmic curve of rapid and decaying initial emergence.
Suppressant-induced inhibition of germination explains the observed delay in initial
seedling emergence. It appears seeds are waiting for fire suppressant chemicals to decay
and/or leach from the soil media before permitting germinating/emerging. As such,
hypothesis (iii) fire suppressants inhibit seed germination and thus delay initial seedling
emergence is supported (though not fully confirmed as germination was not directly
assessed). When the delay in initial emergence ends, only a small number of seeds
emerge, suggesting that levels of suppressant in the soil have decreased to a point
tolerable only for a small number of seeds to germinate. Suppressant inhibition of
germination further explains the secondary emergence event triggered after an initial
delay and reduction in seedling emergence. Most seeds (discounting those few that
emerged initially) appear to remain dormant until fire suppressant chemicals decay
and/or leach from the soil media down to a certain critical point (for that species) where
germination is possible for a large proportion of seed.
While suppressant inhibition of germination can explain initial delay in emergence and
the secondary emergence events, it does not explain the significant reduction in final
seedling emergence found for many species. A certain proportion of germinable seed
(as indicated by the control treatment for each species) are not germinating/emerging
even once fire suppressant have decayed and/or leached from soil media. This appears
to coincide with Luna et al.’s (2007) demonstration that a single retardant (Fire Trol
934) can significantly reduce seed viability.
4.2.2 Weed Species
Evidence for germination inhibition by fire suppressants was also found for the four
species within the weed species emergence trial. However, where such inhibition
existed the severity was less than for the native species and in many cases recoverable,
suggesting that weedy species may be less vulnerable to loss of seed viability due to fire
Page 92
78
suppressant chemicals. For Pelargonium capitatum some minor signs inhibition were
observable within the first two weeks of the trial. Though initial emergence was reduced
by Silv-Ex, Phos-Chek, Virtual and Fire-Ade suppressants, emergence accelerated
between weeks two and four, negating any difference to the control treatment. A similar
but slight effect was observed for Gladiolus caryophyllaceus seeds treated with Phos-
Chek retardant. Again, slight germination inhibition was observed for Asparagus
asparagoides seedling emergence treated with Fire-Ade and Hydrex foams and for
Phos-Chek retardant. However, surprisingly for this species, once suppressant inhibition
passed, the final emergence under Fire-Ade foam was significantly higher than the
control treatment. This suggests an overcoming of suppressant inhibition and a breaking
of addition seed dormancy in the Asparagus asparagoides by these three fire
suppressants.
4.3 In Situ Seedling Emergence
In situ seedling emergence was considerably reduced compared to the ex situ trials,
probably due to a multitude of uncontrolled factors which may include rainfall,
temperature, light, seed predation, allelopathy, seedling competition, and resource
competition. Due to the reduced seedling emergence, conclusions drawn from the in situ
trials should be considered exploratory rather than definitive. However, since no field
trials investigating the effect of fire suppressant on sown seeds have been published, the
results are still of importance.
The first point to note is that seedling emergence was reduced within the without-fire
trial compared to the with-fire trial. A total of 1.2% of the seeds within control plots at
the without-fire trial produced seedlings, compared to 12.6% at the with-fire trial.
Though site differences may account for part of the disparity in seedling emergence, the
fire would be expected to provide conditions more suitable for seedling recruitment
(ash-bed effect, reduced competition, dormancy breaking). Thus impacts of fire
suppressants within burnt vegetation are more likely to affect floral community
composition and perhaps biodiversity. As such, the impact of fire suppressants on
seedling emergence following fire appears to be of primary concern.
Page 93
79
4.3.1 With-Fire Emergence
Of the eight species that produced sufficient seedlings for statistical analysis within the
with-fire field trial, seven species had their emergence reduced by at least one of the
three trialled suppressants (Silv-Ex foam, ClearETI gel, and Phos-Chek retardant). This
confirms the ex situ trial’s findings that fire suppressants do significantly impact on
native species’ seedling emergence. As such hypothesis (iv) that ex situ effects of fire
suppressants on seedling emergence is indicative of in situ effects on seedling
recruitment is generally supported.
As with in situ trials (discussed above), the effect of fire suppressants were species-
specific and product specific. Phos-Chek retardant, similar to the ex situ emergence
trial, significantly reduced emergence for a wide range of species – seven of the eight
species analysed. ClearETI gel was also prominent, significantly reducing emergence
for five of the eight species analysed. In strong contrast to ex situ results, Silv-Ex foam
reduced emergence for only one species within the in situ trial (Conostylis aculeata); an
indication that some ex situ trial results may not always be analogous to field
conditions. As in the ex situ trial, Conostylis aculeata demonstrated a species-specific
sensitivity, with emergence significantly reduced by all three tested suppressants.
4.3.2 Without-Fire Emergence
With much less seedling emergence compared to the with-fire trial, limited conclusions
can be made for the affect of fire suppressants on recruitment within unburnt vegetation.
However, it can be observed from the results that fire suppressants had a reduced impact
on seedling emergence within unburnt vegetation: Of the six species analysed only
Banksia grandis seedling emergence was reduced, and by only two of the nine
suppressants (Jet-X foam and Phos-Chek retardant). Contrastingly, Acacia pulchella
seedling emergence was significantly enhanced by four suppressants (Hydrex, Virtual,
Barricade, and ClearETI), and Gompholobium tomentosum emergence was significantly
enhanced by ClearETI gel. Emergence for the three remaining species analysed
(Banksia menziesii, Bossiaea eriocarpa, and Melaleuca thymoides) was not
significantly affected. This long-unburnt community appears more resistant and/or
Page 94
80
resilient to disturbance from fire suppressants compared to a recently burnt community,
thus lessening fire suppressant impacts on seedling emergence.
Combining the findings, that a) less seedling emergence occurs within unburnt
vegetation, and b) fire suppressants had little negative effects on seedling emergence, it
appears the impact of fire suppressants on seedling recruitment is minimal within
unburnt vegetation. This conclusion does not, however, preclude the possibility that fire
suppressants have a pronounced effect on existing unburnt vegetation.
4.4 Recommendations
As no fire suppressant emergence trials have previously been published, several
possible improvements to trials conducted within this study were identified. The
greatest recommendation is the simultaneous conduction of both with-fire and with-out
fire treatments at each field site for each fire suppressant tested. This expansion to
methods would enable conclusive comparison between seedling recruitment in burnt
and unburnt communities. However, it must be noted that the logistics of such a trial are
challenging due to the temporal and spatial unpredictability of prescribed burning;
retaining close spatial proximity between burnt and unburnt treatments to preserve
treatment homogeneity is of importance.
Seedling emergence results found that fire suppressant effects were species-specific,
varying amongst the species trialled. As such, further emergence trials are
recommended to assess the potential effects of fire suppressants on seedling recruitment
for a wider range of species. This is of particular importance in regard to invasive weed
species not included within this research.
While native species where trialled within both the ex situ and in situ emergence trials,
the four weed species were included only within ex situ trials. This was a conscious
decision made to avoid further introduction of invasive species into field site. However,
future inclusion of weed species within in situ emergence trials would be a useful
exercise to validate ex situ results for weed species.
Page 95
81
While fire suppressant-induced inhibition of seed germination was decisively confirmed
within the research trials, results also indicate the possibility of reduced seed viability
due to suppressants. Only one published study (Luna et al. 2007) has investigated seed
viability and for only one fire suppressant (Fire Trol 934 retardant). Further experiments
to confirm a reduction in seed viability for a range of suppressants and species are
needed. Additionally, the strong correlation identified between suppression of seedling
emergence and the S and Na content of fire suppressants requires further investigation.
Petri dish germination trials applying varying concentrations of S, Na, and other
prominent nutrients found within fire suppressant are also recommended.
4.5 Conclusion
In summary, the ex situ trials clearly demonstrate a potential for fire suppressants to
negatively impact on seedling emergence for native species of the Swan Coastal Plain.
Fire suppressant-induced germination inhibition appears to play an important role in the
reduction of seedling emergence. Correlation of reduced seedling emergence with
nutrient content of fire suppressants suggests S and Na may be responsible for the
inhibition. Additionally, ex situ trials for four weedy species indicate that weed invasion
may be enhanced by fire suppressants; an effect that would be enhanced where native
species recruitment is simultaneously suppressed due to fire suppressants.
Interestingly, in situ trials indicate that fire suppressants are unlikely to have much
impact on seedling recruitment in unburnt vegetation. However, results from the with-
fire trial confirm ex situ findings that suppressants used on burning or burnt vegetation
(as is commonly done during mop-up activities) are likely to negatively impact on
seedling recruitment for multiple native species.
Page 96
82
5.0 References
Angeler DG, Rodriguez M, Silvia M, Moreno JM (2004) Assessment of application-rate
dependent effects of a long-term fire retardant chemical (Fire Trol 934) on
Typha domingensis germination. Environmental International 30, 375-381.
Bell DT (1999) TURNER REVIEW No. 1 The process of germination in Australian
species. Australian Journal of Botany 47, 475-517.
Bell DT, King LA, Plummer JA (1999) Ecophysiological effects of light quality and
nitrate on seed germination in species from Western Australia. Australian
Journal of Ecology 24, 2-10.
Bolland M (1998) Soils of the Swan Coastal Plain. Department of Agriculture,
Government of Western Australia.
Chambers DP, Attiwill PM (1994) The ash-bed effect in Eucalyptus regnans forest:
chemical, physical and microbiological changes in soil after heating or partial
sterilisation. Australian Journal of Botany 42, 739-749.
Couto-Vazquez A, Gonzalez-Prieto SJ (2006) Short- and medium-term effects of three
fire fighting chemicals on the properties of a burnt soil. Science of the Total
Environment 371(3), 353-361.
Cruz A, Serrano M, Navarro E, Luna B, Moreno JM (2005) Effect of a long-term fire
retardant (Fire Trol 934) on the germination of nine mediterranean-type shrub
species. Environmental Toxicology 20, 543-548.
Garcia-Marco S, Gonzalez-Prieto S (2008) Short- and medium-term effects of fire and
fire-fighting chemicals on soil micronutrient availability. Science of the Total
Environment 407(1), 297-303.
Giba Z, Grubisic D, Konjevic R (2003) Nitrogen oxides as environmental sensors for
seeds. Seed Science Research 13, 187-196.
Henig-Server N, Eshel A, Ne’eman G (1996) pH ad osmotic potential of pine ash as
post-fire germination inhibitors. Physiologia Plantarum 96, 71-76.
Kennedy AB (2002) The short term effects of a fire fighting foam and fire retardant on
selected flora from Australia’s southwest. BS Hons Thesis, Edith Cowan
University.
Larson DL, Newton WE (1996) Effects of fire retardant chemicals and fire suppressant
foam on North Dakota prairie vegetation. Proceedings of the North Dakota
Academy of Science 50, 137-144.
Page 97
83
Luna B, Moreno JM, Cruz A, Fernandez-Gonzalez F (2007) Effects of long-term fire
retardant chemical (Fire-Trol 934) on seed viability and germination of plants
growing in a burned Mediterranean area. International Journal of Wildland Fire
16, 349-359.
Merritt DJ, Turner SR, Clarke S, Dixon KW (2007) Seed dormancy and germination
stimulation syndromes for Australian temperate species. Australian Journal of
Botany 55, 336-344.
Milberg P, Lamont BB (1995) Fire enhances weed invasion of roadside vegetation in
Southwestern Australia. Biological Conservation 73, 45-49.
Perez-Fernandez MA, Rodriguez-Echeverria (2003) Effect of smoke, charred wood, and
nitrogenous compounds on seed germination of ten species from woodland in
central-western Spain. Journal of Chemical Ecology 29(1), 237-251.
Rao VS (2000) ‘Persistence and behaviour of herbicides in soil and environment’ in
Principles of Weed Science (Second Edition), Science Publishers Inc, Enfield
(NH) USA.
Sweedman L, Merritt D (eds.) (2006) Australian Seeds: a guide to their collection,
identification and biology. CSIRO Publishing, Collingwood VIC Australia.
Whelan RJ (1995) The Ecology of Fire. Cambridge University Press, New York NY.
Page 99
85
CHAPTER 3
Assessment of fire suppressant impact on plant survival and biomass
1.0 Introduction
The direct physical impacts to flora due to suppressants are investigated within four
published studies, all conducted within Australia. Bradstock et al. (1987) and Bell et al.
(2005) detail the effects of field applications of retardant. Bradstock et al. (1987),
Kennedy (2002), and Hartskeerl et al. (2004) conducted ex situ trials on the growth of
selected species due to a retardant, a foam, and both a retardant and a foam
(respectively). Somewhat related
Both field trials (Bradstock et al. 1987, Bell et al 2005) found varied responses to an
application of retardant, with shoot and whole plant death for key species recorded. Bell
et al. found species composition was retained nine months after application. Bradstock
et al. noted that recovery of the overstorey occurred rapidly while understorey species
took longer, with no obvious taxonomic or life-form trends in susceptibility. Since these
studies were performed in New South Wales and Victoria, and responses were species-
specific, additional trials involving species of the Swan Coastal Plain could provide
information valuable to local management and conservation.
Ex situ studies investigating the impact of fire suppressants on flora are mixed in their
results. This appears to be due to each study trialling different suppressant products on
different species, making comparisons difficult. It is therefore necessary that further
experimental trials be conducted and expanded to involve multiple suppressants and
species. Bradstock et al. (1987) found that retardant defoliated all plants for all three
species, with only one species surviving by producing new leaves. Hartskeerl et al.
(2004) found that Amguard DSB Type R Mop-Up retardant resulted in species-specific
increases and decreases to visual health and/or growth attributes. In contrast, Kennedy
(2002) found that the same Angus ForExpan S foam did significantly affect seedlings
for six of seven species native to the Swan Coastal Plain; visual health and/or growth
attributes were decreased for selected species but increased for others.
Page 100
86
The positive effects of fire suppressants on some species indicate a suppressant
‘fertiliser effect’ (Kennedy 2002). This supports findings of Larson and Duncan (1982)
who found a diammonium phosphate retardant doubled the biomass of both burnt and
unburnt annual grassland in the first year. However, all ex situ studies overviewed
above only considered visual health or growth attributes (shoot length, number of
leaves/stems, internode length, et al.). Such assessment may or may not accurately
detect changes in plant biomass, which may be a better way to assess suppressant
impacts (as advocated by Bell et al. 2005).
A fertiliser effect may be of concern if it benefits weed species over native species. The
impact of fire suppressants on weed species is very limited within the literature. A field
trial by Bell et al. (2005) found that Phos-Chek D75-R retardant significantly enhanced
weed invasion, particularly at higher concentrations. Larson and Newton (1996) found
Phos-Chek G75-F greatly increased biomass of the weed Poa pratensis L. in a mixed-
grass prairie, while Silv-Ex foam appeared to have no effect. No accounts of ex situ
trials involving weeds have been published exploring or confirming effects of fire
suppressant on weed species survival and growth. Since fire has been found to increase
weed invasion of roadside vegetation (Milberg & Lamont 1995), where fire
suppressants are often used, inclusion of weed species into suppressant trials is of
importance.
Nutrient addition studies may provide some insight into the effects of fire suppressants
containing appreciable nutrient loads. Most notable among literature is the reaction of
Australian native plants due to P addition, with loads comparable to that of fire
retardants. Thomson & Leishman (2004) found ex-situ plant mortality to be species-
specific, ranging from 0 to 100% for 26 Hawkesbury Sandstone species. Specht (1963)
and Heddle and Specht (1975) both found P fertiliser addition to a heath community
resulted in almost 100% mortality of native seedlings. Conner & Wilson (1968)
documented biomass increases, species composition changes, and weed invasion due to
fertilizer addition to a coastal heath community.
Overall, the literature is either contradictory on the impact of suppressants on plant
survival and growth, or is indicative of species-specific impacts. In either case, further
investigation, especially within a biodiversity region such as the Swan Coastal Plain, is
needed. Also, biomass assessment of fire suppressant impacts on plants is lacking, and
Page 101
87
may better indicate ecological impacts than growth attribute measurements.
Additionally, since recruitment of some weed species may be enhanced over natives due
to fire suppressants (chapter 2), it is of importance to determine if existing weed plants
receiving suppressants are further promoted over native species.
For a range of ten suppressant products and a selection of species common to the Swan
Coastal Plain the following hypotheses were tested: (i) fire suppressants cause death of
seedlings, (ii) seedling growth and biomass are affected by fire suppressants, and (iii)
fire suppressants do not significantly impact on weedy species.
Page 102
88
2.0 Methods
2.1 Seed Selection and Preparation
2.1.1 Native Species
To test the effect of fire suppressants on native plant species, nine native framework
species representative of families common to Banksia woodland of the Swan Coastal
Plain were selected; Acacia pulchella R.Br., Allocasuarina humilis (Otto & F.Dietr.)
L.A.S.Johnson, Anigozanthos manglesii D.Don, Banksia menziesii R.Br,, Conostylis
aculeata R.Br., Eucalyptus marginata Sm., Gompholobium tomentosum Labill.,
Melaleuca thymoides Labill., and Rhagodia baccata (Labill.) Moq.. All seeds were
purchased from Seeds West Inc. and sourced from the vicinity of Wanneroo.
Some seed species were pretreated to overcome seed dormancy. Anigozanthos
manglesii seeds were oven heated at 100 oC for 3 hours (as per Sweedman & Merritt
2006). Fruit material of Rhagodia baccata was removed from seeds using pectinase
prior being washed in deionised water, air dried. Seeds were then soaked in a mixture
smoke water (1:10 v/v) and gibberellic acid (1000 ppm GA(3)) (as per D Merritt 2006
pers. comm.). Seed of the remaining seven species did not require pretreatment. To
maximise potential seedling emergence only mature and intact seeds, determined by
visual and tactile inspection, were selected for the trial.
2.1.2 Weed Species
To test the effect of fire suppressants on non-native species four introduced species
common to disturbed areas of Banksia woodland of the Swan Coastal Plain were
selected; Asparagus asparagoides (L.) Druce (bridal creeper), Gladiolus
caryophyllaceus (Burm.f.) Poir. (wild gladiolus), Ehrharta calycina Sm. (perennial
veldt grass), and Pelargonium capitatum (L.) L’Her. (rose pelargonium). These species
were selected due to their widespread distribution, their invasive nature within Banksia
woodland, and subject to seed availability. All weed seed was collected from Bold Park
in 2003 and 2004. Seeds of weed species did not require seed treatment to alleviate
Page 103
89
dormancy. To maximise potential seedling emergence only full and intact seeds,
determined by visual and tactile inspection, were selected for the trial.
2.2 Propagation of Seedlings
All juvenile plants within each of the two trials were propagated at one time within an
accredited non-temperature controlled glasshouse (late autumn ~15-30 oC). Seeds were
sown into and grown within 40 mm forestry tubes filled with dry nursery-grade, fine,
washed river sand (Avon Sands & Minerals). To ensure at least one seedling developed
within each tube, multiple seeds were sown per tube with secondary seedlings carefully
removed as they emerged. Any abnormal or unhealthy plants were removed from the
trial. Sufficient seedlings were raised to provide for 16 replicated plants of each native
species and 15 of each weed species. Plants were watered as needed until all plants in a
trial developed a minimum of two first true leaves.
2.3 Fire Suppressant Treatments
Treatments consisted of a water control (no fire suppressant) and the ten fire
suppressants used throughout the research, applied at the product’s maximum directed
concentration (Appendix A). Suppressants were applied to forestry pots at a rate of 1.5
Lm-2, determined as the typical application rate used by trained personnel during field
trial test plots. Each treatment (except Clear ETI Fire Gel) was applied via 1 L pump
spray bottle to all replicate juvenile plants of each species at one time, to assist
consistent application across all species. Clear ETI Fire Gel was also applied at 1.5 Lm-2
but due to the nature of the gel’s swollen crystals could not pass through the nozzle of a
pump spray bottle. Instead, Clear ETI Fire Gel was applied evenly over pots by hand.
As explained within Appendix A, native plants treated with FireAde short-term foam
have been excluded from analysis due to a mixing rate error. The application rate of
FireAde was corrected for the weed seedling trial, and that data is included within the
statistical analysis.
Plants were not watered for 48 hours post suppressant application. Irrigation of all
plants then recommenced at a frequency and quantity suiting control treatment plants.
Page 104
90
Mist irrigation was used to enable the gradual removal of fire suppressants from foliage
and sand substrate through leaching, rather than shower irrigation which would remove
a majority of the suppressant during initial watering.
2.4 Monitoring Methods
Native and weed seedling trials were monitored for a total of eight weeks, when
inspection of data revealed no further change in the impact of the fire suppressants on
juvenile plants. Each individual juvenile plant was monitored prior to treatment and at
every two weeks following treatment. Leading shoot length was measured from the lip
of forestry tubes to exclude the problem of varying soil levels. Survival was recorded,
with observational notes recorded for plant condition.
2.5 Biomass Assessment
The effect of fire suppressants on biomass of five surviving plants (mortality
permitting) was assessed by a destructive plant harvest 12 weeks after suppressant
application. Harvested juvenile plants were dried in an oven at 80 oC for 48 hours
before being stored individually in air-tight bags. Each plant was then divided into root
and shoot components and weighed to obtain total dry weight biomass data and dry
weight root-shoot ratio data.
2.6 Statistical Analysis
2.6.1 Survival
The impact of fire suppressants on native and weed survival was analysed by Binomial
Logistic Regression (SPSS 11.5). Each species was analysed independently. Surviving
seedlings under each fire suppressant treatment were compared against a control
treatment by using dummy variables as covariates. For many species under multiple
suppressant treatments either all plants survived or all plants died, resulting in quasi-
separation of the data due to the existence of zero-values within the binary-treatment
Page 105
91
crosstabs. Quasi-separation of the data was overcome by manually applying a Firth
correction (penalized likelihood correction) as per Zorn (2005) and Heinze and
Schemper (2003).
General exploration of data suggested suppressants with high loads of particular
nutrients had a greater influence on seedling survival. To further test this trend, the
number of species with significantly reduced seedling survival was tallied for each fire
suppressant. A Spearman’s rho correlation (SPSS 11.5) was then performed to identify
any significant (p<0.05) relationship between concentration of nutrients (NO3-, NH4
+, B,
Ca, Cl, Cu, Fe, K, Mg, Mn, Na, P, S, and Zn) within fire suppressant nutrients and
reduced seedling survival.
2.6.2 Leading Shoot Length and Biomass
Non-parametric statistics (SPSS 11.5) were used to determine the effect of fire
suppressants on plant biomass and leading shoot length; data was non-normally
distributed and possessed heterogeneous variances and skew amongst treatments.
Kruskal-Wallis tests (one way analysis of variance by ranks) were utilised to ensure
leading shoot length did not vary amongst treatment groups (p≥0.05) prior to fire
suppressant application. Kruskall-Wallis tests were utilised at the conclusion of the trial
to determine if fire suppressant treatments had an impact on leading shoot length, total
biomass, root biomass, shoot biomass, and root-shoot ratios. Separate analyses were
conducted for each species. Where a Kruskal-Wallis (KW) test returned a significant
difference (p<0.05) amongst suppressant treatments, planned pairwise comparisons
were performed using Mann-Whitney U tests. Planned comparisons were conducted
only between fire suppressant treatments and the control treatment. No planned
comparisons between individual fire suppressant products were performed.
Page 106
92
3.0 Results
3.1 Seedling Survival
The matrix of nine fire suppressants tested on nine native species (Figure 1) and 10
suppressants tested on four weed species (Figure 2) provide a total of 121 statistical
tests (Appendix E). Of these tests, 31 (25.6%) resulted in a significant decrease in
seedling survival. Phos-Chek significantly reduced seedling survival for 11 of 13
species. While Virtual, Jet-X, Silv-Ex significantly reduced survival for eight, six, and
five species, respectively. Where a significant reduction in seedling survival occurred,
the reduction was considerable; 96% of cases reduced survival to ≤ 50%, and 65% of
cases reduced survival to ≤ 25% (Table 1).
Ranking of fire suppressants reveals certain suppressants reduced the survival of
multiple native and weed seedlings, while other suppressants had no significant impact
(Table 2). Since the fire suppressants differ (largely unknowingly) in chemical
composition, this observed product-specific effect on seedling survival may indicate
that certain compounds or nutrients are responsible. A strong significant correlation was
found between the number of species with reduced survival and S concentration within
each suppressant (Spearman’s rho=0.870 p=0.002) (Figure 3(a)). A similar moderately-
strong correlation was found between reduced survival and P concentration (rho = 0.688
p=0.041) (Figure 3(b)). NH4+, NO3
-, B, Ca, Cl, Cu, Fe, Mg, Mn, Na, K, Zn, electrical
conductivity, or pH were not significantly correlated with the number of species with
reduced survival for each suppressant (p≥0.05).
Of interest, tuberal sprouting of Asparagus asparagoides was widespread, occurring
variably amongst all treatments except for ClearETI gel and the control. Within Phos-
Chek, Chemguard, Virtual, FireAde, and Silv-Ex treatments 87%, 53%, 47%, 40%, and
40% of seedlings (respectively) were initially defoliated but subsequently resprouted
from tubers. For Hydrex, Barricade, and Ansul3% treatments 73%, 73%, and 67% of
seedlings (respectively) sprouted additional stems from tubers without first experiencing
defoliation.
Page 107
93
Acacia pulchella
*
0
20
40
60
80
100
120
Con
trol
Che
mgu
ard
Hyd
rex-
AR
Jet-X
Silv
-Ex
ANSU
L3%
Virtu
al
Phos
-Che
k
Barr
icad
e
Cle
arET
I
Surv
ival
%
Acacia pulchella
tsr#tststststsrtr
0.0
0.2
0.4
0.6
0.8
1.0
1.2
1.4
Con
trol
Che
mgu
ard
Hyd
rex-
AR
Jet-X
Silv
-Ex
ANSU
L3%
Virtu
al
Phos
-Che
k
Barr
icad
e
Cle
arET
I
Dry
Bio
mas
s (g
ram
s)
Root Shoot
Allocasuarina humilis
*
0
20
40
60
80
100
120
Con
trol
Che
mgu
ard
Hyd
rex-
AR
Jet-X
Silv
-Ex
ANSU
L3%
Virtu
al
Phos
-Che
k
Barr
icad
e
Cle
arET
I
Surv
ival
%
Allocasuarina humilis
tsrtsr
tsr
0.0
0.1
0.2
0.3
0.4
0.5
Con
trol
Che
mgu
ard
Hyd
rex-
AR
Jet-X
Silv
-Ex
ANSU
L3%
Virtu
al
Phos
-Che
k
Barr
icad
e
Cle
arET
I
Dry
Bio
mas
s (g
ram
s)
Root Shoot
Anigozanthos manglesii
*
*
*
0
20
40
60
80
100
120
Con
trol
Che
mgu
ard
Hyd
rex-
AR
Jet-X
Silv
-Ex
ANSU
L3%
Virtu
al
Phos
-Che
k
Barr
icad
e
Cle
arET
I
Surv
ival
%
Anigozanthos manglesii
tr# s #
tsr
ss
0.0
0.1
0.2
0.3
0.4
0.5
0.6
Con
trol
Che
mgu
ard
Hyd
rex-
AR
Jet-X
Silv
-Ex
ANSU
L3%
Virtu
al
Phos
-Che
k
Barr
icad
e
Cle
arET
I
Dry
Bio
mas
s (g
ram
s)
Root Shoot
Figure 1: Effects of fire suppressants on survival and biomass of native seedlings. Significant difference
(p<0.05) in survival compared to the control denoted by *. Significant difference (p<0.05) in total
biomass, shoot biomass, root biomass, and root:shoot ratio compared to the control denoted by t, s, r, #,
respectively. Error bars represent standard error.
Page 108
94
Banksia menziesii
*
0
20
40
60
80
100
120
Con
trol
Che
mgu
ard
Hyd
rex-
AR
Jet-X
Silv
-Ex
ANSU
L3%
Virtu
al
Phos
-Che
k
Barr
icad
e
Cle
arET
I
Surv
ival
%Banksia menziesii
0.0
0.5
1.0
1.5
2.0
2.5
3.0
3.5
4.0
4.5
Con
trol
Che
mgu
ard
Hyd
rex-
AR
Jet-X
Silv
-Ex
ANSU
L3%
Virtu
al
Phos
-Che
k
Barr
icad
e
Cle
arET
I
Dry
Bio
mas
s (g
ram
s)
Root Shoot
Conostylis aculeata
*
*
**
0
20
40
60
80
100
120
Con
trol
Che
mgu
ard
Hyd
rex-
AR
Jet-X
Silv
-Ex
ANSU
L3%
Virtu
al
Phos
-Che
k
Barr
icad
e
Cle
arET
I
Surv
ival
%
Conostylis aculeata
ts
s
0.0
0.1
0.2
1.6
1.7
Con
trol
Che
mgu
ard
Hyd
rex-
AR
Jet-X
Silv
-Ex
ANSU
L3%
Virtu
al
Phos
-Che
k
Barr
icad
e
Cle
arET
I
Dry
Bio
mas
s (g
ram
s)Root Shoot
Eucalyptus marginata
*
*
0
20
40
60
80
100
120
Con
trol
Che
mgu
ard
Hyd
rex-
AR
Jet-X
Silv
-Ex
ANSU
L3%
Virtu
al
Phos
-Che
k
Barr
icad
e
Cle
arET
I
Surv
ival
%
Eucalyptus marginata
tr
s
tsr tsr
s
tsr
s
r
0.0
0.2
0.4
0.6
0.8
1.0
1.2
Con
trol
Che
mgu
ard
Hyd
rex-
AR
Jet-X
Silv
-Ex
ANSU
L3%
Virtu
al
Phos
-Che
k
Barr
icad
e
Cle
arET
I
Dry
Bio
mas
s (g
ram
s)
Root Shoot
Figure 1 (continued): Effects of fire suppressants on survival and biomass of native seedlings. Significant
difference (p<0.05) in survival compared to the control denoted by *. Significant difference (p<0.05) in
total biomass, shoot biomass, root biomass, and root:shoot ratio compared to the control denoted by t, s,
r, #, respectively. Error bars represent standard error.
Page 109
95
Gompholobium tomentosum
***
0
20
40
60
80
100
120
Con
trol
Che
mgu
ard
Hyd
rex-
AR
Jet-X
Silv
-Ex
ANSU
L3%
Virtu
al
Phos
-Che
k
Barr
icad
e
Cle
arET
I
Surv
ival
%
Gompholobium tomentosum
tr# r
r
tr
0.0
0.1
0.2
0.3
0.4
Con
trol
Che
mgu
ard
Hyd
rex-
AR
Jet-X
Silv
-Ex
ANSU
L3%
Virtu
al
Phos
-Che
k
Barr
icad
e
Cle
arET
I
Dry
Bio
mas
s (g
ram
s)
Root Shoot
Melaleuca thymoides
**
*
*
*
0
20
40
60
80
100
120
Con
trol
Che
mgu
ard
Hyd
rex-
AR
Jet-X
Silv
-Ex
ANSU
L3%
Virtu
al
Phos
-Che
k
Barr
icad
e
Cle
arET
I
Surv
ival
%
Melaleuca thymoides
t
0.00
0.02
0.04
0.06
0.08
0.10
0.12
0.14
0.16
0.18
Con
trol
Che
mgu
ard
Hyd
rex-
AR
Jet-X
Silv
-Ex
ANSU
L3%
Virtu
al
Phos
-Che
k
Barr
icad
e
Cle
arET
I
Dry
Bio
mas
s (g
ram
s)
Root Shoot
Rhagodia baccata
**
*
0
20
40
60
80
100
120
Con
trol
Che
mgu
ard
Hyd
rex-
AR
Jet-X
Silv
-Ex
ANSU
L3%
Virtu
al
Phos
-Che
k
Barr
icad
e
Cle
arET
I
Surv
ival
%
Rhagodia baccata1.201.10
1.000.90
0.80
0.700.09
0.060.03
0.00
Con
trol
Che
mgu
ard
Hyd
rex-
AR
Jet-X
Silv
-Ex
ANSU
L3%
Virtu
al
Phos
-Che
k
Barr
icad
e
Cle
arET
I
Dry
Bio
mas
s (g
ram
s)
Root Shoot
Figure 1 (continued): Effects of fire suppressants on survival and biomass of native seedlings. Significant
difference (p<0.05) in survival compared to the control denoted by *. Significant difference (p<0.05) in
total biomass, shoot biomass, root biomass, and root:shoot ratio compared to the control denoted by t, s,
r, #, respectively. Error bars represent standard error.
Page 110
96
Asparagus asparagoides
***
0
20
40
60
80
100
120
Con
trol
Che
mgu
ard
Hyd
rex-
AR
Jet-X
Fire
Ade
Silv
-Ex
ANSU
L3%
Virtu
al
Phos
-Che
k
Barr
icad
e
Cle
arET
I
Surv
ival
%Asparagus asparagoides
r#
tsr
tr
tsrtsrtsr
ts
ts
0.00
0.01
0.02
0.03
0.04
0.05
0.06
0.07
0.08
0.09
Con
trol
Che
mgu
ard
Hyd
rex-
AR
Jet-X
Fire
Ade
Silv
-Ex
ANSU
L3%
Virtu
al
Phos
-Che
k
Barr
icad
e
Cle
arET
I
Dry
Bio
mas
s (g
ram
s)
Root Shoot
Ehrharta calycina
*
0
20
40
60
80
100
120
Con
trol
Che
mgu
ard
Hyd
rex-
AR
Jet-X
Fire
Ade
Silv
-Ex
ANSU
L3%
Virtu
al
Phos
-Che
k
Barr
icad
e
Cle
arET
I
Surv
ival
%
Ehrharta calycinatsr
ts
#
tsr
#
tsr
0.00
0.05
0.10
0.15
0.20
0.25
0.30
Con
trol
Che
mgu
ard
Hyd
rex-
AR
Jet-X
Fire
Ade
Silv
-Ex
ANSU
L3%
Virtu
al
Phos
-Che
k
Barr
icad
e
Cle
arET
I
Dry
Bio
mas
s (g
ram
s)Root Shoot
Gladiolus caryophyllaceus
**
**
0
20
40
60
80
100
120
Con
trol
Che
mgu
ard
Hyd
rex-
AR
Jet-X
Fire
Ade
Silv
-Ex
ANSU
L3%
Virtu
al
Phos
-Che
k
Barr
icad
e
Cle
arET
I
Surv
ival
%
Gladiolus caryophyllaceus
tr#tr#
0.00
0.01
0.02
Con
trol
Che
mgu
ard
Hyd
rex-
AR
Jet-X
Fire
Ade
Silv
-Ex
ANSU
L3%
Virtu
al
Phos
-Che
k
Barr
icad
e
Cle
arET
I
Dry
Bio
mas
s (g
ram
s)
Root Shoot
Figure 2: Effects of fire suppressants on survival and biomass of weed seedlings. Significant difference
(p<0.05) in survival compared to the control denoted by *. Significant difference (p<0.05) in total
biomass, shoot biomass, root biomass, and root:shoot ratio compared to the control denoted by t, s, r, #,
respectively. Error bars represent standard error.
Page 111
97
Pelargonium capitatum
0
20
40
60
80
100
120
Con
trol
Che
mgu
ard
Hyd
rex-
AR
Jet-X
Fire
Ade
Silv
-Ex
ANSU
L3%
Virtu
al
Phos
-Che
k
Barr
icad
e
Cle
arET
I
Surv
ival
%
Pelargonium capitatum
tsr
tsr
tstsr
0.0
0.1
0.2
0.3
0.4
0.5
0.6
0.7
Con
trol
Che
mgu
ard
Hyd
rex-
AR
Jet-X
Fire
Ade
Silv
-Ex
ANSU
L3%
Virtu
al
Phos
-Che
k
Barr
icad
e
Cle
arET
I
Dry
Bio
mas
s (g
ram
s)
Root Shoot
Figure 2 (continued): Effects of fire suppressants on survival and biomass of weed seedlings. Significant
difference (p<0.05) in survival compared to the control denoted by *. Significant difference (p<0.05) in
total biomass, shoot biomass, root biomass, and root:shoot ratio compared to the control denoted by t, s,
r, #, respectively. Error bars represent standard error.
Table 1: Severity ranges for cases of significantly decreased seedling survival compared to control
treatment seedling survival (native and weed species within ex situ trials).
Significant Survival Reduction Survival Range # of Cases % of Cases Survival = 0% 4 17.39%
0% < Survival ≤ 25% 11 47.83% 25% < Survival ≤ 50% 7 30.43% 50% < Survival ≤ 75% 1 4.35%
Survival = 100% 0 0.00%
Table 2: Ranking of fire suppressants by their impact on survival decline of native and weed seedlings
within an ex situ trial.
Rank Suppressant Total Species Sig. Affected
Native Species Sig.
Affected
Weed Species Sig.
Affected 1 Phos-Chek 11 9 2 2 Virtual 8 6 2 3 Jet-X 6 4 2 4 Silv-Ex 5 4 1 5 Chemguard 1 1 0
7.5 Hydrex-AR 0 0 0 7.5 ANSUL3% 0 0 0 7.5 Barricade 0 0 0 7.5 ClearETI 0 0 0
Page 112
98
0%
10%
20%
30%
40%
50%
60%
70%
80%
90%
100%
0.01 0.1 1 10 100 1000 10000 100000Log (S Concentration (mg/L))
Seed
ling
Surv
ival
0%
10%
20%
30%
40%
50%
60%
70%
80%
90%
100%
0.01 0.1 1 10 100 1000 10000Log (P Concentration (mg/L))
Seed
ling
Surv
ival
Control Chemguard Hydrex Jet-X FireAde Silv-Ex
Ansul3% Virtual Phos-Chek Barricade ClearETI
Figure 3: Correlative relationship between the mean survival of 13 species (nine natives and four weeds)
with the P (a) and S (b) content of fire suppressants. Error bars represent standard error of seedling
survival.
a
b
Page 113
99
3.2 Leading Shoot Length
Leading shoot length proved a poor indicator of change in seedling growth compared to
biomass. Fire suppressants often acted as defoliants, with the result that large-leafed
species tended to have leading shoot length significantly reduced more readily than
small-leafed species. As such, leading shoot length was deemed a supporting measure to
aid interpretation of changes to plant biomass. Where leading shoot length was
significantly increased by a fire suppressant, significant increases to biomass often
occurred. For completeness, statistical analysis output for leading shoot length is
presented in Appendix F.
3.3 Biomass
Biomass measurements were significantly affected for seven of nine native species
(Figure 1) and all four weed species (Figure 2) by at least one fire suppressant
(Appendix G). Only Banksia menziesii and Rhagodia baccata seedling biomass were
statistically unaffected by suppressants. Significant changes in total biomass best
described impacts of suppressants on seedling growth; root and shoot biomass changes
are supportive to interpretation. Overall, increases in total biomass were restricted to
four fire suppressants while biomass decreases were spread amongst seven of nine
suppressants (Table 3). An overlap occurred within Hydrex and Ansul3% with both
increasing the biomass of four species and decreasing biomass of two species.
Table 3: Summary of significant changes to total biomass, expressed as the number of species affected
per fire suppressant treatment. Green cells indicate increased total biomass, red cells indicate decreased
total biomass.
Rank Suppressant Type
Total Species Sig.
Affected
Species with Sig.
Increase
Species with Sig.
Decrease 1.5 Barricade Gel 3 4 0 1.5 Phos-Chek Retardant 3 3 0 3.5 ANSUL3% Foam 6 4 2 3.5 Hydrex-AR Foam 6 4 2 5 ClearETI Gel 2 0 2
6.5 Jet-X Foam 3 0 3 6.5 Virtual Foam 3 0 3 8.5 Chemguard Foam 4 0 4 8.5 Silv-Ex Foam 4 0 4
Page 114
100
Increases to total biomass were species specific but also concurrently suppressant-
specific. Thirteen of 15 significant increases occurred within four species;
Allocasuarina humilis, Asparagus asparagoides, Ehrharta calycina, and Pelargonium
capitatum (the three latter being weeds). Further, all 15 significant increases occurred
within four suppressant treatments; Barricade, Phos-Chek, Ansul3%, and Hydrex.
Large increases in biomass (four-fold to 60-fold) were recorded for nine of 13 species
within the Phos-Chek treatment. However, the majority of these biomass increases were
not statistically significant due to high variance caused by low numbers of replicate
plants (a result of high seedling mortality caused by the retardant). Biomass increases
due to Phos-Chek retardant were only significant for Anigozanthos manglesii and
Ehrharta calycina, where seedling survival was greater than 20%.
Decreases to total biomass were primarily species-specific, with 15 of 20 decreases
occurring within three species; Acacia pulchella, Eucalyptus marginata, and Asparagus
asparagoides. No decrease in total biomass was experienced by Allocasuarina humilis,
Banksia menziesii, Conostylis aculeata, Rhagodia baccata and the weeds Ehrharta
calycina, and Pelargonium capitatum.
Page 115
101
4.0 Discussion
4.1 Survival
Seedling survival for multiple species was found to decrease due to the application of
many of the fire suppressants; as such hypothesis (i) that fire suppressants cause the
death of seedlings, is supported. Importantly, where a significant reduction in seedling
survival occurred, the reduction was rarely trivial. The majority (95%) of significant
cases reduced survival to ≤ 50% of the control treatment, with 65% of significant cases
reducing survival to ≤ 25%. This indicates that where fire suppressants reduce seedling
survival, there is potential for alteration of community composition.
Overall, it was found that fire suppressant impact on seedling survival was both
product-specific and species-specific. This explains the mixed, and often contradictory,
results of past research (Bradstock et al. 1987, Kennedy 2002, Hartskeerl et al. 2004,
Bell et al. 2005). Nevertheless, the correlation of seedling death with S and P content
within fire suppressant well explains the product-specific results observed. In fact, the
correlation with S content partially supports results from a glasshouse trial by Bradstock
et al. (1987) which isolated ammonium sulphate in the DAP fire retardant as the sole
compound responsible for leaf death for four species of seedlings. However, since NH4+
in this research’s trial was not significantly correlated with seedling death, it is possible
that the S component of the ammonium sulphate in Bradstock et al.’s 1987 trial was
responsible for defoliation, rather than NH4+ itself. The significant correlation of P
concentrations within fire suppressants with seedling death is new within the literature,
but matches well with the findings of past P addition trials of Thomson & Leishman
(2004), Specht (1963), and Heddle & Specht (1975). Until more is known fire
suppressants high in S and/or P may need to be avoided in order to preserve seedlings
and natural recruitment in plant communities.
The species-specific component of reduced seedling survival found within the results is
problematic for the use of fire suppressants. It appears that without experimentally
trialling the impact of fire suppressants on every species it will be difficult to foresee
which species will or will not be reduced in population. Testing every species would be
impractical and costly. However, testing the impact of suppressants on rare and
threatened flora may be of value to conservation efforts. Fire suppressant use policy
Page 116
102
could be implemented to protect known populations of threatened flora. Experimental in
situ trials would also be of value in determining if these ex situ findings are applicable
in the field.
4.2 Biomass
Two trends were observable from the trials; 1) decreases in biomass are primarily
species-specific, and 2) increases in biomass are concurrently species-specific and
product-specific. As such, with species-specific and product-specific changes in
biomass, hypothesis (ii) that seedling growth is affected by suppressants is strongly
supported. Unfortunately, it is difficult to compare these findings to previous research
as only one study (Kennedy 2002) reported fire suppressant nutrient content when
investigated plant growth (P and N for two suppressants only). Kennedy found a mix of
species-specific growth responses to a foam low in P and N and a retardant high in P
and N, with an inconsistent trend for the retardant to increase growth variables.
Notably, all significant increases to total biomass concurrently occurred within four fire
suppressants (Hydrex, Ansul3%, Phos-Chek, and Barricade) and primarily within four
species (Allocasuarina humilis, Asparagus asparagoides, Ehrharta calycina, and
Pelargonium capitatum). For three of these products (Hydrex, Ansul3%, and
Barricade), macronutrient K is the common nutrient with P being near absent (<0.09
mg/kg). Phos-Chek differs from these three products in that it contains little K, but is
extremely rich in many other macronutrients; P, NH4+, Ca, S. From this, it appears that
elevated macronutrient content of suppressants is a good predictor for a fertiliser effect
in some species. Further, that three of the four species are introduced weeds of the Swan
Coastal Plain indicates that the ability to rapidly utilise nutrients is a good predictor of
which species will experience increased growth due to fire suppressants.
Following the product-specific impacts to seedling survival, a similar effect on biomass
may have been expected. However, biomass decreases were quite evenly distributed
amongst multiple fire suppressant treatments, and were instead concentrated within
three species. This is surprising given that fire suppressant ingredients and nutrient
content profiles vary greatly (chapter 1 and Appendix A and B). Such a species-specific
impact to decreased biomass suggests a difficulty in predicting which species will be
Page 117
103
negatively impacted by fire suppressants. Further trials involving additional species may
need to be performed before a pattern in species-specific biomass decrease can be
detected.
ClearETI was a notable case amongst the biomass results. This gel contains little
available nutrient content and significantly reduced biomass (primarily root) for three
species (Acacia pulchella, Eucalyptus marginata, and Gompholobium tomentosum), and
had no impact on the remainder. ClearETI appears similar to water saving crystals (such
as Alcosorb) used within horticulture, designed to provide additional moisture to roots.
It is therefore possible that for some species the ClearETI gel crystal’s
additional/continuous provision of water; a) permitted a reduced root network to obtain
sufficient water, and/or b) over-provided water resulting in rotting of roots.
4.3 Promotion of Weed Species
This research is the first to investigate the impact of fire suppressants on weed species.
The proportion of significant tests for fire suppressant impacts on survival and biomass
of weeds was roughly equal to that experienced by the trialled native species. As such,
the hypothesis (iii) that fire suppressants do not significantly impact on weedy species is
rejected. However, differences in the pattern of response to fire suppressants were found
for the four weed species trialled.
Reduction in survival of weeds was typically less severe than was found for native
species, and biomass of weeds tended to be unaffected or increase. This is pronounced
for E. calycina and P. capitatum where little mortality occurred, and biomass was
increased by multiple fire suppressants. Of particular concern is the fertiliser effect
experienced by three of the four weed species to the same three fire suppressants
(Hydrex, Ansul3%, and Phos-Chek), all of which possess the highest nutrient content
loads. This could be interpreted as a clear indication of weedy species’ ability to
efficiently utilise available nutrients provided by fire suppressants. Conversely, the
observed sensitivity of native species (compared to the weed species) to high nutrient
loads in fire suppressants may be due to adaptation to low nutrient soils of the Swan
Coastal Plain. For communities with richer soils the disparity between native and weed
species may not be as apparent. Regardless, the widespread stimulation of tuberal
Page 118
104
sprouting (with or without initial defoliation), for A. asparagoides does highlight the
potential for some weed species to persist and/or thrive under application of fire
suppressants.
An interesting comparison is the tree species E. marginata and the herbaceous climber
weed A. asparagoides which share the same profile of decreased biomass for the same
four foams (Chemguard, Jet-X, Silv-Ex, and Virtual). However, A. asparagoides
biomass was increased by two other foams, Hydrex and Ansul3% both containing
comparably higher nutrient loads of Cl, K, Mg, and Zn, while E. marginata biomass
was not increased. This disparity illustrates how a weed species may have a competitive
edge over a native species due to a better ability to utilise nutrients within fire
suppressants.
Considering the above points, past concerns that weedy species may be favoured over
native species by fire suppressants (Luna et al. 2007, Larson & Newton 1996) are
supported. Even where fire suppressants have no effect on weed species, weeds may
benefit due to the simultaneous negative impacts experience by native plants. Of
additionally concern; since fire alone can promote weeds along roads and firebreaks
(Milberg & Lamont 1995) (where suppressants are often used) fire suppressants may
further promote weeds over native species.
4.4 Recommendations
It is recommended that research be expanded to include more suppressant products and
species, particularly rare flora, to facilitate greater accuracy in predicting fire
suppressant impacts on individual species and vegetation associations. For the four
species tested the response of weed species appears to vary. As such, it would be
valuable to conservation to expand research to other invasive weed species of the Swan
Coastal Plain (and elsewhere).
Fundamentally it appears that sulphur, and to a lesser extent phosphorus, within fire
suppressants play a key role in the impacts to both native and weed species survival.
Future trials to validate this finding are recommended. Such trials could also seek to
determine S and P thresholds for plant survival that could be used as a regulatory guide
Page 119
105
for maximum S and P content within fire suppressants. Until such research is
performed, it may be prudent for managers to reduce nutrient addition by limiting fire
suppressant application or by selecting now nutrient fire suppressants.
This study was the first to utilise biomass measurements to measure fire suppressant
impacts on growth of individual plants. Biomass proved to be an effective method of
assessment, and as such is recommended for future trials within this field.
As a final recommendation, it is acknowledged that this chapter investigates ex situ
impacts of fire suppressants on seedlings only. In situ trials would be invaluable in
determining how applicable this chapter’s findings are within plant communities.
4.5 Conclusion
In summary this chapter has found that fire suppressants can cause death and altered
growth of both native and weed seedlings of the Swan Coastal Plain. Where reduced
seedling survival occurred for native species, the scale of reduction was severe, with the
potential to alter community composition. The product-specific and species-specific
nature of suppressant effects on seedlings makes predicting impacts on plant
communities difficult until further investigation is undertaken. A clear finding is the
potential for particular weed species to be favoured over native species, especially in
disturbed habitat where fire suppression activities often occur.
A correlation between seedling mortality and fire suppressant S and P content was
identified. Additionally, elevated macronutrient content of suppressants was found to be
a good indicator for increased biomass of seedlings that survived suppressant
application. Fire suppressants containing reduced or no additional nutrient content may
therefore be preferred to control fires (especially within low soil nutrient communities),
where use of water only is not ideal.
Initially it may appear that the identified suppressant impacts on seedlings (or mature
plants) are of reduced relevance to suppression activities, in comparison to the impacts
of fire. However, since fire suppressants are used on unburnt vegetation to form
firebreaks, and not all vegetation is burnt during low intensity fires (i.e. spring burns, or
Page 120
106
fuel reduction burns), it is possible for plants not killed by fire to receive application of
suppressant. Additionally, fire is a natural ecosystem process while addition of
chemicals and nutrients within suppressants is not; any change due to suppressants may
therefore be of concern to conservation.
Page 121
107
5.0 References
Bradstock R, Sanders J, Tegart A (1987) Short-term effects on the foliage of a eucalypt
forest after an aerial application of a chemical fire retardant. Australian Forestry
50(2), 71-80.
Bell T, Tolhurst K, Wouters M (2005) Effects of the fire retardant Phos-Chek on
vegetation in eastern Australian heathlands. International Journal of Wildland
Fire 14, 199-211.
Conner DJ, Wilson GL (1967) Response of a coastal Queensland heath community to
fertilizer application. Australian Journal of Botany 16, 117-123.
Kennedy AB (2002) The short term effects of a fire fighting foam and fire retardant on
selected flora from Australia’s southwest. BS Hons Thesis, Edith Cowan
University.
Hartskeerl K, Simmons D, Adams R (2004) Does firefighting foam affect the growth of
some Australian native plants? International Journal of Wildland Fire 13, 335-
341.
Heddle E, Specht R (1975) Dark Island heath (Ninety-mile Plain, South Australia) VII
The effect of fertilizers on composition and growth. Australian Journal of
Botany 22, 151-164.
Heinze, G. and Schemper, M. (2003). A solution to the Problem of Separation in
Logistic Regression, Statistics in Medicine 21(16), 2409-2419.
Larson JR, Duncan DA (1982) Annual grassland response to fire retardant and wildfire.
Journal of Range Management 35, 700-703.
Larson DL, Newton WE (1996) Effects of fire retardant chemicals and fire suppressant
foam on North Dakota prairie vegetation. Proceedings of the North Dakota
Academy of Science 50, 137-144.
Luna B, Moreno JM, Cruz A, Fernandez-Gonzalez F (2007) Effects of long-term fire
retardant chemical (Fire-Trol 934) on seed viability and germination of plants
growing in a burned Mediterranean area. International Journal of Wildland Fire
16, 349-359.
Milberg P, Lamont BB (1995) Fire enhances weed invasion of roadside vegetation in
Southwestern Australia. Biological Conservation 73, 45-49.
Munsell Color Company (1968). Munsell color charts for plant tissues (2nd edition),
Munsell Color Company, Baltimore MD.
Page 122
108
Specht R (1963) Dark Island heath – the effects of fertilizers on composition and
growth, 1950-1960. Australian Journal of Botany 11, 67-94.
Sweedman L., Merritt D (eds.) (2006) Australian Seeds: a guide to their collection,
identification and biology. CSIRO Publishing, Collingwood VIC Australia.
Thomson VP, Leishman MR (2004) Survival of native plants of Hawkesbury Sandstone
communities with additional nutrients: effect of plant age and habitat. Australian
Journal of Botany 52, 141-147.
Zorn C. (2005). A solution to separation in binary response models. Political Analysis
13(2), 157-170.
Page 125
111
CHAPTER 4
Assessment of fire suppressant impacts on two field communities
1.0 Introduction
Fire suppressants have been found to alter soil nutrient content (chapter 1, Hopmans &
Bickford 2003, Couto-Vazquez & Gonzalez-Prieto 2006), reduce emergence from seeds
(chapter 2, Kennedy 2002, Cruz et al. 2005, Luna et al. 2007), and reduce survival and
growth of seedling (chapter 3, Bradstock et al. 1987, Kennedy 2002, and Hartskeerl et
al. 2004). It follows that such changes individually, or in combination, may alter floral
community composition. The majority of studies that investigate impacts of fire
suppressants focus on single aspects of ecology, and generally conclude with a
discussion on possible potential ecological impacts. Only one study has assessed fire
suppressant impact on floral biodiversity, and few studies have assessed the impacts on
floral species richness, or even plant densities of individual species.
Previous studies focus almost exclusively on long-term retardants with short-term
foams poorly investigated and gels not investigated at all. The most detailed study
(Larson et al. 1999) investigated the effects of Silv-Ex foam and Phos-Chek G75F
retardant on in situ growth, flowering, and community characteristics of shrub steppe
vegetation of northern Nevada. Shannon’s H’ index of biodiversity were not changed by
either fire suppressant for the 13 weeks trial duration. Neither the foam nor retardant
had a significant effect on plant growth, resprouting, or flowering. However, species
richness was initially reduced by Phos-Chek retardant, recovering before the trial’s
completion. Silv-Ex foam significantly reduced number of stems per m2 at one field
site, persisting beyond the trial’s duration.
Some additional studies further support the possibility that suppressants can alter floral
species composition and subsequently may affect floral biodiversity. Both Bradstock et
al. (1987) and Bell et al. (2005) found application of retardant in Australian plant
communities caused shoot damage and whole plant death. In addition, Bell et al. (2005)
found that while Phos-Chek D75R retardant caused no change to native species
richness, but did increased weed invasion. Larson and Duncan (1982) found a
diammonium phosphate retardant doubled the biomass of both burnt and unburnt
Page 126
112
Californian annual grassland in the first year. While they concluded changes in species
composition were due to weather, their data table clearly shows that, compared to
control treatments, retardant reduced the combined biomass of Trifolium spp. and
Lupinus bicolor (Lindl.) from 8% in unburned and 4% in burned treatments, to 0%
indicating a loss of those species. Related, fertilizer addition studies (Conner & Wilson
1968, Heddle & Specht 1975, Specht et al. 1977, Thomson & Leishman 2004,
Leishman & Thomson 2005) have variously reported biomass increase, seedling
mortality, species composition changes, and weed promotion due to fertilizer addition to
coastal heathland.
Overall, no Australian trials have specifically investigated impacts of fire suppressants
on floral biodiversity and one trial has investigating the impact to floral species
richness. And since Australian studies were performed in New South Wales and
Victoria, trials conducted within the Swan Coastal Plain of Western Australia could
provide information valuable to local fire and conservation management. Additionally,
weed invasion due to fire suppressant application requires further investigation,
particularly since fire itself is already known to increase weed invasion along roads and
firebreaks (Milberg & Lamont 1995), where fire suppressants are often applied. For
nine fire suppressants at an unburnt site and three suppressants at a burnt site, the
following hypotheses were tested within Banksia woodland: (i) fire suppressants alter
biodiversity of flora communities of the Swan Coastal Plain, (ii) populations of native
flora species are altered by fire suppressants, and (iii) weed species populations are
promoted by fire suppressants.
Page 127
113
2.0 Methods
2.1 Field Site Details
Two field sites were used to observe the effects of fire suppressants on Banksia
woodland communities. The first site at Whiteman Park trialled the effects of
suppressants within unburnt vegetation. The second field site at Wanneroo trialled
suppressant effects directly following a prescribed fire.
2.1.1 Whiteman Park
A mature Banksia woodland community in good condition was identified at Whiteman
Park (Cullacabardee block) (-31.804370, 115.897195, GDA94) to trial the effects of fire
suppressants. The community consisted of open Banksia menziesii R.Br. woodland over
a shrubland of Xanthorrhoea preissii Endl., Hibbertia hypericoides (DC) Benth., and
Eremaea pauciflora Endl. over mixed herbs/grasses. This site had not been burnt within
the previous ~20 years and thus enabled investigation of fire suppressants on flora and
community composition without the confounding factor of recent fire. The soil of
Cullacabardee is within the Bassendean Sand soil association, containing little silt or
clay, very low levels of nutrient elements, and with any nutrient element content
associated with organic matter (Bolland 1998).
2.1.2 Wanneroo
A mixed Banksia/Jarrah/Marri woodland community within the City of Wanneroo was
sourced for use as a “with-fire” community trial (-31.748487, 115.805705, GDA94).
The community consisted of a Banksia menziesii, Eucalyptus marginata Sm., and
Corymbia calophylla (Lindl.) K.D.Hill & L.A.S.Johnson overstorey above a shrubland
of Xanthorrhoea preissii Endl., Hibbertia hypericoides, and Petrophile macrostachya
R.Br. over mixed herbs/grasses. Soil at the Wanneroo site is classed as pale grey
Karrakatta sand (Bolland 1998), limited in nutrient elements but not to the extent of
Bassendean Sand at the Whiteman Park field site. The site was selected as it was
scheduled for a fuel reduction burn that coincided with the research schedule.
Page 128
114
Unfortunately, short notice of the fire’s date and exact location (weather and logistics
dependant) and the fire’s behaviour on the day, resulted in an inability to collect pre-fire
soil data. Analysis of soil nutrient data at the with-fire trial is therefore limited to the
direct impacts of fire suppressants themselves and cannot consider suppressant/fire
interactions.
2.2 Fire Suppressant Treatments
2.2.1 Whiteman Park
Treatments consisted of all ten fire suppressants (Appendix A), a wet control (water
only), and a dry control (no water or suppressant). Experimental plots were installed
along one side of a fire access track, where suppressants would typically be used by
ground units during fire fighting operations. Three replicate sets of plots were installed,
each replicate set placed within relatively homogeneous vegetation. Treatments were
sequentially assigned to plots prior to establishment to ensure even spatial dispersal of
replicate plots throughout the study area. Plots measured 7 m wide and 10 m deep from
the access track, with buffers of 3 m. Suppressant treatments were applied at Whiteman
Park on the 5th and 6th of April 2006 (autumn).
2.2.2 Wanneroo
Prior to analysis, observational assessment of the Whiteman Park without-fire treatment
plots revealed minimal differences in impact on vegetation within the three suppressant
types (foam, gel, retardant). Therefore, only three representative suppressants (in
addition to dry and wet controls) were applied at Wanneroo. Reducing suppressant
treatments at this field site also enabled plant community monitoring to be completed
within a short time; deemed necessary to reduce plant growth disparity given rapid
regrowth after fire. To represent a range of suppressant types, one short-term foam
(Silv-Ex), one gel product (ClearETI), and the long term retardant (Phos-Chek) were
selected for the trial. Silv-Ex was chosen as the short-term foam due to its current
widespread use. ClearETI was selected to represent gel suppressants (Barricade was the
preferred gel product but was excluded as the concentrate had separated during storage
Page 129
115
and could not be adequately mixed on site). Phos-Chek retardant was selected due to its
high nutrient content and relatively high impact observed amongst other trials within
this research (see previous chapters).
The Wanneroo site was burned on the 28th of May 2008 for fuel reduction purposes and
in preparation for the trial. The burn was conducted jointly by FESA (Fire &
Emergency Services Authority) and the City of Wanneroo personnel. Three replicates
plots of each treatment were installed within the centre of the burn area, away from fire
breaks and tracks to avoid areas where suppressants were used to control the prescribed
fire. As at the Whiteman site, treatments were sequentially assigned to plots prior to
their establishment to ensure even spatial dispersal of replicate plots throughout the
study area. Plots measured 7 m wide and 10 m deep, with buffers of 3 m. Suppressant
treatments were applied at Wanneroo in autumn on the 29th and 30th of May 2008 (the
two days following the fire).
2.4 Fire Suppressant Application
2.4.1 Equipment
Four-wheel-drive light tanker vehicles were used to mix and apply fire suppressants to
trial plots at both the Whiteman Park and Wanneroo field sites. Light tankers typically
possessed a water tank (up to 550 L), 9 hp auxiliary motor, hose, and nozzle with fog to
straight stream capability (similar to Figure 1).
Figure 1: Example of a light tanker vehicle, similar to those used to apply fire suppressants to both field
sites. Photo by Nachoman-au; http://commons.wikimedia.org/wiki/User:Nachoman-au.
Page 130
116
Flow rate from the hose nozzle varied amongst the multiple suppressant treatments due
to differences in suppressant viscosity and changes in the throttle of the pump’s motor.
To correct for this, the flow rate was re-calculated prior to each suppressant’s
application by recording the time taken to fill a 20 L bucket. The time required to apply
suppressant to plots was then calculated accordingly to ensure a consistent application
rate of 1.5 Lm-2 to all plots of all suppressant treatments.
2.4.2 Preparation
Mixing rates of each fire suppressant were obtained from manufacturer’s directions, and
are summarised in Appendix A. Sufficient suppressant to allow all three replicate plots
to be applied at one time was prepared by adding suppressant concentrate into the
prefilled water tank on the light tanker vehicle. The fire suppressant mix was then
circulated through the hose and back into the top of the tank to ensure the suppressant
was thoroughly mixed. Barricade gel, Clear ETI Fire Gel, and Phos-Chek retardant
required additional manual mixing using a shovel handle to ensure concentrate clots
were removed from tank baffles and properly dissolved. Potable water obtained from
the mains water network (via hydrants) was used at all times to prepare all fire
suppressants. Between applications of each suppressant product the fire unit’s tank and
hose were thoroughly cleaned using potable mains water.
2.4.3 Application
Suppressant treatments were applied at Whiteman Park on the 5th and 6th of April 2006,
and at Wanneroo on the 29th and 30th of May 2008 (the two days following the fire).
Suppressants were applied at a rate of 1.5 Lm-2 to each 7 m x 10 m plot (thus 105 L per
plot) matching the application rate used by trained personnel in previous test plots.
Suppressants were applied evenly with additional emphasis upon fire hazard features
such as tree trunks and dense vegetation. This method simulates how suppressants are
used a) during direct attack on flames, b) to create a suppressant fire-break in unburned
vegetation, and c) to target smouldering fuel during mop-up activities.
Page 131
117
2.4 Monitoring Methods
Vegetation monitoring within each 7 m x 10 m plot was conducted by installing two
permanent 5 m x 1 m strip plots, as per the method of Rokich et al. (2004). Strip plots
were positioned toward the centre of the larger plot to avoid edge effects, but also
positioned to best represent the vegetation of the surrounding area. A minimum of 1 m
was retained between each strip plot and from the edge of the larger plot. To assist the
monitoring a 5 m x 1 m grid constructed of dowelling was overlaid on the strip plot to
divide the strip into five 1 m quadrats.
Data were recorded for every individual plant within each 1 x 1 m replicate quadrat.
Variables recorded were; species, % projected cover, leading shoot length, condition
(index of 0 to 5, dead to thriving), and reproductive status. Plants originating outside the
strip plot but extending into quadrats were recorded, however, % projected cover was
recorded only for the portion of the plant within the quadrat. In the case of non clump
forming clonal species (e.g. Alexgeorgea nitens, Desmocladus flexuosa), all plant matter
within a quadrat was treated as one plant, with the % projected cover of the entire
quadrat recorded. Additional notes were made to indicate special circumstances (e.g.
grazed, damaged). Total numbers of dicotyledon seedling emergents at the Wanneroo
with-fire site were tallied as a class due to profusion of species and abundance post-fire,
and difficulty of identification prior to leaf development. Due to the large number of
total plants surveyed (~135,000), no plants were tagged for individual monitoring,
although tracking changes in individual plants throughout the trial was possible for the
larger and less numerous species. To retain consistency, accuracy, and precision, the
one same person was responsible for measuring all data during all monitoring periods.
2.5 Statistical Analysis
2.5.1 Biodiversity Assessment
Biodiversity assessment was utilised to assist the interpretation of the ecological
impacts of fire suppressants on the two plant communities. Shannon’s index was used to
calculate and track changes in floral biodiversity over time for each experimental
treatment at each field site. Species with abundances too low to permit statistical
Page 132
118
analysis amongst treatments were excluded from biodiversity assessment in order to
remove statistical noise that masked important plant community changes. Resulting
Shannon index values were interpreted in conjunction with total plant numbers per
treatment and analysis of each plant species (section 2.5.2).
2.5.2 Species Populations
SPSS 11.5 was used to conduct all statistical analysis. An array of Kruskal-Wallis tests
(one-way analysis of variance by ranks) was utilised to determine if fire suppressant
treatment had an impact on plant abundance and growth variables (abundance, projected
cover, leading shoot length, condition, reproductive status). Separate analyses were
conducted for each species, with variables analysed separately for each monitoring
period. Where a Kruskal-Wallis (KW) test returned a significant difference (p<0.05)
amongst suppressant treatments, planned pairwise comparisons were performed using
Mann-Whitney U tests. Planned comparisons were conducted only between fire
suppressant treatments and the control treatments (both dry and wet controls). No
planned comparisons between individual fire suppressant products were performed.
Data from the two field sites were treated as individual trials and therefore analysed
independently, though using the same statistical methods. Parametric statistical analysis
was not possible due to non-normal data that resisted transformation techniques and
heterogeneous variances and skew amongst treatment groups.
For analysis purposes each 1 x 1 m quadrat were considered as a separate replicate.
Quadrats containing zero values (i.e. no plants recorded) were retained for the analysis
of plant abundance to preserve the true value of the number of plants per metre.
However, for the analysis of growth variables (projected cover, leading shoot length,
condition, and reproduction), absence of plants within a quadrat were recorded as a
missing value, as zero values would improperly skew data. As a result, the number of
replicates (n) varied amongst the experimental treatments for growth variable analyses.
Fortunately, the Kruskal-Wallis test proved robust to disproportionate Ns amongst
experimental treatments, returning a more conservative (and precautionary) p-value in
such cases. Treatments consistently containing n<5 for multiple monitoring periods
were excluded from the Kruskal-Wallis tests due to insufficient data.
Page 133
119
A complication arose where the mean value of variables differed considerably amongst
the experimental treatments at time zero. This was due to spatial variability of plant
populations within experimental field sites. In this situation for example, if experimental
treatments did not affect a species (i.e. variable means per treatment were constant,
though different, throughout the trial), the KW test would falsely return a significant
difference amongst treatments. Where possible this complication was resolved by
centring data at time zero, with the centring adjustment also applied to the data of
subsequent monitoring periods. This enabled direct comparison of the change in
variables amongst the experimental treatments at all time periods, using the zero-month
data as a reference point.
Page 134
120
3.0 Results
3.1 Biodiversity Assessment
3.1.1 Whiteman Park (Without-Fire)
With the exception of the dry control and barricade gel treatment, total floral
biodiversity increased at 4-months perhaps indicating that the addition of water to plots
stimulated floral biodiversity. At 12-months all treatments except Hydrex foam
decreased floral biodiversity as annual species senesced. However, the decline in floral
biodiversity at 12-months for Ansul3% and Virtual foams was considerably greater than
for other treatments (Figure 1(a)).
Removing exotic species from calculations reveals that native flora species biodiversity
(Figure 1(c)) and plant density (Figure 1(d)) are not altered by fire suppressants (with
the notable exception of Phos-Chek retardant). Therefore, by deduction, the variable
decrease in floral biodiversity at 12-months within many suppressant treatments is due
to weed species. Two weed species were responsible (Ehrharta calycina Sm. and
Hypochaeris glabra L.), with their proportions differing by treatment (Figure 2). Large
increases in weed species density were highly variable amongst replicate plots, resulting
in inconclusive significant differences compared to the dry and wet control treatments.
However, there is a clear trend for Virtual, Ansul3%, Silv-Ex, and Phos-Chek tended to
favour E. calycina (increases of 11.1-fold, 3.9-fold, 2.8-fold, and 2.5-fold compared to
the wet control, respectively). Phos-Chek and Barricade tended to favour H. glabra
(increases of 6.1-fold and 2.7-fold compared to the wet control, respectively). While
Chemguard, Hydrex, and Jet-X foams tended to suppress both weed species.
Notably, the decline in floral biodiversity and dramatic increase in plant density within
the Phos-Chek retardant treatment was almost exclusively due to mass recruitment of
native Gompholobium tomentosum Labill. at both 4-months and 12-months (Figure 3).
While these increases in density were not statistically significant (p>=0.05) due to high
variance amongst replicate plots, the scale of density increase is notable. At 4-months
density was 5.3-fold and 25.3-fold of the dry and wet control, respectively. At 12-
months density was 8.2-fold and 35.7-fold, respectively. Essentially, G. tomentosum
responded to the retardant in a similar manner as an invasive weed.
Page 135
121
(a) Biodiversity (all species)
0.0
0.5
1.0
1.5
2.0
2.5
3.0
0-Months 4-Months 12-Months
Shan
non
H' I
ndex
(b) Plant Density (all species)
0
50
100
150
200
250
0-Months 4-Months 12-Months
Plan
ts p
er m
2
(c) Biodiversity (native species)
0.0
0.5
1.0
1.5
2.0
2.5
0-Months 4-Months 12-Months
Shan
non
H' I
ndex
(d) Plant Density (native species)
0
10
20
30
40
50
60
0-Months 4-Months 12-Months
Plan
ts p
er m
2
Dry Control Wet Control Chemguard HydrexJet-X Silv-Ex Ansul3% VirtualPhos-Chek Barricade ClearETI
Figure 1: Change in floral biodiversity (Shannon H’ index) and plant density following application of fire
suppressants for all species (a & b) and native species (c & d) at the Whiteman Park field site.
3.1.2 Wanneroo (With-Fire)
Total floral biodiversity did not differ amongst treatments for the 12-month duration of
the field trial. Total floral biodiversity steadily increased within all treatments for the
first nine months following the fire and suppressant application (Figure 4(a)). At 12-
months total floral biodiversity within all treatments declined sharply, coinciding with
massive recruitment following autumn rains (Figure 4(b)). This indicates a few (or one)
species within each treatment disproportionately increasing in abundance.
Comparing total floral biodiversity for all species (Figure 4(a)) with the biodiversity
index for native species only (Figure 4(c)) and native species abundance (Figure 4(d))
Page 136
122
D
D
D
DWDWW
0
20
40
60
80
100
120
140
160
180D
ry C
ontro
l
Wet
Con
trol
Che
mgu
ard
Hyd
rex
Jet-X
Silv
-Ex
Ansu
l3%
Virtu
al
Phos
-Che
k
Barr
icad
e
Cle
arET
I
Plan
ts p
er m
2
Ehrharta calycina Hypochaeris glabra
Figure 2: Weed species responsible for reducing floral biodiversity at 12-months at the Whiteman
(without-fire) site, and their relative abundance within each treatment. Significant differences (p<0.05)
from dry and wet control treatments denoted by ‘D’ and ‘W’, respectively. Error bars represent standard
error, n=30.
0
10
20
30
40
50
60
70
0-Months 4-Months 12-Months
Plan
ts p
er m
2
Dry Control Wet Control Phos-Chek
Figure 3: Change in plant density of native species Gompholobium tomentosum due to application of
Phos-Chek retardant at the Whiteman (without fire) site. Error bars represent standard error, n=30.
Page 137
123
(a) Biodiversity (all species)
0.0
0.5
1.0
1.5
2.0
2.5
3.0
0-Months 3-Months 6-Months 9-Months 12-Months
Shan
non
H' I
ndex
(b) Plant Density (all species)
0
50
100
150
200
250
0-Months 3-Months 6-Months 9-Months 12-Months
Plan
ts p
er m
2
(c) Biodiversity (native species)
0.0
0.5
1.0
1.5
2.0
2.5
3.0
0-Months 3-Months 6-Months 9-Months 12-Months
Shan
non
H' I
ndex
(d) Plant Density (native species)
0
5
10
15
20
25
30
35
40
45
0-Months 3-Months 6-Months 9-Months 12-Months
Plan
ts p
er m
2
Dry Control Wet Control Silv-Ex ClearETI Phos-Chek
Figure 4: Change in floral biodiversity (Shannon H’index) and plant density following application of fire
and fire suppressants for all species (a & b) and native species (c & d) at the Wanneroo field site.
reveals two notable findings. Firstly, the decline in total floral biodiversity within all
treatments at 12-months was due to massive recruitment of weeds. Three weed species
were responsible (Cotula bipinnata Thunb., Ehrharta calycina, and Hypochaeris
glabra) though their proportions differed by treatment (Figure 5); ClearETI
significantly favoured E. calycina recruitment (2.0-fold increase versus the wet control,
p=0.025), while Phos-Chek greatly favoured E. calycina (5.7-fold increase versus the
wet control, p<0.001) but also decreased abundance of C. bipinnata (p=0.012).
Secondly, although biodiversity of native flora steadily increased for all treatments over
the entire trial, all three fire suppressants considerably suppressed native species
recruitment at 6-months compared to both the dry and wet control treatments (Figure
1(d)). This was almost exclusively due to reduced numbers of Lomandra preissii (Endl.)
Ewart and Gompholobium tomentosum (Figure 6).
Page 138
124
DWD
D
DW
DW
W
0
20
40
60
80
100
120
140
160
180
200
Dry Control Wet Control Silv-Ex ClearETI Phos-Chek
Plan
ts p
er m
2
Cotula bipinnata Ehrharta calycinaHypochaeris glabra
Figure 5: Weed species responsible for reduced floral biodiversity at 12-months at the Wanneroo (with-
fire) site, and their relative abundance within each treatment. Significant differences (p<0.05) from dry
and wet control treatments denoted by ‘D’ and ‘W’, respectively. Error bars represent standard error,
n=30.
D
D DWDW
DW
DW
0
2
4
6
8
10
12
14
16
18
Dry Control Wet Control Silv-Ex ClearETI Phos-Chek
Plan
ts p
er m
2
Lomandra preissii Gompholobium tomentosum
Figure 6: Native species responsible for reduced native plant density at the Wanneroo (with-fire) site,
and their relative abundances within each treatment. Significant differences (p<0.05) from dry and wet
control treatments denoted by ‘D’ and ‘W’, respectively. Error bars represent standard error, n=30.
Page 139
125
3.2 Population Assessment
Statistical output for effects of suppressants on abundance, individual plant cover,
leading shoot length, condition, and reproduction for all analysed species is presented in
Appendix H. Many of the detected significant differences were minor and/or temporary.
However, while some changes in plant population densities and growth were minor in
context to the community as a whole, they were notable in scale within a single species
context (i.e. large changes to low abundance species did not significantly affect floral
biodiversity or community plant density).
3.2.1 Whiteman Park (Without-Fire)
At the Whiteman without-fire trial, 14 of the 17 species analysed exhibited a significant
difference (p<0.05) on at least one variable for at least one monitoring period. The
notable significant changes in plant population density and growth are summarised in
Table 1. Trends are not clearly observable due to the low number of significant
differences detected.
The three species with no conclusive impact by fire suppressants (Calytrix flavescens
A.Cunn., Eremaea pauciflora (Endl.) Druce, and Leucopogon parviflorus (Andrews)
Lindl.) are all dicotyledonous perennial shrubs. It is possible that dicot perennials are
more resistant to fire suppressants given they are already established plants not reliant
on a single season of recruitment.
3.2.2 Wanneroo (With-Fire)
At the Wanneroo with-fire trial, 17 of the 21 species analysed exhibited a significant
difference (p<0.05) on at least one variable for at least one monitoring period. The
notable significant changes in plant population density and growth are summarised in
Table 2. Importantly, there is a general trend for native species’ densities to decrease
while weed species’ densities increase. Additionally, Phos-Chek exhibited a fertiliser
effect by increasing cover, leading shoot length, and condition of both native and weed
species.
Page 140
126
Table 1: Notable significant differences (p<0.05 versus both dry and wet control) in plant density and
growth variables to populations due to fire suppressants at the Whiteman without-fire field trial.
Lyginia barbata 4-Months Decreased cover, persistent to 12-months.*Hypochaeris glabra 4-Months Decreased density by 87.8%, persistent to 12-months.
Gompholobium tomentosum 4-Months Increased density by 2.69-fold vs wet control, 14.3-fold vs dry control.
*Gladiolus caryophyllaceus 4-Months Decreased density by 62.3%.
*Gladiolus caryophyllaceus 4-Months Decreased density by 54.1%
Gompholobium tomentosum 4-Months Increased density by 5.3-fold vs dry control, 25.3-fold vs wet control (not significant due to high variance).
12-Months Increased density by 8.2-fold vs dry control, 35.7-fold vs wet control (not significant due to high variance).
Lyginia barbata 12-Months Decreased density by 24.9%.12-Months Increased cover, decreased condition, decreased reproduction.
*Ehrharta calycina 4-Months Improved condition, persistent to 12-months.12-Months Increased density by 5.7-fold (not significant due to high variance).
*Gladiolus caryophyllaceus 4-Months Decreased density by 37.7%.*Hypochaeris glabra 4-Months Decreased density by 93.2%.
12-Months Increased density by 6.1-fold (not significant due to high variance).12-Months Increased cover and leading shoot length.
Silv-Ex Foam
Phos-Chek G75F
Virtual Foam
Jet-X Foam
Ansul3% Foam
Comparison of Table 1 and 2 demonstrates that the number and scale of significant
differences of the population data differ greatly between the two sites. Despite including
seven less suppressant treatments the Wanneroo with-fire trial returned a much larger
set of significant changes in plant population data.
The four species with no conclusive impact by fire suppressants were Bossiaea
eriocarpa Benth., Lepidosperma leptostachyum Benth., Lomandra hermaphrodita
(C.R.P.Andrews) C.A.Gardner, and Xanthorrhoea preissii Endl.. B. eriocarpa is a dicot
perennial shrub, while the three remaining species are monocot perennials.
3.2.2.1 Increased Recruitment from Seed
Seedling emergence occurred in abundance following the fire at the Wanneroo site.
However, a disparity in dicotyledon seedling recruitment was detected within the Phos-
Chek retardant treatment; dicot recruitment at 12-months far exceeded recruitment that
occurred soon after the fire (Figure 7(a)). Specifically, dicot emergents at 6-months
were reduced by 54% compared to the wet control treatment (though not significant,
p=0.134). At 12-months dicot emergents within Phos-Chek plots (512.5 per m2) was
vastly higher than both the dry control (8.2 per m2, 62.5-fold increase) and wet control
(38.1 per m2, 13.5-fold increase).
Page 141
127
Table 2: Notable significant differences (p<0.05 versus both dry and wet control) in plant density and
growth variables to populations due to fire suppressants at the Wanneroo with-fire field trial.
Burchardia congesta 9-Months Decreased cover and condition.Conostylis aculeata 6-Months Increased density (41.7% reduction in mortality), persisting to 12-months.Gompholobium tomentosum 9-Months Decreased density (recruitment) by 82.5%, persisting to 12-months.*Ehrharta calycina 6-Months Increased cover and leading shoot length of adult plants.
12-Months Increased leading shoot length of new seedlings.
Burchardia congesta 6-Months Decreased cover and condition, persisting to 9-months.Conostylis aculeata 6-Months Increased density (75.0% reduction in mortality), persisting to 12-months.Lomandra preissii 6-Months Decreased density by 69.8% (mortality and reduced recruitment),
persisting to 12-months.Mesomelaena pseudostygia 9-Months Decreased density by 48.2%.
9-Months Increased cover of surviving plants.Thysanotus manglesianus 3-Months Decreased density by 100% (no plants).
12-Months Decreased density by 85.7%.*Ehrharta calycina 12-Months Increased density by 2.5-fold.
Conostylis aculeata 3-Months Increased cover.6-Months Increased density by 3.3-fold (reduced mortality compared to controls),
persisting to 12-months.Cotula australis 6-Months Increased cover.
9-Months Increased cover and leading shoot length.Gompholobium tomentosum 6-Months Decreased density (recruitment) by 72.9%, persisting to 12-months.
6-Months Increased cover of surviving plants.Lomandra preissii 3-Months Decreased density by 65.5% (mortality and reduced recruitment),
persisting to 12-months.3-Months Increased cover of surviving plants.
Mesomelaena pseudostygia 9-Months Decreased density by 48.7%.9-Months Increased cover of surviving plants.
Thysanotus manglesianus 3-Months Decreased density by 88.2%.12-Months Decreased density by 100% (no plants).
*Cotula bipinnata 6-Months Increased cover and leading shoot length.9-Months Increased cover.
12-Months Decreased density by 59.4%.12-Months Decreased cover and condition of surviving plants.
*Ehrharta calycina 3-Months Increased cover and condition of new seedlings.6-Months Increased cover, leading shoot length, and condition of adult plants.
12-Months Increased density by 7.6-fold.12-Months Increased leading shoot length of new seedlings.
*Hypochaeris glabra 12-Months Increased cover, leading shoot length, and condition.*Hypochaeris radicata 3-Months Increased cover and leading shoot length, persisting to 12-months.
Phos-Chek G75F
Silv-Ex Foam
ClearETI Gel
A similar pattern of recruitment occurred for Ehrharta calycina; plant density was
significantly increased at 12-months by 5.7-fold and 2.0-fold within Phos-Chek and
ClearETI gel treatments (Figure 7(b)). Growth and reproduction (cover, leading shoot
length, and flowering status) for E. calycina was also significantly increased at 6-
months.
Page 142
128
(a) Dicot Emergents*
0
100
200
300
400
500
600
700
800
0-Months 3-Months 6-Months 9-Months 12-Months
Emer
gent
s pe
r m2
(b) Ehrharta calycina
*
*
0
20
40
60
80
100
120
140
160
180
200
0-Months 3-Months 6-Months 9-Months 12-Months
Emer
gent
s pe
r m2
*
Dry Control Wet Control Silv-Ex ClearETI Phos-Chek
Figure 7: Total dicotyledonous seedling emergence and weed grass Ehrharta calycina abundance,
demonstrating increased recruitment 12-months after application of fire and suppressants. Significant
differences (p<0.05) compared to both dry and wet control treatments denoted by *.
Page 143
129
4.0 Discussion
4.1 Impacts to Biodiversity
The three fire suppressant treatments at the Wanneroo with-fire site did not alter total
floral biodiversity, while Ansul3% and Virtual foams noticeably reduced floral
biodiversity at 12-months at the Whiteman with-fire site. As such, hypothesis (i) that
fire suppressants alter biodiversity of flora is partially supported.
Changes to floral biodiversity at the without-fire site were due to population changes in
a small number of species. This strongly suggests that the potential for altered
biodiversity is dependant on a floral community’s species composition. This is only part
of the story, however, since some species common to both sites (e.g. Gompholobium
tomentosum Labill.) responded differently to application of the same suppressant
product. It is therefore possible that impacts to populations and thus floral biodiversity
are codependent on confounding site factors that affect recruitment and/or regeneration
(such as presence of fire, type of fire, season of application, and post-application
weather). If so, predicting the impact to biodiversity by any particular suppressant
product on any floral community would be problematic.
The alteration of native flora biodiversity by Phos-Chek in unburnt Banksia woodland
appears to be in contrast with Larson et al.’s (1999) finding that Phos-Chek did not alter
biodiversity in northern Nevada shrub steppe vegetation. But such difference is not
unexpected considering Banksia woodland (temperate woodland) and shrub steppe
(semi-arid grassland) are distinctly different communities. Possibly, the impact of high
nutrient fire suppressant may be reduced within ecosystems of higher soil fertility in
comparison to Banksia woodland. In any case, replication of field trials in either
community may produce different outcomes due to the possibility of co-dependent
confounding site factors. Conclusive evidence for altered biodiversity due to
suppressant chemicals could perhaps be produced through meta-analysis of multiple
replicate trials.
Page 144
130
4.2 Native Species Populations
All three fire suppressants at the Wanneroo with-fire field site significantly decreased
recruitment of Gompholobium tomentosum, and reduced resprouting of Lomandra
preissii (Endl.) Ewart six months after application. This demonstratively supports
hypothesis (ii) that populations of native species are altered by fire suppressants.
However, there are a few important points to clarify. Firstly, only these two species of
22 species analysed at Wanneroo were significantly and appreciably reduced in density
due to fire suppressants. This suggests that reductions in populations due to
suppressants are highly species specific, and therefore potential impacts will vary with
species composition.
Secondly, though both species were present at both field sites, reduced plant density for
G. tomentosum and L. preissii only occurred at the Wanneroo with-fire site. This
matches with an overall trend for a much higher incidence of significant differences to
plant populations by suppressants within the with-fire trial. This suggests that burnt
communities (or individual populations within) are more susceptible to impacts from
fire suppressant chemicals; increased recruitment and resprouting occurring after a fire
would provide greater opportunity for fire suppressant chemicals to interrupt post-fire
recovery and succession, in contrast to stable unburnt vegetation where recruitment is
minimal.
4.3 Soil Seed Banks and Weeds
Considered in combination, the population increases at the without-fire site
(Gompholobium tomentosum and Hypochaeris glabra L.) and the with-fire site
(Ehrharta calycina and dicot emergents) 12-months after application of Phos-Chek
suggest a considerable increase in the soil seed bank. Preceeding the 12-month increase,
dicot emergents was reduced 54% at 3-months by Phos-Chek; it is possible that an
increase in soil nutrients due to the retardant within the first 3-6 months (chapter 1) may
have caused suppressant-induced inhibition of seed germination (chapter 2), leading to
an accumulation of the soil seed bank available for recruitment at 12 months once soil
nutrients have normalised. However the difference in dicot emergents at 3 months (of
50.8 per m2) accounts for only 10.0% of the recruitment at 12-months. While seed
Page 145
131
inhibition may have contributed to delayed recruitment, it does not sufficiently explain
the majority of dicot emergent recruitment at 12-months.
The delayed recruitment of the weed E. calycina was preceded by a ‘fertiliser effect’
exhibited by significant increases to plant cover, leading shoot length, condition, and
proportion of plants with inflorescence. The weed H. glabra also increased in density,
plant cover, and leading shoot length due to the Phos-Chek treatment. The retardant’s
promotions of larger and healthier plants appears to have enabled increased seed
production and/or improved seed viability, and thus increased the soil seed bank for the
next recruitment season. For the native G. tomentosum, no preceding increases to
growth, condition, or reproduction where detected. Although no fertiliser effect was
found, it is still plausible that G. tomentosum increased seed production and/or viability,
leading to a later increase in recruitment.
The 12-month mass recruitment pattern of E. calycina, G. tomentosum, H. glabra, and
dicot emergents demonstrates that Phos-Chek and similar retardants are capable of
altering soil seed banks, and subsequently altering floral species composition and
biodiversity. Though E. calycina, G. tomentosum, and H. glabra are distinctly different
species (introduced semi-perennial grass, short-lived native pea, and an introduced
annual herb, respectively) they are all seeders that typically respond well to disturbance.
This indicates that Phos-Chek retardant promotes opportunistic species, with invasive
weeds being the most likely candidates. Therefore, hypothesis (iii), that weed species
populations are promoted by fire suppressants, is supported. This further seconds the
finding of Bell et al. (2005) that Phos-Chek retardant increased weed invasion. In
contrast, foam and gel suppressants did not show a trend for massive recruitment and
altered soil seed banks, and may therefore be preferred alternative to the use of
retardants, particularly where weeds already exist.
4.4 Recommendations
Results indicate that fire suppressant impacts to flora populations and thus biodiversity
may be co-dependent on confounding site factors (e.g. fire, season of suppressant
application, and post-application weather). Though logistically challenging, conclusive
evidence for suppressants consistently altering biodiversity could be produced through
Page 146
132
meta-analysis of multiple experimental trials, with possible confounding factors treated
as covariates. An alternative approach to experimental trials would be a sustained
program of floral biodiversity monitoring (and statistical analysis) following the use of
fire suppressant chemicals.
The indication that flora populations in burnt vegetation are more susceptible to
significant impacts from fire suppressants may justify some restrictions in use. In non-
critical emergency situations (i.e. mop-up) the use of water only on burnt vegetation
could avoid ecological impacts and enhanced weed invasion due to fire suppressants,
possibly with minimal reduction in operational efficiency.
While results indicate that Phos-Chek retardant stimulated seed production or increased
seed viability in opportunistic seeder species, the field trial did not specifically monitor
seed volumes or viability. A future trial specifically investigating retardant effects on
seed production to confirm this theory is recommended.
4.5 Conclusion
With few studies investigating biodiversity or population changes due to fire
suppressants, further investigation is needed. The two field trials provide interesting
examples of potential suppressant impacts to floral biodiversity, populations, and soil
seed banks. Minimal change to biodiversity of native species was found, which is
encouraging for continued use of short-term foams and gel suppressants. However,
opportunistic seeder species (particularly weeds) were strongly favoured by Phos-Chek
retardant. The potential for retardant to promote weed species must therefore be
balanced against their long-term effectiveness against fire over the short-term
effectiveness of foams and gels.
Considerably greater numbers of significant impacts to density, growth, and condition
of populations occurred at the with-fire site. This was true even for foam and gel
suppressants, though their overall impact was less than the retardant. Therefore,
withholding non-critical use of foams after a fire, by using water only for mop-up
activities, may considerably limit negative impacts to biodiversity and weed invasion.
Page 147
133
5.0 References
Bell T, Tolhurst K, Wouters M (2005) Effects of the fire retardant Phos-Chek on
vegetation in eastern Australian heathlands. International Journal of Wildland
Fire 14, 199-211.
Bradstock R, Sanders J, Tegart A (1987) Short-term effects on the foliage of a eucalypt
forest after an aerial application of a chemical fire retardant. Australian Forestry
50(2), 71-80.
Conner DJ, Wilson GL (1967) Response of a coastal Queensland heath community to
fertilizer application. Australian Journal of Botany 16, 117-123.
Couto-Vazquez A, Gonzalez-Prieto SJ (2006) Short- and medium-term effects of three
fire fighting chemicals on the properties of a burnt soil. Science of the Total
Environment 371(3), 353-361.
Cruz A, Serrano M, Navarro E, Luna B, Moreno JM (2005) Effect of a long-term fire
retardant (Fire Trol 934) on the germination of nine mediterranean-type shrub
species. Environmental Toxicology 20, 543-548.
Hartskeerl K, Simmons D, Adams R (2004) Does firefighting foam affect the growth of
some Australian native plants? International Journal of Wildland Fire 13, 335-
341.
Heddle E, Specht R (1975) Dark Island heath (Ninety-mile Plain, South Australia) VII
The effect of fertilizers on composition and growth. Australian Journal of
Botany 22, 151-164.
Hopmans P, Bickford R (2003) Effects of fire retardant on soils of heathland in Victoria
(Research report no. 70). Department of Sustainability and Environment,
Victoria.
Kennedy AB (2002) The short term effects of a fire fighting foam and fire retardant on
selected flora from Australia’s southwest. BS Hons Thesis, Edith Cowan
University.
Larson DL, Newton WE, Anderson PJ, Stein SJ (1999) Effects of fire retardant
chemical and fire suppressant foam on shrub steppe vegetation in northern
Nevada. International Journal of Wildland Fire 9(2), 115-127.
Larson JR, Duncan DA (1982) Annual grassland response to fire retardant and wildfire.
Journal of Range Management 35, 700-703.
Page 148
134
Leishman MR, Thomson VP (2005) Experimental evidence for the effects of additional
water, nutrients and physical disturbance on invasive plants in low fertility
Hawkesbury Sandstone soils, Sydney, Australia. Journal of Ecology 93, 38-49.
Luna B, Moreno JM, Cruz A, Fernandez-Gonzalez F (2007) Effects of long-term fire
retardant chemical (Fire-Trol 934) on seed viability and germination of plants
growing in a burned Mediterranean area. International Journal of Wildland Fire
16, 349-359.
Milberg P, Lamont BB (1995) Fire enhances weed invasion of roadside vegetation in
Southwestern Australia. Biological Conservation 73, 45-49.
Rockich DP, Dixon KW, Buist M (2004) An assessment of the impact of fire-
suppressing agents on native vegetation. Botanic Gardens & Parks Authority,
Western Australia. Report prepared for Fire & Emergency Services Authority of
Western Australia.
Specht R, Connor D, Clifford H (1977) The heath-savannah problem: the effect of
fertilizer on sand-heath vegetation of North Stradbroke Island, Queensland.
Australian Journal of Ecology 2, 179-186.
Thomson VP, Leishman MR (2004) Survival of native plants of Hawkesbury Sandstone
communities with additional nutrients: effect of plant age and habitat. Australian
Journal of Botany 52, 141-147.
Page 151
137
GENERAL CONCLUSION
Summary of fire suppressant impacts on flora
1.0 Overview of Findings
Comprehensive investigation into the impacts of 10 fire suppressants on 1) soil nutrient
content, 2) emergence from seed, 3) seedling mortality and growth, and 4) field
communities, has found that suppressants do significantly affect flora of the Swan
Coastal Plain. Predominantly, the overall effects of fire suppressants were both product-
specific and species-specific. Regardless, trends in fire suppressant impacts on flora
were strongly apparent. To summarise, the major findings from the four experimental
chapters are:
1. High nutrient content (particularly S, P, and Na) within fire suppressants is a
predictor for significant impacts to flora.
2. Native species recruitment and growth are, overall, negatively impacted by fire
suppressants.
3. Weeds species are generally promoted (recruitment and growth) over native
species by fire suppressants; either directly, or by an absence of impact where
native species are negatively affected.
4. Fire suppressant alteration of floral biodiversity is dependent on species
composition due to species-specific impacts of suppressants.
5. Burnt vegetation appears more susceptible to impacts from fire suppressants due
to an increased opportunity to alter populations during post-fire mass
recruitment and regeneration.
While this research was conducted for flora of the Swan Coastal Plain, the findings are
likely applicable to other fire-prone mediterranean woodlands, shrublands, and forests
generally. And since impacts are related to nutrient content concentrations within
suppressants, ecosystems adapted to low-fertility soils (such as on the Swan Coastal
Plain) are more likely to be similarly affected.
Page 152
138
2.0 Management Implications
2.1 Considerations for Suppressant Use
It is now generally accepted that environmental impacts of fire suppression activities
must now be considered during fire fighting operations (Backer et al. 2004).
Nonetheless, this thesis acknowledges that the impact of fire suppressant chemicals on
flora is not the sole consideration for fire managers. The use of fire suppressant
chemicals needs to be balanced against their operational and financial effectiveness and
efficiency, within the aim of protecting life and property. Such an assessment of fire
suppressant use is beyond the scope of this study and best performed by the appropriate
authorities; it is recommended that ecological impacts of fire suppressants found within
this research be appropriately reviewed as part of agency’s fulfilment of environmental
responsibilities.
As a cautionary note, the sentiment that “ecological effects of a fire are significantly
greater than those of fire-suppression activities” (Backer et al. 2004) is not a valid
argument to dismiss or diminish the weight of fire suppressant impacts to ecosystems.
Fire is a natural ecological process, while the addition of chemicals and nutrients within
suppressants are not; any impact due to suppressants is therefore of concern to
conservation, especially when population of rare flora are likely to be affected.
2.2 Limiting Impacts
The impacts to flora identified by this study may be limited or reduced by changes to
how fire suppressants are used. While suppressants were species-specific in their
effects, products with higher nutrient content (particularly S and P) trended to greater
impacts on flora, populations, and communities. As such, selecting products with a
reduced nutrient load is a good first step to limiting potential environmental impacts.
Favouring short-term gels and foams over long-term retardants, that are typically very
high in nutrient content, would partially achieve this. Further, selecting a low nutrient
suppressant from amongst a range of foams and gels could be assisted (for a relatively
low cost) through laboratory based nutrient content analysis of suppressant samples.
Page 153
139
Secondly, results indicate that burnt vegetation is more susceptible to fire suppressant
alteration of flora species composition, floral biodiversity, and weed invasion.
Restricting the application of suppressants (or using water-only) on already burnt
vegetation would reduce or remove potential impacts of suppressants to flora.
Acknowledgedly, use of fire suppressants during emergency situations may be required.
However, reducing suppressant use (or using water-only) for non-emergency mop-up
activities is a strong option to reduce or prevent suppressant impacts.
3.0 Suppressant Regulation/Approval
This research found that the 10 fire suppressants vary widely in composition and
potential impacts on flora communities and populations. As such, fire suppressant
selection is therefore a key decision that may determine type and extent and severity of
ecological impacts during firefighting operations. Suppressant effects on flora were
found to be species-specific and may therefore differ within different ecosystems. As
such, rather than following the USDA’s regulation process and list of approved fire
suppressant products, regions outside north America may be best served by independent
assessment of suppressant products on local flora.
Currently the AFAC (Australasian Fire and Emergency Service Authorities Council)
states it is ‘recommended’ that fire suppressants used in Australia be USDA approved
(AFAC 2011). However, an argument for Australian-based regulation of fire
suppressants can be made based on:
1. The potential for ecological impacts of fire suppressants found within this
research,
2. USDA approval specification’s (USDAFS 2007a, 2007b, 2007c) lack of a
requirement for testing on plants,
3. Differences in Australia’s unique flora, ecosystems, and low soil fertility,
compared to North America, and
4. The detection of boron (chapter 1) in the USDA approved retardant PhosChek
G75F; despite USDA specification requirement (USDAFS 2007a, section 2.2) of
“zero borate, or boron containing ingredients”.
Page 154
140
The AFAC is well placed to coordinate national regulation of fire suppressants in
Australia. Such regulation by AFAC could be achieved with minimal interruption and
cost by:
1. Requiring (as opposed to recommending) all fire suppressants used for the
control of wildland fires within Australia to be USDA approved.
2. Requiring mandatory Australian-based and independent testing of suppressant
chemical composition to confirm (i) manufacturer’s reported ingredients, and
(ii) adherence to USDA approval specifications of ‘unacceptable ingredients’
and ‘chemicals of concern’.
3. Requiring mandatory reporting of available nutrient content within fire
suppressants, to enable fire agencies to make informed decisions regarding
potential ecological impacts when selecting products.
4.0 Further Research
Numerous points of interest were identified within this research that could be further
investigated. Firstly, fire suppressants were found to be species-specific in their effects
on emergence from seed, seedling mortality, plant growth, and population changes.
Broadening research to include a majority of species of any region would be cost and
labour prohibitive. However, further trials investigating impacts of suppressants on
threatened species would be of value to biodiversity conservation and planning.
Secondly, strong significant correlations were found between fire suppressant nutrient
concentrations (S, P, Na) and decreased seedling emergence and seedling mortality.
Further trials would be needed to conclusively demonstrate a causal relationship. Seed
germination inhibition due to fire suppressants was confirmed in this research through
consistent observation of delayed seedling emergence. However, reduced final
emergence following germination inhibition also indicates suppressants may be
reducing seed viability. The impact of suppressants on seed viability was not explored
in this research, and is an area for further investigation.
Trials within two field communities indicated that fire suppressants altered soil seed
banks; specifically, increasing the soil seed bank for opportunistic seeder species.
Page 155
141
However, trials did not specifically measure in situ seed production volumes or seed
viability. Considering the demonstrated potential for invasive species to alter
biodiversity and species composition, further investigation into fire suppressant effects
on seed production and soil seed banks is of importance.
Finally, results indicate that fire suppressant impacts to flora populations and thus
biodiversity may be co-dependent on confounding site factors (e.g. fire, season of
suppressant application, and post-application weather). Though logistically challenging,
conclusive evidence for suppressants consistently altering biodiversity could be
produced through meta-analysis of multiple experimental trials, with possible
confounding factors treated as covariates. An alternative approach to experimental trials
would be a sustained program of floral biodiversity monitoring (with statistical analysis)
following the use of fire suppressant chemicals.
Page 156
142
5.0 References
AFAC (Australasian Fire & Emergency Service Authority Council) (2011) USDA
Forest Service Wildland Fire Chemicals. Online accessed 18/07/2011, URL
http://knowledgeweb.afac.com.au/research/fire_management/chemicals/usda_fo
rest_service_wildland_fire_chemicals.
Backer, DM, Jensen SE, McPherson GR (2004) Impacts of fire-suppression activities
on natural communities. Conservation Biology 18(4), 937-946.
USDAFS (US Department of Agriculture Forest Service) (2007a, amended 2010)
Specification 5100-304c: Long-term retaradant, wildland firefighting. United
States Department of Agriculture, United States of America.
USDAFS (US Department of Agriculture Forest Service) (2007b, amended 2010)
Specification 5100-306a: Specification for water enhancers (gels) for wildland
firefighting. United States Department of Agriculture, United States of America.
USDAFS (US Department of Agriculture Forest Service) (2007c, amended 2010)
Specification 5100-307a: Specification for fire suppressant foam for wildland
firefighting (Class A foam). United States Department of Agriculture, United
States of America.
Page 159
145
APPENDIX A
Overview of the study fire suppressants
Source: Material Safety Data Sheet (MSDS) for each fire suppressant product.
Page 160
146
Chemguard
Full Name Cheguard First Class; “Class A” foam concentrate and wetting agent
Type Short-term Foam Manufacturer Chemguard Inc Composition Water 60-75%, Hexylene glycol 3-7% (by weight). Proprietary mixture of
alkyl sulfates, ethoxylates, amphoterics, solvents, and corrosive inhibitors. Appearance Clear amber liquid, slight solvent odour Mix Rate 1% solution by volume
Hydrex-AR Full Name Hydrex AR FFFP Type Short-term Foam Manufacturer Sabo Foam srl Composition Ethanediol 1-10%, Fluorosurfactants 0.5-5%. Appearance Dark brown liquid, organic odour Mix Rate 3% solution by volume.
Jet-X Full Name Jet-X Foam Concentrate Type Short-term Foam Manufacturer Ansul Incorporated Composition Ethanol (4%). Mix of sodium and ammonium salts of fatty alcohol sulfates
or ether sulfates (C8-C18), higher alcohols, inorganic salts, and water (all >95%).
Appearance Clear green coloured liquid, mild sweet odour Mix Rate 2.75% solution by volume
FireAde Full Name FireAde 2000 Fire Fighting Agent Type Short-term Foam Manufacturer Fire Service Plus Inc Composition Proprietary blend Appearance Clear red liquid, mild pleasant clean smell. Mix Rate 1% solution by volume. NOTE: FireAde treatment has been excluded from all native plant trials due to a
mixing rate error; FireAde was incorrectly applied at 6% due to unclear directions on the container. The mixing error was discovered and corrected for all weed species trials, and that data has been included within the research.
Silv-Ex Full Name SILV-EX Foam Concentrate Type Short-term Foam Manufacturer Ansul Incorporated Composition Proprietary mixture consisting of sodium and ammonium salts of fatty
alcohol ether sulfates (C8-C18), higher alcohols, and water (all >70%.). Diethylene glycol monobutyl ether (18%). Ethanol (8%).
Appearance Pale straw yellow, clear liquid. Mild, sweet odour Mix Rate 0.1% to 1% solution by volume. 1% used for this research
Page 161
147
Ansul3% Full Name Ansul 3% Fluoroprotein Foam Type Short-term Foam Manufacturer Ansul Incorporated Composition Hexylene glycol (6.5%). Dichlorophene (0.02%). Propretary mixture of
protein hydrolysate, fluorosurfactants, inorganic salths, and water (all <90%).
Appearance Red/brown opaque liquid, mildly pungent odour Mix Rate 3% solution by volume
Virtual Full Name Buckeye Virtual Foam / Test Foam Type Short-term Foam. For TRAINING ONLY; not to be used for emergency
operations. Manufacturer Buckeye Fire Equipment Company Composition Based on 1% concentration: Water (<59%), Sucrose (>40%), proprietary
mixture of bactericide and inorganic salts (>1%). Appearance Clear water-based liquid solution, very slight odour Mix Rate 6% solution by volume
Phos-Chek Full Name Phos-Chek Fire Retardant G75F Type Long-term Retardant Manufacturer ICL Performance Products LP Composition Diammonium Sulfate (>65%), Monoammonium Phosphate (>20%),
Diammonium Phosphate (<5%), Guar Gum or derivative (<5%), performance additives (<5%).
Appearance Reddish off-white coloured mixture of powdered and granular components with little or now odour
Mix Rate 0.134 kg/L
Barricade Full Name Barricade Fire Blocking Gel Type Polymer Gel Manufacturer Barricade International Inc Composition Anionic water soluble polymer Appearance Odourless, milky, viscous liquid Mix Rate Directed at 2-6% by volume, depending on purpose of use. Through trial, a
2% mix was found to be too thick for easy application to vegetation by use of light tanker vehicles and hand pump sprayers. A 1% solution was used in this research; found to be appropriate, enabling ease of application and good adherence to vegetation.
Clear-ETI Full Name ClearETI Firegel Type Polymer Gel Manufacturer MVP Clear Pty Ltd Composition Grafted sodium polyacrylate Appearance White granular powder. Odourless. Mix Rate 2 g/L
Page 163
149
APPENDIX B
Nutrient content and properties of the fire suppressants
Page 164
Ta
ble
1: N
utrie
nt c
onte
nt a
nd p
rope
rties
of f
ire
supp
ress
ant s
olut
ions
mix
ed w
ith d
e-io
nise
d wa
ter a
t the
max
imum
dir
ecte
d ra
te fo
r use
on
Cla
ss A
fire
s.
* D
esig
nate
s pla
nt a
vaila
ble
nutri
ent.
Chemguard
Hydrex-AR
Jet-X
Fire-Ade
Silv-Ex
Ansul3%
Virtual
Phos-Chek
Barricade
ClearETI
NO
3- m
g/L
0.
00
0.50
0.
00
0.00
0.
00
1.12
0.
00
0.00
0.
00
0.00
N
H4+
mg/
L
54.6
4 15
4.46
26
6.70
0.
46
61.3
0 16
5.28
2.
90
2877
4.58
10
.44
10.2
4 B
* m
g/L
0.
00
0.47
0.
00
0.00
0.
00
0.50
0.
00
2.43
0.
00
0.00
C
a*
mg/
L
0.30
53
.10
0.61
0.
30
0.45
66
.47
0.77
32
4.00
0.
00
0.00
C
l*
mg/
L
0.00
15
54.6
2 0.
00
0.00
0.
00
1696
.13
86.8
7 0.
00
0.00
0.
00
Cu*
m
g/L
0.
00
0.00
0.
00
0.00
0.
00
0.00
0.
00
0.00
0.
00
0.00
Fe
* m
g/L
0.
00
56.0
1 0.
29
0.00
0.
00
64.1
2 0.
53
1.01
0.
14
0.22
K
* m
g/L
1.
36
84.5
5 3.
11
1.99
1.
67
87.6
9 9.
97
6.99
12
0.90
0.
45
Mg*
m
g/L
0.
00
124.
60
0.52
0.
09
0.11
13
1.80
0.
53
4.16
0.
00
0.00
M
n*
mg/
L
0.00
0.
33
0.00
0.
00
0.00
0.
51
0.00
0.
00
0.00
0.
00
Na*
m
g/L
21
.41
670.
00
65.4
5 37
.01
89.8
2 75
1.10
75
9.40
37
.62
0.17
36
.23
P*
mg/
L
9.47
0.
84
57.6
6 0.
26
0.07
0.
88
6.37
85
86.0
0 0.
30
0.06
S*
m
g/L
12
1.60
13
6.10
51
1.00
44
.69
267.
40
128.
50
912.
40
2118
0.00
1.
08
5.40
Z
n*
mg/
L
0.00
15
4.00
0.
63
0.11
0.
19
178.
20
0.46
0.
07
0.00
0.
00
Con
duct
ivity
dS
/m
0.56
8 5.
023
1.08
3 0.
187
0.45
3 5.
903
1279
.993
15
7.59
3 0.
575
0.30
3 pH
(H2 O
)
4.9
6.2
6.6
6.7
4.6
6.2
7.2
5.4
6.8
7.4
davidleach
Typewritten Text
150
Page 167
153
APPENDIX C
Statistical Analyses Output:
Suppressant Impact on Soil Nutrient Content
Table 1: Without-Fire Trial
Table 2: With-Fire Trial
Page 168
154
Table 1: Statistical analyses output for the effects of fire suppressants applied to unburnt vegetation on
soil nutrient content and soil properties (Kruskal-Wallis test and planned Mann-Whitney U test pairwise
comparisons). Green and red cells denote a significant (p<0.05) increase or decrease (respectively) in
soil nutrient or soil property compared to the control treatments. Table continues over page.
NH4+
KW Test MW-U Tests
Time Treatment N p M
(mg/kg) SE+/- N p Controls 6 2.50 0.5000 6 - Chemguard 3 1.67 0.3333 3 - Hydrex-AR 3 2.00 0.5774 3 - Jet-X 3 2.00 0.0000 3 - Silv-Ex 3 1.67 0.3333 3 - Ansul3% 3 1.33 0.3333 3 - Virtual 3 2.67 1.6667 3 - Phos-Chek 3 1.67 0.3333 3 - Barricade 3 1.33 0.3333 3 -
Pre-App
ClearETI 3
0.674
2.00 0.5774 3 - Controls 6 1.67 0.3333 6 - Chemguard 3 2.00 0.0000 3 0.3865 Hydrex-AR 3 2.67 0.6667 3 0.1696 Jet-X 3 2.33 0.3333 3 0.2142 Silv-Ex 3 2.33 0.3333 3 0.2142 Ansul3% 3 1.67 0.3333 3 0.8875 Virtual 3 1.67 0.6667 3 0.8864 Phos-Chek 3 31.00 15.6312 3 0.0176 Barricade 3 5.33 0.8819 3 0.0176
Post-App
ClearETI 3
0.028
1.67 0.6667 3 0.8864 Controls 6 1.33 0.2108 6 - Chemguard 3 1.00 0.0000 3 - Hydrex-AR 3 1.67 0.3333 3 - Jet-X 3 1.67 0.3333 3 - Silv-Ex 3 1.67 0.3333 3 - Ansul3% 3 1.00 0.0000 3 - Virtual 3 1.67 0.6667 3 - Phos-Chek 3 5.67 1.8559 3 - Barricade 3 2.67 0.8819 3 -
3-Months
ClearETI 3
0.208
2.33 1.3333 3 - Controls 6 2.50 0.4282 6 - Chemguard 3 2.00 0.0000 3 - Hydrex-AR 3 3.00 0.5774 3 - Jet-X 3 2.33 0.3333 3 - Silv-Ex 3 3.00 0.5774 3 - Ansul3% 3 2.33 0.3333 3 - Virtual 3 2.67 0.3333 3 - Phos-Chek 3 2.00 0.5774 3 - Barricade 3 2.67 0.3333 3 -
12-Months
ClearETI 3
0.737
3.33 1.4530 3 -
Page 169
155
Table 1 (continued)
NO3-
KW Test MW-U Tests
Time Treatment N p M
(mg/kg) SE+/- N p Controls 6 1.00 0.0000 6 - Chemguard 3 1.00 0.0000 3 - Hydrex-AR 3 1.00 0.0000 3 - Jet-X 3 1.00 0.0000 3 - Silv-Ex 3 1.00 0.0000 3 - Ansul3% 3 1.00 0.0000 3 - Virtual 3 1.00 0.0000 3 - Phos-Chek 3 1.00 0.0000 3 - Barricade 3 1.00 0.0000 3 -
Pre-App
ClearETI 3
0.358
1.00 0.0000 3 - Controls 6 1.00 0.0000 6 - Chemguard 3 1.00 0.0000 3 - Hydrex-AR 3 1.00 0.0000 3 - Jet-X 3 1.00 0.0000 3 - Silv-Ex 3 1.00 0.0000 3 - Ansul3% 3 1.00 0.0000 3 - Virtual 3 1.00 0.0000 3 - Phos-Chek 3 1.00 0.0000 3 - Barricade 3 1.00 0.0000 3 -
Post-App
ClearETI 3
0.358
1.00 0.0000 3 - Controls 6 1.00 0.0000 6 - Chemguard 3 1.00 0.0000 3 - Hydrex-AR 3 1.00 0.0000 3 - Jet-X 3 1.00 0.0000 3 - Silv-Ex 3 1.00 0.0000 3 - Ansul3% 3 1.00 0.0000 3 - Virtual 3 1.00 0.0000 3 - Phos-Chek 3 1.00 0.0000 3 - Barricade 3 1.00 0.0000 3 -
3-Months
ClearETI 3
0.358
1.00 0.0000 3 - Controls 6 1.00 0.0000 6 - Chemguard 3 1.00 0.0000 3 - Hydrex-AR 3 1.00 0.0000 3 - Jet-X 3 1.00 0.0000 3 - Silv-Ex 3 1.00 0.0000 3 - Ansul3% 3 1.00 0.0000 3 - Virtual 3 1.00 0.0000 3 - Phos-Chek 3 1.00 0.0000 3 - Barricade 3 1.00 0.0000 3 -
12-Months
ClearETI 3
0.358
1.33 0.3333 3 -
Page 170
156
Table 1 (continued)
Phosphorus KW Test MW-U Tests
Time Treatment N p M
(mg/kg) SE+/- N p Controls 6 2.17 0.1667 6 - Chemguard 3 2.00 0.0000 3 - Hydrex-AR 3 2.33 0.3333 3 - Jet-X 3 2.00 0.0000 3 - Silv-Ex 3 2.00 0.0000 3 - Ansul3% 3 2.00 0.0000 3 - Virtual 3 2.33 0.3333 3 - Phos-Chek 3 2.00 0.0000 3 - Barricade 3 2.00 0.0000 3 -
Pre-App
ClearETI 3
0.685
2.00 0.0000 3 - Controls 6 2.00 0.0000 6 - Chemguard 3 2.00 0.0000 3 1.0000 Hydrex-AR 3 2.00 0.0000 3 1.0000 Jet-X 3 2.00 0.0000 3 1.0000 Silv-Ex 3 2.00 0.0000 3 1.0000 Ansul3% 3 2.33 0.3333 3 0.1573 Virtual 3 2.00 0.0000 3 1.0000 Phos-Chek 3 13.33 9.3512 3 0.0058 Barricade 3 2.33 0.3333 3 0.1573
Post-App
ClearETI 3
0.013
2.00 0.0000 3 1.0000 Controls 6 2.00 0.0000 6 - Chemguard 3 2.33 0.3333 3 0.157 Hydrex-AR 3 2.00 0.0000 3 1.000 Jet-X 3 2.00 0.0000 3 1.000 Silv-Ex 3 2.00 0.0000 3 1.000 Ansul3% 3 2.00 0.0000 3 1.000 Virtual 3 3.33 0.3333 3 0.005 Phos-Chek 3 4.67 0.8819 3 0.006 Barricade 3 2.33 0.3333 3 0.157
3-Months
ClearETI 3
0.008
8.67 5.6960 3 0.034 Controls 6 3.00 0.3651 6 - Chemguard 3 2.33 0.3333 3 - Hydrex-AR 3 2.33 0.3333 3 - Jet-X 3 2.33 0.3333 3 - Silv-Ex 3 2.00 0.0000 3 - Ansul3% 3 2.00 0.0000 3 - Virtual 3 2.33 0.3333 3 - Phos-Chek 3 2.00 0.0000 3 - Barricade 3 2.00 0.0000 3 -
12-Months
ClearETI 3
0.181
3.00 1.0000 3 -
Page 171
157
Table 1 (continued)
Potassium KW Test MW-U Tests
Time Treatment N p M
(mg/kg) SE+/- N p Controls 6 15.33 0.2108 6 - Chemguard 3 16.67 1.2019 3 - Hydrex-AR 3 15.67 0.6667 3 - Jet-X 3 15.00 0.0000 3 - Silv-Ex 3 15.33 0.3333 3 - Ansul3% 3 15.00 0.0000 3 - Virtual 3 15.33 0.3333 3 - Phos-Chek 3 15.00 0.0000 3 - Barricade 3 15.00 0.5774 3 -
Pre-App
ClearETI 3
0.637
16.00 0.5774 3 - Controls 6 15.33 0.2108 6 - Chemguard 3 15.33 0.3333 3 - Hydrex-AR 3 15.33 0.3333 3 - Jet-X 3 15.00 0.0000 3 - Silv-Ex 3 15.00 0.0000 3 - Ansul3% 3 15.67 0.6667 3 - Virtual 3 15.33 0.3333 3 - Phos-Chek 3 19.00 3.5119 3 - Barricade 3 15.33 0.3333 3 -
Post-App
ClearETI 3
0.581
15.00 0.0000 3 - Controls 6 16.17 0.6009 6 - Chemguard 3 18.33 2.8480 3 - Hydrex-AR 3 16.33 0.3333 3 - Jet-X 3 17.67 2.6667 3 - Silv-Ex 3 16.67 1.2019 3 - Ansul3% 3 16.00 1.0000 3 - Virtual 3 21.67 3.2830 3 - Phos-Chek 3 19.67 0.6667 3 - Barricade 3 17.67 1.7638 3 -
3-Months
ClearETI 3
0.586
17.33 1.4530 3 - Controls 6 24.50 3.3541 6 - Chemguard 3 23.00 1.5275 3 - Hydrex-AR 3 23.00 1.0000 3 - Jet-X 3 26.00 2.3094 3 - Silv-Ex 3 23.67 3.2830 3 - Ansul3% 3 18.33 1.2019 3 - Virtual 3 20.67 0.8819 3 - Phos-Chek 3 19.67 2.3333 3 - Barricade 3 21.00 3.5119 3 -
12-Months
ClearETI 3
0.558
22.33 1.2019 3 -
Page 172
158
Table 1 (continued)
Sulphur KW Test MW-U Tests
Time Treatment N p M
(mg/kg) SE+/- N p Controls 6 2.43 0.2186 6 - Chemguard 3 1.93 0.1856 3 - Hydrex-AR 3 2.13 0.1764 3 - Jet-X 3 1.97 0.0882 3 - Silv-Ex 3 3.60 1.3650 3 - Ansul3% 3 2.20 0.7572 3 - Virtual 3 2.07 0.3844 3 - Phos-Chek 3 1.70 0.0577 3 - Barricade 3 2.17 0.8007 3 -
Pre-App
ClearETI 3
0.706
2.27 0.5548 3 - Controls 6 2.50 0.1033 6 - Chemguard 3 2.80 0.1732 3 0.1521 Hydrex-AR 3 2.43 0.5897 3 0.4367 Jet-X 3 3.33 0.2728 3 0.0269 Silv-Ex 3 7.83 2.6359 3 0.0196 Ansul3% 3 3.33 0.9262 3 0.4367 Virtual 3 3.83 0.5548 3 0.0269 Phos-Chek 3 38.10 17.2152 3 0.0196 Barricade 3 4.17 0.7881 3 0.0508
Post-App
ClearETI 3
0.011
2.83 0.3756 3 0.3621 Controls 6 3.53 0.5812 6 - Chemguard 3 3.03 0.6438 3 - Hydrex-AR 3 3.20 0.5508 3 - Jet-X 3 3.83 1.1289 3 - Silv-Ex 3 5.27 1.6476 3 - Ansul3% 3 3.80 0.4726 3 - Virtual 3 3.47 0.3480 3 - Phos-Chek 3 6.53 1.3043 3 - Barricade 3 3.43 0.5364 3 -
3-Months
ClearETI 3
0.571
3.93 0.5897 3 - Controls 6 2.68 0.1537 6 - Chemguard 3 2.40 0.3215 3 - Hydrex-AR 3 2.40 0.0577 3 - Jet-X 3 1.97 0.2333 3 - Silv-Ex 3 2.27 0.5667 3 - Ansul3% 3 1.97 0.2333 3 - Virtual 3 1.90 0.2082 3 - Phos-Chek 3 1.87 0.2186 3 - Barricade 3 1.97 0.3215 3 -
12-Months
ClearETI 3
0.220
2.53 0.3180 3 -
Page 173
159
Table 1 (continued)
Conductivity KW Test MW-U Tests
Time Treatment N p M (dS/m) SE+/- N p Controls 6 0.0210 0.0023 6 - Chemguard 3 0.0210 0.0032 3 - Hydrex-AR 3 0.0220 0.0029 3 - Jet-X 3 0.0207 0.0017 3 - Silv-Ex 3 0.0193 0.0023 3 - Ansul3% 3 0.0287 0.0137 3 - Virtual 3 0.0237 0.0039 3 - Phos-Chek 3 0.0193 0.0003 3 - Barricade 3 0.0197 0.0054 3 -
Pre-App
ClearETI 3
0.984
0.0257 0.0045 3 - Controls 6 0.0340 0.0068 6 - Chemguard 3 0.0250 0.0012 3 - Hydrex-AR 3 0.0233 0.0037 3 - Jet-X 3 0.0233 0.0041 3 - Silv-Ex 3 0.0620 0.0334 3 - Ansul3% 3 0.0287 0.0032 3 - Virtual 3 0.0260 0.0061 3 - Phos-Chek 3 0.0937 0.0523 3 - Barricade 3 0.0283 0.0043 3 -
Post-App
ClearETI 3
0.138
0.0220 0.0010 3 - Controls 6 0.0245 0.0038 6 - Chemguard 3 0.0193 0.0033 3 - Hydrex-AR 3 0.0233 0.0050 3 - Jet-X 3 0.0220 0.0050 3 - Silv-Ex 3 0.0200 0.0015 3 - Ansul3% 3 0.0290 0.0059 3 - Virtual 3 0.0220 0.0050 3 - Phos-Chek 3 0.0277 0.0050 3 - Barricade 3 0.0217 0.0023 3 -
3-Months
ClearETI 3
0.848
0.0240 0.0010 3 - Controls 6 0.0378 0.0028 6 - Chemguard 3 0.0337 0.0058 3 - Hydrex-AR 3 0.0390 0.0021 3 - Jet-X 3 0.0347 0.0071 3 - Silv-Ex 3 0.0447 0.0098 3 - Ansul3% 3 0.0353 0.0026 3 - Virtual 3 0.0377 0.0073 3 - Phos-Chek 3 0.0477 0.0182 3 - Barricade 3 0.0337 0.0039 3 -
12-Months
ClearETI 3
0.968
0.0453 0.0093 3 -
Page 174
160
Table 1 (continued)
pH H2O KW Test MW-U Tests
Time Treatment N p M SE+/- N p Controls 6 6.14 0.1922 6 - Chemguard 3 5.88 0.0882 3 - Hydrex-AR 3 5.80 0.1333 3 - Jet-X 3 5.85 0.0882 3 - Silv-Ex 3 6.17 0.0333 3 - Ansul3% 3 6.49 0.2333 3 - Virtual 3 6.39 0.2333 3 - Phos-Chek 3 6.08 0.1453 3 - Barricade 3 6.15 0.1528 3 -
Pre-App
ClearETI 3
0.398
6.10 0.1764 3 - Controls 6 6.88 0.3273 6 - Chemguard 3 6.18 0.2186 3 - Hydrex-AR 3 5.82 0.1000 3 - Jet-X 3 6.08 0.1333 3 - Silv-Ex 3 7.06 0.4509 3 - Ansul3% 3 6.62 0.3000 3 - Virtual 3 6.28 0.1333 3 - Phos-Chek 3 6.06 0.3480 3 - Barricade 3 6.13 0.1155 3 -
Post-App
ClearETI 3
0.336
6.11 0.1453 3 - Controls 6 6.31 0.1145 6 - Chemguard 3 6.15 0.0882 3 - Hydrex-AR 3 6.07 0.0333 3 - Jet-X 3 6.00 0.1333 3 - Silv-Ex 3 6.31 0.0577 3 - Ansul3% 3 6.33 0.1155 3 - Virtual 3 6.37 0.1732 3 - Phos-Chek 3 6.03 0.2028 3 - Barricade 3 6.11 0.0577 3 -
3-Months
ClearETI 3
0.267
6.10 0.1764 3 - Controls 6 5.83 0.1176 6 - Chemguard 3 5.95 0.1528 3 - Hydrex-AR 3 5.73 0.1155 3 - Jet-X 3 5.87 0.0333 3 - Silv-Ex 3 5.70 0.1202 3 - Ansul3% 3 5.80 0.1202 3 - Virtual 3 5.88 0.1333 3 - Phos-Chek 3 5.82 0.2186 3 - Barricade 3 5.86 0.1528 3 -
12-Months
ClearETI 3
0.558
5.93 0.1155 3 -
Page 175
161
Table 1 (continued)
pH CaCl KW Test MW-U Tests
Time Treatment N p M SE+/- N p Controls 6 5.04 0.1687 6 - Chemguard 3 4.80 0.1764 3 - Hydrex-AR 3 4.72 0.1000 3 - Jet-X 3 4.92 0.1000 3 - Silv-Ex 3 5.24 0.1764 3 - Ansul3% 3 5.96 0.4702 3 - Virtual 3 5.69 0.4359 3 - Phos-Chek 3 5.10 0.2082 3 - Barricade 3 5.06 0.1202 3 -
Pre-App
ClearETI 3
0.276
5.33 0.3215 3 - Controls 6 6.26 0.3833 6 - Chemguard 3 5.32 0.3055 3 - Hydrex-AR 3 4.81 0.0577 3 - Jet-X 3 5.18 0.1453 3 - Silv-Ex 3 6.44 0.5783 3 - Ansul3% 3 5.88 0.3844 3 - Virtual 3 5.37 0.2404 3 - Phos-Chek 3 5.18 0.2603 3 - Barricade 3 5.10 0.1764 3 -
Post-App
ClearETI 3
0.322
5.09 0.2082 3 - Controls 6 5.57 0.2167 6 - Chemguard 3 5.06 0.1202 3 - Hydrex-AR 3 4.94 0.0667 3 - Jet-X 3 5.04 0.2333 3 - Silv-Ex 3 5.14 0.0333 3 - Ansul3% 3 5.41 0.1453 3 - Virtual 3 5.59 0.3712 3 - Phos-Chek 3 4.94 0.2333 3 - Barricade 3 4.95 0.1528 3 -
3-Months
ClearETI 3
0.404
4.94 0.0667 3 - Controls 6 4.83 0.1302 6 - Chemguard 3 4.95 0.1528 3 - Hydrex-AR 3 4.70 0.1202 3 - Jet-X 3 4.74 0.0333 3 - Silv-Ex 3 4.77 0.2333 3 - Ansul3% 3 4.94 0.1764 3 - Virtual 3 4.94 0.1764 3 - Phos-Chek 3 4.90 0.1764 3 - Barricade 3 4.96 0.1528 3 -
12-Months
ClearETI 3
0.841
5.01 0.1453 3 -
Page 176
162
Table 1 (continued)
Organic Carbon % KW Test MW-U Tests
Time Treatment N p M (%) SE+/- N p Controls 6 1.02 0.1210 6 - Chemguard 3 1.00 0.2113 3 - Hydrex-AR 3 1.16 0.4311 3 - Jet-X 3 1.01 0.1867 3 - Silv-Ex 3 1.61 0.2418 3 - Ansul3% 3 0.95 0.2070 3 - Virtual 3 1.09 0.2048 3 - Phos-Chek 3 0.98 0.0989 3 - Barricade 3 0.86 0.1132 3 -
Pre-App
ClearETI 3
0.811
1.00 0.0856 3 - Controls 6 1.12 0.2604 6 - Chemguard 3 1.40 0.5372 3 - Hydrex-AR 3 1.06 0.1911 3 - Jet-X 3 1.12 0.2256 3 - Silv-Ex 3 1.33 0.2333 3 - Ansul3% 3 0.84 0.0099 3 - Virtual 3 1.26 0.2161 3 - Phos-Chek 3 0.96 0.3232 3 - Barricade 3 1.03 0.2075 3 -
Post-App
ClearETI 3
0.897
1.04 0.1758 3 - Controls 6 1.19 0.3054 6 - Chemguard 3 1.00 0.0000 3 - Hydrex-AR 3 0.79 0.1348 3 - Jet-X 3 1.23 0.4122 3 - Silv-Ex 3 1.74 0.6584 3 - Ansul3% 3 0.86 0.0739 3 - Virtual 3 1.07 0.0467 3 - Phos-Chek 3 1.09 0.3095 3 - Barricade 3 0.97 0.2459 3 -
3-Months
ClearETI 3
0.836
1.29 0.1276 3 - Controls 6 1.27 0.1879 6 - Chemguard 3 1.21 0.3165 3 - Hydrex-AR 3 1.38 0.1879 3 - Jet-X 3 1.37 0.0415 3 - Silv-Ex 3 1.34 0.1781 3 - Ansul3% 3 1.07 0.0033 3 - Virtual 3 1.10 0.1677 3 - Phos-Chek 3 0.99 0.2088 3 - Barricade 3 0.88 0.1169 3 -
12-Months
ClearETI 3
0.476
1.02 0.1516 3 -
Page 177
163
Table 2: Statistical analyses output for the effects of fire suppressants applied after a fire on soil nutrient
content and soil properties (Kruskal-Wallis test and planned Mann-Whitney U test pairwise
comparisons). Green and red cells denote a significant (p<0.05) increase or decrease (respectively) in
soil nutrient or soil property compared to the control treatments. Table continues over page.
NH4+
KW Test MW-U Tests Time Treatment N p M
(mg/kg) SE+/- N p
Controls 6 9.50 1.1762 6 - Silv-Ex 3 8.67 0.3333 3 - ClearETI 3 7.67 0.6667 3 -
Pre-App
Phos-Chek 3
0.673
8.33 0.8819 3 - Controls 6 10.00 1.8257 6 - Silv-Ex 3 9.33 0.3333 3 0.5978 ClearETI 3 7.00 0.5774 3 0.3559
Post-App
Phos-Chek 3
0.034
83.00 16.2583 3 0.0196 Controls 6 6.00 1.0328 6 - Silv-Ex 3 6.00 0.5774 3 - ClearETI 3 5.33 1.3333 3 -
3-Months
Phos-Chek 3
0.534
7.33 0.8819 3 - Controls 6 4.50 0.3416 6 - Silv-Ex 3 5.67 0.3333 3 0.0728 ClearETI 3 4.33 0.3333 3 0.8774
6-Months
Phos-Chek 3
0.026
8.67 1.4530 3 0.0213 Controls 6 4.67 0.3333 6 - Silv-Ex 3 4.67 0.8819 3 - ClearETI 3 4.33 0.6667 3 -
12-Months
Phos-Chek 3
0.554
7.67 2.6667 3 - NO3
- Controls 6 1.17 0.3801 6 - Silv-Ex 3 1.17 0.4410 3 - ClearETI 3 1.00 0.5000 3 -
Pre-App
Phos-Chek 3
0.391
1.17 0.4410 3 - Controls 6 0.75 0.1118 6 - Silv-Ex 3 0.67 0.1667 3 0.6547 ClearETI 3 0.50 0.0000 3 0.1573
Post-App
Phos-Chek 3
0.049
2.33 0.8819 3 0.0394 Controls 6 1.75 0.4425 6 - Silv-Ex 3 4.67 1.7638 3 - ClearETI 3 5.33 2.8480 3 -
3-Months
Phos-Chek 3
0.170
1.50 0.7638 3 - Controls 6 1.50 0.5477 6 - Silv-Ex 3 1.67 1.1667 3 - ClearETI 3 0.50 0.0000 3 -
6-Months
Phos-Chek 3
0.126
3.00 0.5774 3 - Controls 6 1.25 0.2500 6 - Silv-Ex 3 1.50 0.7638 3 - ClearETI 3 1.67 0.3333 3 -
12-Months
Phos-Chek 3
0.807
2.17 1.0138 3 -
Page 178
164
Table 2 (continued)
Phosphorus KW Test MW-U Tests Time Treatment N p M
(mg/kg) SE+/- N p
Controls 6 4.17 0.7491 6 - Silv-Ex 3 3.00 0.0000 3 - ClearETI 3 3.00 0.5774 3 -
Pre-App
Phos-Chek 3
0.675
3.67 0.6667 3 - Controls 6 4.50 1.1180 6 - Silv-Ex 3 3.33 0.3333 3 0.5637 ClearETI 3 3.33 0.3333 3 0.5637
Post-App
Phos-Chek 3
0.047
40.00 11.1355 3 0.0176 Controls 6 3.17 0.4014 6 - Silv-Ex 3 3.00 0.0000 3 - ClearETI 3 3.33 0.3333 3 -
3-Months
Phos-Chek 3
0.786
4.67 2.0276 3 - Controls 6 2.00 0.3651 6 - Silv-Ex 3 2.00 0.0000 3 1.0000 ClearETI 3 2.67 0.3333 3 0.2695
6-Months
Phos-Chek 3
0.036
7.67 0.6667 3 0.0181 Controls 6 3.33 0.2108 6 - Silv-Ex 3 4.33 0.3333 3 0.0477 ClearETI 3 3.00 0.0000 3 0.2850
12-Months
Phos-Chek 3
0.010
7.00 0.5774 3 0.0148 Potassium
Controls 6 40.17 6.8480 6 - Silv-Ex 3 43.33 4.9103 3 - ClearETI 3 44.67 3.8442 3 -
Pre-App
Phos-Chek 3
0.813
48.33 8.9505 3 - Controls 6 36.00 3.4833 6 - Silv-Ex 3 39.33 9.7354 3 - ClearETI 3 48.33 6.9362 3 -
Post-App
Phos-Chek 3
0.257
49.00 6.5064 3 - Controls 6 39.83 4.0284 6 - Silv-Ex 3 45.33 3.6667 3 - ClearETI 3 52.33 9.5277 3 -
3-Months
Phos-Chek 3
0.280
50.67 3.2830 3 - Controls 6 24.00 3.2249 6 - Silv-Ex 3 37.67 5.8973 3 - ClearETI 3 34.33 4.6667 3 -
6-Months
Phos-Chek 3
0.118
45.33 11.2891 3 - Controls 6 35.33 2.4855 6 - Silv-Ex 3 41.33 7.8811 3 - ClearETI 3 39.67 3.8442 3 -
12-Months
Phos-Chek 3
0.542
47.67 8.8757 3 -
Page 179
165
Table 2 (continued)
Sulphur KW Test MW-U Tests Time Treatment N p M
(mg/kg) SE+/- N p
Controls 6 7.35 2.4028 6 - Silv-Ex 3 5.24 0.8324 3 - ClearETI 3 5.48 0.4532 3 -
Pre-App
Phos-Chek 3
0.400
4.11 0.4461 3 - Controls 6 6.62 1.6841 6 - Silv-Ex 3 7.10 0.4302 3 0.1198 ClearETI 3 6.91 0.8192 3 0.2997
Post-App
Phos-Chek 3
0.038
126.83 25.9056 3 0.0196 Controls 6 3.05 0.1735 6 - Silv-Ex 3 3.92 0.2517 3 - ClearETI 3 3.36 0.9097 3 -
3-Months
Phos-Chek 3
0.288
3.24 0.1626 3 - Controls 6 2.61 0.3071 6 - Silv-Ex 3 3.26 0.3695 3 - ClearETI 3 2.42 0.2122 3 -
6-Months
Phos-Chek 3
0.378
2.99 0.3911 3 - Controls 6 3.02 0.1317 6 - Silv-Ex 3 3.19 0.2608 3 - ClearETI 3 2.67 0.1184 3 -
12-Months
Phos-Chek 3
0.348
3.86 1.0128 3 - Conductivity KW Test MW-U Tests Time Treatment N p M (dS/m) SE+/- N p
Controls 6 0.0625 0.0106 6 - Silv-Ex 3 0.0723 0.0124 3 - ClearETI 3 0.0683 0.0060 3 -
Pre-App
Phos-Chek 3
0.400
0.0560 0.0067 3 - Controls 6 0.0667 0.0076 6 - Silv-Ex 3 0.0713 0.0104 3 - ClearETI 3 0.0640 0.0025 3 -
Post-App
Phos-Chek 3
0.075
0.3000 0.0691 3 - Controls 6 0.0423 0.0028 6 - Silv-Ex 3 0.0670 0.0152 3 - ClearETI 3 0.0597 0.0163 3 -
3-Months
Phos-Chek 3
0.085
0.0540 0.0035 3 - Controls 6 0.0397 0.0037 6 - Silv-Ex 3 0.0537 0.0075 3 - ClearETI 3 0.0463 0.0035 3 -
6-Months
Phos-Chek 3
0.183
0.0563 0.0090 3 - Controls 6 0.0435 0.0024 6 - Silv-Ex 3 0.0610 0.0142 3 - ClearETI 3 0.0500 0.0078 3 -
12-Months
Phos-Chek 3
0.496
0.0520 0.0083 3 -
Page 180
166
Table 2 (continued)
pH H2O KW Test MW-U Tests Time Treatment N p Mean SE+/- N p
Controls 6 5.94 0.1765 6 - Silv-Ex 3 5.97 0.2404 3 - ClearETI 3 5.97 0.1732 3 -
Pre-App
Phos-Chek 3
0.836
5.86 0.1528 3 - Controls 6 5.65 0.0749 6 - Silv-Ex 3 5.99 0.2333 3 - ClearETI 3 5.95 0.1528 3 -
Post-App
Phos-Chek 3
0.230
5.55 0.0882 3 - Controls 6 5.43 0.0477 6 - Silv-Ex 3 6.02 0.3055 3 0.145 ClearETI 3 5.93 0.1155 3 0.019
3-Months
Phos-Chek 3
0.035
5.67 0.0333 3 0.026 Controls 6 5.56 0.0715 6 - Silv-Ex 3 5.72 0.1856 3 - ClearETI 3 5.81 0.0577 3 -
6-Months
Phos-Chek 3
0.199
5.74 0.0333 3 - Controls 6 5.60 0.0000 6 - Silv-Ex 3 6.13 0.2848 3 0.034 ClearETI 3 5.94 0.0333 3 0.005
12-Months
Phos-Chek 3
0.018
5.78 0.0667 3 0.005 pH CaCl
Controls 6 4.99 0.1851 6 - Silv-Ex 3 5.20 0.3383 3 - ClearETI 3 5.12 0.2309 3 -
Pre-App
Phos-Chek 3
0.783
4.92 0.1856 3 - Controls 6 4.68 0.0764 6 - Silv-Ex 3 5.22 0.3283 3 - ClearETI 3 5.03 0.1856 3 -
Post-App
Phos-Chek 3
0.369
4.62 0.1000 3 - Controls 6 4.43 0.0477 6 - Silv-Ex 3 5.55 0.5033 3 0.145 ClearETI 3 4.98 0.1453 3 0.019
3-Months
Phos-Chek 3
0.038
4.71 0.0577 3 0.026 Controls 6 4.61 0.0843 6 - Silv-Ex 3 4.93 0.2848 3 - ClearETI 3 4.87 0.0333 3 -
6-Months
Phos-Chek 3
0.216
4.78 0.0667 3 - Controls 6 4.60 0.0000 6 - Silv-Ex 3 5.65 0.4842 3 0.034 ClearETI 3 4.97 0.0333 3 0.005
12-Months
Phos-Chek 3
0.017
4.78 0.0667 3 0.005
Page 181
167
Table 2 (continued)
Organic Carbon % KW Test MW-U Tests Time Treatment N p M (%) SE+/- N p
Controls 6 2.05 0.1028 6 - Silv-Ex 3 2.10 0.2419 3 - ClearETI 3 1.96 0.1408 3 -
Pre-App
Phos-Chek 3
0.859
1.85 0.2516 3 - Controls 6 1.80 0.1933 6 - Silv-Ex 3 1.99 0.3439 3 - ClearETI 3 1.48 0.0463 3 -
Post-App
Phos-Chek 3
0.427
2.08 0.1198 3 - Controls 6 1.90 0.1817 6 - Silv-Ex 3 1.96 0.3522 3 - ClearETI 3 1.87 0.3126 3 -
3-Months
Phos-Chek 3
0.993
1.96 0.4050 3 - Controls 6 1.48 0.1308 6 - Silv-Ex 3 2.22 0.1332 3 - ClearETI 3 1.79 0.3405 3 -
6-Months
Phos-Chek 3
0.219
1.85 0.3296 3 - Controls 6 1.98 0.1438 6 - Silv-Ex 3 1.86 0.2307 3 - ClearETI 3 2.06 0.3251 3 -
12-Months
Phos-Chek 3
0.543
1.81 0.2536 3 -
Page 183
169
APPENDIX D
Statistical Analyses Output:
Suppressant Impact on Seedling Emergence
Table 1: Ex situ trial of native species
Table 2: Ex situ trial of weed species
Table 3: In situ without-fire trial of native species
Table 4: In situ with-fire trial of native species
Page 184
170
Table 1: Statistical analyses output for ex situ seedling emergence of native species (Binomial Logistic
Regression). Green and red cells denote a significant (p<0.05) increase or decrease (respectively) in
emergence compared to the control treatment.
Acacia pulchella Allocasuarina humilis Emerged Emerged
Treatment of 75 % % vs.
Control p vs.
Control of 75 % % vs.
Control p vs.
Control Control 14 18.67% - - 20 26.67% - - Chemguard 10 13.33% 71.43% 0.375 7 9.33% 35.00% 0.008 Hydrex-AR 11 14.67% 78.57% 0.512 9 12.00% 45.00% 0.026 Jet-X 13 17.33% 92.86% 0.832 12 16.00% 60.00% 0.114 Silv-Ex 12 16.00% 85.71% 0.666 6 8.00% 30.00% 0.004 Ansul 3% 13 17.33% 92.86% 0.832 7 9.33% 35.00% 0.008 Virtual 12 16.00% 85.71% 0.666 3 4.00% 15.00% 0.001 Phos-Chek 4 5.33% 28.57% 0.018 10 13.33% 50.00% 0.045 Barricade 10 13.33% 71.43% 0.375 17 22.67% 85.00% 0.570 ClearETI 19 25.33% 135.71% 0.326 19 25.33% 95.00% 0.852 Anigozanthos manglesii Banksia menziesii Control 46 61.33% - - 34 94.44% - - Chemguard 48 64.00% 104.35% 0.736 31 86.11% 91.18% 0.248 Hydrex-AR 61 81.33% 132.61% 0.008 36 100.00% 105.88% 0.998 Jet-X 42 56.00% 91.30% 0.507 26 72.22% 76.47% 0.022 Silv-Ex 31 41.33% 67.39% 0.015 33 91.67% 97.06% 0.645 Ansul 3% 57 76.00% 123.91% 0.055 30 83.33% 88.24% 0.152 Virtual 33 44.00% 71.74% 0.034 6 16.67% 17.65% 0.000 Phos-Chek 10 13.33% 21.74% 0.000 27 75.00% 79.41% 0.035 Barricade 55 73.33% 119.57% 0.119 34 94.44% 100.00% 1.000 ClearETI 60 80.00% 130.43% 0.013 31 86.11% 91.18% 0.248 Conostylis aculaeta Eucalyptus marginata Control 16 21.33% - - 24 32.00% - - Chemguard 21 28.00% 131.25% 0.345 26 34.67% 108.33% 0.729 Hydrex-AR 5 6.67% 31.25% 0.014 45 60.00% 187.50% 0.001 Jet-X 6 8.00% 37.50% 0.026 14 18.67% 58.33% 0.063 Silv-Ex 0 0.00% 0.00% 0.000 11 14.67% 45.83% 0.014 Ansul 3% 4 5.33% 25.00% 0.007 9 12.00% 37.50% 0.004 Virtual 7 9.33% 43.75% 0.047 5 6.67% 20.83% 0.000 Phos-Chek 10 13.33% 62.50% 0.199 28 37.33% 116.67% 0.493 Barricade 0 0.00% 0.00% 0.000 26 34.67% 108.33% 0.729 ClearETI 3 4.00% 18.75% 0.004 29 38.67% 120.83% 0.394 Gompholobium tomentosum Melaleuca thymoides Control 11 14.67% - - 66 88.00% - - Chemguard 9 12.00% 81.82% 0.631 20 26.67% 30.30% 0.000 Hydrex-AR 12 16.00% 109.09% 0.821 35 46.67% 53.03% 0.000 Jet-X 7 9.33% 63.64% 0.319 28 37.33% 42.42% 0.000 Silv-Ex 3 4.00% 27.27% 0.035 0 0.00% 0.00% 0.000 Ansul 3% 5 6.67% 45.45% 0.121 72 96.00% 109.09% 0.085 Virtual 8 10.67% 72.73% 0.463 8 10.67% 12.12% 0.000 Phos-Chek 2 2.67% 18.18% 0.020 27 36.00% 40.91% 0.000 Barricade 5 6.67% 45.45% 0.121 21 28.00% 31.82% 0.000 ClearETI 7 9.33% 63.64% 0.319 40 53.33% 60.61% 0.000 Rhagodia bacatta Control 15 20.00% - - Chemguard 9 12.00% 60.00% 0.186 Hydrex-AR 8 10.67% 53.33% 0.118 Jet-X 7 9.33% 46.67% 0.071 Silv-Ex 5 6.67% 33.33% 0.022 Ansul 3% 9 12.00% 60.00% 0.186 Virtual 9 12.00% 60.00% 0.186 Phos-Chek 9 12.00% 60.00% 0.186 Barricade 10 13.33% 66.67% 0.276 ClearETI 9 12.00% 60.00% 0.186
Page 185
171
Table 2: Statistical analyses output for ex situ seedling emergence of weed species (Binomial Logistic
Regression). Green and red cells denote a significant (p<0.05) increase or decrease (respectively) in
emergence compared to the control treatment.
*Asparagus asparagoides *Ehrharta calycina Emerged Emerged
Treatment of 75 % % vs.
Control p vs.
Control of 75 % % vs.
Control p vs.
Control Control 41 54.67% - - 23 30.67% - - Chemguard 57 76.00% 139.02% 0.007 17 22.67% 73.91% 0.269 Hydrex 49 65.33% 119.51% 0.183 17 22.67% 73.91% 0.269 Jet-X 71 94.67% 173.17% 0.000 3 4.00% 13.04% 0.000 FireAde 57 76.00% 139.02% 0.007 3 4.00% 13.04% 0.000 Silv-Ex 67 89.33% 163.41% 0.000 0 0.00% 0.00% 0.000 Ansul 69 92.00% 168.29% 0.000 19 25.33% 82.61% 0.468 Virtual 71 94.67% 173.17% 0.000 0 0.00% 0.00% 0.000 Phos-Chek 42 56.00% 102.44% 0.409 0 0.00% 0.00% 0.000 Barricade 55 73.33% 134.15% 0.018 8 10.67% 34.78% 0.004 ClearETI 71 94.67% 173.17% 0.000 49 65.33% 213.04% 0.000 *Gladiolus caryophyllaceus *Pelargonium capitatum Control 73 97.33% - - 60 80.00% - - Chemguard 75 100.00% 102.74% 0.997 57 76.00% 95.00% 0.555 Hydrex 64 85.33% 87.67% 0.020 53 70.67% 88.33% 0.187 Jet-X 75 100.00% 102.74% 0.997 62 82.67% 103.33% 0.675 FireAde 72 96.00% 98.63% 0.651 55 73.33% 91.67% 0.336 Silv-Ex 73 97.33% 100.00% 1.000 53 70.67% 88.33% 0.187 Ansul 72 96.00% 98.63% 0.651 54 72.00% 90.00% 0.253 Virtual 74 98.67% 101.37% 0.567 54 72.00% 90.00% 0.253 Phos-Chek 58 77.33% 79.45% 0.002 63 84.00% 105.00% 0.524 Barricade 73 97.33% 100.00% 1.000 54 72.00% 90.00% 0.253 ClearETI 75 100.00% 102.74% 0.997 63 84.00% 105.00% 0.524
Page 186
172
Table 3: Statistical analyses output for without-fire in situ trial of seedling emergence for sown native
species (Binomial Logistic Regression). Green and red cells denote a significant increase or decrease
(respectively) in emergence compared to the control treatments.
Acacia pulchella Banksia grandis Emerged Emerged
Treatment of 270 %
% vs. Dry
Control
p vs. Dry
Control
p vs. Wet
Control of 270 %
% vs. Dry
Control
p vs. Dry
Control
p vs. Wet
Control Dry Control 8 2.96% - - 0.805 14 5.19% - - 0.849 Wet Control 9 3.33% 112.50% 0.805 - 15 5.56% 107.14% 0.849 - Chemguard 18 6.67% 225.00% 0.050 0.081 11 4.07% 78.57% 0.540 0.423 Hydrex-AR 26 9.63% 325.00% 0.003 0.004 15 5.56% 107.14% 0.849 1.000 Jet-X 16 5.93% 200.00% 0.101 0.157 3 1.11% 21.43% 0.014 0.010 Silv-Ex 16 5.93% 200.00% 0.101 0.157 16 5.93% 114.29% 0.707 0.853 Ansul 3% 13 4.81% 162.50% 0.270 0.386 10 3.70% 71.43% 0.406 0.309 Virtual 33 12.22% 412.50% 0.000 0.000 10 3.70% 71.43% 0.406 0.309 Phos-Chek 10 3.70% 125.00% 0.632 0.815 1 0.37% 7.14% 0.010 0.008 Barricade 26 9.63% 325.00% 0.003 0.004 17 6.30% 121.43% 0.579 0.716 ClearETI 43 15.93% 537.50% 0.000 0.000 15 5.56% 107.14% 0.849 1.000 Banksia menziesii Bossiaea eriocarpa Dry Control 9 3.33% - - 0.649 4 1.48% - - 0.526 Wet Control 11 4.07% 122.22% 0.649 - 6 2.22% 150.00% 0.526 - Chemguard 22 8.15% 244.44% 0.020 0.052 10 3.70% 250.00% 0.116 0.315 Hydrex-AR 22 8.15% 244.44% 0.020 0.052 7 2.59% 175.00% 0.367 0.779 Jet-X 4 1.48% 44.44% 0.172 0.079 10 3.70% 250.00% 0.116 0.315 Silv-Ex 14 5.19% 155.56% 0.290 0.540 5 1.85% 125.00% 0.737 0.761 Ansul 3% 16 5.93% 177.78% 0.157 0.326 4 1.48% 100.00% 1.000 0.526 Virtual 7 2.59% 77.78% 0.613 0.342 5 1.85% 125.00% 0.737 0.761 Phos-Chek 6 2.22% 66.67% 0.435 0.225 2 0.74% 50.00% 0.421 0.175 Barricade 15 5.56% 166.67% 0.215 0.423 9 3.33% 225.00% 0.172 0.435 ClearETI 20 7.41% 222.22% 0.041 0.101 13 4.81% 325.00% 0.036 0.110 Gompholobium tomentosum Melaleuca thymoides Dry Control 10 3.70% - - 0.064 4 1.48% - - 0.367 Wet Control 3 1.11% 30.00% 0.064 - 7 2.59% 175.00% 0.367 - Chemguard 13 4.81% 130.00% 0.524 0.020 3 1.11% 75.00% 0.705 0.215 Hydrex-AR 16 5.93% 160.00% 0.232 0.007 5 1.85% 125.00% 0.737 0.561 Jet-X 13 4.81% 130.00% 0.524 0.020 1 0.37% 25.00% 0.213 0.066 Silv-Ex 12 4.44% 120.00% 0.664 0.029 0 0.00% 0.00% 0.994 0.994 Ansul 3% 4 1.48% 40.00% 0.116 0.705 1 0.37% 25.00% 0.213 0.066 Virtual 14 5.19% 140.00% 0.406 0.014 3 1.11% 75.00% 0.705 0.215 Phos-Chek 6 2.22% 60.00% 0.315 0.323 1 0.37% 25.00% 0.213 0.066 Barricade 15 5.56% 150.00% 0.309 0.010 6 2.22% 150.00% 0.526 0.779 ClearETI 25 9.26% 250.00% 0.011 0.000 2 0.74% 50.00% 0.421 0.115
Page 187
173
Table 4: Statistical analyses output for with-fire in situ trial of seedling emergence for sown native
species (Binomial Logistic Regression). Green and red cells denote a significant increase or decrease
(respectively) in emergence compared to Dry Control and Wet Control treatments.
Acacia pulchella Allocasuarina humilis Emerged Emerged
Treatment of 270 %
% vs. Dry
Control
p vs. Dry
Control
p vs. Wet
Control of 270 %
% vs. Dry
Control
p vs. Dry
Control
p vs. Wet
Control Dry Control 30 11.11% - - 0.892 10 3.70% - - 0.091 Wet Control 31 11.48% 103.33% 0.892 - 19 7.04% 190.00% 0.091 - Silv-Ex 30 11.11% 100.00% 1.000 0.892 14 5.19% 140.00% 0.406 0.371 ClearETI 16 5.93% 53.33% 0.034 0.024 2 0.74% 20.00% 0.035 0.002 Phos-Chek 13 4.81% 43.33% 0.009 0.006 2 0.74% 20.00% 0.035 0.002 Banksia grandis Bossiaea eriocarpa Dry Control 138 51.11% - - 0.667 38 14.07% - - 0.033 Wet Control 133 49.26% 96.38% 0.667 - 57 21.11% 150.00% 0.033 - Silv-Ex 121 44.81% 87.68% 0.143 0.301 43 15.93% 113.16% 0.547 0.122 ClearETI 110 40.74% 79.71% 0.016 0.047 31 11.48% 81.58% 0.368 0.003 Phos-Chek 52 19.26% 37.68% 0.000 0.000 14 5.19% 36.84% 0.001 0.000 Conostylis aculeata Eucalyptus marginata Dry Control 39 14.44% - - 0.245 75 27.78% - - 0.237 Wet Control 49 18.15% 125.64% 0.245 - 63 23.33% 84.00% 0.237 - Silv-Ex 14 5.19% 35.90% 0.001 0.000 61 22.59% 81.33% 0.166 0.838 ClearETI 15 5.56% 38.46% 0.001 0.000 44 16.30% 58.67% 0.000 0.041 Phos-Chek 6 2.22% 15.38% 0.000 0.000 16 5.93% 21.33% 0.000 0.000 Gompholobium tomentosum Rhagodia baccata Dry Control 21 7.78% - - 0.538 8 2.96% - - 0.197 Wet Control 25 9.26% 119.05% 0.538 - 14 5.19% 175.00% 0.197 - Silv-Ex 12 4.44% 57.14% 0.110 0.030 17 6.30% 212.50% 0.072 0.579 ClearETI 11 4.07% 52.38% 0.073 0.019 5 1.85% 62.50% 0.404 0.044 Phos-Chek 8 2.96% 38.10% 0.017 0.004 14 5.19% 175.00% 0.197 1.000
Page 189
175
APPENDIX E
Statistical Analyses Output:
Suppressant Impact on Survival of Juvenile Plants
Table 1: Native Species
Table 2: Weed Species
Page 190
176
Table 1: Statistical analyses output for the survival of juvenile native seedlings treated with fire
suppressants (Binomial Logistic Regression). Red cells denote a significant decrease (p<0.05) in plant
survival compared to the control treatment.
Acacia pulchella Allocasuarina humilis Treatment Alive Dead % Alive p vs. Control Treatment Alive Dead % Alive p vs. Control Control 16 0 100% - Control 15 1 94% - Chemguard 16 0 100% 1.000 Chemguard 16 0 100% 0.487 Hydrex-AR 16 0 100% 1.000 Hydrex-AR 16 0 100% 0.487 Jet-X 15 1 94% 0.487 Jet-X 16 0 100% 0.487 Silv-Ex 16 0 100% 1.000 Silv-Ex 16 0 100% 0.487 ANSUL3% 16 0 100% 1.000 ANSUL3% 16 0 100% 0.487 Virtual 14 2 88% 0.274 Virtual 12 4 75% 0.196 Phos-Chek 2 14 13% 0.001 Phos-Chek 3 13 19% 0.000 Barricade 16 0 100% 1.000 Barricade 16 0 100% 0.487 ClearETI 16 0 100% 1.000 ClearETI 16 0 100% 0.487
Anigozanthos manglesii Banksia menziesii Control 16 0 100% - Control 16 0 100% - Chemguard 15 1 94% 0.487 Chemguard 16 0 100% 1.000 Hydrex-AR 15 1 94% 0.487 Hydrex-AR 16 0 100% 1.000 Jet-X 12 4 75% 0.107 Jet-X 15 1 94% 0.487 Silv-Ex 7 9 44% 0.014 Silv-Ex 16 0 100% 1.000 ANSUL3% 16 0 100% 1.000 ANSUL3% 16 0 100% 1.000 Virtual 0 16 0% 0.001 Virtual 13 3 81% 0.168 Phos-Chek 5 11 31% 0.006 Phos-Chek 4 12 25% 0.003 Barricade 16 0 100% 1.000 Barricade 16 0 100% 1.000 ClearETI 16 0 100% 1.000 ClearETI 16 0 100% 1.000
Conostylis aculeata Eucalyptus marginata Control 15 1 94% - Control 16 0 100% - Chemguard 14 2 88% 0.598 Chemguard 16 0 100% 1.000 Hydrex-AR 13 3 81% 0.345 Hydrex-AR 16 0 100% 1.000 Jet-X 7 9 44% 0.009 Jet-X 14 2 88% 0.274 Silv-Ex 7 9 44% 0.009 Silv-Ex 16 0 100% 1.000 ANSUL3% 16 0 100% 0.487 ANSUL3% 16 0 100% 1.000 Virtual 0 16 0% 0.000 Virtual 5 11 31% 0.006 Phos-Chek 3 13 19% 0.000 Phos-Chek 2 14 13% 0.001 Barricade 16 0 100% 0.487 Barricade 16 0 100% 1.000 ClearETI 15 1 94% 1.000 ClearETI 16 0 100% 1.000
Gompholobium tomentosum Melaleuca thymoides Control 16 0 100% - Control 13 2 81% - Chemguard 12 4 75% 0.107 Chemguard 6 9 38% 0.016 Hydrex-AR 16 0 100% 1.000 Hydrex-AR 13 2 81% 1.000 Jet-X 2 14 13% 0.001 Jet-X 3 12 19% 0.001 Silv-Ex 1 15 6% 0.000 Silv-Ex 6 9 38% 0.016 ANSUL3% 16 0 100% 1.000 ANSUL3% 14 1 88% 0.597 Virtual 0 16 0% 0.001 Virtual 1 14 6% 0.000 Phos-Chek 11 5 69% 0.071 Phos-Chek 1 14 6% 0.000 Barricade 16 0 100% 1.000 Barricade 11 3 69% 0.398 ClearETI 16 0 100% 1.000 ClearETI 14 1 88% 0.597
Rhagodia bacatta Control 13 0 81% - Chemguard 12 1 75% 0.484 Hydrex-AR 13 0 81% 1.000 Jet-X 7 6 44% 0.040 Silv-Ex 8 5 50% 0.063 ANSUL3% 13 0 81% 1.000 Virtual 0 13 0% 0.001 Phos-Chek 2 11 13% 0.003 Barricade 11 2 69% 0.269 ClearETI 12 1 75% 0.484
Page 191
177
Table 2: Statistical analyses output for the survival of juvenile weed seedlings treated with fire
suppressants (Binomial Logistic Regression). Red cells denote a significant decrease (p<0.05) in plant
survival compared to the control treatment.
Asparagus asparagoides Ehrharta calycina Treatment Alive Dead % Alive p vs. Control Treatment Alive Dead % Alive p vs. Control Control 14 1 93% - Control 15 0 100% - Chemguard 12 3 80% 0.343 Chemguard 14 1 93% 0.486 Hydrex-AR 15 0 100% 0.486 Hydrex-AR 15 0 100% 1.000 Jet-X 8 7 53% 0.031 Jet-X 13 2 87% 0.273 FireAde 13 2 87% 0.597 FireAde 13 2 87% 0.273 Silv-Ex 8 7 53% 0.031 Silv-Ex 15 0 100% 1.000 ANSUL3% 15 0 100% 0.486 ANSUL3% 15 0 100% 1.000 Virtual 7 8 47% 0.016 Virtual 12 3 80% 0.166 Phos-Chek 14 1 93% 1.000 Phos-Chek 3 12 20% 0.003 Barricade 14 1 93% 1.000 Barricade 15 0 100% 1.000 ClearETI 11 4 73% 0.193 ClearETI 15 0 100% 1.000
Gladiolus caryophyllaceus Pelargonium capitatum Control 13 2 87% - Control 15 0 100% - Chemguard 9 6 60% 0.127 Chemguard 15 0 100% 1.000 Hydrex-AR 13 2 87% 1.000 Hydrex-AR 15 0 100% 1.000 Jet-X 5 10 33% 0.007 Jet-X 15 0 100% 1.000 FireAde 7 8 47% 0.033 FireAde 15 0 100% 1.000 Silv-Ex 10 5 67% 0.230 Silv-Ex 15 0 100% 1.000 ANSUL3% 15 0 100% 0.273 ANSUL3% 15 0 100% 1.000 Virtual 0 15 0% 0.001 Virtual 15 0 100% 1.000 Phos-Chek 1 14 7% 0.000 Phos-Chek 12 3 80% 0.166 Barricade 14 1 93% 0.597 Barricade 15 0 100% 1.000 ClearETI 12 3 80% 0.652 ClearETI 15 0 100% 1.000
Page 193
179
APPENDIX F
Statistical Analyses Output:
Suppressant Impact on Juvenile Plant Leading Shoot Length
Table 1: Native Species
Table 2: Weed Species
Page 194
180
Table 1: Statistical analyses output for the leading shoot length of native plants treated with fire
suppressants (Mann-Whitney U pairwise comparisons following a significant (p<0.05) Kruskal-Wallis
test). Green and red cells denote a significant increase or decrease (respectively) in leading shoot length
compared to the control treatment.
Acacia pulchella Allocasuarina humilis KW Test MW-U Test KW Test MW-U Test Treatment N p Mean SE p N p Mean SE p Control 16 69.063 4.645 - 15 93.000 6.203 - Chemguard 16 64.125 3.642 - 16 105.500 6.063 0.118 Hydrex-AR 16 65.250 2.893 - 16 158.313 7.419 0.000 Jet-X 15 69.000 3.321 - 16 98.063 5.500 0.678 Silv-Ex 16 60.438 1.932 - 16 97.438 7.121 0.566 ANSUL3% 16 66.625 2.754 - 16 159.438 5.215 0.000 Virtual 14 59.714 3.309 - 12 81.083 6.180 0.102 Phos-Chek 2 61.000 5.000 - 3 142.667 23.383 0.050 Barricade 15 71.667 3.496 - 16 151.500 8.668 0.000 ClearETI 16
0.165
70.625 3.903 - 16
0.000
105.938 4.087 0.063 Anigozanthos manglesii Banksia menziesii Control 16 26.313 1.356 - 16 153.500 4.424 - Chemguard 15 23.867 1.077 0.191 16 149.813 4.209 0.250 Hydrex-AR 15 27.867 1.644 0.552 16 141.813 6.024 0.136 Jet-X 12 29.250 1.577 0.130 16 104.063 8.009 0.000 Silv-Ex 7 23.286 3.650 0.366 16 124.563 5.974 0.000 ANSUL3% 16 32.313 2.177 0.026 16 149.813 2.619 0.146 Virtual 0 - - - 13 62.846 6.443 0.000 Phos-Chek 5 42.600 8.489 0.047 4 95.750 8.854 0.003 Barricade 16 35.000 2.740 0.002 15 136.400 5.631 0.011 ClearETI 15
0.000
25.667 1.530 0.781 16
0.000
147.188 3.997 0.282 Conostylis aculeata Euclalyptus marginata Control 15 14.800 0.788 - 16 82.313 2.332 - Chemguard 14 14.500 0.993 0.775 16 74.063 3.016 0.086 Hydrex-AR 13 12.615 1.685 0.343 16 101.063 4.058 0.001 Jet-X 7 12.714 2.643 0.547 14 66.286 3.093 0.001 Silv-Ex 7 8.714 1.063 0.001 16 71.375 2.630 0.006 ANSUL3% 16 17.750 1.907 0.475 16 115.063 3.900 0.000 Virtual 0 - - - 5 62.200 6.924 0.015 Phos-Chek 3 13.000 4.041 0.633 2 117.000 19.000 0.048 Barricade 16 19.438 1.958 0.081 16 109.063 3.058 0.000 ClearETI 15
0.017
14.533 1.664 0.835 16
0.000
90.438 3.190 0.034 Gompholobium tomentosum Melaleuca thymoides Control 16 12.750 0.581 - 13 18.154 1.636 - Chemguard 12 11.750 0.993 0.454 6 8.500 2.460 0.012 Hydrex-AR 16 15.813 1.473 0.060 13 26.615 2.581 0.006 Jet-X 2 10.500 0.500 0.199 3 16.000 4.163 0.497 Silv-Ex 2 10.500 0.500 0.199 6 13.167 1.851 0.124 ANSUL3% 16 14.375 0.939 0.239 14 29.429 1.208 0.000 Virtual 0 - - - 1 7.000 - 0.105 Phos-Chek 11 40.909 4.641 0.000 1 20.000 - 0.617 Barricade 16 14.000 0.822 0.236 10 26.800 2.351 0.013 ClearETI 15
0.000
15.267 0.831 0.027 14
0.000
20.643 1.802 0.151 Rhagodia baccata Control 13 43.077 3.267 - Chemguard 12 34.667 2.481 - Hydrex-AR 13 39.846 2.594 - Jet-X 7 43.714 3.656 - Silv-Ex 8 39.375 4.989 - ANSUL3% 13 41.846 2.882 - Virtual 0 - - - Phos-Chek 2 51.000 19.000 - Barricade 11 38.909 2.771 - ClearETI 12
0.524
44.833 4.069 -
Page 195
181
Table 2: Statistical analyses output for the leading shoot length of weed plants treated with fire
suppressants (Mann-Whitney U pairwise comparisons following a significant (p<0.05) Kruskal-Wallis
test). Green and red cells denote a significant increase or decrease (respectively) in leading shoot length
compared to the control treatment.
Asparagus asparagoides Ehrharta calycina KW Test MW-U Test KW Test MW-U Test Treatment N p Mean SE p N p Mean SE p Control 14 35.857 1.579 15 101.000 5.523 - Chemguard 12 30.833 1.910 0.032 14 108.429 5.721 0.394 Hydrex-AR 15 36.467 1.276 0.526 15 172.000 9.928 0.000 Jet-X 8 34.625 3.053 0.681 13 97.231 5.284 0.764 FireAde 13 28.769 0.818 0.001 13 94.769 3.817 0.381 Silv-Ex 8 31.875 2.224 0.132 15 99.067 3.437 0.852 ANSUL3% 15 36.467 1.138 0.843 15 189.133 11.754 0.000 Virtual 7 29.571 2.277 0.043 12 105.000 7.244 0.608 Phos-Chek 14 31.929 2.288 0.231 3 366.667 33.498 0.008 Barricade 14 36.643 1.377 0.746 15 209.467 11.127 0.000 ClearETI 11
0.002
35.182 1.457 0.526 15
0.000
102.800 5.261 0.740 Gladiolus caryophyllaceus Pelargonium capitatum
Control 13 80.769 4.023 - 15 20.400 0.748 - Chemguard 9 75.556 5.360 - 15 19.800 1.200 0.453 Hydrex-AR 13 81.769 5.417 - 15 29.533 0.883 0.000 Jet-X 5 82.000 1.449 - 15 20.133 0.899 0.532 FireAde 7 79.714 5.079 - 15 17.667 0.465 0.004 Silv-Ex 10 74.900 2.567 - 15 18.067 0.881 0.045 ANSUL3% 15 86.533 2.977 - 15 28.733 0.943 0.000 Virtual 0 - - - 15 16.867 1.068 0.020 Phos-Chek 1 85.000 - - 12 65.833 2.682 0.000 Barricade 14 78.643 2.843 - 15 29.933 1.442 0.000 ClearETI 12
0.471
82.417 4.091 - 15
0.000
20.067 0.978 0.451
Page 197
183
APPENDIX G
Statistical Analyses Output:
Suppressant Impact on Juvenile Plant Biomass
Table 1: Native Species
Table 2: Weed Species
Page 198
Tabl
e 1:
Sta
tistic
al a
naly
sis o
utpu
t for
effe
cts o
f fir
e su
ppre
ssan
ts o
n ex
situ
nat
ive
seed
ling
biom
ass (
tota
l, sh
oot,
root
, and
root
:sho
ot ra
tio),
by sp
ecie
(Kru
skal
-
Wal
lis te
st an
d pl
anne
d M
ann-
Whi
tney
U te
st pa
irwi
se c
ompa
riso
ns).
Gre
en a
nd re
d ce
lls d
enot
e a
sign
ifica
nt (p
<0.
05) i
ncre
ase
or d
ecre
ase
(res
pect
ivel
y)
com
pare
d th
e co
ntro
l tre
atm
ent.
A
caci
a pu
lche
lla
T
otal
Bio
mas
s Sh
oot B
iom
ass
Roo
t Bio
mas
s R
oot:S
hoot
KW
Tes
t M
W-U
Tes
t K
W T
est
MW
-U T
est
KW
Tes
t M
W-U
Tes
t K
W T
est
MW
-U T
est
Trea
tmen
t N
p
Mea
n SE
p
N
p M
ean
SE
p N
p
Mea
n SE
p
N
p M
ean
SE
p C
ontro
l 5
0.23
2 0.
0333
-
5 0.
093
0.01
20
- 5
0.13
9 0.
0234
-
5 1.
4852
0.
1786
-
Che
mgu
ard
5 0.
137
0.01
13
0.02
8 5
0.06
4 0.
0067
0.
076
5 0.
073
0.00
58
0.07
6 5
1.16
41
0.10
99
0.17
5 H
ydre
x-A
R
5 0.
125
0.01
62
0.02
8 5
0.05
3 0.
0086
0.
028
5 0.
072
0.00
98
0.02
8 5
1.43
48
0.18
48
0.91
7 Je
t-X
5 0.
131
0.01
69
0.04
7 5
0.05
5 0.
0085
0.
028
5 0.
077
0.00
99
0.04
7 5
1.47
78
0.17
85
0.91
7 Si
lv-E
x 5
0.12
7 0.
0122
0.
028
5 0.
049
0.00
54
0.00
9 5
0.07
9 0.
0082
0.
076
5 1.
6695
0.
1533
0.
465
AN
SUL3
%
5 0.
143
0.01
43
0.02
8 5
0.05
9 0.
0070
0.
028
5 0.
084
0.00
83
0.07
6 5
1.45
46
0.10
57
0.75
4 V
irtua
l 5
0.13
0 0.
0265
0.
047
5 0.
050
0.00
86
0.02
8 5
0.08
0 0.
0182
0.
076
5 1.
5661
0.
1554
0.
754
Phos
-Che
k 2
1.08
0 0.
1634
0.
053
2 0.
722
0.12
49
0.05
3 2
0.35
8 0.
0385
0.
053
2 0.
5017
0.
0336
0.
053
Bar
ricad
e 5
0.18
2 0.
0201
0.
347
5 0.
086
0.00
88
0.75
4 5
0.09
7 0.
0114
0.
117
5 1.
1211
0.
0441
0.
117
Cle
arET
I 5
0.02
6
0.11
0 0.
0103
0.
016
5
0.01
1
0.05
6 0.
0050
0.
016
5
0.02
6
0.05
4 0.
0066
0.
016
5
0.01
8
0.96
04
0.09
23
0.04
7
Allo
casu
arin
a hu
mili
s C
ontro
l 5
0.07
2 0.
0110
-
5 0.
032
0.00
46
- 5
0.04
0 0.
0097
-
5 1.
3136
0.
3464
-
Che
mgu
ard
5 0.
068
0.01
03
0.46
5 5
0.03
2 0.
0045
0.
754
5 0.
036
0.00
65
0.75
4 5
1.15
84
0.12
17
- H
ydre
x-A
R
5 0.
287
0.01
76
0.00
9 5
0.14
3 0.
0095
0.
009
5 0.
144
0.01
35
0.00
9 5
1.01
68
0.10
51
- Je
t-X
5 0.
098
0.01
24
0.17
5 5
0.04
6 0.
0044
0.
076
5 0.
051
0.00
86
0.25
1 5
1.09
70
0.12
61
- Si
lv-E
x 5
0.09
3 0.
0114
0.
251
5 0.
039
0.00
70
0.11
7 5
0.05
4 0.
0057
0.
251
5 1.
4767
0.
1826
-
AN
SUL3
%
5 0.
200
0.04
04
0.00
9 5
0.10
7 0.
0210
0.
009
5 0.
093
0.02
01
0.04
7 5
0.86
09
0.06
86
- V
irtua
l 5
0.06
3 0.
0082
0.
754
5 0.
031
0.00
38
0.60
2 5
0.03
3 0.
0057
0.
754
5 1.
0618
0.
1692
-
Phos
-Che
k 2
0.37
1 0.
0053
0.
053
2 0.
191
0.02
28
0.05
3 2
0.18
0 0.
0281
0.
053
2 0.
9769
0.
2636
-
Bar
ricad
e 5
0.23
0 0.
0517
0.
016
5 0.
115
0.02
35
0.00
9 5
0.11
5 0.
0282
0.
028
5 0.
9491
0.
0624
-
Cle
arET
I 5
0.00
0
0.10
9 0.
0252
0.
175
5
0.00
0
0.05
2 0.
0123
0.
251
5
0.00
1
0.05
7 0.
0131
0.
465
5
0.35
7
1.10
92
0.07
01
-
davidleach
Typewritten Text
184
Page 199
Tabl
e 1
(con
tinue
d)
A
nigo
zant
hos m
angl
esii
T
otal
Bio
mas
s Sh
oot B
iom
ass
Roo
t Bio
mas
s R
oot:S
hoot
KW
Tes
t M
W-U
Tes
t K
W T
est
MW
-U T
est
KW
Tes
t M
W-U
Tes
t K
W T
est
MW
-U T
est
Trea
tmen
t N
p
Mea
n SE
p
N
p M
ean
SE
p N
p
Mea
n SE
p
N
p M
ean
SE
p C
ontro
l 5
0.04
5 0.
0083
-
5 0.
010
0.00
13
- 5
0.03
6 0.
0080
-
5 4.
0329
1.
1392
-
Che
mgu
ard
5 0.
035
0.00
71
0.46
5 5
0.01
3 0.
0015
0.
175
5 0.
022
0.00
59
0.11
7 5
1.64
85
0.32
49
0.07
6 H
ydre
x-A
R
5 0.
017
0.00
43
0.02
8 5
0.00
8 0.
0012
0.
602
5 0.
009
0.00
32
0.02
8 5
0.98
46
0.22
33
0.00
9 Je
t-X
5 0.
073
0.01
44
0.11
7 5
0.02
3 0.
0034
0.
009
5 0.
050
0.01
12
0.46
5 5
2.07
29
0.24
95
0.11
7 Si
lv-E
x 3
0.02
6 0.
0124
0.
101
3 0.
012
0.00
57
0.88
1 3
0.01
4 0.
0067
0.
101
3 1.
1405
0.
0303
0.
025
AN
SUL3
%
5 0.
082
0.03
03
0.75
4 5
0.02
4 0.
0070
0.
076
5 0.
059
0.02
35
0.75
4 5
2.18
31
0.27
81
0.17
5 V
irtua
l 0
- -
- 0
- -
- 0
- -
- 0
- -
- Ph
os-C
hek
5 0.
496
0.09
36
0.00
9 5
0.10
3 0.
0158
0.
009
5 0.
393
0.08
53
0.00
9 5
3.91
82
0.67
38
0.75
4 B
arric
ade
5 0.
109
0.06
03
0.46
5 5
0.02
6 0.
0072
0.
009
5 0.
082
0.05
36
0.91
7 5
2.33
24
0.82
58
0.07
6 C
lear
ETI
5
0.00
1
0.04
7 0.
0091
0.
917
5
0.00
0
0.01
6 0.
0012
0.
036
5
0.00
1
0.03
1 0.
0081
0.
917
5
0.00
3
1.88
85
0.36
25
0.07
6
Ban
ksia
men
zies
ii C
ontro
l 5
3.14
9 0.
5517
-
5 1.
995
0.35
17
- 5
1.15
4 0.
2400
-
5 0.
5831
0.
1046
-
Che
mgu
ard
5 2.
899
0.43
09
- 5
1.62
0 0.
2154
-
5 1.
279
0.31
37
- 5
0.84
47
0.23
67
- H
ydre
x-A
R
5 3.
101
0.49
90
- 5
1.65
6 0.
3258
-
5 1.
445
0.19
66
- 5
0.99
93
0.16
42
- Je
t-X
5 2.
255
0.51
90
- 5
1.29
8 0.
3012
-
5 0.
956
0.23
32
- 5
0.72
28
0.14
37
- Si
lv-E
x 5
2.63
9 0.
1587
-
5 1.
634
0.12
22
- 5
1.00
5 0.
0693
-
5 0.
6242
0.
0488
-
AN
SUL3
%
5 3.
046
0.49
74
- 5
1.75
4 0.
3078
-
5 1.
292
0.23
55
- 5
0.74
80
0.09
53
- V
irtua
l 5
2.10
2 0.
6423
-
5 1.
240
0.28
91
- 5
0.86
1 0.
3576
-
5 0.
5778
0.
1316
-
Phos
-Che
k 4
2.84
2 0.
5971
-
4 1.
603
0.30
27
- 4
1.23
9 0.
3176
-
4 0.
7506
0.
0915
-
Bar
ricad
e 5
2.82
3 0.
2582
-
5 1.
600
0.10
42
- 5
1.22
3 0.
1591
-
5 0.
7517
0.
0634
-
Cle
arET
I 5
0.61
3
3.79
8 0.
4288
-
5
0.85
3
1.86
1 0.
1285
-
5
0.43
0
1.93
7 0.
3645
-
5
0.38
5
1.04
29
0.17
39
-
davidleach
Typewritten Text
185
Page 200
Tabl
e 1
(con
tinue
d): S
tatis
tical
ana
lysi
s out
put f
or e
ffect
s of f
ire
supp
ress
ants
on
ex si
tu n
ativ
e se
edlin
g bi
omas
s (to
tal,
shoo
t, ro
ot, a
nd ro
ot:s
hoot
ratio
), by
spec
ie
(Kru
skal
-Wal
lis te
st an
d pl
anne
d M
ann-
Whi
tney
U te
st pa
irwi
se c
ompa
rison
s). G
reen
and
red
cells
den
ote
a si
gnifi
cant
(p<
0.05
) inc
reas
e or
dec
reas
e
(res
pect
ivel
y) c
ompa
red
the
cont
rol t
reat
men
t.
C
onos
tylis
acu
leat
a
Tot
al B
iom
ass
Shoo
t Bio
mas
s R
oot B
iom
ass
Roo
t:Sho
ot
K
W T
est
MW
-U T
est
KW
Tes
t M
W-U
Tes
t K
W T
est
MW
-U T
est
KW
Tes
t M
W-U
Tes
t Tr
eatm
ent
N
p M
ean
SE
p N
p
Mea
n SE
p
N
p M
ean
SE
p N
p
Mea
n SE
p
Con
trol
5 0.
025
0.00
59
- 5
0.00
6 0.
0014
-
5 0.
018
0.00
52
- 5
2.99
10
1.19
76
- C
hem
guar
d 5
0.02
5 0.
0052
0.
754
5 0.
008
0.00
19
0.67
5 5
0.01
7 0.
0038
-
5 2.
0221
0.
4495
-
Hyd
rex-
AR
2
0.01
8 0.
0159
0.
699
2 0.
005
0.00
44
1.00
0 2
0.01
2 0.
0115
-
2 1.
6268
0.
8268
-
Jet-X
4
0.03
6 0.
0029
0.
086
4 0.
011
0.00
05
0.01
4 4
0.02
5 0.
0024
-
4 2.
2052
0.
1466
-
Silv
-Ex
3 0.
014
0.00
78
0.29
7 3
0.00
4 0.
0026
0.
456
3 0.
009
0.00
53
- 3
2.02
15
0.43
67
- A
NSU
L3%
5
0.06
5 0.
0327
0.
251
5 0.
014
0.00
56
0.11
7 5
0.05
1 0.
0273
-
5 3.
0177
0.
7338
-
Virt
ual
0 -
- -
0 -
- -
0 -
- -
0 -
- -
Phos
-Che
k 1
1.68
8 -
0.14
3 1
0.09
2 -
0.14
3 1
1.59
5 -
- 1
17.2
630
- -
Bar
ricad
e 5
0.09
4 0.
0182
0.
009
5 0.
050
0.01
91
0.00
9 5
0.04
3 0.
0088
-
5 1.
3652
0.
4153
-
Cle
arET
I 5
0.03
6
0.04
1 0.
0177
0.
917
5
0.01
8
0.01
1 0.
0050
0.
917
5
0.11
4
0.03
0 0.
0128
-
5
0.33
6
3.47
22
0.80
09
-
Euc
alyp
tus
mar
gina
ta
Con
trol
5 0.
701
0.09
44
- 5
0.21
4 0.
0181
-
5 0.
488
0.08
27
- 5
2.25
59
0.34
78
- C
hem
guar
d 5
0.37
6 0.
0607
0.
028
5 0.
181
0.03
80
0.46
5 5
0.19
5 0.
0239
0.
028
5 1.
2020
0.
1777
-
Hyd
rex-
AR
5
0.66
4 0.
0517
0.
465
5 0.
301
0.02
92
0.02
8 5
0.36
3 0.
0278
0.
347
5 1.
2313
0.
1060
-
Jet-X
5
0.23
0 0.
0386
0.
009
5 0.
098
0.01
91
0.00
9 5
0.13
2 0.
0226
0.
009
5 1.
4231
0.
1636
-
Silv
-Ex
5 0.
306
0.03
19
0.01
6 5
0.14
2 0.
0120
0.
016
5 0.
165
0.02
25
0.01
6 5
1.15
76
0.10
86
- A
NSU
L3%
5
0.91
8 0.
1053
0.
175
5 0.
415
0.06
95
0.01
6 5
0.50
3 0.
0398
0.
917
5 1.
2864
0.
1346
-
Virt
ual
5 0.
159
0.03
53
0.00
9 5
0.07
4 0.
0175
0.
009
5 0.
085
0.01
83
0.00
9 5
1.18
03
0.17
06
- Ph
os-C
hek
2 0.
928
0.01
99
0.05
3 2
0.37
1 0.
0163
0.
053
2 0.
557
0.00
36
0.69
9 2
1.50
44
0.05
65
- B
arric
ade
5 0.
959
0.10
94
0.17
5 5
0.45
3 0.
0552
0.
009
5 0.
506
0.05
61
0.91
7 5
1.12
63
0.05
45
- C
lear
ETI
5
0.00
0
0.44
4 0.
0305
0.
076
5
0.00
0
0.21
6 0.
0209
0.
917
5
0.00
0
0.22
7 0.
0129
0.
047
5
0.09
1
1.08
21
0.09
25
-
davidleach
Typewritten Text
186
Page 201
Tabl
e 1
(con
tinue
d)
G
omph
olob
ium
tom
ento
sum
Tot
al B
iom
ass
Shoo
t Bio
mas
s R
oot B
iom
ass
Roo
t:Sho
ot
K
W T
est
MW
-U T
est
KW
Tes
t M
W-U
Tes
t K
W T
est
MW
-U T
est
KW
Tes
t M
W-U
Tes
t Tr
eatm
ent
N
p M
ean
SE
p N
p
Mea
n SE
p
N
p M
ean
SE
p N
p
Mea
n SE
p
Con
trol
5 0.
029
0.00
68
- 5
0.01
3 0.
0035
-
5 0.
016
0.00
37
- 5
1.34
13
0.23
25
- C
hem
guar
d 5
0.00
7 0.
0022
0.
009
5 0.
004
0.00
13
- 5
0.00
3 0.
0009
0.
009
5 0.
6232
0.
0416
0.
009
Hyd
rex-
AR
5
0.01
6 0.
0020
0.
076
5 0.
006
0.00
05
- 5
0.01
0 0.
0017
0.
076
5 1.
5441
0.
2193
0.
754
Jet-X
2
0.01
6 0.
0013
0.
245
2 0.
010
0.00
10
- 2
0.00
6 0.
0003
0.
053
2 0.
6562
0.
0336
0.
053
Silv
-Ex
2 0.
013
0.00
06
0.05
3 2
0.00
6 0.
0001
-
2 0.
007
0.00
06
0.05
3 2
1.21
29
0.09
22
0.69
9 A
NSU
L3%
5
0.01
2 0.
0024
0.
076
5 0.
005
0.00
15
- 5
0.00
7 0.
0011
0.
012
5 1.
3971
0.
2942
0.
917
Virt
ual
0 -
- -
0 -
- -
0 -
- -
0 -
- -
Phos
-Che
k 2
0.32
8 0.
3035
0.
439
2 0.
177
0.16
73
- 2
0.15
1 0.
1362
0.
012
2 1.
2408
0.
4045
1.
000
Bar
ricad
e 5
0.01
4 0.
0038
0.
076
5 0.
007
0.00
20
- 5
0.00
7 0.
0018
0.
076
5 1.
0193
0.
1088
0.
251
Cle
arET
I 5
0.02
4
0.01
5 0.
0019
0.
028
5
0.07
3
0.00
7 0.
0005
-
5
0.00
5
0.00
8 0.
0015
0.
028
5
0.01
7
1.17
10
0.14
87
0.46
5
Mel
aleu
ca th
ymoi
des
Con
trol
5 0.
015
0.00
45
- 5
0.00
5 0.
0010
-
5 0.
010
0.00
38
- 5
2.41
95
0.82
32
- C
hem
guar
d 4
0.00
7 0.
0041
0.
142
4 0.
004
0.00
22
- 4
0.00
3 0.
0019
0.
086
4 1.
1420
0.
2485
-
Hyd
rex-
AR
5
0.01
5 0.
0031
0.
754
5 0.
007
0.00
11
- 5
0.00
8 0.
0021
0.
917
5 1.
2285
0.
1613
-
Jet-X
3
0.01
0 0.
0013
0.
549
3 0.
003
0.00
06
- 3
0.00
7 0.
0020
0.
655
3 2.
7006
1.
3592
-
Silv
-Ex
4 0.
006
0.00
13
0.05
0 4
0.00
3 0.
0007
-
4 0.
003
0.00
07
0.05
0 4
1.33
10
0.22
65
- A
NSU
L3%
4
0.00
7 0.
0004
0.
027
4 0.
003
0.00
04
- 4
0.00
4 0.
0004
0.
142
4 1.
9448
0.
4936
-
Virt
ual
1 0.
007
- 0.
143
1 0.
003
- -
1 0.
004
- 0.
235
1 1.
3226
-
- Ph
os-C
hek
1 0.
160
- 0.
143
1 0.
060
- -
1 0.
100
- 0.
143
1 1.
6523
-
- B
arric
ade
5 0.
020
0.00
27
0.11
7 5
0.00
6 0.
0007
-
5 0.
014
0.00
22
0.46
5 5
2.15
13
0.23
17
- C
lear
ETI
5
0.01
7
0.01
4 0.
0019
0.
754
5
0.05
6
0.00
5 0.
0011
-
5
0.01
3
0.00
9 0.
0012
0.
917
5
0.49
0
1.84
40
0.33
31
-
davidleach
Typewritten Text
187
Page 202
Tabl
e 1
(con
tinue
d): S
tatis
tical
ana
lysi
s out
put f
or e
ffect
s of f
ire
supp
ress
ants
on
ex si
tu n
ativ
e se
edlin
g bi
omas
s (to
tal,
shoo
t, ro
ot, a
nd ro
ot:s
hoot
ratio
), by
spec
ie
(Kru
skal
-Wal
lis te
st an
d pl
anne
d M
ann-
Whi
tney
U te
st pa
irwi
se c
ompa
rison
s). G
reen
and
red
cells
den
ote
a si
gnifi
cant
(p<
0.05
) inc
reas
e or
dec
reas
e
(res
pect
ivel
y) c
ompa
red
the
cont
rol t
reat
men
t.
R
hago
dia
bacc
ata
T
otal
Bio
mas
s Sh
oot B
iom
ass
Roo
t Bio
mas
s R
oot:S
hoot
KW
Tes
t M
W-U
Tes
t K
W T
est
MW
-U T
est
KW
Tes
t M
W-U
Tes
t K
W T
est
MW
-U T
est
Trea
tmen
t N
p
Mea
n SE
p
N
p M
ean
SE
p N
p
Mea
n SE
p
N
p M
ean
SE
p C
ontro
l 5
0.01
3 0.
0029
-
5 0.
007
0.00
11
- 5
0.00
5 0.
0019
-
5 0.
7022
0.
1540
-
Che
mgu
ard
5 0.
014
0.00
51
- 5
0.00
5 0.
0014
-
5 0.
009
0.00
38
- 5
1.57
84
0.49
47
- H
ydre
x-A
R
4 0.
035
0.02
20
- 4
0.01
8 0.
0130
-
4 0.
017
0.00
93
- 4
1.39
89
0.60
85
- Je
t-X
3 0.
018
0.01
45
- 3
0.00
6 0.
0037
-
3 0.
012
0.01
08
- 3
1.02
65
0.71
51
- Si
lv-E
x 3
0.00
7 0.
0019
-
3 0.
004
0.00
11
- 3
0.00
2 0.
0011
-
3 0.
5306
0.
2039
-
AN
SUL3
%
5 0.
018
0.00
45
- 5
0.01
3 0.
0035
-
5 0.
006
0.00
11
- 5
0.52
47
0.09
84
- V
irtua
l 0
- -
- 0
- -
- 0
- -
- 0
- -
- Ph
os-C
hek
2 1.
120
0.07
95
- 2
0.40
7 0.
0253
-
2 0.
713
0.05
42
- 2
1.75
18
0.02
43
- B
arric
ade
4 0.
017
0.00
16
- 4
0.01
0 0.
0015
-
4 0.
006
0.00
14
- 4
0.65
99
0.18
33
- C
lear
ETI
5
0.21
6
0.02
0 0.
0081
-
5
0.11
4
0.01
3 0.
0056
-
5
0.27
4
0.00
7 0.
0028
-
5
0.41
6
1.14
36
0.69
59
-
davidleach
Typewritten Text
188
Page 203
davidleach
Typewritten Text
189
Page 204
Tabl
e 2:
Sta
tistic
al a
naly
sis o
utpu
t for
effe
cts o
f fir
e su
ppre
ssan
ts o
n ex
situ
wee
d se
edlin
g bi
omas
s (to
tal,
shoo
t, ro
ot, a
nd ro
ot:s
hoot
ratio
), by
spec
ie (K
rusk
al-
Wal
lis te
st an
d pl
anne
d M
ann-
Whi
tney
U te
st pa
irwi
se c
ompa
riso
ns).
Gre
en a
nd re
d ce
lls d
enot
e a
sign
ifica
nt (p
<0.
05) i
ncre
ase
or d
ecre
ase
(res
pect
ivel
y)
com
pare
d th
e co
ntro
l tre
atm
ent.
A
spar
agus
asp
arag
oide
s
Tot
al B
iom
ass
Shoo
t Bio
mas
s R
oot B
iom
ass
Roo
t:Sho
ot
K
W T
est
MW
-U T
est
KW
Tes
t M
W-U
Tes
t K
W T
est
MW
-U T
est
KW
Tes
t M
W-U
Tes
t Tr
eatm
ent
N
p M
ean
SE
p N
p
Mea
n SE
p
N
p M
ean
SE
p N
p
Mea
n SE
p
Con
trol
5 0.
052
0.00
18
- 5
0.00
8 0.
0005
-
5 0.
044
0.00
21
- 5
5.56
27
0.63
99
- C
hem
guar
d 5
0.03
4 0.
0073
0.
047
5 0.
005
0.00
10
0.02
8 5
0.02
9 0.
0064
0.
117
5 6.
3494
0.
6158
0.
465
Hyd
rex-
AR
5
0.07
0 0.
0079
0.
036
5 0.
011
0.00
18
0.07
6 5
0.05
9 0.
0074
0.
117
5 5.
6391
1.
0462
0.
465
Jet-X
5
0.03
3 0.
0037
0.
009
5 0.
006
0.00
10
0.04
7 5
0.02
7 0.
0028
0.
009
5 4.
8458
0.
4851
0.
347
Fire
Ade
5
0.03
1 0.
0043
0.
009
5 0.
005
0.00
04
0.00
9 5
0.02
7 0.
0040
0.
016
5 5.
8361
0.
6564
0.
602
Silv
-Ex
5 0.
038
0.00
31
0.02
8 5
0.00
5 0.
0007
0.
028
5 0.
033
0.00
28
0.04
7 5
6.42
43
0.76
43
0.60
2 A
NSU
L3%
5
0.07
4 0.
0063
0.
009
5 0.
010
0.00
18
0.46
5 5
0.06
5 0.
0052
0.
009
5 7.
6131
1.
4528
0.
347
Virt
ual
5 0.
021
0.00
32
0.00
9 5
0.00
3 0.
0003
0.
009
5 0.
019
0.00
31
0.00
9 5
7.70
98
1.35
35
0.17
5 Ph
os-C
hek
5 0.
052
0.00
67
0.60
2 5
0.02
2 0.
0054
0.
076
5 0.
030
0.00
20
0.00
9 5
1.83
52
0.58
56
0.00
9 B
arric
ade
5 0.
047
0.00
41
0.46
5 5
0.00
8 0.
0009
0.
917
5 0.
039
0.00
32
0.17
5 5
4.64
48
0.25
98
0.17
5 C
lear
ETI
5
0.00
0
0.05
1 0.
0034
0.
602
5
0.00
0
0.00
8 0.
0004
0.
249
5
0.00
0
0.04
4 0.
0031
0.
754
5
0.02
1
5.76
51
0.19
48
0.17
5
Ehr
hart
a ca
lyci
na
Con
trol
5 0.
034
0.00
74
- 5
0.01
2 0.
0019
-
5 0.
022
0.00
58
- 5
1.73
66
0.24
25
- C
hem
guar
d 5
0.04
5 0.
0146
0.
917
5 0.
014
0.00
31
0.75
4 5
0.03
1 0.
0116
0.
465
5 2.
1203
0.
2748
0.
465
Hyd
rex-
AR
5
0.13
0 0.
0154
0.
009
5 0.
045
0.00
35
0.00
9 5
0.08
5 0.
0139
0.
009
5 1.
9009
0.
2753
0.
917
Jet-X
5
0.03
4 0.
0045
0.
754
5 0.
010
0.00
11
0.25
1 5
0.02
4 0.
0034
0.
347
5 2.
4733
0.
1599
0.
047
Fire
Ade
5
0.02
5 0.
0031
0.
251
5 0.
008
0.00
09
0.17
5 5
0.01
8 0.
0022
0.
602
5 2.
2407
0.
1388
0.
117
Silv
-Ex
5 0.
034
0.00
35
0.91
7 5
0.01
1 0.
0010
0.
295
5 0.
023
0.00
27
0.46
5 5
2.18
04
0.24
99
0.25
1 A
NSU
L3%
5
0.10
1 0.
0194
0.
016
5 0.
038
0.00
70
0.00
9 5
0.06
2 0.
0149
0.
016
5 1.
6639
0.
3090
0.
754
Virt
ual
5 0.
050
0.01
11
0.46
5 5
0.01
3 0.
0025
0.
602
5 0.
037
0.00
91
0.17
5 5
2.73
59
0.39
06
0.02
8 Ph
os-C
hek
3 0.
171
0.07
69
0.02
5 3
0.07
6 0.
0338
0.
025
3 0.
095
0.04
31
0.05
3 3
1.24
80
0.07
08
0.10
1 B
arric
ade
5 0.
199
0.05
55
0.00
9 5
0.08
2 0.
0316
0.
009
5 0.
117
0.02
48
0.00
9 5
1.67
16
0.22
42
0.75
4 C
lear
ETI
5
0.00
0
0.03
8 0.
0039
0.
602
5
0.00
0
0.01
3 0.
0014
0.
917
5
0.00
0
0.02
6 0.
0030
0.
251
5
0.02
8
2.08
63
0.20
69
0.17
5
davidleach
Typewritten Text
190
Page 205
Tabl
e 2
(con
tinue
d)
G
ladi
olus
car
yoph
ylla
ceus
Tot
al B
iom
ass
Shoo
t Bio
mas
s R
oot B
iom
ass
Roo
t:Sho
ot
K
W T
est
MW
-U T
est
KW
Tes
t M
W-U
Tes
t K
W T
est
MW
-U T
est
KW
Tes
t M
W-U
Tes
t Tr
eatm
ent
N
p M
ean
SE
p N
p
Mea
n SE
p
N
p M
ean
SE
p N
p
Mea
n SE
p
Con
trol
5 0.
016
0.00
18
- 5
0.00
22
0.00
03
- 5
0.01
3 0.
0015
-
5 6.
1079
0.
1739
-
Che
mgu
ard
5 0.
013
0.00
21
0.75
4 5
0.00
21
0.00
04
- 5
0.01
1 0.
0018
0.
530
5 5.
0041
0.
5013
0.
175
Hyd
rex-
AR
5
0.01
7 0.
0028
0.
465
5 0.
0025
0.
0004
-
5 0.
015
0.00
24
0.46
5 5
5.72
69
0.42
21
0.46
5 Je
t-X
5 0.
011
0.00
20
0.07
6 5
0.00
23
0.00
04
- 5
0.00
9 0.
0018
0.
076
5 3.
7884
0.
5408
0.
009
Fire
Ade
4
0.00
9 0.
0005
0.
014
4 0.
0015
0.
0002
-
4 0.
007
0.00
06
0.01
4 4
5.04
30
0.79
12
0.22
1 Si
lv-E
x 5
0.01
1 0.
0006
0.
009
5 0.
0020
0.
0002
-
5 0.
009
0.00
05
0.00
9 5
4.50
60
0.27
89
0.00
9 A
NSU
L3%
5
0.02
0 0.
0016
0.
117
5 0.
0027
0.
0003
-
5 0.
018
0.00
15
0.07
6 5
6.81
74
0.82
93
0.75
4 V
irtua
l 0
- -
- 0
- -
- 0
- -
- 0
- -
- Ph
os-C
hek
1 0.
006
- 0.
143
1 0.
0025
-
- 1
0.00
3 -
0.14
3 1
1.30
00
- 0.
143
Bar
ricad
e 5
0.01
6 0.
0023
0.
917
5 0.
0025
0.
0002
-
5 0.
014
0.00
23
0.91
7 5
5.51
19
0.86
01
0.60
2 C
lear
ETI
5
0.00
6
0.01
9 0.
0025
0.
347
5
0.16
1
0.00
29
0.00
05
- 5
0.00
5
0.01
6 0.
0021
0.
347
5
0.02
9
6.20
80
1.02
76
0.34
7
Pela
rgon
ium
cap
itatu
m
Con
trol
5 0.
084
0.01
21
- 5
0.02
9 0.
0026
-
5 0.
055
0.00
99
- 5
1.89
94
0.21
55
- C
hem
guar
d 5
0.08
5 0.
0081
0.
754
5 0.
031
0.00
44
0.91
7 5
0.05
4 0.
0047
0.
917
5 1.
8224
0.
2113
-
Hyd
rex-
AR
5
0.15
0 0.
0148
0.
016
5 0.
052
0.00
30
0.00
9 5
0.09
8 0.
0141
0.
047
5 1.
9019
0.
2593
-
Jet-X
5
0.07
6 0.
0065
0.
917
5 0.
025
0.00
12
0.17
5 5
0.05
1 0.
0063
0.
917
5 2.
0653
0.
2502
-
Fire
Ade
5
0.06
9 0.
0053
0.
347
5 0.
022
0.00
12
0.07
6 5
0.04
8 0.
0050
0.
675
5 2.
2248
0.
2267
-
Silv
-Ex
5 0.
066
0.00
64
0.34
7 5
0.02
2 0.
0016
0.
076
5 0.
044
0.00
48
0.34
7 5
2.00
67
0.08
10
- A
NSU
L3%
5
0.12
9 0.
0077
0.
016
5 0.
051
0.00
41
0.00
9 5
0.07
9 0.
0053
0.
117
5 1.
5802
0.
1392
-
Virt
ual
4 0.
060
0.00
21
0.08
6 4
0.02
3 0.
0017
0.
086
4 0.
042
0.00
51
0.17
5 4
1.69
65
0.25
13
- Ph
os-C
hek
5 0.
507
0.08
96
0.00
9 5
0.20
3 0.
0273
0.
009
5 0.
304
0.06
47
0.00
9 5
1.45
52
0.15
84
- B
arric
ade
5 0.
164
0.02
08
0.01
6 5
0.05
9 0.
0028
0.
009
5 0.
105
0.01
85
0.04
7 5
1.74
69
0.23
83
- C
lear
ETI
5
0.00
0
0.07
0 0.
0058
0.
465
5
0.00
0
0.02
6 0.
0024
0.
465
5
0.00
0
0.04
4 0.
0037
0.
602
5
0.26
7
1.73
02
0.09
53
-
davidleach
Typewritten Text
191
Page 207
193
APPENDIX H
Statistical Analyses Output:
Suppressant Impact on Plant Communities
Table 1: Whiteman Park (Without-Fire)
Table 2: Wanneroo (With-Fire)
Page 208
194
Table 1: Statistical analysis output for effects of fire suppressants on density and growth
variables of field populations (by species) for the without-fire trial at Whiteman Park (Kruskal-
Wallis test and planned Mann-Whitney U test pairwise comparisons). Green and red cells
denote a significant (p<0.05) increase or decrease (respectively) compared to dry control (p vs
D) and wet control (p vs W). Yellow cells denote type-I errors, determined by overlapping
standard errors of means. Species names preceded by ‘*’ denote non-native species. Table
continues across double page and continues over next pages.
Species: Alexgeorgea nitens (Nees) L.A.S.Johnson & B.G.Briggs Continues → → →
Abundance Cover KW MW-U Tests KW MW-U Tests KW Test SE p p Test SE p p Test
Time Treatment
p M -/+ N vs D vs W p M -/+ N vs D vs W p Dry Control 0.000 0.085 30 - - 0.000 2.353 21 - - Wet Control 0.000 0.089 30 - - 0.000 1.265 19 - - Chemguard 0.000 0.063 30 - - 0.000 1.215 26 - - Hydrex-AR 0.000 0.069 30 - - 0.000 1.984 25 - - Jet-X 0.000 0.082 30 - - 0.000 0.469 22 - - Silv-Ex 0.000 0.074 30 - - 0.000 1.880 24 - - ANSUL3% 0.000 0.069 30 - - 0.000 1.602 25 - - Virtual 0.000 0.089 30 - - 0.000 0.638 19 - - Phos-Chek 0.000 0.056 30 - - 0.000 2.177 27 - - Barricade 0.000 0.056 30 - - 0.000 3.818 27 - -
0-M
onth
s
ClearETI
-
0.000 0.093 30 - -
-
0.000 1.180 16 - -
-
Dry Control -0.033 0.088 30 - 0.000 4.905 3.989 20 - 0.892 Wet Control 0.033 0.088 30 0.000 - 0.300 1.242 20 0.892 - Chemguard -0.067 0.074 30 0.001 0.001 2.159 1.249 24 0.524 0.395 Hydrex-AR 0.100 0.046 30 0.007 0.007 -0.076 1.889 28 0.818 0.121 Jet-X -0.033 0.085 30 0.000 0.000 1.937 0.831 21 0.361 0.063 Silv-Ex -0.100 0.085 30 0.000 0.000 5.009 3.467 21 0.754 0.657 ANSUL3% -0.167 0.088 30 0.000 0.000 -0.800 1.279 20 0.829 0.356 Virtual 0.000 0.089 30 0.000 0.788 2.147 0.782 19 0.431 0.017 Phos-Chek -0.033 0.063 30 0.003 0.003 -1.238 1.545 26 0.464 0.214 Barricade 0.000 0.056 30 0.004 0.004 -2.333 3.366 27 0.116 0.203
4-M
onth
s
ClearETI
0.000
-0.100 0.092 30 0.091 0.091
0.047
0.934 1.809 13 0.740 0.739
0.172
Dry Control 0.000 0.085 30 - 0.000 4.405 3.654 21 - 0.791 Wet Control 0.067 0.085 30 0.000 - 2.619 1.871 21 0.791 - Chemguard 0.000 0.063 30 0.001 0.001 3.442 1.557 26 0.521 0.966 Hydrex-AR -0.033 0.074 30 0.000 0.000 2.127 2.371 24 0.927 0.096 Jet-X 0.033 0.079 30 0.000 0.000 1.519 0.850 23 0.403 0.403 Silv-Ex 0.067 0.063 30 0.001 0.001 9.566 4.466 26 0.732 0.391 ANSUL3% -0.133 0.085 30 0.000 0.000 -0.889 1.051 21 0.830 0.231 Virtual 0.133 0.079 30 0.000 0.563 3.877 2.738 23 0.473 0.253 Phos-Chek -0.033 0.063 30 0.001 0.001 -3.084 1.230 26 0.274 0.007 Barricade 0.000 0.056 30 0.001 0.001 -1.259 3.760 27 0.132 0.086
12-M
onth
s
ClearETI
0.000
0.067 0.091 30 0.002 0.002
0.003
-0.729 0.850 18 0.977 0.365
0.001
Page 209
195
Analysis Notes: Clonal species; abundance scored as "1" plant when recorded within a quadrat. Growth variables (Cover, Leading Shoot Length, Condition, and Reproduction) have not been centred due to low Ns at 0 and 3 months.
Leading Shoot Length Condition Reproduction MW-U Tests KW MW-U Tests KW MW-U Tests
SE p p Test SE p p Test SE p p M -/+ N vs D vs W p M -/+ N vs D vs W p M -/+ N vs D vs W
0.000 0.764 21 - - 0.000 0.074 21 - - 0.000 0.101 21 - - 0.000 1.243 19 - - 0.000 0.058 19 - - 0.000 0.110 19 - - 0.000 0.679 26 - - 0.000 0.067 26 - - 0.000 0.084 26 - - 0.000 0.726 25 - - 0.000 0.078 25 - - 0.000 0.075 25 - - 0.000 0.665 22 - - 0.000 0.091 22 - - 0.000 0.105 22 - - 0.000 0.807 24 - - 0.000 0.089 24 - - 0.000 0.104 24 - - 0.000 1.033 25 - - 0.000 0.071 25 - - 0.000 0.055 25 - - 0.000 0.916 19 - - 0.000 0.103 19 - - 0.000 0.110 19 - - 0.000 0.716 27 - - 0.000 0.061 27 - - 0.000 0.062 27 - - 0.000 0.775 27 - - 0.000 0.061 27 - - 0.000 0.095 27 - - 0.000 1.079 16 - -
-
0.000 0.161 16 - -
-
0.000 0.125 16 - - -0.491 1.079 20 - - -0.262 0.120 20 - 0.000 0.136 0.082 20 - 0.546 -3.450 0.857 20 - - -0.446 0.057 20 0.000 - -0.334 0.109 20 0.546 - -0.820 0.567 24 - - -0.378 0.094 24 0.166 0.264 -0.144 0.101 24 0.000 0.269 -0.630 0.914 28 - - 0.059 0.107 28 0.001 0.000 -0.197 0.092 28 0.000 0.315 -0.197 1.107 21 - - -0.106 0.080 21 0.626 0.000 -0.208 0.111 21 0.868 0.001 -0.393 0.901 21 - - -0.238 0.066 21 0.034 0.000 0.066 0.112 21 0.270 0.000 -1.920 0.764 20 - - 0.030 0.077 20 0.000 0.000 -0.120 0.092 20 0.000 0.819 -1.316 0.822 19 - - 0.132 0.093 19 0.006 0.000 0.105 0.096 19 0.000 0.006 -0.744 0.677 26 - - -0.358 0.103 26 0.820 0.481 -0.197 0.092 26 0.000 0.546 -0.926 0.749 27 - - -0.204 0.082 27 0.080 0.000 0.185 0.076 27 0.000 0.000 -0.082 0.914 13 - -
0.000
-0.084 0.115 13 0.199 0.080
0.000
0.010 0.140 13 0.810 0.004 -0.143 0.849 21 - 0.048 -0.190 0.163 21 - 0.119 0.238 0.048 21 - 0.028 -2.952 1.222 21 0.048 - -0.516 0.127 21 0.119 - -0.018 0.105 21 0.028 - 0.923 0.550 26 0.357 0.002 -0.769 0.104 26 0.003 0.005 0.154 0.053 26 0.000 0.014 -1.588 0.688 24 0.254 0.106 -0.162 0.099 24 0.280 0.112 -0.048 0.085 24 0.000 0.004 -0.038 1.222 23 0.787 0.068 -0.316 0.104 23 0.099 0.119 -0.115 0.106 23 0.588 0.033 0.314 0.808 26 0.534 0.010 -0.237 0.124 26 0.261 0.052 0.196 0.095 26 0.033 0.001 -3.968 1.090 21 0.011 0.890 -0.268 0.097 21 0.246 0.094 -0.253 0.105 21 0.000 0.001 -0.005 1.191 23 0.502 0.072 0.122 0.099 23 0.151 0.001 0.011 0.098 23 0.010 0.838 -2.551 0.575 26 0.015 0.357 -1.531 0.104 26 0.000 0.000 -0.120 0.084 26 0.000 0.003 0.630 1.389 27 0.747 0.023 -0.019 0.108 27 0.941 0.002 0.222 0.070 27 0.000 0.000 -0.313 0.856 18 0.631 0.067
0.000
0.365 0.146 18 0.017 0.002
0.000
0.292 0.114 18 0.033 0.002
Page 210
196
Table 1: Statistical analysis output for effects of fire suppressants on density and growth
variables of field populations (by species) for the without-fire trial at Whiteman Park (Kruskal-
Wallis test and planned Mann-Whitney U test pairwise comparisons). Green and red cells
denote a significant (p<0.05) increase or decrease (respectively) compared to dry control (p vs
D) and wet control (p vs W). Yellow cells denote type-I errors, determined by overlapping
standard errors of means. Species names preceded by ‘*’ denote non-native species. Table
continues across double page and continues over next pages.
Species: Burchardia congesta Lindl.
Continues → → →
Abundance Cover KW MW-U Tests KW MW-U Tests KW Test SE p p Test SE p p Test
Time Treatment
p M -/+ N vs D vs W p M -/+ N vs D vs W p Dry Control 0.000 0.000 30 - - - - - - - Wet Control 0.000 0.046 30 - - 0.300 0.200 2 - - Chemguard 0.000 0.084 30 - - 0.125 0.025 4 - - Hydrex-AR 0.000 0.063 30 - - 0.150 0.050 4 - - Jet-X 0.000 0.000 30 - - - - - - - Silv-Ex 0.000 0.033 30 - - 1.200 - 1 - - ANSUL3% 0.000 0.046 30 - - 0.100 0.000 2 - - Virtual 0.000 0.079 30 - - 0.217 0.017 3 - - Phos-Chek 0.000 0.046 30 - - 0.200 0.000 2 - - Barricade 0.000 0.056 30 - - 0.767 0.617 3 - -
0-M
onth
s
ClearETI
-
0.000 0.056 30 - -
-
0.133 0.033 3 - -
-
Dry Control 0.767 0.257 30 - 0.068 0.112 0.009 11 - - Wet Control 2.633 0.508 30 0.068 - 0.115 0.006 22 - - Chemguard 2.467 0.670 30 0.844 0.042 0.126 0.013 18 - - Hydrex-AR 1.700 0.530 30 0.091 0.002 0.115 0.009 13 - - Jet-X 2.267 0.579 30 0.027 0.917 0.117 0.011 19 - - Silv-Ex 2.400 0.619 30 0.565 0.929 0.108 0.004 16 - - ANSUL3% 1.900 0.574 30 0.107 0.064 0.110 0.004 13 - - Virtual 0.800 0.275 30 0.005 0.000 0.106 0.004 11 - - Phos-Chek 1.800 0.335 30 0.200 0.303 0.103 0.002 22 - - Barricade 1.100 0.370 30 0.062 0.000 0.105 0.004 13 - -
4-M
onth
s
ClearETI
0.000
2.600 0.458 30 0.239 0.357
0.732
0.110 0.004 19 - -
0.650
Dry Control 0.233 0.114 30 - 0.244 0.100 0.000 5 - 0.049 Wet Control 1.400 0.386 30 0.244 - 0.133 0.010 13 0.049 - Chemguard 1.567 0.484 30 0.225 0.025 0.100 0.000 13 1.000 0.003 Hydrex-AR 1.567 0.404 30 0.466 0.055 0.113 0.010 14 0.385 0.052 Jet-X 1.733 0.557 30 0.021 0.020 0.138 0.033 12 0.235 0.148 Silv-Ex 1.833 0.535 30 0.393 0.014 0.103 0.002 14 0.385 0.013 ANSUL3% 1.033 0.293 30 0.181 0.725 0.103 0.002 13 0.367 0.017 Virtual 0.900 0.286 30 0.191 0.005 0.126 0.011 13 0.118 0.501 Phos-Chek 0.800 0.266 30 0.021 0.371 0.108 0.005 11 0.325 0.049 Barricade 1.367 0.367 30 0.988 0.083 0.104 0.003 16 0.418 0.011
12-M
onth
s
ClearETI
0.001
2.167 0.442 30 0.028 0.869
0.022
0.104 0.003 21 0.379 0.006
0.152
Page 211
197
Analysis Notes: Growth data (Cover, Leading Shoot Length, Condition, and Reproduction) not centred; high variance would result in unreliable data centring (type I errors).
Leading Shoot Length Condition Reproduction MW-U Tests KW MW-U Tests KW MW-U Tests
SE p p Test SE p p Test SE p p M -/+ N vs D vs W p M -/+ N vs D vs W p M -/+ N vs D vs W - - - - - - - - - - - - - - -
63.500 5.500 2 - - 1.250 0.250 2 - - 1.000 0.000 2 - - 49.000 5.986 4 - - 1.125 0.125 4 - - 1.000 0.000 4 - - 42.000 8.124 4 - - 1.000 0.000 4 - - 1.000 0.000 4 - -
- - - - - - - - - - - - - - - 58.000 - 1 - - 1.000 - 1 - - 1.000 - 1 - - 39.500 8.500 2 - - 1.000 0.000 2 - - 0.500 0.500 2 - - 52.500 5.530 3 - - 1.167 0.167 3 - - 1.000 0.000 3 - - 45.500 3.500 2 - - 1.500 0.000 2 - - 1.000 0.000 2 - - 51.000 2.082 3 - - 1.500 0.289 3 - - 1.000 0.000 3 - - 28.333 7.535 3 - -
-
1.500 0.500 3 - -
-
0.333 0.333 3 - - 27.674 3.153 11 - - 2.814 0.294 11 - - 0.045 0.032 11 - - 33.917 2.472 22 - - 3.137 0.081 22 - - 0.064 0.032 22 - - 29.558 2.358 18 - - 3.208 0.106 18 - - 0.116 0.057 18 - - 30.995 2.901 13 - - 2.999 0.096 13 - - 0.000 0.000 13 - - 33.583 3.696 19 - - 4.972 1.670 19 - - 0.032 0.027 19 - - 32.624 3.322 16 - - 3.287 0.146 16 - - 0.062 0.034 16 - - 28.393 2.913 13 - - 3.145 0.134 13 - - 0.028 0.020 13 - - 30.950 4.272 11 - - 3.273 0.173 11 - - 0.023 0.023 11 - - 27.503 2.066 22 - - 2.942 0.132 22 - - 0.017 0.017 22 - - 25.955 2.203 13 - - 2.944 0.155 13 - - 0.000 0.000 13 - - 28.432 2.454 19 - -
0.513
3.119 0.070 19 - -
0.063
0.011 0.011 19 - - 32.933 8.980 5 - - 1.967 0.812 5 - - 0.400 0.245 5 - 0.289 25.181 1.980 13 - - 3.139 0.156 13 - - 0.069 0.042 13 0.289 - 28.716 3.402 13 - - 2.536 0.337 13 - - 0.220 0.104 13 0.693 0.331 24.246 2.173 14 - - 2.726 0.183 14 - - 0.095 0.074 14 0.193 0.668 22.909 2.006 12 - - 3.106 0.092 12 - - 0.000 0.000 12 0.024 0.083 24.468 2.714 14 - - 2.741 0.251 14 - - 0.137 0.072 14 0.680 0.370 22.141 2.759 13 - - 3.244 0.126 13 - - 0.000 0.000 13 0.019 0.072 22.527 1.980 13 - - 3.022 0.146 13 - - 0.026 0.026 13 0.081 0.307 17.702 1.200 11 - - 2.886 0.173 11 - - 0.000 0.000 11 0.030 0.096 22.791 1.514 16 - - 3.153 0.119 16 - - 0.000 0.000 16 0.009 0.047 19.159 1.456 21 - -
0.144
2.891 0.090 21 - -
0.000
0.012 0.012 21 0.022 0.113
Page 212
198
Table 1: Statistical analysis output for effects of fire suppressants on density and growth
variables of field populations (by species) for the without-fire trial at Whiteman Park (Kruskal-
Wallis test and planned Mann-Whitney U test pairwise comparisons). Green and red cells
denote a significant (p<0.05) increase or decrease (respectively) compared to dry control (p vs
D) and wet control (p vs W). Yellow cells denote type-I errors, determined by overlapping
standard errors of means. Species names preceded by ‘*’ denote non-native species. Table
continues across double page and continues over next pages.
Species: Calytrix flavscens A.Cunn.
Continues → → →
Abundance Cover KW MW-U Tests KW MW-U Tests KW Test SE p p Test SE p p Test
Time Treatment
p M -/+ N vs D vs W p M -/+ N vs D vs W p Dry Control 0.000 0.056 30 - - 0.533 0.260 3 - - Wet Control 0.000 0.046 30 - - 1.150 0.850 2 - - Chemguard 0.000 0.150 30 - - 1.078 0.291 10 - - Hydrex-AR 0.000 0.201 30 - - 2.517 1.465 9 - - Jet-X 0.000 0.260 30 - - 3.736 0.816 16 - - Silv-Ex 0.000 0.056 30 - - 2.167 1.014 3 - - ANSUL3% 0.000 0.092 30 - - 2.100 0.572 6 - - Virtual 0.000 0.130 30 - - - - - - - Phos-Chek 0.000 0.243 30 - - 5.580 1.266 7 - - Barricade 0.000 0.202 30 - - 4.129 1.490 7 - -
0-M
onth
s
ClearETI
-
0.000 0.216 30 - -
-
2.993 0.493 10 - -
-
Dry Control 0.033 0.079 30 - 0.000 1.717 1.446 3 - - Wet Control 0.033 0.056 30 0.000 - 0.833 0.289 3 - - Chemguard -
0.067 0.124 30 0.006 0.007 2.430 1.697 10 - -
Hydrex-AR -0.033
0.202 30 0.000 0.000 3.138 2.843 8 - - Jet-X -
0.033 0.288 30 0.028 0.030 2.881 2.474 14 - -
Silv-Ex 0.033 0.063 30 0.730 0.000 2.375 2.056 4 - - ANSUL3% -
0.033 0.101 30 0.000 0.000 1.775 1.461 4 - -
Virtual -0.267
0.046 30 0.000 0.000 - - - - - Phos-Chek -
0.200 0.143 30 0.000 0.000 2.525 1.393 5 - -
Barricade -0.100
0.163 30 0.000 0.000 3.028 2.000 6 - -
4-M
onth
s
ClearETI
0.000
-0.033
0.212 30 0.002 0.002
0.496
3.489 1.836 9 - -
0.603
Dry Control 0.000 0.056 30 - 0.000 1.100 0.493 3 - - Wet Control 0.000 0.046 30 0.000 - 2.500 1.500 2 - - Chemguard -
0.100 0.132 30 0.001 0.002 2.365 0.500 9 - -
Hydrex-AR -0.067
0.184 30 0.002 0.002 3.093 0.962 9 - - Jet-X -
0.200 0.254 30 0.001 0.001 2.988 0.397 14 - -
Silv-Ex 0.167 0.095 30 0.160 0.000 2.929 0.759 7 - - ANSUL3% 0.133 0.102 30 0.005 0.007 5.000 2.167 10 - - Virtual 0.033 0.112 30 0.001 0.002 - - - - - Phos-Chek 0.267 0.267 30 0.010 0.012 4.877 1.814 10 - - Barricade 0.033 0.208 30 0.000 0.000 2.923 0.566 8 - -
12-M
onth
s
ClearETI
0.000
0.067 0.239 30 0.003 0.003
0.769
3.794 0.894 9 - -
0.537
Page 213
199
Analysis Notes: Growth data (Cover, Leading Shoot Length, Condition, and Reproduction) not centred; high variance would result in unreliable data centring (type I errors). Virtual excluded; insufficient Ns.
Leading Shoot Length Condition Reproduction MW-U Tests KW MW-U Tests KW MW-U Tests
SE p p Test SE p p Test SE p p M -/+ N vs D vs W p M -/+ N vs D vs W p M -/+ N vs D vs W
16.000 1.528 3 - - 3.167 0.167 3 - - 0.000 0.000 3 - - 23.000 1.000 2 - - 3.250 0.250 2 - - 0.500 0.500 2 - - 19.317 2.319 10 - - 3.217 0.164 10 - - 0.100 0.100 10 - - 19.194 2.479 9 - - 3.394 0.145 9 - - 0.407 0.165 9 - - 25.875 2.149 16 - - 3.492 0.092 16 - - 0.245 0.083 16 - - 23.333 3.667 3 - - 3.000 0.000 3 - - 0.333 0.333 3 - - 24.083 4.196 6 - - 3.333 0.211 6 - - 0.583 0.201 6 - -
- - - - - - - - - - - - - - - 31.786 3.512 7 - - 3.306 0.143 7 - - 0.724 0.147 7 - - 23.343 2.103 7 - - 3.243 0.134 7 - - 0.286 0.184 7 - - 21.790 2.490 10 - -
-
3.388 0.140 10 - -
-
0.340 0.129 10 - - 20.167 3.329 3 - - 2.167 0.289 3 - 0.239 0.000 0.000 3 - - 20.000 5.196 3 - - 2.667 0.577 3 0.239 - 0.000 0.000 3 - - 20.600 6.649 10 - - 3.250 0.408 10 0.012 0.107 0.000 0.000 10 - - 20.479 5.049 8 - - 3.396 0.358 8 0.014 0.036 0.115 0.240 8 - - 22.506 7.988 14 - - 3.432 0.543 14 0.008 0.027 0.071 0.182 14 - - 22.000 13.589 4 - - 3.375 0.479 4 0.031 0.119 0.000 0.000 4 - - 17.250 7.136 4 - - 3.375 0.595 4 0.032 0.271 0.000 0.000 4 - -
- - - - - - - - - - - - - - - 22.450 4.460 5 - - 1.950 1.067 5 0.651 0.266 0.000 0.000 5 - - 19.000 3.432 6 - - 3.139 0.328 6 0.019 0.291 0.000 0.000 6 - - 25.583 5.328 9 - -
0.008
3.315 0.242 9 0.009 0.036
0.539
0.056 0.167 9 - - 25.333 1.764 3 - - 2.167 0.333 3 - 0.197 0.000 0.000 3 - - 20.000 1.000 2 - - 3.000 0.500 2 0.197 - 0.000 0.000 2 - - 22.519 2.147 9 - - 2.583 0.186 9 0.246 0.394 0.037 0.037 9 - - 21.046 1.843 9 - - 2.940 0.183 9 0.049 1.000 0.028 0.028 9 - - 24.506 2.453 14 - - 2.967 0.111 14 0.022 1.000 0.036 0.036 14 - - 24.643 3.594 7 - - 3.071 0.297 7 0.080 1.000 0.000 0.000 7 - - 27.700 7.758 10 - - 3.125 0.221 10 0.078 0.910 0.100 0.100 10 - -
- - - - - - - - - - - - - - - 28.071 2.613 10 - - 1.719 0.351 10 0.609 0.105 0.000 0.000 10 - - 24.917 2.627 8 - - 2.733 0.430 8 0.152 0.896 0.075 0.075 8 - - 25.744 1.999 9 - -
0.013
3.072 0.198 9 0.030 1.000
0.926
0.000 0.000 9 - -
Page 214
200
Table 1: Statistical analysis output for effects of fire suppressants on density and growth
variables of field populations (by species) for the without-fire trial at Whiteman Park (Kruskal-
Wallis test and planned Mann-Whitney U test pairwise comparisons). Green and red cells
denote a significant (p<0.05) increase or decrease (respectively) compared to dry control (p vs
D) and wet control (p vs W). Yellow cells denote type-I errors, determined by overlapping
standard errors of means. Species names preceded by ‘*’ denote non-native species. Table
continues across double page and continues over next pages.
Species: Dampiera linearis R.Br.
Continues → → →
Abundance Cover KW MW-U Tests KW MW-U Tests KW Test SE p p Test SE p p Test
Time Treatment
p M -/+ N vs D vs W p M -/+ N vs D vs W p Dry Control 0.000 0.613 30 - - 0.000 0.013 9 - - Wet Control 0.000 0.188 30 - - 0.000 0.025 3 - - Chemguard - - - - - Hydrex-AR 0.000 0.229 30 - - 0.000 0.008 6 - - Jet-X - - - - - - - - - - Silv-Ex 0.000 0.277 30 - - 0.000 0.021 5 - - ANSUL3% 0.000 0.084 30 - - 0.000 0.218 4 - - Virtual 0.000 0.282 30 - - 0.000 0.038 4 - - Phos-Chek 0.000 0.519 30 - - 0.000 0.028 5 - - Barricade 0.000 0.560 30 - - 0.000 0.021 7 - -
0-M
onth
s
ClearETI
-
0.000 0.597 30 - -
-
0.000 0.026 17 - -
-
Dry Control -0.400
0.392 30 - 0.001 0.000 0.006 10 - 0.662 Wet Control -
0.133 0.139 30 0.001 - -0.033 0.050 2 0.662 -
Chemguard - - - - - - - - - - Hydrex-AR -
0.033 0.190 30 0.000 0.000 0.024 0.021 6 0.584 0.390
Jet-X - - - - - - - - - - Silv-Ex 0.000 0.260 30 0.001 0.000 -0.030 0.018 7 0.138 0.539 ANSUL3% 0.167 0.154 30 0.000 0.000 -0.007 0.167 5 0.064 0.439 Virtual -
0.233 0.147 30 0.000 0.000 -0.060 0.013 2 0.029 1.000
Phos-Chek -0.533
0.313 30 0.005 0.000 -0.076 0.013 5 0.002 0.439 Barricade -
0.133 0.446 30 0.002 0.000 -0.081 0.027 8 0.007 0.186
4-M
onth
s
ClearETI
0.000
-0.967
0.441 30 0.020 0.000
0.000
-0.067 0.003 15 0.000 1.000
0.002
Dry Control -0.100
0.533 30 - 0.000 0.005 0.011 8 - 0.215 Wet Control 0.033 0.206 30 0.000 - -0.042 0.043 3 0.215 - Chemguard - - - - - - - - - - Hydrex-AR -
0.200 0.143 30 0.001 0.000 0.192 0.176 5 0.459 0.169
Jet-X - - - - - - - - - - Silv-Ex -
0.467 0.108 30 0.001 0.000 -0.028 0.033 3 0.214 0.825
ANSUL3% 0.100 0.106 30 0.001 0.000 -0.250 0.000 6 0.001 0.006 Virtual 0.033 0.283 30 0.000 0.000 0.009 0.035 5 0.768 0.453 Phos-Chek -
0.833 0.237 30 0.001 0.000 -0.112 0.018 4 0.006 0.067
Barricade -0.500
0.298 30 0.000 0.000 -0.107 0.007 8 0.001 0.091
12-M
onth
s
ClearETI
0.000
-1.600
0.302 30 0.000 0.000
0.000
-0.029 0.056 17 0.004 0.403
0.007
Page 215
201
Analysis Notes: Chemguard and Jet-X excluded; insufficient Ns.
Leading Shoot Length Condition Reproduction MW-U Tests KW MW-U Tests KW MW-U Tests
SE p p Test SE p p Test SE p p M -/+ N vs D vs W p M -/+ N vs D vs W p M -/+ N vs D vs W
0.000 2.491 9 - - 0.000 0.112 9 - - 0.000 0.000 9 - - 0.000 4.243 3 - - 0.000 0.150 3 - - 0.000 0.000 3 - -
- 0.000 5.538 6 - - 0.000 0.083 6 - - 0.000 0.000 6 - -
- - - - - - - - - - - - - - - 0.000 4.655 5 - - 0.000 0.132 5 - - 0.000 0.000 5 - - 0.000 14.614 4 - - 0.000 0.157 4 - - 0.000 0.000 4 - - 0.000 8.086 4 - - 0.000 0.314 4 - - 0.000 0.000 4 - - 0.000 2.435 5 - - 0.000 0.098 5 - - 0.000 0.000 5 - - 0.000 1.315 7 - - 0.000 0.101 7 - - 0.000 0.000 7 - - 0.000 1.490 17 - -
-
0.000 0.102 17 - -
-
0.000 0.000 17 - - -1.143 1.370 10 - 0.662 0.015 0.112 10 - - 0.050 0.036 10 - - -2.611 5.333 2 0.662 - -0.208 0.500 2 - - 0.000 0.000 2 - -
- - - - - - - - - - - - - - - -8.444 5.463 6 0.584 0.390 0.007 0.381 6 - - 0.000 0.000 6 - -
- - - - - - - - - - - - - - - -4.192 4.967 7 0.138 0.539 -0.231 0.291 7 - - 0.143 0.143 7 - -
-25.942
2.576 5 0.064 0.439 0.113 0.331 5 - - 0.000 0.000 5 - - -
15.771 0.625 2 0.029 1.000 0.484 0.313 2 - - 0.000 0.000 2 - -
-9.721 2.715 5 0.002 0.439 -0.020 0.188 5 - - 0.150 0.100 5 - - -6.685 2.306 8 0.007 0.186 -0.097 0.132 8 - - 0.151 0.065 8 - - -3.299 1.441 15 0.000 1.000
0.929
-0.107 0.145 15 - -
0.250
0.043 0.034 15 - - 0.435 2.330 8 - 0.215 -0.582 0.226 8 - - 0.047 0.033 8 - - 0.389 6.173 3 0.215 - -0.708 0.505 3 - - 0.000 0.000 3 - -
- - - - - - - - - - - - - - - 3.211 8.669 5 0.459 0.169 -0.583 0.224 5 - - 0.000 0.000 5 - -
- - - - - - - - - - - - - - - -5.652 8.661 3 0.214 0.825 0.069 0.588 3 - - 0.000 0.000 3 - - -3.458 1.846 6 0.001 0.006 0.354 0.262 6 - - 0.000 0.000 6 - - -3.546 4.034 5 0.768 0.453 -0.395 0.435 5 - - 0.000 0.000 5 - - -7.015 4.541 4 0.006 0.067 -0.572 1.021 4 - - 0.286 0.240 4 - - -7.730 1.954 8 0.001 0.091 -0.644 0.188 8 - - 0.000 0.000 8 - - -6.170 2.441 17 0.004 0.403
0.585
-0.721 0.377 17 - -
0.075
0.192 0.086 17 - -
Page 216
202
Table 1: Statistical analysis output for effects of fire suppressants on density and growth
variables of field populations (by species) for the without-fire trial at Whiteman Park (Kruskal-
Wallis test and planned Mann-Whitney U test pairwise comparisons). Green and red cells
denote a significant (p<0.05) increase or decrease (respectively) compared to dry control (p vs
D) and wet control (p vs W). Yellow cells denote type-I errors, determined by overlapping
standard errors of means. Species names preceded by ‘*’ denote non-native species. Table
continues across double page and continues over next pages.
Species: Desmocladus flexuosus (R.Br.) B.G.Briggs & L.A.S.Johnson Continues → → →
Abundance Cover KW MW-U Tests KW MW-U Tests KW Test SE p p Test SE p p Test
Time Treatment
p M -/+ N vs D vs W p M -/+ N vs D vs W p Dry Control 0.000 0.085 30 - - 0.000 2.221 9 - - Wet Control 0.000 0.088 30 - - 0.000 1.497 10 - - Chemguard 0.000 0.082 30 - - 0.000 0.409 8 - - Hydrex-AR 0.000 0.085 30 - - 0.000 1.969 9 - - Jet-X 0.000 0.063 30 - - 0.000 0.866 4 - - Silv-Ex 0.000 0.088 30 - - 0.000 2.702 10 - - ANSUL3% 0.000 0.082 30 - - 0.000 3.063 8 - - Virtual 0.000 0.091 30 - - 0.000 0.509 12 - - Phos-Chek 0.000 0.091 30 - - 0.000 0.494 12 - - Barricade 0.000 0.088 30 - - 0.000 2.823 10 - -
0-M
onth
s
ClearETI
-
0.000 0.092 30 - -
-
0.000 1.499 17 - -
-
Dry Control 0.000 0.085 30 - 0.001 0.778 2.089 9 - - Wet Control 0.033 0.089 30 0.001 - 1.664 1.883 11 - - Chemguard -0.033 0.079 30 0.000 0.002 2.446 1.172 7 - - Hydrex-AR 0.133 0.092 30 0.288 0.000 2.607 1.760 13 - - Jet-X 0.033 0.069 30 0.000 0.006 6.800 5.576 5 - - Silv-Ex 0.000 0.088 30 0.000 0.788 -0.100 1.542 10 - - ANSUL3% 0.000 0.082 30 0.000 0.001 9.375 5.745 8 - - Virtual -0.133 0.082 30 0.000 0.000 3.792 2.816 8 - - Phos-Chek 0.000 0.091 30 0.002 0.001 5.000 2.229 12 - - Barricade -0.033 0.085 30 0.000 0.587 3.940 2.939 9 - -
4-M
onth
s
ClearETI
0.000
0.000 0.092 30 0.152 0.051
0.901
3.941 2.192 17 - -
0.172
Dry Control 0.100 0.091 30 - 0.002 1.306 2.391 12 - - Wet Control 0.133 0.093 30 0.002 - -1.414 1.060 14 - - Chemguard 0.067 0.088 30 0.001 0.009 1.145 1.051 10 - - Hydrex-AR 0.100 0.091 30 1.000 0.002 7.556 4.878 12 - - Jet-X 0.067 0.074 30 0.012 0.076 4.417 3.446 6 - - Silv-Ex 0.000 0.088 30 0.000 0.296 10.900 5.385 10 - - ANSUL3% 0.167 0.092 30 0.000 0.001 14.106 5.330 13 - - Virtual -0.033 0.089 30 0.000 0.000 1.655 1.053 11 - - Phos-Chek -0.100 0.085 30 0.000 0.000 3.700 2.671 9 - - Barricade 0.000 0.088 30 0.000 0.296 7.140 4.991 10 - -
12-M
onth
s
ClearETI
0.000
0.033 0.091 30 0.053 0.013
0.257
3.709 2.513 18 - -
0.214
Page 217
203
Analysis Notes: None.
Leading Shoot Length Condition Reproduction MW-U Tests KW MW-U Tests KW MW-U Tests
SE p p Test SE p p Test SE p p M -/+ N vs D vs W p M -/+ N vs D vs W p M -/+ N vs D vs W
0.000 4.440 9 - - 0.000 0.083 9 - - 0.000 0.000 9 - - 0.000 2.055 10 - - 0.000 0.105 10 - - 0.000 0.000 10 - - 0.000 2.658 8 - - 0.000 0.230 8 - - 0.000 0.164 8 - - 0.000 3.011 9 - - 0.000 0.256 9 - - 0.000 0.167 9 - - 0.000 4.423 4 - - 0.000 0.315 4 - - 0.000 0.000 4 - - 0.000 2.549 10 - - 0.000 0.105 10 - - 0.000 0.133 10 - - 0.000 1.747 8 - - 0.000 0.183 8 - - 0.000 0.189 8 - - 0.000 1.991 12 - - 0.000 0.125 12 - - 0.000 0.083 12 - - 0.000 1.555 12 - - 0.000 0.087 12 - - 0.000 0.000 12 - - 0.000 1.869 10 - - 0.000 0.153 10 - - 0.000 0.163 10 - - 0.000 1.610 17 - -
-
0.000 0.060 17 - -
-
0.000 0.106 17 - - -4.111 2.944 9 - -0.111 0.182 9 - 0.769 0.333 0.167 9 - 0.043 -2.064 1.983 11 - -0.045 0.171 11 0.769 - 0.000 0.000 11 0.043 - 4.179 2.170 7 0.116 0.202 7 0.214 0.330 -0.250 0.000 7 0.000 0.000 3.880 2.968 13 0.248 0.192 13 0.033 0.049 -0.333 0.000 13 0.000 0.000 -3.850 5.124 5 -0.325 0.200 5 0.303 0.090 0.000 0.000 5 0.160 1.000 -3.400 1.521 10 -0.100 0.100 10 0.715 0.387 -0.100 0.100 10 0.001 0.000 1.750 3.145 8 0.000 0.206 8 0.623 0.499 -0.500 0.000 8 0.000 0.000 3.875 3.012 8 0.188 0.162 8 0.492 0.736 -0.083 0.000 8 0.000 0.000 2.333 2.674 12 -0.792 0.199 12 0.024 0.011 0.083 0.083 12 0.159 0.338 5.278 2.053 9 0.144 0.194 9 0.345 0.461 -0.400 0.000 9 0.000 0.000 0.824 2.011 17
0.017
0.000 0.085 17 0.718 0.981
0.000
-0.235 0.000 17 0.000 0.000 -3.861 2.856 12 - -0.458 0.278 12 - 0.267 0.750 0.131 12 - 0.498 0.729 2.771 14 - -0.714 0.214 14 0.267 - 0.857 0.097 14 0.498 - 4.550 3.379 10 -0.813 0.105 10 0.107 0.813 -0.150 0.100 10 0.000 0.000 3.361 1.711 12 -0.153 0.114 12 0.159 0.017 0.333 0.142 12 0.004 0.000 -6.417 4.983 6 -1.292 0.105 6 0.004 0.045 0.667 0.211 6 0.718 0.342 -2.100 2.285 10 0.100 0.163 10 0.127 0.018 0.500 0.153 10 0.007 0.000 4.587 2.446 13 -0.010 0.151 13 0.740 0.077 0.115 0.140 13 0.002 0.000 2.318 1.798 11 0.102 0.206 11 0.237 0.047 0.280 0.152 11 0.000 0.000 -0.389 3.238 9 -0.556 0.256 9 0.536 0.630 0.333 0.167 9 0.062 0.012 0.300 2.620 10 -0.150 0.198 10 0.549 0.077 0.500 0.100 10 0.019 0.001 -1.448 1.828 18
0.000
-0.490 0.121 18 0.520 0.234
0.000
0.542 0.101 18 0.003 0.000
Page 218
204
Table 1: Statistical analysis output for effects of fire suppressants on density and growth
variables of field populations (by species) for the without-fire trial at Whiteman Park (Kruskal-
Wallis test and planned Mann-Whitney U test pairwise comparisons). Green and red cells
denote a significant (p<0.05) increase or decrease (respectively) compared to dry control (p vs
D) and wet control (p vs W). Yellow cells denote type-I errors, determined by overlapping
standard errors of means. Species names preceded by ‘*’ denote non-native species. Table
continues across double page and continues over next pages.
Species: *Ehrharta calycina Sm.
Continues → → →
Abundance Cover KW MW-U Tests KW MW-U Tests KW Test SE p p Test SE p p Test
Time Treatment
p M -/+ N vs D vs W p M -/+ N vs D vs W p Dry Control 0.000 0.146 30 - - 0.000 0.059 7 - - Wet Control 0.000 0.113 30 - - 0.000 0.049 10 - - Chemguard 0.000 0.151 30 - - 0.000 0.168 3 - - Hydrex-AR 0.000 0.074 30 - - 0.000 0.025 2 - - Jet-X 0.000 0.124 30 - - 0.000 0.210 4 - - Silv-Ex 0.000 0.156 30 - - 0.000 0.150 7 - - ANSUL3% 0.000 0.230 30 - - 0.000 0.073 9 - - Virtual 0.000 0.354 30 - - 0.000 0.070 13 - - Phos-Chek 0.000 0.183 30 - - 0.000 0.036 5 - - Barricade 0.000 0.169 30 - - 0.000 0.147 5 - -
0-M
onth
s
ClearETI
-
0.000 0.056 30 - -
-
0.000 0.033 3 - -
-
Dry Control 0.867 0.246 30 - 0.014 0.104 0.066 18 - 0.293 Wet Control 0.738 0.284 29 0.014 - 0.323 0.139 15 0.293 - Chemguard 0.100 0.155 30 0.668 0.328 0.191 0.189 7 0.504 0.216 Hydrex-AR 0.233 0.146 30 0.734 0.364 0.305 0.159 5 0.135 0.569 Jet-X 0.900 0.274 30 0.123 0.024 0.215 0.189 16 0.447 0.132 Silv-Ex 0.500 0.211 30 0.003 0.877 -0.010 0.122 16 0.019 0.008 ANSUL3% 0.633 0.334 30 0.039 0.102 0.478 0.231 16 0.284 0.843 Virtual -0.033 0.296 30 0.019 0.026 0.129 0.090 14 0.849 0.314 Phos-Chek 1.567 0.454 30 0.591 0.106 0.568 0.210 21 0.225 0.834 Barricade 0.567 0.230 30 0.002 0.046 -0.054 0.104 13 0.005 0.001
4-M
onth
s
ClearETI
0.001
0.500 0.189 30 0.832 0.184
0.001
0.347 0.173 10 0.031 0.291
0.607
Dry Control 2.467 0.909 30 - 0.718 0.122 0.077 13 - 0.022 Wet Control 8.567 2.884 30 0.718 - -0.056 0.056 17 0.022 - Chemguard 1.300 0.449 30 0.038 0.940 -0.023 0.096 12 0.049 0.534 Hydrex-AR 1.100 0.425 30 0.074 0.952 0.024 0.067 10 0.419 0.062 Jet-X 0.967 0.312 30 0.053 0.904 0.181 0.159 13 0.520 0.690 Silv-Ex 24.700 7.843 30 0.500 0.193 -0.281 0.064 19 0.000 0.000 ANSUL3% 34.067 23.666 30 0.538 0.160 0.583 0.582 17 0.051 0.593 Virtual 95.433 45.722 30 0.015 0.171 -0.103 0.089 23 0.000 0.000 Phos-Chek 22.267 5.581 30 0.027 0.056 0.123 0.172 23 0.045 0.303 Barricade 1.067 0.573 30 0.002 0.916 0.021 0.114 12 0.114 0.564
12-M
onth
s
ClearETI
0.009
5.833 2.278 30 0.011 0.384
0.000
0.039 0.068 14 0.845 0.005
0.060
Page 219
205
Analysis Notes: Data for Leading Shoot Length and Reproduction not centred; high variance would result in unreliable data centring (type I errors).
Leading Shoot Length Condition Reproduction MW-U Tests KW MW-U Tests KW MW-U Tests
SE p p Test SE p p Test SE p p M -/+ N vs D vs W p M -/+ N vs D vs W p M -/+ N vs D vs W
42.071 11.089 7 - - 0.000 0.163 7 - - 0.321 0.179 7 - - 47.800 9.753 10 - - 0.000 0.267 10 - - 0.500 0.149 10 - - 65.389 5.729 3 - - 0.000 0.419 3 - - 0.722 0.147 3 - - 38.500 26.500 2 - - 0.000 0.375 2 - - 0.000 0.000 2 - - 63.792 15.501 4 - - 0.000 0.687 4 - - 0.250 0.250 4 - - 51.238 14.598 7 - - 0.000 0.406 7 - - 0.429 0.202 7 - - 50.075 9.256 10 - - 0.000 0.188 10 - - 0.175 0.106 10 - - 43.422 6.637 13 - - 0.000 0.194 13 - - 0.339 0.115 13 - - 54.200 6.739 5 - - 0.000 0.272 5 - - 0.717 0.133 5 - - 36.150 10.306 5 - - 0.000 0.245 5 - - 0.250 0.194 5 - - 15.667 4.177 3 - -
-
0.000 0.167 3 - -
-
0.000 0.000 3 - - 31.241 5.258 18 - - -0.132 0.146 18 - 0.204 0.056 0.038 18 - - 37.816 6.446 15 - - 0.068 0.229 15 0.204 - 0.067 0.067 15 - - 44.679 8.881 7 - - -0.131 0.417 7 0.903 0.501 0.000 0.000 7 - - 38.633 5.250 5 - - -0.125 0.411 5 0.368 0.273 0.000 0.000 5 - - 38.288 4.155 16 - - 0.908 0.132 16 0.000 0.002 0.063 0.063 16 - - 28.148 3.161 16 - - 0.532 0.209 16 0.019 0.142 0.013 0.013 16 - - 35.140 3.961 16 - - -0.075 0.144 16 0.729 0.302 0.013 0.013 16 - - 31.969 3.243 14 - - -0.015 0.144 14 0.542 0.237 0.000 0.000 14 - - 31.467 4.213 21 - - 1.142 0.126 21 0.000 0.000 0.057 0.048 21 - - 35.885 7.066 13 - - -0.013 0.171 13 0.126 0.118 0.077 0.052 13 - - 33.600 6.402 10 - -
0.000
0.050 0.228 10 0.441 0.911
0.902
0.000 0.000 10 - - 26.865 5.469 13 - - -0.871 0.317 13 - 0.007 0.115 0.055 13 - - 26.579 5.818 17 - - -0.167 0.281 17 0.007 - 0.126 0.080 17 - - 25.804 5.762 12 - - -0.363 0.362 12 0.156 0.722 0.315 0.127 12 - - 25.675 7.084 10 - - -0.358 0.332 10 0.171 0.338 0.175 0.106 10 - - 37.135 7.902 13 - - -0.107 0.329 13 0.076 0.753 0.378 0.121 13 - - 15.929 4.532 19 - - 0.235 0.186 19 0.000 0.010 0.113 0.072 19 - - 23.136 5.721 17 - - -0.688 0.222 17 0.818 0.009 0.078 0.059 17 - - 21.185 5.954 23 - - -0.249 0.209 23 0.005 0.038 0.157 0.072 23 - - 16.370 2.039 23 - - 0.954 0.075 23 0.000 0.000 0.044 0.043 23 - - 32.229 5.595 12 - - -0.274 0.265 12 0.043 0.068 0.287 0.109 12 - - 23.360 6.988 14 - -
0.000
-0.451 0.285 14 0.143 0.034
0.106
0.110 0.077 14 - -
Page 220
206
Table 1: Statistical analysis output for effects of fire suppressants on density and growth
variables of field populations (by species) for the without-fire trial at Whiteman Park (Kruskal-
Wallis test and planned Mann-Whitney U test pairwise comparisons). Green and red cells
denote a significant (p<0.05) increase or decrease (respectively) compared to dry control (p vs
D) and wet control (p vs W). Yellow cells denote type-I errors, determined by overlapping
standard errors of means. Species names preceded by ‘*’ denote non-native species. Table
continues across double page and continues over next pages.
Species: Eremaea pauciflora (Endl.) Druce
Continues → → →
Abundance Cover KW MW-U Tests KW MW-U Tests KW Test SE p p Test SE p p Test
Time Treatment
p M -/+ N vs D vs W p M -/+ N vs D vs W p Dry Control - - - - - - - - - - Wet Control 0.000 0.171 30 - - 0.000 8.070 9 - - Chemguard 0.000 0.131 30 - - 0.000 12.782 7 - - Hydrex-AR - - - - - - - - - - Jet-X 0.000 0.098 30 - - 0.000 12.211 8 - - Silv-Ex 0.000 0.168 30 - - 0.000 5.172 5 - - ANSUL3% 0.000 0.098 30 - - 0.000 15.163 8 - - Virtual 0.000 0.063 30 - - 0.000 10.680 4 - - Phos-Chek 0.000 0.079 30 - - 0.000 34.440 3 - - Barricade 0.000 0.074 30 - - 0.000 7.411 6 - -
0-M
onth
s
ClearETI
-
- - - - -
-
- - - - -
-
Dry Control - - - - - - - - - - Wet Control -
0.267 0.092 30 - - 11.194 10.190 6 - -
Chemguard -0.133
0.079 30 - 0.000 2.857 12.086 7 - - Hydrex-AR - - - - - - - - - - Jet-X -
0.167 0.063 30 - 0.000 13.750 16.755 4 - -
Silv-Ex -0.167
0.069 30 - 0.000 7.975 7.543 5 - - ANSUL3% 0.167 0.133 30 - 0.000 -9.300 5.765 10 - - Virtual 0.100 0.092 30 - 0.000 -
27.417 9.541 6 - -
Phos-Chek 0.033 0.069 30 - 0.000 -12.667
14.526 5 - - Barricade 0.033 0.104 30 - 0.000 0.500 11.330 5 - -
4-M
onth
s
ClearETI
0.000
- - - - -
0.194
- - - - -
0.394
Dry Control - - - - - - - - - - Wet Control -
0.267 0.092 30 - - 10.111 9.014 6 - -
Chemguard -0.200
0.069 30 - 0.000 11.714 10.559 5 - - Hydrex-AR - - - - - - - - - - Jet-X -
0.267 0.033 30 - 0.000 -
22.500 - 1 - -
Silv-Ex -0.167
0.084 30 - 0.000 36.475 23.939 4 - - ANSUL3% 0.033 0.130 30 - 0.000 -3.452 7.335 7 - - Virtual 0.200 0.111 30 - 0.000 -
27.094 8.888 8 - -
Phos-Chek 0.033 0.069 30 - 0.000 -3.667 24.010 5 - - Barricade 0.000 0.101 30 - 0.000 7.875 8.919 4 - -
12-M
onth
s
ClearETI
0.000
- - - - -
0.067
- - - - -
0.453
Page 221
207
Analysis Notes: Dry Control, Hydrex-AR, and ClearETI excluded from analysis; insufficient Ns.
Leading Shoot Length Condition Reproduction MW-U Tests KW MW-U Tests KW MW-U Tests
SE p p Test SE p p Test SE p p M -/+ N vs D vs W p M -/+ N vs D vs W p M -/+ N vs D vs W - - - - - - - - - - - - - - -
0.000 3.536 9 - - 0.000 0.103 9 - - 0.000 0.073 9 - - 0.000 8.953 7 - - 0.000 0.195 7 - - 0.000 0.189 7 - -
- - - - - - - - - - - - - - - 0.000 2.188 8 - - 0.000 0.094 8 - - 0.000 0.175 8 - - 0.000 9.626 5 - - 0.000 0.190 5 - - 0.000 0.200 5 - - 0.000 3.612 8 - - 0.000 0.238 8 - - 0.000 0.125 8 - - 0.000 10.185 4 - - 0.000 0.433 4 - - 0.000 0.000 4 - - 0.000 2.587 3 - - 0.000 0.144 3 - - 0.000 0.289 3 - - 0.000 9.889 6 - - 0.000 0.167 6 - - 0.000 0.000 6 - -
- - - - -
-
- - - - -
-
- - - - - - - - - - - - - - - - - - - -
9.361 5.043 6 - - -1.014 0.221 6 - - -0.222 0.211 6 - - 18.286 4.765 7 - - -0.071 0.189 7 - 0.014 0.357 0.143 7 - 0.009
- - - - - - - - - - - - - - - 1.938 5.851 4 - - -0.344 0.144 4 - 0.031 0.188 0.250 4 - 0.074 -4.800 11.673 5 - - -0.833 0.274 5 - 0.270 0.200 0.000 5 - 0.003 0.538 4.028 10 - - -0.556 0.334 10 - 0.156 -0.125 0.134 10 - 0.040 1.667 7.872 6 - - -0.958 0.208 6 - 0.872 0.000 0.000 6 - 0.294 -1.967 10.552 5 - - -1.050 0.255 5 - 1.000 0.500 0.000 5 - 0.003 -1.300 10.012 5 - - -0.083 0.354 5 - 0.044 0.000 0.000 5 - 0.325
- - - - -
0.021
- - - - -
0.000
- - - - - - - - - - - - - - - - - - - -
18.278 10.597 6 - - -1.347 0.164 6 - - -0.139 0.171 6 - - 28.857 3.937 5 - - -0.471 0.187 5 - 0.017 0.500 0.000 5 - 0.003
- - - - - - - - - - - - - - - -
11.813 - 1 - - -3.094 - 1 - 0.127 -0.563 - 1 - 0.270
11.850 13.708 4 - - -1.083 0.595 4 - 0.197 -0.050 0.250 4 - 0.119 18.830 9.915 7 - - -0.472 0.245 7 - 0.015 -0.065 0.143 7 - 0.074 2.438 10.344 8 - - -1.063 0.225 8 - 0.242 -0.250 0.164 8 - 0.102 9.633 9.494 5 - - -0.650 0.187 5 - 0.017 0.500 0.000 5 - 0.003 18.375 15.977 4 - - -0.208 0.375 4 - 0.010 0.000 0.000 4 - 0.363
- - - - -
0.046
- - - - -
0.000
- - - - -
Page 222
208
Table 1: Statistical analysis output for effects of fire suppressants on density and growth
variables of field populations (by species) for the without-fire trial at Whiteman Park (Kruskal-
Wallis test and planned Mann-Whitney U test pairwise comparisons). Green and red cells
denote a significant (p<0.05) increase or decrease (respectively) compared to dry control (p vs
D) and wet control (p vs W). Yellow cells denote type-I errors, determined by overlapping
standard errors of means. Species names preceded by ‘*’ denote non-native species. Table
continues across double page and continues over next pages.
Species: *Gladiolus caryophyllaceus (Burm.f.) Poir. Continues → → →
Abundance Cover KW MW-U Tests KW MW-U Tests KW Test SE p p Test SE p p Test
Time Treatment
p M -/+ N vs D vs W p M -/+ N vs D vs W p Dry Control 0.000 0.000 30 - - - - 0 - - Wet Control 0.000 0.000 30 - - - - 0 - - Chemguard 0.000 0.000 30 - - - - 0 - - Hydrex-AR 0.000 0.033 30 - - 0.300 - 1 - - Jet-X 0.000 0.000 30 - - - - 0 - - Silv-Ex 0.000 0.000 30 - - - - 0 - - ANSUL3% 0.000 0.000 30 - - - - 0 - - Virtual 0.000 0.046 30 - - 0.150 0.050 2 - - Phos-Chek 0.000 0.033 30 - - 0.200 - 1 - - Barricade 0.000 0.000 30 - - - - 0 - -
0-M
onth
s
ClearETI
-
0.000 0.000 30 - -
-
- - 0 - -
-
Dry Control 4.600 0.824 30 - 0.023 0.107 0.003 25 - - Wet Control 2.033 0.405 30 0.023 - 0.112 0.005 18 - - Chemguard 1.833 0.426 30 0.006 0.656 0.115 0.011 18 - - Hydrex-AR 2.767 0.483 30 0.035 0.929 0.116 0.009 23 - - Jet-X 1.500 0.306 30 0.004 0.499 0.106 0.003 18 - - Silv-Ex 2.233 0.569 30 0.016 0.842 0.110 0.006 18 - - ANSUL3% 0.767 0.243 30 0.000 0.021 0.103 0.003 12 - - Virtual 0.933 0.240 30 0.000 0.001 0.103 0.003 15 - - Phos-Chek 1.267 0.304 30 0.000 0.008 0.119 0.009 17 - - Barricade 2.400 0.370 30 0.114 0.400 0.112 0.005 22 - -
4-M
onth
s
ClearETI
0.000
1.233 0.243 30 0.001 0.268
0.921
0.106 0.003 18 - -
0.001
Dry Control 3.033 0.720 30 - 0.064 0.111 0.004 18 - - Wet Control 1.133 0.274 30 0.064 - 0.111 0.006 14 - - Chemguard 1.567 0.467 30 0.112 0.853 0.101 0.001 14 - - Hydrex-AR 1.500 0.409 30 0.003 0.104 0.186 0.061 16 - - Jet-X 0.567 0.202 30 0.002 0.096 0.129 0.013 8 - - Silv-Ex 2.833 0.541 30 0.738 0.021 0.105 0.003 20 - - ANSUL3% 1.400 0.358 30 0.131 0.680 0.109 0.006 16 - - Virtual 1.933 0.462 30 0.079 0.893 0.209 0.090 21 - - Phos-Chek 4.233 0.841 30 0.532 0.020 0.107 0.003 23 - - Barricade 4.433 0.882 30 0.289 0.006 0.108 0.005 21 - -
12-M
onth
s
ClearETI
0.000
2.600 0.539 30 0.982 0.054
0.517
0.105 0.002 20 - -
0.000
Page 223
209
Analysis Notes: Extreme oulier removed from Abundance data at 4-months. Growth data (Cover, Leading Shoot Length, Condition, and Reproduction) not centred; high variance would result in unreliable data centring (type I errors).
Leading Shoot Length Condition Reproduction MW-U Tests KW MW-U Tests KW MW-U Tests
SE p p Test SE p p Test SE p p M -/+ N vs D vs W p M -/+ N vs D vs W p M -/+ N vs D vs W - - 0 - - - - 0 - - - - 0 - - - - 0 - - - - 0 - - - - 0 - - - - 0 - - - - 0 - - - - 0 - -
66.000 - 1 - - 1.000 - 1 - - 0.000 - 1 - - - - 0 - - - - 0 - - - - 0 - - - - 0 - - - - 0 - - - - 0 - - - - 0 - - - - 0 - - - - 0 - -
34.500 13.500 2 - - 2.250 1.250 2 - - 0.000 0.000 2 - - 71.000 - 1 - - 1.000 - 1 - - 0.000 - 1 - -
- - 0 - - - - 0 - - - - 0 - - - - 0 - -
-
- - 0 - -
-
- - 0 - - 17.184 1.198 25 - 0.000 3.068 0.078 25 - - 0.000 0.000 25 - - 27.026 2.381 18 0.000 - 3.256 0.083 18 - - 0.000 0.000 18 - - 23.413 2.431 18 0.014 0.097 3.224 0.101 18 - - 0.000 0.000 18 - - 27.821 3.845 23 0.023 0.470 2.868 0.182 23 - - 0.000 0.000 23 - - 16.032 1.730 18 0.273 0.001 3.333 0.120 18 - - 0.000 0.000 18 - - 23.530 2.877 18 0.006 0.019 3.144 0.099 18 - - 0.000 0.000 18 - - 27.014 4.377 12 0.010 0.568 3.097 0.270 12 - - 0.083 0.083 12 - - 24.698 3.904 15 0.142 0.104 3.069 0.097 15 - - 0.000 0.000 15 - - 30.324 3.900 17 0.003 0.804 2.975 0.175 17 - - 0.000 0.000 17 - - 22.615 1.713 22 0.010 0.242 2.807 0.120 22 - - 0.000 0.000 22 - - 21.809 2.118 18 0.076 0.159
0.076
2.842 0.163 18 - -
0.098
0.000 0.000 18 - - 13.173 0.888 18 - 0.027 2.730 0.129 18 - - 0.000 0.000 18 - - 18.475 2.420 14 0.027 - 3.140 0.183 14 - - 0.000 0.000 14 - - 16.869 2.485 14 0.459 0.505 2.848 0.116 14 - - 0.071 0.071 14 - - 23.442 4.981 16 0.031 0.678 2.790 0.211 16 - - 0.000 0.000 16 - - 16.427 2.294 8 0.453 0.585 3.146 0.103 8 - - 0.000 0.000 8 - - 15.680 0.728 20 0.011 0.624 2.874 0.095 20 - - 0.000 0.000 20 - - 20.688 1.632 16 0.001 0.164 3.173 0.146 16 - - 0.021 0.021 16 - - 23.884 2.377 21 0.000 0.045 3.119 0.165 21 - - 0.000 0.000 21 - - 17.613 1.324 23 0.005 0.938 2.945 0.106 23 - - 0.000 0.000 23 - - 21.116 3.504 21 0.000 0.449 2.783 0.172 21 - - 0.048 0.048 21 - - 17.679 1.675 20 0.021 0.820
0.389
3.017 0.092 20 - -
0.593
0.000 0.000 20 - -
Page 224
210
Table 1: Statistical analysis output for effects of fire suppressants on density and growth
variables of field populations (by species) for the without-fire trial at Whiteman Park (Kruskal-
Wallis test and planned Mann-Whitney U test pairwise comparisons). Green and red cells
denote a significant (p<0.05) increase or decrease (respectively) compared to dry control (p vs
D) and wet control (p vs W). Yellow cells denote type-I errors, determined by overlapping
standard errors of means. Species names preceded by ‘*’ denote non-native species. Table
continues across double page and continues over next pages.
Species: Gompholobium tomentosum Labill.
Continues → → →
Abundance Cover KW MW-U Tests KW MW-U Tests KW Test SE p p Test SE p p Test
Time Treatment
p M -/+ N vs D vs W p M -/+ N vs D vs W p Dry Control 0.000 0.074 30 - - 0.725 0.625 2 - - Wet Control 0.000 0.046 30 - - 5.150 4.850 2 - - Chemguard 0.000 0.104 30 - - 1.300 1.200 2 - - Hydrex-AR 0.000 0.098 30 - - 10.613 6.063 8 - - Jet-X 0.000 0.000 30 - - - - - - - Silv-Ex 0.000 0.046 30 - - 1.500 0.500 2 - - ANSUL3% 0.000 0.046 30 - - 1.750 0.750 2 - - Virtual 0.000 0.141 30 - - 4.208 1.889 8 - - Phos-Chek 0.000 0.084 30 - - 8.000 3.298 4 - - Barricade 0.000 0.114 30 - - 4.636 1.765 11 - -
0-M
onth
s
ClearETI
-
0.000 0.063 30 - -
-
2.775 1.533 4 - -
-
Dry Control 2.133 0.617 30 - 0.402 0.917 0.704 14 - 0.654 Wet Control 0.400 0.224 30 0.402 - 0.495 0.395 5 0.654 - Chemguard 2.233 0.886 30 0.001 0.008 0.505 0.388 10 0.719 0.406 Hydrex-AR 0.400 0.410 30 0.000 0.000 11.808 6.093 6 0.017 0.056 Jet-X 1.267 0.407 30 0.150 0.000 0.396 0.197 12 0.683 0.887 Silv-Ex 5.733 1.190 30 0.000 0.000 0.162 0.038 20 0.279 0.846 ANSUL3% 0.200 0.117 30 0.458 0.904 0.917 0.817 6 0.509 1.000 Virtual 3.000 1.545 30 0.016 0.092 0.165 0.025 12 0.221 0.188 Phos-Chek 11.633 4.752 30 0.964 0.294 0.379 0.166 18 0.025 0.070 Barricade 2.133 0.565 30 0.697 0.058 1.500 0.618 21 0.518 0.353
4-M
onth
s
ClearETI
0.000
1.000 0.278 30 0.010 0.403
0.001
1.007 0.665 15 0.394 0.774
0.000
Dry Control 4.700 2.055 30 - 0.482 0.183 0.063 15 - 0.406 Wet Control 1.033 0.448 30 0.482 - 0.519 0.311 8 0.406 - Chemguard 0.467 0.195 30 0.000 0.000 0.215 0.099 9 0.613 0.746 Hydrex-AR 0.367 0.241 30 0.000 0.001 6.140 2.875 10 0.002 0.032 Jet-X 1.067 0.680 30 0.633 0.000 3.417 3.317 6 0.749 0.857 Silv-Ex 7.167 2.348 30 0.031 0.055 0.208 0.108 13 0.700 0.284 ANSUL3% 0.367 0.238 30 0.732 0.200 1.325 1.225 4 0.479 0.824 Virtual 1.900 0.850 30 0.003 0.059 0.931 0.493 13 0.223 0.717 Phos-Chek 39.067 24.776 30 0.403 0.075 0.484 0.317 20 0.023 0.324 Barricade 3.833 1.230 30 0.492 0.330 1.329 0.627 20 0.052 0.440
12-M
onth
s
ClearETI
0.000
4.667 1.483 30 0.049 0.284
0.008
0.650 0.365 14 0.466 0.889
0.115
Page 225
211
Analysis Notes: Growth data (Cover, Leading Shoot Length, Condition, and Reproduction) not centred; high variance would result in unreliable data centring (type I errors).
Leading Shoot Length Condition Reproduction MW-U Tests KW MW-U Tests KW MW-U Tests
SE p p Test SE p p Test SE p p M -/+ N vs D vs W p M -/+ N vs D vs W p M -/+ N vs D vs W
16.500 3.500 2 - - 2.750 0.250 2 - - 0.000 0.000 2 - - 40.000 21.000 2 - - 3.000 0.000 2 - - 0.500 0.500 2 - - 31.500 14.500 2 - - 2.583 1.083 2 - - 0.167 0.167 2 - - 52.938 11.515 8 - - 3.063 0.113 8 - - 0.875 0.125 8 - -
- - - - - - - - - - - - - - - 48.000 29.000 2 - - 2.500 0.500 2 - - 1.000 0.000 2 - - 41.000 0.000 2 - - 2.500 0.500 2 - - 0.500 0.500 2 - - 58.646 9.973 8 - - 2.817 0.301 8 - - 0.813 0.132 8 - - 61.125 6.299 4 - - 2.938 0.157 4 - - 1.000 0.000 4 - - 42.364 6.660 11 - - 3.182 0.155 11 - - 0.727 0.124 11 - - 61.000 19.004 4 - -
-
2.500 0.354 4 - -
-
0.750 0.250 4 - - 10.774 4.349 14 - 0.374 3.006 0.088 14 - 0.129 0.071 0.071 14 - 0.487 9.050 2.393 5 0.374 - 3.225 0.115 5 0.129 - 0.050 0.050 5 0.487 - 8.750 3.462 10 0.497 0.156 3.275 0.079 10 0.044 0.789 0.000 0.000 10 0.398 0.157
45.172 18.144 6 0.159 0.465 3.049 0.261 6 0.480 0.574 0.348 0.207 6 0.038 0.289 8.354 3.166 12 0.091 0.044 3.260 0.098 12 0.107 0.911 0.021 0.021 12 0.956 0.509 7.799 2.130 20 0.343 0.162 2.969 0.093 20 0.768 0.098 0.000 0.000 20 0.232 0.046
13.833 8.882 6 0.648 0.358 2.500 0.516 6 0.496 0.122 0.000 0.000 6 0.513 0.273 10.083 1.158 12 0.066 0.596 3.117 0.095 12 0.385 0.412 0.056 0.043 12 0.517 0.874 17.030 2.336 18 0.003 0.062 3.569 0.071 18 0.000 0.061 0.081 0.057 18 0.467 0.866 19.987 4.502 21 0.032 0.344 2.936 0.098 21 0.969 0.049 0.197 0.080 21 0.148 0.588 22.600 7.337 15 0.245 0.792
0.000
2.600 0.225 15 0.178 0.019
0.010
0.000 0.000 15 0.301 0.083 4.762 1.192 15 - - 2.862 0.124 15 - 0.568 0.000 0.000 15 - 0.171 8.375 3.575 8 - - 2.688 0.210 8 0.568 - 0.125 0.125 8 0.171 - 6.148 3.515 9 - - 2.333 0.323 9 0.109 0.330 0.000 0.000 9 1.000 0.289
38.250 11.766 10 - - 2.300 0.455 10 0.327 0.613 0.250 0.134 10 0.027 0.426 14.333 10.760 6 - - 2.417 0.490 6 0.475 0.746 0.000 0.000 6 1.000 0.386 8.790 5.773 13 - - 2.846 0.243 13 0.388 0.175 0.000 0.000 13 1.000 0.202
18.250 15.918 4 - - 2.250 0.750 4 0.602 0.824 0.000 0.000 4 1.000 0.480 18.846 7.453 13 - - 2.500 0.358 13 0.979 0.730 0.077 0.077 13 0.283 0.722 10.730 2.998 20 - - 3.361 0.206 20 0.004 0.007 0.000 0.000 20 1.000 0.114 15.864 4.569 20 - - 2.501 0.217 20 0.259 0.665 0.106 0.058 20 0.070 0.732 14.929 6.159 14 - -
0.001
2.786 0.239 14 0.790 0.429
0.028
0.000 0.000 14 1.000 0.186
Page 226
212
Table 1: Statistical analysis output for effects of fire suppressants on density and growth
variables of field populations (by species) for the without-fire trial at Whiteman Park (Kruskal-
Wallis test and planned Mann-Whitney U test pairwise comparisons). Green and red cells
denote a significant (p<0.05) increase or decrease (respectively) compared to dry control (p vs
D) and wet control (p vs W). Yellow cells denote type-I errors, determined by overlapping
standard errors of means. Species names preceded by ‘*’ denote non-native species. Table
continues across double page and continues over next pages.
Species: Hibbertia hypericoides (DC.) Benth.
Continues → → →
Abundance Cover KW MW-U Tests KW MW-U Tests KW Test SE p p Test SE p p Test
Time Treatment
p M -/+ N vs D vs W p M -/+ N vs D vs W p Dry Control 0.000 30 - - 0.000 0.111 4 - - Wet Control 0.000 30 - - 0.000 0.084 4 - - Chemguard 0.000 30 - - 0.000 0.088 5 - - Hydrex-AR - - - - - - - - - Jet-X 0.000 30 - - 0.000 0.130 7 - - Silv-Ex 0.000 30 - - 0.000 0.400 5 - - ANSUL3% - - - - - - - - - Virtual 0.000 30 - - 0.000 0.111 8 - - Phos-Chek - - - - - - - - - Barricade - - - - - - - - -
0-M
onth
s
ClearETI
-
- - - -
-
- - - - -
-
Dry Control -0.100 0.056 30 - 0.000 -1.667 18.028 3 - - Wet Control -0.033 0.079 30 0.000 - -5.917 10.345 3 - - Chemguard 0.000 0.111 30 0.661 0.000 2.233 17.587 4 - - Hydrex-AR - - - - - - - - - - Jet-X 0.233 0.184 30 0.058 0.056 14.467 7.190 12 - - Silv-Ex -0.200 0.146 30 0.000 0.000 -1.833 2.697 5 - - ANSUL3% - - - - - - - - - - Virtual -0.167 0.069 30 0.000 0.000 -7.331 2.888 5 - - Phos-Chek - - - - - - - - - - Barricade - - - - - - - - - -
4-M
onth
s
ClearETI
0.000
- - - - -
0.297
- - - - -
0.435
Dry Control -0.100 0.056 30 - 0.000 0.000 16.667 3 - - Wet Control -0.033 0.063 30 0.000 - 3.250 6.455 4 - - Chemguard 0.033 0.092 30 0.267 0.000 1.283 12.734 6 - - Hydrex-AR - - - - - - - - - - Jet-X 0.333 0.182 30 0.171 0.133 13.958 8.100 13 - - Silv-Ex -0.367 0.084 30 0.000 0.000 0.330 3.028 4 - - ANSUL3% - - - - - - - - - - Virtual -0.033 0.109 30 0.000 0.000 13.326 7.368 7 - - Phos-Chek - - - - - - - - - - Barricade - - - - - - - - - -
12-M
onth
s
ClearETI
0.000
- - - - -
0.881
- - - - -
0.131
Page 227
213
Analysis Notes: Hydrex-AR, ANSUL3%, Phos-Chek, Barricade, and ClearETI excluded; insufficient Ns.
Leading Shoot Length Condition Reproduction MW-U Tests KW MW-U Tests KW MW-U Tests
SE p p Test SE p p Test SE p p M -/+ N vs D vs W p M -/+ N vs D vs W p M -/+ N vs D vs W
0.000 11.785 4 - - 0.000 2.160 4 - - 0.000 0.312 4 - - 0.000 7.674 4 - - 0.000 10.323 4 - - 0.000 0.063 4 - - 0.000 13.040 5 - - 0.000 9.313 5 - - 0.000 0.200 5 - -
- - - - - - - - - - - - - - - 0.000 3.067 7 - - 0.000 4.402 7 - - 0.000 0.232 7 - - 0.000 2.886 5 - - 0.000 7.488 5 - - 0.000 0.261 5 - -
- - - - - - - - - - - - - - - 0.000 6.096 8 - - 0.000 2.907 8 - - 0.000 0.094 8 - -
- - - - - - - - - - - - - - - - - - - - - - - - - - - - - - - - - - -
-
- - - - -
-
- - - - - 7.333 5.175 3 - - 0.167 0.333 3 - - 0.000 0.000 3 - 0.025
15.625 6.110 3 - - 0.479 0.300 3 - - 1.000 0.000 3 0.025 - 1.700 9.823 4 - - 0.242 0.336 4 - - 0.500 0.289 4 0.180 0.180
- - - - - - - - - - - - - - - 9.955 3.634 12 - - -0.439 0.272 12 - - 0.000 0.000 12 1.000 0.000 -4.617 10.418 5 - - -0.492 0.238 5 - - 0.000 0.000 5 1.000 0.008
- - - - - - - - - - - - - - - 4.938 4.701 5 - - -0.250 0.158 5 - - 0.000 0.000 5 1.000 0.008
- - - - - - - - - - - - - - - - - - - - - - - - - - - - - - - - - - -
0.126
- - - - -
0.000
- - - - - 5.000 4.041 3 - - 0.000 0.726 3 - - 0.333 0.333 3 - -
28.375 8.430 4 - - -0.063 0.239 4 - - 0.500 0.289 4 - - 9.117 12.148 6 - - -1.050 0.214 6 - - 0.167 0.167 6 - -
- - - - - - - - - - - - - - - 8.700 3.354 13 - - -0.330 0.120 13 - - 0.038 0.038 13 - - -0.225 7.052 4 - - -0.246 0.373 4 - - 0.000 0.000 4 - -
- - - - - - - - - - - - - - - 12.866 5.416 7 - - -0.679 0.248 7 - - 0.000 0.000 7 - -
- - - - - - - - - - - - - - - - - - - - - - - - - - - - - - - - - - -
0.222
- - - - -
0.140
- - - - -
Page 228
214
Table 1: Statistical analysis output for effects of fire suppressants on density and growth
variables of field populations (by species) for the without-fire trial at Whiteman Park (Kruskal-
Wallis test and planned Mann-Whitney U test pairwise comparisons). Green and red cells
denote a significant (p<0.05) increase or decrease (respectively) compared to dry control (p vs
D) and wet control (p vs W). Yellow cells denote type-I errors, determined by overlapping
standard errors of means. Species names preceded by ‘*’ denote non-native species. Table
continues across double page and continues over next pages.
Species: *Hypochaeris glabra L.
Continues → → →
Abundance Cover KW MW-U Tests KW MW-U Tests KW Test SE p p Test SE p p Test
Time Treatment
p M -/+ N vs D vs W p M -/+ N vs D vs W p Dry Control 0.000 0.000 30 - - 0.000 0.000 0 - - Wet Control 0.000 0.000 30 - - 0.000 0.000 0 - - Chemguard 0.000 0.000 30 - - 0.000 0.000 0 - - Hydrex-AR 0.000 0.000 30 - - 0.000 0.000 0 - - Jet-X 0.000 0.000 30 - - 0.000 0.000 0 - - Silv-Ex 0.000 0.000 30 - - 0.000 0.000 0 - - ANSUL3% 0.000 0.000 30 - - 0.000 0.000 0 - - Virtual 0.000 0.000 30 - - 0.000 0.000 0 - - Phos-Chek 0.000 0.000 30 - - 0.000 0.000 0 - - Barricade 0.000 0.000 30 - - 0.000 0.000 0 - -
0-M
onth
s
ClearETI
-
0.000 0.000 30 - -
-
0.000 0.000 0 - -
-
Dry Control 18.733 5.328 30 - 0.058 0.140 0.027 15 - - Wet Control 4.900 2.025 30 0.058 - 0.111 0.011 9 - - Chemguard 1.233 0.715 30 0.002 0.154 0.100 0.000 5 - - Hydrex-AR 0.867 0.520 30 0.001 0.079 0.125 0.025 4 - - Jet-X 0.600 0.358 30 0.000 0.036 0.167 0.067 3 - - Silv-Ex 7.333 2.324 30 0.385 0.214 0.107 0.007 14 - - ANSUL3% 1.200 0.497 30 0.019 0.535 0.133 0.024 9 - - Virtual 5.767 1.901 30 0.174 0.471 0.100 0.000 12 - - Phos-Chek 0.333 0.333 30 0.000 0.006 0.100 - 1 - - Barricade 27.033 8.603 30 0.856 0.073 0.100 0.000 15 - -
4-M
onth
s
ClearETI
0.000
6.933 2.865 30 0.069 0.964
0.415
0.100 0.000 9 - -
0.018
Dry Control 32.133 14.047 30 - 0.773 0.100 0.000 11 - 1.000 Wet Control 19.067 5.960 30 0.773 - 0.100 0.000 14 1.000 - Chemguard 1.133 0.469 30 0.055 0.008 0.167 0.067 6 0.176 0.127 Hydrex-AR 1.233 0.689 30 0.030 0.004 0.100 0.000 5 1.000 1.000 Jet-X 0.100 0.100 30 0.001 0.000 0.100 - 1 1.000 1.000 Silv-Ex 19.200 8.119 30 0.734 0.837 0.106 0.006 16 0.407 0.350 ANSUL3% 3.700 1.502 30 0.204 0.065 0.100 0.000 9 1.000 1.000 Virtual 9.667 4.345 30 0.757 0.427 0.100 0.000 13 1.000 1.000 Phos-Chek 116.600 53.845 30 0.092 0.167 0.143 0.011 21 0.012 0.005 Barricade 50.833 17.671 30 0.351 0.583 0.100 0.000 15 1.000 1.000
12-M
onth
s
ClearETI
0.000
19.433 6.172 30 0.773 0.968
0.000
0.100 0.000 14 1.000 1.000
0.000
Page 229
215
Analysis Notes: Data not centred; no plants at 0-months.
Leading Shoot Length Condition Reproduction MW-U Tests KW MW-U Tests KW MW-U Tests
SE p p Test SE p p Test SE p p M -/+ N vs D vs W p M -/+ N vs D vs W p M -/+ N vs D vs W
0.000 0.000 0 - - 0.000 0.000 0 - - 0.000 0.000 0 - - 0.000 0.000 0 - - 0.000 0.000 0 - - 0.000 0.000 0 - - 0.000 0.000 0 - - 0.000 0.000 0 - - 0.000 0.000 0 - - 0.000 0.000 0 - - 0.000 0.000 0 - - 0.000 0.000 0 - - 0.000 0.000 0 - - 0.000 0.000 0 - - 0.000 0.000 0 - - 0.000 0.000 0 - - 0.000 0.000 0 - - 0.000 0.000 0 - - 0.000 0.000 0 - - 0.000 0.000 0 - - 0.000 0.000 0 - - 0.000 0.000 0 - - 0.000 0.000 0 - - 0.000 0.000 0 - - 0.000 0.000 0 - - 0.000 0.000 0 - - 0.000 0.000 0 - - 0.000 0.000 0 - - 0.000 0.000 0 - - 0.000 0.000 0 - - 0.000 0.000 0 - -
-
0.000 0.000 0 - -
-
0.000 0.000 0 - - 1.200 0.200 15 - 0.550 3.167 0.126 15 - - 0.000 0.000 15 - - 1.444 0.176 9 0.550 - 3.167 0.083 9 - - 0.000 0.000 9 - - 1.000 0.000 5 0.292 0.456 3.000 0.000 5 - - 0.000 0.000 5 - - 1.500 0.500 4 0.888 0.538 3.000 0.000 4 - - 0.000 0.000 4 - - 1.333 0.333 3 0.569 0.320 3.500 0.289 3 - - 0.000 0.000 3 - - 1.286 0.221 14 0.308 0.747 3.036 0.036 14 - - 0.000 0.000 14 - - 2.556 0.973 9 0.900 0.496 3.056 0.130 9 - - 0.000 0.000 9 - - 1.417 0.336 12 0.107 0.248 3.000 0.000 12 - - 0.000 0.000 12 - - 4.000 - 1 0.633 0.739 3.000 - 1 - - 0.000 - 1 - - 1.667 0.532 15 0.073 0.197 3.000 0.049 15 - - 0.000 0.000 15 - - 2.111 0.484 9 0.161 0.317
0.138
3.111 0.073 9 - -
1.000
0.000 0.000 9 - - 1.273 0.141 11 - 0.062 3.000 0.000 11 - 0.200 0.000 0.000 11 - - 1.714 0.163 14 0.062 - 2.929 0.049 14 0.200 - 0.000 0.000 14 - - 1.333 0.211 6 0.799 0.193 2.833 0.167 6 0.176 0.791 0.000 0.000 6 - - 1.800 0.374 5 0.163 0.877 3.000 0.000 5 1.000 0.384 0.000 0.000 5 - - 3.000 - 1 0.056 0.095 3.000 - 1 1.000 0.695 0.000 - 1 - - 1.375 0.202 16 0.974 0.052 2.938 0.063 16 0.407 0.523 0.000 0.000 16 - - 1.889 0.200 9 0.023 0.489 3.000 0.000 9 1.000 0.246 0.000 0.000 9 - - 1.769 0.303 13 0.170 0.663 2.923 0.077 13 0.358 0.657 0.000 0.000 13 - - 3.238 0.316 21 0.000 0.000 3.238 0.095 21 0.054 0.009 0.000 0.000 21 - - 1.133 0.091 15 0.382 0.005 2.833 0.080 15 0.069 0.386 0.000 0.000 15 - - 1.786 0.155 14 0.028 0.729
0.010
3.036 0.063 14 0.594 0.190
1.000
0.000 0.000 14 - -
Page 230
216
Table 1: Statistical analysis output for effects of fire suppressants on density and growth
variables of field populations (by species) for the without-fire trial at Whiteman Park (Kruskal-
Wallis test and planned Mann-Whitney U test pairwise comparisons). Green and red cells
denote a significant (p<0.05) increase or decrease (respectively) compared to dry control (p vs
D) and wet control (p vs W). Yellow cells denote type-I errors, determined by overlapping
standard errors of means. Species names preceded by ‘*’ denote non-native species. Table
continues across double page and continues over next pages.
Species: Lepidosperma scabrum Nees
Continues → → →
Abundance Cover KW MW-U Tests KW MW-U Tests KW Test SE p p Test SE p p Test
Time Treatment
p M -/+ N vs D vs W p M -/+ N vs D vs W p Dry Control 0.000 0.074 30 - - 0.100 0.000 2 - - Wet Control 0.000 0.079 30 - - 1.233 0.888 3 - - Chemguard 0.000 0.104 30 - - 0.133 0.033 2 - - Hydrex-AR 0.000 0.237 30 - - 0.828 0.333 12 - - Jet-X 0.000 0.097 30 - - 0.183 0.060 3 - - Silv-Ex 0.000 0.177 30 - - 0.368 0.238 10 - - ANSUL3% 0.000 0.212 30 - - 0.162 0.040 4 - - Virtual 0.000 0.149 30 - - 0.663 0.479 8 - - Phos-Chek 0.000 0.114 30 - - 0.775 0.576 4 - - Barricade 0.000 0.063 30 - - 0.150 0.050 4 - -
0-M
onth
s
ClearETI
-
0.000 0.074 30 - -
-
0.100 0.000 2 - -
-
Dry Control 0.467 0.133 30 - 0.000 0.204 0.063 14 - 0.620 Wet Control 0.367 0.178 30 0.000 - 0.444 0.320 9 0.620 - Chemguard 0.400 0.133 30 0.001 0.473 0.350 0.155 13 0.641 0.968 Hydrex-AR 0.200 0.280 30 0.023 0.056 0.900 0.337 13 0.004 0.016 Jet-X 0.467 0.200 30 0.001 0.001 0.117 0.008 9 0.171 0.635 Silv-Ex 0.033 0.170 30 0.002 0.008 0.140 0.018 12 0.533 0.935 ANSUL3% 0.267 0.221 30 0.001 0.003 0.199 0.081 11 0.395 0.893 Virtual 0.033 0.150 30 0.000 0.001 0.309 0.170 11 1.000 0.695 Phos-Chek 0.067 0.128 30 0.000 0.000 0.124 0.016 7 0.276 0.651 Barricade 0.300 0.164 30 0.000 0.786 0.125 0.025 8 0.140 0.365
4-M
onth
s
ClearETI
0.000
0.500 0.149 30 0.987 0.000
0.009
0.638 0.530 13 0.129 0.523
0.002
Dry Control 0.567 0.205 30 - 0.000 0.246 0.089 10 - Wet Control 0.300 0.149 30 0.000 - 0.856 0.559 9 - Chemguard 0.267 0.113 30 0.000 0.828 0.500 0.389 10 Hydrex-AR -0.267 0.190 30 0.000 0.000 0.644 0.233 9 Jet-X 0.300 0.171 30 0.000 0.000 0.558 0.351 8 Silv-Ex 0.133 0.174 30 0.015 0.039 0.136 0.017 13 ANSUL3% 0.233 0.242 30 0.000 0.000 0.200 0.071 7 Virtual 0.200 0.212 30 0.007 0.013 0.268 0.105 13 Phos-Chek 0.500 0.185 30 0.009 0.029 0.128 0.013 12 Barricade 0.400 0.157 30 0.000 0.672 0.197 0.040 10
12-M
onth
s
ClearETI
0.000
0.500 0.243 30 0.910 0.000
0.154
0.139 0.021 11
0.000
Page 231
217
Analysis Notes: Cover data not centred; high variance would result in unreliable data centring (type I errors).
Leading Shoot Length Condition Reproduction MW-U Tests KW MW-U Tests KW MW-U Tests
SE p p Test SE p p Test SE p p M -/+ N vs D vs W p M -/+ N vs D vs W p M -/+ N vs D vs W
0.000 40.250 2 - - 0.000 0.750 2 - - 0.000 0.000 2 - - 0.000 8.988 3 - - 0.000 0.250 3 - - 0.000 0.333 3 - - 0.000 0.167 2 - - 0.000 0.083 2 - - 0.000 0.333 2 - - 0.000 6.658 12 - - 0.000 0.175 12 - - 0.000 0.122 12 - - 0.000 2.804 3 - - 0.000 0.167 3 - - 0.000 0.333 3 - - 0.000 9.273 10 - - 0.000 0.119 10 - - 0.000 0.050 10 - - 0.000 9.473 4 - - 0.000 0.201 4 - - 0.000 0.167 4 - - 0.000 7.350 8 - - 0.000 0.094 8 - - 0.000 0.125 8 - - 0.000 5.547 4 - - 0.000 0.161 4 - - 0.000 0.250 4 - - 0.000 19.780 4 - - 0.000 0.204 4 - - 0.000 0.000 4 - - 0.000 2.250 2 - -
-
0.000 0.125 2 - -
-
0.000 0.000 2 - - -
16.583 5.053 14 - 0.008 -0.631 0.209 14 - 0.500 0.071 0.071 14 - 0.000
6.028 4.868 9 0.008 - -0.745 0.117 9 0.500 - -0.333 0.000 9 0.000 - 13.436 4.745 13 0.000 0.270 -0.045 0.152 13 0.030 0.004 -0.218 0.083 13 0.001 0.003 4.161 5.888 13 0.015 0.973 -0.465 0.215 13 0.884 0.366 -0.161 0.103 13 0.007 0.338 6.713 7.330 9 0.023 0.965 -0.287 0.209 9 0.486 0.110 -0.278 0.056 9 0.000 0.317 -4.050 6.782 12 0.123 0.393 -0.071 0.117 12 0.038 0.002 0.033 0.056 12 0.001 0.000 1.038 6.245 11 0.043 0.732 -0.080 0.194 11 0.227 0.030 -0.099 0.068 11 0.000 0.000 17.511 7.585 11 0.002 0.305 0.102 0.203 11 0.029 0.004 0.057 0.122 11 0.002 0.000
-18.863
6.210 7 1.000 0.010 -0.589 0.085 7 0.940 0.257 -0.250 0.000 7 0.000 0.000 6.469 8.018 8 0.029 0.773 -0.047 0.291 8 0.150 0.026 0.000 0.000 8 0.450 0.000 17.814 5.299 13 0.000 0.243
0.017
-0.285 0.153 13 0.463 0.054
0.000
0.000 0.000 13 0.335 0.000 -
23.317 3.053 10 - 0.002 -0.488 0.379 10 - 0.967 0.100 0.100 10 - 0.000
9.074 5.882 9 0.002 - -0.694 0.227 9 0.967 - -0.333 0.000 9 0.000 - 3.417 6.208 10 0.006 0.462 -1.283 0.273 10 0.224 0.038 -0.333 0.000 10 0.000 0.000 3.231 5.554 9 0.000 0.627 -0.195 0.265 9 0.367 0.347 0.175 0.158 9 1.000 0.199 -4.000 4.107 8 0.010 0.043 -0.271 0.297 8 0.721 0.626 0.042 0.183 8 0.211 0.049
-14.758
3.811 13 0.054 0.003 -0.622 0.248 13 0.852 0.567 0.014 0.044 13 0.001 0.000 -
12.950 4.444 7 0.051 0.013 -0.546 0.364 7 0.625 0.307 -0.095 0.071 7 0.005 0.000
5.792 5.666 13 0.000 0.403 -0.096 0.229 13 0.219 0.107 -0.074 0.051 13 0.000 0.000 -
10.861 4.622 12 0.041 0.015 -0.868 0.206 12 0.620 0.282 -0.250 0.000 12 0.000 0.000
-0.167 7.929 10 0.004 0.165 0.000 0.211 10 0.094 0.018 0.100 0.100 10 1.000 0.000 20.490 5.162 11 0.000 0.159
0.018
-0.248 0.200 11 0.229 0.098
0.000
0.000 0.000 11 0.294 0.000
Page 232
218
Table 1: Statistical analysis output for effects of fire suppressants on density and growth
variables of field populations (by species) for the without-fire trial at Whiteman Park (Kruskal-
Wallis test and planned Mann-Whitney U test pairwise comparisons). Green and red cells
denote a significant (p<0.05) increase or decrease (respectively) compared to dry control (p vs
D) and wet control (p vs W). Yellow cells denote type-I errors, determined by overlapping
standard errors of means. Species names preceded by ‘*’ denote non-native species. Table
continues across double page and continues over next pages.
Species: Leucopogon parviflorus (Andrews) Lindl.
Continues → → →
Abundance Cover KW MW-U Tests KW MW-U Tests KW Test SE p p Test SE p p Test
Time Treatment
p M -/+ N vs D vs W p M -/+ N vs D vs W p Dry Control - - - - - - - - - - Wet Control 0.000 0.109 30 - - 0.000 5.764 7 - - Chemguard - - - - - - - - - - Hydrex-AR - - - - - - - - - - Jet-X - - - - - - - - - - Silv-Ex 0.000 0.079 30 - - 0.000 5.460 7 - - ANSUL3% 0.000 0.104 30 - - 0.000 2.544 14 - - Virtual 0.000 0.123 30 - - 0.000 3.938 9 - - Phos-Chek 0.000 0.102 30 - - 0.000 2.575 10 - - Barricade 0.000 0.082 30 - - 0.000 3.904 8 - -
0-M
onth
s
ClearETI
-
0.000 0.088 30 - -
-
0.000 3.105 5 - -
-
Dry Control - - - - - - - - - - Wet Control -0.067 0.079 30 - - 4.336 4.561 7 - - Chemguard - - - - - - - - - - Hydrex-AR - - - - - - - - - - Jet-X - - - - - - - - - - Silv-Ex 0.067 0.098 30 - 0.000 3.214 7.865 8 - - ANSUL3% -0.067 0.104 30 - 0.010 -0.524 4.542 12 - - Virtual 0.167 0.149 30 - 0.016 -1.525 3.109 11 - - Phos-Chek 0.267 0.148 30 - 0.123 -1.626 3.762 14 - - Barricade 0.167 0.104 30 - 0.000 -4.188 2.105 12 - -
4-M
onth
s
ClearETI
0.000
0.033 0.104 30 - 0.000
0.635
1.400 4.554 5 - -
0.388
Dry Control - - - - - - - - - - Wet Control -0.033 0.095 30 - - 5.836 5.833 7 - - Chemguard - - - - - - - - - - Hydrex-AR - - - - - - - - - - Jet-X - - - - - - - - - - Silv-Ex 0.100 0.088 30 - 0.000 -2.586 4.753 10 - - ANSUL3% 0.033 0.115 30 - 0.073 -0.607 3.111 14 - - Virtual 0.000 0.113 30 - 0.001 -0.489 3.683 10 - - Phos-Chek -0.200 0.084 30 - 0.000 -0.025 5.532 4 - - Barricade 0.167 0.114 30 - 0.000 -2.949 2.024 11 - -
12-M
onth
s
ClearETI
0.000
-0.067 0.079 30 - 0.000
0.881
-3.550 1.181 4 - -
0.236
Page 233
219
Analysis Notes: Dry Control, Chemguard, Hydrex-AR, and Jet-X excluded due to insufficient Ns.
Leading Shoot Length Condition Reproduction MW-U Tests KW MW-U Tests KW MW-U Tests
SE p p Test SE p p Test SE p p M -/+ N vs D vs W p M -/+ N vs D vs W p M -/+ N vs D vs W - - - - - - - - - - - - - - -
0.000 4.325 7 - - 0.000 0.207 7 - - 0.000 0.149 7 - - - - - - - - - - - - - - - - - - - - - - - - - - - - - - - - - - - - - - - - - - - - - - -
0.000 6.113 7 - - 0.000 0.154 7 - - 0.000 0.184 7 - - 0.000 2.300 14 - - 0.000 0.215 14 - - 0.000 0.097 14 - - 0.000 3.507 9 - - 0.000 0.141 9 - - 0.000 0.000 9 - - 0.000 4.105 10 - - 0.000 0.224 10 - - 0.000 0.000 10 - - 0.000 5.444 8 - - 0.000 0.175 8 - - 0.000 0.000 8 - - 0.000 5.896 5 - -
-
0.000 0.122 5 - -
-
0.000 0.000 5 - - - - - - - - - - - - - - - - -
0.714 3.469 7 - - -0.857 0.261 7 - - -0.357 0.202 7 - - - - - - - - - - - - - - - - - - - - - - - - - - - - - - - - - - - - - - - - - - - - - - -
-5.661 4.728 8 - - -0.594 0.438 8 - 0.161 0.036 0.164 8 - 0.008 -0.673 2.029 12 - - -0.089 0.477 12 - 0.106 -0.024 0.112 12 - 0.854 1.783 3.158 11 - - -1.005 0.340 11 - 0.495 -0.182 0.102 11 - 0.886 4.126 4.221 14 - - -2.221 0.234 14 - 0.008 -0.679 0.124 14 - 0.023 -4.833 5.291 12 - - -0.271 0.179 12 - 0.033 -0.333 0.142 12 - 0.374 -4.500 8.536 5 - -
0.000
-0.450 0.150 5 - 0.565
0.000
-0.200 0.122 5 - 0.674 - - - - - - - - - - - - - - -
7.357 8.959 7 - - -1.929 0.434 7 - - 0.071 0.143 7 - - - - - - - - - - - - - - - - - - - - - - - - - - - - - - - - - - - - - - - - - - - - - - -
-2.386 4.438 10 - - -1.600 0.414 10 - - 0.086 0.133 10 - 0.015 1.821 2.729 14 - - -1.911 0.380 14 - - -0.107 0.114 14 - 0.002 2.056 4.787 10 - - -1.053 0.412 10 - - -0.050 0.050 10 - 0.007 21.275 5.371 4 - - -2.525 0.473 4 - - -0.250 0.250 4 - 0.022 1.670 4.263 11 - - -0.994 0.344 11 - - -0.182 0.122 11 - 0.004 -4.350 8.673 4 - -
0.187
-1.300 0.645 4 - -
0.000
-0.500 0.289 4 - 0.013
Page 234
220
Table 1: Statistical analysis output for effects of fire suppressants on density and growth
variables of field populations (by species) for the without-fire trial at Whiteman Park (Kruskal-
Wallis test and planned Mann-Whitney U test pairwise comparisons). Green and red cells
denote a significant (p<0.05) increase or decrease (respectively) compared to dry control (p vs
D) and wet control (p vs W). Yellow cells denote type-I errors, determined by overlapping
standard errors of means. Species names preceded by ‘*’ denote non-native species. Table
continues across double page and continues over next pages.
Species: Lomandra hermaphrodita (C.R.P.Andrews) C.A.Gardner Continues → → →
Abundance Cover KW MW-U Tests KW MW-U Tests KW Test SE p p Test SE p p Test
Time Treatment
p M -/+ N vs D vs W p M -/+ N vs D vs W p Dry Control 0.000 0.079 30 - - 0.000 0.433 3 - - Wet Control 0.000 0.123 30 - - 0.000 0.144 10 - - Chemguard 0.000 0.294 30 - - 0.000 0.172 13 - - Hydrex-AR 0.000 0.164 30 - - 0.000 0.281 10 - - Jet-X 0.000 0.174 30 - - 0.000 0.075 5 - - Silv-Ex 0.000 0.046 30 - - 0.000 0.350 2 - - ANSUL3% 0.000 0.095 30 - - 0.000 0.535 7 - - Virtual 0.000 0.252 30 - - 0.000 0.115 9 - - Phos-Chek 0.000 0.137 30 - - 0.000 0.167 5 - - Barricade 0.000 0.111 30 - - 0.000 0.353 8 - -
0-M
onth
s
ClearETI
-
0.000 0.141 30 - -
-
0.000 0.046 9 - -
-
Dry Control 0.067 0.088 30 - 0.000 0.577 0.711 5 - 0.683 Wet Control -0.133 0.095 30 0.000 - -0.115 0.092 7 0.683 - Chemguard -0.433 0.157 30 0.012 0.006 -0.091 0.172 11 0.281 0.256 Hydrex-AR 0.033 0.224 30 0.000 0.000 0.018 0.176 8 0.883 0.727 Jet-X 0.167 0.115 30 0.027 0.000 0.024 0.051 12 0.519 0.086 Silv-Ex 0.233 0.180 30 0.000 0.000 -0.448 0.067 4 0.050 0.013 ANSUL3% -0.067 0.111 30 0.000 0.000 0.208 0.666 4 0.327 0.252 Virtual -0.300 0.109 30 0.000 0.000 0.037 0.181 7 0.935 0.403 Phos-Chek -0.033 0.082 30 0.000 0.000 -0.188 0.060 8 0.460 0.293 Barricade 0.133 0.142 30 0.001 0.000 -0.005 0.260 9 0.458 0.148
4-M
onth
s
ClearETI
0.000
0.067 0.142 30 0.011 0.006
0.006
0.948 0.882 11 0.391 0.020
0.162
Dry Control 0.133 0.126 30 - 0.000 -0.177 0.230 5 - - Wet Control -0.033 0.155 30 0.000 - 0.014 0.141 7 - - Chemguard -0.767 0.088 30 0.000 0.000 -0.052 0.166 5 - - Hydrex-AR -0.200 0.109 30 0.000 0.000 -0.004 0.174 7 - - Jet-X -0.033 0.117 30 0.000 0.000 0.164 0.165 5 - - Silv-Ex 0.100 0.084 30 0.000 0.000 -0.288 0.047 4 - - ANSUL3% -0.067 0.088 30 0.000 0.000 -0.270 0.159 5 - - Virtual -0.267 0.154 30 0.000 0.000 -0.002 0.055 5 - - Phos-Chek 0.000 0.109 30 0.000 0.000 0.093 0.084 7 - - Barricade -0.167 0.069 30 0.000 0.000 0.256 0.550 5 - -
12-M
onth
s
ClearETI
0.000
-0.133 0.085 30 0.000 0.000
0.116
0.107 0.093 9 - -
0.088
Page 235
221
Analysis Notes: None.
Leading Shoot Length Condition Reproduction MW-U Tests KW MW-U Tests KW MW-U Tests
SE p p Test SE p p Test SE p p M -/+ N vs D vs W p M -/+ N vs D vs W p M -/+ N vs D vs W
0.000 15.669 3 - - 0.000 0.144 3 - - 0.000 0.000 3 - - 0.000 3.316 10 - - 0.000 0.075 10 - - 0.000 0.000 10 - - 0.000 1.485 13 - - 0.000 0.126 13 - - 0.000 0.000 13 - - 0.000 1.251 10 - - 0.000 0.120 10 - - 0.000 0.000 10 - - 0.000 5.702 5 - - 0.000 0.206 5 - - 0.000 0.200 5 - - 0.000 1.000 2 - - 0.000 0.000 2 - - 0.000 0.000 2 - - 0.000 4.751 7 - - 0.000 0.240 7 - - 0.000 0.000 7 - - 0.000 2.650 9 - - 0.000 0.072 9 - - 0.000 0.000 9 - - 0.000 6.000 5 - - 0.000 0.167 5 - - 0.000 0.000 5 - - 0.000 2.976 8 - - 0.000 0.094 8 - - 0.000 0.000 8 - - 0.000 2.837 9 - -
-
0.000 0.164 9 - -
-
0.000 0.000 9 - - 2.533 6.328 5 - - 0.600 0.245 5 - 0.038 0.200 0.200 5 - 0.237 -6.476 4.194 7 - - -0.083 0.197 7 0.038 - 0.000 0.000 7 0.237 - 4.646 3.356 11 - - -0.451 0.113 11 0.003 0.205 0.000 0.000 11 0.138 1.000 -0.331 4.152 8 - - -0.097 0.126 8 0.028 0.726 0.000 0.000 8 0.206 1.000 7.440 5.333 12 - - 0.070 0.131 12 0.066 0.342 -0.200 0.000 12 0.000 0.000
-15.775
6.164 4 - - -0.975 0.025 4 0.012 0.006 0.000 0.000 4 0.371 1.000 3.798 6.692 4 - - 0.173 0.208 4 0.140 0.561 0.000 0.000 4 0.371 1.000
-12.230
5.111 7 - - 0.079 0.138 7 0.218 0.845 0.000 0.000 7 0.237 1.000 -0.542 7.404 8 - - -0.354 0.305 8 0.039 0.348 0.000 0.000 8 0.206 1.000 -1.979 3.049 9 - - 0.361 0.111 9 0.245 0.037 0.000 0.000 9 0.180 1.000 -4.256 5.347 11 - -
0.001
0.101 0.110 11 0.046 0.615
0.000
0.091 0.091 11 0.554 0.425 -
11.867 8.517 5 - - -0.833 0.124 5 - 0.018 0.000 0.000 5 - 1.000
-2.369 3.377 7 - - -0.030 0.238 7 0.018 - 0.000 0.000 7 1.000 - -0.985 2.960 5 - - -1.704 0.200 5 0.007 0.004 0.000 0.000 5 1.000 1.000 -2.604 4.310 7 - - -0.275 0.323 7 0.222 0.564 0.143 0.143 7 0.398 0.317 14.040 7.341 5 - - -0.630 0.366 5 0.458 0.059 -0.200 0.000 5 0.003 0.001
-14.125
3.490 4 - - -0.563 0.213 4 0.381 0.129 0.000 0.000 4 1.000 1.000 1.814 2.768 5 - - -0.736 0.300 5 0.753 0.165 0.000 0.000 5 1.000 1.000 2.517 4.105 5 - - -0.056 0.303 5 0.075 0.684 0.000 0.000 5 1.000 1.000 5.619 3.440 7 - - -0.238 0.365 7 0.221 0.564 0.000 0.000 7 1.000 1.000 4.588 2.293 5 - - 0.350 0.245 5 0.008 0.285 0.000 0.000 5 1.000 1.000 -0.907 3.528 9 - -
0.013
-0.444 0.144 9 0.116 0.360
0.000
0.111 0.111 9 0.456 0.378
Page 236
222
Table 1: Statistical analysis output for effects of fire suppressants on density and growth
variables of field populations (by species) for the without-fire trial at Whiteman Park (Kruskal-
Wallis test and planned Mann-Whitney U test pairwise comparisons). Green and red cells
denote a significant (p<0.05) increase or decrease (respectively) compared to dry control (p vs
D) and wet control (p vs W). Yellow cells denote type-I errors, determined by overlapping
standard errors of means. Species names preceded by ‘*’ denote non-native species. Table
continues across double page and continues over next pages.
Species: Lyginia barbata R.Br.
Continues → → →
Abundance Cover KW MW-U Tests KW MW-U Tests KW Test SE p p Test SE p p Test
Time Treatment
p M -/+ N vs D vs W p M -/+ N vs D vs W p Dry Control 0.000 1.128 30 - - 0.000 0.108 10 - - Wet Control 0.000 1.058 30 - - 0.000 0.427 22 - - Chemguard 0.000 0.762 30 - - 0.000 1.042 27 - - Hydrex-AR 0.000 1.210 30 - - 0.000 0.093 20 - - Jet-X 0.000 0.725 30 - - 0.000 3.135 19 - - Silv-Ex 0.000 0.709 30 - - 0.000 0.049 15 - - ANSUL3% 0.000 1.466 30 - - 0.000 0.935 21 - - Virtual 0.000 1.781 30 - - 0.000 2.475 16 - - Phos-Chek 0.000 2.163 30 - - 0.000 0.061 29 - - Barricade 0.000 0.874 30 - - 0.000 0.084 25 - -
0-M
onth
s
ClearETI
-
0.000 1.442 30 - -
-
0.000 0.101 27 - -
-
Dry Control -0.533
0.860 30 - 0.821 -0.049 0.072 11 - 0.451 Wet Control 0.867 1.295 30 0.821 - -0.155 0.131 19 0.451 - Chemguard 0.267 0.865 30 0.196 0.543 0.363 1.119 25 0.001 0.000 Hydrex-AR 2.700 1.695 30 0.964 0.167 0.115 0.238 20 0.247 0.286 Jet-X 0.800 0.717 30 0.000 0.422 -2.446 0.814 23 0.001 0.000 Silv-Ex -
0.033 0.742 30 0.002 0.730 0.256 0.287 13 0.794 0.257
ANSUL3% -1.233
1.361 30 0.085 0.038 0.269 1.228 16 0.001 0.000 Virtual 0.333 1.787 30 0.161 0.054 0.870 2.631 17 0.004 0.001 Phos-Chek -
2.233 1.486 30 0.084 0.085 0.286 0.115 28 0.151 0.027
Barricade 1.067 1.074 30 0.480 0.266 0.247 0.256 26 0.594 0.168
4-M
onth
s
ClearETI
0.003
-2.533
0.900 30 0.108 0.068
0.000
0.545 0.347 25 0.548 0.053
0.516
Dry Control 0.300 1.074 30 - 0.460 -0.066 0.025 11 - 0.043 Wet Control -
0.267 1.145 30 0.460 - -0.177 0.158 18 0.043 -
Chemguard 0.100 0.685 30 0.696 0.141 0.288 1.075 26 0.001 0.000 Hydrex-AR 0.133 1.098 30 0.350 0.145 0.260 0.241 20 0.836 0.011 Jet-X 0.900 0.865 30 0.002 0.166 -1.966 1.135 18 0.001 0.000 Silv-Ex -
0.433 0.620 30 0.006 0.501 1.848 1.118 15 0.264 0.003
ANSUL3% -2.033
1.090 30 0.038 0.046 0.932 1.736 17 0.003 0.006 Virtual -
1.867 1.167 30 0.021 0.032 0.088 2.186 18 0.003 0.000
Phos-Chek -3.633
1.299 30 0.029 0.026 0.178 0.086 28 0.042 0.001 Barricade 0.133 1.020 30 0.729 0.181 0.172 0.126 23 0.868 0.006
12-M
onth
s
ClearETI
0.000
-2.733
0.747 30 0.071 0.126
0.000
0.807 0.735 28 0.318 0.015
0.972
Page 237
223
Analysis Notes: None.
Leading Shoot Length Condition Reproduction MW-U Tests KW MW-U Tests KW MW-U Tests
SE p p Test SE p p Test SE p p M -/+ N vs D vs W p M -/+ N vs D vs W p M -/+ N vs D vs W
0.000 5.823 10 - - 0.000 0.181 10 - - 0.000 0.107 10 - - 0.000 2.241 22 - - 0.000 0.061 22 - - 0.000 0.072 22 - - 0.000 2.119 27 - - 0.000 0.089 27 - - 0.000 0.067 27 - - 0.000 2.368 20 - - 0.000 0.114 20 - - 0.000 0.089 20 - - 0.000 2.979 19 - - 0.000 0.114 19 - - 0.000 0.099 19 - - 0.000 2.171 15 - - 0.000 0.086 15 - - 0.000 0.102 15 - - 0.000 2.503 21 - - 0.000 0.074 21 - - 0.000 0.079 21 - - 0.000 3.108 16 - - 0.000 0.060 16 - - 0.000 0.075 16 - - 0.000 1.662 29 - - 0.000 0.049 29 - - 0.000 0.108 29 - - 0.000 1.803 25 - - 0.000 0.050 25 - - 0.000 0.055 25 - - 0.000 3.392 27 - -
-
0.000 0.097 27 - -
-
0.000 0.058 27 - - -7.853 5.525 11 - - -0.330 0.150 11 - - -0.045 0.082 11 - - -1.257 2.520 19 - - -0.348 0.056 19 - - 0.034 0.065 19 - - -0.888 2.106 25 - - -0.186 0.096 25 - - -0.012 0.065 25 - - -1.584 2.711 20 - - -0.382 0.066 20 - - -0.059 0.075 20 - - -6.322 3.426 23 - - -0.217 0.107 23 - - -0.107 0.092 23 - - -2.672 2.726 13 - - -0.313 0.112 13 - - 0.003 0.097 13 - - -6.751 3.649 16 - - -0.211 0.085 16 - - -0.166 0.078 16 - - -0.014 2.824 17 - - -0.315 0.071 17 - - 0.101 0.062 17 - - 0.249 1.469 28 - - -0.380 0.053 28 - - -0.116 0.055 28 - - -1.854 2.127 26 - - -0.185 0.072 26 - - -0.085 0.061 26 - - -0.288 1.962 25 - -
0.522
-0.279 0.088 25 - -
0.380
-0.017 0.066 25 - - -4.934 3.526 11 - - -0.156 0.078 11 - 0.006 0.084 0.102 11 - 0.051 -5.074 2.262 18 - - -0.578 0.093 18 0.006 - -0.184 0.039 18 0.051 - -4.592 2.202 26 - - -0.558 0.089 26 0.006 0.793 0.008 0.066 26 0.764 0.044 -2.027 2.863 20 - - -0.664 0.089 20 0.001 0.640 -0.031 0.077 20 0.430 0.837 -4.909 3.634 18 - - -0.395 0.153 18 0.192 0.590 -0.094 0.095 18 0.258 0.655 -3.390 3.903 15 - - -0.515 0.228 15 0.696 0.192 -0.023 0.109 15 0.286 0.913 -5.328 3.483 17 - - -0.408 0.200 17 0.057 0.843 -0.133 0.076 17 0.094 0.973 -2.997 3.638 18 - - -0.627 0.098 18 0.001 0.899 -0.156 0.070 18 0.065 0.799 -5.461 1.674 28 - - -1.177 0.125 28 0.000 0.002 -0.309 0.047 28 0.001 0.017 -3.124 1.601 23 - - -0.537 0.091 23 0.019 0.386 -0.157 0.047 23 0.028 0.561 -2.852 2.167 28 - -
0.000
-0.389 0.102 28 0.365 0.105
0.033
-0.058 0.064 28 0.326 0.733
Page 238
224
Table 1: Statistical analysis output for effects of fire suppressants on density and growth
variables of field populations (by species) for the without-fire trial at Whiteman Park (Kruskal-
Wallis test and planned Mann-Whitney U test pairwise comparisons). Green and red cells
denote a significant (p<0.05) increase or decrease (respectively) compared to dry control (p vs
D) and wet control (p vs W). Yellow cells denote type-I errors, determined by overlapping
standard errors of means. Species names preceded by ‘*’ denote non-native species. Table
continues across double page and continues over next pages.
Species: Pattersonia occidentalis R.Br.
Continues → → →
Abundance Cover KW MW-U Tests KW MW-U Tests KW Test SE p p Test SE p p Test
Time Treatment
p M -/+ N vs D vs W p M -/+ N vs D vs W p Dry Control 0.000 0.101 30 - - 0.000 5.367 4 - - Wet Control 0.000 0.132 30 - - 0.000 3.837 9 - - Chemguard 0.000 0.124 30 - - 0.000 4.251 10 - - Hydrex-AR 0.000 0.142 30 - - 0.000 7.555 9 - - Jet-X 0.000 0.131 30 - - 0.000 2.769 8 - - Silv-Ex 0.000 0.122 30 - - 0.000 3.106 8 - - ANSUL3% 0.000 0.079 30 - - 0.000 1.633 3 - - Virtual 0.000 0.098 30 - - 0.000 3.791 8 - - Phos-Chek 0.000 0.115 30 - - 0.000 2.684 12 - - Barricade 0.000 0.133 30 - - 0.000 2.081 12 - -
0-M
onth
s
ClearETI
-
0.000 0.245 30 - -
-
0.000 3.378 14 - -
-
Dry Control 0.067 0.126 30 - 0.001 6.000 6.375 5 - - Wet Control 0.067 0.150 30 0.001 - 0.670 3.848 9 - - Chemguard -
0.067 0.122 30 0.000 0.000 1.048 3.113 8 - -
Hydrex-AR -0.067
0.123 30 0.001 0.000 2.972 7.558 9 - - Jet-X 0.067 0.164 30 0.000 0.000 1.421 1.742 8 - - Silv-Ex -
0.033 0.111 30 0.000 0.000 3.106 3.000 8 - -
ANSUL3% 0.067 0.088 30 0.000 0.001 0.933 0.943 5 - - Virtual -
0.067 0.124 30 0.000 0.001 -0.242 1.294 4 - -
Phos-Chek 0.067 0.133 30 0.031 0.006 2.075 2.604 12 - - Barricade 0.000 0.142 30 0.010 0.002 1.177 2.367 11 - -
4-M
onth
s
ClearETI
0.000
-0.200
0.162 30 0.166 0.036
0.993
4.262 4.785 14 - -
0.509
Dry Control 0.033 0.124 30 - 0.013 3.446 3.512 4 - - Wet Control 0.067 0.124 30 0.013 - -0.481 2.856 11 - - Chemguard -
0.100 0.111 30 0.000 0.000 1.298 2.989 8 - -
Hydrex-AR 0.000 0.133 30 0.004 0.000 0.961 6.330 10 - - Jet-X 0.067 0.184 30 0.000 0.003 7.696 7.016 8 - - Silv-Ex 0.033 0.132 30 0.000 0.002 0.387 2.902 8 - - ANSUL3% 0.133 0.095 30 0.000 0.005 2.062 1.494 7 - - Virtual 0.100 0.113 30 0.003 0.002 -3.005 1.480 10 - - Phos-Chek 0.033 0.150 30 0.004 0.001 0.350 2.367 10 - - Barricade 0.033 0.133 30 0.042 0.004 -0.919 1.847 12 - -
12-M
onth
s
ClearETI
0.000
-0.133
0.167 30 0.129 0.028
0.410
-2.158 3.183 13 - -
0.206
Page 239
225
Analysis Notes: None.
Leading Shoot Length Condition Reproduction MW-U Tests KW MW-U Tests KW MW-U Tests
SE p p Test SE p p Test SE p p M -/+ N vs D vs W p M -/+ N vs D vs W p M -/+ N vs D vs W
0.000 6.243 4 - - 0.000 0.213 4 - - 0.000 0.239 4 - - 0.000 3.307 9 - - 0.000 0.056 9 - - 0.000 0.161 9 - - 0.000 4.214 10 - - 0.000 0.140 10 - - 0.000 0.134 10 - - 0.000 4.673 9 - - 0.000 0.246 9 - - 0.000 0.139 9 - - 0.000 4.999 8 - - 0.000 0.231 8 - - 0.000 0.000 8 - - 0.000 4.041 8 - - 0.000 0.170 8 - - 0.000 0.162 8 - - 0.000 10.693 3 - - 0.000 0.441 3 - - 0.000 0.000 3 - - 0.000 7.717 8 - - 0.000 0.400 8 - - 0.000 0.000 8 - - 0.000 3.154 12 - - 0.000 0.135 12 - - 0.000 0.139 12 - - 0.000 2.005 12 - - 0.000 0.198 12 - - 0.000 0.142 12 - - 0.000 2.182 14 - -
-
0.000 0.123 14 - -
-
0.000 0.124 14 - - 0.292 3.494 5 - -0.363 0.200 5 - 0.312 0.158 0.226 5 - - -2.944 6.140 9 - 0.130 0.264 9 0.312 - -0.130 0.128 9 - - -0.788 4.208 8 0.238 0.302 8 0.185 0.923 0.438 0.162 8 - - 3.111 5.117 9 0.361 0.110 9 0.008 0.068 0.000 0.162 9 - - -0.490 4.863 8 0.094 0.066 8 0.011 0.770 0.281 0.160 8 - - -2.500 3.285 8 -0.313 0.230 8 0.232 0.382 0.000 0.162 8 - - 4.200 6.538 5 -0.533 0.339 5 0.915 0.122 0.200 0.200 5 - -
11.833 3.060 4 -0.833 0.572 4 0.319 0.120 0.125 0.125 4 - - -1.000 2.861 12 0.188 0.149 12 0.017 0.471 0.000 0.139 12 - - -8.927 4.700 11 -0.065 0.218 11 0.333 0.675 -0.045 0.127 11 - - -1.780 2.352 14
0.038
0.164 0.092 14 0.004 1.000
0.167
-0.060 0.127 14 - - -0.917 3.714 4 - -1.146 0.083 4 - 0.354 0.375 0.250 4 - 0.477 2.547 4.479 11 - -0.665 0.211 11 0.354 - -0.143 0.124 11 0.477 - -0.225 4.740 8 -0.981 0.183 8 0.606 0.280 0.125 0.183 8 0.858 0.012 9.317 4.327 10 -0.531 0.228 10 0.064 0.571 -0.111 0.167 10 0.026 0.463 0.042 3.977 8 -0.250 0.164 8 0.005 0.317 0.200 0.136 8 0.361 0.036 -2.500 3.525 8 -0.875 0.334 8 0.492 0.803 0.063 0.157 8 0.727 0.016 -5.786 4.475 7 -1.655 0.404 7 0.126 0.040 0.071 0.071 7 0.145 0.073 11.425 3.855 10 0.238 0.376 10 0.022 0.033 0.000 0.000 10 0.074 0.054 0.883 3.438 10 0.421 0.297 10 0.004 0.013 0.008 0.145 10 0.219 0.381 -3.764 4.183 12 -0.493 0.278 12 0.176 0.665 0.000 0.128 12 0.702 0.009 -1.876 2.006 13
0.001
-0.144 0.194 13 0.012 0.123
0.049
-0.272 0.107 13 0.026 0.421
Page 240
226
Table 1: Statistical analysis output for effects of fire suppressants on density and growth
variables of field populations (by species) for the without-fire trial at Whiteman Park (Kruskal-
Wallis test and planned Mann-Whitney U test pairwise comparisons). Green and red cells
denote a significant (p<0.05) increase or decrease (respectively) compared to dry control (p vs
D) and wet control (p vs W). Yellow cells denote type-I errors, determined by overlapping
standard errors of means. Species names preceded by ‘*’ denote non-native species. Table
continues across double page and continues over next pages.
Species: Xanthorrhoea preissii Endl.
Continues → → →
Abundance Cover KW MW-U Tests KW MW-U Tests KW Test SE p p Test SE p p Test
Time Treatment
p M -/+ N vs D vs W p M -/+ N vs D vs W p Dry Control 0.000 0.104 30 - - 0.000 29.167 2 - - Wet Control 0.000 0.149 30 - - 0.000 12.437 7 - - Chemguard 0.000 0.124 30 - - 0.000 17.337 4 - - Hydrex-AR 0.000 0.195 30 - - 0.000 7.372 6 - - Jet-X 0.000 0.084 30 - - 0.000 9.141 4 - - Silv-Ex - - - - - - - - - - ANSUL3% 0.000 0.069 30 - - 0.000 9.149 5 - - Virtual 0.000 0.084 30 - - 0.000 10.407 4 - - Phos-Chek - - - - - - - - - - Barricade - - - - - - - - - -
0-M
onth
s
ClearETI
-
0.000 0.079 30 - -
-
0.000 17.892 3 - -
-
Dry Control 0.100 0.149 30 - 0.000 -23.333
12.500 3 - - Wet Control 0.067 0.190 30 0.000 - -5.099 14.644 6 - - Chemguard 0.033 0.151 30 0.000 0.000 -0.083 17.335 4 - - Hydrex-AR 0.133 0.224 30 0.000 0.805 -1.321 9.895 7 - - Jet-X -
0.033 0.079 30 0.000 0.000 -
11.375 1.155 3 - -
Silv-Ex - - - - - - - - - - ANSUL3% 0.000 0.069 30 0.000 0.000 -3.500 7.593 5 - - Virtual 0.133 0.153 30 0.000 0.000 -
10.525 4.247 5 - -
Phos-Chek - - - - - - - - - - Barricade - - - - - - - - - -
4-M
onth
s
ClearETI
0.000
0.033 0.069 30 0.531 0.000
0.256
-1.133 21.404 5 - -
0.083
Dry Control 0.067 0.147 30 - 0.000 -12.708
14.375 2 - - Wet Control 0.033 0.164 30 0.000 - -3.333 8.659 7 - - Chemguard 0.033 0.106 30 0.000 0.000 0.042 15.461 6 - - Hydrex-AR 0.200 0.238 30 0.000 0.897 6.152 12.867 7 - - Jet-X 0.000 0.084 30 0.000 0.000 0.875 8.370 4 - - Silv-Ex - - - - - - - - - - ANSUL3% 0.000 0.084 30 0.000 0.000 3.025 9.756 4 - - Virtual 0.033 0.088 30 0.000 0.000 0.275 11.369 5 - - Phos-Chek - - - - - - - - - - Barricade - - - - - - - - - -
12-M
onth
s
ClearETI
0.000
0.033 0.069 30 0.288 0.000
0.802
2.267 18.694 5 - -
0.578
Page 241
227
Analysis Notes: Growth data (Cover, Leading Shoot Length, Condition, and Reproduction) for Silv-Ex, Phos-Chek, and Barricade excluded from analysis; insufficient Ns.
Leading Shoot Length Condition Reproduction MW-U Tests KW MW-U Tests KW MW-U Tests
SE p p Test SE p p Test SE p p M -/+ N vs D vs W p M -/+ N vs D vs W p M -/+ N vs D vs W
0.000 22.000 2 - - 0.000 0.417 2 - - 0.000 0.000 2 - - 0.000 10.137 7 - - 0.000 0.161 7 - - 0.000 0.000 7 - - 0.000 6.632 4 - - 0.000 0.289 4 - - 0.000 0.000 4 - - 0.000 10.753 6 - - 0.000 0.132 6 - - 0.000 0.000 6 - - 0.000 14.822 4 - - 0.000 0.315 4 - - 0.000 0.000 4 - -
- - - - - - - - - - - - - - - 0.000 19.439 5 - - 0.000 0.200 5 - - 0.000 0.000 5 - - 0.000 7.785 4 - - 0.000 0.144 4 - - 0.000 0.000 4 - -
- - - - - - - - - - - - - - - - - - - - - - - - - - - - - -
0.000 8.511 3 - -
-
0.000 0.601 3 - -
-
0.000 0.000 3 - - 3.917 9.794 3 - - -0.542 0.191 3 - 0.120 0.000 0.000 3 - - -5.266 6.737 6 - - 0.016 0.156 6 0.120 - 0.000 0.000 6 - - 9.146 3.865 4 - - 0.104 0.270 4 0.077 1.000 0.000 0.000 4 - -
-24.921
18.332 7 - - 0.044 0.141 7 0.051 0.774 0.000 0.000 7 - - -
22.875 14.189 3 - - 0.292 0.167 3 0.046 0.435 0.000 0.000 3 - -
- - - - - - - - - - - - - - - 6.800 18.819 5 - - 0.400 0.100 5 0.017 0.039 0.000 0.000 5 - - 7.275 5.402 5 - - -0.700 0.200 5 0.647 0.027 0.000 0.000 5 - -
- - - - - - - - - - - - - - - - - - - - - - - - - - - - - -
5.933 6.384 5 - -
0.017
0.233 0.245 5 0.021 0.579
1.000
0.000 0.000 5 - - 13.125 19.375 2 - - -0.354 0.188 2 - 0.370 0.000 0.000 2 - - -7.452 7.350 7 - - -0.107 0.246 7 0.370 - 0.000 0.000 7 - - 3.375 6.682 6 - - -0.646 0.112 6 0.169 0.060 0.000 0.000 6 - - -5.059 6.033 7 - - -0.559 0.221 7 0.378 0.082 0.000 0.000 7 - - 4.375 20.463 4 - - 0.125 0.204 4 0.159 0.443 0.000 0.000 4 - -
- - - - - - - - - - - - - - - 9.850 17.269 4 - - -0.513 0.120 4 0.348 0.250 0.000 0.000 4 - -
-19.275
17.316 5 - - -0.600 0.150 5 0.200 0.113 0.000 0.000 5 - - - - - - - - - - - - - - - - - - - - - - - - - - - - - - - -
6.533 7.664 5 - -
0.017
0.233 0.430 5 0.421 0.935
1.000
0.000 0.000 5 - -
Page 242
228
Table 2: Statistical analysis output for effects of fire suppressants on density and growth
variables of field populations (by species) for the with-fire trial at Wanneroo (Kruskal-Wallis
test and planned Mann-Whitney U test pairwise comparisons). Green and red cells denote a
significant (p<0.05) increase or decrease (respectively) compared to dry control (p vs D) and
wet control (p vs W). Yellow cells denote type-I errors, determined by overlapping standard
errors of means. Table continues across double page and continues over next pages.
Species: Alexgeorgea nitens (Nees) L.A.S.Johnson & B.G.Briggs Continues → → →
Abundance Cover KW MW-U Tests KW MW-U Tests KW Test SE p p Test SE p p Test
Time Treatment
p M -/+ N vs D vs W p M -/+ N vs D vs W p Dry Control 0.000 0.033 30 - - 2.000 - 1 - - Wet Control 0.000 0.056 30 - - 0.567 0.233 3 - - Silv-Ex 0.000 0.000 30 - - - - 0 - - Clear ETI 0.000 0.046 30 - - 0.750 0.250 2 - - 0-
Mon
ths
Phos-Chek
-
0.000 0.000 30 - -
-
- - 0 - -
-
Dry Control 0.000 0.033 30 - 0.000 2.000 - 1 - - Wet Control -0.033 0.046 30 0.000 - 1.250 0.750 2 - - Silv-Ex 0.000 0.000 30 0.000 0.000 - - 0 - - Clear ETI -0.033 0.033 30 0.000 0.000 0.200 - 1 - - 3-
Mon
ths
Phos-Chek
0.000
0.000 0.000 30 0.000 0.000
-
- - 0 - -
-
Dry Control 0.500 0.093 30 - 0.005 1.906 0.374 16 - - Wet Control 0.533 0.089 30 0.005 - 2.028 0.460 18 - - Silv-Ex 0.467 0.093 30 0.003 0.025 1.164 0.230 14 - - Clear ETI 0.367 0.092 30 0.000 0.051 1.231 0.209 13 - - 6-
Mon
ths
Phos-Chek
0.000
0.500 0.093 30 0.001 0.011
0.082
2.500 0.613 15 - -
0.075
Dry Control 0.400 0.092 30 - 0.091 3.346 0.578 13 - 0.129 Wet Control 0.567 0.088 30 0.091 - 2.590 0.558 20 0.129 - Silv-Ex 0.433 0.092 30 0.000 0.091 1.023 0.196 13 0.001 0.006 Clear ETI 0.367 0.092 30 0.000 0.091 3.115 0.861 13 0.299 0.940 9-
Mon
ths
Phos-Chek
0.000
0.567 0.092 30 0.000 0.004
0.005
2.018 0.366 17 0.062 0.440
0.038
Dry Control 0.467 0.093 30 - 0.012 2.687 0.513 15 - 0.607 Wet Control 0.533 0.102 30 0.012 - 2.750 0.419 18 0.607 - Silv-Ex 0.400 0.091 30 0.006 0.081 1.325 0.324 12 0.055 0.007 Clear ETI 0.367 0.092 30 0.000 0.045 2.269 0.647 13 0.428 0.163 12
-Mon
ths
Phos-Chek
0.000
0.467 0.093 30 0.001 0.024
0.022
1.339 0.237 14 0.080 0.010
0.239
Species: Bossiaea eriocarpa Benth.
Continues → → →
Abundance Cover KW MW-U Tests KW MW-U Tests KW Test SE p p Test SE p p Test
Time Treatment
p M -/+ N vs D vs W p M -/+ N vs D vs W p Dry Control 0.000 0.000 30 - - - - 0 - - Wet Control 0.000 0.000 30 - - - - 0 - - Silv-Ex 0.000 0.000 30 - - - - 0 - - Clear ETI 0.000 0.000 30 - - - - 0 - - 0-
Mon
ths
Phos-Chek
-
0.000 0.000 30 - -
-
- - 0 - -
-
Dry Control 0.000 0.000 30 - - - - 0 - - Wet Control 0.033 0.033 30 - - 0.300 . 1 - - Silv-Ex 0.100 0.100 30 - - 0.100 . 1 - - Clear ETI 0.033 0.033 30 - - 0.100 . 1 - - 3-
Mon
ths
Phos-Chek
0.731
0.000 0.000 30 - -
-
- - 0 - -
-
Dry Control 0.633 0.212 30 - 0.032 1.467 0.800 9 - - Wet Control 1.300 0.296 30 0.032 - 0.873 0.341 18 - - Silv-Ex 0.300 0.128 30 0.302 0.001 0.250 0.150 6 - - Clear ETI 0.567 0.177 30 0.777 0.043 0.766 0.291 11 - - 6-
Mon
ths
Phos-Chek
0.005
0.300 0.119 30 0.412 0.002
0.759
0.943 0.688 7 - -
0.778
Dry Control 0.500 0.184 30 - - 1.806 1.222 8 - - Wet Control 0.900 0.319 30 - - 1.477 0.507 13 - - Silv-Ex 0.233 0.092 30 - - 0.733 0.401 6 - - Clear ETI 0.433 0.124 30 - - 1.160 0.321 10 - - 9-
Mon
ths
Phos-Chek
0.180
0.300 0.128 30 - -
0.662
1.400 1.222 6 - -
0.374
Dry Control 0.300 0.128 30 - - 1.728 1.193 6 - - Wet Control 0.600 0.177 30 - - 1.667 0.671 12 - - Silv-Ex 0.167 0.084 30 - - 1.425 0.772 4 - - Clear ETI 0.400 0.132 30 - - 2.281 1.002 9 - - 12
-Mon
ths
Phos-Chek
0.101
0.200 0.088 30 - -
0.889
1.790 1.439 5 - -
0.692
Page 243
229
Analysis Notes: Clonal species; abundance scored as "1" plant when recorded within a quadrat. Abundance data has been centred. Growth variables (Cover, Leading Shoot Length, Condition, and Reproduction) not centred due to low Ns at 0 and 3 months.
Leading Shoot Length Condition Reproduction MW-U Tests KW MW-U Tests KW MW-U Tests
SE p p Test SE p p Test SE p p M -/+ N vs D vs W p M -/+ N vs D vs W p M -/+ N vs D vs W
13.000 - 1 - - 2.500 - 1 - - 0.000 - 1 - - 9.333 4.372 3 - - 0.167 0.167 3 - - 0.000 0.000 3 - -
- - 0 - - - - 0 - - - - 0 - - 20.500 6.500 2 - - 0.750 0.250 2 - - 0.500 0.500 2 - -
- - 0 - -
-
- - 0 - -
-
- - 0 - - 15.000 - 1 - - 2.500 - 1 - - 0.000 - 1 - - 10.500 3.500 2 - - 1.250 0.750 2 - - 0.000 0.000 2 - -
- - 0 - - - - 0 - - - - 0 - - 21.000 - 1 - - 2.000 - 1 - - 0.000 - 1 - -
- - 0 - -
-
- - 0 - -
-
- - 0 - - 12.750 0.722 16 - - 4.438 0.101 16 - - 0.000 0.000 16 - - 10.611 0.444 18 - - 4.056 0.089 18 - - 0.000 0.000 18 - - 12.714 0.624 14 - - 4.179 0.154 14 - - 0.000 0.000 14 - - 13.846 1.454 13 - - 4.308 0.121 13 - - 0.000 0.000 13 - - 12.667 0.722 15 - -
0.058
4.333 0.080 15 - -
1.000
0.000 0.000 15 - - 13.154 0.775 13 - 0.094 4.038 0.089 13 - - 0.000 0.000 13 - - 11.650 0.418 20 0.094 - 3.775 0.068 20 - - 0.000 0.000 20 - - 12.077 0.828 13 0.365 0.401 3.885 0.115 13 - - 0.000 0.000 13 - - 15.000 0.981 13 0.188 0.005 3.923 0.077 13 - - 0.000 0.000 13 - - 12.294 0.741 17 0.351 0.222
0.321
3.853 0.083 17 - -
1.000
0.000 0.000 17 - - 12.533 1.320 15 - - 3.600 0.196 15 - - 0.067 0.067 15 - - 10.889 0.378 18 - - 3.653 0.139 18 - - 0.000 0.000 18 - - 12.083 0.763 12 - - 3.750 0.131 12 - - 0.000 0.000 12 - - 12.077 0.916 13 - - 4.000 0.000 13 - - 0.000 0.000 13 - - 10.214 0.859 14 - -
0.174
3.679 0.162 14 - -
0.434
0.000 0.000 14 - -
Analysis Notes: Data centring not performed; no plants at 0 months, insufficient Ns at 3 months.
Leading Shoot Length Condition Reproduction MW-U Tests KW MW-U Tests KW MW-U Tests
SE p p Test SE p p Test SE p p M -/+ N vs D vs W p M -/+ N vs D vs W p M -/+ N vs D vs W - - 0 - - - - 0 - - - - 0 - - - - 0 - - - - 0 - - - - 0 - - - - 0 - - - - 0 - - - - 0 - - - - 0 - - - - 0 - - - - 0 - - - - 0 - -
-
- - 0 - -
-
- - 0 - - - - 0 - - - - 0 - - - - 0 - -
6.000 . 1 - - 2.500 . 1 - - 0.000 . 1 - - 5.000 . 1 - - 4.500 . 1 - - 0.000 . 1 - - 12.000 . 1 - - 3.000 . 1 - - 0.000 . 1 - -
- - 0 - -
-
- - 0 - -
-
- - 0 - - 13.407 3.276 9 - - 3.389 0.190 9 - - 0.000 0.000 9 - - 13.839 2.867 18 - - 3.481 0.123 18 - - 0.056 0.056 18 - - 9.833 3.219 6 - - 3.333 0.247 6 - - 0.000 0.000 6 - - 16.841 5.159 11 - - 3.477 0.145 11 - - 0.000 0.000 11 - - 12.714 4.139 7 - -
0.298
3.000 0.189 7 - -
0.766
0.000 0.000 7 - - 13.927 3.065 8 - - 2.911 0.252 8 - - 0.000 0.000 8 - - 18.120 3.611 13 - - 2.887 0.268 13 - - 0.000 0.000 13 - - 16.500 5.084 6 - - 3.500 0.289 6 - - 0.000 0.000 6 - - 24.250 4.097 10 - - 2.825 0.092 10 - - 0.000 0.000 10 - - 15.000 5.645 6 - -
0.309
3.167 0.279 6 - -
1.000
0.000 0.000 6 - - 15.889 6.106 6 - - 3.083 0.239 6 - 0.690 0.000 0.000 6 - - 18.521 3.496 12 - - 3.059 0.159 12 0.690 - 0.000 0.000 12 - - 20.000 5.431 4 - - 3.875 0.315 4 0.079 0.038 0.000 0.000 4 - - 24.241 4.747 9 - - 2.722 0.147 9 0.142 0.060 0.000 0.000 9 - - 21.300 7.134 5 - -
0.049
3.450 0.421 5 0.777 0.623
1.000
0.000 0.000 5 - -
Page 244
230
Table 2 (continued): Statistical analysis output for effects of fire suppressants on density and
growth variables of field populations (by species) for the with-fire trial at Wanneroo (Kruskal-
Wallis test and planned Mann-Whitney U test pairwise comparisons). Green and red cells
denote a significant (p<0.05) increase or decrease (respectively) compared to dry control (p vs
D) and wet control (p vs W). Yellow cells denote type-I errors, determined by overlapping
standard errors of means. Species names preceded by ‘*’ denote non-native species. Table
continues across double page and continues over next pages.
Species: *Briza maxima L.
Continues → → →
Abundance Cover KW MW-U Tests KW MW-U Tests KW Test SE p p Test SE p p Test
Time Treatment
p M -/+ N vs D vs W p M -/+ N vs D vs W p Dry Control 0.000 0.000 30 - - - - 0 - - Wet Control 0.000 0.000 30 - - - - 0 - - Silv-Ex 0.000 0.000 30 - - - - 0 - - Clear ETI 0.000 0.000 30 - - - - 0 - - 0-
Mon
ths
Phos-Chek
-
0.000 0.000 30 - -
-
- - 0 - -
-
Dry Control 0.000 0.000 30 - - - - 0 - - Wet Control 0.000 0.000 30 - - - - 0 - - Silv-Ex 0.000 0.000 30 - - - - 0 - - Clear ETI 0.000 0.000 30 - - - - 0 - - 3-
Mon
ths
Phos-Chek
-
0.000 0.000 30 - -
-
- - 0 - -
-
Dry Control 0.400 0.306 30 - - 0.833 0.636 3 - - Wet Control 0.700 0.210 30 - - 0.492 0.114 10 - - Silv-Ex 0.533 0.184 30 - - 0.667 0.195 9 - - Clear ETI 1.167 0.375 30 - - 0.889 0.294 9 - - 6-
Mon
ths
Phos-Chek
0.257
1.200 0.461 30 - -
0.091
2.322 0.562 9 - -
0.405
Dry Control 0.333 0.237 30 - 0.176 0.100 0.000 2 - 0.038 Wet Control 0.300 0.119 30 0.176 - 0.717 0.130 6 0.038 - Silv-Ex 0.367 0.176 30 0.460 0.657 1.304 0.660 4 0.060 0.738 Clear ETI 0.433 0.207 30 0.277 0.869 1.200 0.339 5 0.047 0.291 9-
Mon
ths
Phos-Chek
0.033
1.133 0.425 30 0.004 0.094
0.001
3.991 0.612 12 0.027 0.001
0.249
Dry Control 0.033 0.033 30 - - 0.100 - 1 - - Wet Control 0.167 0.097 30 - - 0.667 0.167 3 - - Silv-Ex 0.233 0.104 30 - - 1.470 0.570 5 - - Clear ETI 0.133 0.079 30 - - 1.067 0.521 3 - - 12
-Mon
ths
Phos-Chek
0.411
0.700 0.418 30 - -
0.183
2.200 0.583 5 - -
0.049
Species: Burchardia congesta Lindl.
Continues → → →
Abundance Cover KW MW-U Tests KW MW-U Tests KW Test SE p p Test SE p p Test
Time Treatment
p M -/+ N vs D vs W p M -/+ N vs D vs W p Dry Control 0.000 1.708 30 - - 0.000 0.003 28 - - Wet Control 0.000 1.904 30 - - 0.000 0.007 30 - - Silv-Ex 0.000 2.186 30 - - 0.000 0.007 29 - - Clear ETI 0.000 2.194 30 - - 0.000 0.009 30 - - 0-
Mon
ths
Phos-Chek
-
0.000 0.844 30 - -
-
0.000 0.003 24 - -
-
Dry Control 3.800 2.593 30 - 0.322 0.043 0.009 29 - - Wet Control -1.367 1.117 30 0.322 - 0.032 0.010 29 - - Silv-Ex -3.767 0.826 30 0.107 0.081 0.062 0.015 28 - - Clear ETI -3.867 1.058 30 0.017 0.083 0.069 0.026 30 - - 3-
Mon
ths
Phos-Chek
0.017
-0.900 0.550 30 0.756 0.847
0.194
0.071 0.040 25 - -
0.923
Dry Control -10.133
0.277 30 - 0.000 0.075 0.037 16 - 1.000 Wet Control -
12.600 0.396 30 0.000 - 0.070 0.022 20 1.000 -
Silv-Ex -10.300
0.415 30 0.823 0.000 0.056 0.023 23 0.114 0.030 Clear ETI -
11.800 0.323 30 0.000 0.015 0.026 0.021 23 0.007 0.002 6-
Mon
ths
Phos-Chek
0.000
- - - - -
0.002
- - - - -
0.829
Dry Control -10.567
0.190 30 - 0.000 0.057 0.013 13 - 0.052 Wet Control -
13.933 0.171 30 0.000 - 0.109 0.056 15 0.052 -
Silv-Ex -11.467
0.160 30 0.109 0.000 0.032 0.012 18 0.001 0.000 Clear ETI -
12.600 0.160 30 0.000 0.000 0.042 0.011 17 0.006 0.002 9-
Mon
ths
Phos-Chek
0.000
- - - - -
0.000
- - - - -
0.546
Dry Control -4.133 1.139 30 - 0.711 0.063 0.032 29 - - Wet Control -5.367 0.762 30 0.711 - 0.029 0.016 29 - - Silv-Ex -7.467 0.565 30 0.094 0.021 0.031 0.015 29 - - Clear ETI -6.833 0.810 30 0.024 0.078 0.035 0.015 30 - - 12
-Mon
ths
Phos-Chek
0.000
-2.800 0.454 30 0.062 0.083
0.410
0.009 0.008 21 - -
0.196
Page 245
231
Analysis Notes: Data not centred; no plants at 0 and 3 months.
Leading Shoot Length Condition Reproduction MW-U Tests KW MW-U Tests KW MW-U Tests
SE p p Test SE p p Test SE p p M -/+ N vs D vs W p M -/+ N vs D vs W p M -/+ N vs D vs W - - 0 - - - - 0 - - - - 0 - - - - 0 - - - - 0 - - - - 0 - - - - 0 - - - - 0 - - - - 0 - - - - 0 - - - - 0 - - - - 0 - - - - 0 - -
-
- - 0 - -
-
- - 0 - - - - 0 - - - - 0 - - - - 0 - - - - 0 - - - - 0 - - - - 0 - - - - 0 - - - - 0 - - - - 0 - - - - 0 - - - - 0 - - - - 0 - - - - 0 - -
-
- - 0 - -
-
- - 0 - - 30.833 6.085 3 - - 0.500 0.289 3 - - 1.000 0.000 3 - - 32.133 3.929 10 - - 0.983 0.211 10 - - 1.000 0.000 10 - - 37.111 3.216 9 - - 0.611 0.162 9 - - 0.889 0.111 9 - - 40.622 3.589 9 - - 0.839 0.325 9 - - 0.867 0.111 9 - - 37.333 3.038 9 - -
0.541
0.611 0.182 9 - -
0.335
1.000 0.000 9 - - 31.000 1.000 2 - - 0.000 0.000 2 - 1.000 1.000 0.000 2 - - 36.333 8.445 6 - - 0.000 0.000 6 1.000 - 1.000 0.000 6 - - 38.958 2.588 4 - - 0.000 0.000 4 1.000 1.000 1.000 0.000 4 - - 45.067 3.078 5 - - 0.600 0.400 5 0.334 0.104 1.000 0.000 5 - - 40.278 3.244 12 - -
0.041
0.000 0.000 12 1.000 1.000
1.000
1.000 0.000 12 - - 18.000 - 1 - 0.180 0.000 - 1 - - 1.000 - 1 - - 52.000 9.866 3 0.180 - 0.000 0.000 3 - - 1.000 0.000 3 - - 32.800 4.821 5 0.143 0.101 0.000 0.000 5 - - 1.000 0.000 5 - - 46.667 4.177 3 0.180 0.827 0.000 0.000 3 - - 1.000 0.000 3 - - 31.900 1.965 5 0.143 0.036
1.000
0.000 0.000 5 - -
1.000
1.000 0.000 5 - -
Analysis Notes: Phos-Chek excluded from analysis at 6 & 9 months; Insufficient Ns, perhaps due to mortality caused by Phos-Chek.
Leading Shoot Length Condition Reproduction MW-U Tests KW MW-U Tests KW MW-U Tests
SE p p Test SE p p Test SE p p M -/+ N vs D vs W p M -/+ N vs D vs W p M -/+ N vs D vs W
0.000 0.763 28 - - 0.000 0.108 28 - - 0.000 0.000 28 - - 0.000 0.526 30 - - 0.000 0.089 30 - - 0.000 0.000 30 - - 0.000 0.607 29 - - 0.000 0.087 29 - - 0.000 0.000 29 - - 0.000 0.398 30 - - 0.000 0.090 30 - - 0.000 0.000 30 - - 0.000 0.591 24 - -
-
0.000 0.080 24 - -
-
0.000 0.000 24 - - 16.817 1.263 29 - - 1.611 0.081 29 - 0.338 0.126 0.029 29 - 0.338 16.794 0.853 29 - - 1.475 0.076 29 0.338 - 0.202 0.035 29 0.338 - 17.137 0.885 28 - - 1.372 0.059 28 0.015 0.299 0.231 0.035 28 0.015 0.299 17.052 1.318 30 - - 1.431 0.084 30 0.230 0.879 0.191 0.030 30 0.230 0.879 17.112 1.422 25 - -
0.029
1.699 0.108 25 0.128 0.047
0.006
0.089 0.033 25 0.128 0.047 29.536 3.236 16 - - -0.946 0.177 16 - 0.822 0.568 0.108 16 - - 29.375 1.830 20 - - -0.859 0.147 20 0.822 - 0.641 0.071 20 - - 31.465 2.122 23 - - -0.655 0.200 23 0.750 0.418 0.678 0.086 23 - - 31.475 2.368 23 - - -1.356 0.144 23 0.021 0.008 0.792 0.078 23 - -
- - - - -
0.008
- - - - -
0.137
- - - - - 34.026 3.149 13 - - -1.561 0.000 13 - 0.000 1.000 0.000 13 - - 31.580 2.147 15 - - -1.602 0.067 15 0.000 - 1.000 0.000 15 - - 28.655 2.579 18 - - -1.599 0.000 18 0.000 0.000 1.000 0.000 18 - - 31.389 2.975 17 - - -1.872 0.000 17 0.000 0.000 1.000 0.000 17 - -
- - - - -
0.000
- - - - -
1.000
- - - - - 15.839 1.990 29 - - 1.899 0.104 29 - - 0.013 0.007 29 - - 14.902 1.045 29 - - 1.828 0.084 29 - - 0.032 0.012 29 - - 14.401 1.928 29 - - 1.966 0.111 29 - - 0.048 0.020 29 - - 17.177 1.588 30 - - 1.651 0.096 30 - - 0.042 0.015 30 - - 19.882 1.860 21 - -
0.092
1.983 0.156 21 - -
0.127
0.000 0.000 21 - -
Page 246
232
Table 2 (continued): Statistical analysis output for effects of fire suppressants on density and
growth variables of field populations (by species) for the with-fire trial at Wanneroo (Kruskal-
Wallis test and planned Mann-Whitney U test pairwise comparisons). Green and red cells
denote a significant (p<0.05) increase or decrease (respectively) compared to dry control (p vs
D) and wet control (p vs W). Yellow cells denote type-I errors, determined by overlapping
standard errors of means. Species names preceded by ‘*’ denote non-native species. Table
continues across double page and continues over next pages.
Species: Conostylis aculeata R.Br.
Continues → → →
Abundance Cover KW MW-U Tests KW MW-U Tests KW Test SE p p Test SE p p Test
Time Treatment
p M -/+ N vs D vs W p M -/+ N vs D vs W p Dry Control 0.000 0.308 30 - - 0.000 0.074 12 - - Wet Control 0.000 0.310 30 - - 0.000 0.254 15 - - Silv-Ex 0.000 0.211 30 - - 0.000 0.067 14 - - Clear ETI 0.000 0.123 30 - - 0.000 0.011 9 - - 0-
Mon
ths
Phos-Chek
-
0.000 0.088 30 - -
-
0.000 0.000 5 - -
-
Dry Control 0.000 0.363 30 - 0.212 -0.004 0.054 9 - 0.138 Wet Control 0.100 0.289 30 0.212 - -0.158 0.090 16 0.138 - Silv-Ex 0.500 0.399 30 0.000 0.122 0.073 0.101 15 0.786 0.035 Clear ETI 0.233 0.148 30 0.001 0.399 0.075 0.064 14 0.070 0.010 3-
Mon
ths
Phos-Chek
0.001
0.467 0.211 30 0.001 0.006
0.006
0.027 0.019 11 0.049 0.027
0.129
Dry Control -0.933 0.097 30 - 0.000 0.100 0.100 3 - - Wet Control -0.800 0.157 30 0.000 - 1.534 0.668 8 - - Silv-Ex -0.467 0.111 30 0.000 0.000 3.795 2.143 8 - - Clear ETI -0.200 0.088 30 0.000 0.000 2.189 0.735 5 - - 6-
Mon
ths
Phos-Chek
0.000
0.033 0.092 30 0.000 0.000
0.303
3.392 1.203 6 - -
0.238
Dry Control -1.033 0.067 30 - 0.000 0.300 - 1 - - Wet Control -0.967 0.106 30 0.000 - 3.899 1.455 6 - - Silv-Ex -0.567 0.092 30 0.000 0.000 2.510 1.076 6 - - Clear ETI -0.200 0.088 30 0.000 0.000 6.989 2.283 5 - - 9-
Mon
ths
Phos-Chek
0.000
0.100 0.098 30 0.000 0.000
0.379
9.125 4.690 8 - -
0.133
Dry Control -1.033 0.067 30 - 0.000 0.175 . 1 - - Wet Control -1.000 0.114 30 0.000 - 3.941 0.988 5 - - Silv-Ex -0.700 0.056 30 0.000 0.000 5.085 2.333 3 - - Clear ETI -0.267 0.063 30 0.000 0.000 5.264 1.749 4 - - 12
-Mon
ths
Phos-Chek
0.000
0.000 0.088 30 0.000 0.000
0.433
3.300 1.495 5 - -
0.598
Species: Cotula australis (Spreng.) Hook.f.
Continues → → →
Abundance Cover KW MW-U Tests KW MW-U Tests KW Test SE p p Test SE p p Test
Time Treatment
p M -/+ N vs D vs W p M -/+ N vs D vs W p Dry Control 0.000 0.000 30 - - - - 0 - - Wet Control 0.000 0.000 30 - - - - 0 - - Silv-Ex 0.000 0.000 30 - - - - 0 - - Clear ETI 0.000 0.000 30 - - - - 0 - - 0-
Mon
ths
Phos-Chek
0.000 0.000 30 - -
-
- - 0 - -
-
Dry Control 0.000 0.000 30 - - - - 0 - - Wet Control 0.000 0.000 30 - - - - 0 - - Silv-Ex 0.000 0.000 30 - - - - 0 - - Clear ETI 0.000 0.000 30 - - - - 0 - - 3-
Mon
ths
Phos-Chek
0.000 0.000 30 - -
-
- - 0 - -
-
Dry Control 10.267 3.652 30 - - 0.210 0.012 21 - 0.037 Wet Control 7.200 1.835 30 - - 0.178 0.010 19 0.037 - Silv-Ex 7.467 3.318 30 - - 0.187 0.011 23 0.173 0.492 Clear ETI 6.100 1.016 30 - - 0.217 0.038 23 0.251 0.650 6-
Mon
ths
Phos-Chek
0.553
7.067 1.078 30 - -
0.000
0.416 0.056 27 0.001 0.000
0.071
Dry Control 4.967 1.129 30 - - 0.244 0.044 18 - 0.001 Wet Control 6.767 1.911 30 - - 0.153 0.012 19 0.001 - Silv-Ex 3.367 0.604 30 - - 0.181 0.011 21 0.060 0.095 Clear ETI 3.900 1.015 30 - - 0.226 0.022 18 0.714 0.004 9-
Mon
ths
Phos-Chek
0.880
5.000 1.071 30 - -
0.000
0.516 0.116 22 0.000 0.000
0.000
Dry Control 6.233 3.080 30 - - 0.213 0.013 8 - - Wet Control 0.367 0.200 30 - - 0.200 0.000 4 - - Silv-Ex 0.333 0.200 30 - - 0.200 0.000 3 - - Clear ETI 0.867 0.338 30 - - 0.188 0.013 8 - - 12
-Mon
ths
Phos-Chek
0.118
1.433 0.462 30 - -
0.723
0.230 0.033 10 - -
0.177
Page 247
233
Analysis Notes: None
Leading Shoot Length Condition Reproduction MW-U Tests KW MW-U Tests KW MW-U Tests
SE p p Test SE p p Test SE p p M -/+ N vs D vs W p M -/+ N vs D vs W p M -/+ N vs D vs W
0.000 1.080 12 - - 0.000 0.184 12 - - 0.000 0.000 12 - - 0.000 2.481 15 - - 0.000 0.226 15 - - 0.000 0.000 15 - - 0.000 1.490 14 - - 0.000 0.190 14 - - 0.000 0.000 14 - - 0.000 2.514 9 - - 0.000 0.130 9 - - 0.000 0.000 9 - - 0.000 0.812 5 - -
-
0.000 0.332 5 - -
-
0.000 0.000 5 - - 17.833 3.578 9 - - 1.254 0.282 9 - - 0.000 0.000 9 - - 11.352 3.031 16 - - 1.186 0.167 16 - - 0.000 0.000 16 - - 14.809 3.682 15 - - 1.297 0.254 15 - - 0.000 0.000 15 - - 23.643 3.060 14 - - 1.802 0.143 14 - - 0.000 0.000 14 - - 19.482 7.118 11 - -
0.064
1.805 0.207 11 - -
1.000
0.000 0.000 11 - - 4.992 6.839 3 - - 2.000 0.333 3 - - 0.000 0.000 3 - - 6.800 4.178 8 - - 2.004 0.276 8 - - 0.000 0.000 8 - - 15.702 3.546 8 - - 2.366 0.148 8 - - 0.000 0.000 8 - - 15.100 5.715 5 - - 1.944 0.418 5 - - 0.000 0.000 5 - - 18.233 5.077 6 - -
0.842
1.808 0.449 6 - -
1.000
0.000 0.000 6 - - 10.158 - 1 - - 1.333 - 1 - - 0.000 - 1 - - 14.633 3.783 6 - - 1.150 0.455 6 - - 0.000 0.000 6 - - 14.786 4.216 6 - - 1.512 0.375 6 - - 0.000 0.000 6 - - 15.900 6.608 5 - - 1.444 0.274 5 - - 0.000 0.000 5 - - 25.963 4.404 8 - -
0.867
1.256 0.509 8 - -
0.321
0.250 0.164 8 - - 9.658 . 1 - - . 1 - - 0.000 . 1 - - 14.967 2.811 5 - - 0.367 5 - - 0.000 0.000 5 - - 14.202 3.606 3 - - 0.000 3 - - 0.000 0.000 3 - - 15.750 4.715 4 - - 0.433 4 - - 0.000 0.000 4 - - 21.400 4.147 5 - -
0.482
0.218 5 - -
1.000
0.000 0.000 5 - -
Analysis Notes: Data centring not required; no existing plants at 0 and 3 months.
Leading Shoot Length Condition Reproduction MW-U Tests KW MW-U Tests KW MW-U Tests
SE p p Test SE p p Test SE p p M -/+ N vs D vs W p M -/+ N vs D vs W p M -/+ N vs D vs W - - 0 - - - - 0 - - - - 0 - - - - 0 - - - - 0 - - - - 0 - - - - 0 - - - - 0 - - - - 0 - - - - 0 - - - - 0 - - - - 0 - - - - 0 - -
-
- - 0 - -
-
- - 0 - - - - 0 - - - - 0 - - - - 0 - - - - 0 - - - - 0 - - - - 0 - - - - 0 - - - - 0 - - - - 0 - - - - 0 - - - - 0 - - - - 0 - - - - 0 - -
-
- - 0 - -
-
- - 0 - - 6.952 0.368 21 - - 2.690 0.164 21 - 0.327 0.762 0.095 21 - - 6.493 0.397 19 - - 2.447 0.157 19 0.327 - 0.895 0.072 19 - - 6.826 0.465 23 - - 2.087 0.190 23 0.934 0.520 0.696 0.098 23 - - 7.522 0.377 23 - - 2.630 0.138 23 0.472 0.053 0.739 0.094 23 - - 8.259 0.448 27 - -
0.021
2.926 0.204 27 0.056 0.013
0.477
0.852 0.070 27 - - 6.222 0.329 18 - 0.064 0.000 0.000 18 - - 0.944 0.056 18 - - 5.316 0.276 19 0.064 - 0.211 0.103 19 - - 0.895 0.072 19 - - 6.524 0.298 21 0.467 0.004 0.190 0.148 21 - - 0.952 0.048 21 - - 7.069 0.521 18 0.234 0.005 0.056 0.056 18 - - 0.944 0.056 18 - - 7.791 0.398 22 0.003 0.000
0.071
0.000 0.000 22 - -
0.929
0.958 0.042 22 - - 6.500 0.598 8 - - 0.000 0.000 8 - - 1.000 0.000 8 - - 5.000 0.913 4 - - 0.000 0.000 4 - - 1.000 0.000 4 - - 4.000 0.577 3 - - 0.000 0.000 3 - - 1.000 0.000 3 - - 6.000 0.926 8 - - 0.000 0.000 8 - - 1.000 0.000 8 - - 6.600 0.521 10 - -
1.000
0.000 0.000 10 - -
0.681
0.900 0.100 10 - -
Page 248
234
Table 2 (continued): Statistical analysis output for effects of fire suppressants on density and
growth variables of field populations (by species) for the with-fire trial at Wanneroo (Kruskal-
Wallis test and planned Mann-Whitney U test pairwise comparisons). Green and red cells
denote a significant (p<0.05) increase or decrease (respectively) compared to dry control (p vs
D) and wet control (p vs W). Yellow cells denote type-I errors, determined by overlapping
standard errors of means. Species names preceded by ‘*’ denote non-native species. Table
continues across double page and continues over next pages.
Species: *Cotula bipinnata Thunb.
Continues → → →
Abundance Cover KW MW-U Tests KW MW-U Tests KW Test SE p p Test SE p p Test
Time Treatment
p M -/+ N vs D vs W p M -/+ N vs D vs W p Dry Control 0.000 0.000 30 - - Wet Control 0.000 0.000 30 - - Silv-Ex 0.000 0.000 30 - - Clear ETI 0.000 0.000 30 - - 0-
Mon
ths
Phos-Chek
-
0.000 0.000 30 - -
Dry Control 4.867 2.309 30 - 0.552 0.000 0.015 12 - - Wet Control 2.833 0.872 30 0.552 - 0.000 0.009 16 - - Silv-Ex 0.567 0.274 30 0.032 0.003 0.000 0.020 5 - - Clear ETI 0.433 0.207 30 0.092 0.005 0.000 0.020 8 - - 3-
Mon
ths
Phos-Chek
0.006
3.300 1.074 30 0.668 0.826
-
0.000 0.084 15 - -
-
Dry Control 1.333 0.396 30 - - 0.207 0.039 13 - 0.338 Wet Control 1.767 0.569 30 - - 0.263 0.082 13 0.338 - Silv-Ex 0.900 0.268 30 - - 0.476 0.164 11 0.501 0.581 Clear ETI 1.000 0.632 30 - - 0.676 0.162 10 0.028 0.104 6-
Mon
ths
Phos-Chek
0.551
1.433 0.406 30 - -
0.000
2.183 0.480 14 0.000 0.000
0.001
Dry Control 1.500 0.736 30 - - 0.196 0.067 10 - 0.673 Wet Control 0.900 0.237 30 - - 0.170 0.081 14 0.673 - Silv-Ex 1.200 0.743 30 - - 0.490 0.112 8 0.039 0.023 Clear ETI 0.300 0.109 30 - - 0.878 0.170 7 0.001 0.006 9-
Mon
ths
Phos-Chek
0.291
1.000 0.371 30 - -
0.000
1.029 0.270 12 0.002 0.000
0.423
Dry Control 82.133 20.931 30 - 0.321 -0.057 0.009 29 - 0.000 Wet Control 40.133 9.932 30 0.321 - -0.052 0.009 28 0.000 - Silv-Ex 33.433 9.995 30 0.048 0.286 -0.040 0.008 24 0.807 0.908 Clear ETI 22.700 6.065 30 0.035 0.138 0.006 0.000 23 0.040 0.060 12
-Mon
ths
Phos-Chek
0.013
16.300 6.882 30 0.001 0.012
0.000
-0.117 0.033 24 0.000 0.000
0.032
Species: Desmocladus flexuosus (R.Br.) B.G.Briggs & L.A.S.Johnson Continues → → →
Abundance Cover KW MW-U Tests KW MW-U Tests KW Test SE p p Test SE p p Test
Time Treatment
p M -/+ N vs D vs W p M -/+ N vs D vs W p Dry Control 0.000 0.033 30 - - 4.000 - 1 - - Wet Control 0.000 0.000 30 - - - - 0 - - Silv-Ex 0.000 0.000 30 - - - - 0 - - Clear ETI 0.000 0.056 30 - - 1.333 0.333 3 - - 0-
Mon
ths
Phos-Chek
-
0.000 0.056 30 - -
-
1.167 0.167 3 - -
-
Dry Control 0.033 0.046 30 - 0.000 2.250 1.750 2 - - Wet Control 0.000 0.000 30 0.000 - - - 0 - - Silv-Ex 0.000 0.000 30 0.000 1.000 - - 0 - - Clear ETI -0.033 0.046 30 0.000 0.000 1.000 4.500 2 - - 3-
Mon
ths
Phos-Chek
0.000
0.000 0.056 30 0.000 0.000
-
1.667 3.464 3 - -
-
Dry Control 0.667 0.085 30 - 0.038 5.310 1.017 21 - - Wet Control 0.500 0.093 30 0.038 - 4.867 1.260 15 - - Silv-Ex 0.767 0.079 30 0.000 0.034 5.630 1.314 23 - - Clear ETI 0.567 0.088 30 0.000 0.021 3.535 0.727 20 - - 6-
Mon
ths
Phos-Chek
0.000
0.467 0.092 30 0.000 0.003
0.672
4.941 0.953 17 - -
0.799
Dry Control 0.700 0.082 30 - 0.130 22.000 1.149 22 - - Wet Control 0.467 0.093 30 0.130 - 14.000 2.028 14 - - Silv-Ex 0.800 0.074 30 0.000 0.008 24.000 1.835 24 - - Clear ETI 0.733 0.069 30 0.000 0.435 25.000 1.235 25 - - 9-
Mon
ths
Phos-Chek
0.000
0.433 0.104 30 0.000 0.003
0.434
15.000 1.469 15 - -
0.345
Dry Control 0.767 0.088 30 - 0.477 4.991 1.061 23 - - Wet Control 0.433 0.092 30 0.477 - 7.769 1.561 13 - - Silv-Ex 0.733 0.082 30 0.000 0.019 8.636 2.254 22 - - Clear ETI 0.633 0.082 30 0.000 0.240 4.548 1.051 22 - - 12
-Mon
ths
Phos-Chek
0.000
0.367 0.104 30 0.000 0.001
0.070
10.308 2.706 13 - -
0.561
Page 249
235
Analysis Notes: Growth varibales (Cover, Leading Shoot Length, Condition, and Reproduction) centred at 3-months; insufficient Ns at 0-months.
Leading Shoot Length Condition Reproduction MW-U Tests KW MW-U Tests KW MW-U Tests
SE p p Test SE p p Test SE p p M -/+ N vs D vs W p M -/+ N vs D vs W p M -/+ N vs D vs W
0.000 0.782 12 - - 0.000 0.220 12 - - 0.000 0.000 12 - - 0.000 0.438 16 - - 0.000 0.111 16 - - 0.000 0.000 16 - - 0.000 0.583 5 - - 0.000 0.122 5 - - 0.000 0.000 5 - - 0.000 1.268 8 - - 0.000 0.176 8 - - 0.000 0.000 8 - - 0.000 1.552 15 - -
-
0.000 0.142 15 - -
-
0.000 0.000 15 - - 14.015 1.144 13 - 0.738 -2.190 0.305 13 - - 0.910 0.067 13 - - 16.135 2.553 13 0.738 - -1.629 0.190 13 - - 0.981 0.019 13 - - 16.092 2.329 11 0.663 0.977 -1.752 0.298 11 - - 1.000 0.000 11 - - 19.547 2.820 10 0.054 0.172 -1.144 0.337 10 - - 1.000 0.000 10 - - 27.954 3.180 14 0.000 0.002
0.099
-2.068 0.193 14 - -
0.527
0.964 0.036 14 - - 13.373 1.617 10 - - -2.917 0.211 10 - 0.860 0.960 0.040 10 - - 15.179 2.569 14 - - -3.027 0.036 14 0.860 - 1.000 0.000 14 - - 14.766 2.287 8 - - -3.138 0.063 8 0.534 0.538 1.000 0.000 8 - - 16.286 1.658 7 - - -3.094 0.000 7 0.282 0.232 1.000 0.000 7 - - 20.192 3.227 12 - -
0.000
-3.967 0.000 12 0.166 0.164
0.393
1.000 0.000 12 - - -2.184 0.118 29 - 0.005 0.221 0.086 29 0.624 0.000 0.000 29 - - -2.143 0.092 28 0.005 - 0.313 0.145 28 0.624 0.000 0.000 28 - - -2.392 0.080 24 0.640 0.908 0.402 0.043 24 0.642 0.219 0.001 0.001 24 - - -2.565 0.106 23 0.002 0.005 0.732 0.051 23 0.000 0.332 0.000 0.000 23 - - -1.606 0.592 24 0.073 0.054
0.000
0.033 0.000 24 0.011 0.019
0.363
0.000 0.000 24 - -
Analysis Notes: Clonal species; abundance scored as "1" plant when recorded within a quadrat.
Leading Shoot Length Condition Reproduction MW-U Tests KW MW-U Tests KW MW-U Tests
SE p p Test SE p p Test SE p p M -/+ N vs D vs W p M -/+ N vs D vs W p M -/+ N vs D vs W
32.000 - 1 - - 1.500 - 1 - - 1.000 - 1 - - - - 0 - - - - 0 - - - - 0 - - - - 0 - - - - 0 - - - - 0 - -
17.667 2.963 3 - - 1.333 0.167 3 - - 0.667 0.333 3 - - 19.000 2.082 3 - -
-
0.500 0.267 3 - -
-
1.000 0.000 3 - - 23.500 3.500 2 - - 1.750 1.750 2 - - 0.000 0.000 2 - -
- - 0 - - - - 0 - - - - 0 - - - - 0 - - - - 0 - - - - 0 - -
20.500 4.500 2 - - 1.750 1.250 2 - - 1.000 0.000 2 - - 20.000 3.464 3 - -
-
0.000 0.000 3 - -
-
0.667 0.333 3 - - 16.000 1.000 21 - - 3.595 0.095 21 - - 0.000 0.000 21 - - 15.733 1.209 15 - - 3.433 0.200 15 - - 0.000 0.000 15 - - 17.609 1.311 23 - - 3.391 0.137 23 - - 0.043 0.043 23 - - 15.175 1.176 20 - - 3.400 0.172 20 - - 0.000 0.000 20 - - 16.588 1.260 17 - -
0.752
3.706 0.187 17 - -
0.529
0.000 0.000 17 - - 16.091 0.850 22 - - 3.136 0.059 22 - 0.110 0.000 0.000 22 - 0.110 15.857 1.249 14 - - 3.286 0.172 14 0.110 - 0.000 0.000 14 0.110 - 18.417 0.819 24 - - 3.146 0.161 24 0.218 0.584 0.000 0.000 24 0.218 0.584 16.360 1.127 25 - - 2.580 0.165 25 0.004 0.002 0.480 0.174 25 0.004 0.002 16.800 1.824 15 - -
0.003
3.083 0.175 15 0.749 0.250
0.000
0.000 0.000 15 0.749 0.250 17.630 0.848 23 - - 3.326 0.081 23 - 0.000 0.000 0.000 23 - - 15.000 1.019 13 - - 3.846 0.087 13 0.000 - 0.000 0.000 13 - - 17.227 1.067 22 - - 3.614 0.093 22 0.033 0.052 0.000 0.000 22 - - 16.045 1.365 22 - - 3.341 0.149 22 0.906 0.021 0.000 0.000 22 - - 17.654 1.987 13 - -
0.000
4.000 0.127 13 0.000 0.420
1.000
0.000 0.000 13 - -
Page 250
236
Table 2 (continued): Statistical analysis output for effects of fire suppressants on density and
growth variables of field populations (by species) for the with-fire trial at Wanneroo (Kruskal-
Wallis test and planned Mann-Whitney U test pairwise comparisons). Green and red cells
denote a significant (p<0.05) increase or decrease (respectively) compared to dry control (p vs
D) and wet control (p vs W). Yellow cells denote type-I errors, determined by overlapping
standard errors of means. Species names preceded by ‘*’ denote non-native species. Table
continues across double page and continues over next pages.
Species: Dicotyledon emergents
Continues → → →
Abundance Cover KW MW-U Tests KW MW-U Tests KW Test SE p p Test SE p p Test
Time Treatment
p M -/+ N vs D vs W p M -/+ N vs D vs W p Dry Control 0.000 1.995 30 - - Wet Control 0.000 1.598 30 - - Silv-Ex 0.000 0.931 30 - - Clear ETI 0.000 0.786 30 - - 0-
Mon
ths
Phos-Chek
-
0.000 1.227 30 - -
Dry Control 87.300 23.933 30 - - Wet Control 91.300 20.542 30 - - Silv-Ex 80.900 17.153 30 - - Clear ETI 75.167 15.075 30 - - 3-
Mon
ths
Phos-Chek
0.134
40.467 8.449 30 - -
Dry Control -5.533 0.000 30 - - Wet Control -7.200 0.000 30 - - Silv-Ex -3.800 0.000 30 - - Clear ETI -5.000 0.000 30 - - 6-
Mon
ths
Phos-Chek
-
-4.800 0.000 30 - -
Dry Control -5.533 0.000 30 - - Wet Control -7.200 0.000 30 - - Silv-Ex -3.800 0.000 30 - - Clear ETI -5.000 0.000 30 - - 9-
Mon
ths
Phos-Chek
-
-4.800 0.000 30 - -
Dry Control 2.667 5.099 30 - 0.081 Wet Control 30.900 20.159 30 0.081 - Silv-Ex 16.633 7.541 30 0.000 0.023 Clear ETI 83.233 33.377 30 0.000 0.002 12
-Mon
ths
Phos-Chek
0.000
507.767 172.992 30 0.000 0.000
Species: Drosera erythrorhiza Lindl.
Continues → → →
Abundance Cover KW MW-U Tests KW MW-U Tests KW Test SE p p Test SE p p Test
Time Treatment
p M -/+ N vs D vs W p M -/+ N vs D vs W p Dry Control 0.000 0.000 30 - - - - 0 - - Wet Control 0.000 0.074 30 - - 0.200 0.000 2 - - Silv-Ex 0.000 0.000 30 - - - - 0 - - Clear ETI 0.000 0.000 30 - - - - 0 - - 0-
Mon
ths
Phos-Chek
-
0.000 0.000 30 - -
-
- - 0 - -
-
Dry Control 1.200 0.471 30 - 0.003 0.190 0.010 10 - 1.000 Wet Control 2.267 1.070 30 0.003 - 0.190 0.010 10 1.000 - Silv-Ex 0.267 0.126 30 0.110 0.011 0.120 0.020 5 0.009 0.009 Clear ETI 0.433 0.196 30 0.305 0.008 0.157 0.020 7 0.127 0.127 3-
Mon
ths
Phos-Chek
0.001
0.033 0.033 30 0.003 0.015
0.016
0.100 . 1 0.034 0.034
0.966
Dry Control 0.000 0.000 30 - - - - 0 - - Wet Control -0.100 0.000 30 - - - - 0 - - Silv-Ex 0.000 0.000 30 - - - - 0 - - Clear ETI 0.000 0.000 30 - - - - 0 - - 6-
Mon
ths
Phos-Chek
-
0.000 0.000 30 - -
-
- - 0 - -
-
Dry Control 0.000 0.000 30 - - - - 0 - - Wet Control -0.100 0.000 30 - - - - 0 - - Silv-Ex 0.000 0.000 30 - - - - 0 - - Clear ETI 0.000 0.000 30 - - - - 0 - - 9-
Mon
ths
Phos-Chek
-
0.000 0.000 30 - -
-
- - 0 - -
-
Dry Control 0.633 0.256 30 - 0.007 0.238 0.018 8 - 0.275 Wet Control 1.100 0.582 30 0.007 - 0.209 0.020 11 0.275 - Silv-Ex 0.400 0.228 30 0.232 0.018 0.125 0.025 4 0.013 0.040 Clear ETI 0.167 0.097 30 0.096 0.026 0.200 0.000 3 0.236 1.000 12
-Mon
ths
Phos-Chek
0.004
0.000 0.000 30 0.003 0.053
0.047
- - 0 - -
0.076
Page 251
237
Analysis Notes: Dicotyledon sprouts include all newly sprouted dicot seedlings of various species, as an indictation of germination/emergence. Only Abundance analysed; all other variables constant for newly sprouted seeds.
Leading Shoot Length Condition Reproduction MW-U Tests KW MW-U Tests KW MW-U Tests
SE p p Test SE p p Test SE p p M -/+ N vs D vs W p M -/+ N vs D vs W p M -/+ N vs D vs W
Analysis Notes: Analysis not performed for 6 and 9 months; No plants recorded (dormant). Growth variables (Cover, Leading Shoot Length, Condition, and Reproduction) have not been centred due to low Ns at 0 and 3 months.
Leading Shoot Length Condition Reproduction MW-U Tests KW MW-U Tests KW MW-U Tests
SE p p Test SE p p Test SE p p M -/+ N vs D vs W p M -/+ N vs D vs W p M -/+ N vs D vs W - - 0 - - - - 0 - - - - 0 - -
1.500 0.500 2 - - 3.000 0.000 2 - - 0.000 0.000 2 - - - - 0 - - - - 0 - - - - 0 - - - - 0 - - - - 0 - - - - 0 - - - - 0 - -
-
- - 0 - -
-
- - 0 - - 1.300 0.153 10 - - 3.250 0.154 10 - - 0.000 0.000 10 - - 1.400 0.267 10 - - 3.100 0.125 10 - - 0.000 0.000 10 - - 1.200 0.200 5 - - 2.900 0.187 5 - - 0.000 0.000 5 - - 1.429 0.429 7 - - 2.857 0.497 7 - - 0.000 0.000 7 - - 1.000 . 1 - -
0.737
3.000 . 1 - -
1.000
0.000 . 1 - - - - 0 - - - - 0 - - - - 0 - - - - 0 - - - - 0 - - - - 0 - - - - 0 - - - - 0 - - - - 0 - - - - 0 - - - - 0 - - - - 0 - - - - 0 - -
-
- - 0 - -
-
- - 0 - - - - 0 - - - - 0 - - - - 0 - - - - 0 - - - - 0 - - - - 0 - - - - 0 - - - - 0 - - - - 0 - - - - 0 - - - - 0 - - - - 0 - - - - 0 - -
-
- - 0 - -
-
- - 0 - - 1.594 0.259 8 - - 3.313 0.132 8 - - 0.000 0.000 8 - - 1.818 0.226 11 - - 3.068 0.127 11 - - 0.000 0.000 11 - - 1.000 0.000 4 - - 3.375 0.239 4 - - 0.000 0.000 4 - - 1.000 0.000 3 - - 3.667 0.167 3 - - 0.000 0.000 3 - -
- - 0 - -
0.184
- - 0 - -
1.000
- - 0 - -
Page 252
238
Table 2 (continued): Statistical analysis output for effects of fire suppressants on density and
growth variables of field populations (by species) for the with-fire trial at Wanneroo (Kruskal-
Wallis test and planned Mann-Whitney U test pairwise comparisons). Green and red cells
denote a significant (p<0.05) increase or decrease (respectively) compared to dry control (p vs
D) and wet control (p vs W). Yellow cells denote type-I errors, determined by overlapping
standard errors of means. Species names preceded by ‘*’ denote non-native species. Table
continues across double page and continues over next pages.
Species: Drosera macrantha Endl.
Continues → → →
Abundance Cover KW MW-U Tests KW MW-U Tests KW Test SE p p Test SE p p Test
Time Treatment
p M -/+ N vs D vs W p M -/+ N vs D vs W p Dry Control 0.000 0.079 30 - - 0.100 0.000 3 - - Wet Control 0.000 0.000 30 - - - - 0 - - Silv-Ex 0.000 0.033 30 - - 0.100 - 1 - - Clear ETI 0.000 0.033 30 - - 0.100 - 1 - - 0-
Mon
ths
Phos-Chek
-
0.000 0.000 30 - -
-
- - 0 - -
-
Dry Control 0.133 0.179 30 - 0.000 0.167 0.033 3 - - Wet Control 0.300 0.167 30 0.000 - 0.250 0.087 4 - - Silv-Ex 0.033 0.067 30 0.000 0.000 0.100 . 1 - - Clear ETI 0.133 0.084 30 0.000 0.000 0.200 0.041 4 - - 3-
Mon
ths
Phos-Chek
0.000
0.000 0.000 30 0.000 0.040
0.571
- - 0 - -
0.364
Dry Control 0.000 0.000 30 - - - - 0 - - Wet Control 0.000 0.000 30 - - - - 0 - - Silv-Ex 0.000 0.000 30 - - - - 0 - - Clear ETI 0.000 0.000 30 - - - - 0 - - 6-
Mon
ths
Phos-Chek
-
0.000 0.000 30 - -
-
- - 0 - -
-
Dry Control 0.000 0.000 30 - - - - 0 - - Wet Control 0.000 0.000 30 - - - - 0 - - Silv-Ex 0.000 0.000 30 - - - - 0 - - Clear ETI 0.000 0.000 30 - - - - 0 - - 9-
Mon
ths
Phos-Chek
-
0.000 0.000 30 - -
-
- - 0 - -
-
Dry Control 0.167 0.137 30 - 0.000 1.647 1.447 5 - - Wet Control 0.267 0.151 30 0.000 - 0.494 0.336 4 - - Silv-Ex -0.033 0.000 30 0.000 0.000 - - 0 - - Clear ETI 0.133 0.069 30 0.000 0.000 0.840 0.225 5 - - 12
-Mon
ths
Phos-Chek
0.000
-0.033 0.000 30 0.000 0.000
0.328
- - 0 - -
0.415
Species: *Ehrharta calycina Sm.
Continues → → →
Abundance Cover KW MW-U Tests KW MW-U Tests KW Test SE p p Test SE p p Test
Time Treatment
p M -/+ N vs D vs W p M -/+ N vs D vs W p Dry Control 0.000 0.759 30 - - 0.000 0.000 19 - - Wet Control 0.000 2.193 30 - - 0.000 0.000 22 - - Silv-Ex 0.000 0.738 30 - - 0.000 0.041 22 - - Clear ETI 0.000 1.184 30 - - 0.000 0.000 24 - - 0-
Mon
ths
Phos-Chek
-
0.000 1.935 30 - -
-
0.000 0.000 26 - -
-
Dry Control 3.300 1.456 30 - - 0.130 0.040 21 - 0.154 Wet Control 1.633 1.695 30 - - 0.080 0.016 25 0.154 - Silv-Ex 5.500 2.025 30 - - 0.119 0.018 22 0.534 0.063 Clear ETI 5.567 1.607 30 - - 0.214 0.096 29 0.125 0.002 3-
Mon
ths
Phos-Chek
0.061
3.933 2.984 30 - -
0.000
0.267 0.048 26 0.001 0.000
0.002
Dry Control 0.533 0.611 30 - 0.000 0.603 0.603 24 - 0.411 Wet Control -4.033 0.886 30 0.000 - 0.596 0.596 19 0.411 - Silv-Ex 1.100 1.041 30 0.514 0.000 1.324 1.324 22 0.023 0.013 Clear ETI 0.300 1.092 30 0.343 0.000 0.730 0.730 24 0.282 0.103 6-
Mon
ths
Phos-Chek
0.000
-5.000 0.743 30 0.000 0.372
0.001
1.248 1.248 20 0.002 0.001
0.000
Dry Control 0.900 1.222 30 - 0.000 1.496 0.570 18 - - Wet Control -6.533 0.276 30 0.000 - 1.702 0.747 9 - - Silv-Ex 0.267 0.983 30 0.561 0.000 2.583 0.682 21 - - Clear ETI -3.267 0.586 30 0.000 0.000 2.005 0.692 19 - - 9-
Mon
ths
Phos-Chek
0.000
-2.467 1.540 30 0.002 0.178
0.975
1.765 0.597 21 - -
0.000
Dry Control 19.700 6.999 30 - 0.554 0.720 0.337 26 - - Wet Control 16.733 3.281 30 0.554 - 0.192 0.101 28 - - Silv-Ex 27.833 8.529 30 0.767 0.767 1.481 0.663 24 - - Clear ETI 41.967 8.239 30 0.008 0.025 0.149 0.038 30 - - 12
-Mon
ths
Phos-Chek
0.000
127.467 36.350 30 0.000 0.000
0.125
0.248 0.076 30 - -
0.000
Page 253
239
Analysis Notes: Analysis not performed for 6 and 9 months; No plants recorded (dormant). Growth variables (Cover, Leading Shoot Length, Condition, and Reproduction) have not been centred due to low Ns at 0 and 3 months.
Leading Shoot Length Condition Reproduction MW-U Tests KW MW-U Tests KW MW-U Tests
SE p p Test SE p p Test SE p p M -/+ N vs D vs W p M -/+ N vs D vs W p M -/+ N vs D vs W
9.667 0.882 3 - - 1 0.167 3 - - 0.000 0.000 3 - - - - 0 - - - - 0 - - - - 0 - -
17.000 - 1 - - 1.000 - 1 - - 0.000 - 1 - - 8.000 - 1 - - 3.000 - 1 - - 0.000 - 1 - -
- - 0 - -
-
- - 0 - -
-
- - 0 - - 7.000 2.887 3 - - 3.000 0.500 3 - - 0.000 0.000 3 - -
11.417 3.938 4 - - 2.708 0.336 4 - - 0.000 0.000 4 - - 3.000 . 1 - - 2.000 . 1 - - 0.000 . 1 - -
12.125 1.712 4 - - 2.438 0.213 4 - - 0.000 0.000 4 - - - - 0 - -
0.524
- - 0 - -
1.000
- - 0 - - - - 0 - - - - 0 - - - - 0 - - - - 0 - - - - 0 - - - - 0 - - - - 0 - - - - 0 - - - - 0 - - - - 0 - - - - 0 - - - - 0 - - - - 0 - -
-
- - 0 - -
-
- - 0 - - - - 0 - - - - 0 - - - - 0 - - - - 0 - - - - 0 - - - - 0 - - - - 0 - - - - 0 - - - - 0 - - - - 0 - - - - 0 - - - - 0 - - - - 0 - -
-
- - 0 - -
-
- - 0 - - 18.233 3.042 5 - - 3.367 0.308 5 - - 0.000 0.000 5 - - 23.375 6.681 4 - - 3.219 0.428 4 - - 0.000 0.000 4 - -
- - 0 - - - - 0 - - - - 0 - - 32.800 7.883 5 - - 3.800 0.200 5 - - 0.000 0.000 5 - -
- - 0 - -
0.495
- - 0 - -
1.000
- - 0 - -
Analysis Notes: Reproduction not centred; no plants reproducing at 0 and 3 months.
Leading Shoot Length Condition Reproduction MW-U Tests KW MW-U Tests KW MW-U Tests
SE p p Test SE p p Test SE p p M -/+ N vs D vs W p M -/+ N vs D vs W p M -/+ N vs D vs W
0.000 0.509 19 - - 0.000 0.158 19 - - 0.000 0.000 19 - - 0.000 0.577 22 - - 0.000 0.101 22 - - 0.000 0.000 22 - - 0.000 0.841 22 - - 0.000 0.149 22 - - 0.000 0.000 22 - - 0.000 0.651 24 - - 0.000 0.093 24 - - 0.000 0.000 24 - - 0.000 0.391 26 - -
-
0.000 0.112 26 - -
-
0.000 0.000 26 - - 5.924 0.909 21 - 0.021 0.550 0.109 21 - 0.000 0.000 0.000 21 - - 2.818 0.742 25 0.021 - -0.158 0.095 25 0.000 - 0.000 0.000 25 - -
10.085 3.838 22 0.588 0.011 -0.255 0.126 22 0.001 0.219 0.000 0.000 22 - - 5.327 0.777 29 0.510 0.021 0.080 0.111 29 0.020 0.003 0.000 0.000 29 - - 8.364 1.078 26 0.222 0.000
0.000
0.874 0.125 26 0.006 0.000
1.000
0.000 0.000 26 - - 33.528 33.528 24 - 0.463 -0.098 -0.098 24 - 0.000 0.351 0.351 24 - 0.298 37.762 37.762 19 0.463 - -1.138 -1.138 19 0.000 - 0.483 0.483 19 0.298 - 67.919 67.919 22 0.000 0.001 -0.542 -0.542 22 0.086 0.009 0.679 0.679 22 0.003 0.159 56.368 56.368 24 0.021 0.053 -0.391 -0.391 24 0.208 0.001 0.465 0.465 24 0.310 0.931 75.873 75.873 20 0.000 0.000
0.001
-0.191 -0.191 20 0.906 0.002
0.000
0.849 0.849 20 0.000 0.002 40.054 7.100 18 - 0.005 -1.537 0.243 18 - 0.001 0.483 0.116 18 - 0.034 73.229 4.588 9 0.005 - -2.836 0.267 9 0.001 - 0.926 0.049 9 0.034 - 81.784 4.156 21 0.000 0.154 -3.409 0.000 21 0.000 0.000 0.976 0.024 21 0.000 0.178 71.932 6.066 19 0.003 0.863 -2.751 0.146 19 0.001 0.065 0.879 0.057 19 0.013 0.771 79.082 4.998 21 0.001 0.129
0.000
-2.847 0.043 21 0.000 0.085
0.000
0.958 0.036 21 0.001 0.358 7.931 2.304 26 - 0.616 0.861 0.072 26 - 0.000 0.080 0.038 26 - - 5.736 1.595 28 0.616 - 0.045 0.083 28 0.000 - 0.028 0.021 28 - -
22.011 5.584 24 0.014 0.003 -0.242 0.160 24 0.000 0.162 0.199 0.070 24 - - 4.674 0.927 30 0.470 1.000 0.282 0.070 30 0.000 0.023 0.027 0.011 30 - -
10.761 1.187 30 0.008 0.000
0.000
0.550 0.084 30 0.004 0.000
0.062
0.035 0.014 30 - -
Page 254
240
Table 2 (continued): Statistical analysis output for effects of fire suppressants on density and
growth variables of field populations (by species) for the with-fire trial at Wanneroo (Kruskal-
Wallis test and planned Mann-Whitney U test pairwise comparisons). Green and red cells
denote a significant (p<0.05) increase or decrease (respectively) compared to dry control (p vs
D) and wet control (p vs W). Yellow cells denote type-I errors, determined by overlapping
standard errors of means. Species names preceded by ‘*’ denote non-native species. Table
continues across double page and continues over next pages.
Species: Gompholobium tomentosum Labill.
Continues → → →
Abundance Cover KW MW-U Tests KW MW-U Tests KW Test SE p p Test SE p p Test
Time Treatment
p M -/+ N vs D vs W p M -/+ N vs D vs W p Dry Control 0.000 0.000 30 - - - - 0 - - Wet Control 0.000 0.033 30 - - 1.000 - 1 - - Silv-Ex 0.000 0.000 30 - - - - 0 - - Clear ETI 0.000 0.000 30 - - - - 0 - - 0-
Mon
ths
Phos-Chek
-
0.000 0.033 30 - -
-
2.000 - 1 - -
-
Dry Control 0.000 0.000 30 - - - - 0 - - Wet Control 0.000 0.000 30 - - - - 0 - - Silv-Ex 0.000 0.000 30 - - - - 0 - - Clear ETI 0.000 0.000 30 - - - - 0 - - 3-
Mon
ths
Phos-Chek
-
0.000 0.000 30 - -
-
1.000 - 1 - -
-
Dry Control 8.667 1.872 30 - 0.055 0.110 0.006 28 - - Wet Control 12.433 4.755 30 0.055 - 0.106 0.006 16 - - Silv-Ex 1.667 0.432 30 0.000 0.209 0.113 0.009 16 - - Clear ETI 4.500 1.649 30 0.001 0.225 0.100 0.000 12 - - 6-
Mon
ths
Phos-Chek
0.000
3.367 0.962 30 0.000 0.013
0.472
0.116 0.009 15 - -
0.106
Dry Control 6.800 1.524 30 - 0.106 0.105 0.004 27 - - Wet Control 6.867 2.341 30 0.106 - 0.106 0.005 19 - - Silv-Ex 1.067 0.318 30 0.000 0.014 0.100 0.000 12 - - Clear ETI 2.138 0.780 30 0.000 0.055 0.100 0.000 12 - - 9-
Mon
ths
Phos-Chek
0.000
1.200 0.425 30 0.000 0.000
0.073
0.119 0.010 13 - -
0.624
Dry Control 2.867 0.522 30 - 0.797 0.121 0.010 22 - - Wet Control 4.200 1.144 30 0.797 - 0.126 0.010 18 - - Silv-Ex 0.567 0.218 30 0.000 0.000 0.229 0.129 8 - - Clear ETI 2.033 0.841 30 0.017 0.079 0.147 0.033 12 - - 12
-Mon
ths
Phos-Chek
0.000
1.567 0.493 30 0.000 0.001
0.548
0.147 0.017 14 - -
0.767
Species: Hibbertia hypericoides (DC.) Benth.
Continues → → →
Abundance Cover KW MW-U Tests KW MW-U Tests KW Test SE p p Test SE p p Test
Time Treatment
p M -/+ N vs D vs W p M -/+ N vs D vs W p Dry Control 0.000 0.100 30 - - Wet Control 0.000 0.149 30 - - Silv-Ex 0.000 0.069 30 - - Clear ETI 0.000 0.104 30 - - 0-
Mon
ths
Phos-Chek
-
0.000 0.117 30 - -
Dry Control 0.333 0.138 30 - 0.009 0.000 0.428 16 - - Wet Control 0.200 0.211 30 0.009 - 0.000 1.191 12 - - Silv-Ex 0.600 0.149 30 0.002 0.005 0.000 0.410 17 - - Clear ETI 0.467 0.153 30 0.008 0.007 0.000 0.598 15 - - 3-
Mon
ths
Phos-Chek
0.000
0.433 0.153 30 0.008 0.007
-
0.000 0.322 15 - -
-
Dry Control 0.433 0.157 30 - 0.000 11.916 2.657 17 - - Wet Control 0.167 0.190 30 0.000 - 9.116 2.285 13 - - Silv-Ex 0.967 0.202 30 0.000 0.001 6.846 1.754 21 - - Clear ETI 0.567 0.176 30 0.021 0.005 5.697 1.702 15 - - 6-
Mon
ths
Phos-Chek
0.000
0.467 0.203 30 0.063 0.013
0.099
11.833 1.953 13 - -
0.005
Dry Control 0.733 0.253 30 - 0.011 11.769 2.588 17 - - Wet Control 0.567 0.356 30 0.011 - 9.815 2.907 14 - - Silv-Ex 0.833 0.152 30 0.009 0.002 10.506 2.108 23 - - Clear ETI 0.533 0.157 30 0.084 0.023 11.321 2.254 16 - - 9-
Mon
ths
Phos-Chek
0.000
0.567 0.209 30 0.104 0.025
0.835
13.236 2.546 15 - -
0.570
Dry Control 0.533 0.178 30 - 0.003 13.424 2.661 18 - - Wet Control 0.167 0.190 30 0.003 - 12.818 3.381 14 - - Silv-Ex 0.800 0.148 30 0.001 0.001 10.481 2.294 22 - - Clear ETI 0.567 0.162 30 0.026 0.005 13.317 3.267 17 - - 12
-Mon
ths
Phos-Chek
0.000
0.433 0.153 30 0.036 0.008
0.830
14.063 2.519 17 - -
0.922
Page 255
241
Analysis Notes: Abundance centred at 3-months; low Ns at 0-months. Growth variables (Cover, Leading Shoot Length, Condition, and Reproduction) not centred; insufficient Ns at 0 and 3 months.
Leading Shoot Length Condition Reproduction MW-U Tests KW MW-U Tests KW MW-U Tests
SE p p Test SE p p Test SE p p M -/+ N vs D vs W p M -/+ N vs D vs W p M -/+ N vs D vs W - - 0 - - - - 0 - - - - 0 - -
39.000 - 1 - - 0.000 - 1 - - 0.000 - 1 - - - - 0 - - - - 0 - - - - 0 - - - - 0 - - - - 0 - - - - 0 - -
46.000 - 1 - -
-
0.000 - 1 - -
-
0.000 - 1 - - - - 0 - - - - 0 - - - - 0 - - - - 0 - - - - 0 - - - - 0 - - - - 0 - - - - 0 - - - - 0 - - - - 0 - - - - 0 - - - - 0 - -
42.000 - 1 - -
-
0.000 - 1 - -
-
0.000 - 1 - - 7.854 0.513 28 - - 3.919 0.067 28 - - 0.002 0.002 28 - - 7.500 0.555 16 - - 3.844 0.109 16 - - 0.000 0.000 16 - - 8.313 0.751 16 - - 3.813 0.101 16 - - 0.000 0.000 16 - - 7.000 0.663 12 - - 3.792 0.074 12 - - 0.000 0.000 12 - - 9.889 0.865 15 - -
0.391
4.056 0.105 15 - -
0.716
0.000 0.000 15 - - 8.408 0.743 27 - - 3.197 0.079 27 - - 0.000 0.000 27 - - 9.163 1.280 19 - - 3.289 0.079 19 - - 0.000 0.000 19 - - 9.222 0.559 12 - - 2.993 0.295 12 - - 0.000 0.000 12 - - 9.333 0.924 12 - - 3.208 0.130 12 - - 0.000 0.000 12 - - 9.287 0.913 13 - -
0.512
3.400 0.149 13 - -
1.000
0.000 0.000 13 - - 8.661 0.573 22 - - 3.622 0.096 22 - - 0.000 0.000 22 - - 8.185 0.630 18 - - 3.461 0.224 18 - - 0.056 0.056 18 - - 8.767 1.370 8 - - 3.400 0.230 8 - - 0.000 0.000 8 - - 9.181 0.689 12 - - 3.462 0.219 12 - - 0.000 0.000 12 - - 9.892 1.179 14 - -
0.704
3.745 0.150 14 - -
0.539
0.000 0.000 14 - -
Analysis Notes: Cover, Leading Shoot Length, and Reproduction collected at 0-months excluded; innacurate due to the difficulty of distinguishing between fire-scorched plants that surivived and those that did not. Data collected at 3-months used to centre growth variables.
Leading Shoot Length Condition Reproduction MW-U Tests KW MW-U Tests KW MW-U Tests
SE p p Test SE p p Test SE p p M -/+ N vs D vs W p M -/+ N vs D vs W p M -/+ N vs D vs W
0.000 0.501 16 - - 0.000 0.125 16 - - 0.000 0.000 16 - - 0.000 6.272 12 - - 0.000 0.345 12 - - 0.000 0.000 12 - - 0.000 0.531 17 - - 0.000 0.158 17 - - 0.000 0.000 17 - - 0.000 1.122 15 - - 0.000 0.190 15 - - 0.000 0.000 15 - - 0.000 0.630 15 - -
-
0.000 0.171 15 - -
-
0.000 0.000 15 - - 52.653 3.153 17 - 0.005 0.070 0.166 17 - - 0.059 0.059 17 - - 35.085 4.567 13 0.005 - 0.112 0.102 13 - - 0.000 0.000 13 - - 41.677 4.006 21 0.081 0.330 0.065 0.097 21 - - 0.095 0.066 21 - - 34.578 4.070 15 0.002 0.945 0.156 0.098 15 - - 0.000 0.000 15 - - 57.396 8.299 13 0.917 0.029
0.870
0.210 0.104 13 - -
0.635
0.038 0.038 13 - - 53.139 5.275 17 - - -0.803 0.123 17 - - 0.000 0.000 17 - - 43.319 5.560 14 - - -0.973 0.172 14 - - 0.000 0.000 14 - - 51.036 3.855 23 - - -0.739 0.068 23 - - 0.000 0.000 23 - - 47.238 3.646 16 - - -0.640 0.118 16 - - 0.000 0.000 16 - - 52.782 4.674 15 - -
0.108
-0.884 0.068 15 - -
1.000
0.000 0.000 15 - - 51.896 5.021 18 - - -0.627 0.177 18 - 0.085 0.000 0.000 18 - - 46.605 5.382 14 - - -0.363 0.149 14 0.085 - 0.000 0.000 14 - - 50.448 3.884 22 - - -0.352 0.142 22 0.067 0.327 0.000 0.000 22 - - 50.105 3.061 17 - - 0.012 0.168 17 0.014 0.071 0.000 0.000 17 - - 53.188 4.053 17 - -
0.012
-0.001 0.159 17 0.007 0.013
1.000
0.000 0.000 17 - -
Page 256
242
Table 2 (continued): Statistical analysis output for effects of fire suppressants on density and
growth variables of field populations (by species) for the with-fire trial at Wanneroo (Kruskal-
Wallis test and planned Mann-Whitney U test pairwise comparisons). Green and red cells
denote a significant (p<0.05) increase or decrease (respectively) compared to dry control (p vs
D) and wet control (p vs W). Yellow cells denote type-I errors, determined by overlapping
standard errors of means. Species names preceded by ‘*’ denote non-native species. Table
continues across double page and continues over next pages.
Species: *Hypochaeris glabra L.
Continues → → →
Abundance Cover KW MW-U Tests KW MW-U Tests KW Test SE p p Test SE p p Test
Time Treatment
p M -/+ N vs D vs W p M -/+ N vs D vs W p Dry Control Wet Control Silv-Ex Clear ETI 0-
Mon
ths
Phos-Chek
Dry Control Wet Control Silv-Ex Clear ETI 3-
Mon
ths
Phos-Chek
Dry Control Wet Control Silv-Ex Clear ETI 6-
Mon
ths
Phos-Chek
Dry Control Wet Control Silv-Ex Clear ETI 9-
Mon
ths
Phos-Chek
Dry Control 55.533 13.501 30 - 0.336 0.100 0.000 30 - 1.000 Wet Control 39.433 6.229 30 0.336 - 0.100 0.000 30 1.000 - Silv-Ex 28.400 3.557 30 0.610 0.383 0.100 0.000 30 1.000 1.000 Clear ETI 15.300 3.458 30 0.219 0.000 0.100 0.000 28 1.000 1.000 12
-Mon
ths
Phos-Chek
0.009
42.633 10.043 30 0.416 0.460
0.000
0.265 0.032 30 0.000 0.000
0.000
Species: *Hypochaeris radicata L.
Continues → → →
Abundance Cover KW MW-U Tests KW MW-U Tests KW Test SE p p Test SE p p Test
Time Treatment
p M -/+ N vs D vs W p M -/+ N vs D vs W p Dry Control 0.000 0.000 30 - - - - 0 - - Wet Control 0.000 0.000 30 - - - - 0 - - Silv-Ex 0.000 0.000 30 - - - - 0 - - Clear ETI 0.000 0.000 30 - - - - 0 - - 0-
Mon
ths
Phos-Chek
-
0.000 0.000 30 - -
-
- - 0 - -
-
Dry Control 3.567 1.073 30 - - 0.199 0.011 17 - 0.286 Wet Control 2.867 0.987 30 - - 0.182 0.013 17 0.286 - Silv-Ex 1.967 0.483 30 - - 0.217 0.029 18 0.797 0.648 Clear ETI 1.067 0.291 30 - - 0.169 0.013 13 0.084 0.513 3-
Mon
ths
Phos-Chek
0.514
1.267 0.267 30 - -
0.000
1.033 0.171 18 0.000 0.000
0.000
Dry Control 0.433 0.133 30 - - 0.706 0.136 9 - 0.464 Wet Control 1.000 0.263 30 - - 0.610 0.102 15 0.464 - Silv-Ex 1.167 0.329 30 - - 0.549 0.091 14 0.324 0.824 Clear ETI 1.433 0.377 30 - - 0.663 0.115 18 0.584 0.839 6-
Mon
ths
Phos-Chek
0.171
1.067 0.262 30 - -
0.000
3.911 0.609 17 0.000 0.000
0.000
Dry Control 0.233 0.104 30 - 0.174 1.160 0.361 5 - 0.431 Wet Control 0.567 0.177 30 0.174 - 0.844 0.177 9 0.431 - Silv-Ex 0.700 0.174 30 0.033 0.485 1.083 0.218 12 0.813 0.464 Clear ETI 0.167 0.084 30 0.694 0.086 0.825 0.175 4 0.558 0.866 9-
Mon
ths
Phos-Chek
0.003
1.067 0.258 30 0.003 0.098
0.000
3.617 0.641 16 0.010 0.000
0.048
Dry Control 0.200 0.111 30 - 0.160 0.800 0.200 4 - 0.429 Wet Control 0.033 0.033 30 0.160 - 0.500 . 1 0.429 - Silv-Ex 0.033 0.033 30 0.160 1.000 2.000 . 1 0.114 0.317 Clear ETI 0.100 0.074 30 0.402 0.544 0.475 0.275 2 0.211 1.000 12
-Mon
ths
Phos-Chek
0.013
0.567 0.213 30 0.168 0.010
0.015
4.729 0.652 8 0.005 0.106
0.312
Page 257
243
Analysis Notes: Analysis performed for 12-month data; plants only recorded at 12 months.
Leading Shoot Length Condition Reproduction MW-U Tests KW MW-U Tests KW MW-U Tests
SE p p Test SE p p Test SE p p M -/+ N vs D vs W p M -/+ N vs D vs W p M -/+ N vs D vs W
1.000 0.000 30 - 1.000 3.000 0.000 30 - 1.000 0.000 0.000 30 - 1.000 1.000 0.000 30 1.000 - 3.000 0.000 30 1.000 - 0.000 0.000 30 1.000 - 1.000 0.000 30 1.000 1.000 3.000 0.000 30 1.000 1.000 0.000 0.000 30 1.000 1.000 1.000 0.000 28 1.000 1.000 3.000 0.000 28 1.000 1.000 0.000 0.000 28 1.000 1.000 3.801 0.382 30 0.000 0.000
0.000
3.350 0.049 30 0.000 0.000
1.000
0.000 0.000 30 1.000 1.000
Analysis Notes: Data not centred; no plants at 0-months.
Leading Shoot Length Condition Reproduction MW-U Tests KW MW-U Tests KW MW-U Tests
SE p p Test SE p p Test SE p p M -/+ N vs D vs W p M -/+ N vs D vs W p M -/+ N vs D vs W - - 0 - - - - 0 - - - - 0 - - - - 0 - - - - 0 - - - - 0 - - - - 0 - - - - 0 - - - - 0 - - - - 0 - - - - 0 - - - - 0 - - - - 0 - -
-
- - 0 - -
-
- - 0 - - 3.129 0.388 17 - 0.368 3.038 0.067 17 - - 0.000 0.000 17 - - 2.647 0.170 17 0.368 - 2.765 0.114 17 - - 0.000 0.000 17 - - 2.833 0.326 18 0.443 0.930 2.833 0.121 18 - - 0.000 0.000 18 - - 2.385 0.266 13 0.157 0.367 2.654 0.119 13 - - 0.000 0.000 13 - - 8.081 0.824 18 0.000 0.000
0.083
3.087 0.138 18 - -
1.000
0.000 0.000 18 - - 23.667 3.270 9 - 0.654 1.417 0.408 9 - 0.132 0.833 0.118 9 - - 26.311 3.305 15 0.654 - 2.039 0.215 15 0.132 - 0.700 0.118 15 - - 27.369 3.750 14 0.488 0.647 1.708 0.157 14 0.292 0.213 0.679 0.124 14 - - 31.286 3.116 18 0.122 0.226 2.774 0.199 18 0.009 0.023 0.732 0.101 18 - - 48.755 5.198 17 0.001 0.000
0.010
1.980 0.330 17 0.313 0.819
0.718
0.863 0.081 17 - - 36.000 1.703 5 - 0.593 0.200 0.200 5 - - 1.000 0.000 5 - - 34.111 3.900 9 0.593 - 0.222 0.147 9 - - 1.000 0.000 9 - - 37.333 2.681 12 0.751 0.413 0.000 0.000 12 - - 1.000 0.000 12 - - 38.500 7.053 4 1.000 0.589 0.000 0.000 4 - - 1.000 0.000 4 - - 49.839 4.525 16 0.021 0.015
0.490
0.156 0.109 16 - -
0.091
0.771 0.104 16 - - 24.833 6.735 4 - - 1.750 1.010 4 - - 0.500 0.289 4 - - 35.000 . 1 - - 0.000 . 1 - - 1.000 . 1 - - 38.000 . 1 - - 0.000 . 1 - - 1.000 . 1 - - 18.500 0.500 2 - - 0.500 0.500 2 - - 0.250 0.250 2 - - 41.104 8.284 8 - -
0.427
0.063 0.063 8 - -
0.054
1.000 0.000 8 - -
Page 258
244
Table 2 (continued): Statistical analysis output for effects of fire suppressants on density and
growth variables of field populations (by species) for the with-fire trial at Wanneroo (Kruskal-
Wallis test and planned Mann-Whitney U test pairwise comparisons). Green and red cells
denote a significant (p<0.05) increase or decrease (respectively) compared to dry control (p vs
D) and wet control (p vs W). Yellow cells denote type-I errors, determined by overlapping
standard errors of means. Species names preceded by ‘*’ denote non-native species. Table
continues across double page and continues over next pages.
Species: Lepidosperma scabrum Nees
Continues → → →
Abundance Cover KW MW-U Tests KW MW-U Tests KW Test SE p p Test SE p p Test
Time Treatment
p M -/+ N vs D vs W p M -/+ N vs D vs W p Dry Control 0.000 0.000 30 - - - - 0 - - Wet Control 0.000 0.000 30 - - - - 0 - - Silv-Ex 0.000 0.000 30 - - - - 0 - - Clear ETI 0.000 0.000 30 - - - - 0 - - 0-
Mon
ths
Phos-Chek
-
0.000 0.000 30 - -
-
- - 0 - -
-
Dry Control 0.600 0.170 30 - 0.009 0.100 0.000 10 - - Wet Control 0.100 0.074 30 0.009 - 0.100 0.000 2 - - Silv-Ex 0.700 0.226 30 0.965 0.010 0.100 0.000 10 - - Clear ETI 0.500 0.164 30 0.757 0.012 0.120 0.020 10 - - 3-
Mon
ths
Phos-Chek
0.008
1.200 0.323 30 0.196 0.000
0.737
0.102 0.002 15 - -
0.063
Dry Control 0.533 0.202 30 - - 0.156 0.018 9 - - Wet Control 0.667 0.221 30 - - 0.198 0.035 10 - - Silv-Ex 0.767 0.196 30 - - 0.226 0.063 13 - - Clear ETI 0.300 0.145 30 - - 0.167 0.021 5 - - 6-
Mon
ths
Phos-Chek
0.129
0.367 0.162 30 - -
0.404
0.593 0.378 5 - -
0.741
Dry Control 0.167 0.069 30 - - 0.140 0.024 5 - - Wet Control 0.400 0.132 30 - - 0.244 0.096 9 - - Silv-Ex 0.500 0.190 30 - - 1.039 0.809 9 - - Clear ETI 0.100 0.056 30 - - 0.467 0.273 3 - - 9-
Mon
ths
Phos-Chek
0.116
0.133 0.063 30 - -
0.291
1.400 1.201 4 - -
0.095
Dry Control 0.100 0.100 30 - - 0.200 . 1 - - Wet Control 0.367 0.155 30 - - 0.137 0.019 5 - - Silv-Ex 0.300 0.145 30 - - 1.000 0.800 6 - - Clear ETI 0.267 0.126 30 - - 0.120 0.020 5 - - 12
-Mon
ths
Phos-Chek
0.434
0.233 0.141 30 - -
0.191
0.506 0.374 4 - -
0.589
Species: Lomandra hermaphrodita (C.R.P.Andrews) C.A.Gardner Continues → → →
Abundance Cover KW MW-U Tests KW MW-U Tests KW Test SE p p Test SE p p Test
Time Treatment
p M -/+ N vs D vs W p M -/+ N vs D vs W p Dry Control 0.000 0.000 30 - - - - 0 - - Wet Control 0.000 0.000 30 - - - - 0 - - Silv-Ex 0.000 0.000 30 - - - - 0 - - Clear ETI 0.000 0.000 30 - - - - 0 - - 0-
Mon
ths
Phos-Chek
-
0.000 0.000 30 - -
-
- - 0 - -
-
Dry Control 0.000 0.000 30 - - - - 0 - - Wet Control 0.000 0.000 30 - - - - 0 - - Silv-Ex 0.000 0.000 30 - - - - 0 - - Clear ETI 0.000 0.000 30 - - - - 0 - - 3-
Mon
ths
Phos-Chek
-
0.000 0.000 30 - -
-
- - 0 - -
-
Dry Control 0.900 0.227 30 - - 0.645 0.103 14 - - Wet Control 1.567 0.302 30 - - 1.066 0.384 19 - - Silv-Ex 0.800 0.246 30 - - 0.823 0.322 12 - - Clear ETI 0.533 0.142 30 - - 1.071 0.375 12 - - 6-
Mon
ths
Phos-Chek
0.066
0.900 0.369 30 - -
0.528
0.836 0.125 11 - -
0.901
Dry Control 1.000 0.307 30 - - 0.516 0.075 13 - - Wet Control 1.233 0.290 30 - - 1.631 0.543 16 - - Silv-Ex 0.467 0.115 30 - - 0.804 0.227 12 - - Clear ETI 0.467 0.164 30 - - 0.436 0.077 9 - - 9-
Mon
ths
Phos-Chek
0.213
0.800 0.206 30 - -
0.099
0.657 0.128 14 - -
0.734
Dry Control 0.667 0.205 30 - - 0.500 0.100 10 - - Wet Control 0.633 0.195 30 - - 0.946 0.263 12 - - Silv-Ex 0.300 0.153 30 - - 0.780 0.338 5 - - Clear ETI 0.367 0.140 30 - - 0.367 0.115 7 - - 12
-Mon
ths
Phos-Chek
0.165
0.267 0.126 30 - -
0.405
0.600 0.105 5 - -
0.302
Page 259
245
Analysis Notes: Data not centred; no plants at 0-months.
Leading Shoot Length Condition Reproduction MW-U Tests KW MW-U Tests KW MW-U Tests
SE p p Test SE p p Test SE p p M -/+ N vs D vs W p M -/+ N vs D vs W p M -/+ N vs D vs W - - 0 - - - - 0 - - - - 0 - - - - 0 - - - - 0 - - - - 0 - - - - 0 - - - - 0 - - - - 0 - - - - 0 - - - - 0 - - - - 0 - - - - 0 - -
-
- - 0 - -
-
- - 0 - - 28.700 1.055 10 - - 3.000 0.129 10 - 0.258 0.000 0.000 10 - - 22.000 1.000 2 - - 3.500 0.500 2 0.258 - 0.000 0.000 2 - - 34.000 3.575 10 - - 2.650 0.150 10 0.104 0.094 0.000 0.000 10 - - 36.300 2.129 10 - - 3.350 0.076 10 0.042 0.713 0.000 0.000 10 - - 30.667 2.069 15 - -
0.022
3.392 0.216 15 0.208 0.820
1.000
0.000 0.000 15 - - 59.000 4.447 9 - - 3.528 0.214 9 - - 0.111 0.111 9 - - 64.142 3.503 10 - - 3.621 0.123 10 - - 0.100 0.100 10 - - 60.885 3.350 13 - - 4.010 0.117 13 - - 0.147 0.089 13 - - 53.667 6.100 5 - - 3.133 0.585 5 - - 0.467 0.226 5 - - 62.167 4.531 5 - -
0.087
4.033 0.107 5 - -
0.225
0.067 0.067 5 - - 55.800 7.453 5 - - 2.400 0.620 5 - - 0.000 0.000 5 - - 48.278 6.777 9 - - 2.480 0.219 9 - - 0.111 0.111 9 - - 73.111 6.532 9 - - 3.417 0.317 9 - - 0.333 0.167 9 - - 67.000 8.083 3 - - 3.333 0.167 3 - - 0.667 0.333 3 - - 66.750 11.842 4 - -
0.145
3.250 0.323 4 - -
0.166
0.500 0.289 4 - - 41.667 . 1 - - 2.167 . 1 - - 0.000 . 1 - - 55.900 8.675 5 - - 2.433 0.238 5 - - 0.000 0.000 5 - - 63.250 7.296 6 - - 2.938 0.157 6 - - 0.333 0.211 6 - - 52.667 4.914 5 - - 3.117 0.260 5 - - 0.433 0.194 5 - - 59.750 4.049 4 - -
0.083
3.906 0.488 4 - -
0.367
0.500 0.289 4 - -
Analysis Notes: Data not centred; no plants at 0 and 3 months.
Leading Shoot Length Condition Reproduction MW-U Tests KW MW-U Tests KW MW-U Tests
SE p p Test SE p p Test SE p p M -/+ N vs D vs W p M -/+ N vs D vs W p M -/+ N vs D vs W - - 0 - - - - 0 - - - - 0 - - - - 0 - - - - 0 - - - - 0 - - - - 0 - - - - 0 - - - - 0 - - - - 0 - - - - 0 - - - - 0 - - - - 0 - -
-
- - 0 - -
-
- - 0 - - - - 0 - - - - 0 - - - - 0 - - - - 0 - - - - 0 - - - - 0 - - - - 0 - - - - 0 - - - - 0 - - - - 0 - - - - 0 - - - - 0 - - - - 0 - -
-
- - 0 - -
-
- - 0 - - 29.083 2.103 14 - - 3.649 0.232 14 - - 0.000 0.000 14 - - 28.723 1.545 19 - - 3.786 0.087 19 - - 0.000 0.000 19 - - 29.842 2.677 12 - - 3.867 0.253 12 - - 0.000 0.000 12 - - 29.458 2.498 12 - - 3.625 0.186 12 - - 0.042 0.042 12 - - 27.000 1.408 11 - -
0.776
3.682 0.246 11 - -
0.323
0.000 0.000 11 - - 30.485 1.362 13 - - 3.123 0.133 13 - - 0.000 0.000 13 - - 28.613 1.912 16 - - 2.917 0.222 16 - - 0.063 0.063 16 - - 29.792 2.123 12 - - 3.188 0.224 12 - - 0.000 0.000 12 - - 27.417 2.908 9 - - 2.833 0.161 9 - - 0.000 0.000 9 - - 29.143 2.560 14 - -
0.586
3.054 0.202 14 - -
0.558
0.000 0.000 14 - - 27.675 1.482 10 - - 3.138 0.099 10 - - 0.150 0.107 10 - - 23.608 3.189 12 - - 3.083 0.183 12 - - 0.208 0.114 12 - - 32.800 3.787 5 - - 3.700 0.200 5 - - 0.000 0.000 5 - - 21.524 4.746 7 - - 2.738 0.363 7 - - 0.000 0.000 7 - - 33.600 5.573 5 - -
0.170
3.367 0.207 5 - -
0.097
0.500 0.224 5 - -
Page 260
246
Table 2 (continued): Statistical analysis output for effects of fire suppressants on density and
growth variables of field populations (by species) for the with-fire trial at Wanneroo (Kruskal-
Wallis test and planned Mann-Whitney U test pairwise comparisons). Green and red cells
denote a significant (p<0.05) increase or decrease (respectively) compared to dry control (p vs
D) and wet control (p vs W). Yellow cells denote type-I errors, determined by overlapping
standard errors of means. Species names preceded by ‘*’ denote non-native species. Table
continues across double page and continues over next pages.
Species: Lomandra preisii (Endl.) Ewart
Continues → → →
Abundance Cover KW MW-U Tests KW MW-U Tests KW Test SE p p Test SE p p Test
Time Treatment
p M -/+ N vs D vs W p M -/+ N vs D vs W p Dry Control 0.000 0.488 30 - - 0.000 1.308 13 - - Wet Control 0.000 0.251 30 - - 0.000 0.275 14 - - Silv-Ex 0.000 0.620 30 - - 0.000 0.707 15 - - Clear ETI 0.000 1.831 30 - - 0.000 2.027 16 - - 0-
Mon
ths
Phos-Chek
-
0.000 2.813 30 - -
-
0.000 0.040 13 - -
-
Dry Control 0.000 0.683 30 - 0.002 -1.453 0.467 12 - 0.003 Wet Control 0.133 0.305 30 0.002 - 0.250 0.446 13 0.003 - Silv-Ex 0.267 0.554 30 0.086 0.096 -0.850 0.088 13 0.004 0.001 Clear ETI 1.533 2.118 30 0.024 0.019 -0.305 2.043 17 0.005 0.000 3-
Mon
ths
Phos-Chek
0.000
-3.200 0.801 30 0.000 0.000
0.000
6.476 4.279 14 0.001 0.001
0.529
Dry Control 11.567 3.462 30 - 0.592 -2.122 0.251 20 - 0.000 Wet Control 7.267 2.683 30 0.592 - 0.043 0.200 19 0.000 - Silv-Ex 0.633 0.945 30 0.000 0.000 -0.669 0.347 11 0.000 0.000 Clear ETI -4.133 0.433 30 0.000 0.000 -2.475 0.158 11 0.019 0.000 6-
Mon
ths
Phos-Chek
0.000
-3.867 0.573 30 0.000 0.000
0.000
0.081 0.037 10 0.000 0.001
0.913
Dry Control -1.067 0.189 30 - 0.000 -2.316 0.061 5 - - Wet Control -0.733 0.136 30 0.000 - -0.250 0.000 2 - - Silv-Ex -1.800 0.033 30 0.000 0.000 -0.696 . 1 - - Clear ETI -4.700 0.699 30 0.000 0.000 -1.863 0.662 4 - - 9-
Mon
ths
Phos-Chek
0.000
-5.300 0.056 30 0.000 0.000
-
2.974 2.186 3 - -
-
Dry Control -0.967 0.324 30 - 0.000 -2.425 0.029 3 - - Wet Control -0.700 0.111 30 0.000 - 0.525 0.544 4 - - Silv-Ex -1.800 0.033 30 0.000 0.000 1.804 . 1 - - Clear ETI -5.467 0.033 30 0.000 0.000 -1.963 . 1 - - 12
-Mon
ths
Phos-Chek
0.000
-5.367 0.033 30 0.000 0.000
-
0.808 . 1 - -
-
Species: Mesomelaena pseudostygia (Kuek.) K.L.Wilson Continues → → →
Abundance Cover KW MW-U Tests KW MW-U Tests KW Test SE p p Test SE p p Test
Time Treatment
p M -/+ N vs D vs W p M -/+ N vs D vs W p Dry Control 0.000 0.115 30 - - 0.000 3.127 13 - - Wet Control 0.000 0.123 30 - - 0.000 1.378 9 - - Silv-Ex 0.000 0.147 30 - - 0.000 1.144 18 - - Clear ETI 0.000 0.170 30 - - 0.000 1.918 12 - - 0-
Mon
ths
Phos-Chek
-
0.000 0.224 30 - -
-
0.000 4.034 14 - -
-
Dry Control 0.033 0.133 30 - 0.032 -1.833 1.379 13 - - Wet Control -0.100 0.119 30 0.032 - 2.413 3.615 7 - - Silv-Ex -0.167 0.148 30 0.011 0.109 2.871 1.905 14 - - Clear ETI 0.000 0.156 30 0.004 0.026 3.174 3.088 12 - - 3-
Mon
ths
Phos-Chek
0.021
-0.033 0.198 30 0.067 0.224
0.465
0.358 2.607 14 - -
0.064
Dry Control 0.233 0.179 30 - 0.057 5.089 3.417 15 - - Wet Control 0.267 0.216 30 0.057 - 8.012 4.959 10 - - Silv-Ex -0.067 0.151 30 0.021 0.107 13.009 4.674 16 - - Clear ETI -0.067 0.150 30 0.000 0.001 14.739 6.744 11 - - 6-
Mon
ths
Phos-Chek
0.002
-0.100 0.184 30 0.011 0.001
0.808
8.293 3.171 14 - -
0.777
Dry Control 0.300 0.169 30 - 0.069 6.615 2.228 15 - 0.069 Wet Control 0.200 0.156 30 0.069 - 9.819 4.490 12 0.069 - Silv-Ex 0.033 0.180 30 0.029 0.130 17.784 5.760 17 0.029 0.130 Clear ETI -0.133 0.104 30 0.000 0.001 26.452 4.953 13 0.000 0.001 9-
Mon
ths
Phos-Chek
0.001
-0.200 0.146 30 0.006 0.033
0.009
26.344 6.229 16 0.006 0.033
0.195
Dry Control 0.233 0.166 30 - 0.078 10.162 4.494 15 - - Wet Control 0.033 0.114 30 0.078 - 28.728 7.396 11 - - Silv-Ex -0.100 0.137 30 0.014 0.136 23.872 5.655 17 - - Clear ETI -0.033 0.133 30 0.001 0.012 23.375 7.783 14 - - 12
-Mon
ths
Phos-Chek
0.025
0.067 0.219 30 0.060 0.295
0.320
28.737 7.719 17 - -
0.690
Page 261
247
Analysis Notes: All data centred. Growth variables (Cover, Leading Shoot Length, Condition, and Reproduction) not analysed at 9 and 12 months; insufficient Ns.
Leading Shoot Length Condition Reproduction MW-U Tests KW MW-U Tests KW MW-U Tests
SE p p Test SE p p Test SE p p M -/+ N vs D vs W p M -/+ N vs D vs W p M -/+ N vs D vs W
0.000 0.630 13 - - 0.000 0.054 13 - - 0.000 0.000 13 - - 0.000 0.715 14 - - 0.000 0.251 14 - - 0.000 0.000 14 - - 0.000 0.582 15 - - 0.000 0.142 15 - - 0.000 0.017 15 - - 0.000 0.726 16 - - 0.000 0.232 16 - - 0.000 0.000 16 - - 0.000 1.456 13 - -
-
0.000 0.275 13 - -
-
0.000 0.000 13 - - 7.186 1.626 12 - - 1.777 0.363 12 - - 0.000 0.000 12 - 0.083 8.457 2.205 13 - - 2.055 0.395 13 - - 0.192 0.106 13 0.083 -
12.248 2.498 13 - - 2.208 0.307 13 - - 0.049 0.032 13 0.076 0.016 10.142 1.179 17 - - 1.881 0.109 17 - - 0.112 0.065 17 0.076 0.865 8.227 1.753 14 - -
0.130
2.350 0.114 14 - -
0.013
0.214 0.101 14 0.049 0.800 21.694 2.030 20 - - 3.170 0.216 20 - 0.004 0.000 0.000 20 - 0.142 22.390 1.917 19 - - 2.666 0.155 19 0.004 - 0.015 0.010 19 0.142 - 24.049 2.413 11 - - 2.594 0.222 11 0.062 0.649 0.006 0.023 11 0.000 0.000 21.576 2.645 11 - - 1.971 0.107 11 0.000 0.001 0.000 0.000 11 1.000 0.274 22.006 1.721 10 - -
0.000
2.153 0.164 10 0.001 0.008
0.000
0.023 0.023 10 0.157 0.965 19.888 7.982 5 - - 2.591 0.339 5 - - 0.000 0.000 5 - - 8.726 10.000 2 - - 0.286 0.000 2 - - 0.000 0.000 2 - -
21.594 . 1 - - 3.003 . 1 - - -0.017 . 1 - - 33.828 5.212 4 - - 1.742 0.239 4 - - 0.000 0.000 4 - - 23.256 6.741 3 - -
-
1.936 0.167 3 - -
-
0.000 0.000 3 - - 6.507 0.776 3 - - 3.521 0.188 3 - - 0.000 0.000 3 - -
17.476 5.483 4 - - 2.411 0.375 4 - - 0.250 0.250 4 - - 33.594 . 1 - - 2.503 . 1 - - 0.983 . 1 - - 32.828 . 1 - - 2.117 . 1 - - 1.000 . 1 - - 21.923 . 1 - -
-
1.769 . 1 - -
-
1.000 . 1 - -
Analysis Notes: None.
Leading Shoot Length Condition Reproduction MW-U Tests KW MW-U Tests KW MW-U Tests
SE p p Test SE p p Test SE p p M -/+ N vs D vs W p M -/+ N vs D vs W p M -/+ N vs D vs W
0.000 1.020 13 - - 0.000 0.119 13 - - 0.000 0.000 13 - - 0.000 0.878 9 - - 0.000 0.172 9 - - 0.000 0.000 9 - - 0.000 0.508 18 - - 0.000 0.089 18 - - 0.000 0.000 18 - - 0.000 0.777 12 - - 0.000 0.063 12 - - 0.000 0.000 12 - - 0.000 1.442 14 - -
-
0.000 0.112 14 - -
-
0.000 0.036 14 - - 12.051 1.278 13 - - 2.122 0.141 13 - - 0.000 0.000 13 - 1.000 12.778 1.134 7 - - 2.155 0.130 7 - - 0.000 0.000 7 1.000 - 16.328 1.334 14 - - 2.163 0.119 14 - - 0.000 0.000 14 1.000 1.000 15.569 1.744 12 - - 1.792 0.158 12 - - 0.000 0.000 12 1.000 1.000 17.723 2.897 14 - -
0.189
1.823 0.195 14 - -
0.000
0.036 0.071 14 0.000 0.000 51.020 2.333 15 - - 2.852 0.117 15 - - 0.867 0.091 15 - 0.794 54.064 1.716 10 - - 2.995 0.232 10 - - 0.890 0.074 10 0.794 - 54.831 2.495 16 - - 3.061 0.129 16 - - 0.719 0.112 16 0.265 0.398 52.936 3.683 11 - - 2.847 0.229 11 - - 0.894 0.072 11 0.869 0.959 54.229 2.480 14 - -
0.483
3.029 0.093 14 - -
0.001
0.845 0.083 14 0.000 0.003 50.064 3.543 15 - - 2.863 0.139 15 - - 0.900 0.072 15 - 0.752 61.306 4.181 12 - - 2.965 0.180 12 - - 0.833 0.112 12 0.752 - 60.710 3.013 17 - - 2.801 0.093 17 - - 0.941 0.059 17 0.501 0.356 59.439 2.196 13 - - 2.957 0.122 13 - - 0.923 0.077 13 0.668 0.499 53.857 2.763 16 - -
0.724
2.741 0.086 16 - -
0.000
0.818 0.086 16 0.000 0.001 54.686 2.856 15 - - 3.141 0.136 15 - - 0.878 0.074 15 - 0.123 58.005 4.210 11 - - 2.992 0.163 11 - - 1.000 0.000 11 0.123 - 57.249 2.285 17 - - 3.208 0.125 17 - - 0.676 0.113 17 0.241 0.030 58.208 3.394 14 - - 3.152 0.146 14 - - 0.929 0.071 14 0.363 0.375 54.873 2.256 17 - -
0.446
3.198 0.119 17 - -
0.000
0.891 0.051 17 0.001 0.000
Page 262
248
Table 2 (continued): Statistical analysis output for effects of fire suppressants on density and
growth variables of field populations (by species) for the with-fire trial at Wanneroo (Kruskal-
Wallis test and planned Mann-Whitney U test pairwise comparisons). Green and red cells
denote a significant (p<0.05) increase or decrease (respectively) compared to dry control (p vs
D) and wet control (p vs W). Yellow cells denote type-I errors, determined by overlapping
standard errors of means. Species names preceded by ‘*’ denote non-native species. Table
continues across double page and continues over next pages.
Species: Thysanototus manglesianus Kunth
Continues → → →
Abundance Cover KW MW-U Tests KW MW-U Tests KW Test SE p p Test SE p p Test
Time Treatment
p M -/+ N vs D vs W p M -/+ N vs D vs W p Dry Control 0.000 0.000 30 - - - - 0 - - Wet Control 0.000 0.033 30 - - 0.000 - 1 - - Silv-Ex 0.000 0.074 30 - - 0.000 0.000 2 - - Clear ETI 0.000 0.088 30 - - 0.000 0.020 5 - - 0-
Mon
ths
Phos-Chek
-
0.000 0.056 30 - -
-
0.000 0.000 3 - -
-
Dry Control 0.700 0.259 30 - 0.018 0.536 0.172 11 - - Wet Control 0.567 0.132 30 0.018 - 0.821 0.237 14 - - Silv-Ex 0.367 0.142 30 0.000 0.000 0.445 0.158 10 - - Clear ETI 0.000 0.088 30 0.000 0.000 0.280 0.089 5 - - 3-
Mon
ths
Phos-Chek
0.000
0.067 0.069 30 0.000 0.000
0.346
0.180 0.058 5 - -
0.818
Dry Control 0.000 0.000 30 - - - - 0 - - Wet Control 0.000 0.000 30 - - - - 0 - - Silv-Ex 0.000 0.000 30 - - - - 0 - - Clear ETI 0.000 0.000 30 - - - - 0 - - 6-
Mon
ths
Phos-Chek
-
0.000 0.000 30 - -
-
- - 0 - -
-
Dry Control 0.000 0.000 30 - - - - 0 - - Wet Control 0.000 0.000 30 - - - - 0 - - Silv-Ex 0.000 0.000 30 - - - - 0 - - Clear ETI 0.000 0.000 30 - - - - 0 - - 9-
Mon
ths
Phos-Chek
-
0.000 0.000 30 - -
-
- - 0 - -
-
Dry Control 0.467 0.124 30 - 0.000 0.909 0.369 11 Wet Control 0.233 0.095 30 0.000 - 0.643 0.394 7 Silv-Ex 0.100 0.101 30 0.000 0.000 0.800 0.356 4 Clear ETI 0.033 0.104 30 0.000 0.000 2.550 0.804 5 12
-Mon
ths
Phos-Chek
0.000
0.000 0.056 30 0.000 0.000
0.538
0.300 0.100 3
0.370
Species: Xanthorrhoea preissii Endl.
Continues → → →
Abundance Cover KW MW-U Tests KW MW-U Tests KW Test SE p p Test SE p p Test
Time Treatment
p M -/+ N vs D vs W p M -/+ N vs D vs W p Dry Control 0.000 0.132 30 - - 0.000 5.875 14 - - Wet Control 0.000 0.114 30 - - 0.000 2.653 5 - - Silv-Ex 0.000 0.106 30 - - 0.000 1.717 7 - - Clear ETI 0.000 0.123 30 - - 0.000 1.681 12 - - 0-
Mon
ths
Phos-Chek
-
0.000 0.140 30 - -
-
0.000 2.094 9 - -
-
Dry Control 0.000 0.132 30 - 0.191 7.343 7.238 14 - - Wet Control 0.000 0.114 30 0.191 - 6.600 4.130 5 - - Silv-Ex 0.033 0.109 30 0.096 0.000 11.707 10.364 7 - - Clear ETI 0.067 0.150 30 0.035 0.003 5.190 3.383 12 - - 3-
Mon
ths
Phos-Chek
0.000
-0.100 0.126 30 0.171 0.000
0.812
3.598 2.530 9 - -
0.990
Dry Control 0.000 0.132 30 - 0.171 25.111 9.148 14 - - Wet Control 0.033 0.126 30 0.171 - 30.833 16.974 5 - - Silv-Ex 0.033 0.119 30 0.114 0.000 32.243 17.187 7 - - Clear ETI 0.067 0.150 30 0.035 0.003 11.826 5.170 12 - - 6-
Mon
ths
Phos-Chek
0.000
-0.100 0.106 30 0.129 0.000
0.670
18.302 10.345 9 - -
0.146
Dry Control 0.000 0.141 30 - 0.087 29.539 9.016 14 - - Wet Control 0.033 0.126 30 0.087 - 36.700 19.962 5 - - Silv-Ex 0.033 0.119 30 0.057 0.000 29.029 18.307 7 - - Clear ETI 0.067 0.150 30 0.022 0.003 15.465 4.959 12 - - 9-
Mon
ths
Phos-Chek
0.000
0.033 0.156 30 0.039 0.000
0.729
20.357 9.897 9 - -
0.040
Dry Control 0.033 0.155 30 - 0.102 24.992 9.611 14 - - Wet Control 0.000 0.114 30 0.102 - 46.333 22.098 5 - - Silv-Ex 0.033 0.128 30 0.070 0.000 33.850 18.667 7 - - Clear ETI 0.100 0.150 30 0.016 0.009 17.549 5.803 12 - - 12
-Mon
ths
Phos-Chek
0.000
0.000 0.155 30 0.054 0.000
0.875
22.177 8.656 9 - -
0.021
Page 263
249
Analysis Notes: Analysis not performed for 6 and 9 months; No plants recorded (dormant). Condition and Reproduction not centred; insufficient Ns at 0-months.
Leading Shoot Length Condition Reproduction MW-U Tests KW MW-U Tests KW MW-U Tests
SE p p Test SE p p Test SE p p M -/+ N vs D vs W p M -/+ N vs D vs W p M -/+ N vs D vs W - - 0 - - - - 0 - - - - 0 - -
0.000 - 1 - - 4.000 - 1 - - 0.000 - 1 - - 0.000 2.000 2 - - 2.000 0.000 2 - - 0.000 0.000 2 - - 0.000 4.359 5 - - 2.700 0.464 5 - - 0.000 0.000 5 - - 0.000 3.383 3 - -
-
3.333 0.167 3 - -
-
0.000 0.000 3 - - 15.424 4.630 11 - - 3.712 0.209 11 - - 0.000 0.000 11 - - 20.321 5.413 14 - - 3.643 0.225 14 - - 0.000 0.000 14 - - 17.450 5.175 10 - - 3.283 0.184 10 - - 0.000 0.000 10 - - 11.000 2.702 5 - - 3.350 0.187 5 - - 0.000 0.000 5 - - 13.933 4.445 5 - -
0.282
3.200 0.339 5 - -
1.000
0.000 0.000 5 - - - - 0 - - - - 0 - - - - 0 - - - - 0 - - - - 0 - - - - 0 - - - - 0 - - - - 0 - - - - 0 - - - - 0 - - - - 0 - - - - 0 - - - - 0 - -
-
- - 0 - -
-
- - 0 - - - - 0 - - - - 0 - - - - 0 - - - - 0 - - - - 0 - - - - 0 - - - - 0 - - - - 0 - - - - 0 - - - - 0 - - - - 0 - - - - 0 - - - - 0 - -
-
- - 0 - -
-
- - 0 - - 28.227 6.052 11 - - 3.773 0.237 11 - - 0.000 0.000 11 - - 27.143 13.700 7 - - 3.321 0.465 7 - - 0.000 0.000 7 - - 32.250 8.400 4 - - 2.938 0.819 4 - - 0.000 0.000 4 - - 61.000 19.809 5 - - 4.350 0.218 5 - - 0.000 0.000 5 - - 22.000 6.333 3 - -
0.163
3.333 0.441 3 - -
1.000
0.000 0.000 3 - -
Analysis Notes: Reproduction not centred; no plants reproducing at 0 and 3 months.
Leading Shoot Length Condition Reproduction MW-U Tests KW MW-U Tests KW MW-U Tests
SE p p Test SE p p Test SE p p M -/+ N vs D vs W p M -/+ N vs D vs W p M -/+ N vs D vs W
0.000 10.922 14 - - 0.000 0.212 14 - - 0.000 0.000 14 - - 0.000 13.073 5 - - 0.000 0.194 5 - - 0.000 0.000 5 - - 0.000 9.862 7 - - 0.000 0.184 7 - - 0.000 0.000 7 - - 0.000 14.624 12 - - 0.000 0.234 12 - - 0.000 0.000 12 - - 0.000 9.037 9 - -
-
0.000 0.241 9 - -
-
0.000 0.000 9 - - 12.393 6.856 14 - - 1.071 0.154 14 - - 0.000 0.000 14 - - 21.133 8.334 5 - - 1.033 0.187 5 - - 0.000 0.000 5 - - 24.357 10.571 7 - - 1.179 0.221 7 - - 0.000 0.000 7 - - 17.944 15.135 12 - - 1.250 0.396 12 - - 0.000 0.000 12 - - 11.926 12.165 9 - -
0.797
0.537 0.457 9 - -
-
0.000 0.000 9 - - 31.857 4.521 14 - - 1.964 0.148 14 - - 0.036 0.036 14 - - 46.733 6.000 5 - - 1.400 0.276 5 - - 0.000 0.000 5 - - 60.429 17.121 7 - - 1.750 0.451 7 - - 0.000 0.000 7 - - 37.639 14.863 12 - - 1.806 0.419 12 - - 0.000 0.000 12 - - 31.370 16.896 9 - -
0.254
0.889 0.545 9 - -
-
0.000 0.000 9 - - 26.105 9.643 14 - 0.052 1.446 0.289 14 - - 0.036 0.036 14 - - 51.533 7.449 5 0.052 - 1.883 0.200 5 - - 0.000 0.000 5 - - 62.857 17.555 7 0.017 0.167 1.857 0.449 7 - - 0.000 0.000 7 - - 41.972 14.355 12 0.136 0.673 1.618 0.372 12 - - 0.000 0.000 12 - - 51.481 11.907 9 0.027 0.386
0.201
1.431 0.362 9 - -
-
0.000 0.000 9 - - 26.202 8.979 14 - 0.010 1.476 0.301 14 - - 0.036 0.036 14 - - 58.400 4.637 5 0.010 - 1.967 0.207 5 - - 0.000 0.000 5 - - 64.786 16.283 7 0.009 0.062 1.857 0.459 7 - - 0.000 0.000 7 - - 52.833 13.311 12 0.045 0.598 2.125 0.313 12 - - 0.000 0.000 12 - - 44.565 15.655 9 0.078 0.640
0.146
1.597 0.550 9 - -
-
0.000 0.000 9 - -