39
Firm Valuation week 4-8 Fall 2014 FINC 5880 Assignment Help File and DEMO FOR YOUR INDIVIDUAL ASSIGNMENT Walt Disney Valuation 2003
| Date post: | 27-Dec-2015 |
| Category: |
Documents |
| Upload: | myron-carr |
| View: | 215 times |
| Download: | 1 times |

Firm Valuationweek 4-8 Fall 2014 FINC 5880
Assignment Help File and DEMOFOR YOUR INDIVIDUAL ASSIGNMENT
Walt Disney Valuation 2003
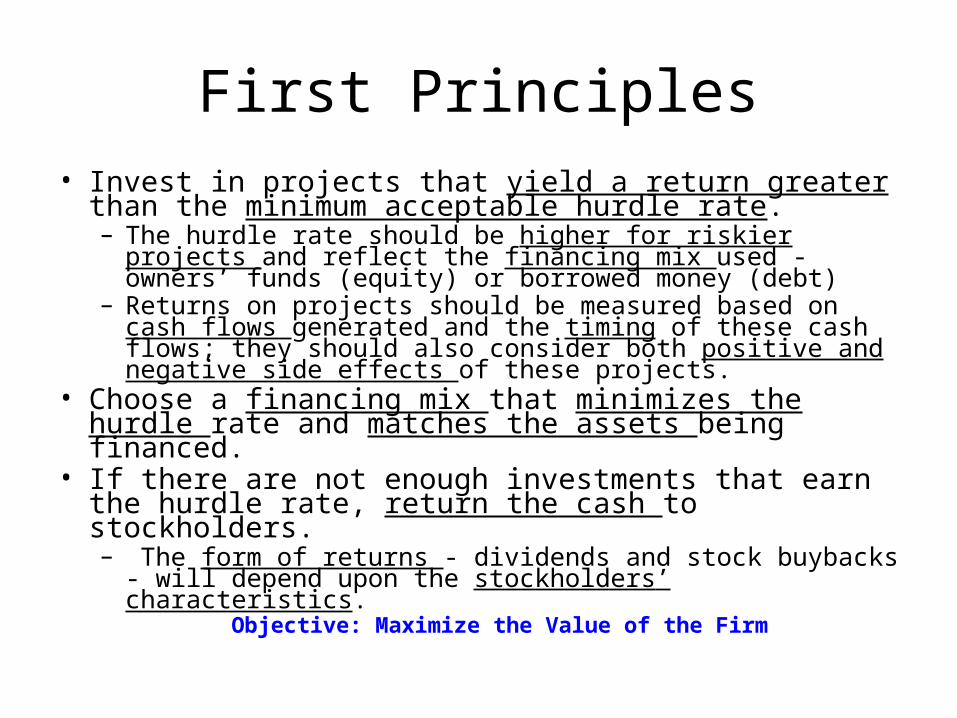
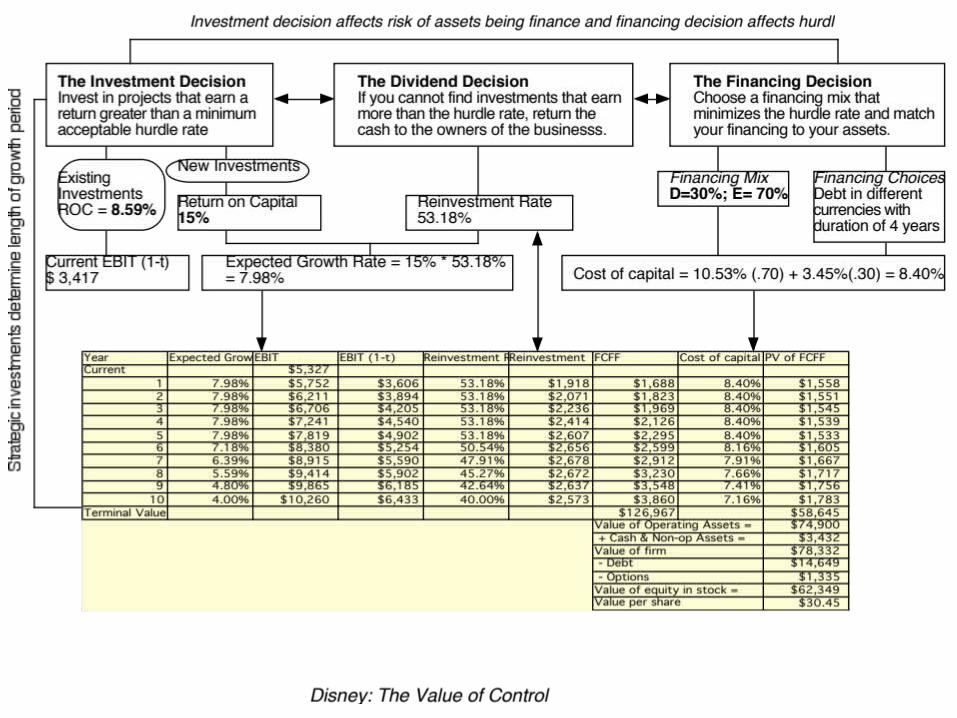
First Principles• Invest in projects that yield a return greater than the
minimum acceptable hurdle rate.– The hurdle rate should be higher for riskier projects and reflect
the financing mix used - owners’ funds (equity) or borrowed money (debt)
– Returns on projects should be measured based on cash flows generated and the timing of these cash flows; they should also consider both positive and negative side effects of these projects.
• Choose a financing mix that minimizes the hurdle rate and matches the assets being financed.
• If there are not enough investments that earn the hurdle rate, return the cash to stockholders.– The form of returns - dividends and stock buybacks - will
depend upon the stockholders’ characteristics.Objective: Maximize the Value of the Firm
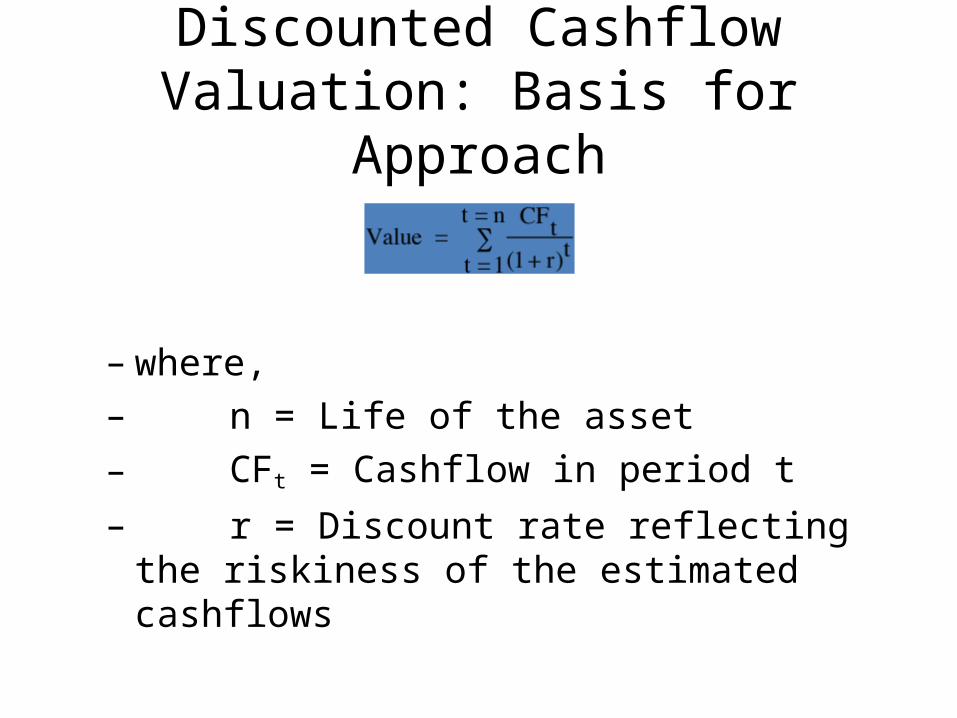
Discounted Cashflow Valuation: Basis for Approach
– where,– n = Life of the asset– CFt = Cashflow in period t– r = Discount rate reflecting the riskiness of
the estimated cashflows
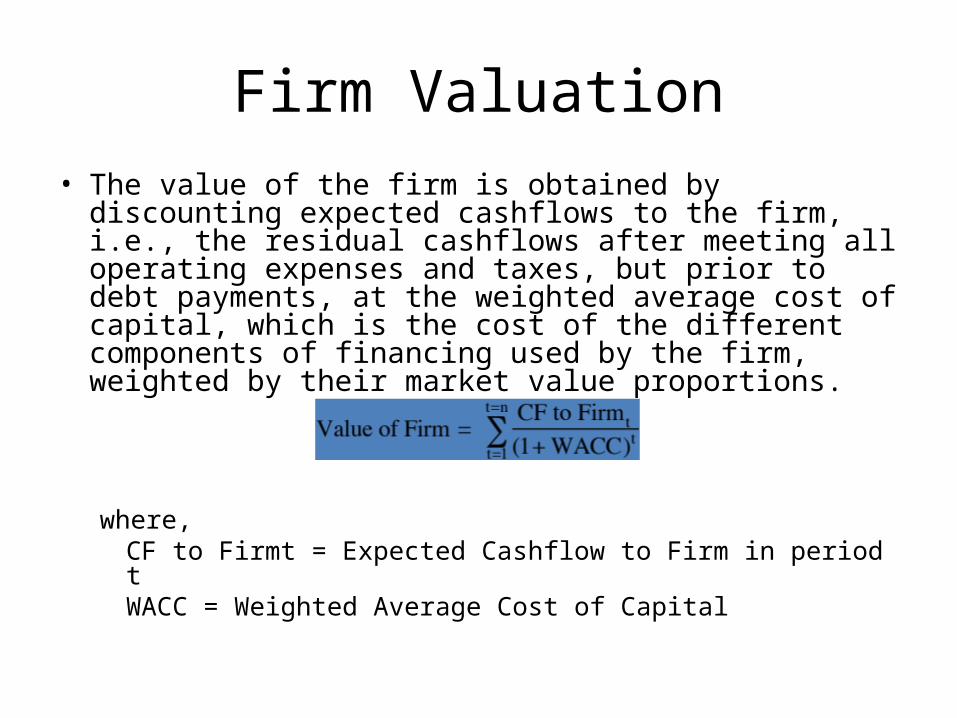
Firm Valuation• The value of the firm is obtained by discounting expected
cashflows to the firm, i.e., the residual cashflows after meeting all operating expenses and taxes, but prior to debt payments, at the weighted average cost of capital, which is the cost of the different components of financing used by the firm, weighted by their market value proportions.
where,CF to Firmt = Expected Cashflow to Firm in period tWACC = Weighted Average Cost of Capital
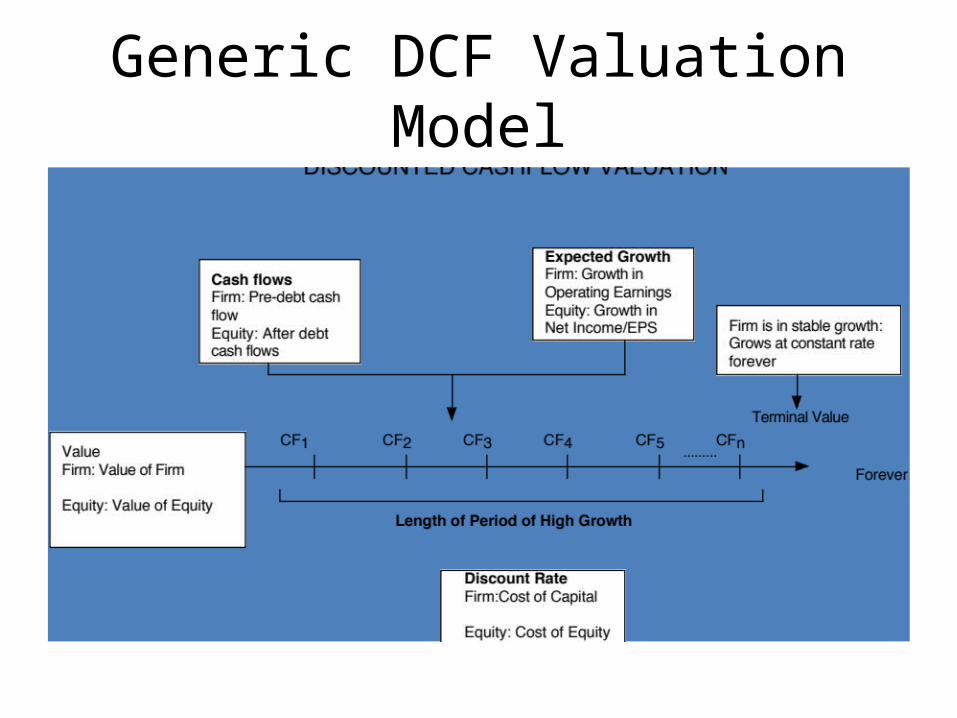
Generic DCF Valuation Model

Estimating Inputs:I. Discount Rates
• Critical ingredient in discounted cashflow valuation. Errors in estimating the discount rate or mismatching cashflows and discount rates can lead to serious errors in valuation.
• At an intuitive level, the discount rate used should be consistent with both the riskiness and the type of cashflow being discounted.
• The cost of equity is the rate at which we discount cash flows to equity (dividends or free cash flows to equity). The cost of capital is the rate at which we discount free cash flows to the firm.
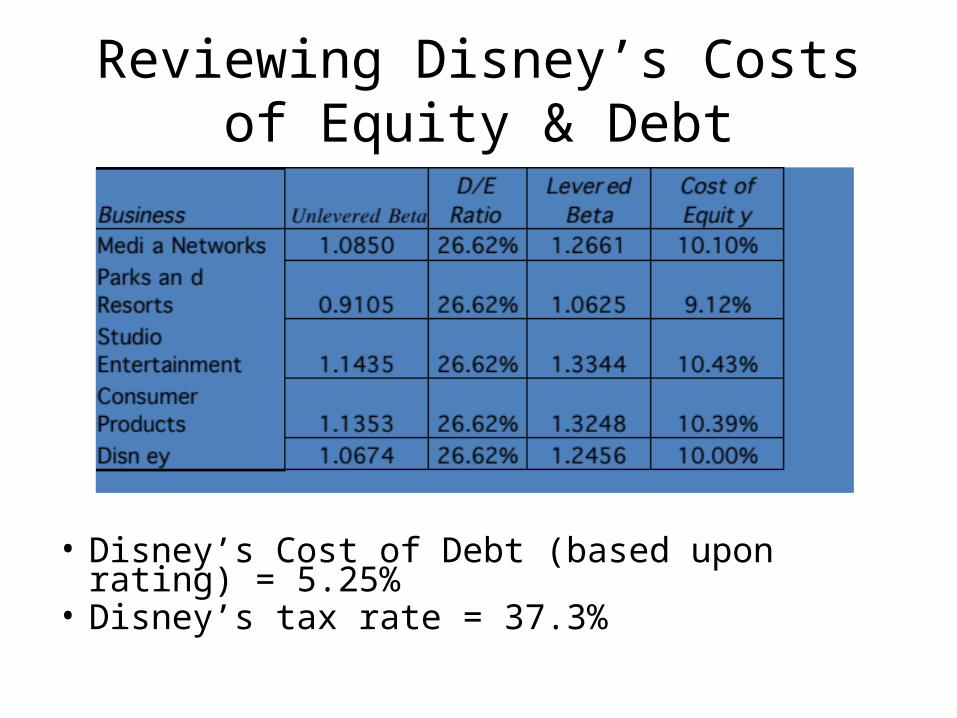
Reviewing Disney’s Costs of Equity & Debt
• Disney’s Cost of Debt (based upon rating) = 5.25%• Disney’s tax rate = 37.3%
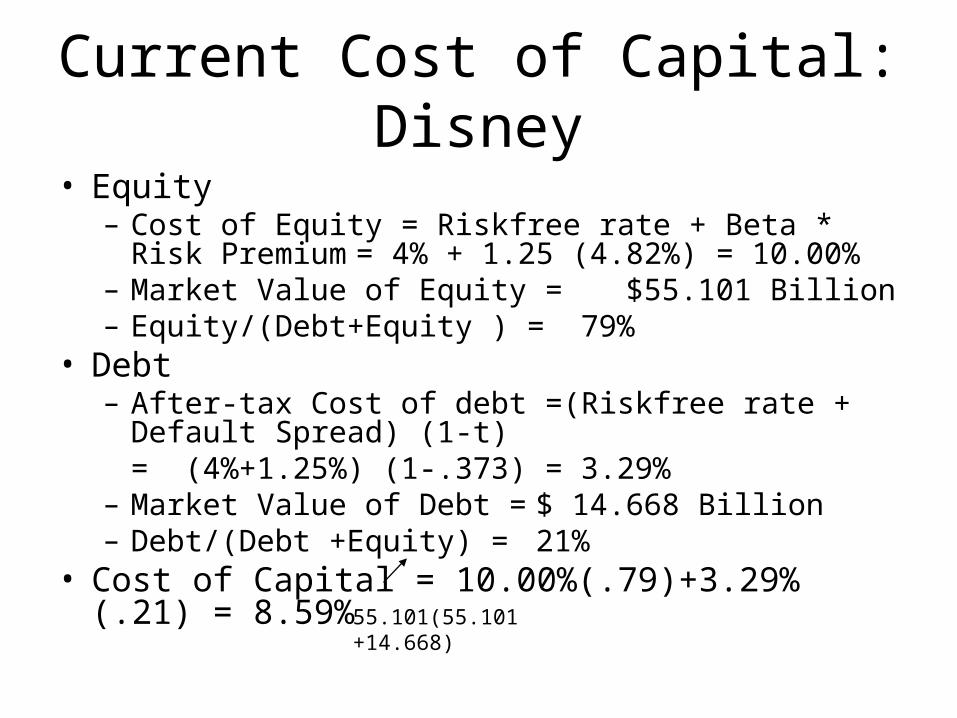
Current Cost of Capital: Disney• Equity– Cost of Equity = Riskfree rate + Beta * Risk Premium
= 4% + 1.25 (4.82%) = 10.00%– Market Value of Equity = $55.101 Billion– Equity/(Debt+Equity ) = 79%
• Debt– After-tax Cost of debt =(Riskfree rate + Default Spread) (1-
t)= (4%+1.25%) (1-.373) = 3.29%
– Market Value of Debt = $ 14.668 Billion– Debt/(Debt +Equity) = 21%
• Cost of Capital = 10.00%(.79)+3.29%(.21) = 8.59%55.101(55.101+14.668)
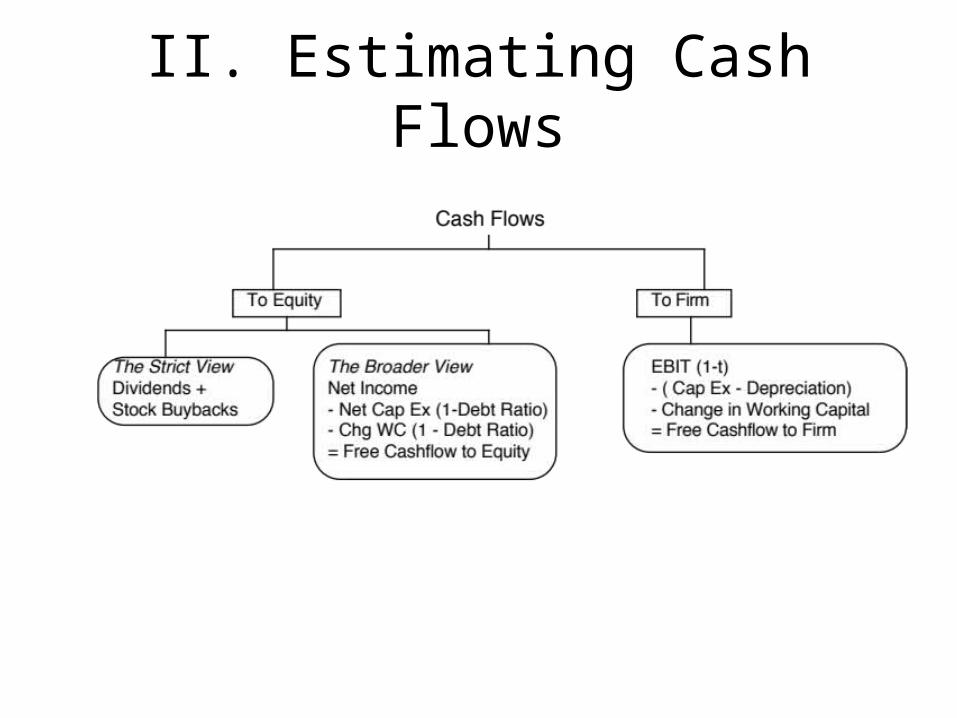
II. Estimating Cash Flows
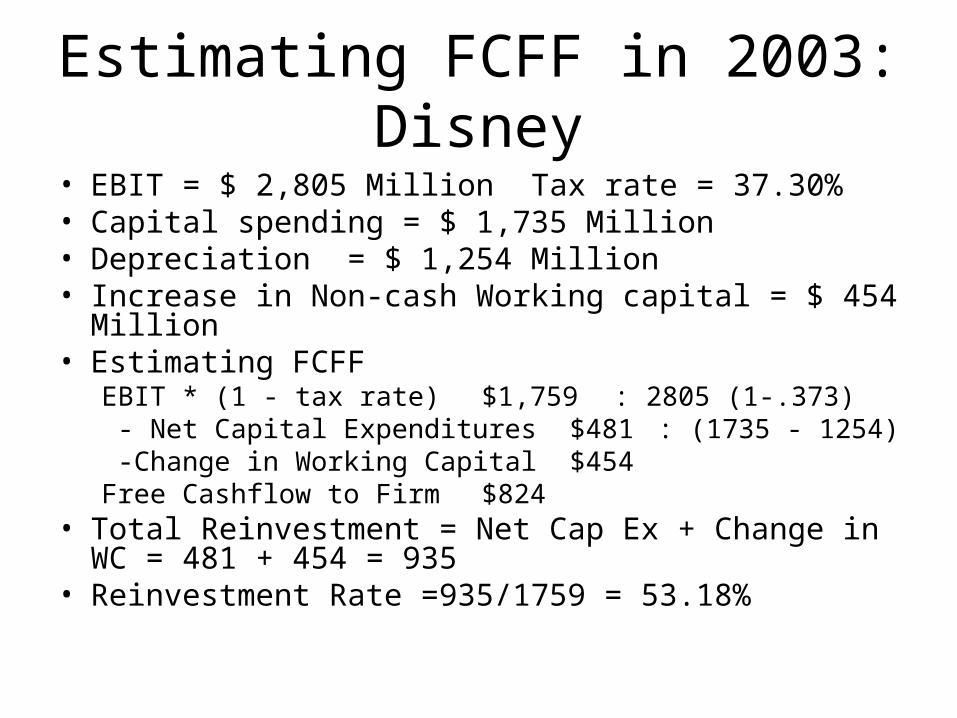
Estimating FCFF in 2003: Disney• EBIT = $ 2,805 Million Tax rate = 37.30%• Capital spending = $ 1,735 Million• Depreciation = $ 1,254 Million• Increase in Non-cash Working capital = $ 454 Million• Estimating FCFF
EBIT * (1 - tax rate) $1,759 : 2805 (1-.373) - Net Capital Expenditures$481 : (1735 - 1254) -Change in Working Capital $454 Free Cashflow to Firm $824
• Total Reinvestment = Net Cap Ex + Change in WC = 481 + 454 = 935
• Reinvestment Rate =935/1759 = 53.18%

Application Test: Estimating your firm’s FCFF
• Estimate the FCFF for your firm in its most recent financial year:
In general, If using statement of cash flowsEBIT (1-t) EBIT (1-t)+ Depreciation + Depreciation- Capital Expenditures + Capital Expenditures- Change in Non-cash WC + Change in Non-cash WC= FCFF = FCFFEstimate the dollar reinvestment at your firm:Reinvestment = EBIT (1-t) - FCFF
Choosing a Cash Flow to Discount• When you cannot estimate the free cash fllows to equity or
the firm, the only cash flow that you can discount is dividends. For financial service firms, it is difficult to estimate free cash flows. For Deutsche Bank, we will be discounting dividends.
• If a firm’s debt ratio is not expected to change over time, the free cash flows to equity can be discounted to yield the value of equity. For Aracruz, we will discount free cash flows to equity.
• If a firm’s debt ratio might change over time, free cash flows to equity become cumbersome to estimate. Here, we would discount free cash flows to the firm. For Disney, we will discount the free cash flow to the firm.

III. Expected Growth
Expected Growth in EPS
gEPS = Retained Earningst-1/ NIt-1 * ROE= Retention Ratio * ROE= b * ROE
• Proposition 1: The expected growth rate in earnings for a company cannot exceed its return on equity in the long term.
ROE and Leverage
• ROE = ROC + D/E (ROC - i (1-t))where,
ROC = (EBIT (1 - tax rate)) / Book Value of Capital= EBIT (1- t) / Book Value of Capital
D/E = BV of Debt/ BV of Equityi = Interest Expense on Debt / Book Value of Debtt = Tax rate on ordinary income
• Note that BV of Capital = BV of Debt + BV of Equity.
Decomposing ROE• Assume that you are analyzing a company with a 15%
return on capital, an after-tax cost of debt of 5% and a book debt to capital ratio of 100%. Estimate the ROE for this company.
• Now assume that another company in the same sector has the same ROE as the company that you have just analyzed but no debt. Will these two firms have the same growth rates in earnings per share if they have the same dividend payout ratio?
• Will they have the same equity value?
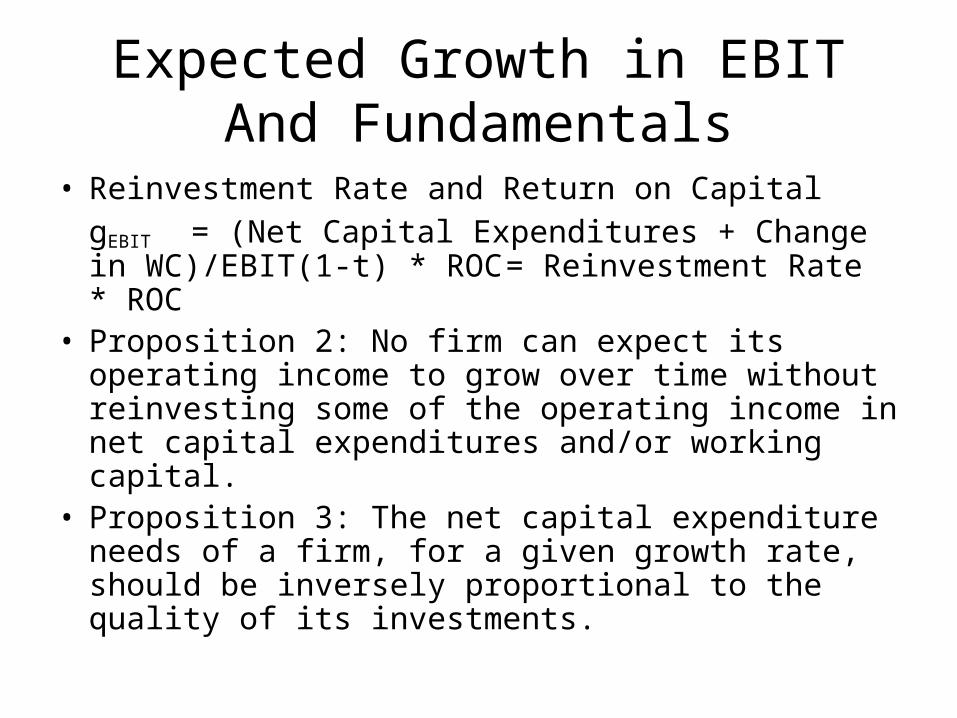
Expected Growth in EBIT And Fundamentals
• Reinvestment Rate and Return on CapitalgEBIT = (Net Capital Expenditures + Change in WC)/EBIT(1-t) * ROC = Reinvestment Rate * ROC
• Proposition 2: No firm can expect its operating income to grow over time without reinvesting some of the operating income in net capital expenditures and/or working capital.
• Proposition 3: The net capital expenditure needs of a firm, for a given growth rate, should be inversely proportional to the quality of its investments.

Estimating Growth in EBIT: Disney• We begin by estimating the reinvestment rate and return on capital
for Disney in 2003, using the numbers from the latest financial statements. We did convert operating leases into debt and adjusted the operating income and capital expenditure accordingly.– Reinvestment Rate2003 = (Cap Ex – Depreciation + Chg in non-cash
WC)/ EBIT (1-t) = (1735 – 1253 + 454)/(2805(1-.373)) = 53.18%– Return on capital2003 = EBIT (1-t)2003/ (BV of Debt2002 + BV of Equity2002)
= 2805 (1-.373)/ (15,883+23,879) = 4.42%– Expected Growth Rate from existing fundamentals = 53.18% * 4.42% =
2.35%• We will assume that Disney will be able to earn a return on capital
of 12% on its new investments and that the reinvestment rate will be 53.18% for the immediate future.– Expected Growth Rate in operating income = Return on capital *
Reinvestment Rate = 12% * .5318 = 6.38%
Application Test: Estimating Expected Growth
• Estimate the following:– The reinvestment rate for your firm– The after-tax return on capital – The expected growth in operating income, based
upon these inputs
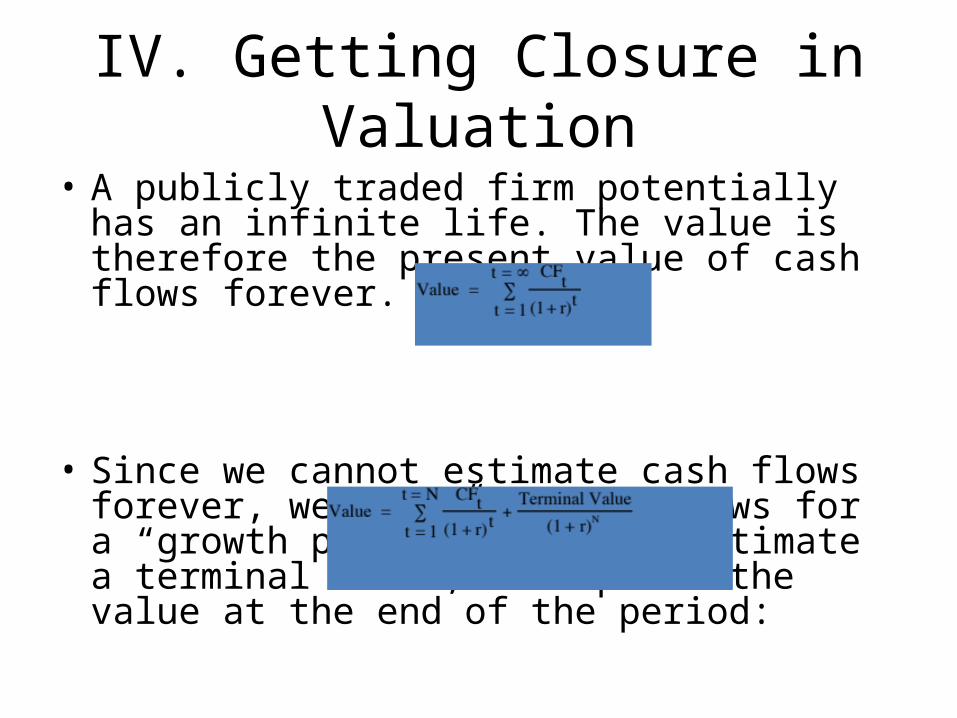
IV. Getting Closure in Valuation• A publicly traded firm potentially has an infinite
life. The value is therefore the present value of cash flows forever.
• Since we cannot estimate cash flows forever, we estimate cash flows for a “growth period” and then estimate a terminal value, to capture the value at the end of the period:
Stable Growth and Terminal Value• When a firm’s cash flows grow at a “constant” rate forever, the
present value of those cash flows can be written as:Value = Expected Cash Flow Next Period / (r - g)where,
r = Discount rate (Cost of Equity or Cost of Capital)g = Expected growth rate
• This “constant” growth rate is called a stable growth rate and cannot be higher than the growth rate of the economy in which the firm operates.
• While companies can maintain high growth rates for extended periods, they will all approach “stable growth” at some point in time.
• When they do approach stable growth, the valuation formula above can be used to estimate the “terminal value” of all cash flows beyond.
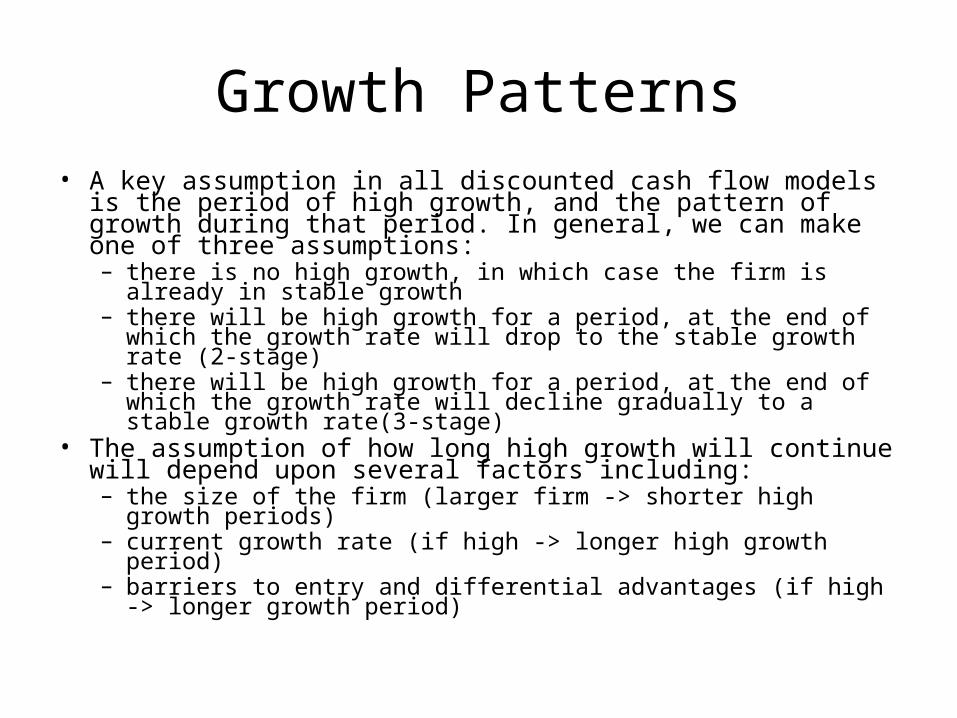
Growth Patterns• A key assumption in all discounted cash flow models is the period
of high growth, and the pattern of growth during that period. In general, we can make one of three assumptions:– there is no high growth, in which case the firm is already in stable
growth– there will be high growth for a period, at the end of which the growth
rate will drop to the stable growth rate (2-stage)– there will be high growth for a period, at the end of which the growth
rate will decline gradually to a stable growth rate(3-stage)• The assumption of how long high growth will continue will depend
upon several factors including:– the size of the firm (larger firm -> shorter high growth periods)– current growth rate (if high -> longer high growth period)– barriers to entry and differential advantages (if high -> longer growth
period)

Length of High Growth Period• Assume that you are analyzing two firms, both of which are
enjoying high growth. The first firm is Earthlink Network, an internet service provider, which operates in an environment with few barriers to entry and extraordinary competition. The second firm is Biogen, a bio-technology firm which is enjoying growth from two drugs to which it owns patents for the next decade. Assuming that both firms are well managed, which of the two firms would you expect to have a longer high growth period?
Earthlink Network Biogen Both are well managed and should have the same high
growth period

Choosing a Growth Period: Examples
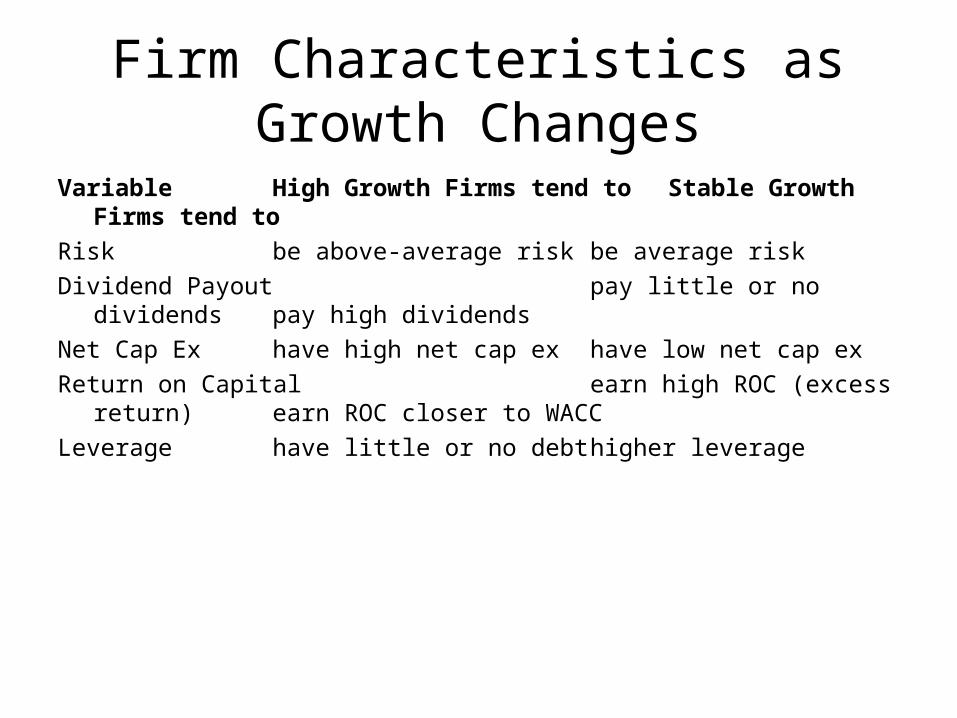
Firm Characteristics as Growth Changes
Variable High Growth Firms tend to Stable Growth Firms tend toRisk be above-average risk be average risk Dividend Payout pay little or no dividends pay high dividendsNet Cap Ex have high net cap ex have low net cap exReturn on Capital earn high ROC (excess return) earn ROC closer to WACCLeverage have little or no debt higher leverage
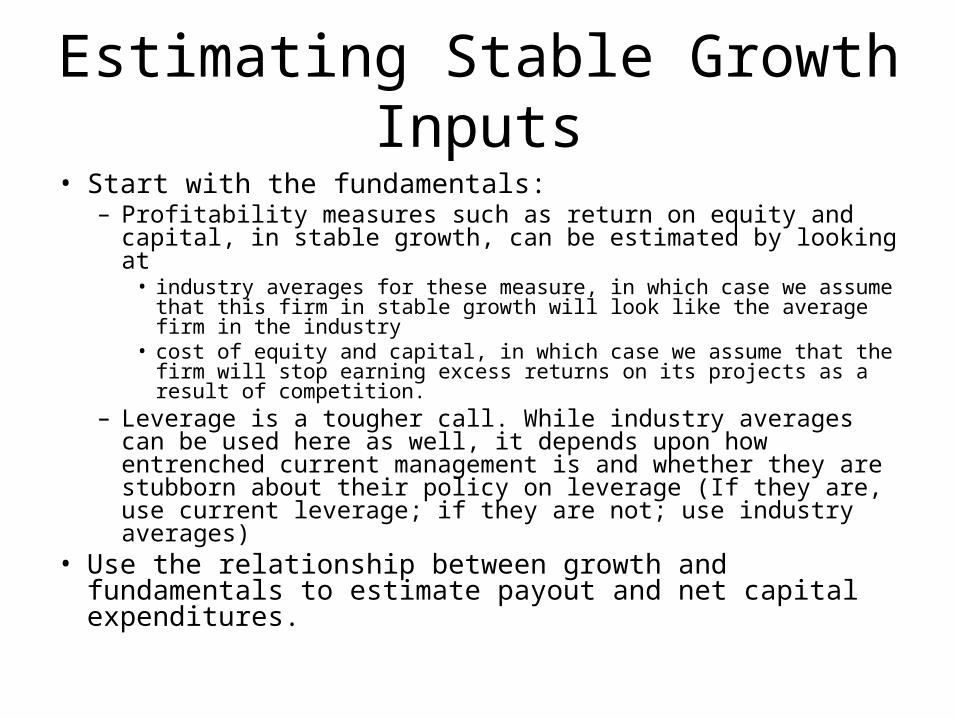
Estimating Stable Growth Inputs• Start with the fundamentals:
– Profitability measures such as return on equity and capital, in stable growth, can be estimated by looking at• industry averages for these measure, in which case we assume that
this firm in stable growth will look like the average firm in the industry• cost of equity and capital, in which case we assume that the firm will
stop earning excess returns on its projects as a result of competition.– Leverage is a tougher call. While industry averages can be used
here as well, it depends upon how entrenched current management is and whether they are stubborn about their policy on leverage (If they are, use current leverage; if they are not; use industry averages)
• Use the relationship between growth and fundamentals to estimate payout and net capital expenditures.
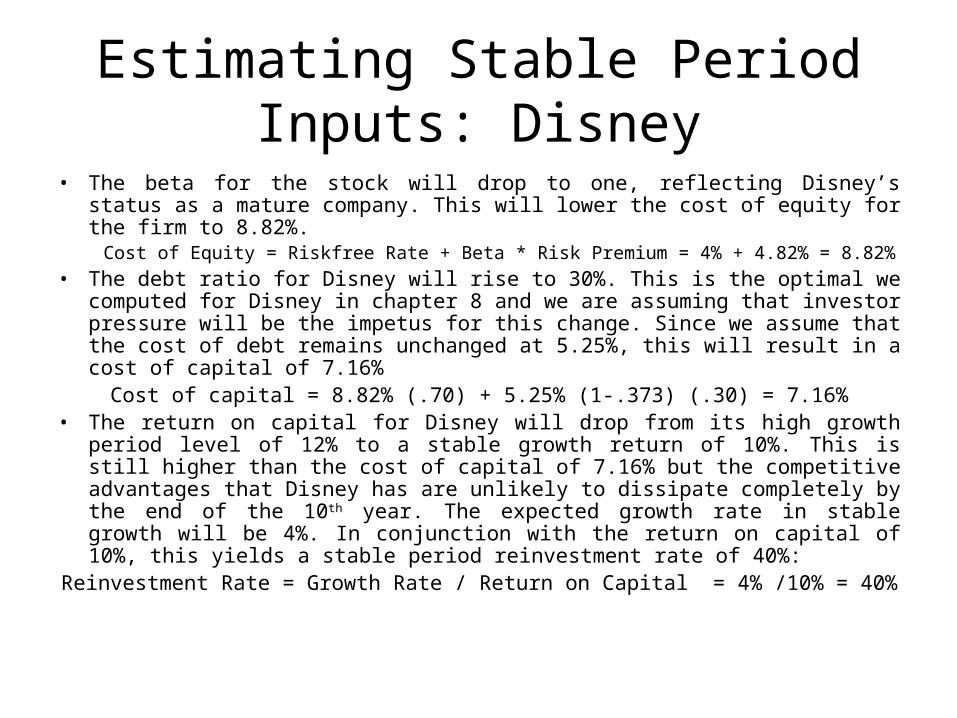
Estimating Stable Period Inputs: Disney
• The beta for the stock will drop to one, reflecting Disney’s status as a mature company. This will lower the cost of equity for the firm to 8.82%.
Cost of Equity = Riskfree Rate + Beta * Risk Premium = 4% + 4.82% = 8.82%• The debt ratio for Disney will rise to 30%. This is the optimal we computed for
Disney in chapter 8 and we are assuming that investor pressure will be the impetus for this change. Since we assume that the cost of debt remains unchanged at 5.25%, this will result in a cost of capital of 7.16%
Cost of capital = 8.82% (.70) + 5.25% (1-.373) (.30) = 7.16%• The return on capital for Disney will drop from its high growth period level of 12%
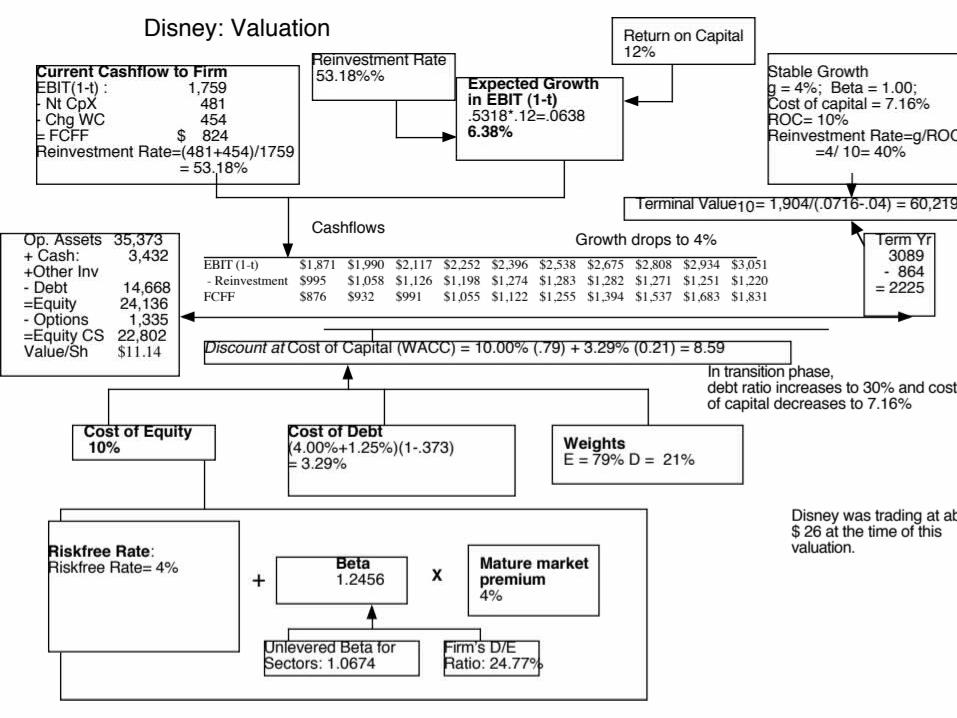
to a stable growth return of 10%. This is still higher than the cost of capital of 7.16% but the competitive advantages that Disney has are unlikely to dissipate completely by the end of the 10th year. The expected growth rate in stable growth will be 4%. In conjunction with the return on capital of 10%, this yields a stable period reinvestment rate of 40%:
Reinvestment Rate = Growth Rate / Return on Capital = 4% /10% = 40%
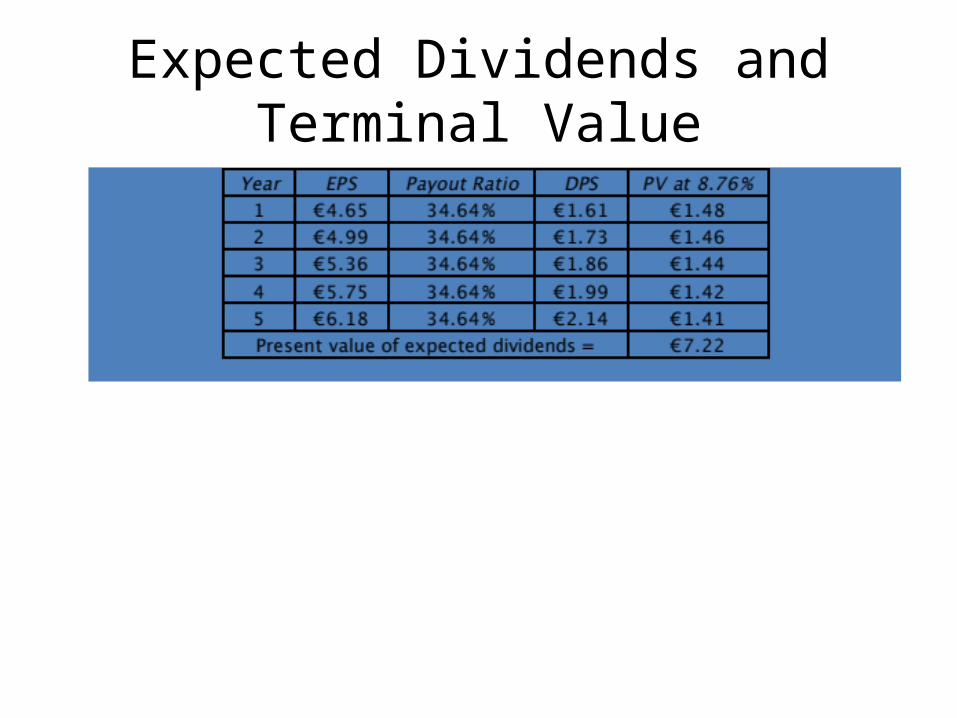
Expected Dividends and Terminal Value
What does the valuation tell us?• Stock is overvalued: This valuation would suggest
that Deutsche Bank is significantly overvalued, given our estimates of expected growth and risk.
• Dividends may not reflect the cash flows generated by Deutsche Bank. The FCFE could have been significantly higher than the dividends paid.
• Estimates of growth and risk are wrong: It is also possible that we have underestimated growth or overestimated risk in the model, thus reducing our estimate of value.
Disney Valuation
• Model Used:– Cash Flow: FCFF (since I think leverage will change
over time)– Growth Pattern: 3-stage Model (even though
growth in operating income is only 10%, there are substantial barriers to entry)
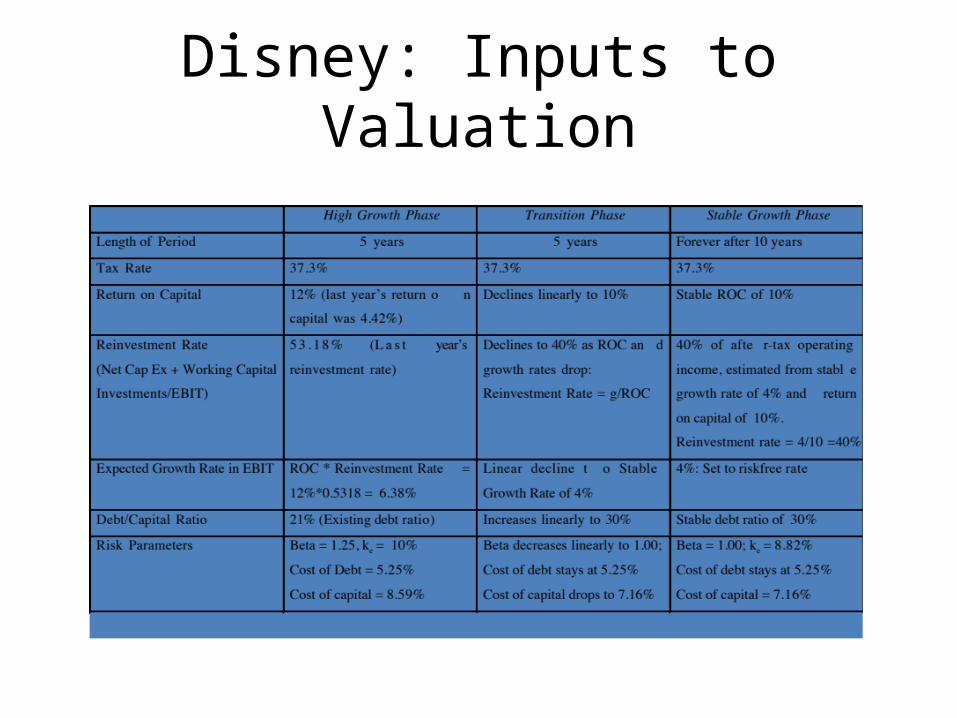
Disney: Inputs to Valuation
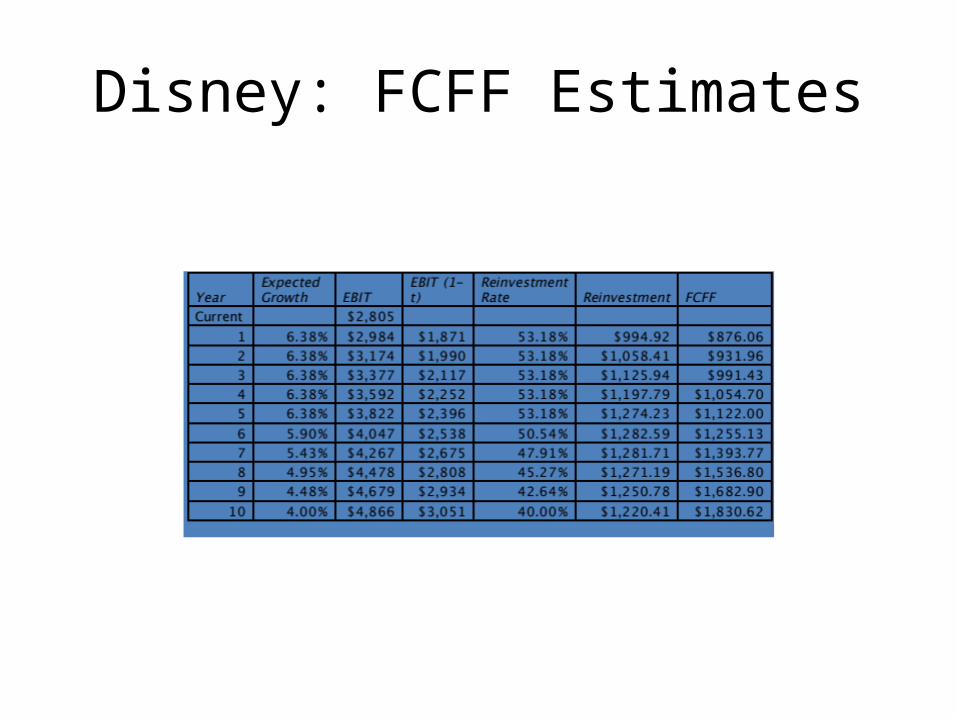
Disney: FCFF Estimates
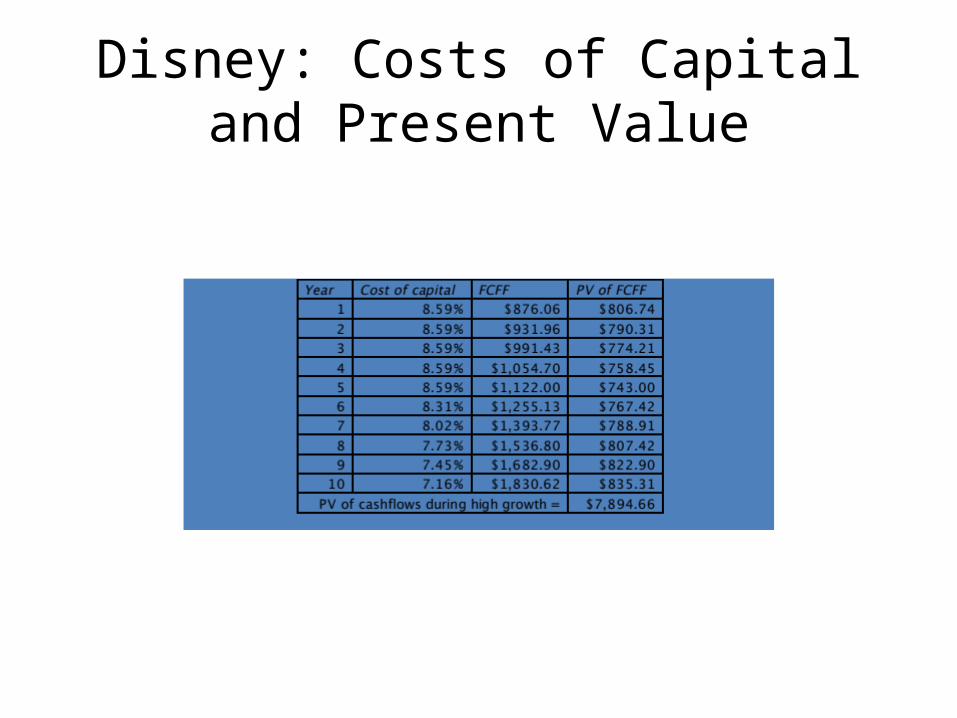
Disney: Costs of Capital and Present Value

Disney: Terminal Value and Firm Value
• Terminal Value– FCFF11 = EBIT11 (1-t) (1- Reinvestment RateStable Growth)/
= 4866 (1.04) (1-.40) = $1,903.84 million– Terminal Value = FCFF11/ (Cost of capitalStable Growth – g)
= 1903.84/ (.0716 - .04) = $60,219.11 million• Value of firm
PV of cashflows during the high growth phase =$ 7,894.66 PV of terminal value =$ 27,477.81+ Cash and Marketable Securities =$ 1,583.00+ Non-operating Assets (Holdings in other companies) =$
1,849.00Value of the firm =$ 38,804.48
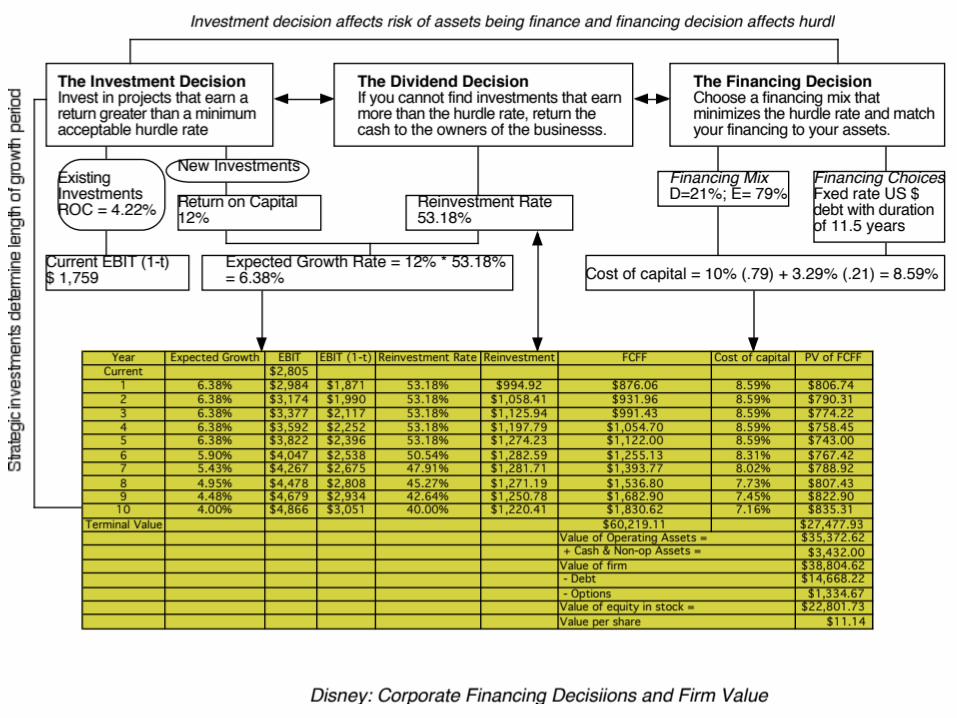

First Principles• Invest in projects that yield a return greater than the
minimum acceptable hurdle rate.– The hurdle rate should be higher for riskier projects and reflect
the financing mix used - owners’ funds (equity) or borrowed money (debt)
– Returns on projects should be measured based on cash flows generated and the timing of these cash flows; they should also consider both positive and negative side effects of these projects.
• Choose a financing mix that minimizes the hurdle rate and matches the assets being financed.
• If there are not enough investments that earn the hurdle rate, return the cash to stockholders.– The form of returns - dividends and stock buybacks - will
depend upon the stockholders’ characteristics.Objective: Maximize the Value of the Firm

Assignment week 4-8: Valuation• Follow the process of estimating Free Cash Flow for your
company• Determine the WACC% now and in the future• Estimate future growth (show your
calculations/assumptions)• Process the numbers and determine Firm Value based on
your assumptions• Calculate the Equity Value/share outstanding and conclude
if your company’s share is over/under priced in the stock market…
• Show all your calculations, workings and assumptions!• If you use any sources show the references!


