Chapter 11 Firms in Perfectly Competitive Markets Chapter Summary Economists group industries into one of four market structures: Perfect competition, monopolistic competition, oligopoly, and monopoly. In Chapter 11, you will learn about the first market structure – perfect competition. In a perfectly competitive market, there are many buyers and many firms, all of whom are small relative to the size of the total market. Products sold by these firms are identical and there are no barriers to new firms entering the market. Firms in a perfectly competitive market are price takers, meaning that they are unable to control the prices of goods they sell and are unable to earn economic profits in the long run. Consumers are also price takers in a perfectly competitive market. Prices in perfectly competitive markets are determined by the interaction of market demand and market supply. The objective of the firm is to maximize profit. Profit is the difference between total revenue and total cost. The firm will produce the output for which the marginal revenue (MR) equals the marginal cost (MC). For perfectly competitive firms, price is equal to marginal revenue. In the short run, the firm’s price: a. will exceed its average total cost (ATC) which means it will make an economic profit, or b. will equal ATC so its total cost will equal total revenue, which means the firm breaks even and earns no economic profit, or c. will be less than ATC, which means the firm experiences an economic loss. Remember that economic costs include all opportunity costs as well as explicit accounting costs. A firm experiencing losses can continue to produce, stop production by shutting down temporarily, or go out of business. The first two are short-run options, while the third is a long-run option. In the short run, if by producing the firm would lose an amount greater than its fixed cost, the firm will shut down temporarily. If the firm’s losses are less than the amount of its fixed cost, it will continue to produce. The firm will produce output even though total profits remain negative if total revenue is greater than total variable cost. This is identical to saying that the price of its output (P) must exceed average variable cost (AVC). The quantity where P = AVC is called the shutdown point. When firms earn short-run profits, other firms will enter the industry. Entry of new firms shifts the industry supply curve to the right and lowers the market price. Entry continues until economic profits are zero. When firms suffer short-run losses, some firms will exit the industry. The exit of firms shifts the industry supply curve to the left and the market price increases. Exit continues until economic profits are zero. In a long-run competitive equilibrium, entry and exit of firms causes the typical firm to earn zero economic profits. The long-run supply curve in a perfectly competitive market shows the relationship between market price and quantity supplied. In the long run, firms will supply the quantity that consumers
Transcript
Chapter 11
Firms in Perfectly Competitive Markets Chapter Summary Economists group industries into one of four market structures: Perfect competition, monopolistic competition, oligopoly, and monopoly. In Chapter 11, you will learn about the first market structure – perfect competition. In a perfectly competitive market, there are many buyers and many firms, all of whom are small relative to the size of the total market. Products sold by these firms are identical and there are no barriers to new firms entering the market. Firms in a perfectly competitive market are price takers, meaning that they are unable to control the prices of goods they sell and are unable to earn economic profits in the long run. Consumers are also price takers in a perfectly competitive market. Prices in perfectly competitive markets are determined by the interaction of market demand and market supply. The objective of the firm is to maximize profit. Profit is the difference between total revenue and total cost. The firm will produce the output for which the marginal revenue (MR) equals the marginal cost (MC). For perfectly competitive firms, price is equal to marginal revenue. In the short run, the firm’s price: a. will exceed its average total cost (ATC) which means it will make an economic profit, or b. will equal ATC so its total cost will equal total revenue, which means the firm breaks even and earns
no economic profit, or c. will be less than ATC, which means the firm experiences an economic loss. Remember that economic costs include all opportunity costs as well as explicit accounting costs. A firm experiencing losses can continue to produce, stop production by shutting down temporarily, or go out of business. The first two are short-run options, while the third is a long-run option. In the short run, if by producing the firm would lose an amount greater than its fixed cost, the firm will shut down temporarily. If the firm’s losses are less than the amount of its fixed cost, it will continue to produce. The firm will produce output even though total profits remain negative if total revenue is greater than total variable cost. This is identical to saying that the price of its output (P) must exceed average variable cost (AVC). The quantity where P = AVC is called the shutdown point. When firms earn short-run profits, other firms will enter the industry. Entry of new firms shifts the industry supply curve to the right and lowers the market price. Entry continues until economic profits are zero. When firms suffer short-run losses, some firms will exit the industry. The exit of firms shifts the industry supply curve to the left and the market price increases. Exit continues until economic profits are zero. In a long-run competitive equilibrium, entry and exit of firms causes the typical firm to earn zero economic profits. The long-run supply curve in a perfectly competitive market shows the relationship between market price and quantity supplied. In the long run, firms will supply the quantity that consumers
CHAPTER 11 | Firms in Perfectly Competitive Markets 296
demand at a price equal to the minimum average total cost. A perfectly competitive market achieves productive efficiency and allocative efficiency in the long run. Learning Objectives When you finish this chapter, you should be able to: 1. Define a perfectly competitive market and explain why a perfect competitor faces a horizontal
demand curve. A perfectly competitive market has many buyers and sellers, all firms sell identical products, and there are no barriers to new firms entering the market. A perfectly competitive firm faces a horizontal demand curve because if the firm tried to raise its price, consumers would buy from the firm’s competitors. Because the firm can sell all the output it wants at the current market price, there would be no point trying to charge a lower price. If a firm increases the output it sells, the price will not decrease because each firm is too small to shift the market supply curve enough to lower equilibrium price.
2. Explain how a firm maximizes profits in a perfectly competitive market. To make profit as large
as possible, a firm will produce that quantity of output for which marginal revenue equals marginal cost. Since marginal revenue equals price for a perfectly competitive firm, price will also equal marginal cost at the profit-maximizing quantity of output.
3. Use graphs to show a firm’s profit or loss. The firm’s profit-maximizing rate of output is
determined by the intersection of the demand curve with the marginal cost curve. The position of the average total cost (ATC) curve in this graph will indicate whether the firm earns a profit (price exceeds ATC) or suffers a loss (price is less than ATC).
4. Explain why firms may shut down temporarily. A firm experiencing losses in the short run will
shut down if the revenue from producing is insufficient to cover its total variable costs. By shutting down, the firm will avoid variable costs and minimize its losses. When the firm shuts down, it must still pay the fixed costs of production.
5. Explain how entry and exit ensure that perfectly competitive firms earn zero economic profit in
the long run. If firms earn short run economic profits, other firms will enter the market. The entry of firms will shift the market supply curve to the right and lower price until the short run profits are eliminated. If firms suffer short run losses, some firms will leave the market. The exit of firms will shift the market supply curve to the left and raise price until the short run losses are eliminated.
6. Explain how perfect competition leads to economic efficiency. In the long run, competitive forces
will drive the market price to the minimum average total cost of the typical firm. This means that perfect competition results in productive efficiency. Firms also produce at the point where the marginal cost of producing another unit equals the marginal benefit consumers receive from consuming that unit. This means that perfect competition achieves allocative efficiency.
CHAPTER 11 | Firms in Perfectly Competitive Markets 297
Chapter Review Chapter Opener: Perfect Competition in the Market for Organic Apples (pages 376-377) The market for organic apples grew rapidly in the late 1990s. In response to rising demand and high profits, many apple growers switched to organic methods. The entry of new firms rapidly increased supply, which decreased the price and profit associated with the production of organic apples. Today, the industry has the characteristics of a perfectly competitive market. Each apple producer has only a small share of the overall market; therefore each firm is a price taker.
Helpful Study Hint An Inside Look at the end of this chapter features a newspaper article about organic foods and includes graphs that describe the effect of the entry of firms on profits in a competitive market. The increase in the popularity of organic foods will increase the price of organic foods and the profits associated with producing these foods. This will provide an incentive for firms to enter, supply will shift to the right, and prices will fall until economic profit becomes zero. The market for organic apples is used to describe the impact of the entry and exit of firms in Figures 11-8 and 11-9 on pages 394 and 396 of the textbook. Making the Connection “The Decline of Apple Production in New York State” addresses the decline of apple production in the state of New York. In New York, the demand for land has risen, increasing the profitability of using land for nonagricultural purposes. This means that the opportunity cost of using the land for growing apples increases, so land is being converted from apple production to a more profitable use, such as housing. Economics in YOUR Life! asks you to consider your entrepreneurial ventures. Maybe you babysat, mowed lawns, or shoveled snow. How did you select a price to charge? Keep this question in mind as you read the chapter. The authors will answer this question at the end of the chapter.
11.1 LEARNING OBJECTIVE
11.1 Perfectly Competitive Markets (pages 379-381) Learning Objective 1 Define a perfectly competitive market and explain why a perfect competitor faces a horizontal demand curve. A perfectly competitive market is a market that meets the conditions of (1) many buyers and sellers, (2) all firms selling identical products, and (3) no barriers to new firms entering the market. Prices in perfectly competitive markets are determined by the intersection of market demand and supply. Consumers and firms must accept the market price if they want to buy and sell in a competitive market. A price taker is a buyer or seller that is unable to affect the market price. A firm in a perfectly competitive market is a price taker because it is very small relative to the market and sells exactly the
CHAPTER 11 | Firms in Perfectly Competitive Markets 298
same product as every other firm. Consumers are also price takers. Although the market demand curve has the normal downward shape, the demand curve for a perfectly competitive firm is horizontal at the market price because the firm is unable to affect the market price.
Helpful Study Hint Spend some time reviewing Table 11-1 on page 378 because it provides an overview of the four market structures. This chapter focuses on perfect competition. You will see the other three market structures in the upcoming chapters. Don’t Let This Happen to YOU! “Don’t Confuse the Demand Curve for Farmer Parker’s Wheat with the Market Demand Curve for Wheat” reinforces the idea that the individual firm is a price taker, so he faces a flat (perfectly elastic) demand curve not the market demand curve. The perfectly competitive firm’s demand curve represents what happens to quantity demanded for the smallest increase in price— quantity demanded drops to zero even if the price is increased by only a penny! Since the firm can sell all it is able to at the market price, the question “what happens to quantity if price is decreased?” is irrelevant. The firm would not choose to lower price. Consider a farmer offering to sell wheat at $2.95 per bushel if he can sell all he produced for a price of $3.00.
Extra Solved Problem 11-1 Chapter 11 in the textbook includes two Solved Problems. Here is an extra Solved Problem to help you build your skills solving economic problems. Supports Learning Objective 1: Define a perfectly competitive market and explain why a perfect competitor faces a horizontal demand curve. Analyze the following statement: “When an individual firm in a perfectly competitive industry increases its production, the price of the good will likely fall.” Step 1: Review the chapter material. This problem is about the definition of a perfectly competitive market and the effect of
market structure on the firm’s ability to control price, so you may want to review the section “Perfectly Competitive Markets,” which begins on page 379 of the textbook.
Step 2: Determine whether the statement is true or false and explain your answer. The statement is false. Firms in a perfectly competitive industry do not have the ability to
affect the price. If a single firm or several firms increase the number of units they produce, this increased production has no effect on the market price because the production of these firms is only a tiny fraction of total production in the market. Firms in a perfectly competitive industry are price takers who are unable to affect the market price no matter how much or how little they produce.
CHAPTER 11 | Firms in Perfectly Competitive Markets 299
11.2 LEARNING OBJECTIVE 11.2 How a Firm Maximizes Profit in a Perfectly Competitive Market (pages 381-384) Learning Objective 2 Explain how a firm maximizes profits in a perfectly competitive market. Economists assume that the objective of a firm is to maximize profits. Profit is the difference between total revenue (TR) and total cost (TC):
Profit = TR – TC Therefore, a firm will produce that quantity of output where the difference between TR and TC is as large as possible. A firm’s average revenue (AR) equals total revenue divided by the number of units sold. Average revenue is the same as market price. For a firm in a perfectly competitive market, price is also equal to marginal revenue. Marginal revenue (MR) is the change in total revenue caused by producing and selling one more unit:
Marginal revenue = MR = TRQ
∆∆
The marginal revenue curve for a perfectly competitive firm is the same as its demand curve. The marginal cost (MC) of production for a perfectly competitive firm first falls, then rises. So long as MR exceeds MC the firm’s profits are increasing and production will increase. The firm’s profits will decrease if production is increased beyond the output for which MC exceeds MR. The profit maximizing level of output is where MR = MC. Since P = MR for these firms, profit will be maximized when P = MC.
Helpful Study Hint Students often ask “Why would the firm produce a unit of output for which MR = MC, since it would not earn any profit from this last unit?” Included in the cost of production is a normal return so that the revenue earned from the profit maximizing unit of output is just enough to compensate the firm’s owner(s) for the effort made to produce it.
Extra Solved Problem 11-2 Chapter 11 in the textbook includes two Solved Problems. Here is an extra Solved Problem to help you build your skills solving economic problems. Supports Learning Objective 2: Explain how a perfect competitor decides how much to produce. Cost and Revenue for “Apples R’ Us” Sally Borts owns “Apples R’ Us,” an orchard located in Washington State. Sally is one of about 7,500 apple producers in the United States who produced over 9 billions pounds of apples in 2004. Although the price of apples reached nearly $0.30 per pound in 2003, it fell to less than $0.20 in 2005. Sally believes
CHAPTER 11 | Firms in Perfectly Competitive Markets 300
she would be able to sell her apples for $0.20 in 2006, or $200 per thousand lbs. She estimated her revenue and costs of production for various quantities of apples based on the number of pounds her orchard would yield per acre.
Sources: http://www.usapple.org/media/industry/index.shtml. Agricultural Prices, U.S. Department of Agriculture, National Agricultural Statistics Service. a. Determine whether “Apples R’ Us” is a perfectly competitive firm. b. Explain how Sally will decide how much to produce. SOLVING THE PROBLEM Step 1: Review the chapter material. This problem is about how a firm maximizes profits, so you may want to review the section
“How a Firm Maximizes Profit in a Perfectly Competitive Market,” which begins on page 381 of the textbook.
Step 2: Determine if “Apples R’ Us” is a perfectly competitive firm. Sally is one of thousands of apple producers and her output is a small fraction of the total
number of apples produced. Within each variety of apples (Red Delicious, McIntosh, Granny Smith, etc.) apple growers sell an identical product and new firms are free to enter the market. Therefore, “Apples R’ Us” is a perfectly competitive firm. Also, marginal revenue is constant, which means that price must also be constant, and the demand curve must be horizontal. Price and marginal revenue are constant and the demand curve is horizontal only in a perfectly competitive market.
Step 3: Explain how Sally will decide how much to produce. Sally should increase her production of apples so long as the marginal revenue exceeds
her marginal cost of production. Sally’s marginal revenue equals the $200 price of a thousand pounds of apples. Therefore, if the estimates for 2006 are accurate, Sally should produce 6 thousand pounds of apples because her marginal cost for this quantity of output also equals $200.
CHAPTER 11 | Firms in Perfectly Competitive Markets 301
11.3 LEARNING OBJECTIVE 11.3 Illustrating Profit or Loss on the Cost Curve Graph (pages 385-390) Learning Objective 3 Use graphs to show a firm’s profit or loss. Profit equals total revenue (TR) minus total cost (TC). Since TR equals price multiplied by quantity sold, this can be written as:
Profit = (P x Q) – TC Dividing both sides by Q:
Profit ( )P x Q TCQ Q Q
= −
This equation means that profit per unit (or average profit) equals price minus average total cost. Multiplying both sides of the equation by Q yields an equation that tells us a firm’s total profit is equal to the quantity produced multiplied by the difference between price and average total cost. (P – ATC is called the profit margin per unit.)
Profit = (P – ATC) x Q Figure 11-4 on page 385 of the textbook illustrates the situation where the firm is making a profit. Figure 11-5 on page 387 illustrates the situations where the firm is either breaking even or suffering a loss. The firm will make a profit if P > ATC. The firm will break even if P = ATC. The firm will experience losses if P < ATC.
Helpful Study Hint Solved Problem 11-3 provides an example of an individual firm in a perfectly competitive market. Study this Solved Problem carefully and be sure you understand the graphs that show a firm’s profit or loss. If properly drawn, graphs can help you to answer questions that would be more difficult to answer using only words or numbers. Here are tips to learning from these graphs: (1) When a firm’s demand curve intersects the ATC curve, price will exceed ATC for some level of output. That means the firm earns a profit. (2) To show a firm suffering losses, the ATC curve is drawn everywhere above the demand curve, which would mean that the price is less than the average total cost. (3) Always draw the demand curve and the MC curve first to determine the profit-maximizing output. This will make it easier to identify ATC and AVC at this same output. Review the section Don’t Let This Happen to YOU! “Remember That Firms Maximize Total Profit, Not Profit per Unit.” Remember that P – ATC is the profit per unit and at Q1 the profit per unit
CHAPTER 11 | Firms in Perfectly Competitive Markets 302
would be maximized; that is, the distance between price and the average total cost curve would be greatest. But this is not the profit-maximizing level of output. At this quantity the marginal revenue is greater than the price, so if the firm adds additional units to output it will add more to revenue than it adds to cost. In other words, increasing production will increase profit. The firm should stop producing at the quantity where MC = MR in order to maximize profit. Making the Connection “Losing Money in the Medical Screening Industry” provides an example of firms experiencing losses. The demand for preventative CT scans was so low that the price that consumers were willing to pay was lower than the firm’s average total cost and firms experienced losses. This caused many firms to exit the market for preventative CT scans to avoid the losses.
11.4 LEARNING OBJECTIVE
11.4 Deciding Whether to Produce or to Shut Down in the Short Run (pages 390-393) Learning Objective 4 Explain why firms may shut down temporarily. In the short run, a firm suffering losses has two options: produce or shutdown. The firm will produce the profit-maximizing output if its total revenue is greater than its total variable cost. In this situation, even though the firm is suffering a loss, it is earning enough revenue to cover all of its variable costs and at least some of its fixed costs. The firm’s second option is to stop production by shutting down temporarily (producing zero output). During a temporary shut down, a firm must still pay its fixed costs. If, by producing, the firm would lose an amount greater than its fixed costs (that is, the firm will not be able to cover all of its variable costs), it will shut down. A sunk cost is a cost that has already been paid and cannot be recovered. The firm should treat its sunk costs as irrelevant to its decision making. The firm’s marginal cost curve is its supply curve only for prices at or above average variable cost. The shutdown point is the minimum point on a firm’s average variable cost curve. If the price falls below this point, the firm shuts down production in the short run. The market supply curve can be derived by adding up the quantity that each firm in the market is willing to supply at each price.
Helpful Study Hint The decision to shut down is not the same as deciding to leave the market or go out of business. Many firms sell goods or services only in certain seasons. Examples include ski resorts, retail stores near summer resorts, and Christmas tree vendors. These firms shut down temporarily during the off season. Going out of business permanently, however, is a long-run decision. See Making the Connection “When to Close a Laundry” for an example of a firm that is not making a profit. The laundry had $3,300 per month in fixed costs and was losing $4,000 per month while operating. If the laundry closed down it would only lose $3,300 per month instead of $4,000, so the firm should shut down. The owner of the
CHAPTER 11 | Firms in Perfectly Competitive Markets 303
laundry brought in a new manager who reorganized the business so that it was now only losing $2,000 per month. Under this reorganization, the firm should stay in business because it is only losing $2,000 per month while operating compared to the $3,300 per month that would be lost if it shut down.
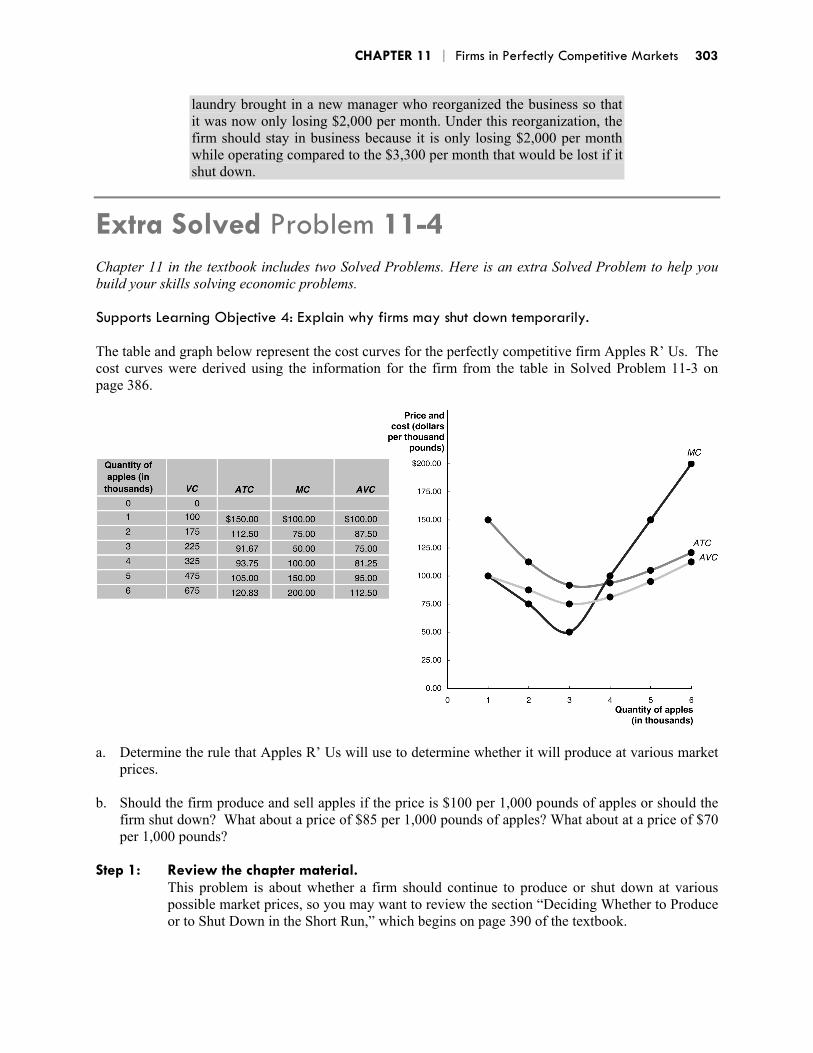
Extra Solved Problem 11-4 Chapter 11 in the textbook includes two Solved Problems. Here is an extra Solved Problem to help you build your skills solving economic problems. Supports Learning Objective 4: Explain why firms may shut down temporarily. The table and graph below represent the cost curves for the perfectly competitive firm Apples R’ Us. The cost curves were derived using the information for the firm from the table in Solved Problem 11-3 on page 386.
a. Determine the rule that Apples R’ Us will use to determine whether it will produce at various market
prices. b. Should the firm produce and sell apples if the price is $100 per 1,000 pounds of apples or should the
firm shut down? What about a price of $85 per 1,000 pounds of apples? What about at a price of $70 per 1,000 pounds?
Step 1: Review the chapter material. This problem is about whether a firm should continue to produce or shut down at various
possible market prices, so you may want to review the section “Deciding Whether to Produce or to Shut Down in the Short Run,” which begins on page 390 of the textbook.
CHAPTER 11 | Firms in Perfectly Competitive Markets 304
Step 2: Determine the rule that Apples R’ Us will use to determine whether they should produce at each price mentioned in the problem.
Apples R’ Us will compare the market price to the minimum value of average variable cost. If the price is greater than the minimum AVC, then the firm will produce. If the price is below the minimum AVC, then the firm will shut down in the short run. Apples R’ Us should continue to produce in the short run as long as the price is greater than $75, which is the minimum value for AVC. If the price falls below $75, the firm will shut down temporarily because its loss will be greater than its fixed cost.
Step 3: Compare each price to the rule from step 2 to determine whether the firm will
produce or shut down at each given price. Apples R’ Us will continue to produce in the short run when the price is $100 and $85 per
thousand pounds of apples. The firm will receive a positive profit for the $100 price because the price is greater than the ATC for the 4,000 pounds of apples that will be produced. When the price is $85 per thousand pounds, the firm is suffering a loss, but the firm will continue to produce because its revenue is high enough that all the variable costs are covered and there is some money left over to put towards the fixed costs that the firm must pay. When the price falls to $70 per thousand pounds, the firm will shut down because the price has fallen below the minimum of the AVC. In this case the firm cannot collect enough revenue to cover its variable costs, so there is no money left over to pay down on the fixed costs.
11.5 LEARNING OBJECTIVE
11.5 “If Everyone Can Do It, You Can’t Make Money at It”: The Entry and Exit of Firms in the Long Run (pages 393-398) Learning Objective 5 Explain how entry and exit ensure that perfectly competitive firms earn zero economic profit in the long run. In the long run, unless a firm can cover all of its costs it will shut down and exit the industry. Economic profit is a firm’s revenues minus all its costs, implicit and explicit. An economic loss means a firm’s total revenue is less than its total cost, including all implicit costs. If firms in a perfectly competitive market are earning economic profits in the short run, new firms will have an incentive to enter the market so they, too, can earn an economic profit. The entry of new firms shifts the industry supply curve to the right. As a result, the market price will fall. The entry of firms will continue until price is equal to average total cost. If firms in a perfectly competitive market are suffering losses in the short run, some of these firms will exit the industry because they will not be able to cover all of their costs. The exit of firms shifts the industry supply curve to the left. As a result, the market price will rise. The exit of firms will continue until price is equal to average total cost. Long-run competitive equilibrium is the situation in which the entry and exit of firms have resulted in the typical firm just earning zero economic profits. The long-run supply curve shows the relationship in the long run between market price and the quantity supplied in the long run. A constant cost industry is an industry in which the typical firm’s long-run average costs do not change as the industry expands. This means that the firm will have a horizontal long-run supply curve. An increasing cost industry is an industry in which the typical firm’s long-run average costs increase as the industry expands. This means the firm will have an upward-sloping long-run supply curve. A decreasing cost industry is an industry in
CHAPTER 11 | Firms in Perfectly Competitive Markets 305
which the typical firm’s long-run average costs decrease as the industry expands. This means that the firm will have a downward sloping long run supply curve.
Helpful Study Hint Which firms are most likely to leave an industry that is experiencing economic losses? Even though we assume all firms are identical, that is not true in the real world. Some firms have more financial resources and are better able to withstand short periods of negative profits. Financially weaker firms are more likely to exit. For example, a corporate-owned Starbucks is more likely to sustain economic losses due to slow sales and remain in the industry than is a local coffee shop.
Extra Solved Problem 11-5 Chapter 11 in the textbook includes two Solved Problems. Here is an extra Solved Problem to help you build your skills solving economic problems. Supports Learning Objective 5: Explain how entry and exit ensure that perfectly competitive firms earn zero economic profit in the long run. Consider the perfectly competitive market in which Apples R’ Us competes. There are many buyers and sellers in the market for apples, so many that all consumers and firms in the market are price takers. Suppose that the price is $85 per thousand pounds of apples and that all firms face the same cost curves as Apples R’ Us. a. What will happen to the supply in this industry in the long run? What is the effect of this change in
supply on price? b. What will happen to the long run profit of firms that remain in the market for apples? Step 1: Review the chapter material. This problem is about long-run losses, so you may want to review the section “‘If Everyone
Can Do It, You Can’t Make Money at It’: The Entry and Exit of Firms in the Long Run,” which begins on page 393 of the textbook.
Step 2: Determine what the short run profit looks like for a typical firm in the industry and
discuss the incentive effect that this profit has on the firm. If each firm has the same costs as Apples R’ Us, the price of $85 will be below minimum
average total cost, and each firm in the industry will be suffering a loss. These losses give firms an incentive to exit the industry because the owners of the firms could receive a greater return on their investment somewhere else.
Step 3: Determine how this incentive will alter the market supply curve and the
equilibrium price. Because profits are negative, some firms will exit the apple market, which will cause the
market supply curve to shift to the left. A decrease in supply means that the market price for apples will rise.
CHAPTER 11 | Firms in Perfectly Competitive Markets 306
Step 4: Consider the effect of exit on the profit of the remaining firms. As firms exit the industry, the price will continue to rise up to the point where it equals
minimum average total cost and all firms in the industry will be achieving zero economic profit. The firms who remain are making the same return producing apples as could be achieved in their next best alternative, so there is no additional incentive for firms to exit the market.
11.6 LEARNING OBJECTIVE
11.6 Perfect Competition and Efficiency (pages 398-401) Learning Objective 6 Explain how perfect competition leads to economic efficiency. Productive efficiency is the situation in which a good or service is produced at the lowest possible cost. Perfect competition results in productive efficiency because the forces of competition drive the market price to the minimum average cost of the typical firm. Managers of firms strive to earn economic profits by reducing costs. But in a perfectly competitive market, other firms can quickly copy ways of reducing costs, so that in the long run consumers, not producers, benefit from cost reductions. Allocative efficiency is a state of the economy in which production represents consumer preferences. In particular, every good or service is produced up to the point where the last unit produced provides a marginal benefit to consumers equal to the marginal cost of producing it. Entrepreneurs in a perfectly competitive market efficiently allocate resources to best satisfy consumer wants.
Helpful Study Hint Critics of the perfectly competitive model complain that few industries feature sellers of identical products who are all price takers. These critics fail to understand either what an economic model is or how economists use these models. Although not many markets are perfectly competitive, many markets are very competitive and experience entry and exit in response to short-run profits and losses. The markets for televisions, calculators, personal computers, and even automobiles have changed over time as firms earned short-run profits or new technologies forced firms to adapt. The steel and coal industries experienced exit by firms in response to short-run losses, just as the model of perfect competition predicts. The model also provides policymakers and analysts with a valuable standard against which to judge the efficiency of real markets. When the price of a product is greater or less than marginal cost, one can argue that too little or too much of the product has been produced, a deviation from allocative efficiency.
Solved Problem 11-6 describes the benefits of competition in the market for such products as plasma televisions and DVD players. When new technology is developed, firms that enter a market early can earn positive economic profits. These profits will provide an incentive for other firms to enter, causing the market supply curve to shift to the right. This shift will decrease the price of the good and reduce the profit that the firms in the market can achieve. Firms will enter the market until the price equals the minimum average total cost for the typical firms. The result is productive efficiency. Competition ensures that the benefits from the production of any good are quickly passed onto the consumers.
CHAPTER 11 | Firms in Perfectly Competitive Markets 307
Helpful Study Hint The competition that teenagers face in markets such as babysitting and lawn mowing is the subject of the Economics in YOUR Life! in this chapter. Teenagers are unable to affect the low market price for services such as babysitting and lawn mowing because they supply these services in very competitive markets.
Key Terms Allocative efficiency. A state of the economy in which production represents consumer preferences; in particular, every good or service is produced up to the point where the last unit provides a marginal benefit to consumers equal to the marginal cost of producing it. Average revenue (AR). Total revenue divided by the quantity of the product sold. Economic loss. The situation in which a firm’s total revenue is less than its total cost, including all implicit costs. Economic profit. A firm’s revenues minus all its costs, implicit and explicit. Long-run competitive equilibrium. The situation in which the entry and exit of firms has resulted in the typical firm breaking even. Long-run supply curve. A curve that shows the relationship in the long run between market price and the quantity supplied. Marginal revenue (MR). Change in total revenue from selling one more unit of a product. Perfectly competitive market. A market that meets the conditions of (1) many buyers and sellers, (2) all firms selling identical products, and (3) no barriers to new firms entering the market. Price taker. A buyer or seller that is unable to affect the market price. Productive efficiency. The situation in which a good or service is produced at the lowest possible cost. Profit. Total revenue minus total cost. Shutdown point. The minimum point on a firm’s average variable cost curve; if the price falls below this point, the firm shuts down production in the short run. Sunk cost. A cost that has already been paid and that cannot be recovered.
CHAPTER 11 | Firms in Perfectly Competitive Markets 308
Self-Test (Answers are provided at the end of the Self-Test.) Multiple-Choice Questions 1. Which of the following are characteristics of a perfectly competitive industry?
a. Firms are unable to control the prices of the products they sell. b. Firms are unable to earn an economic profit in the long run. c. Firms sell identical products. d. All of the above
2. Which of the following conditions must exist in order to have a perfectly competitive market?
a. There must be many buyers and many firms, all of whom are small relative to the market. b. The products sold by firms in the market must be different from each other. c. There must be some barriers to entry in order to protect perfect competition. d. All of the above
3. A buyer or seller that is unable to affect the market price is called?
a. A price maker b. A price taker c. An independent producer d. A monopoly
4. Refer to the graph below. What is the graph trying to explain?
a. The decision of a producer to charge $4.00 for 3,000 bushels or for 7,500 bushels b. Uncertainty about producing 3,000 or 7,500 bushels given the market price of $4.00 c. How market demand and the firm’s demand curve are one and the same in a perfectly competitive
market d. The ability of the perfectly competitive firm to sell any amount of output as long as it accepts the
market price of $4.00
CHAPTER 11 | Firms in Perfectly Competitive Markets 309
5. If an individual firm in a perfectly competitive market increases its price, the firm will experience a. higher revenue. b. lower average total cost. c. increased sales. d. None of the above
6. To maximize profit, which of the following should a firm attempt to do? a. Maximize revenue b. Minimize cost c. Find the largest difference between total revenue and total cost d. All of the above simultaneously
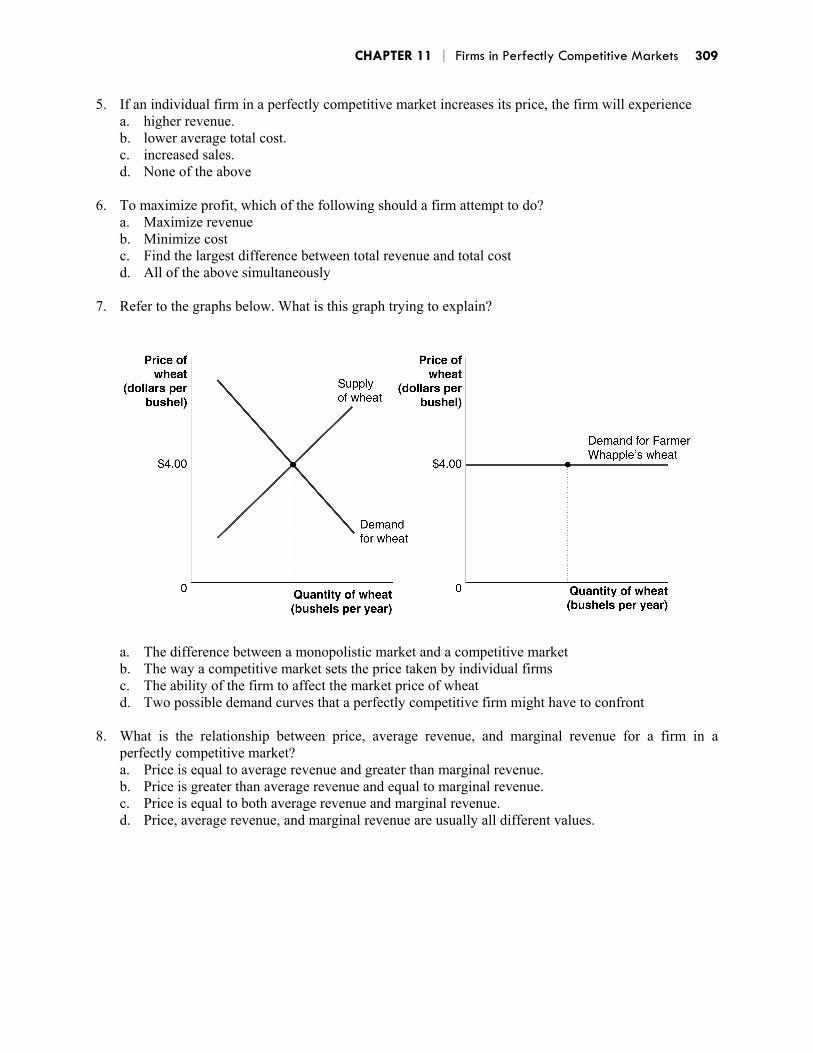
7. Refer to the graphs below. What is this graph trying to explain?
a. The difference between a monopolistic market and a competitive market b. The way a competitive market sets the price taken by individual firms c. The ability of the firm to affect the market price of wheat d. Two possible demand curves that a perfectly competitive firm might have to confront
8. What is the relationship between price, average revenue, and marginal revenue for a firm in a
perfectly competitive market? a. Price is equal to average revenue and greater than marginal revenue. b. Price is greater than average revenue and equal to marginal revenue. c. Price is equal to both average revenue and marginal revenue. d. Price, average revenue, and marginal revenue are usually all different values.
CHAPTER 11 | Firms in Perfectly Competitive Markets 310
9. Refer to the table below. Based on the numbers on the table, how much should this farmer produce in order to maximize profit?
a. An amount greater than 10 bushels b. Exactly 10 bushels, where total revenue is maximum c. 6 bushels d. There is insufficient information to answer the question.
10. Refer to the graph below. Based on the information on the graph, what can be said about marginal
revenue?
a. Marginal revenue increases as the quantity of bushels produced and sold increases. b. Marginal revenue decreases with additional bushels produced and sold. c. Marginal revenue remains constant as additional bushels are produced and sold. d. There is insufficient information to deduct the behavior of marginal revenue from this graph.
CHAPTER 11 | Firms in Perfectly Competitive Markets 311
11. Refer to the graph below. What is the profit-maximizing level of output (in whole units)?
a. 3 bushels, where marginal cost is minimized b. 10 bushels, where the distance between marginal cost and marginal revenue is the greatest c. 6 bushels, where the proximity between marginal revenue and marginal cost is the closest and
MR > MC d. 7 bushels, where marginal cost rises slightly above marginal revenue
12. Refer to the graph below. Which of the following best represents profit per unit?
a. The shaded rectangle b. The distance between points A and B c. Market price, or the demand (marginal revenue) curve d. None of the above
CHAPTER 11 | Firms in Perfectly Competitive Markets 312
13. Refer to the graph below. One of the curves in this graph is not necessary in order to determine the profit-maximizing level of output. Which curve can be discarded?
a. The marginal cost curve b. The demand curve c. The average total cost curve d. None of the above; all three curves are needed to determine which level of output maximizes
profit. 14. Refer to the graph below. One of the curves in this graph is not necessary in order to determine the
amount of profit obtained from producing any level of output. Which curve can be discarded?
a. The marginal cost curve b. The demand curve c. The average total cost curve d. None of the above; all three curves are needed to determine the amount of profit obtained from
producing and selling any amount of output.
CHAPTER 11 | Firms in Perfectly Competitive Markets 313
15. Refer to the graph below. At what level of output does the firm maximize profit?
a. At Q1, where output coincides with the minimum point on the MC curve b. At Q2, where output coincides with the minimum point on the ATC curve c. At Q3, where price is greater than ATC d. None of the above
16. Refer to the graph below. What happens at point A?
a. The firm earns zero accounting profit. b. The firm suffers a loss. c. The firm breaks even, which means that it earns some accounting profit. d. The firm may or may not earn profit.
CHAPTER 11 | Firms in Perfectly Competitive Markets 314
17. Refer to the graph below. What does the shaded area in the graph represent?
a. Positive economic profit b. Accounting profit c. Negative economic profit, or losses d. Neither profits nor losses
18. Refer to the graph below. Which level of the demand curve results in economic losses?
a. Demand when price is $495 b. Demand when price is $250 c. Any demand curve for prices above $495 d. Both levels of the demand curve shown on the graph result in losses for the firm.
19. What is the term given to a cost that has already been paid and cannot be recovered?
a. Unrecoverable cost b. Variable cost c. Sunk cost d. Implicit cost
CHAPTER 11 | Firms in Perfectly Competitive Markets 315
20. Refer to the graph below. Which demand curve is associated with the shutdown point?
a. Demand1 b. Demand2 c. Demand3 d. Demand4
21. Refer to the graph below. When the demand curve is Demand3, which of the following is true?
a. The firm can cover all of its fixed costs. b. The firm should shut down. c. The firm will suffer losses, but should continue to operate. d. The firm does not suffer a loss, but earns only a small economic profit.
CHAPTER 11 | Firms in Perfectly Competitive Markets 316
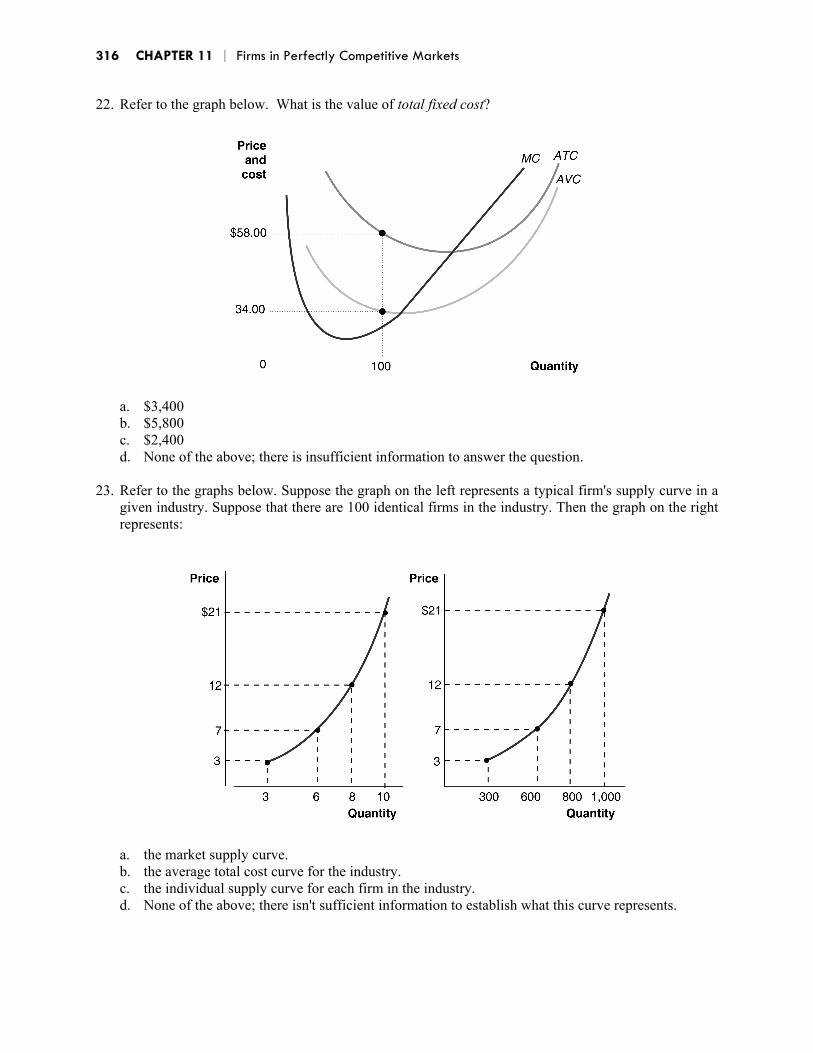
22. Refer to the graph below. What is the value of total fixed cost?
a. $3,400 b. $5,800 c. $2,400 d. None of the above; there is insufficient information to answer the question.
23. Refer to the graphs below. Suppose the graph on the left represents a typical firm's supply curve in a
given industry. Suppose that there are 100 identical firms in the industry. Then the graph on the right represents:
a. the market supply curve. b. the average total cost curve for the industry. c. the individual supply curve for each firm in the industry. d. None of the above; there isn't sufficient information to establish what this curve represents.
CHAPTER 11 | Firms in Perfectly Competitive Markets 317
24. Which term below best describes the minimum amount that a farmer needs to earn on her $100,000 investment in her farm to remain in a(perfectly competitive industry in the long run? a. Explicit cost b. Opportunity cost c. Economic profit d. Economic loss
25. Economic loss refers to a situation in which a firm’s total revenue is less than its total cost. To
calculate the amount of a loss, which of the following costs should be included? a. Explicit costs only b. Implicit cost only c. Both explicit costs and implicit cost d. Fixed costs only
26. Refer to the graphs below. The firms in this market are experiencing
a. a profit in the short run. b. a profit in the long run. c. a loss in the short run. d. a loss in the long run.
CHAPTER 11 | Firms in Perfectly Competitive Markets 318
27. Refer to the graphs below. What do you expect to happen in this market as it approaches long-run equilibrium?
a. A shift to the right of the market demand curve due to the entry of new firms. b. An upward shift of the firm’s demand curve due to the entry of new firms. c. A shift to the left of the market demand curve due to the entry of new firms. d. A shift to the right of the market supply curve due to the entry of new firms.
28. Refer to the graphs below. What do you expect to happen in this market as it approaches long-run
equilibrium?
CHAPTER 11 | Firms in Perfectly Competitive Markets 319
a. The price will increase and profits will become zero. b. The price will decrease until it is equal to the minimum of average total cost, and profits will increase. c. The price will decrease until it is equal to the minimum of average total cost, and profits will
become zero. d. Firms will exit because economic profit will become zero.
29. Refer to the graphs below. After the shift in the market demand curve, how will the firm react?
a. The firm will increase its output to increase its profits. b. The firm will have to decrease its output and suffer losses. c. The firm will maintain its output at the current level, but suffer losses. d. The firm will decrease its output and earn higher profit.
CHAPTER 11 | Firms in Perfectly Competitive Markets 320
30. Refer to the graphs below. When the market demand curve shifts to the right, how will the firm react?
a. The firm will increase its output, which will increase its profits. b. The firm will have to decrease its output and suffer losses. c. The firm will keep its output constant, but increase its profits. d. The firm will decrease its output, which will increase its profit.
31. What is long-run competitive equilibrium?
a. The situation in which the entry and exit of firms have resulted in the typical firm just breaking even.
b. A situation in which market price is at a level equal to the minimum point on the typical firm’s marginal cost curve.
c. The end of a process during which firms are prevented from adjusting their production methods. d. All of the above
CHAPTER 11 | Firms in Perfectly Competitive Markets 321
32. Refer to the graphs below. After the market demand curve shifts to the left, which of the following would happen next in this perfectly competitive market as it adjusts to long-run equilibrium?
a. The market demand curve will shift back to the right. b. The market supply curve will shift to the right. c. The market supply curve will shift to the left. d. The market demand curve will shift further to the left.
CHAPTER 11 | Firms in Perfectly Competitive Markets 322
33. Refer to the graphs below. After the market demand curve shifts to the right, which of the following would happen next as this perfectly competitive market adjusts to long-run equilibrium?
a. The market demand curve will shift back to the left. b. The market supply curve will shift to the right. c. The market supply curve will shift to the left. d. The market demand curve will shift further to the right.
34. Refer to the graph below. Initially, the market is in long-run equilibrium at point A. If this is a
constant-cost industry, after the increase in demand, through which point is the long-run supply curve most likely to cross?
a. Through none of the points shown b. Through point B c. Through point C d. Through point D
CHAPTER 11 | Firms in Perfectly Competitive Markets 323
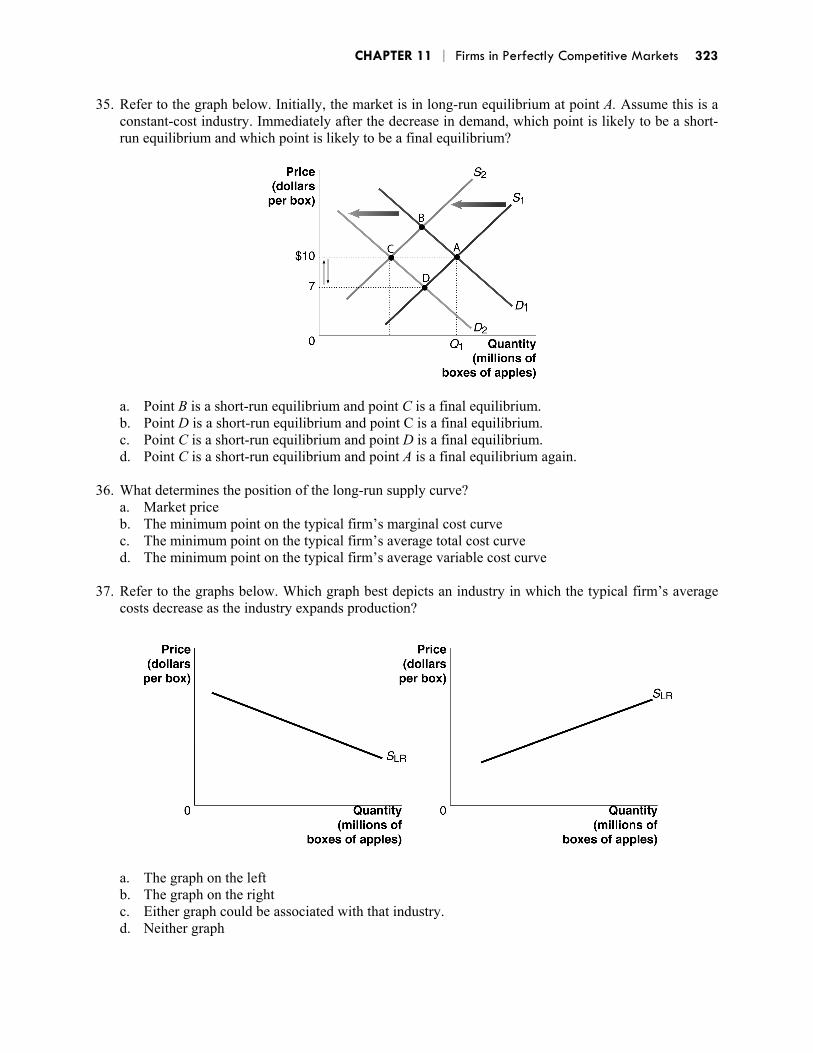
35. Refer to the graph below. Initially, the market is in long-run equilibrium at point A. Assume this is a constant-cost industry. Immediately after the decrease in demand, which point is likely to be a short-run equilibrium and which point is likely to be a final equilibrium?
a. Point B is a short-run equilibrium and point C is a final equilibrium. b. Point D is a short-run equilibrium and point C is a final equilibrium. c. Point C is a short-run equilibrium and point D is a final equilibrium. d. Point C is a short-run equilibrium and point A is a final equilibrium again.
36. What determines the position of the long-run supply curve?
a. Market price b. The minimum point on the typical firm’s marginal cost curve c. The minimum point on the typical firm’s average total cost curve d. The minimum point on the typical firm’s average variable cost curve
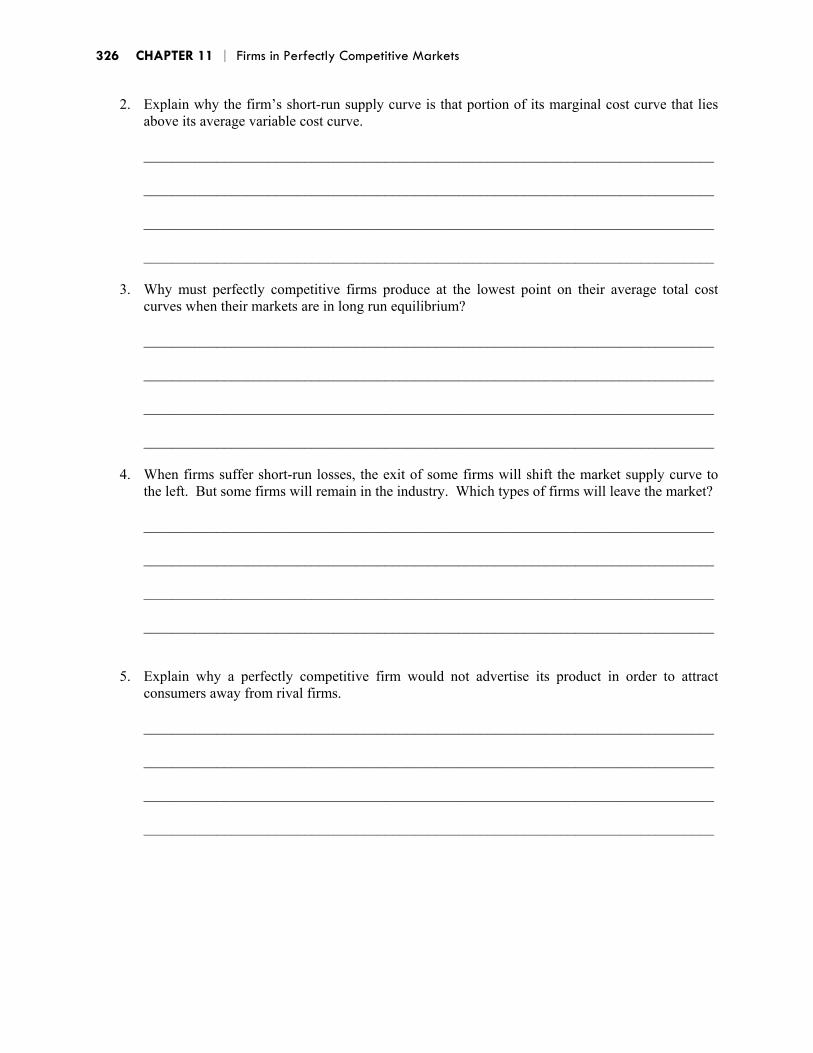
37. Refer to the graphs below. Which graph best depicts an industry in which the typical firm’s average
costs decrease as the industry expands production?
a. The graph on the left b. The graph on the right c. Either graph could be associated with that industry. d. Neither graph
CHAPTER 11 | Firms in Perfectly Competitive Markets 324
38. Which of the following terms best describes how the result of the forces of competition driving the market price to the minimum average cost of the typical firm? a. Allocative efficiency b. Productive efficiency c. Decreasing-cost industry d. Competitive markdown
39. Which of the following terms best describes a state of the economy in which production reflects
consumer preferences? a. Allocative efficiency b. Productive efficiency c. Capitalism d. Consumer equilibrium
40. Refer to the graphs below. The graph describes the situation of a typical firm in the competitive
plasma TV industry. What combination of price and output levels best describes the industry when plasma TVs were first introduced?
a. Point A b. Point B c. Either point could reflect the conditions in the infant industry. d. There is insufficient information to answer the question.
CHAPTER 11 | Firms in Perfectly Competitive Markets 325
41. Refer to the graphs below. The graph describes a typical firm in the competitive plasma TV industry. What combination of price and output levels best describes the existence of productive efficiency in the plasma TV industry?
a. Point A b. Point B c. Both points reflect productive efficiency. d. Neither point reflects productive efficiency.
42. When the market system allocates inputs efficiently to produce goods and services that best satisfy
consumer wants, which of the following is true? a. The price of a good represents the marginal benefit consumers receive from consuming the last
unit of the good sold. b. Perfectly competitive firms produce up to the point where the price of the good equals the
marginal cost of producing the last unit. c. Firms produce up to the point where the last unit provides a marginal benefit to consumers equal
to the marginal cost of producing it. d. All of the above
Short Answer Questions 1. Entry and exit ensure that perfectly competitive firms will not earn economic profits in the long
run. Why would any firm remain in an industry if it cannot earn a profit?
4. When firms suffer short-run losses, the exit of some firms will shift the market supply curve to the left. But some firms will remain in the industry. Which types of firms will leave the market?
CHAPTER 11 | Firms in Perfectly Competitive Markets 327
True/False Questions T F 1. Perfectly competitive firms will lower their prices in response to price cuts of rival firms. T F 2. The slope of the demand curve of a perfectly competitive firm equals zero. T F 3. The firm’s profit equals price minus average total cost. T F 4. If a firm’s price is less than average variable cost in the short run, it will temporarily shut
down. T F 5. The long run supply curve of a perfectly competitive industry is upward sloping. T F 6. Allocative efficiency is achieved when a product is produced up to the point where the
marginal benefit equals the marginal cost of the last unit sold. T F 7. In the short run, a perfectly competitive firm will shut down if the total revenue from the
quantity of output it sells is less than total cost. T F 8. When perfectly competitive firms exit a market, the market supply curve shifts to the left. T F 9. An increase in the firm’s fixed costs will raise its price and reduce the quantity of output it
sells. T F 10. When a firm’s price equals its average variable costs, it will break even. T F 11. The market supply curve is derived by adding up the quantity that each firm in a perfectly
competitive market is willing to supply at each possible price. T F 12. The market demand curve for a perfectly competitive market is perfectly elastic. T F 13. In a constant cost industry, the market demand curve is a horizontal line. T F 14. Productive efficiency is achieved when firms produce the level of output that minimizes
their variable costs. T F 15. Allocative efficiency is achieved when a firm produces a good or service up to the point
where average total cost of the last unit produced equals price. Answers to the Self-Test Multiple-Choice Questions Question Answer Explanation 1 d Firms in a perfectly competitive market are unable to control the prices of the
goods they sell, and the owners are unable to earn economic profits in the long run. 2 a The three conditions that make a market perfectly competitive are: 1) There must
be many buyers and many firms, all of whom are small relative to the market; 2) The products sold by all firms in the market must be identical; and 3) There must be no barriers to new firms entering the market.
3 b A buyer or seller that is unable to affect the market price; that is each is a price taker.
4 d The firm can bring to the market any amount of output it chooses to produce, and sell it at the given market price of $4.00 per bushel.
5 d If the firm increases its price, it will not sell any units of the good. 6 c To maximize profits, a perfectly competitive firm should produce that quantity of
the good where the difference between the total revenue he receives and his total cost is as large as possible.
7 b This is the graph that describes the concept of a price-taker type of firm. 8 c For a firm in a perfectly competitive market, price is equal to both average revenue
and marginal revenue.
CHAPTER 11 | Firms in Perfectly Competitive Markets 328
9 c In order to maximize profit, the farmer should produce the level of output where marginal revenue equals marginal cost or the last unit of the good for which the MR > MC.
10 c When total revenue is linear, marginal revenue is constant. 11 c The closest the farmer can come to equalizing marginal revenue and marginal cost
is by producing 6 bushels of wheat. 12 b Profit per unit equals price minus average total cost, or the distance between points
A and B on the graph. 13 c Only marginal revenue and marginal cost are needed in order to determine the
profit-maximizing level of output. 14 a Marginal cost is not needed in the computation of profit. 15 c Profit is maximized by setting marginal revenue equals marginal cost. 16 c The firm earns normal profit, or an amount of profit equal to the opportunity cost
to the firm’s owners of remaining in this business. 17 c Since average total cost is greater than price, the area represents losses or a
negative economic profit. 18 b Since average total cost is greater than price, the area represents losses. 19 c Sunk cost is a cost that has already been paid and cannot be recovered. 20 b At the price level indicated by this demand curve, the firm obtains exactly the
amount of revenue necessary to cover the variable costs of production, leaving the firm with a loss equal to total fixed cost. At this point, the firm is indifferent between producing or shutting down. This is called the shutdown point.
21 c When demand is Demand3, the firm can cover all of the variable cost and part of the fixed cost, so the firm is better off producing than shutting down.
22 c TFC = TC – TVC. TC = $58.00 x 100 = $5,800. TVC = $34.00 x 100 = $3,400. Then, $5,800 – $3,400 = $2,400.
23 a The graph on the right represents the market’s supply curve. 24 b If a farmer could have earned a 10 percent return on her $100,000 in savings in the
best alternative use, then her apple business incurs a $10,000 opportunity cost. We can also think of this $10,000 as being the minimum amount that the farmer needs to earn on her $100,000 investment in her farm to remain in the industry in the long run.
25 c Economic loss is a situation in which a firm’s total revenue is less than its total cost, including all implicit costs.
26 a Since price is greater than average total cost, there is economic profit to be made in the short run.
27 d Because price is greater than average total cost, there are economic profits to be made and firms will enter the market. As firms enter, the market supply curve shifts to the right.
28 c As firms enter the market, the market price will decrease until it reaches the minimum of the ATC curve and the profit will become $0.
29 b The lower equilibrium market price will force the firm to reduce its output to maintain the condition where price (marginal revenue) and marginal cost are equal (and avoid an even bigger loss if output remained the same).
30 a The higher equilibrium market price would entice the profit-maximizing firm to increase its output so that price (marginal revenue) and marginal cost remain equal. The firm would increase its profits if it increases output rather than if it maintains the same level of output after the price increase.
31 a In long-run competitive equilibrium, entry and exit have resulted in the typical firm just breaking even. The long-run equilibrium market price is at a level equal to the minimum point on the typical firm’s average total cost curve.
CHAPTER 11 | Firms in Perfectly Competitive Markets 329
32 c Lower market demand results in losses that cause some firms to exit the industry, thereby shifting the market supply curve to the left.
33 b Higher market demand results in economic profit that causes some firms to enter the industry, thereby shifting the market supply curve to the right.
34 d An increase in demand for apples will lead to a temporary increase in price from $10 to $15 per box, as the market demand curve shifts to the right from D1 to D2. The entry of new firms shifts the market supply curve to the right, which in the case of the constant-cost industry will cause the price to fall to its long-run level of $10.
35 b A decrease in demand will lead to a temporary decrease in price from $10 to $7 per box, as the market demand curve shifts to the left from D1 to D2. The exit of firms shifts the market supply curve to the left from S1 to S2, which causes the price to rise to its long-run level of $10.
36 c The position of the long-run supply curve is determined by the minimum point on the typical firm’s average total cost curve. Anything that raises or lowers the costs of the typical firm in the long run will cause the long-run supply curve to rotate up or down.
37 a In the long run, competition will force the price of the product to fall to the level of the new lower average cost of the typical firm. In this case, the long-run supply curve will slope downward. Industries with downward-sloping long-run supply curves are called decreasing-cost industries.
38 b Productive efficiency refers to the situation in which a good or service is produced at the lowest possible cost. As we have seen, perfect competition results in productive efficiency.
39 a Allocative efficiency is a state of the economy in which production reflects consumer preferences; in particular, every good or service is produced up to the point where the last unit provides a marginal benefit to consumers equal to the marginal cost of producing it. When DVD players were first introduced, prices were high and only a few firms were in the market.
40 a When plasma TVs were first introduced, prices were high and only a few firms were in the market.
41 b Productive efficiency is achieved when plasma TVs are produced at the lowest possible cost.
42 d When the market system allocates inputs efficiently to produce goods and services that best satisfy consumer wants: 1) the price of a good represents the marginal benefit consumers receive from consuming the last unit of the good sold; 2) perfectly competitive firms produce up to the point where the price of the good equals the marginal cost of producing the last unit; and 3) firms produce up to the point where the last unit provides a marginal benefit to consumers equal to the marginal cost of producing it.
Short Answer Responses 1. Remember that zero economic profit is not the same as zero accounting profit. The return that a
perfectly competitive firm earns in the long run is equal to the value of the owner(s) opportunity cost. An economic profit is a return greater than this. In competitive markets, economic profits are possible only in the short run.
2. A supply curve shows the relationship between the price of a product and the quantity of the product
supplied. The firm’s marginal cost curve traces out the quantity the firm will supply at various prices. But for prices less than average variable cost, the firm will shut down temporarily and produce zero
CHAPTER 11 | Firms in Perfectly Competitive Markets 330
units of output. This is why the firm’s short-run supply curve coincides with only the portion of the marginal cost curve that lies above average variable cost. (Of course, the supply curve also includes the graph’s origin.)
3. Since the demand curve for a perfectly competitive firm is horizontal, it has a zero slope. In long-run
equilibrium the firm will earn zero economic profit. For this to be true, price must equal average total cost. This can only happen when the demand curve is tangent to the firm’s long run average total cost curve and this tangency can only be where both the demand curve and the average total cost curve have slopes equal to zero. And the ATC curve will have a slope of zero only at its minimum point.
4. Owners of firms are in different locations and have different opportunity costs. Some will be more
optimistic about the future of their markets than others. Owners who are less optimistic about the future prospects for profit are more likely to leave. Some firms are likely to have greater financial resources than others. The firms with lower financial resources are more likely to leave the market when they experience losses.
5. Successful advertising allows firms to gain sales at the expense of other firms and/or to raise the
prices of the products they advertise. In perfectly competitive markets, firms can sell all the output they wish to sell at the market price and cannot raise their prices. Advertising would only add to cost and reduce profits.
True/False Answers 1. F The firm should charge the market price because it can sell as many or as few units of the good
as desired at that price. 2. T The change in price over the change in quantity is zero. 3. F This defines profit per unit, not total profit. 4. T Because P < AVC, the firm cannot cover all the losses. 5. F The statement describes an increasing cost industry. A perfectly competitive market can have
constant, increasing, or decreasing long run costs. (A decreasing cost industry will have a downward sloping long run supply curve. A constant cost industry will have a horizontal long run supply curve.)
6. T See the definition of allocative efficiency on page 401 of the textbook. 7. F The firm will continue to produce if total revenue exceeds total variable costs. 8. T A decrease in the number of firms in the market will cause the market supply curve to shift left. 9. F Changes in fixed costs will affect a firm’s profit but not its output since this does not affect
marginal cost. Changes in price result from changes in market supply and demand. 10. F Break even occurs when all costs are covered and there is no additional revenue left over, that
is, when P = minimum of the ATC curve. 11. T See Figure 11-7 on page 392 of the textbook. 12. F The firm’s, not the market’s, demand curve is perfectly elastic. 13. F In a constant-cost industry, the long-run market supply curve is a horizontal line. 14. F Productive efficiency occurs when a firm produces the quantity associated with the minimum
average total cost. 15. F Allocative efficiency is achieved when a firm produces up to the point where the marginal
benefit of the last unit equals the marginal cost of producing it.