32
FIRST-HALF FINANCIAL REPORT 30 JUNE 2011
| Date post: | 02-Oct-2018 |
| Category: |
Documents |
| Upload: | truongdiep |
| View: | 213 times |
| Download: | 0 times |

F I R S T- H A L F F I N A N C I A L R E P O R T3 0 J U N E 2 0 1 1

GROUPE SEBF i r s t - h a l f f i n a n c i a l r e p o r t
CONTENTS
1PROFILE AND KEY FIGURES FOR 2011 1
22011 MANAGEMENT REPORT 4Key events 4
Trading activity 6
Comments on results 9
Financial structure 9
Outlook 10
32011 FINANCIAL REPORT 11Consolidated Income Statement 11
Consolidated Statement of Comprehensive Income 11
Consolidated Balance Sheet 12
Consolidated Cash Flow Statement 13
Consolidated Statement of Changes in Equity 14
Notes to the condensed consolidated fi nancial statements 15
Statutory auditors’ review report 26
Statement by the person responsible for the interim fi nancial report 27

1F i r s t - h a l f f i n a n c i a l r e p o r tGROUPE SEB
PROFILE AND KEY FIGURES FOR 2011
GROUPE SEB, IN TOUCH WITH CHANGING TIMES
With a presence in almost 150 countries, Groupe SEB has won strong positions on the various continents, thanks to a wide and very diversifi ed product range whose value is enhanced by an exceptional brand portfolio. Today it is the world leader in small domestic equipment.
This success is based on its ability to innovate and invent for day-to-day life in tomorrow’s world.
A MULTI-SPECIALIST GROUP
WORLD RANKING
A LEADING POSITION SUPPORTED BY VERY WELL-KNOWN BRANDS:
� Worldwide brands: All-Clad, Krups, Lagostina, Moulinex, Rowenta and Tefal
� Regional brands: Calor and Seb (France and Belgium), T-fal, Mirro, WearEver, AirBake and Regal
(North America), Arno, Panex, Rochedo, Penedo, Clock, Samurai, Imusa and Umco (South America),
Supor (China), Asia Vina (Vietnam).
� COOKWAREFrying pans, saucepans, casseroles, bakeware, oven
dishes, pressure cookers, low-pressure steam pots,
kitchen utensils, etc.
� KITCHEN ELECTRICSElectric cooking: deep fryers, table-top ovens, rice
cookers, induction hobs, electric pressure cookers,
barbecues, informal meal appliances, waffl e makers,
grills, toasters, steam cookers, breadmakers, etc.
Food preparation: food processors, beaters,
mixers, blenders, centrifugal juice extractors, small
food- preparation equipment, filter or pod coffee
makers, espresso machines, electric kettles, home
beer-tapping machines, etc.
� HOME AND PERSONAL CARE PRODUCTS
Personal care: hair styling and hair removal
appliances, bathroom scales, foot massagers, baby-
care equipment (including feeding bottles, bottle
warmers, sterilisers and nightlights), etc.
Linen care: irons and steam generators, semi- automatic
washing machines, garment steam brushes, etc.
Home care: upright and cylinder vacuum cleaners
with and without bags (handheld and cordless), fans,
heating and air treatment appliances, etc.
Cookware – Pressure cookers – Irons and steam generators – Kettles – Steam cookers – Toasters – Deep fryers – Breadmakers – Informal meal appliances – Weighing equipment (bathroom and kitchen scales)
Espresso coffee machines - Table-top ovens – Waffl e and sandwich makers
Food preparation equipment - Electric depilators
No. 1No. 2No. 3
SALES
€3,652m + 15 %
OPERATING MARGIN
€438m + 23%
NET INCOME
€220m + 51 %
NET DEBT
€131m - €112 M
CAPITAL
EXPENDITURE
€140m + 28 %
EMPLOYEES
23,058 PEOPLE WORLDWIDE
31/12/2010
AT 31 DECEMBER 2010

2 GROUPE SEBF i r s t - h a l f f i n a n c i a l r e p o r t
PROFILE AND KEY FIGURES1
CHANGE IN HALF-YEAR SALES(in € millions)
1,7191,555
Organic growth
+131Currencies
+1 Imusa
+32
H1 2010 H1 2011
DETAIL OF CHANGE IN OPERATING MARGIN(in € millions)
Volume effect
Price & mix effect
Purchaseprices
Change in expenses
Currency impact
Acquisition168
+38 -27-25
-22 +21 +2
155
H1 2010 H1 2011
NET DEBT AT 30 JUNE
0
100
200
300
400
500
600
700
324
456
195
440385
481
627
504
208257
0.6
1.0
0.3
0.60.5
0.6 0.60.5
0.10.2
2011201020092008200720062005200420032002
0
0.2
0.4
0.6
0.8
1
1.2
0
100
200
300
400
500
600
700
Debt-to-equity ratio (gearing)
Debt (in € millions)
1.45
2.80
0.77
1.54 1.64 1.58 1.601.45
0.46 0.54
2011201020092008200720062005200420032002
0
0.5
1
1.5
2
2.5
3
Debt-to-EBITDA ratio
AT 30 JUNE 2011
GROUPE SEB CONSOLIDATED RESULTS
(in € millions) H1 2010 H1 2011Sales 1,555 1,719
Operating margin 168 155
Other operating income and expense (8) 16
Operating profi t 141 152
Net income, Group share 89 93

3F i r s t - h a l f f i n a n c i a l r e p o r tGROUPE SEB
PROFILE AND KEY FIGURES 1
1
CHANGE IN DEBT OVER 6 MONTHS(in € millions)
Cashflow
Tax and finance costs
Dividends
Capital expenditure
Sales of shares
Restructuring operations
Acquisitions
WCR
Other
131
5367
58
42
1098
-30
-3257
Debt 31/12/2010
Debt30/06/2011
-178
WORKING CAPITAL REQUIREMENT (WCR) AT 30 JUNE(as a percentage of sales)
20
22
24
26
28
30
32
20112010200920082007
30.7
24.923.9
21.5 21.7
SHARE PERFORMANCE
SEB
January-11
CAC 40 index (adjusted)
€ Number of shares
Volumes
0
10
20
30
40
50
60
70
80
90
0
100,000
200,000
300,000
400,000
500,000
600,000
July-11June-11May-11April-11March-11February-11
-6.41%
-9.88%

4 GROUPE SEBF i r s t - h a l f f i n a n c i a l r e p o r t
2011 MANAGEMENT REPORT2
KEY EVENTS
GENERAL CLIMATE
Trading activity in H1 took place in a generally favourable worldwide
economic context, though there were some areas of concern:
� Eurozone countries (Spain, Portugal, Greece and Ireland) suffering from
an economic downturn and slowing consumer spending;
� large sociopolitical movements in a number of Arab countries, that may
have an impact on the per barrel price of oil. These events have, however,
had little impact on the sales of the Group (limited turnover in the Near
East and the Maghreb);
� a Japanese market marked by the disasters which have affected it and
the subsequent impact upon consumer spending.
In this environment, the small domestic equipment sector is still being driven
by strong demand for equipment from emerging markets, whilst mature
markets are experiencing a slowdown in consumer spending. This situation
is, however, partially offset by powerful trends such as the home-made food,
the vogue for healthy cooking and the application of new technological
solutions.
Currencies. The volatility which has dominated the last few years continued
to prevail. During H1 2011, based on average exchange rates, currencies
underwent contrasting changes compared with the fi rst six months of 2010.
Some of the Group’s operating currencies strengthened against the euro,
such as the Brazilian real (+4.2%), the yen (+5.5%) and the zloty (+1.3%),
whilst the pound sterling (+0.2%) and the Mexican peso (+0.7%) remained
virtually unchanged. Others, however, saw their value fall: this was the case
for the dollar (-5.4%), the Turkish pound (-8.4%) and, to a lesser extent, the
yuan (-1.3%) and the Korean won (-0.8%). These changes also concealed
contrasting quarter-on-quarter trends: whilst almost all currencies, except
the Turkish pound, strengthened against the euro during Q1, Q2 saw all of
them fall in value. This signifi cant volatility eventually led to an almost zero
impact on sales and more marked profi t on the operating margin.
Cost of raw materials and transport. Infl ation in the cost of raw materials
ran at a higher rate in H1 2011 compared with last year. All metals used in the
composition of our products saw a signifi cant increase (average price over
the period): aluminium +20% to USD 2,554/t, copper +30% to USD 9,420/t
and nickel (a component of stainless steel) +22% to USD 25,795/t. In this
highly infl ationary context, the Group pursued its hedging policy in order to
smooth out the impact of the price increases whilst implementing targeted
productivity plans and constantly controlling purchases of materials,
components and sourced products. At the same time, prices of plastic
materials followed the same upward trend (+20% compared with H1 2010)
with a diluted impact on parts and sub-assemblies for the Group. This
change is related to the rise in the price of a barrel of oil, which increased
from USD 79 to USD 111 (+40%).
Sea transport costs remained relatively stable, with the exception of
Asia/ Europe traffi c, where the reduction was noticeable due to excess
container capacity caused by demand not rising to expected levels. Air
and road freight, meanwhile, are subject to the fuel surcharge (diesel) which
causes their prices to rise.
ACQUISITION OF IMUSA IN COLOMBIA
After opening negotiations with Imusa’s shareholders in July 2010, in
December the Group was given the green light by the Colombian authorities
allowing it to finalise the acquisition of the Colombian company on
28 February 2011. Imusa manufactures and markets aluminium, stainless
steel and cast aluminium cookware (frying pans, saucepans, stockpots,
local cooking pots known as ‘calderos’, pressure cookers, etc.) and plastic
products for food and domestic use (storage boxes, kitchen utensils, thermos
fl asks, etc.). Based on turnover of around €90 million in 2010, 57% of the
company’s business came from the domestic market, 28% from the United
States – its largest export market – and the balance from other Latin American
countries. Leader on the Colombian market under its two brands, Imusa
and Umco, it has two industrial sites, two commercial premises (Columbia
and the United States) and 12 directly-owned stores. The company has
around 1,000 employees. With this acquisition, the Group has strengthened
its leading position in small domestic equipment on the Colombian market,
where it was already the leader in small domestic appliances through its
Samurai brand. Moreover, it is complementing and spreading its presence
across several other Latin American markets (Venezuela, Central America,
Ecuador and the Caribbean) and focusing on the Hispanic population of the
United States with a targeted product range.
The integration process is forging ahead in terms of both product
development and production, logistics, IT systems, fi nancial reporting and
human resources. A range of electrical cooking products developed in
synergy with the Group will be launched in the second half of 2011 under
the Imusa brand.
TAKEOVER OF THE VIETNAMESE COMPANY ASIA FAN
On 12 May 2011, the Group took over the Vietnamese company Asia Fan,
the national leader on the fan market. Its stake amounts to 65% of capital,
with 30% of the remaining shares held by the founding family and 5%
by employees. Specialising in the production and marketing of fans, the
largest category of small domestic appliances in South-East Asia, Asia Fan
is represented by its ASIAvina brand, which has a strong national reputation.
In 2010, the company achieved sales of around €11 million, an increase
of more than 30% in two years. The workforce is made up of 700 people.
Its operations run on two industrial sites and 40 directly-owned stores.
As with the acquisition of Imusa, this takeover forms part of the Group’s
development strategy in rapidly emerging countries such as Vietnam, where
the small domestic appliance market is experiencing growth of between 15
and 20% per year. It provides a complementary business to the deployment
of Supor in Vietnam, which is already present in the fi eld of cookware and
kitchen electrics and a gateway to the other markets in South-East Asia.
The integration process is underway.
2011 MANAGEMENT REPORT

5F i r s t - h a l f f i n a n c i a l r e p o r tGROUPE SEB
2011 MANAGEMENT REPORT 2PROJECT TO INCREASE THE GROUP’S STAKE IN THE CHINESE COMPANY SUPOR
In February 2011, the Su family, who founded the company, reported their
intention to sell an extra 20% of the capital of Supor. Having already bought
out shares from the Su family in 2007 and owning 51.3% of the company,
Groupe SEB took the option to purchase the additional 20%. The Group
agreed to purchase 115,450,400 shares at the price of CNY 30 per share,
giving a total transaction amount of CNY 3,464 million (around €371 million
based on the CNY/€ as at 30 June 2011). The project was approved by
Supor’s Board of Directors on 16 February and General Meeting on
4 March 2011. The dossier was then submitted for approval to the MOFCOM
(the Chinese Ministry of Commerce) and the CSRC (the China Securities
Regulatory Commission). On 7 July, the MOFCOM authorised Groupe SEB
to increase its shareholding in Supor’s capital to 71.3%. The project is still
being reviewed by the CSRC.
This additional acquisition is intended to consolidate the strategic investment
made by the Group in Supor in 2007 and to ensure the company’s mid-to
long-term development based on solid, stable share ownership.
EXTENSION OF THE SUPOR SITE IN WUHAN
The extension of this site, which specialises in the production of cookware
for the Chinese domestic market, began in May 2010. It should allow the
company to keep up with demand more effectively and double production
capacity with ultra-modern processes and production lines. Wuhan will thus
become the largest cooware manufacturing site in Asia. The total investment
devoted to this project since it began amounts to CNY 500 million, i.e. around
€53 million. The site’s workforce currently stands at 1,700 employees.
FIRST BOND ISSUE
In May 2011, the Group launched its fi rst bond issue in the amount of
€300 million, with a term of fi ve years (maturing on 3 June 2016) and an
annual coupon of 4.5%. The issue was hugely oversubscribed (€600 million),
a sign of investors’ confi dence and their appetite for the fi rst bonds issued. It
allows Groupe SEB to extend the average maturity of its debt and diversify
its sources of fi nancing beyond existing credit lines, whilst benefi ting from an
advantageous fi nancing opportunity. The bonds are listed on Euronext Paris.
CREATION OF A SEB ALLIANCE INVESTMENT FUND
With a view to opening up its innovation policy to new and external
technologies, in May 2011 the Group created a SEB Alliance investment
fund endowed with capital of €30 million. This structure will target innovative
companies with a strong high-tech content in fi elds such as: population
ageing, promotion of healthy living, new energies, robotics, digital
technologies, etc. SEB Alliance made its fi rst investment by purchasing a
stake in the American company Key Ingredient, a start-up specialising in
the development of digital cooking solutions. In 2008, the company created
an innovative service which allows a community of 40,000 members to
collect, save and share their cooking recipes in one digital format on the
keyingredient.com website. This recipe database can be accessed via an
iPad or Android application or even using a dedicated touchscreen tablet.
ACTIVITIES OF THE GROUPE SEB FOUNDATION
Created in 2007, the Groupe SEB Foundation’s mission is to combat
social exclusion. It lends its support to projects assisting with the social
rehabilitation of underprivileged people, via three channels: work, housing
and education/training. In 2010, 48 projects received support from the
Groupe SEB Foundation. In total, 141 projects of very diverse kinds have
been supported since its creation (out of more than 1,000 projects received).
For 2011, the support budget is €558,000 in cash and €326,000 in gifts of
products.
The network of key partners of the Foundation (comprised of Habitat et
Humanisme, Fondation de la 2e Chance, Envie, Fondation d’Auteuil and
Agence du Don en Nature) has been joined by a new partner: the French
charity Secours Catholique. A project aimed at equipping “petits lieux de
vie”, drop-in centres with small domestic appliances, is underway in Caen,
on the initiative of the Groupe SEB Foundation, and is now being rolled
out across France. Around fi fty drop-in centres across the country will be
equipped with the Group’s products.
In H1 2011, the Group also carried out humanitarian work in support of those
affected by natural disasters. Following the events in Japan last March, the
Group donated €168,000 to the Japanese Red Cross via its Foundation and
subsidiaries and donated products worth more than €420,000. A collection
was also launched among its employees worldwide, bringing in donations
amounting to €12,000.
As a reward for its actions, Groupe SEB received the ‘Ethics & Governance’
trophy under the “Grande Entreprise Française” category, in recognition of
its investment in sustainable development as well as its efforts to combat
exclusion through its Foundation. This prize was awarded in February 2011
by the “Ecole des Dirigeants et Créateurs d’entreprise” business school (EDC).
2

6 GROUPE SEBF i r s t - h a l f f i n a n c i a l r e p o r t
2011 MANAGEMENT REPORT2TRADING ACTIVITY
Sales(in € millions) H1 2010 H1 2011
Variation as %*
Current exchange rates
Like-for-like and constant exchange
rates
France 297 291 -2.2% -2.2%
Other Western European countries 323 341 +5.8% +5.8%
North America 167 172 +3.1% +2.0%
South America 148 190 +27.9% +9.6%
Asia-Pacifi c 357 433 +21.5% +19.6%
Central Europe, Russia and other countries 263 292 +11.0% +12.2%
TOTAL 1,555 1,719 +10.6% +8.4%
* Calculated on unrounded fi gures.
In H1 2011, the macro-economic environment remained favourable overall,
but with some contrasting characteristics, such as:
� stable demand in Western Europe, except in some countries including
Greece, Spain and Portugal;
� the ongoing vitality of emerging markets;
� the competitive and promotional nature of most markets.
In this context, and despite the bar having already been set high in 2010,
Groupe SEB recorded sales of €1,719 million, up 10.6% and originating
mainly in volumes. This figure includes a contribution from Imusa,
consolidated since 1 March, in the amount of €32 million. On a like-for-like
basis and at constant exchange rates, sales growth amounted to 8.4%,
made up of +11.6% in Q1 and +5.4% in Q2, refl ecting a slowdown in a
number of countries.
Currencies remained highly volatile, ultimately having a near-zero impact on
sales, as Q2 cancelled out the largely positive effect recorded over the fi rst
three months of the year.
PRODUCT PERFORMANCE
The innovation policy continued to energise the Group’s product range, with
some 90 new products and models having been introduced on our various
markets in H1.
Cookware. The entry-level range developed in late 2010 and manufactured
in France experienced excellent growth and allowed the company to regain
its position on this segment. The mid-range – which has been completely
revitalised with the implementation of new technologies (ultra-resistant
coatings, reinforced bases ensuring better heat distribution, detachable
features) – was successfully introduced onto the European markets. The
top-range All-Clad and Lagostina sets, meanwhile, suffered a slight drop
in performance. At the same time, Imusa provided a new product range
in South America and enhanced its ranges with synergy products such as
pressure cookers and detachable handles which will be introduced to the
Colombian market in H2. Meanwhile, Tefal is set to launch its induction base
mid-range, continuing its international deployment.
Kitchen electrics. This area, which is experiencing strong growth, is driven
by the ‘home-made’ trend. Its dynamism is drawn from food preparation,
with some emblematic products such as the Fresh Express multi-grater,
the Moulinette, the meat mincer – mainly in Russia – and the Kitchen
Machine food processor, mainly in Brazil. The relaunch of Moulinex in nine
European countries also made a signifi cant contribution to this performance.
Another growth driver lies in coffee machines (Nespresso and Dolce Gusto),
particularly the recently-launched Pixie and Piccolo models, which respond
to the current craze for coffee portions in a multitude of different types. The
Nutritious & Delicious range, with its fl agship product Actifry, is pursuing
its international expansion with a promising launch in Brazil. The Actifry
range will be expanded in H2 with two new versions: one on the entry-level
segment and another on the top-range segment, featuring the integration
of new functions. Furthermore, a Soup & Co heated blender model and
a Masterchef 2000 compact food processor are set to revitalise the food
preparation ranges in the autumn.
Linen and home care. The growth of steam generators in new territories
such as Turkey and Russia has given a shot in the arm to a lifeless ironing
market. On its traditional markets, the Group is strengthening its positions
by making market share gains through technological advances (self-cleaning
soleplate, limescale fi lter, steam generator on wheels) and the renowned
performance of its products. In steam irons, despite a few one-off diffi culties,
business remains at a healthy level in the United States, Mexico and Turkey.
However, the Rowenta brand, with a strong presence in Southern Europe,
is suffering from the gloomy economic climate.
Moreover, performance was remarkable in home care, with growth in double
fi gures drawn from two areas: Air Force cordless upright vacuum cleaners
and Silence Force cylinder vacuum cleaners. Air Force is enjoying great
success pressing ahead with its conquest of new markets, particularly Italy
and Turkey. New Silence Force Extreme models, even quieter and more
user- friendly, will further enrich the product range in H2. In fans, sales fell
due to the poor weather conditions at the turn of the year in South America
(Brazil, Colombia). The takeover of the Vietnamese company Asia Fan will
expand the Group’s scope and allow it to open up new prospects on Asian
markets.
Personal care. This business, impacted by the crisis in 2008-2009, returned
to some level of growth, driven mainly by excellent performance in South
America. Haircare made up some ground through an expanded range with
hair dryer products at entry-level and hair styling products on the mid-range
segment. Meanwhile, hair removal – boosted by Aquaperfect (underwater
depilator) – achieved record growth and allowed the Group to regain some
market shares. The Elite and Weight Watchers partnerships (specifi cally in
bathroom scales) play a leading role on our various ranges that should be
further enhanced in H2. Moreover, in September we will be introducing a
new category of Well-being products: massage cushions, chairs and mats.

7F i r s t - h a l f f i n a n c i a l r e p o r tGROUPE SEB
2011 MANAGEMENT REPORT 2GEOGRAPHICAL PERFORMANCE
Groupe SEB is active in almost 150 countries and achieved H1 2011 sales
distributed as follows:
17%France(19%)
20%(21%)
25%(23%)
17%(17%)
10%(11%)
11%(9%)
Other WesternEU countries
North America
South America
Asia-Pacific
Central Europe, Russiaand other countries
(H1 2010 fi gures).
In France, in a context where consumer spending has levelled off slightly,
the small domestic appliance market remained favourable overall in H1,
although kitchen electrics did suffer a slowdown in Q2 whilst the cookware
market remained buoyant. The competitive environment remained fi erce
in terms of both products and prices, as reported by some distributors.
In this environment, the Group’s sales fell by 2.2% during H1, affected
by promotional offers in small domestic appliances and by a rival loyalty-
building initiative organised by one of our cookware distributors. Results
were nevertheless very satisfactory for traditional breakfast equipment and
Nespresso and Dolce Gusto pod coffee makers. The success of the Air Force
upright vacuum cleaner was confi rmed and the Group improved its ranking.
In personal care, although business did suffer some diffi culties, the Group
recorded resurgent dynamism on certain key products such as depilators,
hair dryers and hair straighteners. In food preparation, the success of Fresh
Express continued, whilst the other food preparation operations awaited
the introduction of new products. In electric cooking, business felt the strain
caused mainly by a strong sales history on Actifry. In linen care, the drop in
the market mainly affected steam irons.
In the other Western European countries, despite comparison with strong
fi gures in the previous year, Groupe SEB recorded sales growth of 5.8%,
with a positive contribution from all markets - except Greece, Spain and the
Netherlands - and market share gains in both small domestic appliances
and cookware.
In Spain, the economic environment is still very strained and some
distributors continue to suffer diffi culties. The small domestic equipment
market has gradually turned negative and the Group’s sales are down, but
market shares are improving thanks mainly to positive results for vacuum
cleaners, steam generators, cookware and Nespresso. Greece, which
has been deeply affected by the crisis, also suffered a marked downturn
on a collapsing market. In contrast, on a weakened market, business in
Portugal benefi ted from the relaunch of Moulinex. In Italy, the Group had a
good H1 and outperformed the market, enjoying great success in vacuum
cleaners, Fresh Express, Nespresso and both linen and personal care.
In Germany, the market, though experiencing growth, was nonetheless still
very price- and promotion-oriented. Despite recent price rises, the Group
recorded an increase in sales and won market shares with, in particular,
sustained results from food preparation (relaunch of Moulinex), Dolce
Gusto and Nespresso pod coffee makers and vacuum cleaners. The same
phenomenon was seen in Belgium, which also recorded business growth
and strengthened its positions.
Elsewhere in northern Europe, the United Kingdom achieved a very strong
performance in H1 - although the basis of comparison was still favourable -
driven by cookware, which expanded its product listings, deep fryers, linen
care (with, in particular, a recovery in steam irons) and Dolce Gusto and
Nespresso pod coffee makers. In Austria, the Group’s sales rose, driven
by steam generators and food preparation, whilst the Netherlands ran
out of steam on a weakened market and despite the electrical business
experiencing growth. Finally, in the Scandinavian countries sales rose sharply
thanks mainly to the relaunch of Moulinex.
In North America, in an economic climate that remained sluggish, the
Group recorded sales growth of 2.0% on a like-for-like basis and at constant
exchange rates during H1 2011. If Imusa’s contribution is included, sales
increased by 3.1% at current exchange rates, with the situation varying from
country to country.
In the United States, the Group’s fourth largest market, the fi nancial status
of households is gradually returning to normal and consumer spending is
recovering little by little, under the impetus of a return to lending. However,
the recovery remains fragile and the macro-economic indicators negative. In
this uncertain context, the Group ended the quarter in a position of growth.
In cookware, T-fal’s business remained at a good level despite a highly
promotional competitive environment. Positioned on the entry-level segment,
WearEver continued in its role as a complement to T-fal and as a presence
for market occupation, whilst Emeril enjoyed sustained sales through the
teleshopping channel. On the top-range segment, the Group is preparing
the launch of the new All-Clad stainless steel ranges and the repositioning
of the brand planned for H2 by clearing out old stock. As regards Imusa,
business was highly dynamic in H1 and the Group is gradually launching
synergies in relation to products and distribution networks. On the small
domestic appliance market, the Group’s presence is still small but advances
were made in electric cooking, driven by Emeril barbecues and deep fryers.
Moreover, Krups’ business remained at a low level in view of the launches
in H2. Finally, in linen care, Rowenta experienced an erratic H1, with a very
good reception for the new iron ranges on the one hand and a downturn on
the garment steam brush market on the other.
Canada recorded a very strong H1, driven by a recovery in consumer
spending and a more offensive commercial policy. The Group benefi ted
in particular from sustained results in cookware and strong sales growth in
electric cooking - deep fryers (including Actifry) and toasters - and on Tefal
Dolce Gusto.
Business in Mexico was very robust, but sales were hindered by the non-
renewal of a loyalty programme implemented last year with a major customer.
In South America, business remained at a healthy level, though with a
more strained Q2 on some markets. The Group’s sales rose by 9.6% at
constant exchange rates and on a like-for-like basis. Including Imusa, growth
amounted to +27.9%.
In Brazil, the Group’s largest market in the region and third largest worldwide,
various phenomena had a combined effect. From an economic point of view,
the government’s measures to control infl ation by increasing interest rates
2

8 GROUPE SEBF i r s t - h a l f f i n a n c i a l r e p o r t
2011 MANAGEMENT REPORT2automatically caused a drop in lending. At the same time, the real remained
at a high level, encouraging the import of products manufactured in China
to the detriment of local industry. Finally, the unfavourable weather (with the
La Niña weather pattern affecting the entire region) had a highly negative
impact on the fan market. In this context, the Group recorded sales growth
of 9.4% at constant exchange rates (+12.4% at current exchange rates),
including a sharp drop in fans and food preparation, a category particularly
affected by the infl ux of inexpensive Chinese products. These diffi culties
were offset by very strong results for non-automatic washing machines,
spin dryers and irons, rapid growth for Dolce Gusto and the expansion
in haircare distribution. The Group also experienced a very good H1 in
cookware, resulting in its positions being strengthened. In H2, it will pursue
its strategy based on enhancing the complementary nature of its brands and
market-making. Meanwhile, it has greatly benefi ted from the expansion of
its directly-owned distribution network.
Colombia experienced a positive fi nancial dynamic. On a like-for-like basis,
excluding fans – which suffered from poor weather conditions – the Group’s
business recorded rapid growth in all product categories, especially in
food preparation and personal care. The Group was also supported by the
deployment of its stores under its own brand name. Imusa, consolidated
since 1 March, strengthened this dynamic and will allow synergies to be
achieved rapidly in both commercial and marketing terms.
Fortunes in the region’s other countries were more contrasting. In Venezuela,
the Group regained a local balance and returned to growth despite a diffi cult
political context. In Chile, in a very buoyant economic context, the Group
recorded a dynamic H1 combining successful launches, such as Actifry and
Fresh Express, and sales team successes.
The region’s black spot lies in Argentina, where the Group recorded a sudden
halt in small domestic appliance sales following the measures taken by
the government to block imports of electrical products. In this context, the
Group drew on existing stock and on its cookware business, which was not
affected by these measures.
In Asia-Pacifi c, sales increased by 21.5% at current exchange rates (+19.6%
at constant exchange rates), the result of an improvement across almost all
markets except Japan, which is going through a more diffi cult period. On this
market, sales were unchanged from H1 2010. The earthquake on 11 March
and its consequences have had a major impact on consumer spending and
behaviour, with buying focused in particular on certain categories of essential
products (mineral water, survival kits, fans, etc.). In this context, the Group
maintained its business level, with a particularly good dynamic in frying
pans and in food preparation. In Korea, the Group ended H1 in a position
of sustained growth and improved its ranking, particularly in the haircare
segment. This dynamic was rounded out by the success enjoyed by food
preparation (mini-blender dedicated to the market and handheld mixer),
coffee makers and toasters. In cookware, however, business slowed in the
face of aggressive local competition. In other countries in South-East Asia,
the Group continued its expansion, seeing particularly positive results in
Hong Kong, despite the non-renewal of a loyalty program, Thailand - which
is experiencing a period of sustained growth - and Singapore.
In China, on a still very lively small domestic equipment market, Supor
achieved a solid performance in H1, marked in particular by a buoyant
Q1. In cookware, growth was driven by woks, frying pans, steam cookers
(non-electrical) and, to a lesser extent, pressure cookers, which came
up against fierce competition from their electric counterparts. In small
domestic appliances, almost all categories experienced rapid growth and
Supor gained some market shares. Supor recorded marked success in rice
cookers, induction hobs, electric pressure cookers and kettles, driven by
new models. The expansion of the Supor Lifestores network also contributed
to this performance.
Finally, after two diffi cult years, the Group made a stark recovery in Australia.
Business was sustained by the successful deployment of our bestselling
products: Actifry, which benefi ted from signifi cant advertising support and
an effective viral marketing campaign, the Air Force upright vacuum cleaner
and Fresh Express in New Zealand.
In Central Europe, Russia and other countries (Turkey and the Middle
East, Africa, etc.), the economic indicators are positive and the recovery is
confi rmed on a number of markets. The Group thus achieved sales growth
of 11% at current exchange rates and 12.2% at constant exchange rates.
In Russia, the Group’s fi fth largest market, the economic context is favourable
and consumer spending is gradually increasing. The situation in distribution
has stabilised, although the concentrations observed recently have applied
increased pressure on commercial terms. During H1, the Group recorded a
sustained increase in activity and improved its ranking on a buoyant market,
reinforcing its leading position. Personal care (hairdryers and straighteners),
vacuum cleaners, food preparation (mincers) and Nespresso were the main
drivers of this growth. In Ukraine, consumer spending was very lively and
the market very healthy in H1. In this context, the Group outperformed the
market and recorded strong sales growth led by vacuum cleaners, cookware,
breadmakers, yoghurt makers and Dolce Gusto. In Poland, the economic
recovery was confi rmed and the market favourable, if highly competitive
and promotional. On this market, the Group achieved sustained sales
growth led by cookware, food preparation, the Air Force vacuum cleaner
and Dolce Gusto, benefi ting from enhanced advertising support. Markets
and consumer spending elsewhere in Central Europe were somewhat
lifeless, resulting in tougher requirements on the part of distributors (stock
management, commercial terms). The Group has nonetheless remained a key
player, particularly by implementing several loyalty programmes contributing
positively to sales.
In Turkey, the context was positive aside from a slowdown in Q2. Over the
half-year period, sales saw strong growth despite infl ation, the fall in the
value of the Turkish pound and the ongoing protectionist measures. The
Group was supported by both the power of its brands and its extensive
commercial presence, particularly through its Tefal Shops. In the rest of the
Near- and Middle-East, political crises had a limited impact on the Group’s
sales. With a small presence in the most affected countries, the Group also
benefi ted from sustained business in Saudi Arabia, driven mainly by Moulinex
food preparation, Actifry, irons and personal care, introduced at the end of
the period.

9F i r s t - h a l f f i n a n c i a l r e p o r tGROUPE SEB
2011 MANAGEMENT REPORT 2COMMENTS ON RESULTS
H1 2011 benefi ted from a relatively buoyant overall environment, but was
marked by an economic slowdown over the period which led to more
moderate consumer spending in a number of countries – mainly developed
markets – in Q2, after a particularly dynamic start to the year. For the Group,
business in the fi rst six months is not representative of the whole year, due
to the strong seasonality of sales in the fourth calendar quarter caused by
holiday periods. Nonetheless, it remained at a level of sustained growth over
the period, despite the basis having already been set very high in 2010. In
terms of currencies, volatility was still prevalent, but the fi nal net currency
effect was not material on sales, Q2 cancelling the positive effect recorded
over the fi rst three months of the year.
For the fi rst six months of 2011, the operating margin came to €155 million
(€168 million and €106 million in H1 2010 and 2009 respectively), representing
9% of sales versus 10.8% at 30 June 2010 and 7.7% at the end of June 2009.
Compared with the exceptionally high level recorded at 30 June 2010, this
result and this rate of 9% represent a good performance for the fi rst half
of the year.
On contrasting markets, we have adjusted our commercial policy in a
targeted manner, taking an annual perspective to managing growth, in
particular by strengthening our investments in growth drivers. This approach
had the following effects on the operating margin:
� a positive volume effect of €38 million, which was generated by market
share gains and allowed strong industrial activity and the effective
absorption of production costs;
� a price-product mix effect down by €27 million, neutralising the price
increases made and refl ecting more promotional markets, selling price
adjustments in some countries and the impact of the dynamic of new
economies on the mix;
� an increase of €22 million in investments in innovation, advertising and
marketing (mainly for the relaunch of the Moulinex brand in Europe) and
in the expansion of our store network.
Moreover, an excess cost of €25 million, created by an increase in prices of
metals and plastics, impacted upon our direct production purchases and
sourced products. This increase was partially offset by a currency effect of
+€21 million, which included the favourable impact on purchases of the fall
in the value of the dollar against the euro.
The change in the scope of consolidation originating in Imusa’s consolidation
since 1 March led to an impact of €2 million, whilst the Vietnamese company
Asia Fan will only be integrated in H2.
Operating profi t amounted to €152 million at the end of June, compared
with €141 million in H1 2010. The difference between the two periods was
mainly the result of a signifi cant change under ‘Other income and expenses’,
which increased from -€8 million to +€16 million. This was caused by the
near-absence of restructuring costs over the fi rst six months of 2011, and
the recognition of a substantial capital gain (€14 million) from the sale of a
plot of land in Brazil, which was fi nalised at the start of the fi nancial year.
Moreover, bonus and profi t-sharing schemes amounted to €19 million, in
line with H1 2010.
Net fi nancial expense, at -€7 million, was unchanged from H1 2010, with
the favourable impact related to the reduction in average debt (€178 million
versus €195 million a year ago) “offset” by an increase in the average fi nance
rate. This rate, net of the unfavourable mathematical impact of Supor’s cash
on the rate calculation, came to 5.41% in H1 2011 (4.84% in H1 2010).
Net profi t after tax came to €93 million (€89 million at 30 June 2010, after
a tax expense of €38 million, corresponding to a rate of 26.2%, comparable
with last year’s). Net profi t is also stated after deduction of the amount
referable to minority interests (Supor), which amounted to €13 million,
compared to €10 million in H1 2010, and refl ects the marked improvement
of business in China.
FINANCIAL STRUCTURE
At 30 June 2011, the Group posted a solid balance sheet and a healthy,
comfortable fi nancial position.
Shareholders’ equity in the Group at the end of June came to €1,561 million,
virtually unchanged from €1,571 million at 31 December 2010. This stability
was the result of various factors which had, however, contrasting effects:
� a positive profi t contribution for the period;
� negative translation adjustments in the amount of €54 million, caused
by the impact of the depreciation of currencies on the capital of several
subsidiaries, with the hardest-hit countries being China and Turkey;
� the payment of dividends (in the total sum of €67 million);
� €3 million in sales of SEB treasury stock to cover the exercise of stock
options (236,443 shares).
Meanwhile, net debt at 30 June 2011 came to €257 million (€208 million at
the end of June 2010), versus €131 million at the end of December 2010,
representing an increase of €126 million over the fi rst six months of the year.
This change is attributable to various trends. The positive factors included
the cashfl ow made available, the improved working capital requirement
(amounting to around €30 million), the income from the sale of a plot of
land in Brazil and sales of treasury stock. Payments out included tax, fi nance
costs, dividends paid and investments made (€58 million), as well as the
acquisitions of Imusa and Asia Fan. Under these conditions, the gearing
ratio amounted to 16.5%, compared with 8% at the end of December 2010.
The debt/EBITDA ratio, which refl ects the Group’s ability to pay off its debts,
increased from 0.28 at 31 December 2010 to 0.54 at 30 June 2011. The
Group is therefore still in a healthy, sound fi nancial position, with a structure
that is even further diversifi ed and extended following the bond issue carried
out in May.
2

10 GROUPE SEBF i r s t - h a l f f i n a n c i a l r e p o r t
2011 MANAGEMENT REPORT2OUTLOOK
In an overall climate in relatively good health, though with contrasting
fortunes between markets, Groupe SEB achieved a very satisfactory
performance level in H1 2011, even after the bar was set particularly high in
2010. Groupe SEB strengthened its positions on its markets, achieved
strong organic sales growth and maintained a solid operating margin,
despite a decrease compared with the record level achieved in H1 2010. It
is important to remember that H1 is not representative of the whole fi nancial
year and that the performance achieved over the fi rst six months cannot be
extrapolated over the entire year owing to the high seasonality of sales and
results during the last calendar four month period.
For the next few months, the Group does not anticipate any signifi cant
change to the economic climate, with the situation likely to remain contrasted
between stable demand in most mature markets and lively consumer
spending in emerging countries. However, the competitive and promotional
nature of the markets will doubtless continue to prevail across the board.
Furthermore, prices of raw materials are set to continue to rise, impacting
upon the Group’s purchases – especially of metals and plastics – despite
the hedging implemented on aluminium, copper and nickel. Currencies,
meanwhile, will most likely continue to be marked by the high volatility
that has affected various regions at various times over the past few years.
The Group’s purchases should continue to benefi t from the weakening of
the dollar against the euro, if it continues, in relation to both materials and
outsourced products.
Under these conditions, Groupe SEB is targeting further growth in turnover,
which will be driven by:
� organic growth originating in the product dynamic through the launch
throughout the year of more than 250 new products and models; the
effect of the relaunch of Moulinex in Europe; robust business in emerging
countries; market share gains;
� external growth, with the contributions from Imusa over ten months and
Asia Fan over six months.
The improvement in the operating margin value will be achieved through
organic growth, which is the primary driver, and through the appropriate
management of selling prices taking into account purchase prices, the level
of absorption of industrial costs and changes in exchange rates. The Group
will, as usual, keep a tight rein on all costs and will press ahead with the
initiatives undertaken in relation to indirect purchases. Nevertheless, it will
not sacrifi ce its investments in innovation or in market growth drivers (sales,
marketing and advertising).
The Group’s fi nancial structure will remain healthy and solid owing to the
large-scale debt reduction carried out over the past few years, a diversifi ed
fi nancing structure and extended debt maturity. It leaves signifi cant fi nancial
leeway, which should allow the Group to seize any acquisition opportunities
that may arise.
Though it must remain cautious, Groupe SEB can confi dently enter the
second half of the year and target continued growth in its sales and its
operating margin value for 2011.

11F i r s t - h a l f f i n a n c i a l r e p o r tGROUPE SEB
2011 FINANCIAL REPORT 3
CONSOLIDATED INCOME STATEMENT
(in € millions)2011
6 months2010
6 months2010
12 monthsRevenue (Note 3) 1,719.4 1,555.1 3,651.8
Operating expenses (Note 4) (1,564.3) (1,387.2) (3,213.9)
OPERATING MARGIN 155.1 167.9 437.9
Discretionary and non-discretionary profi t-sharing (Note 5) (19.1) (18.5) (50.4)
RECURRING OPERATING PROFIT 136.0 149.4 387.5
Other operating income and expense (Note 6) 15.7 (8.0) (38.5)
OPERATING PROFIT 151.7 141.4 349.0
Finance costs (Note 7) (6.4) (6.4) (12.0)
Other fi nancial income and expense (Note 7) (0.6) (0.6) (3.9)
Share of profi ts/(losses) of associates 0.0 0.0 0.0
PROFIT BEFORE TAX 144.7 134.4 333.1
Income tax expense (Note 8) (37.9) (35.3) (89.5)
PROFIT FOR THE PERIOD 106.8 99.1 243.6
Non-controlling interests (13.4) (9.8) (23.2)
PROFIT ATTRIBUTABLE TO OWNERS OF THE PARENT 93.3 89.3 220.4
EARNINGS PER SHARE (IN €)
Basic earnings per share 1.94 1.89 4.65
Diluted earnings per share 1.89 1.86 4.55
The accompanying Notes 1 to 14 are an integral part of these consolidated fi nancial statements.
CONSOLIDATED STATEMENT OF COMPREHENSIVE INCOME
(in € millions)2011
6 months2010
6 months2010
12 monthsPROFIT FOR THE PERIOD 106.8 99.1 243.6
Exchange differences on translating foreign operations (54.0) 162.9 111.6
Gains (losses) on cash fl ow hedges (2.7) (2.5) 7.6
OTHER COMPREHENSIVE INCOME (56.7) 160.4 119.2
COMPREHENSIVE INCOME 50.1 259.5 362.8
Non-controlling interests (3.3) (35.3) (39.0)
COMPREHENSIVE INCOME ATTRIBUTABLE TO OWNERS OF THE PARENT 46.8 224.2 323.8
2011 FINANCIAL REPORTCondensed consolidated fi nancial statements for the six months ended 30 June 2011
3

12 GROUPE SEBF i r s t - h a l f f i n a n c i a l r e p o r t
CONDENSED CONSOLIDATED FINANCIAL STATEMENTS3CONSOLIDATED BALANCE SHEET
ASSETS(in € millions) 30 June 2011 30 June 2010 31 December 2010Goodwill 417.8 450.4 409.1
Other intangible assets 414.0 416.3 398.7
Property, plant and equipment 448.9 426.3 426.5
Investments in associates 0.0 0.0 0.0
Other investments 11.6 0.5 0.6
Other non-current fi nancial assets 8.6 8.0 7.9
Deferred tax assets 50.0 60.0 40.2
Other non-current assets 7.7 6.7 4.2
Long-term derivative instruments 0.0 0.3 2.5
NON-CURRENT ASSETS 1,358.6 1,368.5 1,289.7
Inventories 752.7 641.4 635.5
Trade receivables 506.2 464.6 733.9
Other receivables 63.4 58.5 59.4
Current tax assets 35.4 6.8 26.8
Short-term derivative instruments 10.0 2.0 14.1
Cash and cash equivalents (Note 11) 475.0 226.2 236.6
CURRENT ASSETS 1,842.7 1,399.5 1,706.3
TOTAL ASSETS 3,201.3 2,768.0 2,996.0
EQUITY AND LIABILITIES(in € millions) 30 June 2011 30 June 2010 31 December 2010Share capital 50.0 50.0 50.0
Reserves and retained earnings 1,398.7 1,311,1 1,409.9
Treasury stock (Note 9) (55.7) (82.6) (61.7)
EQUITY ATTRIBUTABLE TO OWNERS OF THE PARENT 1,392.9 1,278.5 1,398.2
NON-CONTROLLING INTERESTS 168.5 169.4 173.1
EQUITY 1,561.4 1,447.9 1,571.3
Deferred tax assets 64.1 61.0 54.9
Long-term provisions (Note 10) 120.2 115.9 120.0
Long-term borrowings (Note 11) 536.6 201.2 201.8
Other non-current liabilities 26.3 25.0 23.7
Long-term derivative instruments 0.7 1.9 0.3
NON-CURRENT LIABILITIES 747.9 405.0 400.7
Short-term provisions (Note 10) 57.3 75.6 78.3
Trade payables 409.3 385.9 494.4
Other current liabilities 184.5 186.6 250.8
Current tax liabilities 35.2 20.3 24.6
Short-term derivative instruments 7.6 15.9 5.8
Short-term borrowings (Note 11) 198.1 230.8 170.1
CURRENT LIABILITIES 892.0 915.1 1,024.0
TOTAL EQUITY AND LIABILITIES 3,201.3 2,768.0 2,996.0
The accompanying Notes 1 to 14 are an integral part of these consolidated fi nancial statements.

13F i r s t - h a l f f i n a n c i a l r e p o r tGROUPE SEB
CONDENSED CONSOLIDATED FINANCIAL STATEMENTS 3CONSOLIDATED CASH FLOW STATEMENT
(in € millions)2011
6 months2010
6 months2010
12 monthsPROFIT ATTRIBUTABLE TO OWNERS OF THE PARENT 93.3 89.3 220.4
Depreciation, amortisation and impairment losses 48.4 47.8 117.6
Change in provisions (21.4) (12.7) (4.2)
Unrealised gains and losses on fi nancial instruments 4.7 3,0 (8.4)
Income and expenses related to stock options 2.8 3.2 6.2
Gains and losses on disposals of assets (14.3) 0,0 1.8
Other (0.2) (0.1) 0.0
Non-controlling interests 13.4 9.8 23.2
Current and deferred taxes 37.9 35.4 89.4
Finance costs, net 7.6 6.4 12.0
CASH FLOW (a) 172.2 182.1 458.0
Change in inventories (119.2) (127.5) (138.6)
Change in trade receivables 226.9 205.9 (67.4)
Change in trade payables (77.6) (44.5) 82.1
Change in other receivables and payables (68.6) (22.1) 35.0
Income taxes paid (45.0) (45.3) (100.9)
Interest paid (7.6) (6.4) (12.0)
NET CASH FROM OPERATING ACTIVITIES 81.1 142.2 256.2
Proceeds from disposals of assets 23.9 7.3 20.9
Purchases of property, plant and equipment (53.7) (52.3) (120.6)
Purchases of software and other intangible assets (13.9) (7.7) (20.2)
Purchases of fi nancial assets (0.3) 0.1 0.3
Acquisitions of subsidiaries, net of the cash acquired (53.1) 0.0 0.0
Effect of other changes in scope of consolidation 0.0 0.0 0.0
NET CASH USED BY INVESTING ACTIVITIES (97.1) (52.6) (119.6)
Change in long-term borrowings 336.7 (99.9) (99.3)
Change in short-term borrowings (29.5) (19.9) (80.1)
Proceeds from issue of share capital, including non-controlling interests 0.0 0.0 0.0
Change in treasury stock 3.2 18.9 33.4
Dividends paid, including to non-controlling shareholders (66.8) (55.9) (55.9)
NET CASH FROM/(USED BY) FINANCING ACTIVITIES 243.6 (156.8) (201.9)
Effect of changes in foreign exchange rates 10.8 (14.3) (5.8)
NET INCREASE/(DECREASE) IN CASH AND CASH EQUIVALENTS 238.4 (81.6) (71.2)
Cash and cash equivalents at beginning of period 236.6 307.8 307.8
Cash and cash equivalents at end of period 475.0 226.2 236.6
(a) Before interest and income taxes paid.
3

14 GROUPE SEBF i r s t - h a l f f i n a n c i a l r e p o r t
CONDENSED CONSOLIDATED FINANCIAL STATEMENTS3CONSOLIDATED STATEMENT OF CHANGES IN EQUITY
(in € millions)Share
capital
Share premium account
Reserves and
retained earnings
Translation reserve
Treasury stock
Equity attributable
to owners of the
parent
Non-controlling
interests Equity
AT 1 JANUARY 2010 50.0 78.9 1,022.7 38.5 (108.8) 1,081.3 138.8 1,220.1
Profi t for the period 89.3 89.3 9.8 99.1
Other comprehensive income (2.5) 137.3 134.8 25.5 160.3
COMPREHENSIVE INCOME 86.8 137.3 224.1 35.3 259.4
Dividends paid (51.2) (51.2) (4.7) (55.9)
Issue of share capital
Changes in treasury stock 26.2 26.2 26.2
Gains (losses) on sales of treasury stock, after tax (4.8) (4.8) (4.8)
Exercise of stock options 3.2 3.2 3.2
Other movements (0.3) (0.3) (0.3)
AT 30 JUNE 2010 50.0 78.9 1,056.4 175.8 (82.6) 1,278.5 169.4 1,447.9
Profi t for the period 131.1 131.1 13.4 144.5
Other comprehensive income 10.1 (41.5) (31.4) (9.7) (41.1)
COMPREHENSIVE INCOME 141.2 (41.5) 0.0 99.7 3.7 103.4
Dividends paid
Issue of share capital
Changes in treasury stock 20.9 20.9 20.9
Gains (losses) on sales of treasury stock, after tax (4.2) (4.2) (4.2)
Exercise of stock options 3.0 3.0 3.0
Other movements (1.1) 1.4 0.3 0.3
AT 31 DECEMBER 2010 50.0 78.9 1,195.3 135.7 (61.7) 1,398.2 173.1 1,571.3
Profi t for the period 93.3 93.3 13.4 106.8
Other comprehensive income (2.7) (43.8) (46.5) (10.2) (56.7)
COMPREHENSIVE INCOME 90.6 (43.8) 0.0 46.8 3.3 50.1
Dividends paid (58.4) (58.4) (8.1) (66.5)
Issue of share capital 0.0 0.0
Changes in treasury stock 5.9 5.9 5.9
Gains (losses) on sales of treasury stock, after tax (1.8) (1.8) (1.8)
Exercise of stock options 2.8 2.8 2.8
Other movements (0.7) (0.7) 0.2 (0.5)
AT 30 JUNE 2011 50.0 78.9 1,227.9 91.9 (55.8) 1,392.9 168.5 1,561.4

15F i r s t - h a l f f i n a n c i a l r e p o r tGROUPE SEB
CONDENSED CONSOLIDATED FINANCIAL STATEMENTS 3NOTES TO THE CONDENSED CONSOLIDATED FINANCIAL STATEMENTS
RESULTS FOR THE SIX MONTHS ENDED 30 JUNE 2011, IN € MILLIONS
Groupe SEB, comprising SEB S.A. and its subsidiaries, is a world leader
in the design, manufacture and sale of cookware and small domestic
equipment, such as pressure cookers, coffee machines, kettles and food
preparation appliances, irons and steam generators, and vacuum cleaners.
SEB S.A.’s registered office is at Chemin du Petit Bois, Ecully (69130
Rhône, France). The Company is listed on Eurolist by Euronext Paris (ISIN
FR0000121709).
The condensed consolidated fi nancial statements for the fi rst half of 2011
were approved by the Board of Directors on 22 July 2011.
NOTE 1 SUMMARY OF SIGNIFICANT ACCOUNTING POLICIES
The condensed interim consolidated fi nancial statements for the six months
ended 30 June 2011 have been prepared in accordance with IAS 34 – Interim
Financial Reporting. They do not include all the disclosures required in a full
set of annual fi nancial statements under IFRS and should therefore be read
in conjunction with the annual consolidated fi nancial statements for the
year ended 31 December 2010, which are included in the 2010 Registration
Document fi led with the French securities regulator (AMF) on 7 April 2011.
The Registration Document may be downloaded from the Group’s website
(www.groupeseb.com) and the AMF website (www.amf-france.org), and is
available on request from the Groups registered offi ce at the above address.
The condensed interim consolidated financial statements have been
prepared in accordance with the IFRSs, IASs and related interpretations
adopted by the European Union and applicable at 30 June 2011,
which can be found on the European Commission’s website
(http:// ec. europa. eu / internal_ market/ accounting/ias/index_en.htm).
The accounting policies applied to prepare these financial statements
are unchanged compared with those used to prepare the 2010 annual
consolidated financial statements except for income tax expense and
discretionary and non-discretionary employee profi t-sharing, which are
calculated on the basis of full-year projections (see Note 8 – Income tax,
and Note 5 – Discretionary and non-discretionary profi t sharing). In addition,
the comparability of the interim and annual fi nancial statements may be
affected by the seasonal nature of the Group’s activities, which results in
higher sales in the second half of the year.
The following standards, amendments and interpretations applicable since
1 January 2011 have no material impact on the Group’s fi nancial statements:
� IAS 24 (revised) – Related Party Disclosures;
� Amendment to IAS 32 – Classifi cation of Rights Issues;
� Amendment to IFRS 1 – Limited Exemption from Comparative IFRS 7
Disclosures for First-time Adopters;
� Amendment to IFRIC 14 – Prepayments of a Minimum Funding
Requirement;
� IFRIC 19 – Extinguishing Financial Liabilities with Equity Instruments.
The Group chose not to early apply the standards and interpretations whose
application was optional at 30 June 2011. However, it does not expect their
application to have a material impact on the fi nancial statements.
NOTE 2 CHANGES IN THE SCOPE OF CONSOLIDATION
2.1 IMUSA
On 28 February 2011, Groupe SEB completed its acquisition of Colombia-
based Imusa following the successful takeover bid launched for the company
and its delisting from the Bogota stock exchange. At that date, Groupe SEB
held almost 99% of Imusa’s shares.
Description of the company
Specialised in small household equipment, Imusa manufactures and markets
cookware (which accounts for two-thirds of its sales) as well as plastic food
containers and household products. The company holds forefront positions
in Colombia and has expanded its business to foreign markets, in particular
other Latin American countries and the United States. Imusa employs around
1,000 people and operates two manufacturing sites – at Copacabana and
Rionegro in Colombia – as well as a dozen stores located across the country.
3

16 GROUPE SEBF i r s t - h a l f f i n a n c i a l r e p o r t
CONDENSED CONSOLIDATED FINANCIAL STATEMENTS3In 2010, Imusa reported revenue of around €89 million, an increase of more than 30% compared with 2009 based on current exchange rates.
At 30 June 2011, the provisional estimate of the net fair value of Imusa’s identifi able assets and liabilities when Groupe SEB acquired control of the company
on 28 February 2011 was as follows:
(in € millions) 28 Feb. 2011Non-current assets (a) 55.5
Inventories 16.9
Trade and other receivables 19.3
Net debt (53.3)
Trade and other payables (6.6)
Other liabilities (including deferred taxes) (19.0)
TOTAL NET ASSETS 12.8
PERCENT INTEREST 99%
NET ASSETS ACQUIRED 12.7
Non-controlling interests 0.1
CASH OUTFLOW FOR THE IMUSA ACQUISITION 44.2
Goodwill 31.4
(a) Including the value of the “Imusa in Colombia” and “Imusa in the USA” brands, independently valued at €20 million and €5.3 million respectively.
The goodwill arising on the acquisition – recognised in accordance with the
partial goodwill method – corresponds mainly to market shares and projected
synergies, particularly in terms of manufacturing, supply chain operations
and product development, that cannot be separately identifi ed.
Imusa’s contribution to the Group’s revenue in fi rst-half 2011 amounted to
€32 million.
2.2 OTHER TRANSACTIONS IN FIRST-�HALF 2011
Acquisition of a controlling interest in Asia Fan
In May 2011, Groupe SEB acquired a controlling interest in Asia Fan,
Vietnam’s leading electric fan company. Following the transaction, Groupe
SEB now holds a 65% interest in Asia Fan, with 30% still held by the
company’s founding family and 5% by its employees.
In 2010, Asia Fan reported revenue of around €11 million. It has two
manufacturing sites and employs 700 people.
Asia Fan was not consolidated at 30 June 2011 as the timeframe between
the acquisition date and Groupe SEB’s interim reporting date was too short to
integrate Asia Fan’s fi nancial statements. Consequently, the Group’s interest
in Asia Fan is presented under “Other investments” in the consolidated
balance sheet. Groupe SEB does not consider that its consolidated fi nancial
statements for the six months ended 30 June 2011 were materially affected
by the fact that Asia Fan’s operations and assets and liabilities were not
included in the scope of consolidation at that date.
Acquisition of a stake in Key Ingredient
To prepare for coming changes in the small domestic equipment market
and extend its innovation strategy to new technologies and expertise
from outside the Company, Groupe SEB has created an investment fund
– SEB Alliance – with initial capital of €30 million. The fund will serve as a
technology watch as well as an investment unit.
SEB Alliance made its fi rst investment in the area of digital and connected
products, by acquiring a majority stake in US-based Key Ingredient.
Key Ingredient is a US start-up, based in Austin, Texas and specialises in
the development of digital cooking solutions.
In 2010 it generated revenue of less than €1 million. In view of this
non- material amount Key Ingredient was not consolidated by the Group.
Acquisition of an additional interest in Supor
In fi rst-half 2011, the founding shareholders of China-based Supor – which
is already 51.3%-owned by Groupe SEB – stated that they wished to sell
20% of the company’s shares, and Groupe SEB indicated that it wished to
acquire this additional interest.
Consequently, the Group has signed a share purchase agreement in which it
has undertaken to purchase 115,450,400 Supor shares from the company’s
founding shareholders at a price of RMB 30 per share. The total cost of the
transaction will amount to RMB 3,464 million, representing approximately
€371 million based on the exchange rate at 30 June 2011. The transaction
was approved by Supor’s Board of Directors on 16 February 2011 and by
its shareholders in a General Meeting held on 4 March 2011.
The Chinese Ministry of Commerce (MOFCOM) has not issued any objections
to the completion of the transaction but it is still subject to a number of
authorisations, notably from the China Securities Regulatory Commission
(CSRC) and consequently it could still take several months for the acquisition
to be completed.
Merger of Groupe SEB Mexicana and Vistar
The two Mexican entities Groupe SEB Mexicana and Vistar were merged
during the fi rst half of 2011. The operation did not have any impact on the
consolidated fi nancial statements as it was a simple legal restructuring.

17F i r s t - h a l f f i n a n c i a l r e p o r tGROUPE SEB
CONDENSED CONSOLIDATED FINANCIAL STATEMENTS 3NOTE 3 SEGMENT INFORMATION
In accordance with IFRS 8 – Operating Segments, the information presented
below for each operating segment is the same as the information presented
to the chief operating decision makers (Executive Committee members)
for the purposes of assessing the segments’ performance and allocating
resources.
The internal reports reviewed and used by the chief operating decision
makers present such data by geographical segment. The Executive
Committee assesses each segment’s performance based on:
� revenue and operating profi t;
� net invested capital, defined as the segment’s assets (goodwill,
property, plant and equipment and intangible assets, inventories and
trade receivables) less its liabilities (trade payables, other payables and
provisions).
Performance in terms of fi nancing and cash fl ow as well as income tax
treatment are tracked at Group level, not by operating segment.
3.1. GEOGRAPHICAL SEGMENT INFORMATION (BY LOCATION OF ASSETS)
30 June 2011(in € millions) France
Other Western European
countries (a) North America South America Asia-Pacifi c
Central Europe, Russia
and other countries
Intra-group transactions Total
Revenue
Inter-segment revenue 290.6 333.6 164.4 189.7 430.7 278.4 1,687.4
External revenue 242.5 18.9 0.3 6.3 324.2 54.0 (614.2) 32.0
TOTAL REVENUE 533.1 352.5 164.7 196.0 754.9 332.4 (614.2) 1,719.4
Profi t/(loss)
Operating margin 49.9 11.1 (11.0) 9.9 87.9 41.4 (34.1) 155.1
Operating profi t/(loss) 21.0 3.7 (10.4) 17.7 82.7 37.0 151.7
Finance costs and other fi nancial income and expense, net (7.0)
Share of profi t of associates
Income tax expense (37.9)
PROFIT FOR THE PERIOD 106.8
Balance sheet
Segment assets 600.4 375.3 345.1 436.2 903.4 240.1 (289.9) 2,610.6
Financial assets 505.2
Tax assets 85.5
TOTAL ASSETS 3,201.3
Segment liabilities 351.6 215.0 53.8 112.3 185.4 109.5 (230.0) 797.6
Borrowings 742.9
Tax liabilities 99.3
Equity 1,561.4
TOTAL EQUITY AND LIABILITIES 3,201.3
Other information
Capital expenditure and purchases of intangible assets 31.5 3.0 2.5 11.6 18.6 0.5 67.7
Depreciation and amortisation expense 26.5 4.0 1.9 6.2 9.0 0.8 48.4
Impairment losses 0.0
(a) “Other Western European countries” correspond to the 15 countries other than France comprising the pre-enlargement European Union. The new EU countries are included
in the “Central Europe, Russia and other countries” segment.
3
18 GROUPE SEBF i r s t - h a l f f i n a n c i a l r e p o r t
CONDENSED CONSOLIDATED FINANCIAL STATEMENTS3
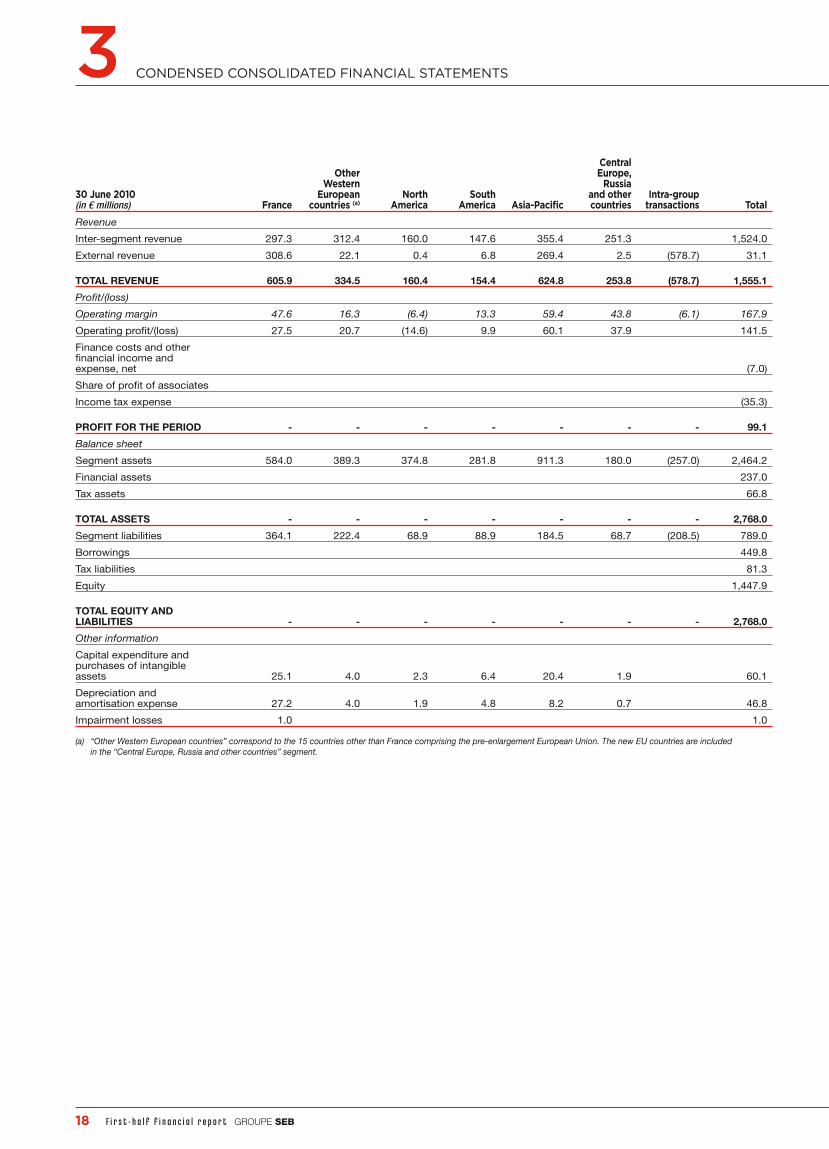
30 June 2010(in € millions) France
Other Western
European countries (a)
North America
South America Asia-Pacifi c
Central Europe,
Russia and other countries
Intra-group transactions Total
Revenue
Inter-segment revenue 297.3 312.4 160.0 147.6 355.4 251.3 1,524.0
External revenue 308.6 22.1 0.4 6.8 269.4 2.5 (578.7) 31.1
TOTAL REVENUE 605.9 334.5 160.4 154.4 624.8 253.8 (578.7) 1,555.1
Profi t/(loss)
Operating margin 47.6 16.3 (6.4) 13.3 59.4 43.8 (6.1) 167.9
Operating profi t/(loss) 27.5 20.7 (14.6) 9.9 60.1 37.9 141.5
Finance costs and other fi nancial income and expense, net (7.0)
Share of profi t of associates
Income tax expense (35.3)
PROFIT FOR THE PERIOD - - - - - - - 99.1
Balance sheet
Segment assets 584.0 389.3 374.8 281.8 911.3 180.0 (257.0) 2,464.2
Financial assets 237.0
Tax assets 66.8
TOTAL ASSETS - - - - - - - 2,768.0
Segment liabilities 364.1 222.4 68.9 88.9 184.5 68.7 (208.5) 789.0
Borrowings 449.8
Tax liabilities 81.3
Equity 1,447.9
TOTAL EQUITY AND LIABILITIES - - - - - - - 2,768.0
Other information
Capital expenditure and purchases of intangible assets 25.1 4.0 2.3 6.4 20.4 1.9 60.1
Depreciation and amortisation expense 27.2 4.0 1.9 4.8 8.2 0.7 46.8
Impairment losses 1.0 1.0
(a) “Other Western European countries” correspond to the 15 countries other than France comprising the pre-enlargement European Union. The new EU countries are included
in the “Central Europe, Russia and other countries” segment.

19F i r s t - h a l f f i n a n c i a l r e p o r tGROUPE SEB
CONDENSED CONSOLIDATED FINANCIAL STATEMENTS 3
31 December 2010(in € millions) France
Other Western
European countries (a)
North America
South America Asia-Pacifi c
Central Europe,
Russia and other countries
Intra-group transactions Total
Revenue
Inter-segment revenue 711.7 770.7 386.8 344.1 660.2 614.2 3,487.7
External revenue 635.9 46.5 0.8 12.1 756.2 6.4 (1,293.8) 164.1
TOTAL REVENUE 1,347.9 817.2 387.6 356.2 1,416.4 620.6 (1,293.8) 3,651.8
Profi t/(loss)
Operating margin 160.4 44.2 (8.8) 24.7 118.3 106.0 (6.9) 437.9
Operating profi t/(loss) 87.0 47.1 (23.6) 20.8 119.8 100.6 349.0
Finance costs and other fi nancial income and expense, net (15.9)
Share of profi t of associates
Income tax expense (89.5)
PROFIT FOR THE PERIOD - - - - - - - 243.6
Balance sheet
Segment assets 637.9 469.1 339.4 303.6 961.1 241.3 (285.1) 2,667.3
Financial assets 261.7
Tax assets 67.0
TOTAL ASSETS - - - - - - - 2,996.0
Segment liabilities 425.1 279.1 54.7 100.2 239.9 109.0 (240.8) 967.2
Borrowings 378.0
Tax liabilities 79.5
Equity 1,571.3
TOTAL EQUITY AND LIABILITIES - - - - - - - 2,996.0
Other information
Capital expenditure and purchases of intangible assets 59.4 7.4 5.0 19.1 47.2 2.7 140.8
Depreciation and amortisation expense 59.9 8.2 3.8 9.1 17.4 1.6 100.0
Impairment losses 3.6 14.7 18.3
(a) “Other Western European countries” correspond to the 15 countries other than France comprising the pre-enlargement European Union. The new EU countries are included in the
“Central Europe, Russia and other countries” segment.
Inter-segment revenue corresponds to sales to external customers located
within the geographical segment.
External revenue corresponds to total sales (within the Group and to external
customers) generated outside the geographical segment by companies
within the geographical segment.
Intra-group transactions are carried out on an arm’s length basis.
3

20 GROUPE SEBF i r s t - h a l f f i n a n c i a l r e p o r t
CONDENSED CONSOLIDATED FINANCIAL STATEMENTS33.2. REVENUE BY GEOGRAPHICAL LOCATION OF THE CUSTOMER
(in € millions)2011
6 months2010
6 months2010
12 monthsFrance 290.6 297.3 711.7
Other Western European countries (a) 341.3 322.6 786.9
North America 172.0 166.8 404.4
South America 190.0 148.6 345.7
Asia-Pacifi c 433.2 356.7 764.0
Central Europe, Russia and other countries 292.2 263.1 639.1
TOTAL 1,719.4 1,555.1 3,651.8
(a) “Other Western European countries” correspond to the 15 countries other than France comprising the pre-enlargement European Union. The new EU countries are included in the
“Central Europe, Russia and other countries” segment.
NOTE 4 OPERATING EXPENSES
(in € millions)2011
6 months2010
6 months2010
12 monthsCost of sales (1,041.3) (906.7) (2,146.6)
Research and development costs (29.4) (27.8) (60.0)
Advertising expense (55.7) (46.2) (143.0)
Distribution and administrative expenses (438.0) (406.5) (864.3)
OPERATING EXPENSES (1,564.4) (1,387.2) (3,213.9)
NOTE 5 DISCRETIONARY AND NON-DISCRETIONARY PROFIT-SHARING
Discretionary and non-discretionary profi t-sharing for fi rst-half 2011 has been calculated by multiplying the estimated annual cost by the percentage of annual
profi t generated during the period by the companies concerned.

21F i r s t - h a l f f i n a n c i a l r e p o r tGROUPE SEB
CONDENSED CONSOLIDATED FINANCIAL STATEMENTS 3NOTE 6 OTHER OPERATING INCOME AND EXPENSE
(in € millions)2011
6 months2010
6 months2010
12 monthsRestructuring costs (2.1) (8.7) (15.0)
Impairment losses 0.0 (1.0) (18.4)
Gains and losses on asset disposals and other 17.8 1.7 (5.1)
OTHER OPERATING INCOME AND EXPENSE 15.7 (8.0) (38.5)
(in € millions)2011
6 months2010
6 months2010
12 monthsFINANCE COSTS (6.4) (6.4) (12.0)
Interest cost on long-term employee benefi t obligations (2.3) (2.7) (5.6)
Exchange gains and losses 3.3 3.3 4.8
Income and expenses from fi nancial instruments (1.9) (1.0) (0.1)
Other 0.3 (0.2) (3.0)
OTHER FINANCIAL INCOME AND EXPENSE, NET (0.6) (0.6) (3.9)
6.1. RESTRUCTURING COSTS
First-half 2011 restructuring costs mainly comprised €0.8 million for the
restructuring of sales forces in Argentina and a further €0.8 million for a
production capacity adjustment plan set up in Brazil.
In the fi rst six months of 2010, restructuring costs included €5.1 million for
restructuring of sales forces in Brazil and an additional €3.3 million provision
set aside for the early retirement plan in France.
In full-year 2010 the above-mentioned restructuring in Brazil and the early
retirement plan in France represented restructuring costs of €6.5 million and
€4.8 million respectively.
6.2. IMPAIRMENT LOSSES
Due to the seasonal nature of the business, impairment tests are conducted
regularly at the year-end. The carrying amounts of brands and recognised
goodwill were reviewed at 30 June 2011 to determine whether there were
any indications that they may be impaired.
No indications of impairment of these assets were identifi ed.
At 30 June 2010, an additional €1.0 million impairment loss was recognised
on the Mayenne Beverage CGU.
The main impairment losses recognised at 31 December 2010 concerned
All- Clad goodwill (€14.7 million) and the manufacturing assets of the Scales
plant (€3.6 million).
6.3. GAINS AND LOSSES ON ASSET DISPOSALS AND OTHER
The main gains recorded under this item in fi rst-half 2011 were €14.8 million
in proceeds from the sale of Plant 3 in Brazil and €1.5 million in compensation
received in settlement of the Pentalpha dispute (see Note 12 Signifi cant
events and litigation for further details).
In fi rst-half 2010 this item included €1.9 million in compensation received by
the Group in settlement of a dispute with one of its suppliers.
NOTE 7 FINANCE COSTS AND OTHER FINANCIAL INCOME AND EXPENSE, NET
The interest cost on long-term employee benefi t obligations corresponds
to the difference between the discounting adjustment for the year – arising
from the fact that benefi t payments are one year closer to being paid –
and the expected return on the corresponding plan assets. Discounting
adjustments to other long-term liabilities and provisions are also included
under this caption.
Exchange gains and losses on foreign currency transactions are included
in operating margin.
Gains and losses on hedges of foreign currency borrowings are reported
under “Other fi nancial income and expense”.
Income and expenses from fi nancial instruments correspond mainly to
amortisation of the time value of commodity hedges.
3

22 GROUPE SEBF i r s t - h a l f f i n a n c i a l r e p o r t
CONDENSED CONSOLIDATED FINANCIAL STATEMENTS3NOTE 8 INCOME TAXES
Income tax expense for the period was calculated by multiplying consolidated
pre-tax profi t by the estimated average effective tax rate for the year. The
calculation was performed separately for each tax entity.
The following table provides a reconciliation between the effective tax rate
of 26.2% and the statutory French tax rate of 34.43%, which is unchanged
from 2010:
(in %)2011
6 months2010
6 months2010
12 monthsSTATUTORY FRENCH TAX RATE 34.4 34.4 34.4
Effect of different tax rates (a) (9.5) (7.6) (8.4)
Unrecognised and unrelieved tax loss carryforwards (b) 1.5 0.3 2.0
Prior-period tax loss carryforwards recognised and utilised during the period (c) (2.0) (1.9) (4.0)
Other (d) 1.7 1.1 2.9
EFFECTIVE TAX RATE 26.2 26.3 26.9
(a) The effect of different tax rates varies depending on France’s contribution to consolidated profi t.
(b) Unrecognised and unrelieved tax loss carryforwards mainly concerned the United States and the United Kingdom.
(c) Prior-period tax loss carryforwards recognised and utilised during the period mainly relate to Spain and Germany.
(d) The caption “Other” primarily include taxes on distributed earnings and provisions for tax audits and, for full-year 2010, the impact of the non-deductibility of the impairment loss on
All-Clad goodwill (1.5%).
NOTE 9 TREASURY STOCK
At 30 June 2011, the share capital was made up of 49,951,826 shares with
a par value of €1 each.
In fi rst-half 2011, the Group bought back 83,280 SEB shares on the market
at a weighted average price of €66.60 and sold 270,158 shares on the market
at an average price of €32.45.
At 30 June 2011, the Group held 1,793,820 shares in treasury (2,489,625 at
30 June 2010 and 1,980,698 at 31 December 2010), acquired at an average
price of €31.04 (€33.16 at 30 June 2010 and €31.14 at 31 December 2010).
Movements in fi rst-half 2011, fi rst-half 2010 and full-year 2010 were as follows:
(in number of shares)
Transactions
First-half 2011 First-half 2010 Full-year 2010Shares held in treasury at 1 January 1,980,698 3,149,443 3,149,443
Purchases
Buyback plan 47,361
Liquidity contract 35,919 107,697 264,329
Sales
Shares sold on the market (33,715) (116,345) (279,525)
Shares allocated on exercise of stock options (236,443) (651,170) (1,153,549)
Shares cancelled during the period
SHARES HELD IN TREASURY AT PERIOD-END 1,793,820 2,489,625 1,980,698

23F i r s t - h a l f f i n a n c i a l r e p o r tGROUPE SEB
CONDENSED CONSOLIDATED FINANCIAL STATEMENTS 3NOTE 10 PROVISIONS
(in € millions)
30 June 2011 30 June 2010 31 December 2010
Long-term Short-term Long-term Short-term Long-term Short-termPension and other post-employment benefi t obligations 81.7 5.6 78.2 8.4 78.0 6.0
Product warranties 2.7 25.2 3.6 29.1 3.0 31.8
Claims and litigation and other contingencies 22.1 17.8 21.3 14.8 25.0 25.5
Restructuring provisions 13.6 8.7 12.8 23.3 14.0 15.0
TOTAL 120.1 57.3 115.9 75.6 120.0 78.3
Provisions are classifi ed as short-term or long-term according to whether the obligation is expected to be settled within or beyond one year.
Provision movements (other than provisions for pensions and other post-employment benefi ts) were as follows:
(in € millions) 1 January 2011 Increases Reversals UtilisationsOther
movements (a) 30 June 2011Product warranties 34.9 5.7 4.3 7.8 (0.6) 27.9
Claims and litigation and other contingencies 50.4 4.2 4.4 9.4 (0.8) 40.0
Restructuring provisions 29.0 1.0 0.5 7.0 (0.2) 22.3
TOTAL 114.3 10.9 9.2 24.2 (1.6) 90.2
(a) “Other movements” include translation adjustments and the effect of changes in the scope of consolidation.
(in € millions) 1 January 2010 Increases Reversals UtilisationsOther
movements (a) 30 June 2010Product warranties 39.0 9.1 1.6 13.5 (0,3) 32.7
Claims and litigation and other contingencies 32.0 16.8 2.6 14.8 4.8 36.1
Restructuring provisions 43.3 6.4 2.1 12.0 0.5 36.1
TOTAL 114.3 32.3 6.3 40.3 5.0 104.9
(a) “Other movements” include translation adjustments and the effect of changes in the scope of consolidation.
(in € millions) 1 January 2010 Increases Reversals UtilisationsOther
movements (a) 31 December 2010Product warranties 39.0 24.7 1.1 26.4 (1.3) 34.9
Claims and litigation and other contingencies 32.0 25.1 1.7 9.7 4.7 50.4
Restructuring provisions 43.3 8.4 4.5 18.8 0.6 29.0
TOTAL 114.3 58.2 7.3 54.9 4.0 114.3
(a) “Other movements” include translation adjustments and the effect of changes in the scope of consolidation.
Restructuring provisions break down as follows:
(in € millions) 30 June 2011 30 June 2010 31 December 2010Severance costs 17.8 27.4 22.8
Site closure costs 4.5 8.7 6.2
TOTAL 22.3 36.1 29.0
3

24 GROUPE SEBF i r s t - h a l f f i n a n c i a l r e p o r t
CONDENSED CONSOLIDATED FINANCIAL STATEMENTS3NOTE 11 NET DEBT
NOTE 12 SIGNIFICANT EVENTS AND LITIGATION
SALE OF PLANT 3 IN BRAZIL
In August 2008, Groupe SEB do Brasil signed an agreement to sell Plant 3
in São Paulo, Brazil. The sale was conditional upon the Group providing the
purchaser with a decontamination certifi cate. The site was decontaminated
in 2009 and 2010.
On 4 February 2011, Group SEB do Brasil received a partial payment of
€14.8 million in respect of the sale. The balance of €1.8 million has been
retained by the purchaser in guarantee of full and complete decontamination
of the surrounding land. The site’s carrying amount, including decontamination
expenses, was €3.2 million at 31 December 2010.
The capital gain generated on this transaction and recorded in the fi nancial
statements for the six months ended 30 June 2011 came to €14.2 million.
PENTALPHA DISPUTE
On 31 May 2011 the US Supreme Court ruled in Groupe SEB’s favour on an
appeal lodged by Pentalpha concerning the patent infringement suit fi led
against Pentalpha relating to deep fryers in the United States. Consequently,
the $5.1 million in damages (including interest) received in August 2010 were
recognised as income in the fi rst-half 2011 fi nancial statements.
RENEGOTIATION OF THE SYNDICATED LOAN
The unused €456.1 million syndicated loan due in 2011 was renegotiated with
the banking pool, which comprises BNP Paribas, Citibank, Commerzbank,
Crédit Agricole, HSBC, Natixis and Société Générale. The new loan has a
nominal amount of €560 million and a fi ve-year term.
BOND ISSUE
On 26 May 2011, the Group launched its fi rst bond issue, representing a
total amount of €300 million. The bonds have a fi ve-year term maturing on
3 June 2016 and pay interest at an annual rate of 4.5%. The lead managers
for the issue were BNP Paribas, Crédit Agricole CIB, Natixis and Société
Générale. The bonds have been admitted to trading on the NYSE Euronext
Paris stock exchange.
There were no other signifi cant developments in fi rst-half 2011 concerning
litigation involving the Group.
(in € millions) 30 June 2011 30 June 2010 31 December 2010Bonds 297.8
Bank borrowings 199.8 171.0 171.0
Finance lease liabilities 3.0 2.7 1.6
Other 2.0 1.5 1.9
Non-discretionary profi t sharing liability 34.0 26.0 25.4
LONG-TERM BORROWINGS 536.6 201.2 199.9
Bank borrowings 110.7 110.6 53.8
Commercial paper 69.0 100.0 100.0
Current portion of long-term borrowings 18.3 20.2 18.2
SHORT-TERM BORROWINGS 198.0 230.8 172.0
TOTAL BORROWINGS 734.6 432.0 371.9
Cash and cash equivalents, net (475.0) (226.2) (236.6)
Derivative instruments, net (2.9) 2.0 (4.2)
NET DEBT 256.7 207.8 131.1
Net debt corresponds to total long and short-term borrowings less cash and cash equivalents and derivative instruments acquired as hedges of debt that
mature in less than one year and are readily convertible into cash.

25F i r s t - h a l f f i n a n c i a l r e p o r tGROUPE SEB
CONDENSED CONSOLIDATED FINANCIAL STATEMENTS 3NOTE 13 RELATED PARTY TRANSACTIONS
3
NOTE 14 SUBSEQUENT EVENTS
No stock options were granted in the fi rst half of 2011.
No material transactions with related parties took place during the period and there were no changes in the nature of transactions as described in Note 30
to the consolidated fi nancial statements in the 2010 Registration Document.
No material events occurred between the date these fi nancial statements were drawn up and 22 July 2011 when they were approved by the Board of Directors.

26 GROUPE SEBF i r s t - h a l f f i n a n c i a l r e p o r t
CONDENSED CONSOLIDATED FINANCIAL STATEMENTS3STATUTORY AUDITORS’ REVIEW REPORT
ON THE FIRST HALF YEAR FINANCIAL INFORMATION FOR 2011
This is a free translation into English of the Statutory auditors’ report issued in French and is provided solely for the convenience of English speaking users.
This report should be read in conjunction and construed in accordance with French law and professional auditing standards applicable in France.
To the shareholders,
In compliance with the assignment entrusted to us by your Annual General Meeting and in accordance with the requirements of Article L. 451-1-2 III of the
Monetary and Financial Code (Code Monétaire et Financier), we hereby report to you on:
� the review of the accompanying condensed half-year consolidated fi nancial statements of SEB S.A., for the period from 1 January 2011 to 30 June 2011;
� the verifi cation of the information contained in the interim management report.
These condensed half-year consolidated fi nancial statements are the responsibility of the Board of Directors. Our role is to express a conclusion on these
fi nancial statements based on our review.
1. Conclusion on the fi nancial statements
We conducted our review in accordance with professional standards applicable in France.
A review of interim fi nancial information consists of making inquiries, primarily of persons responsible for fi nancial and accounting matters, and applying
analytical and other review procedures. A review is substantially less in scope than an audit conducted in accordance with professional standards applicable
in France and consequently does not enable us to obtain assurance that we would become aware of all signifi cant matters that might be identifi ed in an
audit. Accordingly, we do not express an audit opinion.
Based on our review, nothing has come to our attention that causes us to believe that the accompanying condensed half-year consolidated fi nancial statements
are not prepared, in all material respects, in accordance with IAS 34 standard of the IFRSs as adopted by the European Union applicable to interim fi nancial
information.
2. Specifi c verifi cation
We have also verifi ed the information given in the interim management report commenting the condensed half-year consolidated fi nancial statements subject
to our review.
We have no matters to report as to its fair presentation and consistency with the condensed half-year consolidated fi nancial statements.
Lyon and Villeurbanne, 25 July 2011
The Statutory auditors
PricewaterhouseCoopers Audit
Bernard RASCLE
Deloitte & Associés
Dominique VALETTE

27F i r s t - h a l f f i n a n c i a l r e p o r tGROUPE SEB
CONDENSED CONSOLIDATED FINANCIAL STATEMENTS 3STATEMENT BY THE PERSON RESPONSIBLE FOR THE INTERIM FINANCIAL REPORT
I declare that, to the best of my knowledge,
� the condensed fi nancial statements for the six months ended 30 June 2011 have been prepared in accordance with the applicable accounting standards
and give a true and fair view of the assets and liabilities, fi nancial position and results of the consolidated companies;
� the interim management report includes a fair review of signifi cant events of the past six months, their impact on the interim fi nancial statements and the
main related party transactions for the period, as well as a description of the main risks and uncertainties in the second half of the year.
Ecully, 25 July 2011
The Chairman and Chief Executive Offi cer
Thierry de La Tour d’Artaise
3

28 GROUPE SEBF i r s t - h a l f f i n a n c i a l r e p o r t

Photos: Gettyimages/Siri Stafford - GraphicObsession/Agamia – Photothèque Groupe SEB

Groupe SEB
Les 4 M chemin du Petit Bois - BP 172
69134 Écully Cedex France
www.groupeseb.com
Groupe SEB
Les 4 M chemin du Petit Bois - BP 172
69134 Écully Cedex France
www.groupeseb.com


