+ All Categories
Home > Documents > First Half of Fiscal Year Ending December 31, 2017 ... · 1H of fiscal year ending December 31,...

First Half of Fiscal Year Ending December 31, 2017 ... · 1H of fiscal year ending December 31,...

Date post: 19-Aug-2018
Category:
Upload: doancong
View: 217 times
Download: 0 times
Share this document with a friend
19
Copyright (c) Unicharm Corporation. All rights reserved. Projections stated in these materials include those based on the Company’s currently obtained assumptions, forecasts and plans regarding the future. Therefore, actual results may differ significantly from projections due to risks and uncertainties associated with market competition, foreign exchange rates, etc. Furthermore, as stated on the announcement “Notice of Investigation Related to the Previous Financial Results”, we are conducting an investigation on the appropriateness of accounting processes for previous fiscal years up to the fiscal period ending December, 2016. At present, we assess that there will be no major impact on the financial results of this fiscal period. However, regarding the figures for period of the 2 nd quarter consolidated results (January 1, 2016-June 30, 2016), as listed in these materials, we are not certain at present if there is a need for corrections, and it is possible a need for corrections may arise based on results of the investigation. These figures use information previously published as a reference, and we list comparison information on these figures, but based on the conditions described above, we request that this information is not used as a basis for investment decisions. August 10, 2017 Takahisa Takahara President and CEO Unicharm Corporation First Half of Fiscal Year Ending December 31, 2017 Financial Performance Unicharm Investor Meeting Presentation Materials
Transcript

Copyright (c) 2012 Unicharm Corporation. All rights reserved.Copyright (c) Unicharm Corporation. All rights reserved.

Projections stated in these materials include those based on the Company’s currently obtained assumptions, forecasts and plans

regarding the future. Therefore, actual results may differ significantly from projections due to risks and uncertainties associated with

market competition, foreign exchange rates, etc.

Furthermore, as stated on the announcement “Notice of Investigation Related to the Previous Financial Results”, we are conducting

an investigation on the appropriateness of accounting processes for previous fiscal years up to the fiscal period ending December,

2016. At present, we assess that there will be no major impact on the financial results of this fiscal period. However, regarding the

figures for period of the 2nd quarter consolidated results (January 1, 2016-June 30, 2016), as listed in these materials, we are not

certain at present if there is a need for corrections, and it is possible a need for corrections may arise based on results of the

investigation. These figures use information previously published as a reference, and we list comparison information on these figures,

but based on the conditions described above, we request that this information is not used as a basis for investment decisions.

August 10, 2017Takahisa TakaharaPresident and CEOUnicharm Corporation

First Half of Fiscal Year Ending December 31, 2017

Financial Performance

Unicharm Investor Meeting Presentation Materials

Copyright (c) 2012 Unicharm Corporation. All rights reserved.Copyright (c) Unicharm Corporation. All rights reserved.

1H of fiscal year ending December 31, 2017

Financial performance summary

2

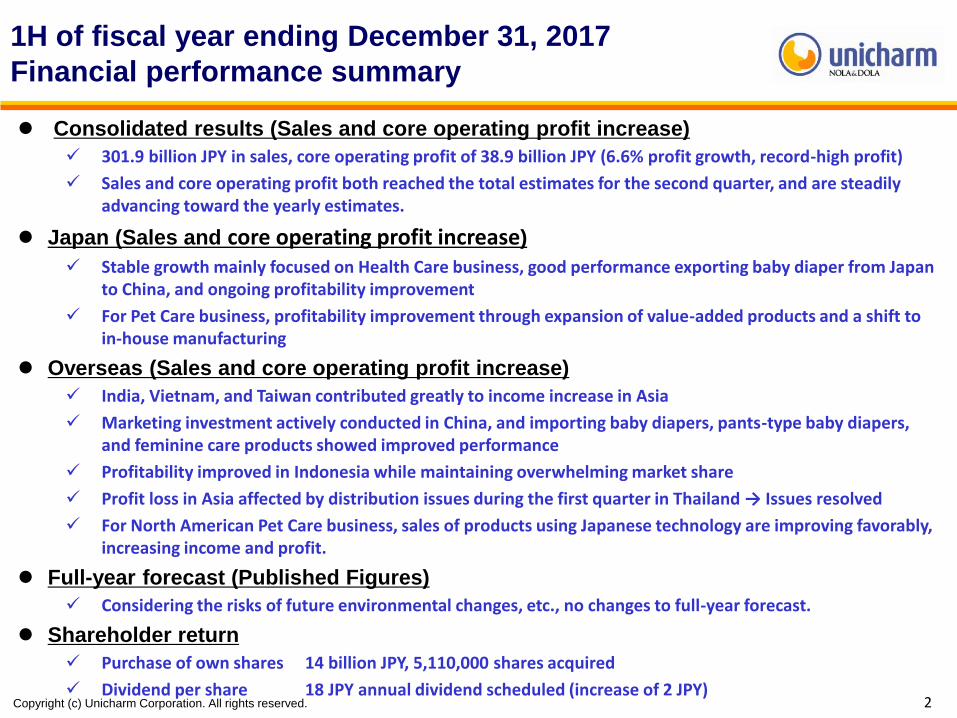
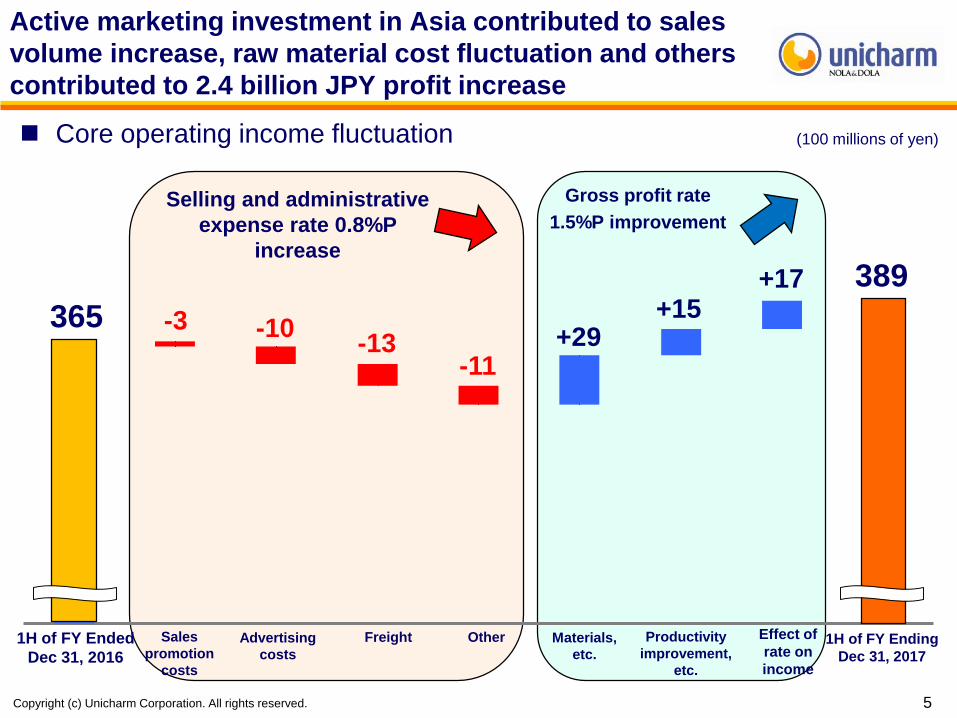
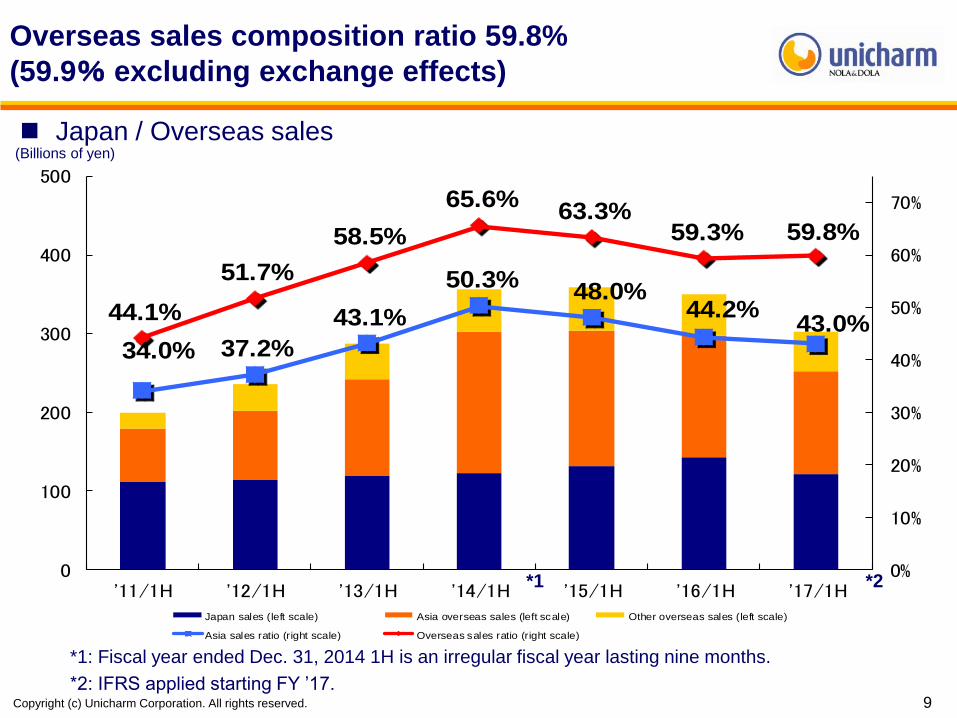
Consolidated results (Sales and core operating profit increase)

301.9 billion JPY in sales, core operating profit of 38.9 billion JPY (6.6% profit growth, record-high profit)

Sales and core operating profit both reached the total estimates for the second quarter, and are steadily advancing toward the yearly estimates.

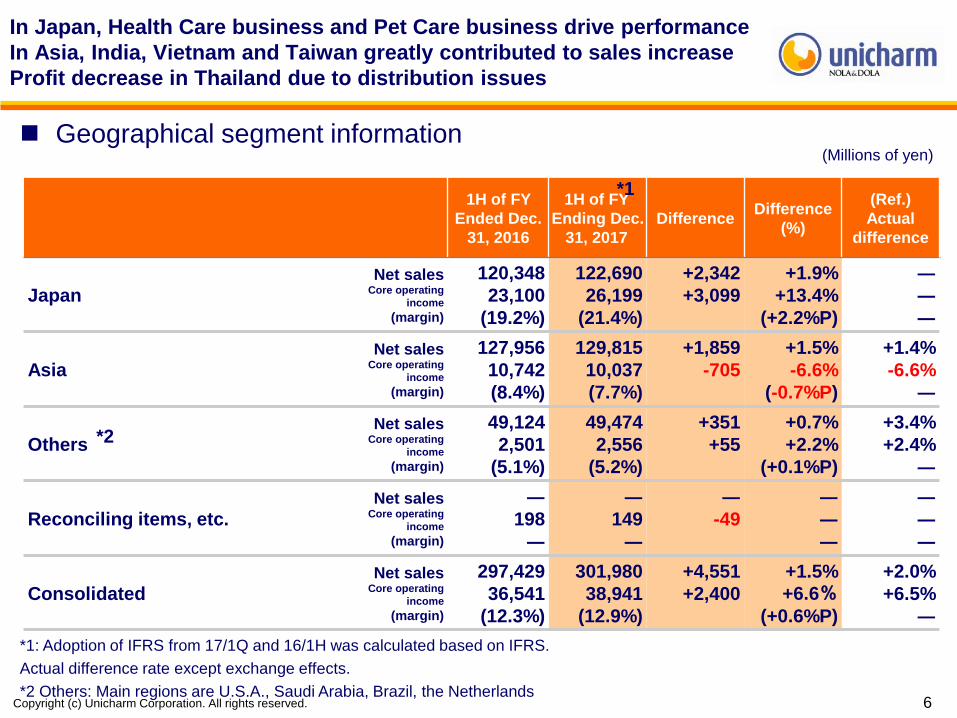
Japan (Sales and core operating profit increase)

Stable growth mainly focused on Health Care business, good performance exporting baby diaper from Japan to China, and ongoing profitability improvement

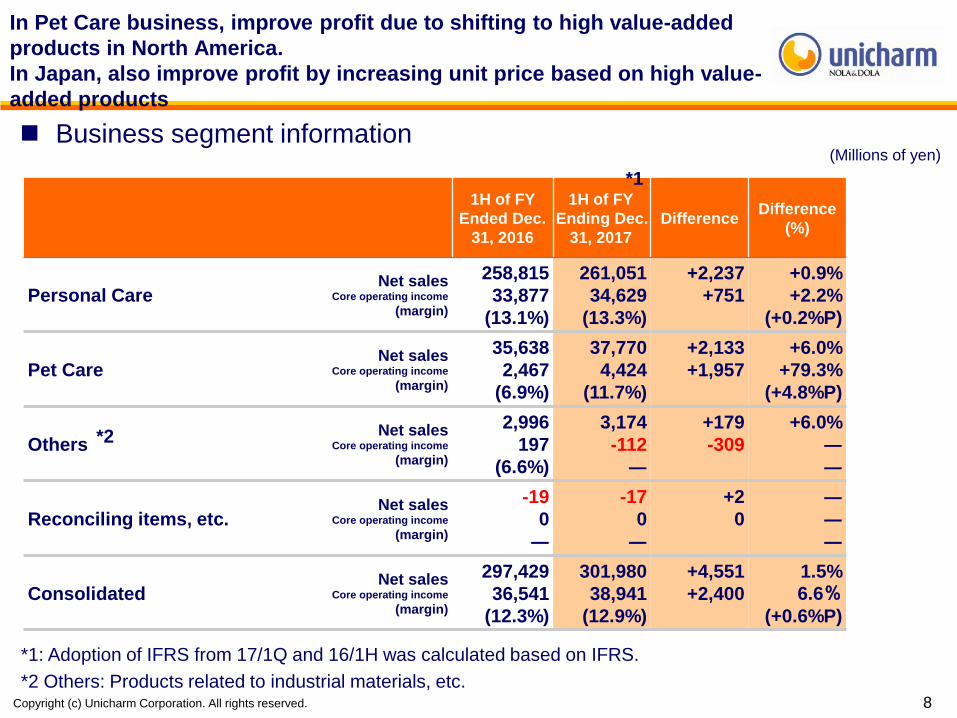
For Pet Care business, profitability improvement through expansion of value-added products and a shift to in-house manufacturing

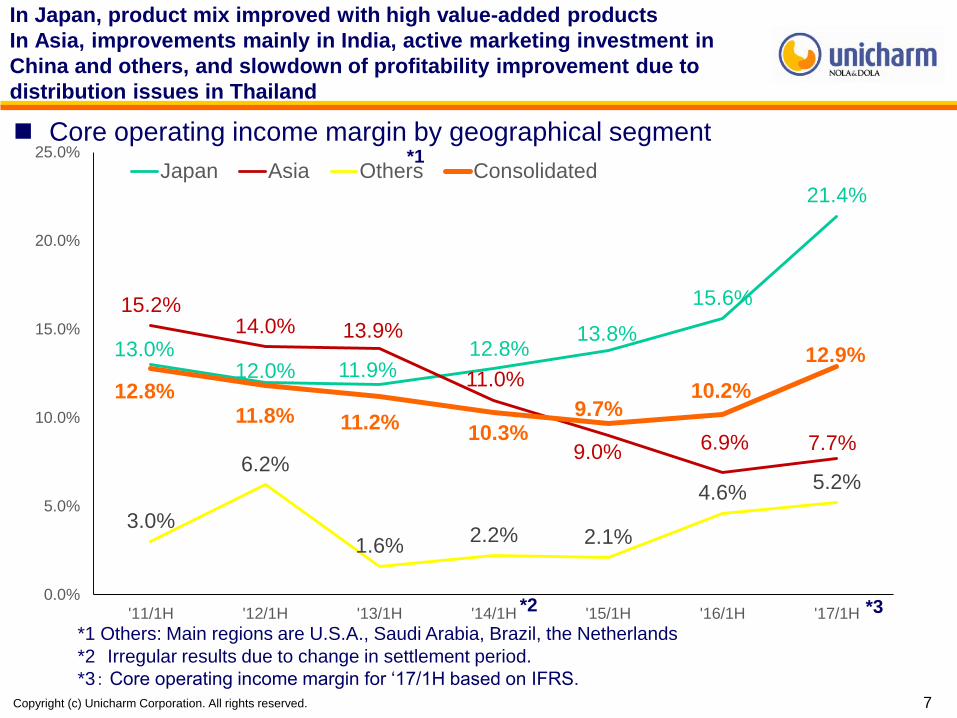
Overseas (Sales and core operating profit increase)

India, Vietnam, and Taiwan contributed greatly to income increase in Asia

Marketing investment actively conducted in China, and importing baby diapers, pants-type baby diapers, and feminine care products showed improved performance

Profitability improved in Indonesia while maintaining overwhelming market share

Profit loss in Asia affected by distribution issues during the first quarter in Thailand → Issues resolved

For North American Pet Care business, sales of products using Japanese technology are improving favorably, increasing income and profit.

Full-year forecast (Published Figures)

Considering the risks of future environmental changes, etc., no changes to full-year forecast.

Shareholder return

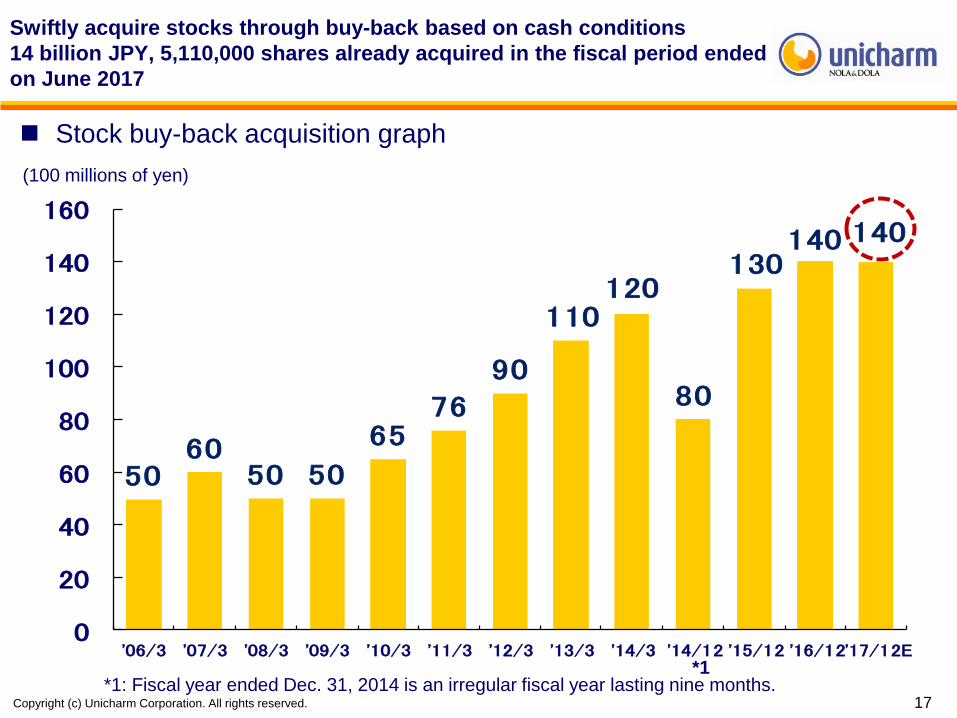
Purchase of own shares 14 billion JPY, 5,110,000 shares acquired

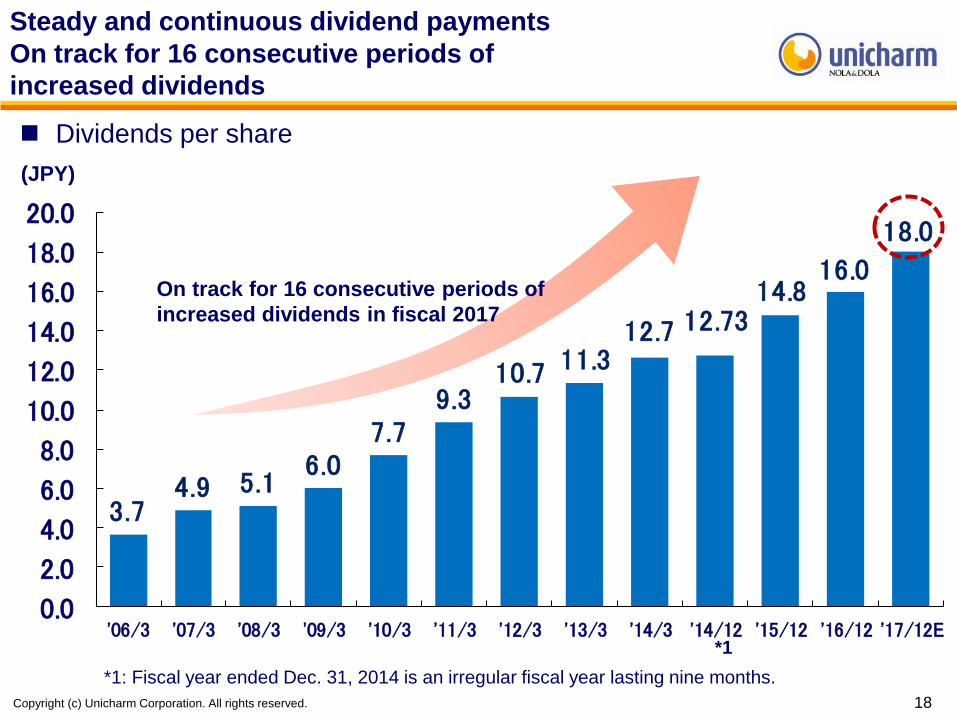
Dividend per share 18 JPY annual dividend scheduled (increase of 2 JPY)

Copyright (c) 2012 Unicharm Corporation. All rights reserved.Copyright (c) Unicharm Corporation. All rights reserved.

First Half of Fiscal Year Ending December 31, 2017

Financial Performance Summary

Copyright (c) 2012 Unicharm Corporation. All rights reserved.Copyright (c) Unicharm Corporation. All rights reserved.

1.5% sales increase, 6.6% core operating profit increase

(Record high)

Sales and profit goals reached for 1H forecast

4

Consolidated account highlights

1H of FY

Ended Dec.

31, 2016

1H of FY

Ending Dec.

31, 2017

DifferenceDifference

(%)

(Forecast)

1H of FY

Ending Dec.

31, 2017

Achievement

Rate

Net sales 297,429 301,980 +4,551 +1.5% 299,000 101.0%

Core operating income

(margin)

36,541

(12.3%)

38,941

(12.9%)+2,400

+6.6%

(+0.6%P)

34,000

(11.4%)114.5%

Profit before tax

(margin)

30,819

(10.4%)

38,429

(12.7%)+7,610

+24.7%

(+2.3%P)

32,000

(10.7%)120.1%

Profit attributable to owners of parent

(margin)19,682

(6.6%)

25,198

(8.3%)+5,516

+28.0%

(+1.7%P)

20,800

(7.0%)121.1%

Basic earnings per share (JPY) 33.04 42.80 +9.76 +29.5% ― ―

(Millions of yen)

USD Rate (JPY) 111.81 112.37 +0.56 +0.5% 110.00 ―

CNY Rate (JPY) 17.07 16.39 -0.68 -4.0% 16.30 ―

Adoption of IFRS from 17/1Q and 16/1H was calculated based on IFRS.

Copyright (c) 2012 Unicharm Corporation. All rights reserved.Copyright (c) Unicharm Corporation. All rights reserved.

Active marketing investment in Asia contributed to sales

volume increase, raw material cost fluctuation and others

contributed to 2.4 billion JPY profit increase

5

Core operating income fluctuation

Sales

promotion

costs

Advertising

costs

Other Materials,

etc.

Productivity

improvement,

etc.

365

389

-13 +29

(100 millions of yen)

Freight Effect of

rate on

income

-11

+15

1H of FY Ended

Dec 31, 2016

1H of FY Ending

Dec 31, 2017

Gross profit rate

1.5%P improvement

Selling and administrative

expense rate 0.8%P

increase

+17

-3 -10

Copyright (c) 2012 Unicharm Corporation. All rights reserved.Copyright (c) Unicharm Corporation. All rights reserved.

In Japan, Health Care business and Pet Care business drive performance

In Asia, India, Vietnam and Taiwan greatly contributed to sales increase

Profit decrease in Thailand due to distribution issues

6

Geographical segment information

*1: Adoption of IFRS from 17/1Q and 16/1H was calculated based on IFRS.

Actual difference rate except exchange effects.

*2 Others: Main regions are U.S.A., Saudi Arabia, Brazil, the Netherlands

1H of FY

Ended Dec.

31, 2016

1H of FY

Ending Dec.

31, 2017

DifferenceDifference

(%)

(Ref.)

Actual

difference

JapanNet sales

Core operating

income

(margin)

120,348

23,100

(19.2%)

122,690

26,199

(21.4%)

+2,342

+3,099

+1.9%

+13.4%

(+2.2%P)

AsiaNet sales

Core operating

income

(margin)

127,956

10,742

(8.4%)

129,815

10,037

(7.7%)

+1,859

-705

+1.5%

-6.6%

(-0.7%P)

+1.4%

-6.6%

OthersNet sales

Core operating

income

(margin)

49,124

2,501

(5.1%)

49,474

2,556

(5.2%)

+351

+55

+0.7%

+2.2%

(+0.1%P)

+3.4%

+2.4%

Reconciling items, etc.Net sales

Core operating

income

(margin)

198

149

-49

ConsolidatedNet sales

Core operating

income

(margin)

297,429

36,541

(12.3%)

301,980

38,941

(12.9%)

+4,551

+2,400

+1.5%

+6.6%

(+0.6%P)

+2.0%

+6.5%

(Millions of yen)

*1

*2

Copyright (c) 2012 Unicharm Corporation. All rights reserved.Copyright (c) Unicharm Corporation. All rights reserved.

Core operating income margin by geographical segment

13.0%12.0% 11.9%

12.8%13.8%

15.6%

21.4%

15.2%14.0% 13.9%

11.0%

9.0% 6.9% 7.7%

3.0%

6.2%

1.6%2.2% 2.1%

4.6%5.2%

12.8%11.8% 11.2%

10.3%9.7%

10.2%

12.9%

0.0%

5.0%

10.0%

15.0%

20.0%

25.0%

'11/1H '12/1H '13/1H '14/1H '15/1H '16/1H '17/1H

Japan Asia Others Consolidated

In Japan, product mix improved with high value-added products

In Asia, improvements mainly in India, active marketing investment in

China and others, and slowdown of profitability improvement due to

distribution issues in Thailand

7

*2

*1

*3

*1 Others: Main regions are U.S.A., Saudi Arabia, Brazil, the Netherlands

*2 Irregular results due to change in settlement period.

*3: Core operating income margin for ‘17/1H based on IFRS.

Copyright (c) 2012 Unicharm Corporation. All rights reserved.Copyright (c) Unicharm Corporation. All rights reserved.

In Pet Care business, improve profit due to shifting to high value-added

products in North America.

In Japan, also improve profit by increasing unit price based on high value-

added products

8

Business segment information

*1: Adoption of IFRS from 17/1Q and 16/1H was calculated based on IFRS.

*2 Others: Products related to industrial materials, etc.

1H of FY

Ended Dec.

31, 2016

1H of FY

Ending Dec.

31, 2017

DifferenceDifference

(%)

Personal CareNet sales

Core operating income

(margin)

258,815

33,877

(13.1%)

261,051

34,629

(13.3%)

+2,237

+751

+0.9%

+2.2%

(+0.2%P)

Pet CareNet sales

Core operating income

(margin)

35,638

2,467

(6.9%)

37,770

4,424

(11.7%)

+2,133

+1,957

+6.0%

+79.3%

(+4.8%P)

OthersNet sales

Core operating income

(margin)

2,996

197

(6.6%)

3,174

-112

+179

-309

+6.0%

Reconciling items, etc.Net sales

Core operating income

(margin)

-19

0

-17

0

+2

0

ConsolidatedNet sales

Core operating income

(margin)

297,429

36,541

(12.3%)

301,980

38,941

(12.9%)

+4,551

+2,400

1.5%

6.6%

(+0.6%P)

(Millions of yen)

*2

*1

Copyright (c) 2012 Unicharm Corporation. All rights reserved.Copyright (c) Unicharm Corporation. All rights reserved.

34.0% 37.2%

43.1%

50.3%48.0%

44.2%43.0%

44.1%

51.7%

58.5%

65.6%63.3%

59.3% 59.8%

0%

10%

20%

30%

40%

50%

60%

70%

0

100

200

300

400

500

'11/1H '12/1H '13/1H '14/1H '15/1H '16/1H '17/1HJapan sales (left scale) Asia overseas sales (left scale) Other overseas sales (left scale)

Asia sales ratio (right scale) Overseas sales ratio (right scale)

Overseas sales composition ratio 59.8%

(59.9% excluding exchange effects)

9

Japan / Overseas sales (Billions of yen)

*1: Fiscal year ended Dec. 31, 2014 1H is an irregular fiscal year lasting nine months.

*2: IFRS applied starting FY ’17.

*1 *2

Copyright (c) 2012 Unicharm Corporation. All rights reserved.Copyright (c) Unicharm Corporation. All rights reserved.

Effects of exchange fluctuations:

Sales: Approx. 1.3 billion JPY decrease

Core operating income: Approx. 300 million JPY increase

CurrencyRate for 1H of

FY ended Dec. 2016

Rate for 1H of

FY ending Dec. 2017Rate Change

China (CNY) 17.07 16.39 -4.0%

Indonesia (IDR) 0.0084 0.0085 +1.2%

Thailand (THB) 3.15 3.24 +2.9%

Saudi Arabia (SAR) 29.86 30.01 +0.5%

India (INR) 1.68 1.73 +3.0%

Vietnam (VND) 0.0050 0.0049 -2.0%

USA (USD) 111.81 112.37 +0.5%

Taiwan (TWD) 3.41 3.67 +7.6%

Netherlands (EUR) 124.62 121.64 -2.4%

South Korea (KRW) 0.0946 0.0987 +4.3%

Australia (AUD) 81.90 84.79 +3.5%

Malaysia (MYR) 27.25 25.61 -6.0%

Egypt (EGP) 13.27 6.28 -52.7%

Brazil(BRL) 30.21 35.37 +17.1%

Russia (RUB) 1.60 1.94 +21.3%10

Rate fluctuations by currency

Copyright (c) 2012 Unicharm Corporation. All rights reserved.Copyright (c) Unicharm Corporation. All rights reserved.

Increasing Corporate Value

Copyright (c) 2012 Unicharm Corporation. All rights reserved.Copyright (c) Unicharm Corporation. All rights reserved. 12

World first! “Recycle technology for

disposable diapers”

Patent acquired in Japan (Patent No. 6061875)

Environment

(E)

Unicharm’s goal to create a recycling system

Patent No. 6061875 is a patent for a processing method of ozone treatments for used disposable

diapers to separate the macromolecular polymers are separated from the disposable diapers, remove

pulp fibers from the diapers, and simultaneously disinfect and sterilize the pulp fibers. By using this

technology, it becomes possible to efficiently recycle hygienic, safe high-quality pulp from used

disposable diapers.

Raw materials Materials Manufacturing Use

Used

disposable

diapers Recycling

(From hospitals and other facilities)

High quality pulp Ozone treatment Used

disposable

diapersUnicharm’s unique

recycling system

Patent No. 6061875 technology

Copyright (c) 2012 Unicharm Corporation. All rights reserved.Copyright (c) Unicharm Corporation. All rights reserved.

*1 Established for the objective of “Disaster Area Support”. Original polo shirts,

jackets, merchandise, etc. worn by employees are sold in the company. Using this

system, the amount equivalent to that paid by employees for the merchandise is

donated.

*2 Established in 2011 as a scholarship fund to support further education after

high school graduation for children who lost their parents in the Great East Japan

Earthquake. 13

“Initiatives for the Cohesive Society”

Support programs that show the spirit of

Unicharm

Moony provided as a “Maternity Gift” to Nihon Kotsu

Society

(S)

Sponsorship of “Jintsu Taxi Project” Dementia Prevention Support

Local Revitalization SupportEmployee participation in ongoing

recovery support

Comprehensive Partnership Agreement with Kakegawa City,

Shizuoka Prefecture in 7 fields such as disaster measures,

child-raising support, health promotion, etc.

“Agreement Regarding Cooperation with Provision of

Supplies in the Event of a Disaster” with Fukushima City.

Partnership agreements with Fukuoka, Kumamoto, Kagawa,

etc.

“Social Walking”, a dementia-prevention program to

interact with “society” with an “objective” held in

Tokyo, Osaka, and Shizuoka.

“Dementia Supporter Training Course” implemented in

new employee training.

Employee participation in earthquake support “Matching

Fund*1”

“Uni Uni Rakugo Kai” charity event held by labor union

All proceeds donated to Michinoku Mirai Fund *2

*Child raising starter kits provided by 14 companies sponsoring Nihon

Kotsu’s “Jintsu Taxi Project” (Labor Pain Taxi Project) to support

expecting mothers. A file of products, information, etc. to help with

childbirth/child raising are packaged in original boxes that are delivered

registered members of “Jintsu Taxi”.

Copyright (c) 2012 Unicharm Corporation. All rights reserved.Copyright (c) Unicharm Corporation. All rights reserved.

“Work-style reform development office” newly established to promote work-style reform on the theme

of productivity improvement and the role of women

“Interval Work System” implemented with the objective of maintaining health and improving

productivity by preventing the accumulation of fatigue

Implementation of “work-at-home or telework system” to improve productivity and demonstrate

creativity

14

We aim for a company where each employee can

work in good health and with purpose

Previous initiatives with the objective of maintaining employee health and improving productivity

New initiatives

Aiming for the improvement

of both work and daily life

Endorsement of “Premium Friday” Pet bereavement leave (cats/dogs)

Governance

(G)

Revision of the remuneration system to create an

environment that raises employee motivations and also

where personal growth drives company growth

Ament child-rearing and nursing care systems using brand

names incorporated.

Copyright (c) 2012 Unicharm Corporation. All rights reserved.Copyright (c) Unicharm Corporation. All rights reserved.

Shareholder Return Policy

Copyright (c) 2012 Unicharm Corporation. All rights reserved.Copyright (c) Unicharm Corporation. All rights reserved.

47.5%49.5%

44.7%

38.3%

55.6%

40.3%

51.4%47.8%

53.9%50.0%

53.2%

0

5,000

10,000

15,000

20,000

25,000

30,000

'08/3 '09/3 '10/3 '11/3 '12/3 '13/3 '14/3 '14/12 '15/12 '16/12 '17/12E0.0%

10.0%

20.0%

30.0%

40.0%

50.0%

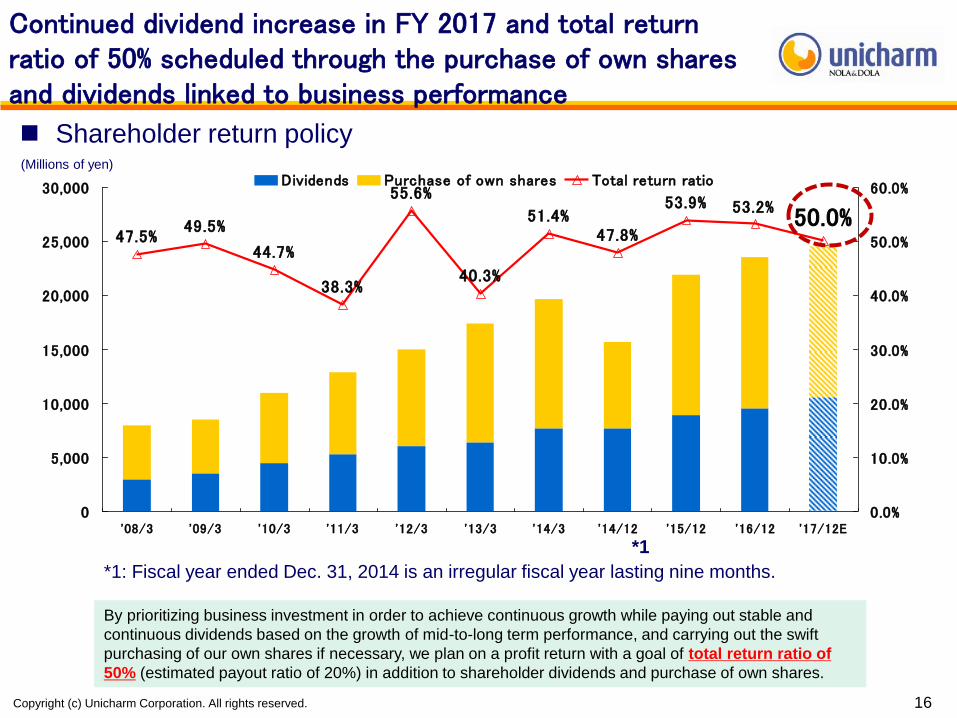
60.0%Dividends Purchase of own shares Total return ratio

16

Continued dividend increase in FY 2017 and total return ratio of 50% scheduled through the purchase of own shares and dividends linked to business performance

*1: Fiscal year ended Dec. 31, 2014 is an irregular fiscal year lasting nine months.

By prioritizing business investment in order to achieve continuous growth while paying out stable and

continuous dividends based on the growth of mid-to-long term performance, and carrying out the swift

purchasing of our own shares if necessary, we plan on a profit return with a goal of total return ratio of

50% (estimated payout ratio of 20%) in addition to shareholder dividends and purchase of own shares.

Shareholder return policy

*1

(Millions of yen)

Copyright (c) 2012 Unicharm Corporation. All rights reserved.Copyright (c) Unicharm Corporation. All rights reserved.

5060

50 50

6576

90

110120

80

130140 140

0

20

40

60

80

100

120

140

160

'06/3 '07/3 '08/3 '09/3 '10/3 '11/3 '12/3 '13/3 '14/3 '14/12 '15/12 '16/12'17/12E

17

Swiftly acquire stocks through buy-back based on cash conditions

14 billion JPY, 5,110,000 shares already acquired in the fiscal period ended

on June 2017

Stock buy-back acquisition graph

*1: Fiscal year ended Dec. 31, 2014 is an irregular fiscal year lasting nine months.*1

(100 millions of yen)

Copyright (c) 2012 Unicharm Corporation. All rights reserved.Copyright (c) Unicharm Corporation. All rights reserved.

3.74.9 5.1

6.07.7

9.310.7 11.3

12.7 12.7314.8

16.0

18.0

0.0

2.0

4.0

6.0

8.0

10.0

12.0

14.0

16.0

18.0

20.0

'06/3 '07/3 '08/3 '09/3 '10/3 '11/3 '12/3 '13/3 '14/3 '14/12 '15/12 '16/12 '17/12E

18

Steady and continuous dividend payments

On track for 16 consecutive periods of

increased dividends

(JPY)

Dividends per share

*1: Fiscal year ended Dec. 31, 2014 is an irregular fiscal year lasting nine months.

*1

On track for 16 consecutive periods of

increased dividends in fiscal 2017

Copyright (c) 2012 Unicharm Corporation. All rights reserved.Copyright (c) Unicharm Corporation. All rights reserved. 19


Recommended